International Research Journal of Engineering and Technology (IRJET)
e-ISSN: 2395-0056
Volume: 12 Issue: 06 | Jun 2025
p-ISSN: 2395-0072
www.irjet.net
Optimising cutting speed, feed rate and depth of cut to minimise machining time and increase tool life in the milling of gray cast iron Sandeep Chowdhry1 1 Engineering Consultancy & Training, Chandigarh, India
-------------------------------------------------------------------------***-----------------------------------------------------------------------
Abstract - Gray cast iron (GCI) contains graphite flakes
Nevertheless, there is still ambiguity in how these process parameters affect the tool life. For instance, according to Taylor's equation, cutting speed affects the tool life. At the same time, Gorezyca’s [4] tool life equation includes feed speed and depth of cut. The above literature shows a need to reduce the machining time and increase the tool life.
that provide a high level of stability and minimise shrinking during the casting process. The high carbon content makes GCI easy to machine. At the same time, GCI is less ductile. Its machining affects the machining efficiency and tool life. This study aims to use an appropriate optimisation method to reduce the machining time and increase the tool life. As per the results, the response surface method is used for optimisation. The feed per tooth makes the maximum contribution, followed by the depth of cut and spindle speed towards minimising the machining time. As per the extended tool life equation, tool life decreases with increased spindle speed. The optimisation results show that as per the second tool life equation, the minimum machining time is five times, and the maximum tool life is thirty times that of the values obtained by the extended tool life equation.
Therefore, the study's main aim is 1) To select an appropriate optimisation method to minimise the machining time and increase the tool life; 2) To minimise the machining time of GCI workpiece; 3) To maximise the tool life while machining the GCI workpiece. This study aims to contribute to the understanding of using an appropriate optimisation method to minimise the machining time and maximise the tool life while machining the GCI workpiece.
2 METHODOLOGY
Key Words: tool life, milling, full factorial design,
2.1 Material
response surface method, solidworks cam, gray cast iron, machining time
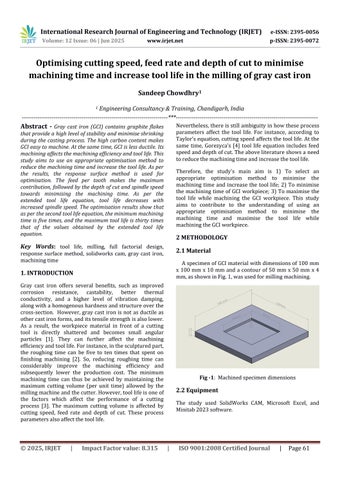
A specimen of GCI material with dimensions of 100 mm x 100 mm x 10 mm and a contour of 50 mm x 50 mm x 4 mm, as shown in Fig. 1, was used for milling machining.
1. INTRODUCTION Gray cast iron offers several benefits, such as improved corrosion resistance, castability, better thermal conductivity, and a higher level of vibration damping, along with a homogenous hardness and structure over the cross-section. However, gray cast iron is not as ductile as other cast iron forms, and its tensile strength is also lower. As a result, the workpiece material in front of a cutting tool is directly shattered and becomes small angular particles [1]. They can further affect the machining efficiency and tool life. For instance, in the sculptured part, the roughing time can be five to ten times that spent on finishing machining [2]. So, reducing roughing time can considerably improve the machining efficiency and subsequently lower the production cost. The minimum machining time can thus be achieved by maintaining the maximum cutting volume (per unit time) allowed by the milling machine and the cutter. However, tool life is one of the factors which affect the performance of a cutting process [3]. The maximum cutting volume is affected by cutting speed, feed rate and depth of cut. These process parameters also affect the tool life.
© 2025, IRJET
|
Impact Factor value: 8.315
Fig -1: Machined specimen dimensions
2.2 Equipment The study used SolidWorks CAM, Microsoft Excel, and Minitab 2023 software.
|
ISO 9001:2008 Certified Journal
|
Page 61