International Research Journal of Engineering and Technology (IRJET)
e-ISSN: 2395-0056
Volume: 04 Issue: 07 | July -2017
p-ISSN: 2395-0072
www.irjet.net
A Review on Characterization and Analysis of Gait Pattern Sameer Ashra1 1Sameer
Ashra-Student, Dept. Of Biomedical Engineering, Government Engineering College, Sector-28, Gandhinagar, India ---------------------------------------------------------------------***---------------------------------------------------------------------
Abstract - In clinical studies, gait pattern is observed to
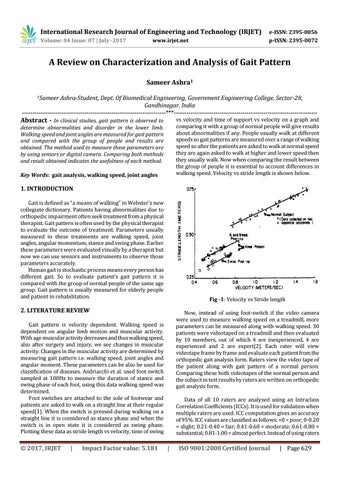
vs velocity and time of support vs velocity on a graph and comparing it with a group of normal people will give results about abnormalities if any. People usually walk at different speeds so gait patterns are measured over a range of walking speed so after the patients are asked to walk at normal speed they are again asked to walk at higher and lower speed then they usually walk. Now when comparing the result between the group of people it is essential to account differences in walking speed. Velocity vs stride length is shown below.
determine abnormalities and disorder in the lower limb. Walking speed and joint angles are measured for gait pattern and compared with the group of people and results are obtained. The method used to measure these parameters are by using sensors or digital camera. Comparing both methods and result obtained indicates the usefulness of each method. Key Words: gait analysis, walking speed, joint angles
1. INTRODUCTION Gait is defined as “a means of walking” in Webster’s new collegiate dictionary. Patients having abnormalities due to orthopedic impairment often seek treatment from a physical therapist. Gait pattern is often used by the physical therapist to evaluate the outcome of treatment. Parameters usually measured in these treatments are walking speed, joint angles, angular momentum, stance and swing phase. Earlier these parameters were evaluated visually by a therapist but now we can use sensors and instruments to observe those parameters accurately. Human gait is stochastic process means every person has different gait. So to evaluate patient’s gait pattern it is compared with the group of normal people of the same age group. Gait pattern is usually measured for elderly people and patient in rehabilitation.
Fig -1: Velocity vs Stride length
2. LITERATURE REVIEW
Now, instead of using foot-switch if the video camera were used to measure walking speed on a treadmill, more parameters can be measured along with walking speed. 30 patients were videotaped on a treadmill and then evaluated by 10 members, out of which 4 are inexperienced, 4 are experienced and 2 are expert[2]. Each rater will view videotape frame by frame and evaluate each patient from the orthopedic gait analysis form. Raters view the video tape of the patient along with gait pattern of a normal person. Comparing these both videotapes of the normal person and the subject in test results by raters are written on orthopedic gait analysis form.
Gait pattern is velocity dependent. Walking speed is dependent on angular limb motion and muscular activity. With age muscular activity decreases and thus walking speed, also after surgery and injury, we see changes in muscular activity. Changes in the muscular activity are determined by measuring gait pattern i.e. walking speed, joint angles and angular moment. These parameters can be also be used for classification of diseases. Andriacchi et al. used foot switch sampled at 100Hz to measure the duration of stance and swing phase of each foot, using this data walking speed was determined. Foot switches are attached to the sole of footwear and patients are asked to walk on a straight line at their regular speed[1]. When the switch is pressed during walking on a straight line it is considered as stance phase and when the switch is in open state it is considered as swing phase. Plotting these data as stride length vs velocity, time of swing
© 2017, IRJET
|
Impact Factor value: 5.181
Data of all 10 raters are analyzed using an Intraclass Correlation Coefficients (ICCs). It is used for validation when multiple raters are used. ICC computation gives an accuracy of 95%. ICC values are classified as follows: <0 = poor; 0-0.20 = slight; 0.21-0.40 = fair; 0.41-0.60 = moderate; 0.61-0.80 = substantial; 0.81-1.00 = almost perfect. Instead of using raters
|
ISO 9001:2008 Certified Journal
| Page 629