International Research Journal of Engineering and Technology (IRJET) Volume: 04 Issue: 05 | May -2017
www.irjet.net
e-ISSN: 2395 -0056 p-ISSN: 2395-0072
Non-linear Static Analysis of Tee-beam Bridge Abisheik A1, Dr R. Sathyanarayan Sridhar2 1 Post
Graduate student, M.E. Computer Methods and Applications in Structural Engineering, Coimbatore Institute of Technology (E-mail: abisheikarthanari@gmail.com) 2 Associate Professor, Department of Civil Engineering, Coimbatore Institute of Technology, Coimbatore-04, Tamil Nadu, India
---------------------------------------------------------------------***--------------------------------------------------------------------collapses. Once the elastic limit is reached the structure is further loaded which results in formation of cracks, plastic hinge and failure of the structural components. The relation between base shear VS displacement is plotted. This curve is also called as pushover curve or capacity curve. The main aim of capacity curve is to determine performance point for a desired seismic demand. Below are the two methods to be followed.
Abstract: This paper deals with Non-linear static analysis (pushover analysis). This had been used for seismic analysis of high-rise buildings to determine ultimate load and deflection capability of structure. Particularly in bridges the seismic analysis is carried out by using nonlinear dynamic analysis and nonlinear static analysis. Under nonlinear static analysis Capacity spectrum method and N2 method has been used widely for the high-rise buildings. The main aim of the paper is to imply the concepts of Capacity spectrum method and N2 method of seismic analysis in T-beam Bridge. This is achieved by modelling, analyzing the T-beam Bridge in CSiBridge and SAP2000 software and comparing the output from both the software and verify the concepts of analysis with the code provision. Key word: capacity spectrum, N2, Tee-beam Bridge, nonlinear, nsp, static analysis.
1. INTRODUCTION India is one of the country to experience number of the world’s greatest earthquakes in the last century. Hence the seismic building design code in India (IS 1893, Part-I) is also revised in 2002. As per the records of the previous earthquake the magnitudes of the design seismic forces has raised up and so the seismic zone of some regions has also been upgraded. Whereas the Zone I is combined with Zone II and declared it as Low intensity zone. However, bridges are very for transportation network in any country. The bridge design codes in India doesn't meet the seismic design demand at present based on the earthquake records. Therefore, it is now liable to evaluate the capacity of existing bridges against seismic force demand based on EURO codes.
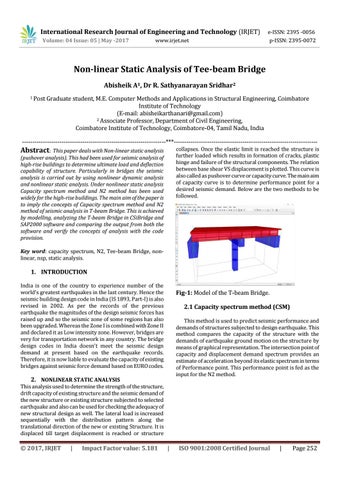
Fig-1: Model of the T-beam Bridge. 2.1 Capacity spectrum method (CSM) This method is used to predict seismic performance and demands of structures subjected to design earthquake. This method compares the capacity of the structure with the demands of earthquake ground motion on the structure by means of graphical representation. The intersection point of capacity and displacement demand spectrum provides an estimate of acceleration beyond its elastic spectrum in terms of Performance point. This performance point is fed as the input for the N2 method.
2. NONLINEAR STATIC ANALYSIS This analysis used to determine the strength of the structure, drift capacity of existing structure and the seismic demand of the new structure or existing structure subjected to selected earthquake and also can be used for checking the adequacy of new structural design as well. The lateral load is increased sequentially with the distribution pattern along the translational direction of the new or existing Structure. It is displaced till target displacement is reached or structure Š 2017, IRJET
|
Impact Factor value: 5.181
|
ISO 9001:2008 Certified Journal
|
Page 252