International Research Journal of Engineering and Technology (IRJET)
e-ISSN: 2395 -0056
Volume: 04 Issue: 03 | Mar -2017
p-ISSN: 2395-0072
www.irjet.net
FACTS Devices Placement Using Sensitivity Indices Analysis Method Prof. Chetan W. Jadhao1, Prof. Ankit A. Zade2 1Assistant
Professor, Electrical Engineering Department of Datta Meghe Institute of Engineering, Technology & Research, Wardha, Maharashtra, India 2Assistant Professor, Electrical Engineering Department of Jagadambha College of Engineering & Technology, Yavatmal, Maharashtra, India
---------------------------------------------------------------------***---------------------------------------------------------------------
Abstract – The transmission of power has been severely
limited due to limited resources and environmental restriction because in recent years, power demand has increased substantially. From the security point of view Power system stability has been recognized as an important problem. To improve operating margins necessary for system stability several conventional methods used. Many of these suffer with excessive response time and considerable amount of power loss. To overcome this difficulty, a rapid development of power electronic devices such as Flexible AC Transmission System (FACTS) devices are used, their primary application is to enhance power transfer capabilities, power system stability and allow more flexible control of power flows. By installing FACTS equipment at optimal sites, the overall system benefits are sought. But the location of these FACTS devices has been big challenge. This challenge is overcome by using Sensitivity Indices analysis method. The ‘MATLAB’ software is used here to write a programming code for finding out the sensitivity indices. IEEE-5 bus system is used here for the study purpose. Key Words: FACTS; PI; sensitivity analysis; sensitivity indices; power system security
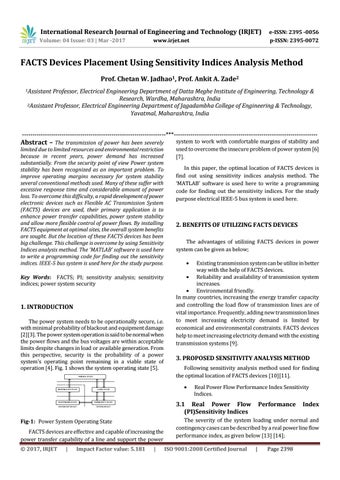
1. INTRODUCTION The power system needs to be operationally secure, i.e. with minimal probability of blackout and equipment damage [2][3]. The power system operation is said to be normal when the power flows and the bus voltages are within acceptable limits despite changes in load or available generation. From this perspective, security is the probability of a power system’s operating point remaining in a viable state of operation [4]. Fig. 1 shows the system operating state [5]. NORMAL STATE
RESTORATIVE STATE
ALERT STATE
IN-EXTREMIS STATE
EMERGENCY STATE
SYSTEM NOT INTACT
SYSTEM INTACT
Impact Factor value: 5.181
2. BENEFITS OF UTILIZING FACTS DEVICES The advantages of utilizing FACTS devices in power system can be given as below;
Existing transmission system can be utilize in better way with the help of FACTS devices. Reliability and availability of transmission system increases. Environmental friendly. In many countries, increasing the energy transfer capacity and controlling the load flow of transmission lines are of vital importance. Frequently, adding new transmission lines to meet increasing electricity demand is limited by economical and environmental constraints. FACTS devices help to meet increasing electricity demand with the existing transmission systems [9].
3. PROPOSED SENSITIVITY ANALYSIS METHOD Following sensitivity analysis method used for finding the optimal location of FACTS devices [10][11]. Real Power Flow Performance Index Sensitivity Indices.
3.1 Real Power Flow (PI)Sensitivity Indices
FACTS devices are effective and capable of increasing the power transfer capability of a line and support the power |
In this paper, the optimal location of FACTS devices is find out using sensitivity indices analysis method. The ‘MATLAB’ software is used here to write a programming code for finding out the sensitivity indices. For the study purpose electrical IEEE-5 bus system is used here.
Fig-1: Power System Operating State
© 2017, IRJET
system to work with comfortable margins of stability and used to overcome the insecure problem of power system [6] [7].
|
Performance
Index
The severity of the system loading under normal and contingency cases can be described by a real power line flow performance index, as given below [13] [14]; ISO 9001:2008 Certified Journal
|
Page 2398