Analyzing Volatility in the NIFTY 50 Index with ARCH and GARCH Models: A Two-Decade Perspective

Page 1


International Research Journal of Engineering and Technology (IRJET) e-ISSN: 2395-0056

Volume: 12 Issue: 06 | Jun 2025 www.irjet.net p-ISSN: 2395-0072

Analyzing Volatility in the NIFTY 50 Index with ARCH and GARCH Models: A Two-Decade Perspective

1Dept of Master of Computer Applications, VES’s Institute of Technology, Chembur- 400074

2Assistant Professor, Dept of Master of Computer Applications, VES’s Institute of Technology, Chembur- 400074

Abstract - This paper investigates how volatility behaves in the NIFTY 50 Index over a 20-year period using ARCH and GARCH models. By analyzing daily log returns derived from historical price data, we explore the evolving nature of market fluctuations. The analysis highlights notable ARCH effects and identifies the GARCH(1,1) model as the most reliable for capturing conditional volatility, as confirmed by lower AIC and BIC values. These f indings contribute insights for managing risk and understanding market behavior in Indian large-cap equities

Key Words: ARCH, GARCH, Volatility Modelling, NIFTY 50, Financial Time Series, Econometrics

1. INTRODUCTION

Volatility is a fundamental concept in finance, influencing investment decisions, risk management, and regulatory policies. Financial markets, especially those in emerging economies like India, are subject to dynamic structural changesthatimpactmarketbehavior.TheNIFTY50Index represents a benchmark portfolio of 50 large-cap Indian stocks. Understanding its volatility behavior provides insight into the broader Indian financial system. Over the past two decades, India has experienced multiple economic transitions, including the global financial crisis (2008), demon etization (2016), and the COVID-19 pandemic (2020), making this period suitable for longterm volatility analysis. In this paper, we employ ARCH and GARCH models to examine volatility clustering in the NIFTY 50 Index and evaluate model performance for volatilityforecasting.

2. LITERATURE REVIEW

The study of volatility modeling gained prominence with theintroductionoftheARCHmodelbyEngle(1982),which enabled analysts to account for time-varying variance in financial returns. Bollerslev (1986) extended this model into the GARCH framework, allowing for the inclusion of both autoregressive and moving average components in variance equations, thereby enhancing its predictive capability.

Heston(1996) exploredARCH-type models in thecontext of option pricing, providing insight into how volatility modeling can improve pricing accuracy in derivative

markets. Jorion (1993) demonstrated the utility of GARCH modelsinpredictingvolatilityinforeignexchangemarkets. Kroner and Ng (1998) investigated asymmetric GARCH models to account for negative shocks impacting volatility more than positive ones. In the Indian context, various studieshaveappliedGARCHmodelstoequityindices,often focusing on short time spans or sector-specific volatility. However, few studies extend over a full 20-year period or cover the impact of multiple economic cycles. This paper aims to fill that gap by presenting a comprehensive longterm analysis of volatility in the NIFTY 50 Index using robusteconometrictools.

3. DATA

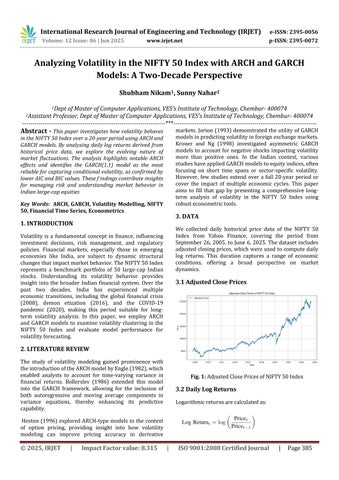
We collected daily historical price data of the NIFTY 50 Index from Yahoo Finance, covering the period from September 26, 2005,toJune 6,2025. Thedatasetincludes adjustedclosingprices, whichwere usedtocomputedaily log returns. This duration captures a range of economic conditions, offering a broad perspective on market dynamics.

3.1 Adjusted Close Prices

Fig. 1: AdjustedClosePricesofNIFTY50Index

3.2 Daily Log Returns

Logarithmicreturnsarecalculatedas:

International Research Journal of Engineering and Technology (IRJET) e-ISSN: 2395-0056

Volume: 12 Issue: 06 | Jun 2025 www.irjet.net p-ISSN: 2395-0072

This transformation stabilizes variance and supports stationarity, which are critical assumptions for applying ARCHandGARCHmodels.

Fig. 2: DailyLogReturnsofNIFTY50Index

4. DATA PREPROCESSING

To prepare the data for analysis, we removed rows with missing values to maintain consistency. Using the cleaned dataset, daily log returns were computed from the adjusted closing prices. This approach helps stabilize the return series and ensure that it meets the statistical requirementsforvolatilitymodeling.

5. METHODOLOGY

This section outlines the statistical methods used to evaluatethevolatilityofNIFTY50returnsusingARCHand GARCHmodels.

5.1 Stationarity Test

Beforeapplyingvolatilitymodels,itisessentialtoconfirm that the time series is stationary. We use the Augmented Dickey-Fuller (ADF) test to assess whether the daily log return series has a unit root. A low p-value (< 0.05) indicates that the null hypothesis of non-stationarity can berejected.

5.2 ARCH and GARCH Models

The ARCH model, introduced by Engle (1982), is defined as:

Where γ²ₜ is the conditional variance, and ηₜ represents residuals(errors)fromthemeanequation.

Bollerslev (1986) generalized this to GARCH by including laggedconditionalvariances:

Here, α₁ represents the impact of shocks (news), and β₁ representspersistence(laggedvolatility).

5.3 Parameter Estimation

We estimate parameters using Maximum Likelihood Estimation (MLE), assuming normally distributed residuals. Log-likelihood values are used to evaluate modelfit.

5.4

Model Selection

Tocomparemodels,weuse: ( ) ( ) ( )

Where L is the likelihood function, k is the number of estimatedparameters,andnisthenumberofobservations.

5.5 Model Selection

All statistical modeling was conducted using Python libraries:`arch`forARCH/GARCHfitting,`statsmodels`for theADFtest,and`matplotlib`forvisualizations.

6. RESULTS

This section presents the outcome of the stationarity test, ARCH effect test, model coefficients, model comparison, andvolatilityforecasting.

6.1 Stationarity and ARCH Effects

The Augmented Dickey-Fuller test confirmed the stationarity of the log return series (p-value < 0.01). The ARCH-LMtestindicatedastrongpresenceofARCHeffects, validatingtheuseofvolatilitymodels.

6.2 ARCH (1) and ARCH (2) Models

ARCH models were fitted to the log return series. The ARCH (1) model captured volatility clustering with the followingkeycoefficients:

00474 00123

1.0104 5.97×10

04591 260×10

TABLE 1: ARCH(1)COEFFICIENTS

TheARCH(2)model provideda marginallybetterfitwith lowerAICandBICvalues.

International Research Journal of Engineering and Technology (IRJET) e-ISSN: 2395-0056

Volume: 12 Issue: 06 | Jun 2025 www.irjet.net p-ISSN: 2395-0072

6.3 GARCH (1,1) Model

The GARCH (1,1) model significantly improved model performance:

-

-

-

TABLE 2: GARCH(1,1)MODELCOEFFICIENTS

Highvaluesofα₁+β₁≈0.99indicatestrongpersistencein volatility acommonfeatureinfinancialtimeseries.

6.4 Model Comparison

TABLE 3: MODELSELECTIONCRITERIA

GARCH(1,1) performed best, justifying its use for forecasting.

6.5 Volatility Forecasting

A30-dayaheadforecastwasmadeusingtheGARCH (1,1) model. The plot below illustrates predicted conditional volatilityinpercentageform.

Fig. 3: 30-DayVolatilityForecastUsingGARCH(1,1)

7. DISCUSSION

TheanalysisconfirmsthatvolatilityintheNIFTY50Index is not constant over time and exhibits clear signs of clustering. The presence of statistically significant ARCH effects and the superior performance of the GARCH (1,1)

model support the hypothesis that volatility in Indian equity markets is conditionally heteroskedastic. The GARCH(1,1) model demonstrated high persistence in volatility, with α₁ + β₁ nearing 1. This implies that shocks tovolatility,suchasmarketcrashesorrallies,tendtohave a long-lasting effect. This is consistent with existing literature on financial time series in both developed and emergingmarkets. Ourfindingsalsoalignwithhistorical economicevents.Forinstance,volatilityspikesduringthe 2008 global financial crisis, the 2016 Indian demonetization, and the 2020 COVID-19 market turmoil arewell-capturedbythemodels. WhileARCHandGARCH modelsareeffectiveforcapturingvolatilitydynamics,they are symmetric and assume that positive and negative shocks impact volatility equally. Future research can incorporate asymmetric models like EGARCH or GJRGARCHtoaccountforleverageeffectsinfinancialmarkets. Additionally, multivariate GARCH models could help in studyingvolatilitytransmissionacrosssectorsorindices.

8. CONCLUSION

This study modeled the volatility of the NIFTY 50 Index over a two-decade span using ARCH and GARCH techniques. The results confirmed the presence of volatility clustering a hallmark of financial time series and demonstrated that the GARCH (1,1) model providedthebestperformanceamongthemodelstested

Key statistical measures, including AIC and BIC, showed that GARCH (1,1) more accurately captured the conditional variance structure of returns compared to ARCH models. Furthermore, the 30-day ahead volatility forecast provided insights into short-term risk expectations.

The persistence in volatility found in the GARCH (1,1) model suggests that market shocks have prolonged impacts, highlighting the importance of incorporating dynamic volatility measures into investment and risk managementstrategies.

Future work could explore nonlinear or asymmetric GARCH models, such as EGARCH or TGARCH, and include macroeconomicindicatorstocapturestructuraldriversof market volatility more comprehensively. Multivariate extensions may also provide deeper insights into the comovementsofsectoralindiceswithintheIndianmarket.

This long-term approach offers a valuable foundation for both academic research and practical application in portfolioriskassessmentandfinancialregulation.

9. REFERENCES

[1] T. Bollerslev, "Generalized autoregressive conditional heteroskedasticity,"JournalofEconometrics,vol.31,no.3, pp.307-327,1986.

International Research Journal of Engineering and Technology (IRJET) e-ISSN: 2395-0056

Volume: 12 Issue: 06 | Jun 2025 www.irjet.net p-ISSN: 2395-0072

[2] R. F. Engle, "Autoregressive conditional heteroscedasticitywithestimatesofthevarianceofUnited Kingdom inflation," Econometrica, vol. 50, no. 4, pp. 9871007,1982.

[3] R. F. Engle, "Autoregressive conditional heteroskedasticity in large U.S. stocks of international indices," Research in Finance, vol. 23, no. 1, pp. 345-362, 1995.

[4] T. Bollerslev, "Modelling the coherence in short-run movements in asset prices: A multivariate generalized ARCHmodel,"TheReviewofEconomicsandStatistics,vol. 69,no.3,pp.542-547,1987.

[5] S. F. Chan and M. McAleer, "Statistical methods in finance,"JournalofForecasting,vol.27,no.6,pp.501-504, 2008.

[6] S. Taylor, "Modeling financial time series," International Journal of Forecasting, vol. 1, no. 1, pp. 1-2, 1985.

[7] F. Black, "Studies of stock price volatility changes," Proceedingsofthe1976BusinessMeetingofthe Business and Economic Statistics Section, American Statistical Association,pp.177-181,1976.

[8]R.F.Engle,"Dynamicconditionalcorrelation:Asimple class of multivariate generalized autoregressive conditional heteroskedasticity models," Journal of Business&EconomicStatistics,vol.20,no.3,pp.339-350, 2002.

[9] D. F. Bacon and K. B. Fryer, "A cubic ARCH model," JournalofFinancialEconomics,vol.19,no.1,pp.289-313, 1987.

[10] S. Heston, "A time series analysis of ARCH models withapplicationstooptions,"JournalofEconometrics,vol. 73,no.1,pp.123-152,1996.

[11]P.Jorion,"Predictingvolatilityintheforeignexchange market," Journal of Finance, vol. 48, no. 4, pp. 139-168, 1993.

[12] A. G. Timmermann and C. W. Granger, "A new approach to the economic analysis of nonstationary time series and the business cycle," The Review of Economics andStatistics,vol.75,no.1,pp.123-137,1993.

[13] R. P. Engle and C. W. Granger, "Co-integration and error correction:Representation, estimation, and testing," Econometrica,vol.55,no.2,pp.251-276,1987.

[14] K. F. Kroner and V. Ng, "Modeling asymmetric comovements of asset returns," Review of Financial Studies,vol.11,no.4,pp.817-844,1998.

[15] J. P. Morgan, "Econometric analysis of ARCH: Stable paretian behavior," Journal of Business and Economic Statistics,vol.13,no.1,pp.15-27,1995.

Turn static files into dynamic content formats.

Create a flipbook
Issuu converts static files into: digital portfolios, online yearbooks, online catalogs, digital photo albums and more. Sign up and create your flipbook.