Analysis of proline in sour beer collected during barrel aging using
Ashleigh Merrill, Jenna Watson, Kian Kruk, Emily Santa Ana, Teresa Longin, Chemistry Department, University of Redlands, Redlands, CA, 92373
Bryan Doty Sour Cellars, 9495 9th Street Unit B, Rancho Cucamonga, CA91730
Confirming the Matrix Effect and Proline Concentrations
In recent years, sour beer has taken over the alcohol industry with its complex flavor profile.[1] The brewing process for sour and regular (non-sour) beer starts with water, malted barley, wheat, hops, and a mixture of yeast. For sour beer, brewers add bacteria like Lactobacillus or Pediococcus which produce organic acids during fermentation. Brewers then age the sour beer in barrels for several year. Yeast and bacteria can also produce trace compounds such as amino acids that provide subtle flavors During the fermentation process the concentrations of amino acids vary due to the consumption or production of amino acids by microbes in beer.[2]In both regular (non-sour) and sour beer, amino acids aid in the development of umami, smokey, flavors. Consequently, amino acids are essential to the final flavor profile of a brew. Amino acid concentrations in regular beer have been well studied using high performance liquid chromatography (HPLC). [3,4,5,6]. In these studies, proline concentrations ranged from 31.8-663 ug/mL, leucine concentrations ranged 2.60 – 84.8, and tyrosine ranged from 1.00 – 71.3, indicating that amino acid concentrations can vary widely among various types of beers. All these studies focused on non-sour beers and looked at finished products rather than exploring amino acid concentrations during the aging process. In contrast, amino acids concentrations in sour beer during the aging process or in the final product are not well studied. Given the complexity of the process for creating sour beer, brewers would benefit from knowing how amino acid concentrations can vary over time for various brewing, fermenting and aging conditions.
Sour Beer Studies at the University of Redlands: Previous Work
To investigate the chemistry of sour beer during the aging process, Dr. Teresa Longin and Dr. David Soulsby of the University of Redlands partnered with Bryan Doty, head brewer at Sour Cellars. Doty collected samples every 2-4 weeks over the course of a year fromseven different batches of sour beer. Emily Santa Ana studied the relationship between tryptophan and 1,2,3,4-tetrahydroharmane-3-carboxylic acid in the sour beer samples using liquid chromatography mass spectrometry (LC-MS).[7] Jenna Watson continued this research by quantifying levels of phenylalanine, leucine, and proline in the samples.[8] Watson’s results for proline were significantly lower than expected based on literature results for regular beer. We speculated that this could be due to interference from the organic acid matrix present in the sour beer.
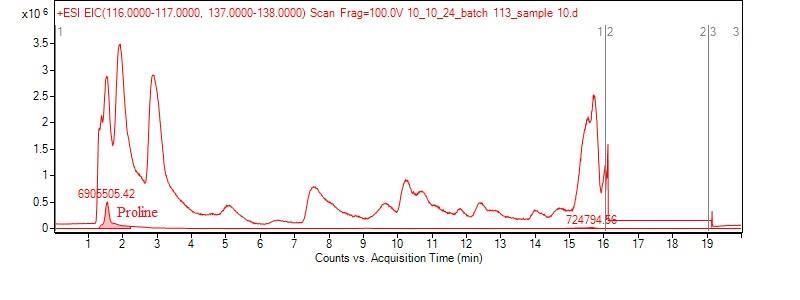
Kian Kruk [9] explored a possible matrix effect using tryptophan and tyrosine by adding a known amount of amino acid to solutions with varying % by volume of sour beer matrix. The matrix was an average of organic acid and ethanol concentrations found in the sour beer samples in a previous study.[10] As shown in the figure, Kruk found that tryptophan’s LC-MS signal was not affected by the sour beer matrix (right), but the LC-MS signal for tyrosine was significantly suppressed in a sour beer matrix (left). Tryptophan’s retention time is significantly longer than that of the organic acids, while tyrosine’s retention time is only about a minute longer than that of the organic acids. This suggests that if an amino acid’s retention time is closer to that of the organic acids, then that amino acid’s signal will be suppressed. The retention time of proline is almost the same as that of the organic acids, so proline is likely to experience a significant matrix effect. The goal of this study is to confirm that matrix effect for proline and to use matrix-matched standards to more accurately quantify proline and other amino acids.
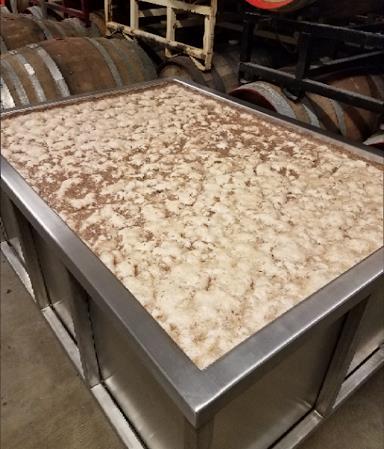
Sample Preparation and Experimental Conditions
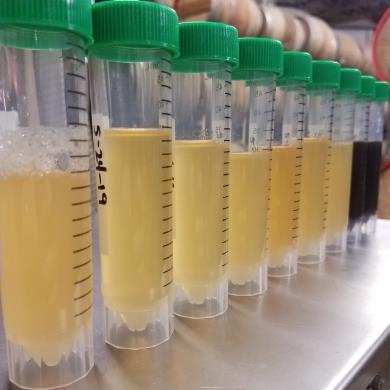
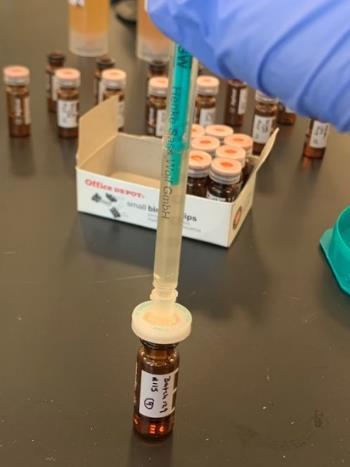
We used a sour beer matrix to simulate the composition of sour beer samples. This matrix consisted of ethanol, lactic acid, and acetic acid, diluted in LCMS grade water. These percentages were determined by Alexis Cooper in a previous study at the University of Redlands.[10]
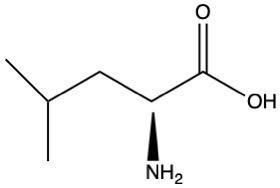
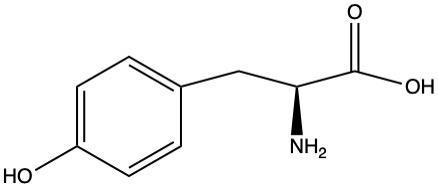
Matrix matched standard solutions of dl-proline (Sigma-Aldrich, 99%), l-leucine (Sigma-Aldrich, >98%), and l-tyrosine (Sigma-Adlrich 99%) were prepared in the ranges of 2-140 ppm.
QuantifyingAminoAcids
To confirm the matrix effect for proline, we created a “mock beer” sample consisting of 40 g/mL of proline in a sour beer matrix. We also created proline standards using sour beer matrix as the solvent and another set of standards using water as the solvent. We analyzed the mock beer sample using LC-MS along with both sets of standards. We used the calibration curves from the two sets of standards to convert the proline peak area of the mock beer to the concentration of proline to see which set of standards reproduced the known concentration of proline in the mock beer. The water-based calibration curve gave back a concentration of 2.39 ug/mL while the sour beer matrix calibration curve gave a much more accurate concentration of 39.8 ug/mL for the 40.0 ug/mL mock beer sample. This results demonstrates that there is a significant matrix effect for proline and confirms that we must use matrix-matched standards to determine accurate concentrations of amino acids in our sour beer samples. The standard curves themselves (on the left) show a significantly diminished peak area of proline (as measure in ion counts) in the standards made with the sour beer matrix, further demonstrating that the organic acids suppress the proline signal.

AminoAcids in Sour Beer vs Regular Beer Results & Discussion
Proline results from this study
Proline results from Watson’s study[8]
Plots of the concentrations of proline vs. days from brew for the seven different batches obtained in this study using matrix-matched standards and obtained by Watson [8] using standards with water as the solvent are shown above. Both studies show that the proline concentrations tend to increase over time and then level off after about 150 days from brew for most batches. However, the proline concentrations obtained in this study are much higher than those obtained by Watson.[8] The overall concentration range for proline during the aging process in Watsons study was approximately 4.00 to 25.0 ug/mL, while the concentration range for our study was 11.9 to 109 ug/mL. This shows that the concentrations determined using matrix-matched standards give a much broader and larger range for proline concentrations in sour beer. Furthermore, the final concentration values found in this study fall within the final concentration ranges of proline in regular beer .[3-6] This confirms that matrixmatched standards must be used to produce accurate concentrations of amino acids in sour beer.
In addition to studying proline and leucine, we also used matrix-matched standards to quantify tyrosine concentrations in our samples. Plots of concentration versus days from brew for all seven batches for each amino acid are shown above. Batches 113 and 123 show very similar trends for all three amino acids. For both batches, proline levels increase slightly and then level off at relatively high concentrations after 150 days, while the concentrations of leucine and tyrosine are relatively moderate and remain steady over time. For batches 119 and 132, proline, leucine, and tyrosine concentrations tend to increase and then level off after about 150 days. However, batch 119 has relatively high concentrations of all three amino acids, while batch 132 has relatively low levels. For batch 125, the concentrations of all three amino acids increase slightly and then level off after about 100 days. However, the concentrations of proline remain relatively low with the concentrations of leucine and tyrosine remain high. Like batch 125, the levels of all three amino acids in batch 130 tend to increase over time and then level off after about 100 days. However, proline and leucine levels remain relatively low while the concentration of tyrosine is relatively high.
Batch 129 shows very odd behavior for tyrosine. The concentrations of all three amino acids are relatively moderate and remain steady over time until day 385. At this point, the concentration of tyrosine drops dramatically to an undetectable level while proline and leucine concentrations remain constant. This was not due to an instrumentation issue, as the batch was run twice in the LCMS to ensure he instrumentation was not at fault. This trend will need to be further investigated.
Several past studies have determined amino acid concentrations in regular beers such as pilsners, lambics, pale ale, and Eastern European wheat beers [36] The table on the right summarizes ranges of concentrations proline, leucine, and tyrosine in the studies on regular beers and the ranges we found using matrix-matched standards. Our concentrations for proline and tyrosine fall into the general range for proline found in regular, finished beer. This agreement gives us confidence that using matrix-matched standards provides accurate concentrations for amino acid concentrations in our sour beer samples. It also suggests that microbial activity involving these amino is similar in sour and regular beer. Our concentrations of leucine tend to be a bit higher than the concentrations found in regular beer, so it’s possible that microbial activity involving leucine is slightly different between sour and regular beer. We plan to investigate other amino acids to see how ranges in our sour beer samples compare to those for regular beer.
Since Watson studied leucine concentrations [8], we also quantified leucine concentrations used matrix-matched standards. As for proline, the concentration trends for our study match Watson’s study. However, the concentration ranges are much higher with matrix-matched standards suggesting that leucine also experiences a matrix effect due to organic acids in sour beer.
Conclusions and Future Work
This work confirmed that the presence of organic acids in the sour beer matrix suppress the LC-MS signal for proline, establishing that we must use matrix-matched standards to obtain accurate concentrations for most amino acids. Our results for proline showed similar trends in concentration vs. days from brew to the results obtained by Watson [8], but we found much higher concentrations of proline. To further compare our results to Watson’s results, we quantified leucine in the sour beer samples using matrix-matched standards, and our trends in leucine concentration versus days from brew were similar to those obtained by Watson [8] but, again, our concentrations were higher. Finally, we used matrix-matched standards to find concentrations of tyrosine in the sour beer samples. In general, concentrations of the three amino acids increased over time and then leveled off for most batches. However, for batch 129, the concentration of tyrosine abruptly fell to undetectable levels while the concentrations of proline and leucine remained constant. In addition, batch 130 showed relatively low levels of leucine and proline but relatively high levels of tyrosine compared to other batches. This confirms that the biochemical processes controlling concentrations of amino acids can vary depending on the brewing conditions and the amino acids.
We plan to use matrix-matched standards to study concentrations of more amino acids in sour beer to see if other amino acids exhibit some of the same variable trends as tyrosine. We will also compare trends for amino acids to trends in concentrations of organic acids and ethanol found by Cooper.[10] These comparisons will help shed light on the biochemical processes involved in fermentation and aging.
Brewing of sour beer is an intricate process affected by numerous variables like starting ingredients, extraction and mashing times, barrel wood, temperature, humidity, and wild fermentation. These unknown variables contribute to a wonderfully complex brew but can result in quality inconsistency and difficulties with reproducibility. Having a more
1.
We plan to look more closely at the conditions Bryan Doty used for brewing various batches to see if there are correlations between brewing conditions such as the relative amounts of wheat and barley, the types of hops used, etc. and amino acid trends. We also have information about trends in organic acid and ethanol concentrations from previous work[10] and will look at those trends for correlations with amino acid concentrations.
4. Erbe, T.; Bruckner, H.; Chromatographic determination of amino acid enantiomers in beers and raw materials used for their manufacture, Journal of Chromatography A,
881(1-2), 81-91.
5. Schad, G.J.; Bollig B. Fast and Simple Determination of FreeAminoAcids in Beer. The Column, 2015, 10. 6. Ferreira, I., Guido, L.;Impact of WortAminoAcids on Beer Flavour a Review. Fermentation. 2018, 4-23.