International Research Journal of Engineering and Technology (IRJET)
e-ISSN: 2395-0056
Volume: 11 Issue: 03 | Mar 2024
p-ISSN: 2395-0072
www.irjet.net
FLOOD RISK ASSESSMENT AND ZONATION OF NILAMBUR TALUK USING GEOSPATIAL ANALYSIS Aswin Saji1, Shaheer Akhthar C P2, Shilpa B3 1Department of Marine Geology, Mangalore University, Karnataka, India 2 3 Department of Geography, Mangalore University, Karnataka, India
---------------------------------------------------------------------***---------------------------------------------------------------------
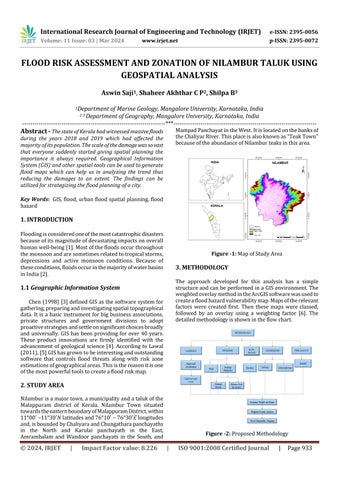
Mampad Panchayat in the West. It is located on the banks of the Chaliyar River. This place is also known as “Teak Town” because of the abundance of Nilambur teaks in this area.
Abstract - The state of Kerala had witnessed massive floods during the years 2018 and 2019 which had affected the majority of its population. The scale of the damage was so vast that everyone suddenly started giving spatial planning the importance it always required. Geographical Information System (GIS) and other spatial tools can be used to generate flood maps which can help us in analyzing the trend thus reducing the damages to an extent. The findings can be utilized for strategizing the flood planning of a city. Key Words: GIS, flood, urban flood spatial planning, flood hazard
1. INTRODUCTION Flooding is considered one of the most catastrophic disasters because of its magnitude of devastating impacts on overall human well-being [1]. Most of the floods occur throughout the monsoon and are sometimes related to tropical storms, depressions and active monsoon conditions. Because of these conditions, floods occur in the majority of water basins in India [2].
Figure -1: Map of Study Area
3. METHODOLOGY The approach developed for this analysis has a simple structure and can be performed in a GIS environment. The weighted overlay method in the ArcGIS software was used to create a flood hazard vulnerability map. Maps of the relevant factors were created first. Then these maps were classed, followed by an overlay using a weighting factor [6]. The detailed methodology is shown in the flow chart.
1.1 Geographic Information System Chen (1998) [3] defined GIS as the software system for gathering, preparing and investigating spatial topographical data. It is a basic instrument for big business associations, private structures and government divisions to adopt proactive strategies and settle on significant choices broadly and universally. GIS has been providing for over 40 years. These product innovations are firmly identified with the advancement of geological science [4]. According to Lawal (2011), [5] GIS has grown to be interesting and outstanding software that controls flood threats along with risk zone estimations of geographical areas. This is the reason it is one of the most powerful tools to create a flood risk map.
2. STUDY AREA Nilambur is a major town, a municipality and a taluk of the Malappuram district of Kerala. Nilambur Town situated towards the eastern boundary of Malappuram District, within 11°00′ −11°30′𝑁 latitudes and 76°10′ − 76°30′𝐸 longitudes and, is bounded by Chaliyara and Chungathara panchayaths in the North and Karulai panchayath in the East, Amrambalam and Wandoor panchayats in the South, and
© 2024, IRJET
|
Impact Factor value: 8.226
Figure -2: Proposed Methodology
|
ISO 9001:2008 Certified Journal
|
Page 933