
International Research Journal of Engineering and Technology (IRJET) e-ISSN: 2395-0056
Volume: 12 Issue: 04 | Apr 2025 www.irjet.net p-ISSN: 2395-0072


International Research Journal of Engineering and Technology (IRJET) e-ISSN: 2395-0056
Volume: 12 Issue: 04 | Apr 2025 www.irjet.net p-ISSN: 2395-0072
Joshua C. Junio1
1Faculty, Civil Engineering Department, Pangasinan State University- Urdaneta City, Pangasinan, Philippines ***
Abstract - Thisstudyinvestigatestheductilebehaviorofreentrant corner reinforced concrete (RC) buildings using nonlineartimehistoryanalysis.Re-entrantcornersintroduce geometric irregularities that significantly influence seismic performance, particularly the structural ductility, which is a critical factor in energy dissipation and collapse prevention during earthquakes. A total of 180 two-storey RC buildings with various plan shapes and re-entrant projections were modeled and designed using SAP2000, following NSCP 2015 provisions. Nonlinear time history analysis was performed using the 1995 Kobe earthquake ground motion. Ductility values in both x and y directions were calculated by bilinearizingthebaseshear–displacementcurvesandrelating peak ground acceleration (PGA) at yield and ultimate states. To estimate ductility values, stepwise nonlinear regression analysis was conducted in MATLAB, utilizing models such as polynomial regression, support vector regression, Gaussian process regression, decision trees, ensemble methods, and neuralnetworks.Twelveinputvariables,includingplanshape, re-entrant corner projection (x and y), building weight, material properties (concrete and rebar), shear reinforcements (beams and columns), and flexural reinforcement incolumns, topand bottombar reinforcement in beams, and compression-to-tension reinforcement ratio in beams, were evaluated. The best-performing models were identified based on R², RMSE, MAE, and MSE. A regression modelwasthenappliedtopredicttheductilityofanactualreentrant corner RC building, which was validated through nonlinear pushover and time history analysis. The study presents a reliable framework for estimating ductility in irregular RC buildings and offers valuable insights for enhancing seismic design and safety in earthquake-prone regions.
Key Words: Re-entrant Corner Irregularity, Reinforced Concrete (RC) Buildings, Nonlinear Time History Analysis, Regression Analysis
ThePhilippines,duetoitslocation,ispronetoearthquakes, experiencingaround30daily[1].Historicalearthquakeslike the1976MoroGulf(M8.1)andthe1990Luzonquake(M7.8) have caused severe damage and fatalities [2]. Earthquake impacts are worsened by structural vulnerabilities, particularly a lack of structural ductility, the ability of a building to deform without collapsing. Incorporating
ductility helps structures absorb seismic energy and minimize collapse risks [3][4]. Among RC buildings, reentrantcornerconfigurationsarecommonfortheirspatial and aesthetic efficiency, but their geometric irregularity increases seismic vulnerability which leads to stress concentrationandtorsion[5].PertheNSCP2015,re-entrant cornerirregularityisdefinedwhenprojectionsexceed15% of the plan dimension [6]. This irregularity significantly affects seismic parameters such as base shear and storey drift,whichinfluenceductilityandtheresponsemodification factor(R)[7][8].However,ATC-19donotfullyaddressplan irregularities, and adjustments are recommended for irregularstructures[9][10].Ductilitycanbeimprovedwith proper materials, reinforcement, and joint detailing [11] Whilenumericalsimulationsandstatic/dynamicanalyses are standard, they often demand high computational resources [12]. To address this, this study proposes using nonlinear time history analysis and regression analysis to estimateductilityvaluesinre-entrantcornerRCbuildings. The goal is to develop a more efficient, data-driven frameworktoassesstheseismicperformanceofirregularRC structures, enhancing safety and resiliency in building design.
This study aims to assess the ductile behavior of reentrant corner reinforced concrete (RC) buildings and to estimate the ductility considering plan shape, projection beyondare-entrantcorneralongx-directionandy-direction, buildingweight,materialproperties,shearreinforcementin beamsandcolumns,flexuralreinforcementincolumns,top andbottombarreinforcementinbeams,andcompressionto-tension reinforcement ratio in beams using regression analysis.Specifically,thestudysoughtanswers:
Toevaluatetheseismicresponseofre-entrantcornerRC buildings using time history analysis considering the effectofthefollowingparametersontheductilityforthe developmentofaregressionmodel:
planshape,
projection beyond a re-entrant corner along x and y direction,
buildingweight,
materialproperties,
shearreinforcementinbeamsandcolumns,
flexuralreinforcementincolumns,
topandbottombarreinforcementinbeams,and

International Research Journal of Engineering and Technology (IRJET) e-ISSN: 2395-0056
Volume: 12 Issue: 04 | Apr 2025 www.irjet.net p-ISSN: 2395-0072
compression-to-tensionreinforcementratioinbeams.
To develop a regression model for estimating the ductilityofre-entrantcornerRCbuildings.
Tovalidatetheductilityofanactualre-entrantcorner RCbuildingusingthedevelopedregressionmodeland thecode-prescribedmethods.
2.1 Evaluation of the Seismic Response of Re-entrant Corner RC Buildings
Structural Modeling and Design of the 180 Building Models
The study analyzed two-storey RC buildings with a regularstoreyheightof3.0m.Thestudymodelsinclude 3D irregular RC buildings in U-shaped, E-shaped, Hshaped, L-shaped, Plus-shaped, T-shaped, and Z-shaped plans.Thebuildinginventoryalsoincludesaregular(boxshaped)building.
Five different projections, 0%, 20%, 40%, 60%, and 80%, were studied. A total of 45 building models with unique plan shapes were modeled and designed using SAP2000 The different building model parameters are showninTable1
Table – 1: BuildingModelsParameters
Re-entrantcornerprojections
0%, 20%, 40%, 60%, 80% PlanConfiguration Regular, E, H, L, P, T, U, Z
Thedifferentmaterialpropertiesusedinthebuilding modelsareshowninTable2
Theforty-five(45)buildingmodelswerecategorized intofour(4)casesbasedonthematerialproperties,as shown in Table 3. A total of one hundred eighty (180) buildingmodelsweredesignedandanalyzedinthisstudy.
Table – 2: MaterialProperties
Concretestrength,fc’ 25 MPa, 28 MPa
Modulusofelasticityof concrete,Ec 200000 MPa
Yieldstrengthofsteel 280 MPa, 420 MPa
Table – 3: BuildingModelCasesBasedonMaterial Properties
4 28 MPa, 420 MPa
The beams and columns were designed with equal dimensions in all building models, as shown in Table 4. Three-dimensional frame modeling and analysis were conductedforthe180buildingmodelsusingthesoftware SAP2000.
Table – 4: DimensionsofFrameModels
Case1 25 MPa, 280 MPa
2 28 MPa, 280 MPa
Case3 25 MPa, 420 MPa
Case4 28 MPa, 420 MPa
ThegravityloadsusedarepresentedinTable5,andthe lateralloadswerecomputedusingSAP2000,accordingto UBC 97. Linear static analysis and response spectrum analysis were utilized for designing the structural members.Thecompleteseismicparametersusedinthe analysisareshowninTable6.

International Research Journal of Engineering and Technology (IRJET) e-ISSN: 2395-0056
Volume: 12 Issue: 04 | Apr 2025 www.irjet.net p-ISSN: 2395-0072
Table – 5: LoadsontheBuildingModels Load
Table – 6: SeismicParameters
The180buildingsweredesigneduntilallbeamsand columns had equal dimensions. The largest shear reinforcementrequirementinbeamsandcolumns,largest value of flexural reinforcement in columns, and largest compression-to-tension reinforcement ratio in beams wereobtainedfromtheresultsofeachbuildingmodel. These quantities served as input values in the development of a regression model for estimating the ductilityfactor.
Performing Nonlinear Time History Analysis
Groundmotiondatafromthe1995KobeEarthquakein Japanwasselectedfortheanalysis.Theparametersused todownloadandfilterthegroundmotionfromthePEER GroundMotionDatabasearesummarizedinTable7.
Table – 7: 1995KobeEarthquake
Japan
The horizontal components of the recorded seismic event were both exported to Microsoft Excel and subsequently imported into SAP2000 to define a time history function. The data was scaled to peak ground acceleration(PGA)rangingfrom0.1gto4.0gtosimulate varyinglevelsofearthquakeintensity.
Nonlinear Time History Analysis was conducted for each model. Key response parameters were extracted including base shear and maximum roof displacement. Results were graphed to visualize the relationships betweenPGAandstructuralresponseparameters.
Similar process was applied for the nonlinear time history analysis of the actual re-entrant corner RC building.
The graph of base shear versus maximum roof displacement was used two critical response points, includingmaximumpointandyieldpointofeachbuilding model.Acurvefittingtechniquewasappliedtoidentifythe maximum point, while the yield point was determined usingbilinearapproximation,asshowninFigure1.
A graph of peak ground acceleration (PGA) against displacement was also generated as shown in Figure 2. ThePGAatmaximumandPGAatyieldisobtainedfrom thisgraph. Theductilityvaluesonbothdirectionswere obtainedbydividingthePGAatthemaximumresponseof thebuildingbythePGAattheyieldpoint.

International Research Journal of Engineering and Technology (IRJET) e-ISSN: 2395-0056
Volume: 12 Issue: 04 | Apr 2025 www.irjet.net p-ISSN: 2395-0072
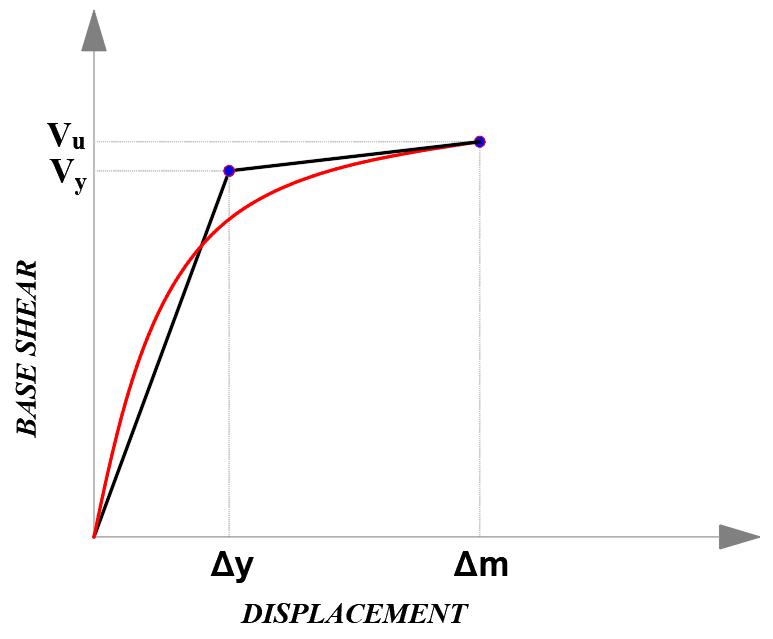
– 1: BilinearApproximationofBaseShearversus Displacement

Fig – 2: PGAversusDisplacement
Relationship of the Various Parameters on the Ductility
The dataset was prepared by organizing the independent variables (IVs) and dependent variables. ModelingbeganbyusingonlytwoIVsandincrementally increasethenumberofIVsuptoafullmodelwithtwelve IVs.
How each additional variable affects model performance was assessed. For every IV count, train multiplenonlinearregressionmodelstocapturevarious datarelationships.
For each trained model, the performance was evaluatedusingcoefficientofdeterminationR2,rootmean squarederrorRMSE,meanabsoluteerrorMAE,andmean squarederrorMSE. Theprocesswasrepeatedseparately forductilityinthex-directionandy-direction.
2.2 Development of a Regression Model for Estimating the Ductility Factor of Re-entrant Corner RC Buildings
Dataset Preparation
The 12 input features derived from the structural analysis and design of the 180 building models were collectedandprepared.
Theseincludeplanshape,projectionbeyondre-entrant corneralongx-directionandy-direction,buildingweight, materialproperties(concreteandrebarstrength),shear reinforcement in beams and columns, flexural reinforcement in columns, top bar and bottom bar reinforcement in beams, and compression-to tension reinforcementratioinbeams.Thetargetoutputvariable wasdefined:Ductility(XandYdirection),obtainedfrom nonlineartimehistoryanalysis.
Modeling using MATLAB’s Regression Learner App
ThedatasetwasloadedintoRegressionLearnerApp. Thedatasetwassplitintotrainingandvalidationsetsto ensuremodelgeneralizability.
Various regression algorithms were applied: linear regression, regression trees, support vector machines (SVM),Gaussianprocessregression(GPR),andensemble methods.Hyperparameteroptimizationswereperformed usingcrossvalidation.
Modelperformancewasevaluatedusingthefollowing metrics: Root Mean Square Error, R-squared, and Mean Absolute Error. Regression models were tabulated and rankedbasedontheirperformance.
using MATLAB’s Neural Network Fitting App
NeuralNetworkFittingAppfromtheDeepLearning Toolbox was used to build regression models. The modeling process was divided into three categories: DuctilityintheX-direction,DuctilityintheY-direction,and Ductility in both directions. Multiple regression models weredevelopedforeachcategoryusingthespecifications inTable8.
Table – 8: NeuralNetworkFittingAppSpecifications Specification Value
Inputdata(predictors) 12 features
Targetdata(output) 1 output
Trainingdata 75%, 80%
Validationdata 15%, 10%
Testingdata 15%, 10%
NumberofHiddenNeurons 1, 2, 3, 4, 5, 6, 7, 8, 9, 10
Trainingalgorithm LevenbergMarquardt

International Research Journal of Engineering and
Volume: 12 Issue: 04 | Apr 2025 www.irjet.net p-ISSN: 2395-0072
Building
Actual Re-entrant Corner RC Building Description and Structural Modeling
The complete architectural and structural plans of theactualbuildingusedinthisstudywasobtainedfrom theDepartmentofPublicWorksandHighways(DPWH) database.
A two-storey building with a T-shaped plan was selected for the study. The structural and earthquake parametersusedisinTable9and10,respectively.
Table – 9: T-shapedBuildingStructuralParameters
Concretestrength,fc’ 25 MPa (3500 psi)
Modulus of elasticity of concrete,Ec
Table – 10: T-shapedBuildingSeismicParameters
ThebuildingwasmodeledinSAP2000usingthedata obtainedfromthe plansand specifications. Thesame model was used for nonlinear pushover analysis, nonlinear time history analysis, and for extracting inputstotheregressionmodel.
Nonlinear Analyses of the Actual Building

Conductednonlinearpushoveranalysistodetermine maximumdisplacement andyielddisplacement . Calculated ductility by dividing maximum displacementby andyielddisplacement

Nonlineartimehistoryanalysiswasalsoconducted usingthe1995KobeJapanearthquakegroundmotion data.DuctilitywascomputedbydividingthePGAatmax dividedbyPGAatyieldstate.
Comparison and Model Validation
The developed regression model was applied to estimatetheductilityoftheactualbuilding.Thepredicted ductility was compared with the ductility obtained throughnonlinearpushoveranalysisandnonlineartime historyanalysis.
This comparison was conducted to validate the accuracy and reliability of the regression-based estimationapproach.
3.1 Evaluation of the Seismic Response of Re-entrant Corner RC Buildings
ShowninCharts1and2aretheductilityvaluesintheX andYdirectionofthe180buildingmodels.
Chart – 1: DuctilityValuesintheXdirection


International Research Journal of Engineering and Technology (IRJET) e-ISSN: 2395-0056
Volume: 12 Issue: 04 | Apr 2025 www.irjet.net p-ISSN: 2395-0072

Chart – 2: DuctilityValuesintheYdirection
ThehighestandlowestductilityintheXdirectionand YdirectionareshowninTables11and12.
Table – 11:HighestandLowestDuctilityValuesatX Direction
Case Model Name Ductility
Case 1
Case 2
Case 3
Case 4
Table – 12:HighestandLowestDuctilityValuesatY Direction
Case Model Name Ductility (Highest) Model Name Ductility (Lowest)
Case 1
Case 2
Case 3
Case 4
ShowninCharts3and4arethefittedcurveforthebase shear and roof displacement values from the results of the nonlineartimehistoryanalysesofthebuildingmodelT4080 inXandYdirections Themaximumpointwasdetermined fromthisgraph.

Chart – 3: BaseShearVersusDisplacementof T4080_FC25FY420(XDirection)

Chart – 4: BaseShearVersusDisplacementof T4080_FC25FY420(YDirection)
The bilinearization using Microsoft Excel in X and Y directionsofthebuildingmodelT4080wereshowninCharts 5and6.Theyieldpointwasobtainedfromthisgraph.
Meanwhile,displayedinCharts7and8arethegraphsof PGAversusdisplacementofthebuildingmodelT4080.This wasusedindeterminingtheductilityfactor.

International Research Journal of Engineering and
Volume: 12 Issue: 04 | Apr 2025 www.irjet.net p-ISSN: 2395-0072
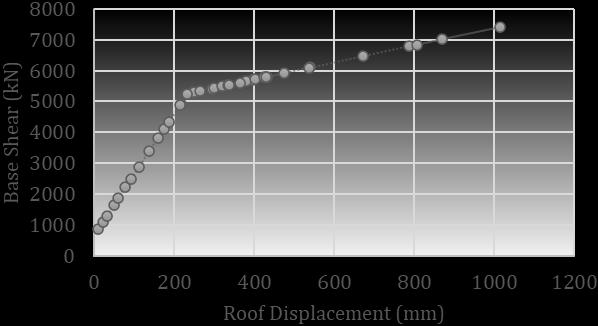
Chart – 5: BilinearizationforBaseShearVersus DisplacementofT4080_FC25FY420(XDirection)

Chart – 6: BilinearizationforBaseShearVersus DisplacementofT4080_FC25FY420(YDirection)
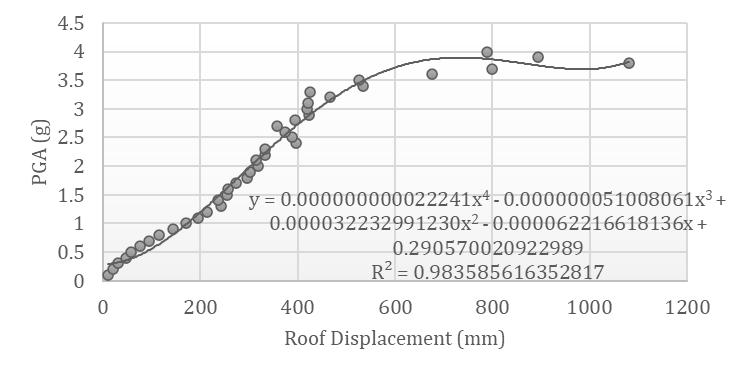
Chart – 7: PGAVersusDisplacementofT4080_FC25FY420 (XDirection)
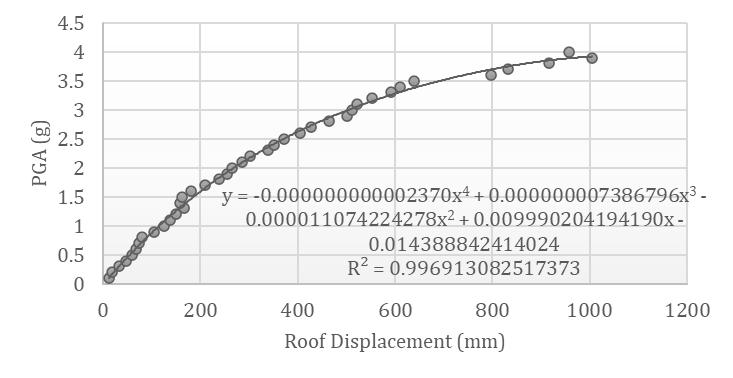
Chart – 8: PGAVersusDisplacementofT4080_FC25FY420 (YDirection)
The relationship between the various parameters and ductility factors were obtained using stepwise nonlinear regressionanalysis.TheresultsareshowninTables13and 14,forXandYdirections,respectively.Thebestperforming modelperIVcountsstartingfrom2variablesuptothefull model,12variables,arechosen.
Table – 13: StepwiseNonlinear
for DuctilityatXDirection
on
IV2,IV3, IV4,IV5, IV6,IV7, IV8,IV9, IV10,IV11, IV12
IV2, IV3,IV4, IV5,IV6, IV7,IV8, IV9,IV10, IV11,IV12
Legend:IV1-PlanShape;IV2–ProjectionX;IV3–Projection Y;IV4–BuildingWeight;IV5–ConcreteStrength;IV6-Rebar Strength;IV7–ShearReinforcementinBeams;IV8-Shear

International Research Journal of Engineering and Technology (IRJET) e-ISSN: 2395-0056
Volume: 12 Issue: 04 | Apr 2025 www.irjet.net p-ISSN: 2395-0072
ReinforcementinColumns;IV9–FlexuralReinforcementin Columns;IV10 – TopBarReinforcementinBeams;IV11 –BottomBarReinforcementinBeams;IV12–Compressionto-TensionReinforcementinBeams
Table – 14: StepwiseNonlinearRegressionResultsfor DuctilityatYDirection
IV count
2 Kernel Ridge IV1,IV9
3 Kernel Ridge IV7,IV9,IV12
4 Kernel Ridge IV4,IV9,IV10, IV12
5 Kernel Ridge IV4,IV5,IV6, IV9,IV12
6 Decision Tree IV1,IV5,IV6, IV10,IV11, IV12
7 Decision Tree IV6,IV7,IV8, IV9,IV10, IV11,IV12
8 Kernel Ridge IV2,IV5,IV6, IV7,IV8,IV9, IV10,1V12
9 Kernel Ridge IV1,IV3,IV4, IV5,IV6,IV7, IV9,IV11,IV12
10 Kernel Ridge IV1,IV3,IV4, IV5,IV6,IV7, IV8,IV9,IV11, IV12
11 Kernel Ridge IV1,IV3,IV4, IV5,IV6,IV7, IV8,IV9,IV10, IV11,IV12
12 Decision Tree IV1,IV2,IV3, IV4,IV5,IV6, IV7,IV8,IV9, IV10,IV11, IV12
Legend:IV1-PlanShape;IV2–ProjectionX;IV3–Projection Y;IV4–BuildingWeight;IV5–ConcreteStrength;IV6-Rebar Strength;IV7–ShearReinforcementinBeams;IV8-Shear ReinforcementinColumns;IV9–FlexuralReinforcementin Columns;IV10 – TopBarReinforcementinBeams;IV11 –BottomBarReinforcementinBeams;IV12–Compressionto-TensionReinforcementinBeams
3.2 Development of the Regression Model
ShowninTable14istheresultsoftheregressionanalysis usingMATLAB’sRegressionLearnerAppwith5-foldCross validation.
Table – 14: RegressionModelsusing5-foldCrossValidation
Regression Model
Meanwhile, the results of the regression analysis using MATLAB’s Regression Learner App with 10% Hold-out ValidationareshowninTable15.
Table – 15: RegressionModelsusing10%Hold-out Validation
To capture complex and nonlinear relationships among thedata,NeuralNetworkFittingToolwasalsousedtodevelop a regression model estimating the ductility values in both directions.
The results of the regression analysis using neural networks considering data split of 70% Training, 15% Validation,and15%Testsets,areshowninTable16.
Table – 16: NeuralNetworkModels
Shown in Table 17 is the results of the estimation of ductilityoftheT-shapedre-entrantcornerRCbuildingusing nonlinearpushoveranalysis.

International Research Journal of Engineering and Technology (IRJET) e-ISSN: 2395-0056
Volume: 12 Issue: 04 | Apr 2025 www.irjet.net p-ISSN: 2395-0072
Table – 17: DuctilityusingNonlinearPushoverAnalysis
Moreover, the results of the nonlinear time history analysisoftheactualbuildingisshowninTable18.
Table – 18: DuctilityusingNonlinearTimeHistory Analysis.
Method
History Analysis atX
History Analysis atY
Theresultoftheductilityestimationusingthedeveloped regressionmodelisshowninFigure3
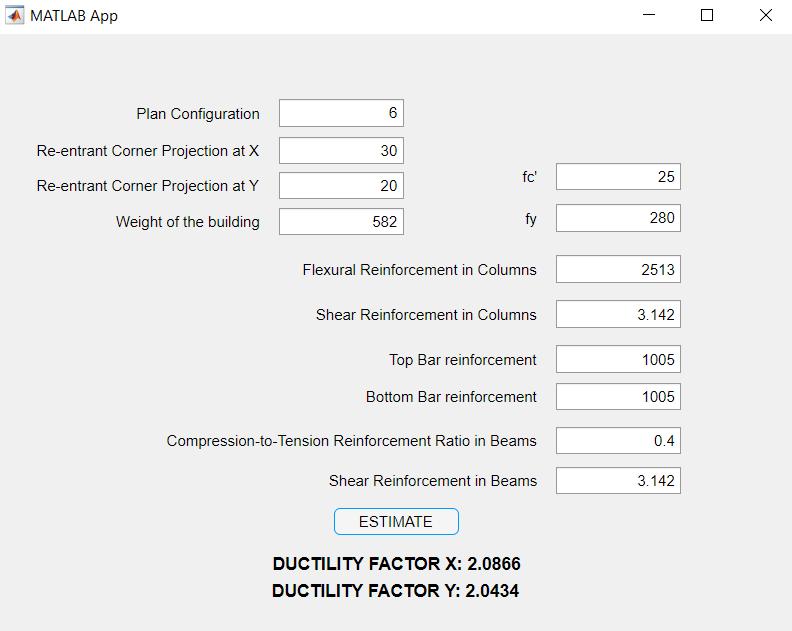
Fig – 3: DuctilityUsingtheDevelopedRegressionModel
Meanwhile,Table19showsthecomparisonoftheductility values obtained using the developed regression model
compared to the code- prescribed methods, pushover analysisandnonlineartimehistoryanalysis.
Table – 19: ComparisonoftheDuctilityValues
4.1 Evaluation of the Seismic Response of Re-entrant Corner RC Buildings
Nonlineartimehistoryanalysisrevealedthatbuildings with larger re-entrant corner projections (e.g., 80%) exhibited higher ductility, while those with smaller projections (e.g., 20%) performed less favorably. This behaviorwascausedbytheexperimentalsetupwhereall buildingmodelsdesignedtohaveequalbeamdimensions and equal column dimensions across the 180 building models.Thekeydifferentiatingfactorwasthepercentage of re-entrant corner projection which introduced geometricirregularityonthebuildingmodels.
ModelT4080consistentlydisplayedthehighestductility, whilemodelslikeZ2020andZ4060hadthelowest.
As the number of independent variables (IV) increase, themodelaccuracyimprovessignificantly,from0.749to 0.99.
TheerrormetricsdecreasesasIVcountincreases.This indicatesbetterpredictiveperformancewithmoreIVs.
The variables that appear consistently across the best models per IV count indicates strong influence on the ductility on x- direction. These includes plan shape, concrete strength, top bar beam reinforcement, shear reinforcementincolumns,buildingweight,projectionsin X and Y, flexural reinforcement in columns, and compression-to-tensionreinforcementratioinbeams.
Meanwhile, for ductility on y-direction, the highly influential variables are compression-to-tension reinforcement ratio, flexural reinforcement in column, rebar strength, concrete strength, top bar beam reinforcement,shearreinforcementinbeam,planshape, projectioninY,andbuildingweight.
4.2 Development of the Regression Model
The ductility at X can be estimated reliably using nonlineartechniqueslikeNeuralnetworksorGaussian processregression.

International Research Journal of Engineering and Technology (IRJET) e-ISSN: 2395-0056
Volume: 12 Issue: 04 | Apr 2025 www.irjet.net p-ISSN: 2395-0072
Meanwhile, the ductility at Y is more variable due to directional irregularities or less significant predictor correlation.
Theregressionmodelpredictingthecombinedductility at X and Y offers good overall correlation between predictedandactualductilityvalues.Italsogeneralizes wellonunseendata.
4.3 Ductility Estimation of an Actual Re-entrant Corner RC Building
Ductilityvaluesarehigherinpushoveranalysisbecause it uses static nonlinear loading and does not capture dynamic effects like inertia, rate of loading, or cyclic degradation.
TimeHistoryanalysisgivesamoreconservativeductility estimatecomparedtopushoveranalysis.
The developed regression model provides a ductility estimateclosetotheresultsofthenonlineartimehistory analysis with 4.7% difference in X direction and 0.4% differenceinydirection.
This study demonstrated how re-entrant corner projections affects significantly the ductility of reinforced concretebuildingswhensubjectedtoearthquakeloads.
Whenallbuildingmodelsweredesignedtohaveequal beam dimensions and equal column dimensions, the reentrantcorner projection becomesa critical factor, where larger projections tend to improve ductility by promoting betterdistributionofseismicforcesandenergydissipation, whilesmaller projectionsleadtostressconcentrationand reducedperformance.
Amongthemodelstested,T4080,T-shapedwith40% projectionatXand80%projectionatY,consistentlyshowed superiorductility.
Throughnonlinearregression,itwasfoundthatmodel accuracyimprovesasmoreinfluentialvariables,suchasplan shape, material properties, and reinforcement details, are considered.TheductilityintheX-directioncanbepredicted reliably, while estimates in the Y-direction show greater variabilityduetodirectionalirregularities.
Moreover,thecombinedregressionmodelgeneralized well and closely matched the results from nonlinear time history analysis, outperforming pushover estimates. This highlights the value of using data-driven approaches for practical and accurate ductility prediction in irregular RC buildings.
[1] Philippine News Agency (PNA), “Phivolcs: PH experiencesanaverageof30quakesperday,” Philippine News Agency, Jan. 17, 2025. [Online]. Available: https://www.pna.gov.ph/articles/1242557
[2] DOST-PHIVOLCS, “Destructive Earthquake of the Philippines,” [Online]. Available: https://www.phivolcs.dost.gov.ph/index.php/earthqua ke/destructive-earthquake-of-the-philippines/17earthquake.[Accessed:Apr.17,2025].
[3] D.O.Knuttunen,“Theroleofductilityinseismicdesign,” Civil Engineering Practice, vol. 2, pp. 17-31, 1987. [Online].Available:https://www.bscesjournal.org/wpcontent/uploads/CEP-Vol-2-No-1-02.pdf.
[4] R. Park, “Evaluation of ductility of structures and structural assemblages from laboratory testing,” New ZealandNationalSocietyforEarthquakeEngineering,vol. 22,no.3,Sep.1989.
[5] C. Shreyasvi and B. Shivakumaraswamy, “Seismic response of buildings with re-entrant corners in differentseismiczones,” IJRET: International Journal of Research in Engineering and Technology, vol. 4, no. 4, 2015.
[6] AssociationofStructural EngineersofthePhilippines, National Structural Code of the Philippines: Volume 1 –Buildings, Towers and Other Vertical Structures,7thed. ASEP,2015.
[7] N.DixitandA.Jhanjhot,“Analysis&designofirregular buildingwithre-entrantcornerusingpushoveranalysis: Areview,” InternationalJournalofScientificDevelopment and Research (IJSDR),vol.5,no.9,2020.
[8] R. Riddell, P. Hidalgo, and E. Cruz, “Response modificationfactorsforearthquake-resistantdesignof short period buildings,” Earthquake Spectra, pp. 571590,1989.
[9] Applied Technology Council, Structural Response Modification Factors,1995.
[10] The Japan Building Disaster Prevention Association, Standard for Seismic Evaluation and Guidelines for Seismic Retrofit of Existing R/C Buildings (English Translation),2005.
[11] M. M. Ahmed, M. H. Baluch, A. K. Azad, and A. M. Alhozaimy,“Effectoftopbeamreinforcementanchorage detailsontheductilityofhighstrengthconcretebeamcolumnjoints,” KSCEJournalofCivilEngineering,vol.23, no.7,pp.3096–3105,2019,doi:10.1007/s12205-0191285-6.
[12] A. K. Chopra, Dynamics of Structures: Theory and ApplicationstoEarthquakeEngineering,5thed.Pearson, 2017.

Joshua C. Junio isa candidatefor the degree, MasterofScienceinCivilEngineering,majorin Structural Engineering, at Tarlac State UniversityinTarlacCity,Tarlac,Philippines.He is currently a faculty member in the Civil Engineering Department at Pangasinan State University-UrdanetaCityCampusinUrdaneta City,Pangasinan,Philippines.