TOP CROP MANAGER
CROP PEST FORECAST
FOR 2015
What’s in store?
PG. 16 A WHAMMY ON WILD OAT
Cultural practices are good ally PG. 32 CANOLA CHALLENGE
Are extra inputs warranted? PG. 42

FOR 2015
What’s in store?
PG. 16 A WHAMMY ON WILD OAT
Cultural practices are good ally PG. 32 CANOLA CHALLENGE
Are extra inputs warranted? PG. 42
8 | Verticillium wilt in canola A first for Canada. Is this an isolated incident?
By
Donna Fleury
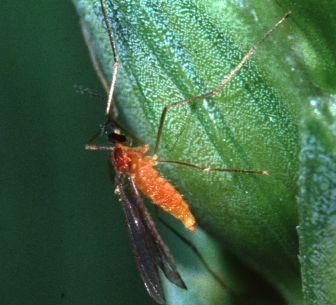
16 | Insect update and forecast 2015 For most farmers, 2014 was a good year. What’s in store for 2015?
Bruce
Barker
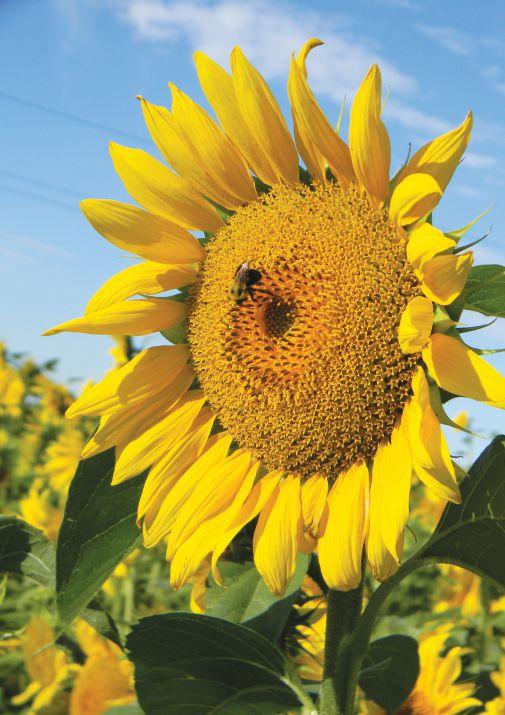
| Made-for-Canada sunflower varieties New sunflower varieties specifically for Canadian cropping under development.
Madeleine Baerg
Wheat stem sawfly requires
Brian Beres
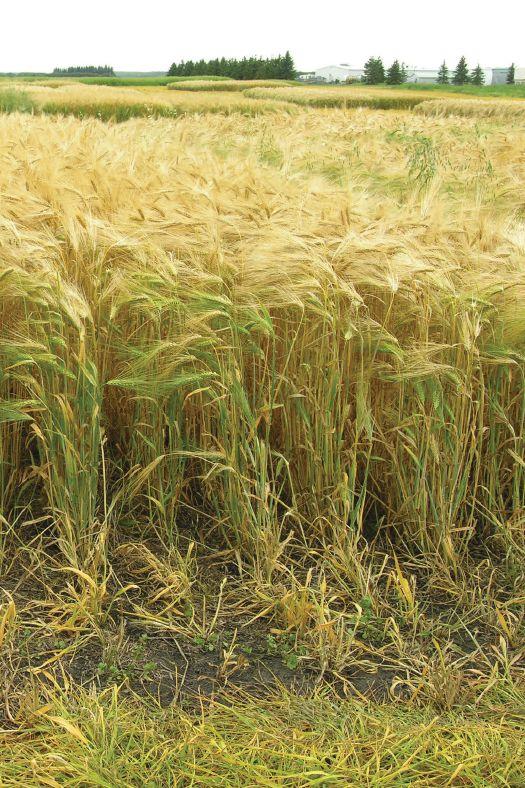
A whammy on wild oat
Anne Cote
The future looks bright
Janet Kanters

JANET KANTERS | EDITOR
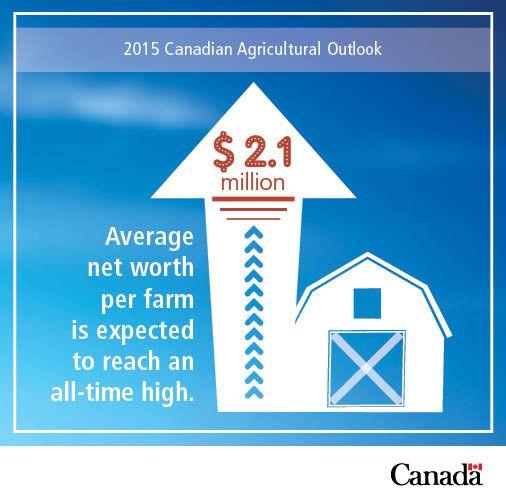
The 2015 Canadian Agricultural Outlook was released about a month ago, and by all indications, the future looks bright for agriculture in this country.
The report, prepared by Agriculture and Agri-Food Canada in consultation with provincial governments and Statistics Canada, is used as a benchmark for governments and industry as they plan for the years to come. The report is a forecasted outlook for farm cash receipts, expenses and net incomes, and highlights the trends that are expected to influence global agriculture and agri-food markets over the medium term (2015 to 2024).
The highlights of the report read fairly positive, for the most part. For instance, strong crop sales and relatively stable input costs that produced record farm incomes in 2014 will continue to sustain the agricultural economy in 2015. On the downside, 2015 farm incomes will be down moderately; on the upside, they remain historically high, at $13 billion.
Still crunching the numbers, the report states aggregate net cash income for 2014 is expected to reach $14 billion, 10 per cent above the 2013 record. Farm-level average net operating income is forecast to be $78,139, an all-time high, and average net worth per farm is expected to set new records of $2 million in 2014 and $2.1 million in 2015.
In the latter part of 2014, grain and oilseed prices declined following an unprecedented corn and soybean harvest in the U.S., but Canadian sale volumes remained strong, partially offsetting these price declines. With farmers carrying forward a large portion of their record 2013 crop into 2014, and with a larger-than-average 2014 harvest, grain and oilseed sales increased. Taking all this into account, the 2015 Canadian Agricultural Outlook forecasts global prices for grains and oilseeds will increase over the medium term.
For Canada’s livestock producers, the report states cattle and hog sectors enjoyed record prices in 2014 due to low North American supplies, while weakening feed grain prices also contributed to higher incomes. Although it’s expected total livestock receipts will not change significantly in 2015, cattle receipts will continue to benefit from tight markets and higher prices.
It certainly sounds rosy.
To keep the good news moving right along, this issue of Top Crop Manager brings you another full slate of excellent crop production content to assist you in the 2015 crop year. Several of the stories in this issue focus on insect pests you had to contend with in 2014, and which ones you may see in 2015.
Also in this issue of the magazine, we delve into the newest disease threat in canola – verticillium wilt. Following confirmation of the disease last fall in a Manitoba field, the response by industry and government was swift. While the Canola Council of Canada says farmers don’t have to be too concerned yet, agronomy director Clint Jurke suggests it’s important to keep updated on the situation and to learn as much about the disease as you can. Read more on page 8.
We also feature stories on tank-mixing, managing manure fertilizer and sunflower breeding initiatives.
For all the latest news, remember to visit our website, topcropmanager.com.

Simcoe, ON N3Y 4N5 subscribe@topcropmanager.com Printed in Canada ISSN 1717-452X CIRCULATION email: subscribe@topcropmanager.com Tel.: 866.790.6070 ext. 202 Fax: 877.624.1940 Mail: P.O. Box 530, Simcoe, ON N3Y 4N5
SUBSCRIPTION RATES Crop Manager West - 9 issuesFebruary, March, Mid-March, April, June, September, October, November and December - 1 Year - $45.00 Cdn. plus tax
Top Crop Manager East - 7 issuesFebruary, March, April, September, October, November and December1 Year - $45.00 Cdn.


shut downs, gack, gels and headaches.
by Bruce Barker
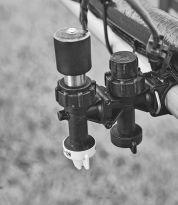
There was a time when loading up the sprayer tank was as simple as filling the sprayer tank one-half full of water, adding the herbicide with agitation, filling the tank and going spraying. In some cases today, though, you almost have to have a chemical engineering degree to mix up the herbicide cocktail. Add everything in the correct order and life is good. If you tank-mix products incorrectly, you could experience sediments in the spray tank, gelling, and plugging of nozzles and filters.
“The first thing you should ensure is that the tank-mix is either on the label or supported by the manufacturer. If the tank-mix is supported, you know the manufacturer has spent time researching the product and understands how to mix the products together,” Brian Wintonyk, agronomy leader with Dow AgroSciences at Calgary, Alta., says. “The label and the manufacturer should be your first sources of information.”
Wintonyk says before adding herbicides, growers should ensure the sprayer tank is cleaned so residues do not hurt sensitive crops. Additionally, he says to make sure the chemical injection tanks are thoroughly cleaned, and to rinse the injection tank between each herbicide addition.
Adding herbicides into the tank in the correct order is critical to ensure herbicide compatibility isn’t compromised. Generally, following the WALES acronym is a good way to remember the order of products. Before adding any products, fill the sprayer tank with onehalf to three-quarters of the required water. Any water conditioners, buffering agents or defoamers generally go in next. Then, follow the WALES sequence: Wettable powders and water dispersible granules; Agitate; Liquid flowables and suspensions; Emulsifiable concentrate (ECs) formulations; and Surfactants/solutions.
Suspension forming products like wettable powders (WP), dry flowables (DF) or water-dispersible granule products (WDG) should be added to the tank first. Adequate agitation throughout the mixing process is important and ensures products are well dispersed in the spray tank. Some of the new technologies in these formulations mix very readily, and with today’s sprayers, they can disperse rapidly in the spray solution.
Liquid flowable (F, FL) are added next followed by emulsifiable concentrates (EC). Finish filling the sprayer tank and add any surfactants.
Wintonyk cautions mixing of different product formulation types should be done carefully. Glyphosates are a good example
because different undiluted glyphosate formulations may react with each other.
“If you add different glyphosate formulations into a chemical injector, you can end up with a Slurpee in the chemical handler. Avoid mixing different formulations, if possible,” he notes.
Of course, there can be exceptions so always check the label, and with the manufacturers, if in doubt.
In addition to providing an exceptional yield increase, Prosaro® fungicide protects the high quality of your cereals and helps ensure a better grade.
With two powerful actives, Prosaro provides long-lasting preventative and curative activity, resulting in superior protection against fusarium head blight, effective DON reduction and unmatched leaf disease control.
With Prosaro you’ll never have to settle for second best again.
For more information, please visit: BayerCropScience.ca/Prosaro

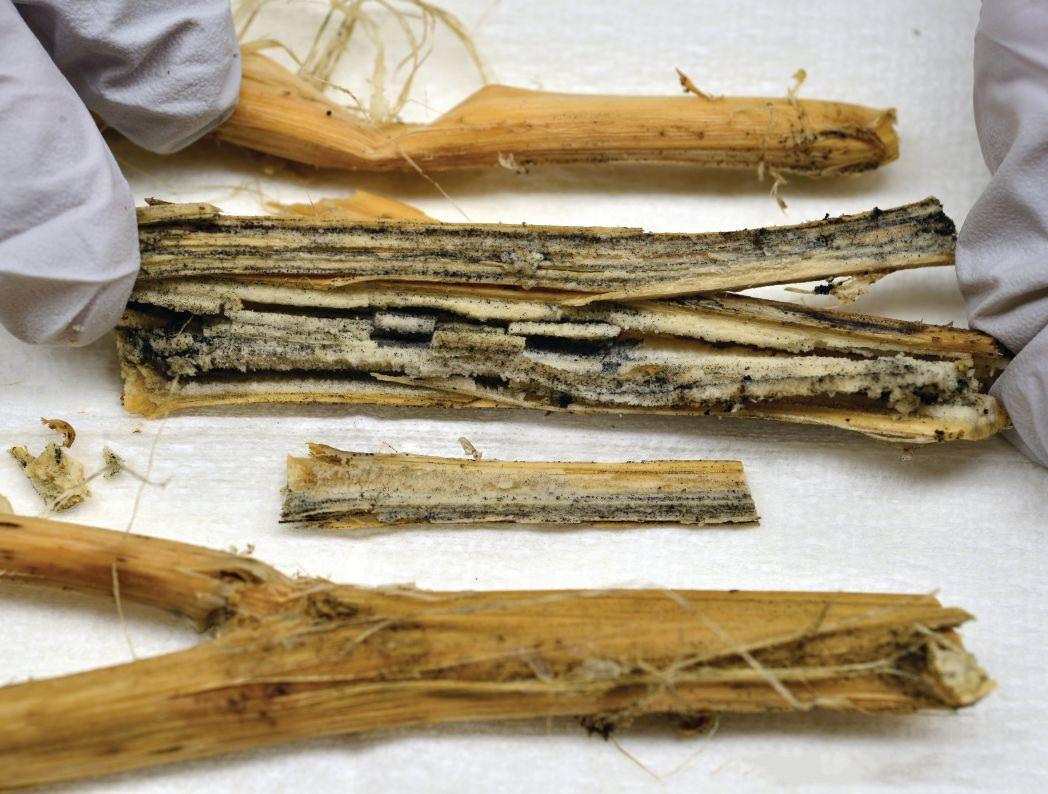
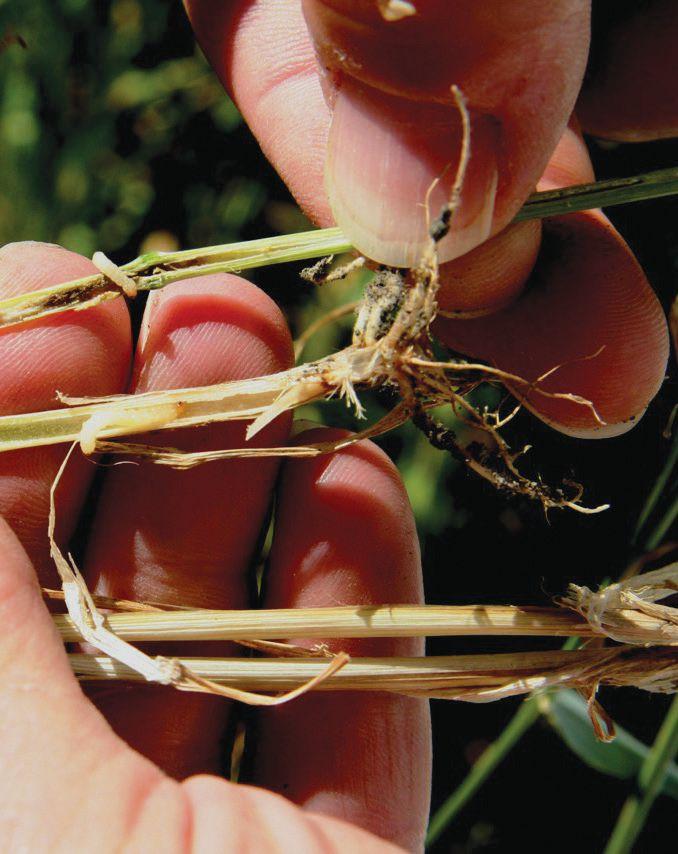
A first for Canada. Is this an isolated incident?
by Donna Fleury
Acanola disease previously undetected in Canada made its first appearance in one field in Manitoba last fall. Federal and provincial governments and industry are working together to isolate the verticillium wilt disease and assess the potential risk to industry.
The Canadian Food Inspection Agency (CFIA) confirmed the presence of the pathogen Verticillium longisporum for the first time in November 2014 in one field in Manitoba. Samples from the field had been originally submitted to the Manitoba Agriculture Food and Rural Development (MAFRD) Crop Diagnostic Centre after patches of wilted canola were observed, and then sent to CFIA for confirmation. A CFIA pest risk assessment has indicated Verticillium longisporum poses a high risk to canola production.
In 2013, the canola industry contributed $19.3 billion to the Canadian economy.
“The initial findings are in one field in Canada, so there is no need for growers to be too concerned yet until we have more
information,” Clint Jurke, agronomy director with the Canola Council of Canada (CCC), says. “However, it is important to keep updated on the situation and to learn as much about this disease as you can.”
Verticillium wilt is a disease of concern in canola in Sweden and other northern European countries, and in Russia and Japan. In countries like Sweden, verticillium wilt can cause significant disease loss in canola crops. It has also been found in vegetable growing areas in the U.S. States of California and Illinois. What the potential impact for Canada will be is unknown.
“This pathogen, Verticillium longisporum, is a fungus that is particularly virulent on Brassica napus canola and it does infect a few other Brassica crops like mustard, rutabaga, cabbage, cauliflower and broccoli,” Jurke explains. “This [is] not the same pathogen
ABOVE: V. longisporum causes early death and reduced yield in crops.
that causes Fusarium wilt in canola (Fusarium oxysporum), nor is it the same species that causes verticillium wilt (V. dahlia) in sunflower and potatoes, which is common throughout Manitoba.”
The CFIA is taking the lead on addressing the initial findings. Its plant protection program aims to prevent the introduction and spread within Canada of plant pests of quarantine significance, and to detect and control or eradicate these plant pests in Canada. When a new plant pest is detected that may be regulated as a quarantine pest, the CFIA conducts surveillance activities to determine the source and distribution of the pest, and implements appropriate restrictions to prevent the pest from spreading, as necessary.
According to the CFIA, their next steps are to conduct additional surveys during the 2015 crop year in order to determine the distribution of the pest, and to confirm whether this is an isolated incident or may be more widespread. Survey activities are currently limited due to winter weather.
The CFIA is developing its 2015 survey plan, which will involve surveying areas adjacent to the infected field as well as other canola production areas of Canada.
Next steps, including the regulatory status of Verticillium longisporum, will be determined based on the results of the surveys. As new information is available, it will be posted on CFIA’s website.
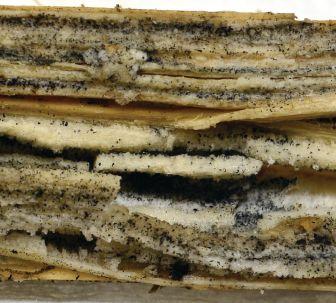
Verticillium longisporum is a plant pathogen that can cause early death and reduced yield in crops. Symptoms include chlorosis of lateral branches or leaves (often one-sided) and early death stunting. At later stages, the outer stem may peel back to reveal black microsclerotia.
The pathogen is primarily spread through the movement of infested soil or diseased plant parts. There is also some evidence that seed from heavily infected crops may introduce the pathogen to new areas.
“This disease is like Fusarium wilt in some ways, but also like clubroot in other ways,” Jurke says. “Like Fusarium wilt, it is a soil-borne disease that infects the roots and goes into the vascular tissue of the roots. As the infection starts spreading from the roots up the stem through the xylem tissue, and if conditions are suitable
for the disease and it infects the plant early enough, it will start plugging up the vascular tissues. Once the tissue is plugged, parts of the plant die, which is precisely what Fusarium wilt does.”
However, the difference with verticillium wilt is once the infection has plugged up the tissue, often on only one side of the plant, and the plant starts to die, it induces the fungus to produce a resting body called microsclerotia. Jurke says microsclerotia are similar to sclerotia in sclerotinia stem rot, but are extremely tiny, smaller

You’ll like that new tractor even more
Get pre-approved with FCC Equipment Financing and you’ll be ready when you see the right deal. Finance new or used equipment through more than 800 dealers across the country.
Call us at 1-800-510-6669 and get pre-approved today. fcc.ca/Equipment
than dust particles. Thousands of microsclerotia can be produced which can survive in the soil for several years. Although the black microsclerotia or verticillium’s spots may look similar to blackleg symptoms, in verticillium wilt the microsclerotia appear underneath the dried outer skin (epidermis) of the plant rather than on top of it such as with blackleg.
“V. longisporum spores may survive in the soil for 10 to 15 years, which is how it is similar to clubroot,” Jurke adds. “Both clubroot (caused by Plasmodiophora brassicae) and V. longisporum have longlived, hardy survival structures that travel with the soil and increase the risk of spreading the disease into other locations. A lot of the management techniques for controlling verticillium wilt will be similar to what we recommend for clubroot, including sanitization, minimizing the amount of equipment, soil and plant residues moving over the fields, longer rotations and developing an on-farm
biosecurity plan. In Sweden and other parts of Europe, growers are recommended to use a four-year canola rotation to help reduce the amount of disease. However, we don’t know for sure yet what will work in Canada.”
The best time to scout for verticillium wilt in canola is at swathing, but it is even possible to identify this disease after harvest, as microsclerotia will continue to develop. Infected plants will become more obvious after harvest as they will turn grey-black as they senesce. Fungicides are not effective against this disease and host resistance in canola is not available at this time.
Jurke says although there haven’t been any resistance genes identified for controlling verticillium wilt in canola, hopefully something will be found. For example, 10 years ago Fusarium wilt was a serious problem in canola in Canada, but one resistance gene was identified that gives good resistance. Today all new canola varieties have Fusarium wilt resistance.
“For now, industry and growers will have to wait to learn more
from the CFIA survey results and next steps, and watch for further information and updates,” he says. “The Canola Council of Canada will be updating the Canola Encyclopedia and posting information on the disease lifecycle and identification to its website. The CFIA, Canola Council of Canada and MAFRD will continue to update and post information and management practices for growers over the next several months. Although we are hopeful this is an isolated case, it is important for everyone to learn more about the disease and how to reduce the risks.”
Producers should report any signs and symptoms of V. longisporum to their local CFIA office or to the MAFRD Crop Knowledge Centre at 204-745-5660. More information about the signs and symptoms of V. longisporum is available on CFIA, CCC and MAFRD websites.


The complete solution. Grass and broadleaf weed control for wheat and barley, no tank mixing required. For more information, please visit: BayerCropScience.ca/Tundra
Base it on nitrogen or phosphorus?
by Ross H. McKenzie, PhD, P. Ag.
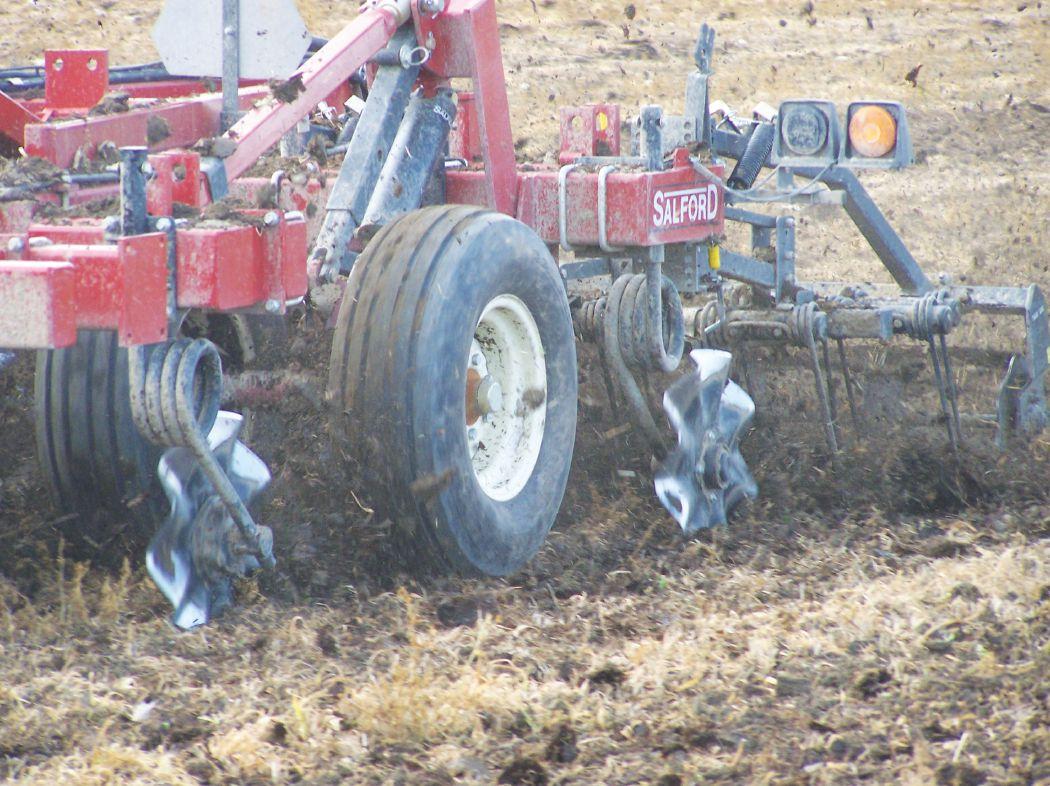
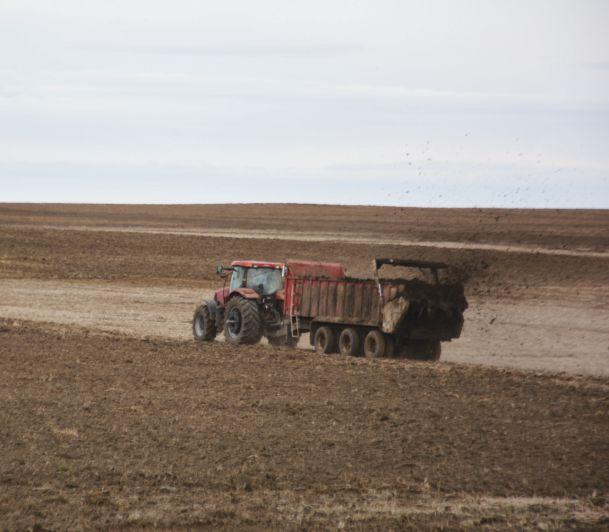
Society is becoming increasingly concerned about surface and groundwater quality degradation from agricultural operations. We are becoming more aware that environmental problems can occur with over-application of manure applied to land repeatedly over a period of years. Overloading soil with nutrients, poor manure handling or poor timing of manure applications can lead to contamination of surface or groundwater.
However, if good manure management practices are followed, animal waste can be utilized as a valuable nutrient resource rather than treated as a waste that becomes an environmental concern.
It is important to realize it is not possible to apply manure to match crop requirements for all nutrients. When manure is applied based on one nutrient, other nutrients will be either overor under-applied. For example, if feedlot manure is applied to meet the nitrogen (N) requirements of a wheat crop, phosphorus (P) will be applied at approximately three to six times the rate of crop requirements, depending on the P level in manure. Repeated
applications over a period of years will result in build-up of high levels of P in soil. To complicate the situation, nutrients such as N and P are contained in a number of different organic forms in manure. The unavailable nutrient compounds break down and release at different rates over a period of years.
Many producers who have applied manure to their land based on N content have noticed a gradual build-up of soil P. Many fields exceed 400 lb/ac of available P in the top six inches of soil, while some fields are in the range of 800 lb/ac of available P. This is equivalent to 1770 lb/ac of P2O5 and 3540 lb/ac of 12-51-0 phosphate fertilizer, respectively. To further complicate things, the soil test doesn’t measure the unavailable inorganic or organic forms of P in the soil. Soil tests just show the plant available fraction of inorganic P in the soil.
ABOVE: Incorporating manure management plans into fertilizer planning will help ensure sustainable nutrient management.
When soil test P is very high, it can result in reduced crop yields due to nutrient imbalances and it can interfere with plant uptake of other nutrients. Further, high soil P can result in greater potential for runoff into surface water. The USDA says one pound of P in surface water can result in about 500 lb of cyanobacteria (bluegreen algae) production in water.
Producers with high soil P should take serious steps to draw down soil P levels. They should try to avoid manure application on fields testing over 200 lb P/ac and not apply manure on fields testing over 400 lb P/ac. Efforts should be made to grow crops with high P requirements to draw down soil P levels. For example,
If good manure management practices are followed, animal waste can be utilized as a valuable nutrient resource.
growing crops such as alfalfa or cereal silage to draw down P soil levels would be a good management practice.
To prevent problems from developing, intensive livestock operators should adopt best management practices (BMP). When developing a long-term manure management plan, producers have to decide whether to apply manure based on N or P. In the long-term, it is advisable to use P as the nutrient to match with crop removal, rather than N.
It is important to remember BMP will vary from farm to farm, depending on the climatic zone of the farm, the type of animals in confinement, number of animals in confinement, total amount of manure produced, and how the manure is handled, stored and applied. It will also depend on the amount of land available to apply manure, soil types on the farm, types of crops grown and the yield potential of each crop. BMPs should be tailored to match the needs of each farm, and following a step-by-step approach is essential.
Determine where and how much manure can be applied
The factors of where to apply the manure and what rates to apply require the greatest attention. These two factors go hand-in-hand and involve identifying the fields where manure should not be applied, determining the acreage of each field and soil testing each field.
Soil sample each field to a depth of at least two feet and take depth samples at 0-6, 6-12 and 12-24 inches. Have samples analyzed
This is a simple case study outlining how development of BMP might work:
• Small feedlot in southern Alberta with 1600 acres (10 quarter sections) of irrigated land.
• Feedlot produces 10,800 tons of manure annually.
• All fields are soil tested and found to have between 50 and 80 lb of N/ac in the top 24 inches of soil.
• Two fields have soil P levels above 400 lb P/ac, three fields between 200 and 400 lb P/ac, five fields level 400 lb P/ac. Therefore, the two fields high in P should not receive manure.
• Manure was analyzed and found to have about 5 lb of N/ton and 15 lb of P2O5/ton that will be available to a crop in the year of application..
• If plant available N content of manure = 5 lb N/ton x 10,800 tons of manure, then 54,000 lb of plant available N is produced annually in the manure.
• If plant available P2O5 content of manure = 15 lb/ton x 10,800 tons of manure, then 162,000 lb of P2O5 is produced annually in the manure.
Manure management based on N:
If crop removal averages between 150 and 180 lb N/ac with various irrigated crops grown, and 50 to 80 lb of N comes from the soil, the remaining 100 lb N/ac would come from the manure. Thus, 54,000 lb of N from manure ÷ 100 lb of N/ ac = 540 acres of land needed annually for matching manure
application with crop removal.
Manure management based on P:
Assuming average irrigated crop removal is about 60 lb P2O5/ ac, then 162,000 lb of P2O5 in manure ÷ 60 lb of P2O5/ac = 2700 acres of land needed for matching manure application with crop removal.
In this very simplified example, a 540 acre land base would be needed for matching N in manure with crop removal, but would result in serious over-application of P to land in the long term. However, a 2700 acre land base would be needed for matching P2O5 in manure with crop removal. Keep in mind the farm has several fields with high soil P that should not be manured.
In this simple example, the farm has a land base of 1600 acres, minus 320 acres that should not be manured, leaving 1280 acres available for long-term sustainable manure management. The farm would require about 1420 additional acres for managing manure based on P.
In situations where intensive livestock producers do not have a large enough land base to balance manure application with crop removal of P, there is an opportunity to work with a neighbour. Indeed, the potential to purchase manure by paying for delivery and spreading has a double benefit. The confinement operator can dispose of extra manure, and the nearby neighbour has the advantage of an excellent source of fertilizer. In addition, manure applied to eroded fields will benefit from improved soil physical quality and productivity.
at each depth for nitrate-nitrogen, phosphorus, potassium, sulphate-sulphur, pH and electrical conductivity (EC – a measure of salt in the soil). Take at least 20 random sampling sites across each field to make up a composite soil sample for each depth. Ideally, each field should be analyzed each year, either in late fall or early spring, to track soil nutrient changes and for manure and fertilizer planning.
This information is needed to identify which nutrients are excessive, high, adequate or deficient in each field. This allows you to determine how much of each nutrient must be added to the soil to ensure adequate nutrient levels for crop growth, and which nutrients are high or excessive in a field.
Representative manure samples should be taken and analyzed for total and available nutrients, specifically N, P, potassium (K) and sulphur (S). “Available” nutrient refers to an element that is in plant available form or one that can be rapidly released for uptake by growing plants in the year of application. “Total” nutrient refers to an element in both plant available and unavailable forms. When determining manure application rates, available nutrients and a portion of the unavailable nutrients that can be released from manure in the year of application must be matched to crop nutrient requirements in each field. Book values of typical nutrient levels in manure can be obtained from provincial agriculture departments.
Some operations may find they don’t have a sufficient land base for matching the total P in manure with crop removal. This may mean expansion of their land base or working with adjacent farms to apply manure. In addition, commercial N fertilizer may have to be added to make up the difference between what the crop requires and what is contained in the manure.
All information gathered can be put together to develop a manure management plan. Each provincial agriculture department has work sheets and computer based programs to help work though this exercise and specialists are available to assist with the planning process. Although it seems like a daunting exercise, it is essential in planning your manure management program and to optimize crop production.
For more on fertility management, visit www.topcropmanager.com.


When tough broadleaf weeds invade your cereal crops, it’s no time for half-measures. You need action now. With a new and more concentrated formulation, DuPont™ Barricade® II herbicide leverages the strength of three active ingredients from 2 diferent groups (Group 2 and Group 4) to keep broadleaf weeds far away from your crop. Powered by Solumax® soluble granules, Barricade® II also delivers one-hour rainfastness and easier, more consistent sprayer cleanout. It’s no wonder


powered by Solumax® soluble granules, combining


Questions? Ask your retailer, call 1-800-667-3925 or
narrow-leaved hawk’s beard, kochia, cleavers, fixweed, lamb’s-quarters, cow cockle, volunteer canola


multiple modes of action from two groups – Group 2 and Group 4.

An ef ective, time-saving formulation. Barricade® II is powered by DuPont™ Solumax® soluble granules, combining the c


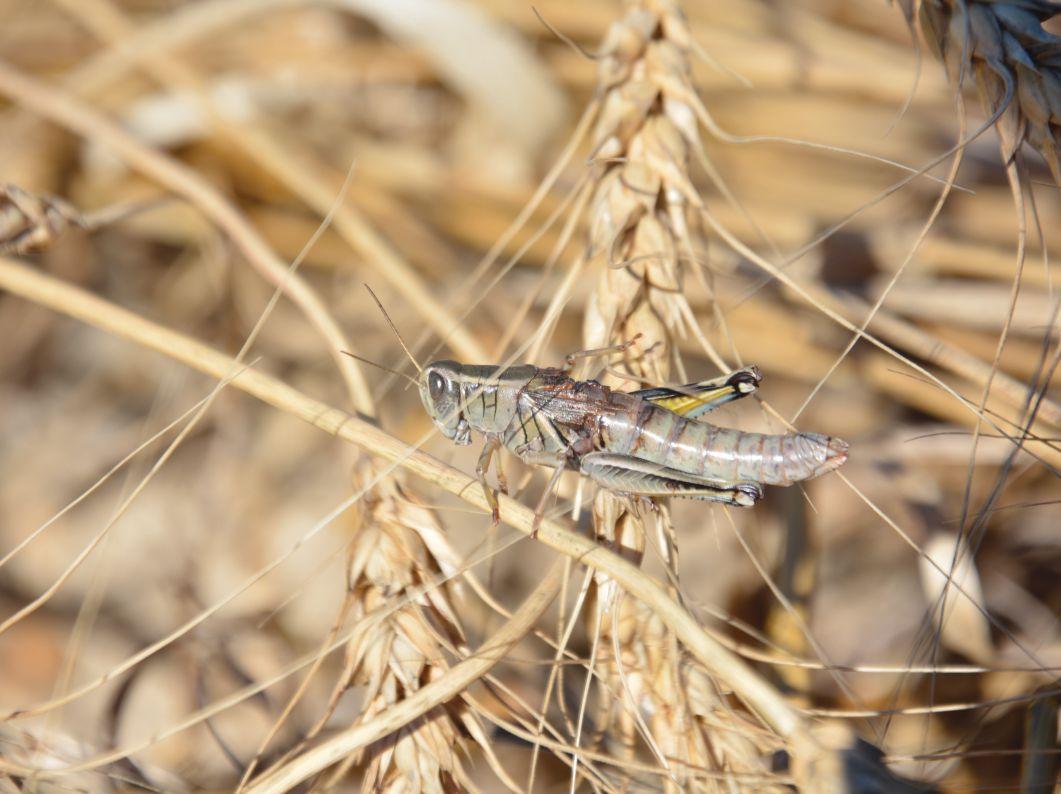
For most farmers, 2014 was a good year. What’s in store for 2015?
by Bruce Barker
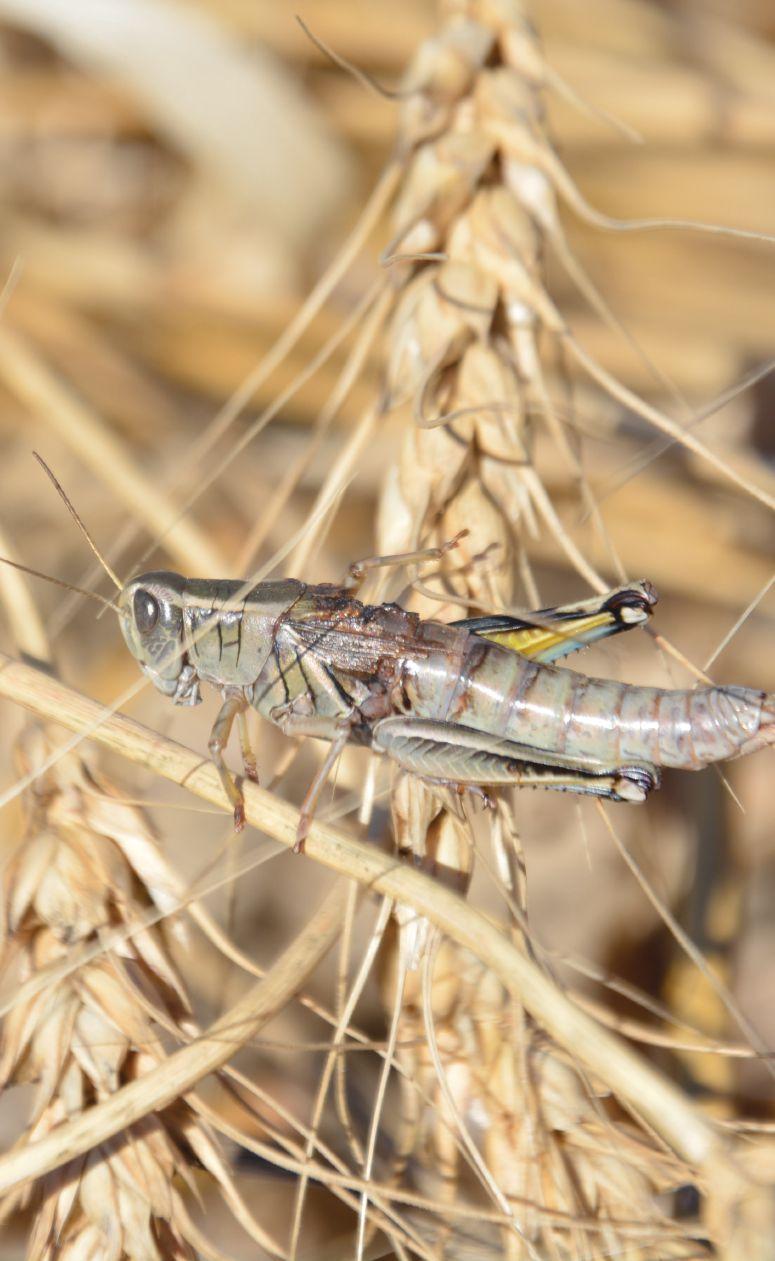
Weather gave farmers a helping hand in 2014, with few serious outbreaks from insects like diamondback moth, wheat midge and grasshopper.
Cutworm
After a three-year decline in numbers, there was an apparent resurgence in cutworm populations across Saskatchewan, according to Scott Hartley, provincial insect specialist with the Saskatchewan Ministry of Agriculture. He says controls were required, with instances of more than 30 acres impacted on some fields.
John Gavloski, entomologist with Manitoba Agriculture, Food and Rural Development, reports high populations of cutworms were reported in central Manitoba on cereal crops. Cutworm damage was also reported on corn in the eastern and central regions of the province and some spraying was done. Cutworms were also sprayed on some canola, sunflower and dry bean fields.
Cutworm problems were not reported in Alberta. Methods for predicting cutworm infestations do not exist, so forecasts for 2015 are not reliable. Cutworms tend to be more problematic in warm, dry springs, but not necessarily for all species of cutworms.
The risk of economically significant grasshopper populations in 2015 has increased in parts of southern Alberta and decreased in central Alberta and the Peace region. The grasshopper risk has been increasing in southern Alberta for the last few years and the provincial survey shows there are now some high-risk areas for 2015. The most notable increase in grasshopper populations in southern Alberta are in Forty Mile and Willow Creek counties.
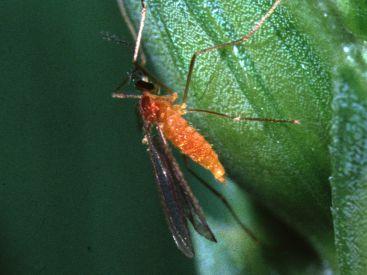
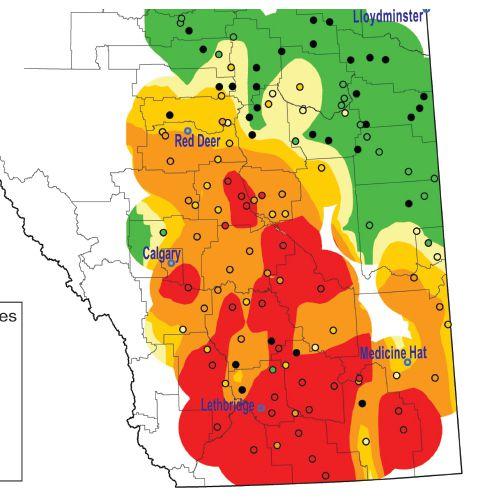
TOP: The grasshopper risk has been increasing in southern Alberta for the last few years.
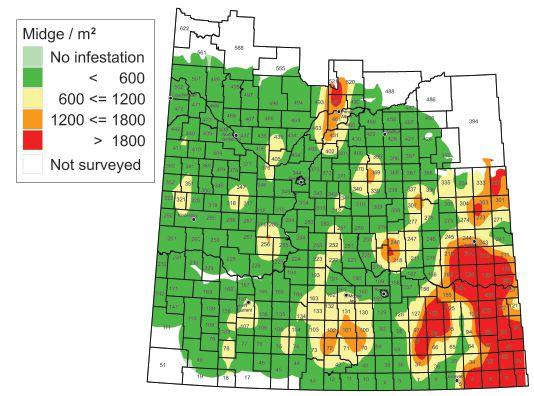
INSET: Wheat midge surveys show some potential hot spots on the Prairies.
“In southern Alberta, if perfect conditions for grasshoppers occur in 2015, you may have to spray,” Scott Meers, insect management specialist with Alberta Agriculture and Rural Development, says.
Economic infestations of grasshopper were reported in Saskatchewan in only a few areas in the southwest, around Leader, Richmound and Fox Valley, with only one report from the south central Region. The Saskatchewan 2015 grasshopper forecast shows pockets of very light risk, mainly in southern Saskatchewan.
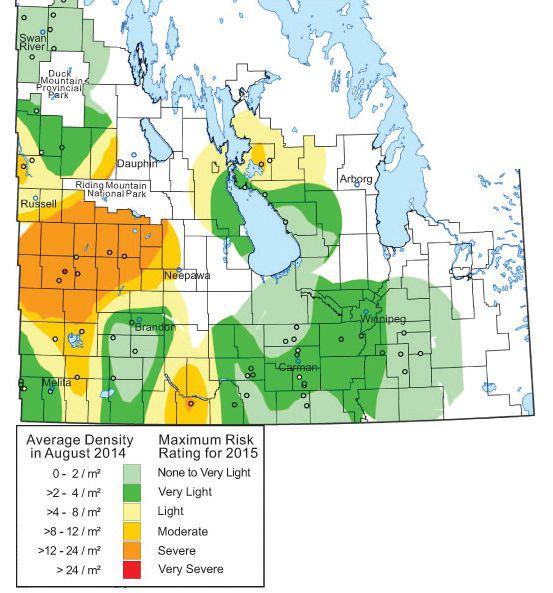
In Manitoba, Gavloski says grasshopper populations have been increasing over the last three years, and in 2014 there was a further trend to more areas in the higher risk categories. The risk of economical populations of grasshoppers developing in 2015 is quite variable, depending on location, with some areas in western Manitoba having moderate to severe risk (see map above).
Flea beetles
Despite common use of seed treatments to control flea beetles, Gavloski says feeding damage to canola at or above threshold levels, and additional use of foliar insecticides, was still reported from all agricultural regions of Manitoba. There were reports of some fields being sprayed two to three times, and some canola fields in eastern Manitoba were reseeded. He says several fields in central Manitoba were reseeded due to heavy damage from flea beetles or a combination of flea beetle and cutworm damage.
The 2014 cabbage seedpod weevil survey covered all the canola growing areas of Alberta with 290 fields sampled in 49 municipalities (see map above, at right). The cabbage seedpod weevil is still only found at economic levels in southern Alberta. The Municipal District of Pincher Creek was added to the survey in 2014
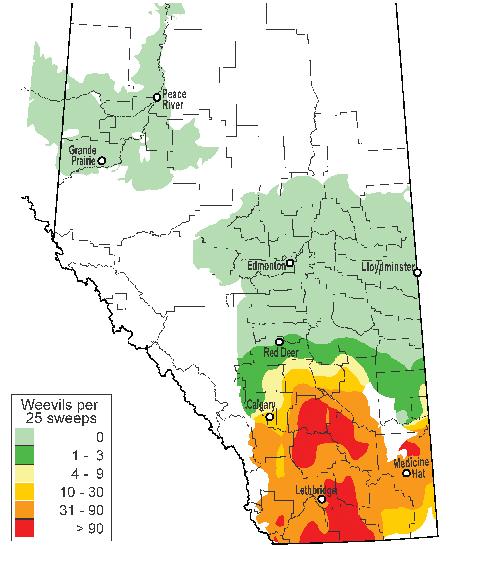
and economic levels of cabbage seedpod weevil were found there. Generally, weevil numbers were lower than in previous years in southern Alberta and there was less spraying than in a typical year. Unfortunately this does not necessarily mean cabbage seedpod weevil numbers will stay low in future years. It will be important to scout fields as they come into flower in 2015.
The range of economic levels did not expand in 2014 but the northern range of the weevil did appear to push further north to the southern boundaries of Red Deer, Stettler, Paintearth and Provost counties, notes Meers. “We’ve seen this push up there before and then the populations backed off. We will need to continue to monitor up in that region.”
Canola producers in southern Alberta and in the southern portion of central Alberta should scout for the insect as the crop comes into flower. The earliest flowering canola crops tend to have the highest risk from cabbage seedpod weevil and should be monitored very closely.
In Saskatchewan, Hartley says the cabbage seedpod weevil was at economic levels from the Alberta border to areas near Indian Head in southern Saskatchewan. Significant numbers were noted in the 2014 survey as far north as Kindersley in the west central region across to Outlook, but not necessarily corresponding with reports of spraying. “There is concern as the weevil is now into new areas where there is more extensive canola acreage,” Hartley says.
Diamondback moth blows in every year from the U.S. and is monitored with sentinel sites. In Saskatchewan, some higher counts were found in traps in June (Riverhurst and Yorkton), but that did not translate into economic infestations and spraying.
In Alberta, spraying occurred in Forty Mile County with high numbers at early flower in canola and with many acres above threshold.
Levels of diamondback moth were generally not economical in Manitoba, although a few fields in eastern Manitoba were sprayed.
The bertha armyworm population in Alberta appears to have shifted west and south in 2014. This is likely due to diseases and parasitism in the previous outbreak areas in east central Alberta. There was much less spraying for bertha armyworm in Alberta in 2014 than in the previous two years. There was some need for treatment in Stettler and Leduc counties, and an outbreak centered around Foremost in southern Alberta resulted in between 20,000 and 30,000 acres sprayed.
The trend in Alberta appears to be higher populations in west central and southern Alberta, but 2015 populations will depend on overwinter survival and spring environmental conditions. With the amount of armyworm disease present, Meers says if weather conditions are favourable there may be a complete
collapse of the population in central Alberta in 2015.
Hartley says bertha armyworm continued to decline in Saskatchewan in 2014, and it is thought to be of a lesser risk for 2015. A few areas in southern Saskatchewan reported spraying in 2014.
In Manitoba, levels were generally low.
Swede midge was first identified in 2007 in northeast and east central Saskatchewan. The first significant infestations were noted in 2012 and 2013 around Nipawin and Carrot River, and west towards Humboldt. In 2014 an Agriculture and Agri-Food Canada survey indicated wider distribution of swede midge than previously known, including a new site near North Battleford.
In Manitoba, an individual swede midge was found in pheromone-baited traps in two instances at Sanford, and one instance at Winkler and Dauphin. Larvae were also found in a canola field

northeast of Bowsman.
No swede midge has been reported in Alberta.
Swede midge remains on the watch list for entomologists on the Prairies. High or potentially economic levels have not been documented.
The Alberta wheat midge forecast for 2015 shows a collapse of the extreme populations in the eastern Peace Region, but wheat midge has not followed forecasts very well in that area, so caution needs to be observed. Central Alberta has shown a general increase in wheat midge risk with several areas of particular concern east of Edmonton.
The population has fallen to very low numbers in much of southern Alberta with the exception of some irrigated fields in the County of Forty Mile.
Varro® herbicide for wheat. Freedom from Group 1 herbicide resistance. Freedom to select your preferred broadleaf partner. Freedom to re-crop back to sensitive crops like lentils.
To learn more about Varro, visit: BayerCropScience.ca/Varro
“Irrigated wheat in southern Alberta provides perfect conditions for wheat midge and we’ve seen some substantial yield loss,” Meers says. “Use good rotations and proper agronomy to help control midge there.”
Wheat midge populations were low in Saskatchewan in 2014. The 2015 wheat midge forecast for Saskatchewan shows the eastern part of the province has the highest risk (see map on page 19).
In Manitoba, Gavloski reports wheat midge was not a major concern in 2014, and wheat was already flowering in many areas by the time the pest emerged.
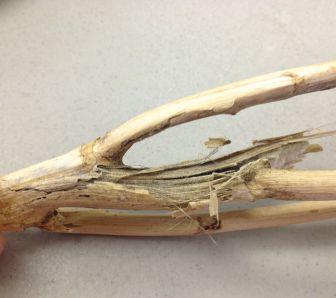
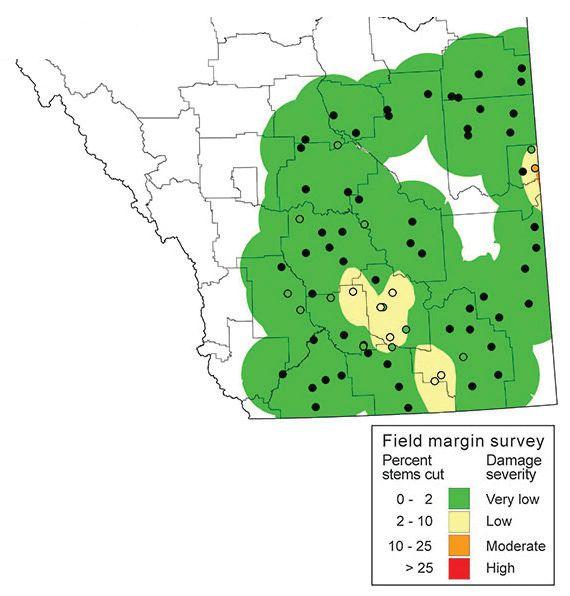
Wheat stem sawfly
The area at risk of economically significant wheat stem sawfly populations in 2015 will be limited to only a few areas in Alberta. The 2014 field margin survey shows low populations in most of the area surveyed, including the traditional sawfly areas in the Special Areas and the County of Forty Mile (see map above).
“Unless you’re in the County of 40 Mile, you probably won’t have a problem,” Meers notes.
Cereal leaf beetle
Meers says while cereal leaf beetle has been showing up in southern Alberta, he isn’t very concerned about it at this point. Threshold appears to be one beetle per flag leaf. “It hasn’t been causing economic damage. Natural enemies appear to be doing their job on cereal leaf beetle.”
In Manitoba, the range of cereal leaf beetle has expanded south and further east through the central region, although no populations have come close to economic thresholds. In 2014, cereal leaf beetle larvae were found in fields near Pilot Mound, LaRiviere and Roseisle. Two shipments of the parasitoid Tetrastichus julis were released in July and September in the hopes of establishing the parasitic wasp to help keep the cereal leaf beetle below economic levels.
European corn borer
Gavloski says higher populations of European corn borer were
found in the central region of Manitoba with some insecticidal applications occurring.
Field pea
Pea leaf weevil
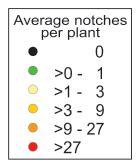
Damage from pea leaf weevil in Alberta in 2014 was much higher than in 2013, especially in southern Alberta (see map above). For producers south of Highway 1 and including the counties of Kneehill, Wheatland, Newell and Cypress, there is risk of damaging levels of pea leaf weevil in 2015. The areas in northern Wheatland County and Kneehill County have not previously seen such high populations of pea leaf weevil.
“We have never had more than 81 notches per plant, so damage was much higher in 2014,” Meers says. “There was an expansion in intensity north of Red Deer and I think this is connected to fababean. Pea leaf weevil really likes fababean.”
Meers notes the true economic damage of this insect on both peas and fababean on the higher organic matter soils of central Alberta is not well understood.
Some very low levels of feeding damage were once again found throughout central Alberta. This damage is so low that there is no risk of serious issues with pea leaf weevil throughout central Alberta in 2015. This is the same as in previous years and, despite range expansion, the damage rating numbers are still exceedingly low. It will be important to watch the development of these populations over the next few years.
The pea leaf weevil survey in Saskatchewan in 2014 suggested lower levels of the insect compared to 2013. Damage is still noted primarily in the southwest part of Saskatchewan, although some feeding was noted on pea in a few fields near Kyle, north of the South Saskatchewan River in 2013.
Pea leaf weevil does not occur in Manitoba.

On the horizon for 2015 and beyond, Meers says two crops will need to be watched carefully – hemp and fababean. “Bertha armyworm and lygus bug will become problems in hemp. Insects really like it,” Meers says.


Float through seeding with HF With unusually wet conditions becoming the norm in many areas, decreased available seeding time has become a reality. The Bourgault Hi-Flotation (HF) running gear available on the larger 3720 Independent Coulter Drills and 3320 ParalinkTM Hoe Drills, allows you to float through wet conditions that would have kept you down in the past.

WIDE FRONT TIRES FLOAT YOU THROUGH WET SPOTS
LARGE DIAMETER WHEELS PREVENT THE DRILL FROM “DIVING” INTO SOFT SOILS
EFFECTIVELY MANAGE TURNS WITH HF’S WAGON-STYLE STEERING
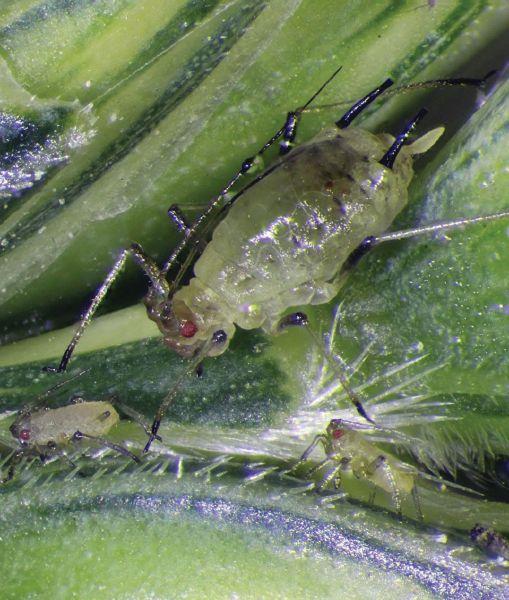
Dynamic Action Threshold a new and improved way to make pest management decisions.
by Madeleine Baerg
To spray or not to spray when you scout insect pests in the field, that is always a tough question. While an economic threshold calculation can help a producer make an informed decision, the simple “X insects = spray” model only captures a small part of what’s actually happening in the field.
Now, Tyler Wist and Chrystel Olivier are aiming to develop a more integrated, fuller-picture threshold calculation to help producers make better pest management decisions.
“We’re building a Dynamic Action Threshold (DAT) based on aphids and their predators in cereal crops,” Wist says. Wist is project lead and a National Science and Engineering Research Council Visiting Fellow at Agriculture and Agri-Food Canada’s (AAFC) Saskatoon Research Centre. “If you don’t factor in a pest’s natural enemies, your population predictions for the pest could be far too high. By developing a DAT equation that accounts for aphids as well as the predators and parasitoids that keep aphid populations in check, we’re hoping to help producers only spray when they really need to, thereby saving spray inputs and time, and preserving the ‘good’ insects like ladybugs.”
Current economic threshold calculations base their pesticide recommendations on an estimate of the total number of any particular pest in a field. The problem is the calculation assumes every pest counted will survive to inflict crop damage and/or to reproduce. While the calculation might make sense in a closed scientific lab, it works much less effectively in a field setting where nature constantly seeks balance between pests and hosts, predators and prey. To make an economic threshold calculation field-relevant, it needs to calculate the total number of pests minus the number of those pests that will be destroyed by predators/parasitoids prior to the pests inflicting crop damage and/or reproducing. But how? Whereas a straight estimate of the number of pests in a given area is relatively simple, quantifying multiple and complex predator/prey relationships requires sophisticated mathematics, some educated guesswork and a willingness to add layer upon layer of complexity.
For the past two years, Wist and Olivier – entomologist with AAFC in Saskatoon – have worked to develop and validate a DAT calculation that can translate into a simple, user-friendly tool for producers. Working in fields in multiple locations across Saskatchewan and Manitoba, the researchers started by scouting for any and all insects. After identifying aphid species and their natural enemies, they tracked the populations over time, using linear models to show how the enemies were helping to balance aphid populations. After collecting sufficient data, Wist began inputting the data and a series of calculations into a mathematical model to
estimate the populations’ effects on one another.
“The model works on a field-by-field basis. I input the actual numbers of aphids and their natural enemies at time t0 [the initial sample date]. Then, the model takes the natural enemies and their voracities [the number of aphids they eat per day] and turns them into one input, what we call a ‘Natural Enemy Unit,’ which is a consistent way of describing the pressure the natural enemies put on the aphid population,” Wist explains.
For example, a seven-spotted ladybug eats 100 aphids per day, whereas another predator might consume only 20. By turning the predators into consistent units (a ladybug is no longer a ladybug, it is simply calculated as -100), they fit the confines of the mathematical model.
If aphid populations spread themselves relatively evenly across a given area, the aphid versus predator ratio calculation would be enough to calculate the DAT. However, aphids randomly disperse, colonizing plants inconsistently. Depending on planting density, the
sweep net sampling method the researchers used covers approximately 2400 tillers, collecting most of the aphids congregating in the heads and providing an estimate of the total number of aphids in this area of the field. A ladybug, however, would not possibly be able to visit all 2400 of these tillers in search of its optimal number of aphid meals per day. Therefore, during the early stages of an aphid infestation while aphid colonies are spread out and aphids are harder for predators to find, the DAT equation overestimates the number of aphids that actually get eaten by any given predator. For this reason, Wist plans to further refine the equation by adding a factor that describes the searching time of a predator, decreasing the number of aphids eaten when an aphid infestation is low and colonies are spread out.
Wist knows he still has much work ahead, since modelling the initial pest:enemy ratio is only step one of a complex calculation.
For example, there are two families of wasps that parasitize aphids. Within seven days of an adult wasp stinging an aphid and laying its egg inside the aphid’s body, the aphid dies, then hardens and turns into a swollen mummy. Inside the mummy, the wasp larva grows
until, around seven days later, it chews its way out of its aphid host.
“Aphid parasitism is wonderful when you see it in action,” Wist says. “That said, we don’t know a lot about the parasitoids’ natural history in Canada or what they do when they emerge from their aphid hosts. The challenge for our mathematical model is their biologies have to be accounted for. For example, will they parasitize another aphid in the same season? Several species of parasitoid wasp (including one that unfortunately kills ladybugs) can re-parasitize within one hour of emergence, but others won’t parasitize until the next year. So, for the purposes of our mathematical model, it’s hard to know exactly how much ‘killing ability’ to give to these parasitoids.”
But wait – it gets more challenging still to mathematically model. About 50 per cent of aphid parasitizing wasp larvae found in Wist’s and Olivier’s survey were killed before they emerged by secondary (or “hyper-”) parasitoids.
CONTINUED ON PAGE 25


Solid stem varieties are effective, but not the only solution.
by Brian Beres*, research scientist, AAFC
The wheat stem sawfly (WSS) Cephus cinctus Norton (Hymenoptera: Cephidae) is an economically destructive insect pest of wheat in the northern Great Plains. A significant resurgence in the southern Prairies of Canada caused substantial economic losses from 1999 through 2007. It continues to be a major economic pest in states adjoining the Canadian Prairies, and has become problematic in other wheat growing states, such as Colorado and Nebraska.
Solid stem wheat cultivar selection is critical to the integrated management of WSS, but adoption of these cultivars has so far been low, which compounds losses at harvest.
A study was conducted from 2001-2005 in southern Alberta and Saskatchewan to establish the range of susceptibility of hollow stem wheat varieties representing the major spring wheat classes, to characterize resistance levels in solid stem germplasm derived from traditional and novel genetic backgrounds, and to determine the impact of host plant on WSS population dynamics.
The solid stem varieties of wheat were generally superior at reducing damage and fitness response of WSS. However some varieties, such as McKenzie and the Canada Western Amber Durum cultivars AC Navigator and AC Avonlea, provided improved efficacy over the other hollow stem cultivars. The novel germplasm Golden Ball and the derivative G9608B1-L-12J11BF02 were the most consistent at reducing damage, fitness and fecundity of WSS across an array of environments.
The challenge will be to maintain this level of efficacy as the Canada Western Red Spring phenotype is reintroduced into the germplasm. Variability in fitness response suggests that stem type alone was only a partial solution to reduce female fecundity, and illustrates why multiple integrated strategies over the long term are needed to reduce populations to manageable levels.
In summary, solid stem cultivars are highly effective but prone to inconsistent performance, and should therefore be integrated into a holistic strategy for WSS that includes agronomics and biocontrol.
References: Beres, B.L., H.A. Cárcamo, J.R. Byers, F.R. Clarke, C.J. Pozniak, S.K. Basu, et al. 2013. Host plant interactions between wheat germplasm source and wheat stem sawfly Cephus cinctus Norton (Hymenoptera: Cephidae) I. Commercial cultivars. Canadian Journal of
Plant Science 93:607-617.
Beres, B.L., H.A. Cárcamo, J.R. Byers, F.R. Clarke, C.J. Pozniak, S.K. Basu, et al. 2013. Host plant interactions between wheat germplasm source and wheat stem sawfly Cephus cinctus Norton (Hymenoptera: Cephidae II. Other germplasm. Canadian Journal of Plant Science 93: 1169-1177 doi:10.4141/CJPS2013-035.
*Editor’s note: This article is based on the Canadian Journal of Plant Science Best Agronomy Article for 2014. The Journal articles are open source to the public and the complete articles can be downloaded at pubs.aic.ca/journal/cjps.
“It gets really complicated,” Wist notes. “You can just keep adding layers and layers to the calculation, though hopefully each layer brings you closer to a relevant threshold calculation.”
For this reason, Wist and Olivier have applied for further research funding in order to more completely develop their model. Further, they plan to take their research and translate it into a user-friendly tool for producers.
“Our goal is to make this applicable to producers. Right now it’s an excel spreadsheet with a whole series of equations, but how do we make it relevant?” Wist says, adding the short answer to that question may reside in your pocket.
“What we’re trying to do is make a smartphone application that incorporates these calculations. Basically, we want to provide a simple tool to help producers identify pests and predators in their field using a user-friendly ID and sampling system. We’d like to make it as
easy as producers punching in the counts they find for each insect, and then the app instantly calculates the dynamic action threshold,” Wist says. “After all, there’s no point in doing this work if producers aren’t going to benefit from it.”
Whether this model will be translatable to other insect pests is uncertain at this point, though the theory behind the model certainly applies to any pest. Despite the fact aphids might not always be producers’ most challenging adversary, Wist is confident his research and development work will pay dividends for producers.
“Aphids are a weird bunch because they are very hard to predict. In most cases, they blow up from the U.S. on the wind. Though they are not a big issue in cereals every year, if they come in at the right time (or rather, the wrong time for the crops) they can quickly surpass the economic thresholds. That’s why projects like this are important even if aphids don’t cost growers significantly every year.”


At the heart of plant health is a quality seed treatment. Trilex® EverGol™ seed treatment for pulses provides exceptional disease control and superior crop establishment.

Not only does Trilex EverGol provide exceptional protection from diseases like rhizoctonia and ascochyta, it also promotes overall plant health. The result is a higher performing root system, increased biomass and faster emergence, regardless of disease pressure.


To learn more about Trilex EverGol, visit: BayerCropScience.ca/Trilex

If you’re looking to bring new employees into your business, you’ve seen first-hand how difficult it can be to attract the right people.
There are plenty of reasons why: An aging labour force means fewer workers. Competition for those workers from other sectors is steep. And the nature and location of the work may not be what people originally have in mind. But as the Executive Director of the Canadian Agricultural Human Resource Council (CAHRC) says, there are things we can do as an industry and inside our businesses to tip the scales in our favour. And it all starts with letting people know what’s out there.
“Although opportunities abound, agriculture is not
top of mind for youth and their influencers exploring career options. It is misrepresented and misunderstood as unsophisticated, lacking in innovation, repetitive and non-entrepreneurial,” says Portia MacDonaldDewhirst. “As an industry, we need to increase awareness of all the opportunities in agriculture and let people know what a personally satisfying, exciting and rewarding career it is.”
MacDonald-Dewhirst also notes that businesses can do a lot in their own backyard to attract and retain the right people. That starts with
understanding what they’re looking for, where to find it and how to create an environment where new employees can succeed.
“Employers need to understand the value and return on investment that can be realized by focusing on HR management,” she says. “If you provide training and other support, are flexible and open to new ideas, and actively manage performance, you’ll be rewarded with loyal, productive employees.”
The real good news is the right people are out there.
“Anyone who seeks active work that requires creative problem solving in an interesting environment should look into agriculture,” says MacDonald-Dewhirst. “It also offers great opportunities for those with entrepreneurial interests .”
No matter what role we play in the industry, big or small, we can all set the foundation by sharing the real story – with young people, at career events or by getting in on the conversations that are already happening about Canadian agriculture and the opportunities it holds.
For information and tools, check out the CAHRC’s website at cahrc-ccrha.ca or visit AgMoreThanEver.ca.


In order for our industry to reach its full potential, we need to capture the imaginations of thousands of skilled, energetic workers. The good news is we can do it. One person at a time. If you know someone who is still weighing their career options or looking for a change, take the opportunity to let them know that Canadian agriculture offers more opportunities and more things to do than they might realize. And encourage them to consider these facts:

From 2013 to 2022 there will be almost 74,000 projected openings in Canadian ag, but only 49,000 projected job seekers1.
Canada’s ag industry has far more jobs than people to fill them. And that spells opportunity for workers across the country. Lots of opportunity. Employers are looking for energetic, enthusiastic people who want to learn and grow with this dynamic industry. It’s there for the taking.
Canadian agriculture has never been more important to Canada or the world, and there are so many ways to be part of it, both on the farm and off. Hundreds of occupations directly contribute to ag – in fields like manufacturing, research, education, finance, trade, retail and more. The opportunities are endless.
You’re in good company. As someone who works in ag, you’re one of 2.1 million people who propel the sector forward every hour of every day. That’s one out of every eight Canadian jobs! It’s time to get the word out, because even though there are a lot of us, there’s definitely room for more.
The career opportunities in Canadian ag are incredibly diverse – and so are the opportunities to train for those careers. That means, if you can imagine a career in ag, you’ll probably find the training you need to land the job close to home.
The impact of agriculture on Canada’s economy, communities and families is truly remarkable. And this is just the beginning. So spread the word. Encourage young people to build a career in ag. There’s never been a better time. Learn more at AgMoreThanEver.ca .

Creating a positive perception of Canadian agriculture is a big job. That’s why Ag More Than Ever is built on partnerships. Our partners come from many different backgrounds to support one great industry. They actively grow awareness of the cause and spread positive messages about Canadian ag to their employees, associates, customers and the public. Interested in becoming a partner? Visit AgMoreThanEver.ca/Partners to find out how.
Are you or someone you know looking for a career in agriculture, but don’t know where to start? The Canadian Agricultural Human Resource Council has some great online resources to help.
This site features a great virtual tool to help you find opportunities in ag that match your interests. It’s a great starting point for your career path.

Once you have an idea of the opportunities you want to pursue, it’s time to find out how to pursue them. Agritalent.ca is a national database of learning opportunities in agriculture. If Agripathways.ca is your starting point, this is your road map.

a
“ We take pride in knowing we would feel safe consuming any of the crops we sell. If we would not use it ourselves it does not go to market.”
– Katelyn Duncan, Saskatchewan
“ The natural environment is critical to farmers – we depend on soil and water for the production of food. But we also live on our farms, so it’s essential that we act as responsible stewards.”
– Doug Chorney, Manitoba
“ The welfare of my animals is one of my highest priorities. If I don’t give my cows a high quality of life they won’t grow up to be great cows.”
– Andrew Campbell, Ontario
Safe food; animal welfare; sustainability; people care deeply about these things when they make food choices. And all of us in the agriculture industry care deeply about them too. But sometimes the general public doesn’t see it that way. Why? Because, for the most part, we’re not telling them our story and, too often, someone outside the industry is.
The journey from farm to table is a conversation we need to make sure we’re a part of. So let’s talk about it, together.
Visit AgMoreThanEver.ca to discover how you can help improve and create realistic pti ofC dia
by Carolyn King
The results from a nine-year study show that using good cultural practices, along with herbicides, helps reduce the risk of developing herbicide-resistant weeds and boosts crop yields.
The study focused on wild oat, one of Western Canada’s worst annual weeds. According to John O’Donovan, a research scientist with Agriculture and Agri-Food Canada (AFFC) and one of researchers involved in the study, wild oat is a major problem on the Prairies, and it has been so for many years.
“Wild oat also has a fairly high propensity to become resistant to herbicides. We started noticing that at the end of the 1980s, when we saw resistance developing in wild oat to a number of herbicide groups: the Group 1 herbicides, Group 2 herbicides and [Group 8] herbicides like Avadex BW and Avenge,” he says. “Since then, some wild oat biotypes on the Prairies have developed multiple herbicide resistance to two, three or even four herbicide modes of action, making the weed even more challenging to control.
O’Donovan worked on the study with AAFC colleagues George Clayton, Neil Harker and Kelly Turkington. The researchers were interested in weed management strategies that included both herbicides and cultural practices for several reasons.
“Way back before we saw herbicide resistance developing, we felt that if good cultural practices were used, then maybe not as much herbicide would need to be applied. So it made sense from an economic and environmental perspective,” O’Donovan explains.
“Then we saw herbicide resistance developing. That really started to emphasize to us that relying totally on herbicide application was not sustainable into the future,” he says.
The researchers initiated the study in 2001, establishing plots at Lacombe, Beaverlodge and Fort Vermilion in Alberta, and at Brandon, Man. In that first year, they broadcast wild oat at 100 seeds per square metre at each site to supplement the natural wild oat populations.
The study evaluated the effects of four treatment factors. Three involved cultural practices: continuous barley versus a barley-canola-barley-field pea rotation; a lower barley seeding rate (200 seeds/m2) versus a higher rate (400 seeds/m2); and a semi-dwarf hulless barley variety versus a tall hulled barley variety.
ABOVE: After the first five years of the study, the plots with the 25 per cent herbicide rate clearly showed that the suboptimal cultural practices (left) provided poorer wild oat control than the optimal cultural practices (right).
Source: Adapted from Tables 4 and 5 in Weed Science, volume 61, pages 328-333, with permission of John O’Donovan.
The fourth factor was the herbicide rate, with a comparison of 25, 50 and 100 per cent of the recommended rate. O’Donovan emphasizes, “We were not comparing herbicide rates to advocate that farmers go below the label rate. [In fact, other research has shown that reduced herbicide rates may result in faster development of some types of herbicide resistance.]
“We used the lower rates because, in our small plot experiments, we tend to get more efficacy from the herbicides than farmers would for large areas, like quarter sections or larger,” he says. “The lower herbicide rates on the plots helped simulate the lower herbicide effectiveness in farm fields that occurs due to weather conditions, problems in herbicide application timing and/or other issues.”
The study’s first five years produced several key results. “We found that each of the four factors was very important in terms of controlling wild oats,” O’Donovan says. “As expected, the higher we went on the herbicide rate, the better wild oat control we got.
“We also found that a stronger competitor [the tall hulled variety], a higher seeding rate and a more diverse rotation were very important for enhancing wild oat control, when combined with a herbicide. And that effect was greater at the lower herbicide rates than at the recommended rates,” he says.
So, given the less effective herbicidal control that occurs in fieldscale applications, these three cultural practices would be very helpful in ensuring good weed control. As well, if a field already has some herbicide-resistant weeds, then these cultural practices could help to compensate for the reduced herbicide effectiveness.
The researchers continued the study for another four years, to 2009, at the Beaverlodge and Fort Vermilion sites. They used the same treatment factors except they changed the semi-dwarf cultivar from a hulless to a hulled cultivar.
In this phase of the study, they examined the long-term impact of the four factors on the number of wild oat seeds in the soil seed bank and on barley yields in the final year of the study.
“The soil seed bank is crucial in terms of herbicide resistance,” O’Donovan explains. “Modelling studies have shown that the more seed entering the soil seed bank, whether it be wild oat or other weed seeds, the greater the likelihood that resistant weeds will be selected for. That makes sense because the more seeds you’ve got in the seed bank, the more likely it is that there’s a seed in there with a mutation that results in herbicide resistance.
“Now if you ask anybody what is the best way to reduce wild oat seed getting in the soil seed bank, they’d say use a good herbicide. And that is true, but it is also a bit of a dilemma. Because it is also true that the more you use a particular herbicide, the greater the likelihood of
selecting for resistant weeds,” he adds.
The higher seeding rate combined with the diverse rotation – the optimal cultural practices in this phase of the study – resulted in much less wild oat seed in the soil seed bank compared to the plots with the lower seeding rate and continuous barley – the suboptimal cultural practices.
In contrast to the study’s first phase, the two barley cultivars used in the second phase were about equally competitive with wild oats, and the semi-dwarf variety had higher yields. So it appears that, in the study’s first phase, the semi-dwarf variety was less competitive because it was hulless, rather than because it was short.
Hulless barley is generally less competitive than hulled barley when seeded at the same rate. In hulless cultivars, the embryo is more exposed during seeding, so it is more easily damaged, resulting in poorer emergence and less competition with weeds. Thus higher seeding rates are recommended for hulless barley. For example, in other research, O’Donovan found that, for the hulled variety AC Harper, a seeding rate of 300 seeds/m2 was needed to achieve the target plant population of 200 to 240 plants/m2, but the hulless variety Peregrine needed a seeding rate of 400 seeds/m2 (and a seeding depth of about an inch) to achieve the target population.
The effect of the optimal cultural practices in reducing wild oat seeds in the soil seed bank was especially noticeable at the lower herbicide rates (see Table 1). And at the Beaverlodge site, that effect was evident even when the full herbicide rate was used. “For example, where we had the suboptimal cultural practices and the full herbicide rate, we had about 40 wild oat seeds per square metre in the soil seed bank. But where we had the optimal cultural practices plus the full herbicide rate, we had less than one wild oat seed per square metre,” O’Donovan says.
“So we got greater than a 40-fold decrease in the wild oat seed in the soil seed bank when we used the optimal cultural practices compared to the suboptimal cultural practices.”
The researchers also found that barley yields were generally better where the optimal cultural practices were used for the nine years. “On the plots with continuous barley, barley disease built up over the years, which resulted in the reduced yield,” O’Donovan explains.
Although using the higher seeding rate alone helped reduce the amount of wild oat seed in the seed bank, it was not nearly as effective as combining the higher seeding rate with the diverse rotation. O’Donovan notes that there are numerous other reasons to use diverse crop rotations. For example, research shows diverse rotations reduce a wide range of weed, disease and insect problems. “With the high price of a crop like canola, it may make economic sense in the short-term to shorten crop rotations, but over the long-term, all of these factors come into play.” Table 1. Effects of herbicides plus cultural practices on wild oat seed numbers and barley yields

WELCOME TO NEW
Make it NexeraTM and make more, NOW in more ways than one.
• Get healthier premiums, profits, demand for Omega-9 oils
• Healthier agronomics, profit to your potential either way
• New for 2015, the Nexera canola Flexibility Agreement TM
• Grow Nexera WITH OR WITHOUT a contract
New sunflower varieties specifically for Canadian cropping under development.
by Madeleine Baerg
The quality and yield of crops like canola and wheat have improved markedly in Canada over the past couple decades, thanks to the investment of significant research time and dollars. Until now, the same cannot be said for sunflowers. Despite a strong domestic and international market for both oilseed and confection (hull-on, snacking variety) sunflower seeds, the acreage of sunflowers grown in Canada is small and dropping due to a variety of unresolved disease and hardiness issues.
However, the recent injection of almost $4 million dollars towards developing hybrids specifically suited to Canadian conditions may finally make this crop an attractive option for Canadian growers.
“At our board’s strategic planning session in 2010, we asked ourselves how we could convince producers to plant sunflowers. Our number one problem is we do not have any new, adaptable hybrids coming into the marketplace because there is no public or private breeding program for sunflowers in Canada. All new hybrids for North America are being developed in the U.S., and those hybrids don’t necessarily suit our climate here in Canada,” Darcelle Graham, executive director of the National Sunflower Association of Canada (NSAC) says. “One of the main confection hybrids we grow right now is a 20 plus year old variety. You never hear of that in canola or wheat because new varieties are always being developed.”
So, NSAC – small in represented acres and operating funds, but big in vision – decided to attack the research challenges head-on.
Their efforts have paid off to the tune of $3.6 million dollars split between two rounds of funding. The first, started in September 2011 and completed in March of 2014, totaled $1.361 million dollars with 85 per cent of funding from the Canadian Agricultural Adaptation Program and 15 per cent from grower check-off dollars. The second, recently announced round of funding will provide an additional $2.5 million dollars for research through 2018. This funding comes from the combined commitments of the federal and provincial governments, the Western Grains Research Foundation, and producer check-off.
With these dollars, NSAC purchased a collection of confection sunflower genetics from Mike Hagen, an independent sunflower breeder. They then contracted Hagen to continue adapting the germplasm from his warehouse in Fargo, North Dakota to achieve hybrids with traits necessary for Canadian growers and marketers.
The top breeding priority, interestingly, is shape. In Canada,
Sunflowers’ deep roots make them drought and excess moisture tolerant, and let them drill down to nutrients in the lower depths of the soil.
sunflower seed lovers prefer to eat round confection seeds. Internationally, however, big sunflower consuming regions like Asia, the Middle East, Germany and the U.S. prefer a long seed rather than round.
“In certain countries like China, instead of having peanuts at a bar they have sunflower seeds. Some people have notches in their teeth from eating so many,” Graham says. “Those are the lucrative markets, the markets Canada needs to sell into, and our seeds need

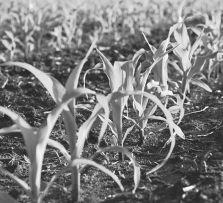
Even though it looks the same, it’s not. Volunteer canola can provide a host for dangerous diseases, steal nutrients and limit the yield performance of your crop. But moving forward, this doesn’t need to be a problem.

Pardner® herbicide is now registered as a pre-seed, tank-mix partner with Roundup® WeatherMAX® herbicide and other similar glyphosate technologies for control of all volunteer canola, even if they’re tolerant to other herbicide groups.
For more information, visit BayerCropScience.ca/Pardner


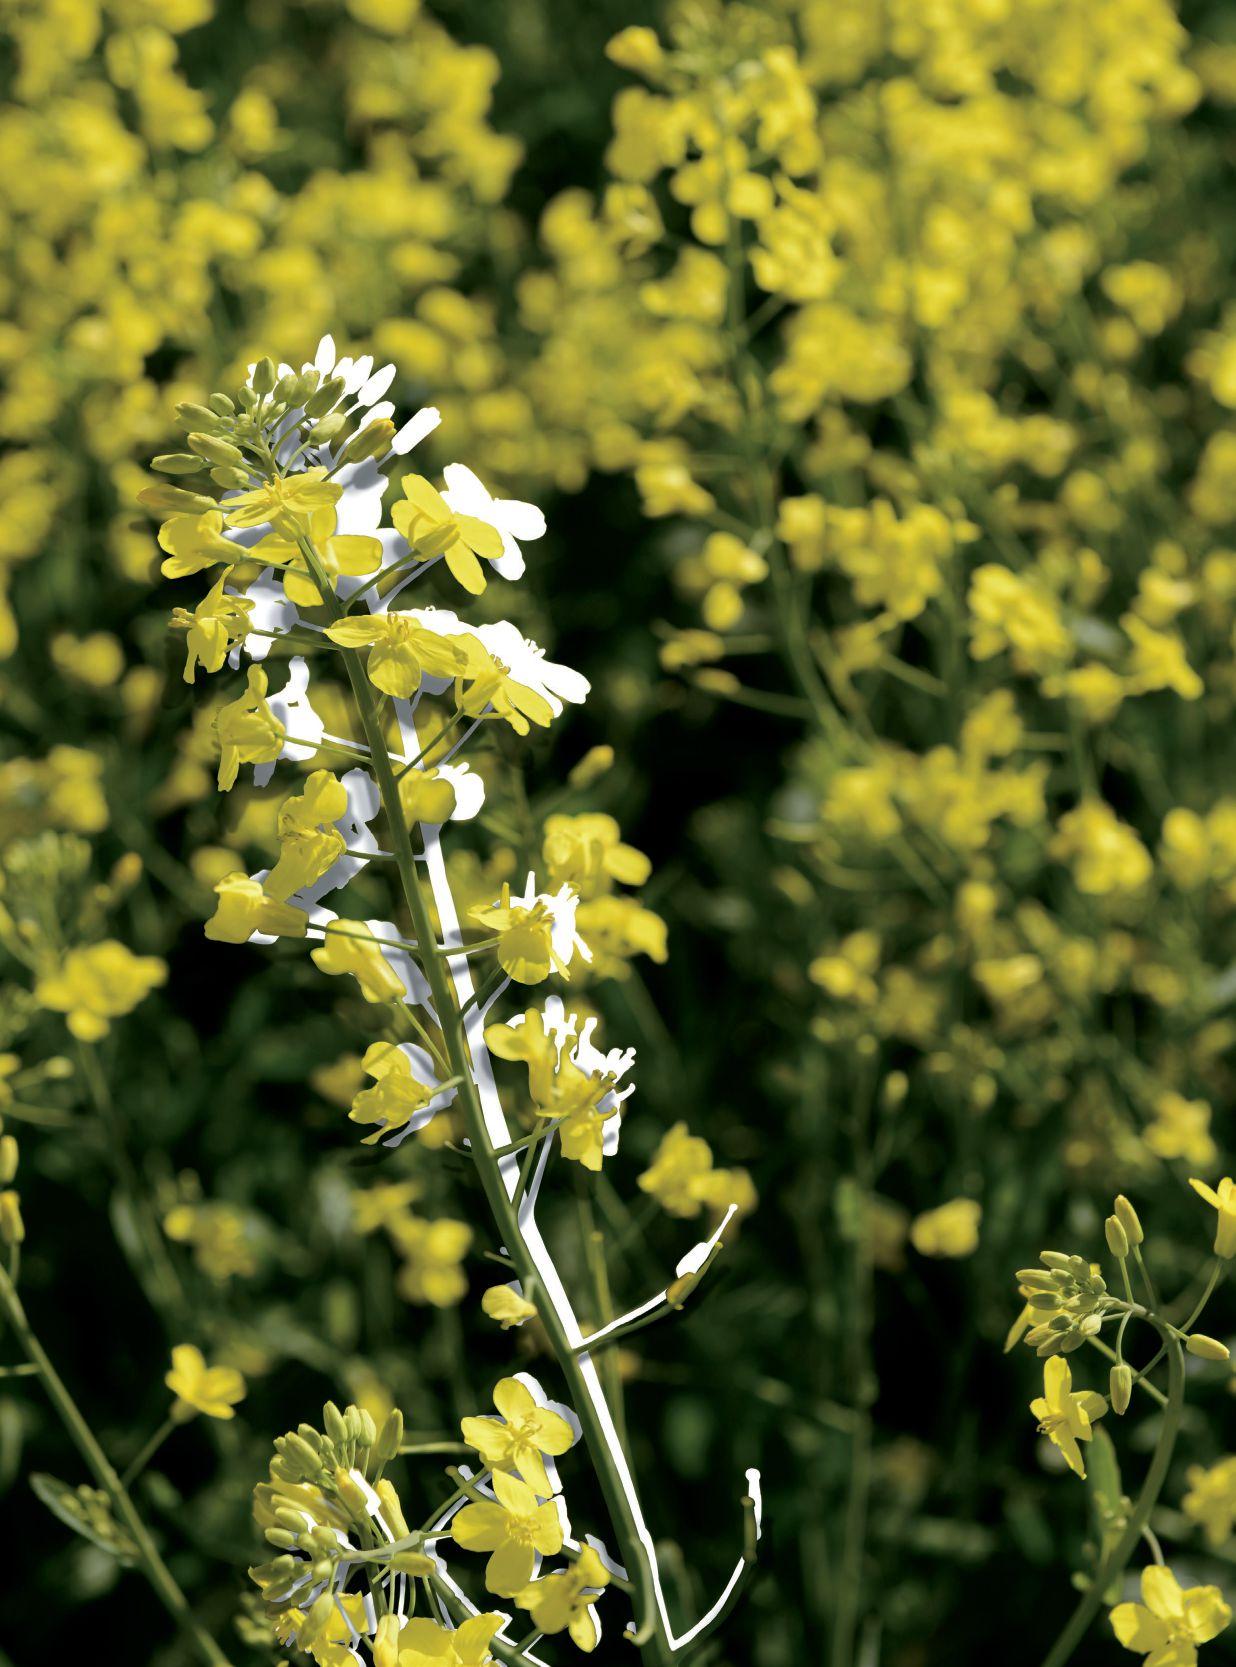
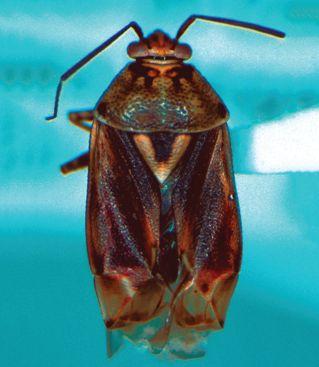
Researchers are looking to validate economic thresholds with new canola hybrids.
by Donna Fleury
Lygus bugs are a serious pest in canola crops, as well as some pulses and legumes. The current economic thresholds for lygus were developed in the late 1980s and validated later for older conventional canola varieties. Researchers are testing and updating these thresholds to reflect climatic and environmental conditions specific to Alberta, the differences in insect biology across the province, and newer, higher yielding hybrid canola varieties.
According to Héctor Cárcamo, research scientist with Agriculture and Agri-Food Canada (AAFC) in Lethbridge, Alta, updated thresholds will help growers make better management decisions and reduce unnecessary insecticide applications.
“We are repeating the earlier threshold studies done in the late 1980s in Winnipeg [Manitoba] using a similar research design and cages, and similar densities of lygus, to re-evaluate economic thresholds,” he says.
Newer hybrid herbicide-tolerant canola varieties are more vigorous and much higher yielding than the older conventional varieties. Earlier varieties such as Westar averaged 20 bu/ac, while newer varieties average more than twice that level in many areas. Researchers expect the newer, more vigorous and higher yielding varieties can possibly tolerate lygus feeding better and the threshold can be adjusted accordingly. As well, there are different species of lygus in Alberta as compared to Manitoba, and the species differ between the southern and northern parts of the province.
In this four-year study initiated in 2012, researchers are conducting related studies in Lethbridge, Lacombe and Beaverlodge, Alta., each slightly different based on local differences. “In Lacombe, researchers are comparing two different species of lygus and two canola cultivars, Westar and L150,” Cárcamo explains.
Plots include cages with lygus at four, 20, 40 and 80 per cage, and a control without lygus to quantify the damage and economic threshold. In a related study in Beaverlodge, researchers are comparing three cultivars, Westar, L150 and an RR hybrid, and including cages with and without lygus added at the late bud stage. “In northern Alberta, there is only one generation of lygus, but the main concern is with their arrival in the fields at bolting to just prior to flower, and the impact on flowering and pod set,” Cárcamo says.
In Lethbridge, researchers are using only one canola variety, L150, but have added cabbage seedpod weevil (csw) comparisons as well to help derive a more scientific threshold for csw at the same time as update the lygus threshold. In southern Alberta, there are
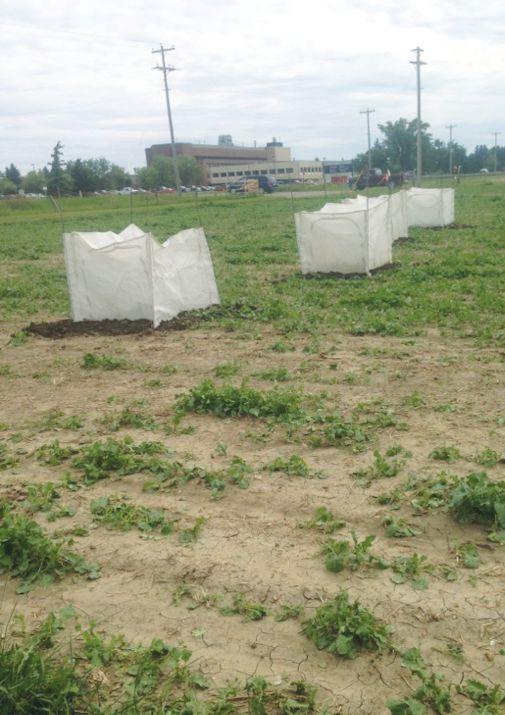
two and sometimes up to three generations of lygus. Plot treatments for lygus include zero, four, 20, 50 or 80 lygus per cage. In another treatment, cages with 20 csw and 40 csw are being compared. To better understand the impact of a moderate level of lygus and weevils combined in the same field, another treatment is comparing 10 csw and 10 lygus per cage to a control with no insects.
After three years of the study with different growing conditions, researchers are learning more about the impacts of lygus on crops.
“The first two years of the study had very different growing conditions, with 2012 being a poor year for canola yields,” Cárcamo says.
“The 2012 summer was too hot, the heat blast impacted yields, and
dry conditions favoured lygus which also caused a lot of damage to yield. However, 2013 was quite the opposite, with very good yields across the Prairies. And the better moisture conditions appeared to reduce the impact by lygus on yields. It confirmed earlier research that shows rainfall during the flowering and pod setting is important for canola, and if the rainfall is strong in a short period, it can be very instrumental in reducing the impact of lygus.”
In 2014, yields across the Prairies were more average and lower than in 2013. Although lygus counts have not been finalized, it looked like numbers were lower in 2014 than in 2012. The project will continue for one more year, and results will be available after the 2015 crop season.
“These differences in growing conditions and weather each year emphasize the importance of having at least four years of data to compare, to get a better understanding of the overall impacts on yields, insect densities and economic thresholds,” Cárcamo says. “For now, growers should continue to use a basic general threshold of one lygus per sweep at the end of flower and two lygus per sweep at the mid pod stage, the stages when the most economic impact occurs. Some growers are going to a much higher threshold of five lygus per sweep within two weeks of swathing, when the plants are better able to tolerate the insects.”
Crop health also impacts the economic threshold. Although there is no threshold for the bud stage, if the crop is under fairly severe moisture stress and lygus feeding is clearly preventing flowering (sap should be visible on the buds where lygus have punctured them), an insecticide application may be warranted to protect canola yield. Under
good growing conditions, canola can grow through this early damage without any yield loss. Crops that are healthy and not under stress can usually withstand low levels of infestation at the end of flowering and early pod stages. At higher feeding pressures, it is possible that a healthy vigorous crop may compensate for higher feeding pressures, and that only poorer crops may need control at threshold levels of lygus.
“At the end of 2015, we will be reviewing our results and determining how these new
cultivars are coping with lygus bugs across Alberta,” Cárcamo says. “We hope it is a positive story, but we won’t know for sure until all of the data is collected and analyzed.
We expect to be able to update the economic thresholds for lygus, which will give canola growers a much more accurate way of knowing whether insecticide spraying is warranted,” he adds. “This will help them to reduce application frequency and input costs and continue to protect product and environmental sustainability.”

Organizing your field and crop data is easier with the right tools. Use FM PRO Mobile to enter information on the go, sync it with Field Manager PRO or 360 on your desktop, and make decisions based on the most profitable scenarios. Ask us how.
fccsoftware.ca/FieldManager 1-877-926-0064

CONTINUED FROM PAGE 36
to blend in with what they grow and prefer.”
In addition to shape, other trait priorities include improvements to days to maturity, height, lodging attributes, and disease resistance, especially to downy mildew and rust. And, to make growing the crop simpler for producers, NSAC is also looking to develop a non-GM form of herbicide tolerance.
“Sunflowers will always be a non-GMO crop because they are native to North America, so if we tried to go GM it would just be a mess once it got into the wild population,” Graham says.
Instead, the herbicide tolerance trait will be based on genetics from a natural mutation that occurred in a wild sunflower in 1996.
Already, NSAC has completed three years of strip trial testing on Hagen’s first hybrids, and will continue testing them in larger scale plots this coming summer. Additional hybrids are at a variety of other stages in the development process.
“The genetic program we purchased had some almost finished hybrids when we purchased it, so we’re in the process of pre-commercialization trialing on those hybrids in Canada,” Graham says. “Those are the first out of the gate because they were almost fully developed, and gave us a good indication that maturity and seed size was what we were looking for.
“But at the same time, Mike keeps developing and testing more hybrids in Fargo and, in the winter, runs a second nursery in Chile. We’re running a 200 row screening nursery in Manitoba every year to look for more possible hybrids, and advanced two rep, two row; four rep, four row; and strip trials at different locations around Manitoba,” Graham says. “If they show enough promise, the final step is small and then large-scale pilot production. We don’t want to jump into the market with anything we don’t fully know.”
The first herbicide tolerant hybrid from this program will be tested in a two rep, two-row trial this coming summer.
Producers should greet this research work with enthusiasm, Anastasia Kubinec, oilseed specialist with Manitoba Agriculture, Food and Rural Development (MAFRD) says.
“There are lots of benefits to growing sunflowers. They are very good for rotation. Their very deep roots make them drought and excess moisture tolerant, and let them drill down to nutrients in the lower depths of the soil. And they are highly profitable if you can control the head rot. If you can get yield, plus the quality buyers want, most times growers say they are the most profitable crop,” says Kubinec.
“But up until now, varieties have had issues with our northern climate, and they’ve provided no head rot resistance traits. I’m really hopeful that gains will be made that make it a more attractive crop for Canadian producers,” she says.
Graham agrees. “This work is incredibly important to producers. This is their check-off dollars being put to work, with the benefits directed right back to producers. This is a purely Canadian focused program that they’re not going to see from anyone else. And, given that we have such a low rate of check-off refunds – less than three per cent – I take that to mean producers are onside with this work.”
NSAC hopes that improved hybrid options will help almost triple Manitoba’s sunflower acreage. Bringing acreage from its current 87,000 acres to 200,000 acres would provide sufficient check-off dollars that the association could use to meet its operating needs, retain an on-staff agronomist, and complete necessary additional research on key topics like fertility and fungicide.
“I’m hoping acreage is on its way up now,” adds Graham.
For more on crop management, visit www.topcropmanager.com.
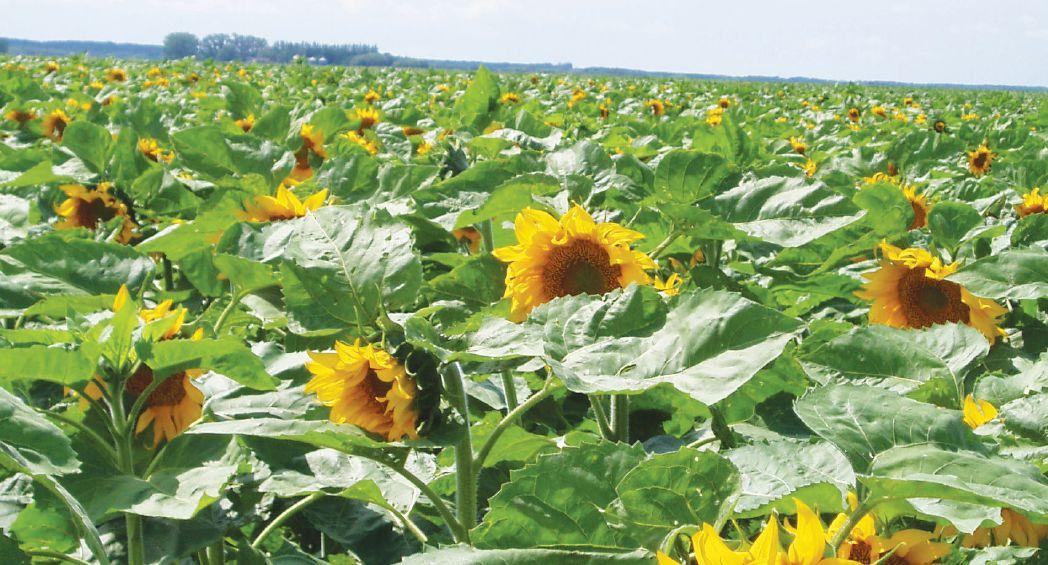

Start this season with Wolf Trax Innovative Nutrients. Wolf Trax technologies deliver important nutrients to your crops more effectively, so they can access the nutrients earlier. With a better start, your crops can finish strong – and that’s a better use of your fertilizer dollar. So stand up for your crops, and ask your retailer for field-proven Wolf Trax Innovative Nutrients.

Take care of best management practices and little else matters.
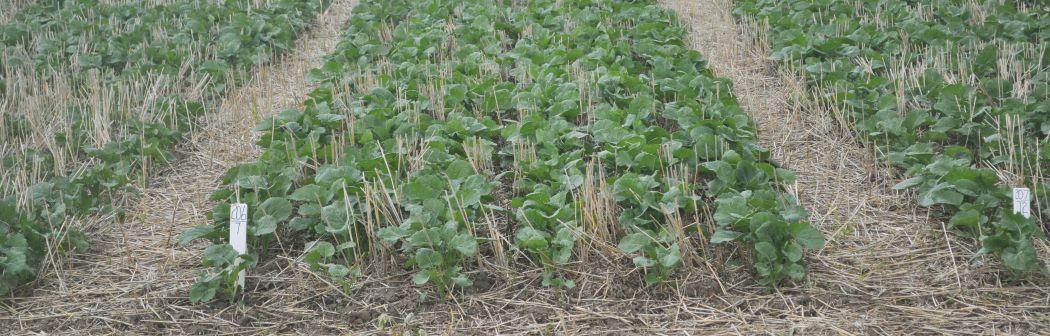
by Bruce Barker
Look after your fertility package, use proven agronomics, be skeptical of “special” input products, demand good quality research data and your canola crop will look after you. That’s the message coming out of the Ultimate Canola Challenge (UCC) organized by the Canola Council of Canada (CCC). The UCC was launched in 2013 and repeated in 2014, testing yield increase and return on investment of 13 specialty products and practices.
“The Ultimate Canola Challenge stemmed from the idea that most growers are getting asked to put extra inputs on their canola,” Keith Gabert, a CCC agronomist in central and south Alberta, says. Gabert presented the UCC findings at the Alberta Agronomy Update in Lethbridge in late January.
“You’re really on the hook when we talk about [the cost of] growing canola because you’re already betting like someone who has been to Vegas a few times. We want data to be able to prove it on the farm before we go gambling on additional inputs.”
On top of the serious investment in inputs and fixed costs, Gabert asks where the best place is to invest in the canola crop. In theory, you want to invest in products that will give the best return. Most farmers look for a three-to-one return on an input because weather plays such a critical role.
“On top of reality [weather] not being perfect, some product claims are exaggerated. If it sounds too good to be true, it probably is,” Gabert cautions. “Western Canadian field trials conducted by unbiased researchers is your best source of information. Check out what the research is. How many trials they have, and how close to your farm. Do you think you can duplicate that at home? If the answer is ‘I don’t think I can duplicate what he is talking about,’ you can ignore that, too.”
The UCC research was conducted at nine sites in Alberta, four sites in Saskatchewan and one site in Manitoba. All UCC sites
included in the study followed scientific research protocols set out by Neil Harker with Agriculture and Agri-Food Canada in Lacombe, Alta., and by Murray Hartman, oilseed specialist with Alberta Agriculture and Rural Development. Each site had small plots with four replicates. CCC agronomists, along with Harker and Hartman, selected the best management practices (BMP) that served as the check treatment.
“If you don’t have your N [nitrogen], P [phosphorus], K [potassium], and S [sulphur] figured out, and on top of that your seed placement and your fertilizer placement, you might as well not look at fine tuning your agronomy because there are a lot of things you can work out at home first,” Gabert notes. “I’m going to guess that most canola growers still have something better they can do at home, before we start talking about micros or buying the next new variety that is an extra 50 cents per pound.”
The UCC plots had to be on cereal stubble. Each site used one variety for all plots, with the variety chosen for its suitability to the area. The seeding rate was 100 seeds/m2. Fertilizer rate was 100 per cent of soil test recommendation for N, P, K and S. Seeding date was early May. Crop protection was applied as needed. Plant counts were taken at regular intervals through the season. Grain yield, moisture, seed weight, green content and oil content were recorded for each plot.
In 2014, individual co-operators could add another treatment of interest. The standard BMP treatment was developed with aggressive yield targets, not just for an average crop. Basically the question put to the UCC was if there were any profitable inputs that could be added to a good solid agronomy package.
ABOVE: A solid yield target and fertility plan is the best approach for profitable canola.
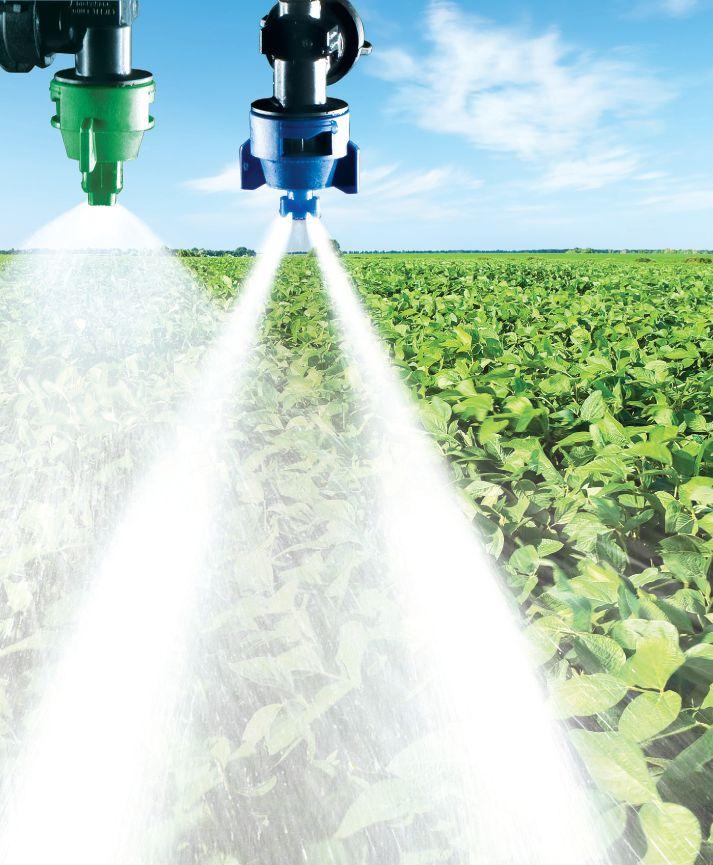
The 13 treatments applied according to protocols were:
1. Standard – 100 seeds/m2, no primers and no foliars
2. Extra N: 125 per cent of recommended in the sideband
3. Seed primer: Protinus seed primer
4. Stress relief: C3 with herbicide
5. Top dressing: 100 per cent N at seeding
6. Boron (Nexus): at five per cent flowering (with fungicide if needed)
7. Higher seeding rate: (150 seeds/m2)
8. Reduced N: 75 per cent of recommended in the sideband
9. Precede seed primer
10. Biostimulator – Penergetic P (one leaf & rosette)
11. Fortified foliar (five leaf)
12. Boron (Alpine): four-six leaf
13. CO2 greenhouse effect: AGROSOLution (two-four leaf and two weeks later)
Of the 13 products and practices tested, only one provided a significant response compared to the BMP check and it was a negative yield response. It involved applying N at 75 per cent of the recommended rate, which resulted in a significantly lower yield than the treatment that received 100 per cent of the recommended N.
Gabert says when considering extra inputs, growers should keep their perspectives simple. Look at the response claims and see if they are based on robust, multi-location, unbiased research. He says to ignore claims based on a function in the plant or based on what the product does within the plant. Look at the probability of response and
consider the magnitude of the response.
“Are you chasing a one-half bushel response with a five dollar added cost? Or if you talk to me in February should we just take the money and spend it on nitrogen and just take our chances? Because across your farm, without knowing anything about your operation, chances are I’m just going to spend money on N,” Gabert says.
Prior to the UCC, Gabert says he would have bet on extra N and a higher seeding rate delivering a significant yield increase. The fact that neither did is explained by the sound fertility package and good stand establishment for the standard BMP treatment. He emphasizes if you want to look at increasing canola yield, make sure the macro fertility package is sound.
“Do you need more P? I can’t really answer that. But typically when I talk to growers about their yield expectations, it has grown considerably over the last 10 to 12 years, but their P fertility program has not changed much,” Gabert notes.
Gabert is a big believer in S fertilizer, but cautions soil tests aren’t reliable. “If your soil test says you don’t need S, don’t believe it and put about 15 pounds on. And if your soil test says you do need S, put on about 20 lbs. That’s a little too simple, but I don’t want S to be one of the limiting factors in canola production. At about 30 cents per pound, and at 20 pounds per acre, why would you want it to be the $6 that holds back 60 or 70 bushels of yield?”
Gabert says the take home messages from the UCC should resonate with growers and agronomists. Develop a solid yield target and fertility plan. Research any new input choices. Do your homework. And, leave a couple of check strips and accurately measure results.
TeeJet tips: precise herbicide application to wipe out weeds & boost yields.


Good weather, adequate nitrogen and a good corn hybrid are crucial.
by Anne Cote
The perfect crop is every corn grower’s dream; but perfect, or bumper, crops don’t happen without planning, and a little luck.
Elite crop specialist François Labrie says, “If you do everything perfect, then 300 bushels per acre is possible. But life’s not perfect.” And, he adds, that’s the reason it’s important to get growers thinking about how to improve their yield as well as their profit.
Labrie, with La Coop fédérée, visited Manitoba last November, to offer advice to corn growers in the province.
He says the top three contributors to a high yield are good weather, adequate nitrogen (N) and a performance corn hybrid seed. These three factors directly affect 72 per cent of a crop’s yield. The remaining 28 per cent of the yield is determined by the previous crop, density of plant population, type of tillage used on a particular soil and the application of fungicides during the growing season.
Labrie’s advice is to work with the top three first. While he says we can’t control the weather, it is important to institute an adequate drainage system to manage extreme wet weather, and to take steps to improve water retention in dry weather. Together, these two measures will improve the likelihood of having optimum moisture levels, which contribute to 27 per cent of final yield.
N levels in the soil are the second most important influence on yield. Labrie says adequate N levels impact the final yield by 26 per cent. The presence of N is entirely controlled by the grower, and careful application of N will improve yield. Labrie suggests applying 180 pounds of N per acre in two stages: 45 pounds at seeding and 135 pounds at the four-leaf stage.
“The right amount of [N] at the right time will produce a higher yield,” he notes. “Watch for [N] deficiency in August and make application adjustments in the future if needed.”
Using the same hybrid year after year won’t improve yields either, according to Labrie. Corn breeders are continually developing new hybrids that out-produce many of the older varieties because they’re more resistant to disease, produce bigger cobs with more kernels and mature earlier to decrease the likelihood of frost damage. The initial cost is higher than many of the older varieties, but Labrie suggests growers do the math to see if improved yields are worth the additional cost.
So just how much time and effort should a grower put into a field to extract the highest yield? With N and seed being the two most important factors in crop yield, after weather, Elite set out to determine where a corn grower should concentrate their efforts.
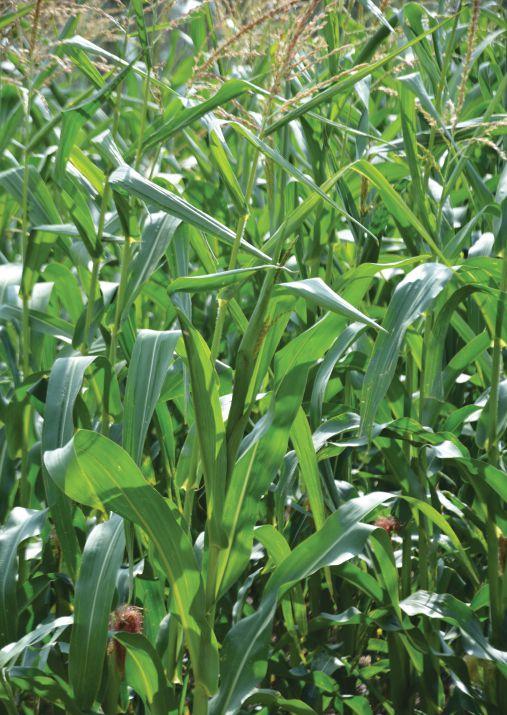
In their own field trials, Elite measured changes in yields following adjustments to the number of kernels planted per acre, the amount of N added to the soil and the application of fungicide to the crop. They began by planting the same hybrid corn seed on three sites, each with a different soil type. They used an intensive management practice on one field, planting 38,000 kernels per acre and fertilizing with 215 pounds of N per acre but didn’t apply fungicide. The second field had the same planting and fertilization rates but a

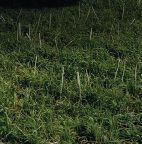
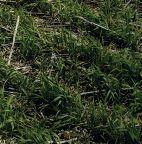
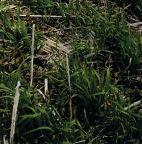
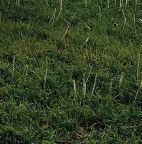
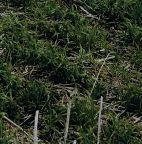
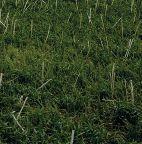
Wind speed, pressure gauge, optimal nozzle settings, check. All systems are go and it’s time to take down the toughest weeds in your wheat eld, whether they’re resistant or not. With three different modes of action in a single solution, Velocity m3 herbicide provides you with exceptional activity on over 29 different tough-to-control grassy and broadleaf weeds.
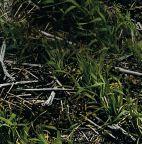
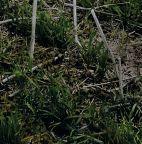
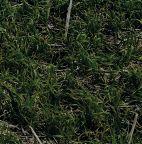
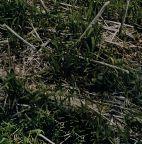
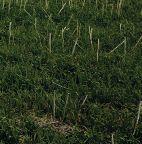
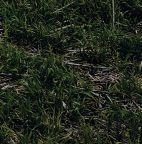
For more information, please visit: BayerCropScience.ca/Velocitym3
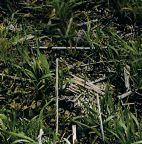
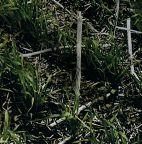
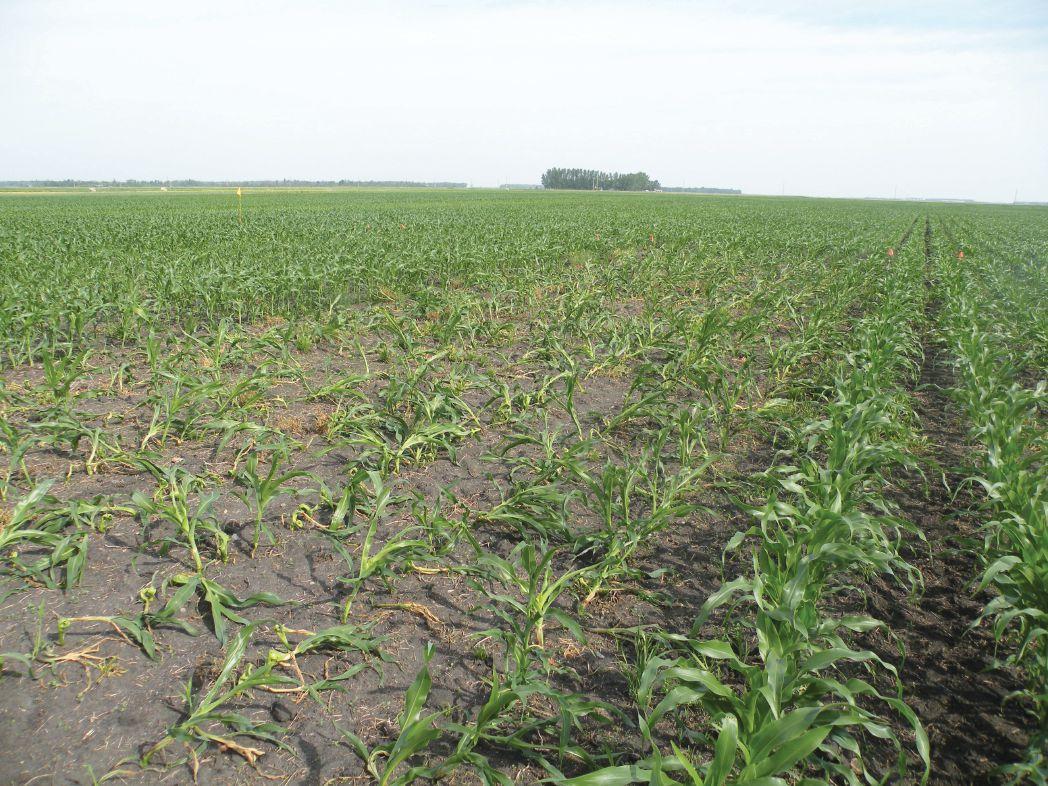
Better control choices are now available.
by Bruce Barker
Since the widespread adoption of both Roundup Ready (RR) corn and RR canola, growers have been struggling with controlling volunteers. Until 2015, controlling RR volunteer canola in RR corn was possible, but with some potential crop tolerance issues. From 2011 to 2013, Wilt Billing, agronomist with DuPont Pioneer, looked at some commonly used herbicides in corn that specifically targeted glyphosate-resistant volunteer canola.
“The herbicides were all being used by commercial growers and the products all had potential harmful implications,” Billing notes. He has a special interest in weed control as DuPont Pioneer sells RR corn and Billing wanted to help growers get the most out of their corn genetics.
Billing looked at five different herbicide treatments on four industry-leading Pioneer and other brands of RR corn hybrids. Glyphosate alone was used as a check to assess herbicide tolerance and weed control.
Herbicides were applied at the V3 stage of corn growth (see Table 1). Treatments were replicated four times over three years.
Herbicide injury scores were recorded at three to five, seven to 10, and 21 to 24 days after post-emergent herbicide application. Brittle snap, test weight, yield and per cent moisture content were also observed. In the glyphosate-only treatment, after herbicide application any volunteer canola plants were removed in order to have a valid yield and test weight comparison.
Dicamba, 2,4-D and MCPA amine are Group 4 herbicides that work to produce abnormal growth in weeds. Bromoxynil is a Group 6 contact herbicide. All herbicides are registered on corn.
“I wanted to see if the Group 4 herbicides were impacting corn growth and compare that to bromoxynil,” Billing says. “Over the three years, we saw some consistent trends.”
Severe and persistent herbicide injury resulted from 2,4-D on all hybrids. 2,4-D showed the highest brittle snap in all hybrids (see Table 2). On average 2,4-D reduced yield by 13.5 per cent and lowered
ABOVE: Glyphosate plus 2,4-D treatment caused severe herbicide injury.
test weight by 4.4 lbs/bu.
Billing explains that MCPA amine increased brittle snap counts and displayed significant onion-leafing symptoms. Dicamba produced stalk lodging and increased brittle snap counts with significantly reduced yield and test weights. 2,4-D, MCPA and dicamba produced stunted plants and poor brace root development when compared to bromoxynil and the glyphosate only check. Bromoxynil caused minor leaf scorching, but produced no growth inhibition or brittle snap and plants recovered quickly.
“All the bromoxynil treatments looked fairly good. It wasn’t inhibiting growth of the corn crop. There was some flash burn, but within two to three days after application, the corn outgrew the minor injury and was healthy. With Group 4 products, it set the corn back seven to 12 days. There was often a staging difference at maturity,” Billing says.
Overall, Billing says bromoxynil treatments had the highest yield, lowest crop injury, no crop stunting, no brittle snap and no reduction in test weight. (See Fig. 1.)
When applying bromoxynil to corn, Billing recommends application during warm temperatures but not at temperatures greater than 27 C. High water volumes of at least 10 to 15 gallons per acre are recommended to reduce crop stress, and applications should be avoided during or immediately following environmental stress on the corn crop.
Since Billing conducted his research, a new active ingredient has been registered in Western Canada for use on field and sweet corn to provide better grassy and broadleaf weed control. The active ingredient is topramezone – a Group 27 herbicide – sold by BASF as Armezon and by UAP as Impact. Volunteer canola is not yet on the label, but control at the one- to six-leaf stage has been submitted for addition to the label.
“I’ve looked at Armezon and Impact in demonstrations on commercial fields and I think these herbicides will become leading products for use on corn crops in Western Canada,” Billing notes. “[They do] a very good job on broadleafs and I haven’t seen any crop injury. It looks very safe on the crop.”
Tropramezone should be tank-mixed with glyphosate for application to RR corn and can be applied from the one- to seven-leaf stage. The tropramezone and glyphosate tank-mix provides control of all weeds on the glyphosate label, plus it provides improved control of barnyard grass, green and yellow foxtail, chickweed, lamb’s quarters, ragweed, smartweed, redroot pigweed and wild mustard.
DuPont Pioneer is also looking at some of the chemistries registered on corn just south of the border in North Dakota, and the company hopes to be able to work with other pesticide companies to support registration efforts in Western Canada.
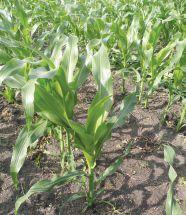
Source: Wilt Billing, DuPont Pioneer.
1: Hybrid yield by herbicide treatment (bu/ac)
Source: Wilt Billing, DuPont Pioneer.

Believe it or not, there’s a simple trick to protecting your canola yield before sclerotinia even becomes a problem –and you don’t have to be a magician.
Based 100% in science, easy-to-use Proline® fungicide proactively protects your pro ts and continues to be the number one choice for canola growers looking for effective sclerotinia protection.
For more information, visit BayerCropScience.ca/Proline

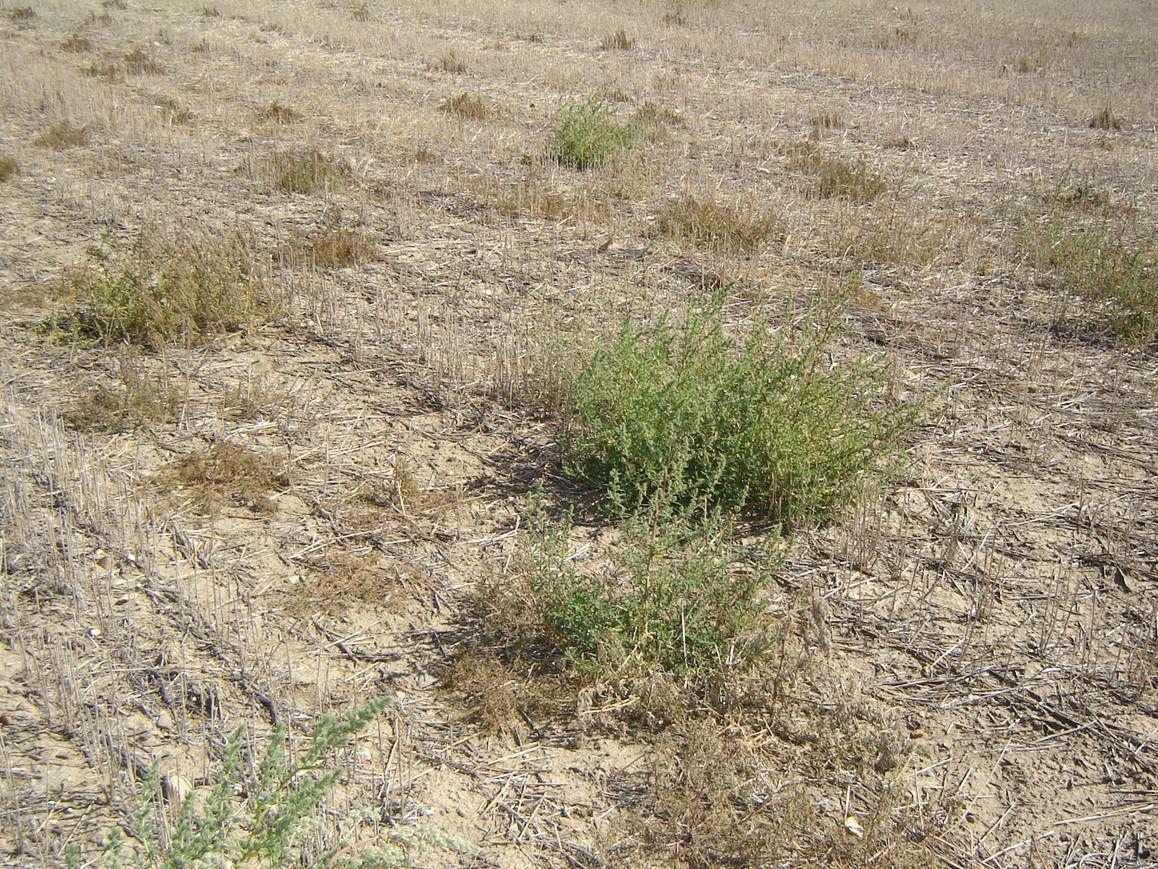
Research is identifying the best management options.
by Bruce Barker
Whether you have it or not, you better get used to dealing with kochia resistant to both Group 2 and Group 9 herbicides. Researchers assume that all kochia on the Prairies is now resistant to Group 2 herbicides, and the incidence of Group 9 kochia resistance is only going to grow in time and space.
According to Bob Blackshaw, research scientist with Agriculture and Agri-Food Canada (AAFC) at Lethbridge, Alta., this doesn’t come as a surprise.
“Where you have heavy infestations, wide distribution and intensive use of herbicides, you will get resistance development. It is almost a given, and whether it will happen in 10 or 20 or 30 years, it will happen at some time,” he says.
Blackshaw and AAFC Saskatoon colleague Hugh Beckie have been following the development of glyphosate resistant (GR) kochia over the last several years. They have participated in surveys and are looking at herbicide control options.
Beckie has looked at GR kochia control with some common
herbicides in greenhouse trials to assess weed control. Blackshaw has conducted small plot herbicide trials at Lethbridge and Coalhurst, Alta. over the last two years.
As part of Nikki Burton’s undergrad research at the University of Saskatchewan (U of S), Beckie looked at GR kochia control with Banvel II (dicamba, Group 4), Pulsar (dicamba+fluroxypyr, Group 4), Distinct (dicamba+diflufenzopyr, Group 4+19), Buctril M (MCPA+bromoxynil, Group 4+6) and Liberty (glufosinate, Group 10). The herbicides were applied to two GR kochia biotypes and one non-GR biotype.
Beckie explains both GR and non-GR biotypes responded similarly to each of the herbicide treatments. Although both GR biotypes were sensitive to the herbicides, MCPA+bromoxynil
Grain Guard’s new line of 4" wide corrugated grain bins are manufactured using state-of-theart technology and are available in diameters from 15' to 105' in flat bottom models, as well as 15' to 27' in hopper bottom models. With an established catalogue of aeration and conditioning equipment, high-quality grain storage bins are yet another solution provided by Grain Guard.
Our research and development team has put in countless hours working to improve our Classic Rocket design. Resulting in an innovative, stronger and even more reliable rocket; The Next Generation Rocket
The revolutionary Retro Rocket is the only do-it-yourself rocket system that allows you to retrofit existing hopper bottom and smooth-walled bins with farm proven Grain Guard aeration.
Grain Guard also offers turnkey construction packages on all flat bottom bin models. Trust the storage and conditioning experts to be your one-stop shop.
was the most effective treatment in reducing shoot biomass three weeks after application (99 per cent), followed by glufosinate (91 per cent) then the dicamba mixtures (82 per cent). Dicamba alone only suppressed kochia biomass (76 per cent reduction).
“Control of glyphosate resistant kochia with dicamba is very rate dependent, especially if the kochia is larger – we only got suppression at the 140 g ai/ha rate,” Beckie notes.
Blackshaw looked at some registered and experimental herbicides to assess their potential for controlling GR kochia on chemfallow. All treatments were tank-mixed with glyphosate at the 450 g ai/ha, as would be commonly done on chemfallow fields. The kochia was at a fairly large growth stage. At Lethbridge, the kochia was 15 cm tall and 10 to 15 cm in diameter, while it was 10 to 15 cm tall at Coalhurst.
“It was a tough test, but kochia is usually larger in chemfallow fields than in-crop treatments so we wanted to have a realistic test,” Blackshaw says.
Fluthiacet, an unregistered herbicide, provided marginal control on chemfallow. 2,4-D did not control kochia very well.
“2,4-D never has controlled kochia. If you look at the data going back 30 years, 2,4-D by itself is not great. You have to mix it with Banvel or bromoxynil to get better control. Do not rely on 2,4-D by itself,” Blackshaw cautions.
Optica Trio (MCPA+mecoprop+dichlorprop, Group 4), dicamba (Group 4) and Distinct (dicamba+diflufenzopryr, Group 4+19) herbicides all provided fairly good control as well.
“Dicamba could be a good choice for many people to use but you need higher rates,” Blackshaw says. Best control with dicamba came with 580 g ai/ha rate.
A batch of Group 14 herbicides all worked quite well, too,
Aquick bioassay for determining glyphosate resistance in kochia was developed by Beckie, along with U of S graduate student Jessica Pratchler and AAFC research technician Scott Shirriff. Seeds of six kochia populations, three GR and three nonGR (susceptible), were placed on filter paper in dishes treated with varying doses of glyphosate. After a seven-day incubation period, seedlings were assessed for growth. If a true leaf (not cotyledon) was present after seven days, the seedling was GR resistant.
Farmers can try a version of this experiment at home by using common household items. Materials needed:
• Two round plastic 500mL yogurt or sour cream containers
• Four basket-style coffee filters
• 500mL water
• Glyphosate
• One medicine dropper
• Saran wrap
• Minimum 50 kochia seeds
Method:
• Place two coffee filters in each of the two plastic containers
Blackshaw notes. Aim, Valtera+2,4-D, Heat, and Aim+Authority herbicides provided a consistently high level of GR kochia control.
“It is nice to have Group 14 products as an option. Group 14 isn’t really a new herbicide group in the world, but it is relatively new to us in Western Canada,” Blackshaw explains. “The good news is there are other products to use in chemfallow.”
In spring wheat, Blackshaw looked at 15 different herbicides and rate structures. Dicamba+2,4-D, bromoxynil+2,4-D, estaprop and Target (dicamba+mecroprop+MCPA) provided marginal control. Dyvel Dsp (dicamba+mecoprop+2,4-D) looked better at the higher rate. Optica Trio provided good control although not as good as some of the other herbicides.
“Probably the best products to use on spring wheat are those containing fluroxypyr. Fluroxypyr is dynamite on kochia and is probably the one you want to use,” Blackshaw says.
Fluroxypyr is a Group 4 herbicide. It is found in Attain (with 2,4-D), Prestige (with clopyralid+MCPA), Pulsar (with dicamba) and Stellar (with florasulam). Blackshaw combined Stellar with MCPA to boost up GR kochia control.
Enforcer D also contains fluroxypyr along with bromoxynil and 2,4-D. Blackshaw needed to use the higher rate to get better control.
Infinity (bromoxynil+pyrasulfotole, Group 4 and 27) also gave very good control. “I really didn’t know if it would have much control, but it did with more than 90 per cent control. We don’t use Group 27 herbicides as much so that is nice for managing herbicide resistance,” Blackshaw notes.
The final product tried for GR kochia control in spring wheat was Authority (sulfentrazone, Group 14). It is applied to the soil
• Using the medicine dropper, add two drops of glyphosate to the 500mL of water
• Shake the solution
• Put 5mL of the mixed solution onto the coffee filters in one container
• Put 5mL of plain water onto the coffee filters in the other container
• Spread 25 kochia seeds evenly into each of the containers, and cover both with a transparent lid or Saran wrap
• Poke a few pinholes into the lids/wrap to prevent potential anaerobic conditions
• Place the containers on a windowsill at about 25 C, but out of direct sunlight, for seven days
If the herbicide-treated seeds grow true leaves, the kochia is GR. The typical way to screen for GR kochia is to grow seedlings in soil-filled flats and spray with glyphosate to assess weed control 21 days after treatment. Beckie says this approach still provides the most accurate confirmation of weed resistance.
“If growers or agronomists want confirmation, we do testing for glyphosate resistant kochia for no cost here [at AAFC Saskatoon]. If you really suspect you have glyphosate resistant kochia, it will probably be fairly obvious if glyphosate isn’t controlling it, but we can do the screening.”


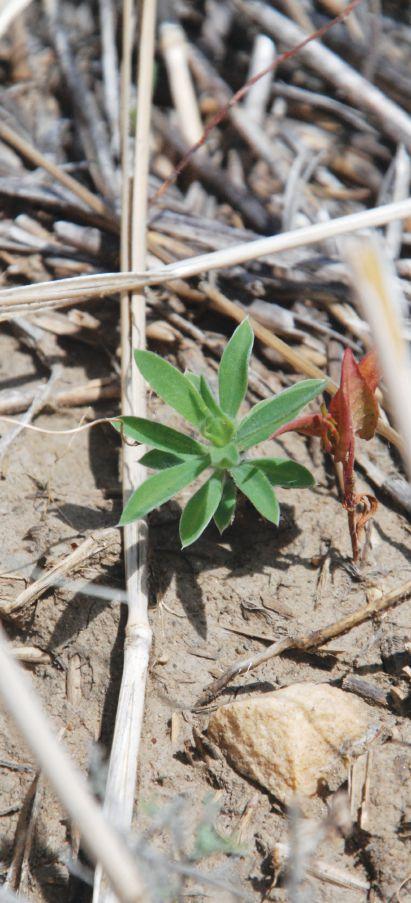
prior to crop emergence, but is not registered on wheat.
“We know Authority is great on kochia. It looks like there may be enough safety in wheat to see if there is interest in moving Authority forward for registration prior to wheat,” Blackshaw says.
GR kochia control in field pea
Blackshaw looked at a number of fall-applied herbicides on field pea, and none provided very good control. These included Edge, Kerb, pyroxasulfone and Valtera alone and in some tank-mixes.
Aim (carfentrazone, Group 14) plus Authority applied preplant provided excellent control from 90 to 100 per cent. Heat (saflufenacil, Group 14) preplant followed by Viper ADV also provided
excellent control. Fluthiacet alone or with Viper ADV showed promise as well, but fluthiacet caused some injury to pea.
“There are some good options. Authority will probably be the choice in field pea,” Blackshaw says.
Control in canola more difficult In Roundup Ready canola, GR kochia would not be controlled with glyphosate. Similarly, in Clearfield canola, kochia would not be controlled because the herbicides used in this system are Group 2, and kochia is assumed to be resistant to Group 2 herbicides.
“Control in those crops will be a challenge if you have GR kochia,” Blackshaw notes.
In Liberty Link canola, though, GR kochia control has some good options. Liberty (glufonsinate, Group 10) herbicide alone provided excellent control. Fall-applied Edge, similar to field pea treatments, did not provide control.
Blackshaw also looked at Aim plus Authority pre-emerge at various rates. The products are not registered on canola. At rates used in field pea, this combination killed the canola. At reduced rates, some control was achieved, but Blackshaw isn’t sure crop tolerance is good enough. If crop tolerance was okay, it might be a registration worthwhile pursuing for Roundup Ready canola. But, “That might be a long shot,” Blackshaw says.
One more year of funding is providing opportunity for further research on GR kochia control. Blackshaw is continuing with the herbicide research; while he and Beckie, along with Julia Leeson with AAFC in Saskatoon and Sara Martin with AAFC in Ottawa, are looking at the mechanisms and genetics of resistance. They are also looking at seed germination, dormancy and persistence in the soil. This could provide guidance on when to spray kochia on chemfallow.
“One of the questions we have is, if kochia germinates in August do we have to worry about it or will frost take care of it?” Blackshaw says. “We’re hoping to find out more to help manage herbicide resistant kochia.”
CONTINUED FROM PAGE 44
fungicide was added. A standard management practice was used on the third field with 32,000 kernels per acre, 155 pounds of N per acre and no fungicide applications.
The previous crops on the test sites were all cereals so there was no extra N left from soybeans.
The intensive management field with fungicide showed a yield of 235 bushels per acre or 13 per cent increase in yield and a $29.55 per acre increase in net profit over the standard management field. Labrie uses corn at $4.80 per bushel for the calculations. He notes fungicide is a good management tool for corn after other management problems like soil compaction or lack of N have been solved. “Fungicide has less impact on the bottom line and works best with a full season hybrid. It’s not the first management tool I’d use,” he says.
The same test done without adding N to an intensive management field produced 17.8 fewer bushels per acre than an intensive management field with N added. The field without N showed a $44.53 per acre net profit. The field with N showed a $44.94 per acre net profit even after paying for the N.
According to Labrie, the biggest risk with intensive management is competition between plants for light, water and nutrients. Late emerging plants are at a disadvantage and produce smaller and fewer, if any, cobs.
Labrie says before charging ahead and increasing the per acre plant population, growers must ensure they have a highly fertile soil with good water retention. He says if the soil is dry or sandy, “Don’t waste money on that because yields won’t improve.” Compaction is also a limiting factor as it inhibits root development and the plant won’t be able to pick up the available water and nutrients. Too many plants in the field will create increased pressure on the available water and nutrients causing uneven plant development.
The seed is bred so all the plants are the same; if they’re not all the same, then there’s something else wrong, he notes.

Delaro™ fungicide doesn’t take kindly to diseases like anthracnose, ascochyta and white mould threatening the yield potential of innocent pulse and soybean crops. Powerful, long-lasting disease control with exceptional yield protection, Delaro is setting a new standard in pulse and soybean crops.
‘EM DELARO’S COMING For more information, please visit: BayerCropScience.ca/Delaro
To provide you with the best agricultural equipment and support possible, we have 37 locations across the Western Prairies. So you never have to look far to find us. And we never have to look far to service you. It’s the kind of proximity, convenience, and quality that you can depend on. See our full lineup of Case IH equipment at rockymtn.com.
DEPENDABLE IS WHAT WE DO.