
International Research Journal of Engineering and Technology (IRJET) e-ISSN: 2395-0056
Volume: 12 Issue: 05 | May 2025 www.irjet.net p-ISSN: 2395-0072
International Research Journal of Engineering and Technology (IRJET) e-ISSN: 2395-0056
Volume: 12 Issue: 05 | May 2025 www.irjet.net p-ISSN: 2395-0072
Viomesh Singh1, Anand Deshmukh2, Aneesh Deshmukh3, Ayush Gude4, Gautam Warvatkar5 , Shreyas Dhomane6
1Professor, Dept. of Artificial Intelligence and Data Science, BRACT’s Vishwakarma Institute of Technology, Pune, India
2Student, Dept. of Artificial Intelligence and Data Science, BRACT’s Vishwakarma Institute of Technology, Pune, India
3Student, Dept. of Artificial Intelligence and Data Science, BRACT’s Vishwakarma Institute of Technology, Pune, India
4Student, Dept. of Artificial Intelligence and Data Science, BRACT’s Vishwakarma Institute of Technology, Pune, India
5Student, Dept. of Artificial Intelligence and Data Science, BRACT’s Vishwakarma Institute of Technology, Pune, India
6Student, Dept. of Artificial Intelligence and Data Science, BRACT’s Vishwakarma Institute of Technology, Pune, India
Abstract - ProponentsofElectricVehicles(EVs)oftenargue that their adoption is a simple and effective step toward decarbonizing transportation. However, the environmental advantages of EVs are highly dependent on the source of electricity, which can vary significantly across different regions. In this paper, we aim to analyze and compare the emissions produced by EVs and Internal Combustion Engine (ICE)vehiclesincludingpetrol,diesel,andCNGvariantsacross variousautomobilecategoriesandstatesinIndia.Ouranalysis revealsthatstateslikeTamilNaduandKarnataka,whichhave ahighershareofrenewableenergysources,showsignificantly lower emissions from EV usage. In contrast, coal-dependent statessuchasJharkhandandChhattisgarhexhibithigherEV emissions compared to ICE vehicles [1], [2]. Across vehicle categories, it is evident that Mopeds, Bikes, and ThreeWheelers are idealcandidatesforelectrificationdue totheir consistently low emissions in all states [3]. These findings underscore the needfor state-specific strategies andpolicies for energy and transportation along with grid decarbonization and vehicle-to-grid integration to ensure a trulysustainabletransitiontoEVs[4],[5].
Key Words: Electric Vehicles (EVs), Internal Combustion Engine(ICE)Vehicles,CarbonEmissions,CoalDependency, Renewable Energy, Grid Decarbonization, State-Specific EnergyPolicies,VehicleElectrification,TwoWheelers,Three Wheelers,LifecycleEmissions,SustainableTransportation
1.INTRODUCTION
Electric vehicles (EVs) are perceived as the best possible solution to tackle emissions originating from transport; however,thestrictlyenvironmentaladvantagesofEVsare painstakinglysensitivetotheenergy'sorigin,whichdiffers greatly on India’s vast terrains. In this paper, we try to
analyze and contrast the emissions of EVs and Internal CombustionEngine(ICE)vehiclescomprisingPetrol,Diesel, and CNG versions of different types of vehicles across the various states of India. From the analysis, we learn that statesabundantinrenewableenergysourcessuchasTamil NaduandKarnatakatendtohavethelowestemissionsfrom EVs,whereascoal-dependentstatessuchasJharkhandand Chhattisgarh show a much greater emission levels of EVs comparedtoICE[2],[3].Astudyofdifferentcategoriesof automobilesandmotorcyclesindicatesthatTwo-wheelers (Mopeds and Bikes) and Three-wheelers are the best candidatestoswitchtoEVsastheyexhibittheleastamount ofemissionsbyfarincomparisontootherstates[4].Such analysis provides clarity on the need for state-specific energyandtransportsystemsandpoliciesthatarecentered arounddecarbonizingthegridandsegmentelectrification, whichsubstantivelychangesthedynamicsofadoptingEVs.
Nevertheless, the positive impacts on the environment resulting from EVs adoption are not the same for every regionandstateduetothevaryingimpactoftheelectricity grid.TheelectricityusedinchargingtheEVscaneitherbe derivedfromrenewablesourceslikesolarandwindorfossil fuel-based sources like coal and gas [5], [6]. Like most countries,thestate-levelemissionsdifferencesinIndiaare influenced by geographic and energy infrastructure diversity.WhilesomestateslikeTamilNaduandKarnataka use a large share of renewables in their power mix, JharkhandandChhattisgarharemostlydependentoncoal [6]. This means that where adoption of EVs in coal-heavy states would result in higher emissions, estimation of emissionsinstateswithcleanerfuelusewouldshowthemto haveloweremissionswhencomparedtopetrol/dieselICE vehicles, especially when compared to CNG-powered vehicles[6].
International Research Journal of Engineering and Technology (IRJET) e-ISSN: 2395-0056
Volume: 12 Issue: 05 | May 2025 www.irjet.net p-ISSN: 2395-0072
Thisstudyseekstobridgethisgapbyestimatingemissions on a state level and stratifying the analysis per vehicle segment (Four Wheelers: SEDANS and SUVs; Heavy Wheelers:MINITRUCKSandTRUCKS;ThreeWheelers;and TwoWheelers:MopedsandBikes)withintentiontodefine targetstatesforEVadoption[2],[3].
2.1
The vehicles were categorized into four segments: Four Wheelers, Heavy Wheelers, Three Wheelers, and Two Wheelers. Data on the most popular vehicles for each segment,includingtheirmileage(inkm/liter),wascollected from official manufacturer websites and automotive platforms [1], [2], [3]. Fuel types considered were Petrol, Diesel, and CNG. Emission factors (in kg CO₂/liter) were obtainedfromtheGujaratCarbonFootprintCalculator.
Theemissionperkilometerforeachvehiclewascalculated as:

ComputetheemissionperkWhforeachstate:
eq (iii)
CalculateemissionperkmforEVs:

eq(iv)
Pythonscriptsautomated:
Efficiencycalculationsforallvehiclesinasegment [5].
Averaging emissions per km for each segment acrossstates.
2.4 Comparison
2.4.1 Histogram Analysis

= eq(i)
ThePythonscriptautomatedthefollowingtasks:
Parsing mileage data for multiple vehicles and averagingacrossfueltypes[5].
Computingemissionperkmforindividualvehicles.
Generatingasummarytablewithaveragesegmentwiseemissions.
2.3.1
Dataontherange(inkilometers)andbatterycapacity(in kWh) of EVs was collected for each segment. Sources included manufacturer websites and platforms such as ZigwheelsandSwitchMobility[6],[7].
2.3.2
Theefficiency(inkm/kWh)foreachvehiclewascalculated as:

Pythonscriptswereusedto:
eq(ii)
Process state-wise electricity generation and emissiondatafromICEDNITIAayog[8],[9].
Histograms were generated using Python’s visualization libraries (e.g., Matplotlib, Seaborn) to compare emissions across states for different fuel types (Petrol, Diesel, CNG, Electricity)andvehiclesegments[5].
2.4.2 Segment-Specific
Python’sdataanalysiscapabilitiesenabled:
Identification of state-specific trends in emissions [10].
Segment-wisevisualizationforvehicleslikeSedans, SUVs,andTrucks.
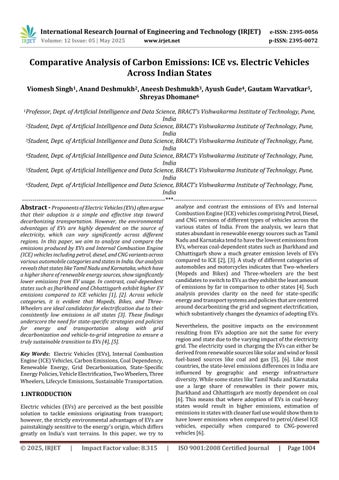
This section compares the carbon emissions of Electric Vehicles (EVs) and Internal Combustion Engine (ICE) vehiclesacrossdifferentIndianstates,withabreakdownby vehicletype.Theanalysisincludesgraphstoillustratethe trends, highlighting states like Goa and Kerala that show zeroorminimalemissionsduetoimportedelectricity.Any associated error margins or potential biases have been acknowledgedandareaddressedinaseparatesectionlater inthispaper[9].
Tomakethedatamorereadableandeasiertointerpret,the largecompositegraphsgeneratedforeachvehiclecategory were divided into smaller, focused subgroups (Group 1, Group2,andGroup3).Thisgroupingapproachwasusedto ensure that comparisons between states and fuel types remainvisuallyclearandreadable,especiallygiventhelarge number of data points across various Indian states. Each
International Research Journal of Engineering and Technology (IRJET) e-ISSN: 2395-0056
Volume: 12 Issue: 05 | May 2025 www.irjet.net p-ISSN: 2395-0072
group highlights a specific subset of states, allowing for a moredetailedexamination andinterpretationofemission trendswithoutoverwhelmingthereader.Thegraphswere created using Python visualization libraries such as MatplotlibandSeaborn.
3.1.1
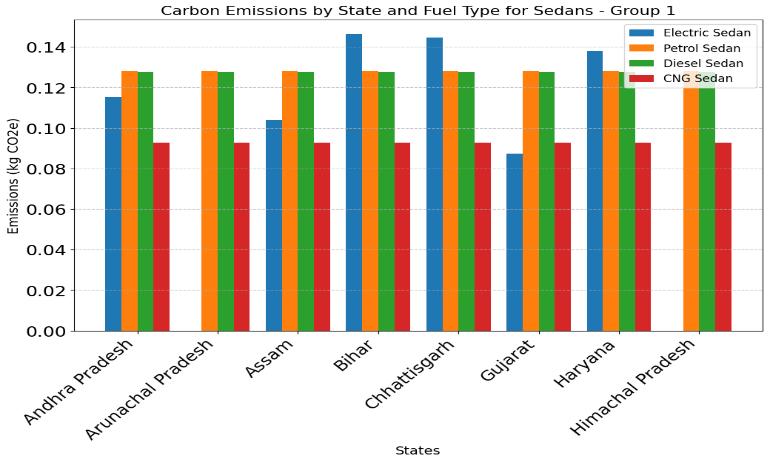
The emissions from Sedans highlight a clear distinction betweenEVsandICEvehicles:
EV Sedans: StateslikeTamilNaduandKarnataka, powered by renewable energy, have the lowest emissions (~0.08 kg CO₂e/km). In contrast, coalreliant states like Jharkhand and Chhattisgarh exhibithigheremissions(~0.14kgCO₂e/km)[11].
ICE Sedans: Petrol, Diesel, and CNG emissions remainconstantacrossstatesduetouniformfuelbased emission factors. Petrol and Diesel Sedans produce~0.12–0.15kgCO₂e/km,whileCNGSedans haveslightlyloweremissions(~0.11kgCO₂e/km) [1].
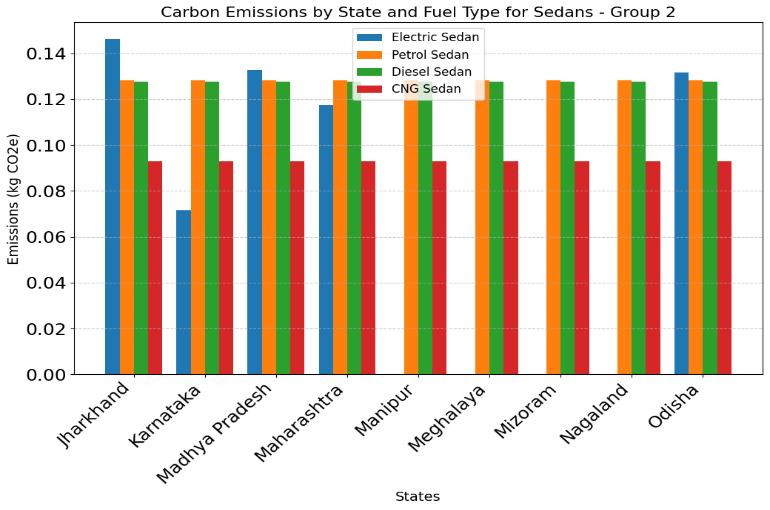
CarbonEmissionsbyStateandFuelTypefor
–Group3
Insight: EV Sedans outperform ICE Sedans in renewable-richstateslikeTamilNadu,butincoaldependent states like Jharkhand, their emissions oftenexceedthoseofCNGSedan.
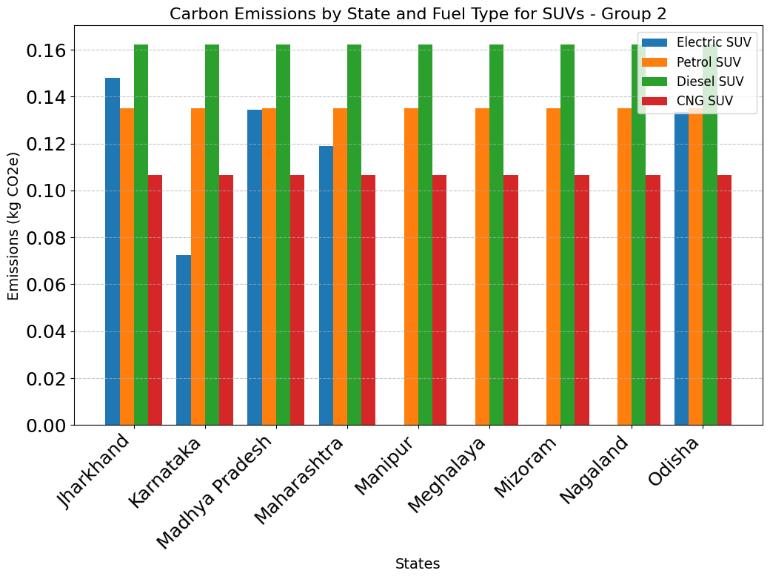
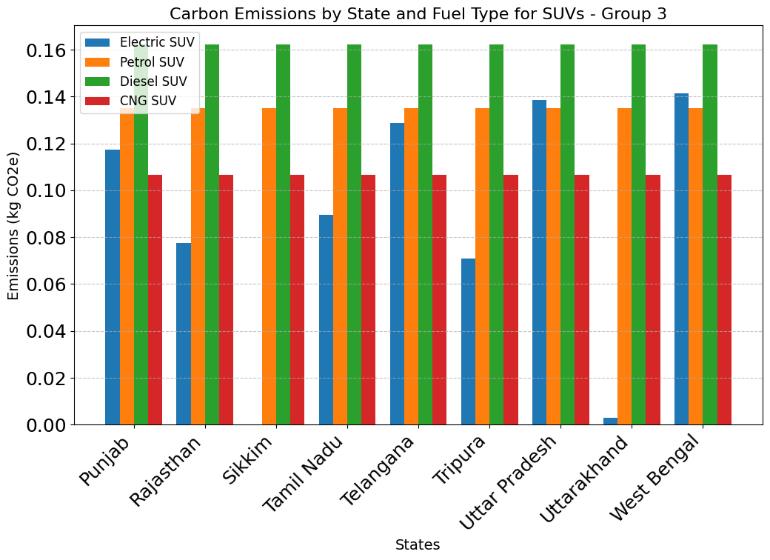
SimilartrendswereobservedforSUVs:
EV SUVs:Lowestemissionswererecordedinstates like Himachal Pradesh and Tamil Nadu (~0.08 kg CO₂e/km).Coal-dependentstatesshowedemissions ashighas0.16kgCO₂e/km,makingEVSUVsless advantageousinthoseregions[12].
ICE SUVs: Diesel SUVs consistently exhibited the highestemissions(~0.15kgCO₂e/km),followedby PetrolandCNGSUVs(~0.12–0.14kgCO₂e/km)[1].
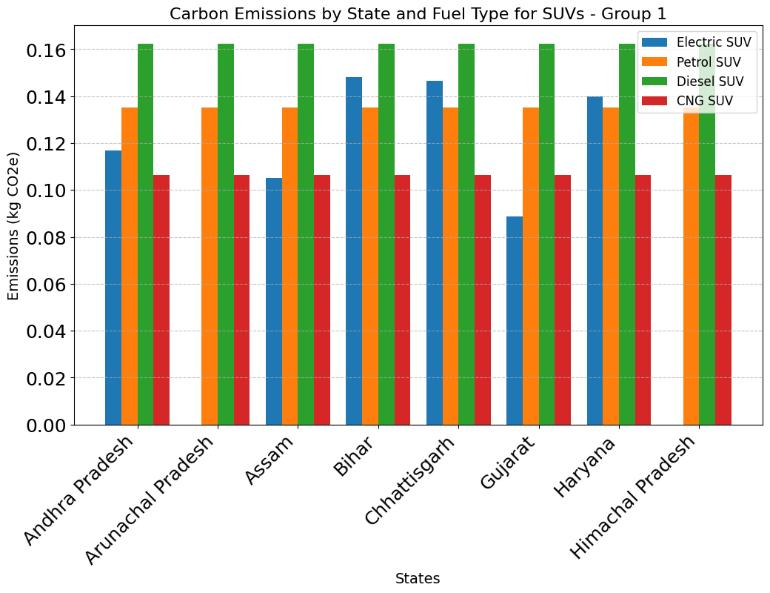
Fig-4: CarbonEmissionsbyStateandFuelTypeforSUVs–Group1
International Research Journal of Engineering and Technology (IRJET) e-ISSN: 2395-0056
Volume: 12 Issue: 05 | May 2025 www.irjet.net p-ISSN: 2395-0072
Fuel
Insight: EV SUVs are the cleanest option in renewable-energystateslikeHimachalPradesh,but incoal-dependentstates,theiremissionscanexceed thoseofCNGandPetrolSUVs.
3.2 Heavy Wheelers
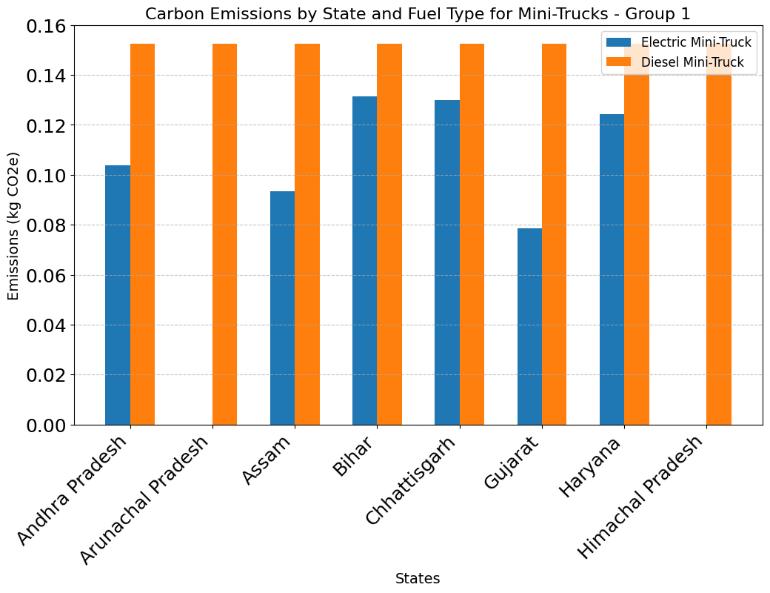
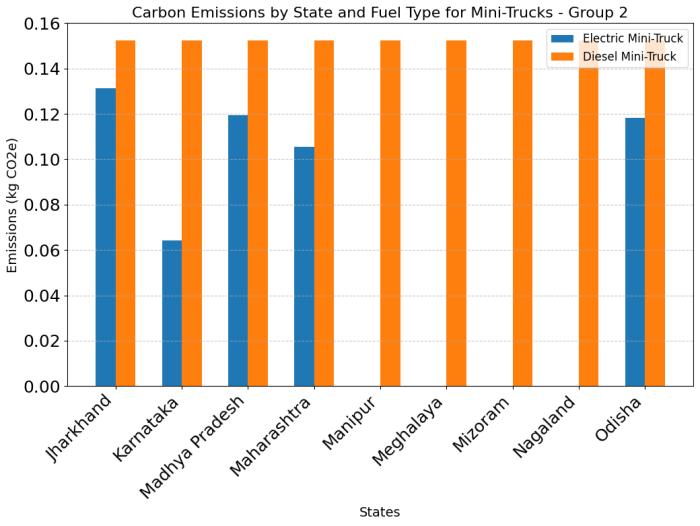
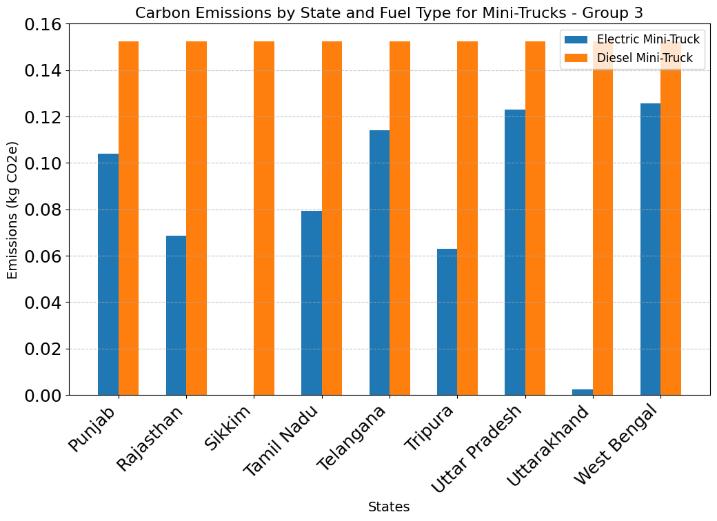
3.2.1 Mini Trucks
TheemissionsofMiniTruckshighlightthesuitabilityofEVs inrenewable-energy-dominatedstates:
EV Mini Trucks: Emissionsvariedfrom0.06–0.12 kg CO₂e/km depending on the state’s energy mix [11].
Diesel Mini Trucks: Emissionswereconsistently highat~0.15kgCO₂e/kmacrossallstates[1].
International Research Journal of Engineering and Technology (IRJET) e-ISSN: 2395-0056
Volume: 12 Issue: 05 | May 2025 www.irjet.net p-ISSN: 2395-0072
Insight: Electric Mini Trucks outperform Diesel Mini Trucks in renewable-heavy states, with emissions as low as 0.06 kg CO₂e/km, but show comparableemissionsincoal-reliantstates.
Truckemissionsshowedhighdisparityduetodifferencesin mileageestimationmethodologies[5],[10]:
EV Trucks: Emissions ranged from 0.5–0.7 kg CO₂e/kminrenewable-heavystates.Thismileage estimation was based on engine testing during manufacturing, which may not reflect real-world performance.
Diesel Trucks: Emissions wereconsistently~0.4 kgCO₂e/kmacrossstatesduetomorerealistic,inusemileagetesting.
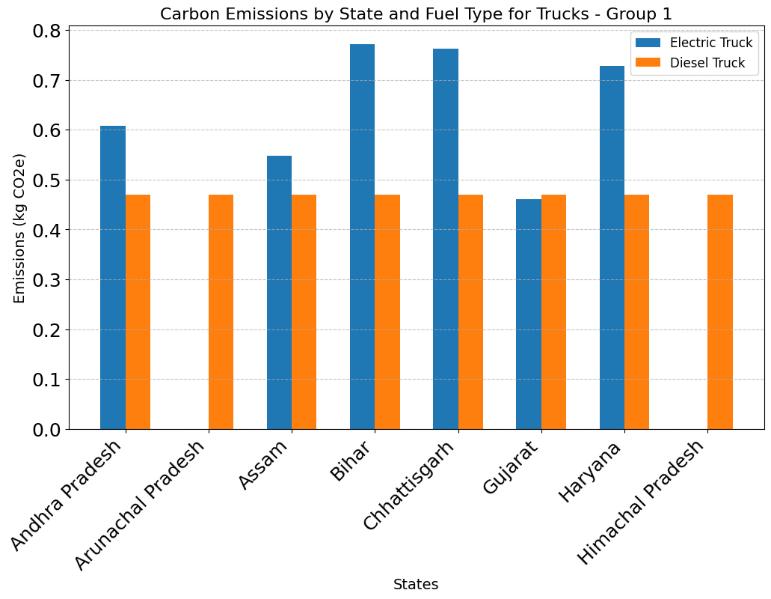
Fig-10: CarbonEmissionsbyStateandFuelTypefor Trucks–Group1
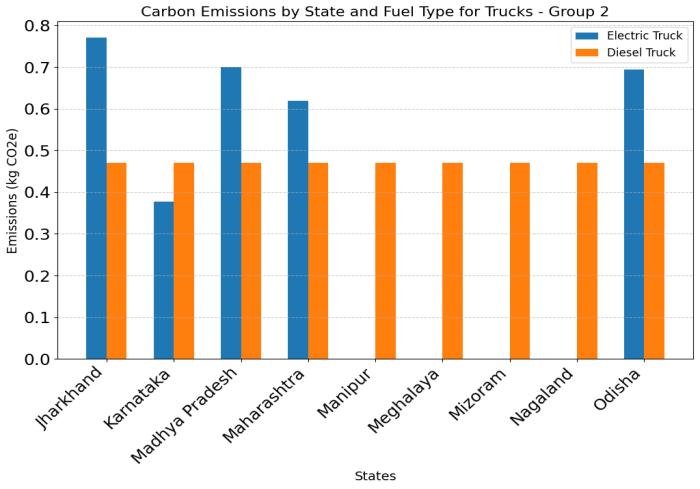
Fig-11: CarbonEmissionsbyStateandFuelTypefor Trucks–Group2
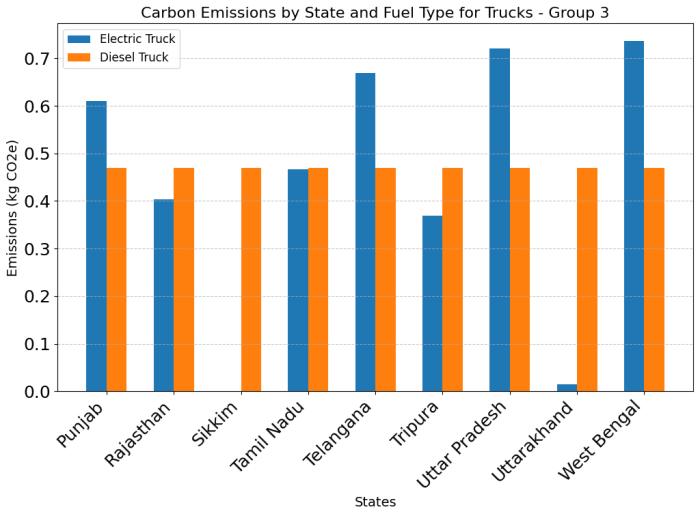
Fig-12: CarbonEmissionsbyStateandFuelTypefor Trucks–Group3
Insights: EV Trucks have the potential to outperformDieselTrucksintermsofemissions,but standardized mileage testing is needed to ensure faircomparisons.
Three Wheelers demonstrated a clear advantage for electrification:
EV Three Wheelers: Emissionsweresignificantly lower,rangingfrom0.04kgCO₂e/kminrenewableheavy states to 0.06 kg CO₂e/km in coal-reliant states[11].
Diesel and CNG Three Wheelers: Emissions remained constant across states (~0.08–0.09 kg CO₂e/km)[1].
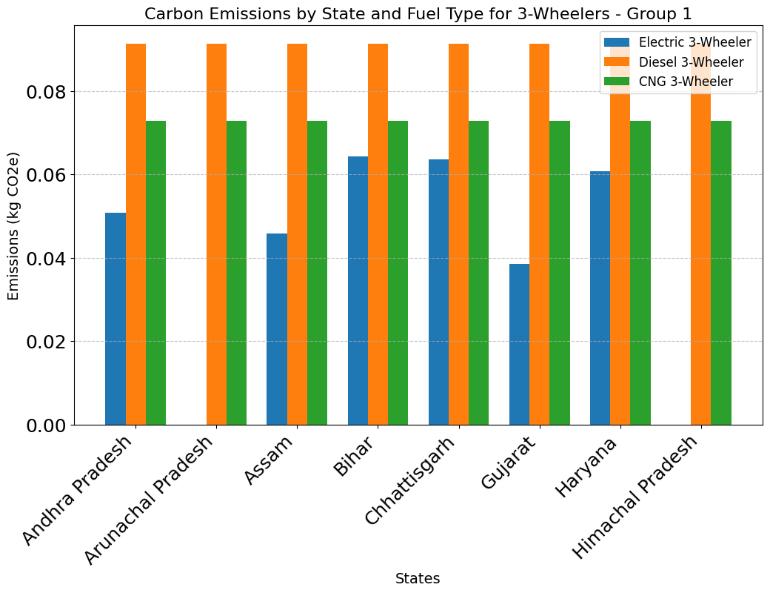
Fig-13 CarbonEmissionsbyStateandFuelTypeforThree Wheelers–Group1
International Research Journal of Engineering and Technology (IRJET) e-ISSN: 2395-0056
Volume: 12 Issue: 05 | May 2025 www.irjet.net p-ISSN: 2395-0072
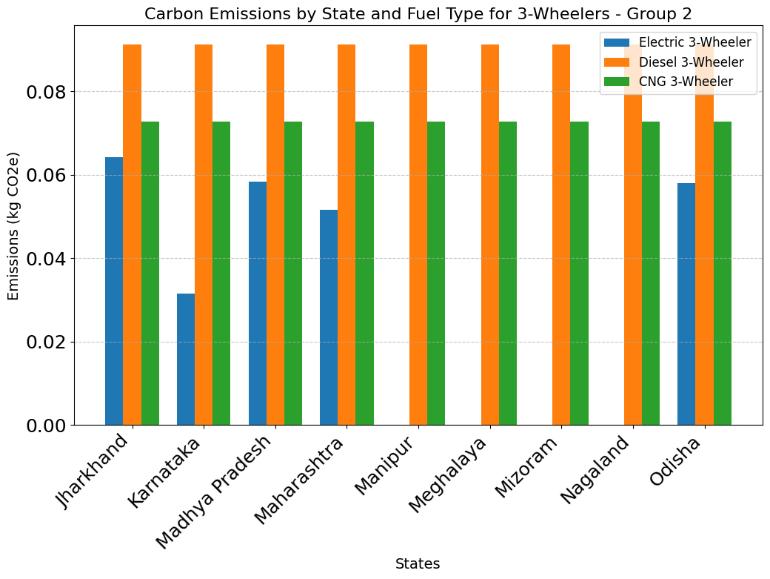
CarbonEmissionsbyStateandFuelTypefor ThreeWheelers–Group2
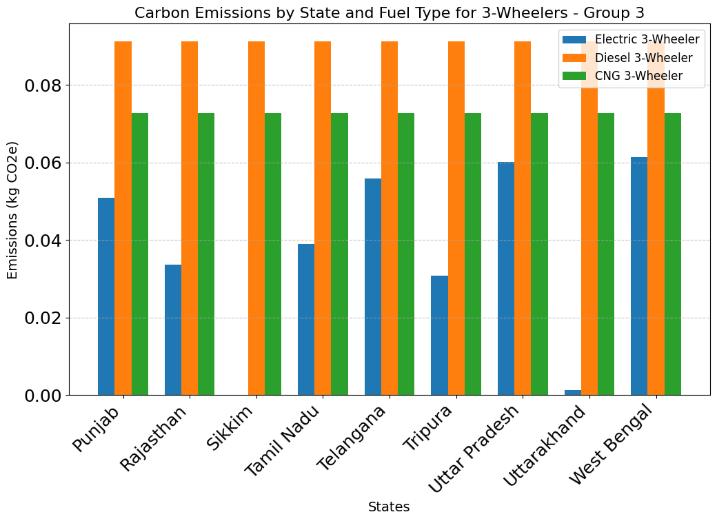
Fig-15:CarbonEmissionsbyStateandFuelTypefor ThreeWheelers–Group3
Insights:EVThreeWheelersarethemostviable segment for electrification, offering consistent emissionreductionsacrossallstates.
3.4 Two Wheelers
3.4.1 Mopeds
ElectricMopedsconsistentlyoutperformedPetrolMopeds:
EV Mopeds: Emissions were lowest in states like Tamil Nadu and Karnataka (~0.01–0.03 kg CO₂e/km)[11].
Petrol Mopeds: Emissionswereconsistentlyhigher at~0.05kgCO₂e/kmacrossstates[1].
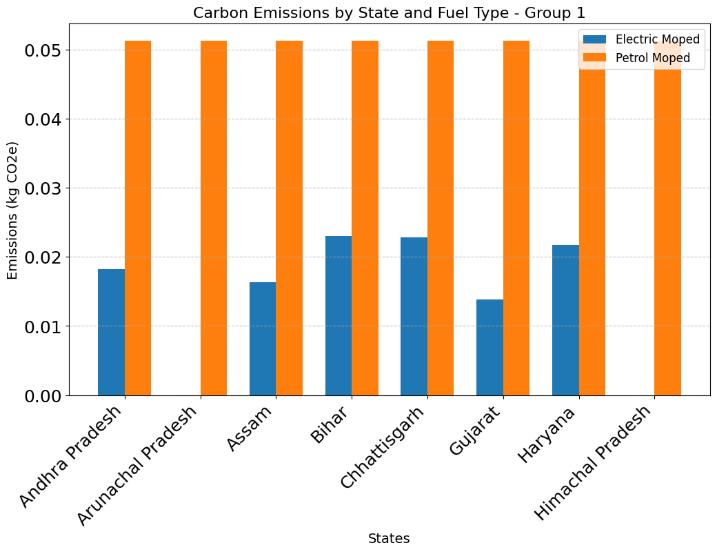
CarbonEmissionsbyStateandFuelTypefor Mopeds–Group1
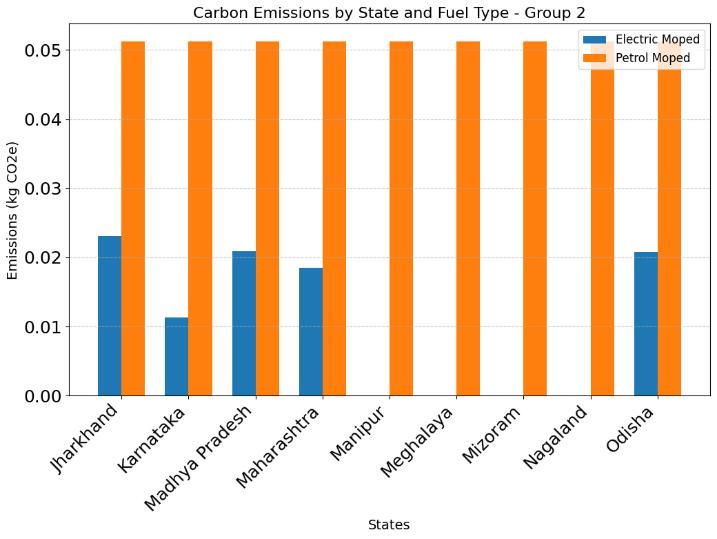
Fig-17: CarbonEmissionsbyStateandFuelTypefor Mopeds–Group2
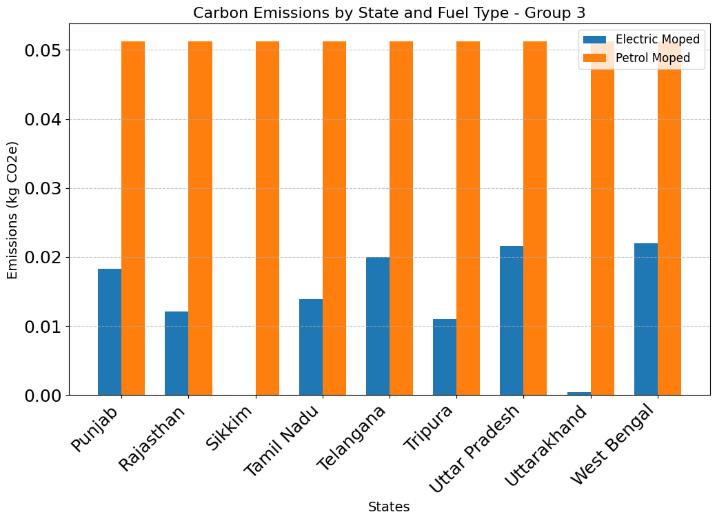
Fig-18: CarbonEmissionsbyStateandFuelTypefor Mopeds–Group3
International Research Journal of Engineering and Technology (IRJET) e-ISSN: 2395-0056
Volume: 12 Issue: 05 | May 2025 www.irjet.net p-ISSN: 2395-0072
Insight: ElectricMopedsoutperformPetrolMopeds acrossallstates,withemissionsaslowas0.01–0.03 kgCO₂e/kminrenewable-heavyregionslikeTamil NaduandKarnataka.
BikesfollowedsimilartrendsasMopeds:
EV Bikes: Emissions ranged from 0.01–0.03 kg CO₂e/kminrenewable-energystates,withslightly highervaluesincoal-dependentstates.
Petrol Bikes: Emissions remained constant at ~0.05kgCO₂e/kmacrossstates.
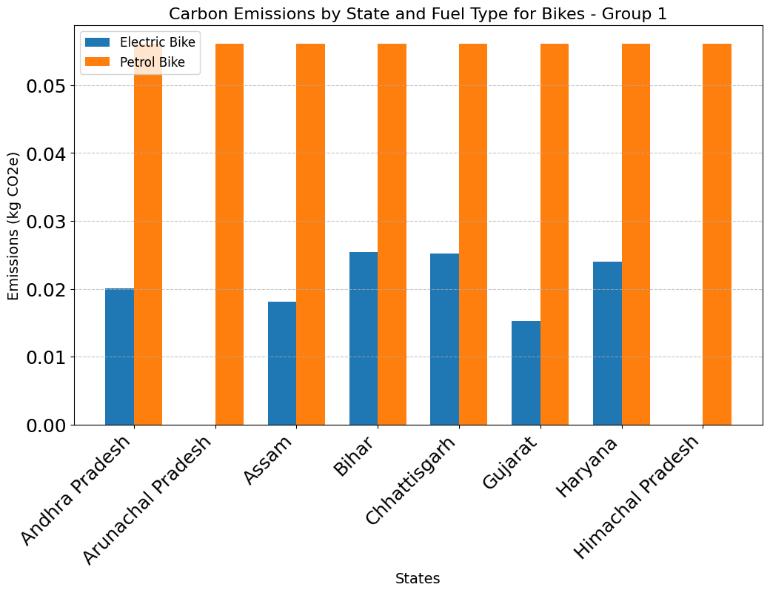
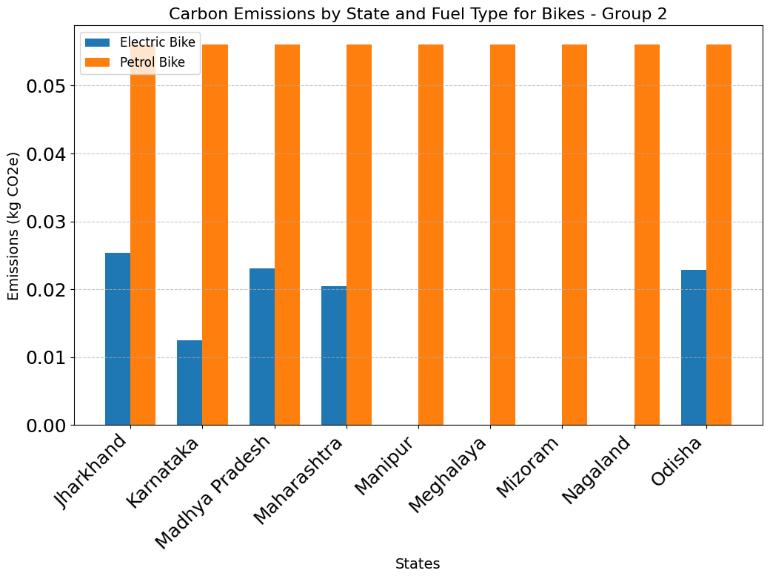
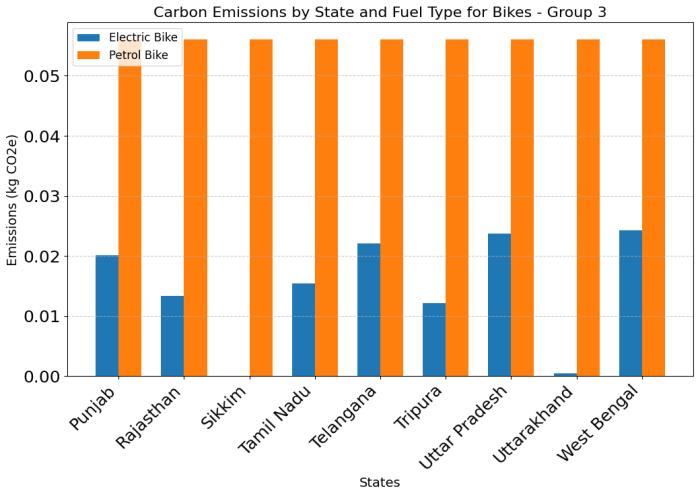
Insights:ElectricTwoWheelers,includingMopeds andBikes,offersubstantialemissionreductionsand arehighlyrecommendedforwidespreadadoption.
Thedataandinformationusedinthisresearchisgathered and derived from a combination of manufacturer specifications, state-level electricity grid emissions, and various real-world data sources. It is important to acknowledgeandconsiderthepotential biasesanderrors thatmayexistwithinthesedatasets:
1. Vehicle Performance and Efficiency Data:
Overestimation in Controlled Tests: Mileage reported by manufactures is often based on ideal conditions, which can lead to overestimated realworldefficiencybyabout10–30%[3].
Incomplete Vehicle Information: Missing or inconsistent efficiency/range values in certain vehiclecategoriesmayskewemissionsestimates[3].
ExtremeEVConsumptionOutliers:Certainelectric vehicles (EVs) display unusually high energy consumption per kilometer, potentially skewing averageresultsfortheirsegment[3].
Variability in ICE Mileage: The fuel efficiency of internalcombustionengine(ICE)vehiclescanvary and depend on factors like maintenance, usage patterns, and fuel quality, resulting in overall deviationsofupto20%[3].
BatteryDegradationImpact:Overtime,EVbatteries losecapacity,whichcanincreasereal-worldenergy consumption by 5–15%, it is a huge factor that is oftenoverlooked[4].
Fluctuations in Grid Emissions: Relying solely on staticstate-wisegridemissionsfailstoaccountfor seasonal and demand-related changes, leading to potential errors of 5–20% in estimating EV emissions[2].
International Research Journal of Engineering and Technology (IRJET) e-ISSN: 2395-0056
Volume: 12 Issue: 05 | May 2025 www.irjet.net p-ISSN: 2395-0072
AnnualGaps:Gapsinstaterecordscanimpacttrend accuracy for interpolation methods utilized, resultingindifferencesofroughly5–15%[2].
EmissionTrendChanges:Significantemissionsdue to new policy implementation or additions to infrastructurecanleadtoapproximateuncertainty of±10%[2].
ElectricityEmissionsfromImports:Certainstates, likeGoa,Delhi,andUttarakhand,donotaccountfor emissions associated with imported electricity, which can lead to an underestimation of total emissionsby10–20%[2].
Emission Estimates from Privates: Private and industrialemittersarenotcompletelycapturedin the report, which allows for a 5–10% underestimationofemissions[2].
Fixed Conversion Factors: Set standard emission rates ignore the differences in the quality of coal and the efficiency of the plants, which results in errorsbetween5–12%[4].
GridEmissionChangeVariations:Theassumption stationary mix fuel tends to disregard seasonal changesin the sourceof powerwhich canleadto differencesof5–15%inactualemissions[2].
3. Electricity Generation Data:
IncompleteRecords:Gapsinyearlydatafromsome states can lead to a 5-15% uncertainty within generationtrends[2].
Substitution from Other Sources: Seasonal and policychangesinenergysourcescauseavariation of10%intheannualmixestimates[5].
Skipped Grid Losses: Reduction in power generation due to transmission losses being ignoredwillresultinanunderestimationofpower useby5-12%[2].
Overvalued Renewables: States overreporting generationoutputwhenthewindturnstosolar, causestheactualgenerationtodropby10-20% duetotheweatherandmaintenance[5].
Thermal Inefficiency Gaps: Blame it on aged coal plants in some states, with their outdatedness causingtheplantstoincreaseemissionby5-15% morethanthestandardestimates[4].
OmittedPowerSurrounding:Emissionscausedby electricitycomingfromborderingstatesaretaken for granted resulting in underestimate of Delhi andGoa’simpactbyashocking10-25%[2].
4. Emission Factors Data:
Absence of Data: Various states not having the completerecordforCO₂ leadstoa staggering1030%inaccuracywithinestimations[4].
Methodologies Cut Out: Discrepancies appearing betweenestimatesandcalculationswouldleadto
statesrecordsemissionrangesanywherebetween 5-15%[4].
Fixed Assumption Factors: Standard emission factors fail and ignore fuel and plant differences bringingupaconsiderable5-12%[4].
Ignored Carbon Cuts: Emissions unaccounted for reforestation or renewable credits causes net emissionsbeingoverestimatedbyaridiculous1020%[5].
Imported Emissions Excluded: States like Kerala and Goa omit emissions from imported power, underreportingby10–25%[2].
TheemissionsforgridelectricityinstatessuchasGoaand Kerala, where energy imports were recorded, was a zero value[2].Therefore,thesestatescouldnotbeincludedinthe analysis.Withnotrustworthygovernmentorauthoritative sourcesforelectricityimportemissionfactors,thesestates wereomittedfromthecomparisonofemissionsprocesses.
1. FactorstoConsiderforEachState:Themake-upofthe power grid determines the emission profile of an electric vehicle. States rich in renewables like Tamil Nadu, Karnataka, and Himachal Pradesh are very supportive of EVs, while coal-dependent states of JharkhandandChhattisgarhhaveEVswhicharemore carbonemittingbecauseofcoalpoweredelectricity[1], [2],[5].
2. SegmentFeasibility:TwoWheelersandThreeWheelers arethemostpromisingcandidatesforelectrificationin allregionssincetheyhaveloweremissionsthantheir internalcombustionengine(ICE)counterpartsevenin regionsthatrelyoncoal[3].
Dependence on Coal: In coal dominant regions, electric trucks,particularlytheheaviervehicles,havethepotentialto emitmoreCO₂ethanCNGorDiesel-burningtrucks,whichis notthecaseinotherregions.Therefore,theenvironmental advantage of EVs is masked. Pairing electrification with reductions of emissions from fossil fuel power plants is necessaryfortruesustainability[4],[5].
Arobustfoundationislaidbythefindingsofthisresearch, whichrepresentsmuchofthemainstreamunderstanding. This paper emphasizes that all concepts of state-specific energypoliciesshouldbeintegratedwiththeelectrification ofthetransportsector[5],[6].Theenvironmentalbenefitsof ElectricVehicles(EVs)canbedemonstratedinstatesrichin renewableenergy,butsignificantchallengesremaininstates dependentoncoal[6].Furtherresearchcouldfocusonthe following:
International Research Journal of Engineering and Technology (IRJET) e-ISSN: 2395-0056
Volume: 12 Issue: 05 | May 2025 www.irjet.net p-ISSN: 2395-0072
Encouragetheincorporationofrenewableenergyinstates where coal plays a dominant role in the energy mix to minimize emissions related to electricity production. This wouldenhancethesustainabilityofelectricmobilityacross the entire country [9]. It can also be supported by decentralizedrenewableenergysolutions,whereinelectric vehicle charging is powered by solar energy, thereby reducingrelianceoncoal-generatedelectricity[9],[13].
Developstate-specificincentivesthathelpdevelopelectric vehicle infrastructure, based on the advance of electric vehicleadoptioninstateswithsignificantrenewableenergy usage [5], [6]. In the interim, also promote the use of compressed natural gas (CNG) vehicles in coal-dependent regionsasacleaneralternativetotraditionalfuels[6].Offer state-specific incentives for the integration of renewable energy to further foster the development of EV infrastructure[9].
Broaden the scope of the study to include a complete lifecycle assessment of EVs and ICE vehicles, considering impactsfrombatterymanufacturing,recycling,anddisposal [4],[10].Explorealternativebatterytechnologiesthathave lowerenvironmental impactsandaremoresustainable in thelongterm[10].
Developstandardizedtestingproceduresforevaluatingthe real-worldrangeandenergyconsumptionofelectricheavyduty vehicles, especially trucks, to enable reliable comparisonswithinternalcombustionenginevehicles[11].
4.5. Incorporation of Imported Electricity Emissions:
Theanalysisofelectricityimportemissionsshouldbecomea part of future assessments for electricity-deficient states suchasGoaandKerala.Acomprehensiveevaluationarises fromassessingboththesourcesofimportedpowerandtheir associatedemissionfactors[2],[6].
4.6.
Advancedtechnologiesinanalysisandmachinelearningare usedtopredicttheadoptionofelectricvehiclesindifferent Indianstates,andsimultaneouslyassesstheenvironmental impact under different network configurations [14] [15]. Using a decarbonization impact model, we efficiently determine areas that require political intervention by examiningvehicle-relatedemissions[9][12].
Investigate alternative fuel options such as hydrogen fuel cells,especiallyinregionsandsectorswhereEVsmayfailto reduce emissions due to coal-based electricity generation [5].ResearchonhybridsolutionslikePlug-inHybridElectric Vehicles(PHEVs)shouldalsobeencouragedasshort-term, transitionaltechnologies[10].
Directingfutureresearchtowardtheseareaswillsupporta smoothertransitiontosustainabletransportationsystems.It willensurethattheimplementationofEVsalignswitheach state'senergyprofileandenvironmentaltargets[5],[6].
Vehicleemissionsarehighlycontingentonthecomposition oftheenergygrid,so thisresearchemphasizestheneedfor state-specificstrategiesasAmericansadoptElectricVehicles (EVs). EVs have a significant environmental advantage in renewable power-rich states like Tamil Nadu, Karnataka andHimachalPradesh.Whilethesebenefitsaresubstantial, they are much lower in coal-producing states such as Jharkhand and Chhattisgarh due to the relatively higher emissionsfromcoal-based electricitygeneration[1],[2],[5].
Further, the results all point to the conclusion that electrification in the transport sector is definitively not a one-size-fits-all solution for emission reduction. In coalheavy regions, ICE vehicles fueled by cleaner fuels (CNG etc.)mayemitlessthanEVsinthenearfuture[6].Amongall vehiclecategories,Two-Wheelers(MopedsandBikes)and Three-Wheelers appear to be the most suitable for electrification, consistently delivering lower emissions acrossallIndianstates[3],[4].
The research indicates that moving towards sustainable transportationnecessitatesanall-encompassingapproach, whichincludes:
1. Decarbonizingthegridbyinvestinginrenewableenergy sources.
2. Implementing state-specific policies that foster EV adoptioninareaswithcleanerenergywhileadvocating forinternalcombustionenginealternativesinregions reliantoncoal.
3. Emphasizing the needtostandardizetesting methods andconductlifecycleemissionsevaluationstoguarantee precisecomparisons[6],[12],[14].
Byintegratingenergyandtransportationpolicies,Indiahas thepotentialtoattainamoreequitableandenvironmentally friendly strategy for vehicle electrification, guaranteeing enduringadvantagesforboththeenvironmentandsociety.
International Research Journal of Engineering and Technology (IRJET) e-ISSN: 2395-0056
Volume: 12 Issue: 05 | May 2025 www.irjet.net p-ISSN: 2395-0072
[1]GujaratClimateChangeDepartment,"CarbonFootprint Calculator." [Online]. Available: https://ccd.gujarat.gov.in/carbon-footprint-calculator.htm.
[2] ICED NITI Aayog, "Power Generation Emissions." [Online]. Available: https://iced.niti.gov.in/energy/electricity/generation/coemission
[3] ICED NITI Aayog, "Power Generation Data." [Online]. Available: https://iced.niti.gov.in/energy/electricity/generation/powe r-generation
[4] BikeDekho, "Two Wheelers (EV)." [Online]. Available: https://www.bikedekho.com/electric-bikes.
[5] BikeDekho, "Two Wheelers (ICE)." [Online]. Available: https://www.bikedekho.com
[6] Zigwheels, "Four Wheelers (EV)." [Online]. Available: https://www.zigwheels.com/newcars/electric-cars
[7] CarDekho, "Four Wheelers (ICE)." [Online]. Available: https://www.cardekho.com
[8] Olectra Greentech Ltd, "Heavy Vehicles (EV)." [Online]. Available:https://olectra.com/.
[9] Switch Mobility, "Heavy Vehicles (EV)." [Online]. Available:https://www.switchmobilityev.com
[10] CarDekho, "Heavy Vehicles (ICE)." [Online]. Available: https://trucks.cardekho.com/
[11]GovernmentofIndia,"EnergyStatistics2022:Electricity Emissions."[Online].Available:https://mospi.nic.in/
[12] International Energy Agency (IEA), "Lifecycle AssessmentStandardsforEVBatteries."[Online].Available: https://www.iea.org/
[13]InternationalRenewableEnergyAgency(IRENA),"Grid Decarbonization Strategies in Emerging Economies." [Online].Available:https://www.irena.org/
[14] WorldResourcesInstitute(WRI),"The RoleofElectric Vehicles in Decarbonizing Transportation." [Online]. Available:https://www.wri.org/.
[15]JournalofCleanerProduction,"PredictiveAnalyticsfor State-Level EV Adoption," 2021. [Online]. Available: https://www.sciencedirect.com/journal/journal-of-cleanerproduction
[16]AppliedEnergy,"SimulatingRenewableEnergyImpacts on Grid Efficiency," 2022. [Online]. Available: https://www.sciencedirect.com/journal/applied-energy
[17] G. Bieker, "Life-Cycle Greenhouse Gas Emissions of Combustion Engine and Electric Passenger Cars and TwoWheelers in India," International Council on Clean Transportation (ICCT), 2021. [Online]. Available: https://theicct.org/
[18] A. Yadav, A. O’Connell, and N. Pavlenko, "A Comparison of Life-Cycle Greenhouse Gas Emissions from Combustion and Electric Heavy-Duty Vehicles in India," International Council on Clean Transportation (ICCT), 2024. [Online]. Available:https://theicct.org/.
[19] A. Sen, J. Miller, A. Bandivadekar, M. Sharma, P. K. Nagar, D. Singh, and J. Callahan, "Understanding the Emissions Impacts of Large-Scale Vehicle Electrification in India," International Council on Clean Transportation (ICCT),2021.[Online].Available:https://theicct.org/