As summer transitions into fall, the third quarter on the Monterey Peninsula traditionally brings a dynamic blend of energy and anticipation Between the excitement of Monterey Car Week, the arrival of second-home buyers escaping the heat elsewhere, and the steady flow of visitors through Carmel-by-the-Sea, Pebble Beach, and the surrounding areas, Q3 often sets the tone for the year’s real estate narrative Historically, this is when momentum builds transaction activity strengthens, luxury buyers return to the market, and trends begin to shape the year’s closing chapters.
Overall, the market remained largely stable compared to both the previous quarter and Q3 2024 The average sales price, number of homes sold, and total volume each fluctuated by less than 5%, indicating a period of relative balance The most notable change was in Days on Market (DOM): Carmel-by-the-Sea, Greater Carmel, and Pebble Beach experienced a 45% increase, averaging 67 days, while Marina and Seaside saw a 35% rise, averaging 51 days a reflection of more deliberate and selective buyers across both ends of the market In contrast, mid-market neighborhoods recorded a 14% decrease in DOM, signaling sustained strength and steady demand in that segment
As we move into Q4, all eyes are on whether buyer activity will carry through to year’s end or if seasonal slowing will temper the steady pace seen across much of 2025
Despite the market’s steadiness, our team remains as active as ever We currently have three listings “coming soon” and seven active listings but we’re never too busy to connect Whether over coffee or a glass of wine, we’d love to catch up and hear how you’re doing!
All our best,
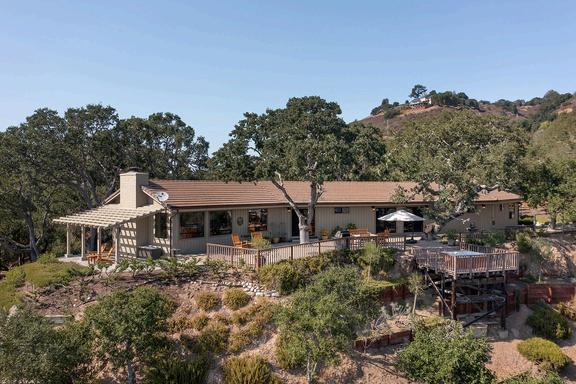
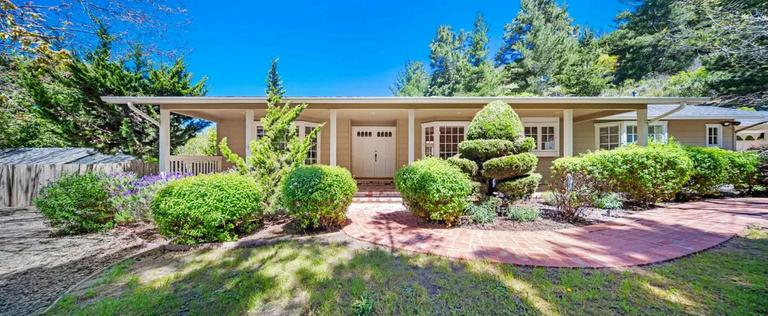
List Price: $2.4m
Representing Seller
In Escrow
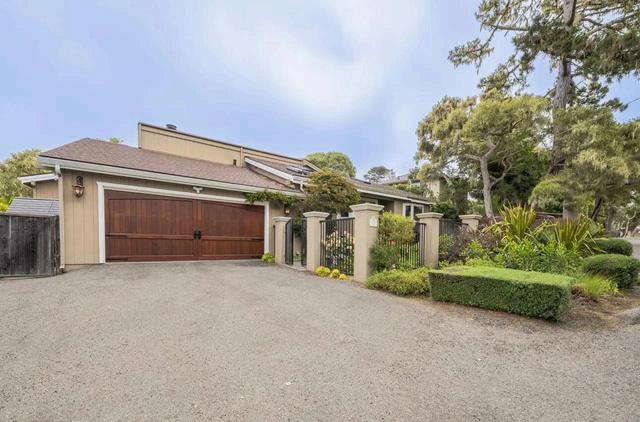
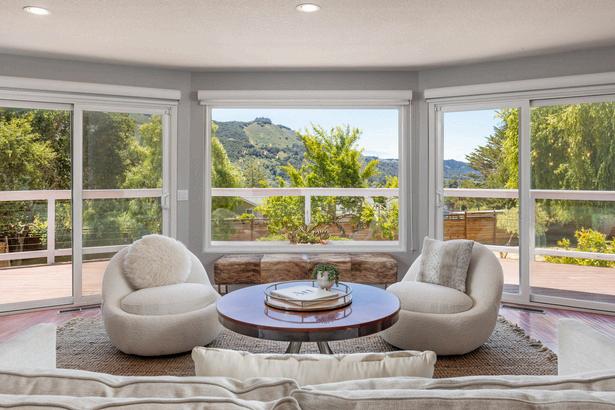
List Price: $3.0m
Representing Buyer
Just sold
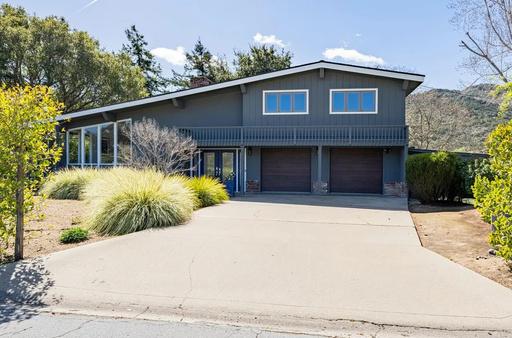
Represented Buyer Mid Valley, Carmel
Represented Buyer Mid Valley, Carmel
Represented Seller Mid Valley, Carmel
Represented Buyer & Seller Carmel Valley
TABLE OF CONTENTS
Carmel by the Sea
Greater Carmel
Carmel Valley
Pebble Beach
Monterey
Pacific Grove
Seaside
Marina
Corral & San Benancio
2 4 6 8 10 12 14 16 18
Carmel - by - the - Sea
Carmel-by-the-Sea saw 25 home sales in Q3, the most of 2025 and one more than last year’s strongest quarter The average sales price was $3.3M, down 20% from Q2 a decline largely due to a $17.5M sale last quarter that inflated the prior average. Excluding that outlier, prices dipped a modest 4%. Average days on market rose to 78, with 36% of homes spending over 100 days before going into escrow That’s 31 days longer than Q2, but similar to Q1 levels, reflecting a steadier market pace.
Year-over-year, the average sales price fell 12%, influenced by a $12.5M sale in Q3 2024, while days on market increased by 45 days, or 138%. Overall, Carmel-by-the-Sea will likely close 2025 slightly below last year’s total sales volume, signaling a more balanced and deliberate market environment.
Greater Carmel
The Greater Carmel area experienced a softer third quarter, with most key metrics trending downward compared to the previous quarter. There were 36 closed sales during Q3, down slightly from 39 in Q2. The average sales price dipped by nearly $600K, or 17%, influenced by the absence of two $10M+ sales that boosted last quarter’s numbers. Average days on market also extended notably, rising to 80 days marking the slowest pace since the first quarter of 2020.
S A L E S B Y S E G M E N T
Compared to the same time last year, most figures were a touch lower. Still, the number of sales rose by four year-over-year, showing continued buyer interest The average price was about $500K, or 15% lower than Q3 2023, and homes spent roughly 25 more days on the market.
Carmel Valley
Carmel Valley had a strong quarter with 20 sales the most since Q2 2022. While activity was up, the average sales price dipped about $350,000, or 16%, from last quarter, reflecting the absence of $5M+ transactions. Homes also sold faster, with days on market down ten days, landing at 65 the secondlowest since 2023
Year-over-year results were largely steady, with prices holding within 2% of Q3 2024 and two more homes sold than the same period last year. At 94%, the sale-to-list price ratio hit its lowest level on record, tying Greater Carmel, and ranking as the lowest of all markets monitored this quarter Overall, Carmel Valley remains a steady and resilient market, showing consistent demand and balanced conditions.
Pebble Beach
Pebble Beach had a standout quarter, recording two $10M+ sales the most since Q3 2023. Luxury activity surged, with 26% of all sales closing at $5M or more, up from just 10% last quarter As a result, the average sales price jumped $1.2M, or 33%, compared to Q2 2025. Overall sales activity remained strong, just one sale shy of last quarter, while total market volume climbed by $19M despite a modest slowdown to 44 days on market. Year-over-year comparisons underscore Pebble’s renewed strength. Total sales volume rose $37M from Q3 2024, and the average sales price increased by over $1.6M, or 53%, as days on market improved by nearly 40%. With another $10M+ sale pending early in Q4 and several contingent listings in play, Pebble appears to be regaining momentum after nearly three years of tempered activity. S A L E S B Y
Monterey
Monterey recorded 42 sales during the quarter, closely in line with 40 last quarter and 43 in Q3 2024. The average sales price held steady, rising just 1%, while the median price climbed 16% to a record $1.425M. Homes also sold faster, averaging 35 days on market seven fewer than the previous quarter.
Compared to the same period last year, results were slightly softer. The average sales price declined about $300K, or 16%, bringing total sales volume down roughly $14M, or 18%.
With buyer demand remaining strong and interest rates beginning to ease, Monterey is well-positioned for continued healthy activity heading into Q4.
Pacific Grove
Pacific Grove had a strong quarter, achieving its highest average sales price to date at $1.8M. With 30 homes sold three more than last quarter total sales volume climbed by over $9 million, or 21%. Days on market continued its steady decline, averaging 27 days, just one fewer than the previous quarter
Pacific Grove also stood out as the only market where more than half of all homes sold at or above list price, underscoring robust demand and pricing strength.
Compared to the same quarter in 2024, the average sales price rose by more than $130K, or 8%, even as transactions declined by nine, or 23%. Days on market improved by eight days, reflecting sustained buyer activity and ongoing market competitiveness.
Seaside
Seaside experienced a relatively steady quarter compared to Q2, with no change in the number of homes sold and a modest 3% decline in the average sales price. Days on market increased slightly, with homes spending an additional 11 days on average before selling. While the quarter did record one sale above $2 million and $1M+ transactions have become increasingly common in recent years the $600K–$800K price range remains the market’s core, representing 55% of all Q3 sales.
Year over year, Seaside showed little movement in overall activity, with the average sales price up 3% and two fewer homes sold compared to Q3 2024 However, days on market rose by 26 days, suggesting buyers are taking more time to make decisions amid stable pricing conditions. S
Marina
Marina had a strong third quarter, recording 37 home sales the highest so far in 2025. The average sales price reached its highest level of the year and second-highest on record, just over $1M. Days on market rose to 51, the longest since Q1 2024, driven by six homes that spent over 100 days on the market
Compared to the same quarter last year, Marina saw growth across nearly every metric: the average sales price rose 9%, with eight more homes sold, and total sales volume climbed by $11M up 40% year over year. The only exception was a 17-day increase in average days on market Inventory declined from 45 to 35 active listings by quarter’s end, signaling that buyer demand remains strong even as sales timelines lengthen.
Corral&San Benancio
The 93908 area code saw 26 home sales this quarter totaling $32M in volume with average sales price of $1.2M. Homes sold in an average of 34 days, reflecting a steady market pace.
Quarter over quarter, pricing was largely flat, with less than 1% change, while sales volume fell $13M or 29%, as 11 fewer homes sold. The days on market improved by eight days, or 18%, showing continued buyer engagement despite fewer overall sales. Year over year, the average sales price declined by $59K, or 4%, and sales volume was down $4M, or 11% with two fewer homes sold Still, days on market shortened by four days, indicating homes continue to move at a healthy pace relative to last year.