Carmel-by-the-Sea & Carmel Point ◆ Greater Carmel ◆ Carmel Valley ◆ Pebble Beach
Carmel Highlands, Big Sur & South Coast ◆ Pacific Grove ◆ Monterey & Del Rey Oaks
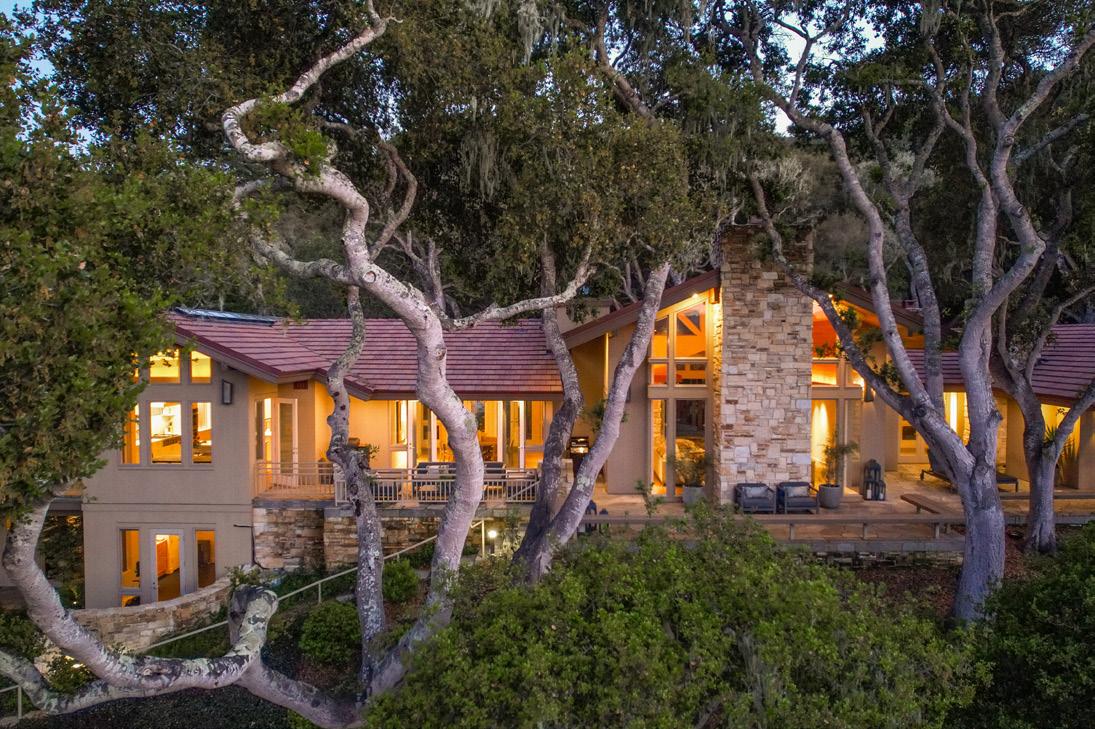
Featured Property
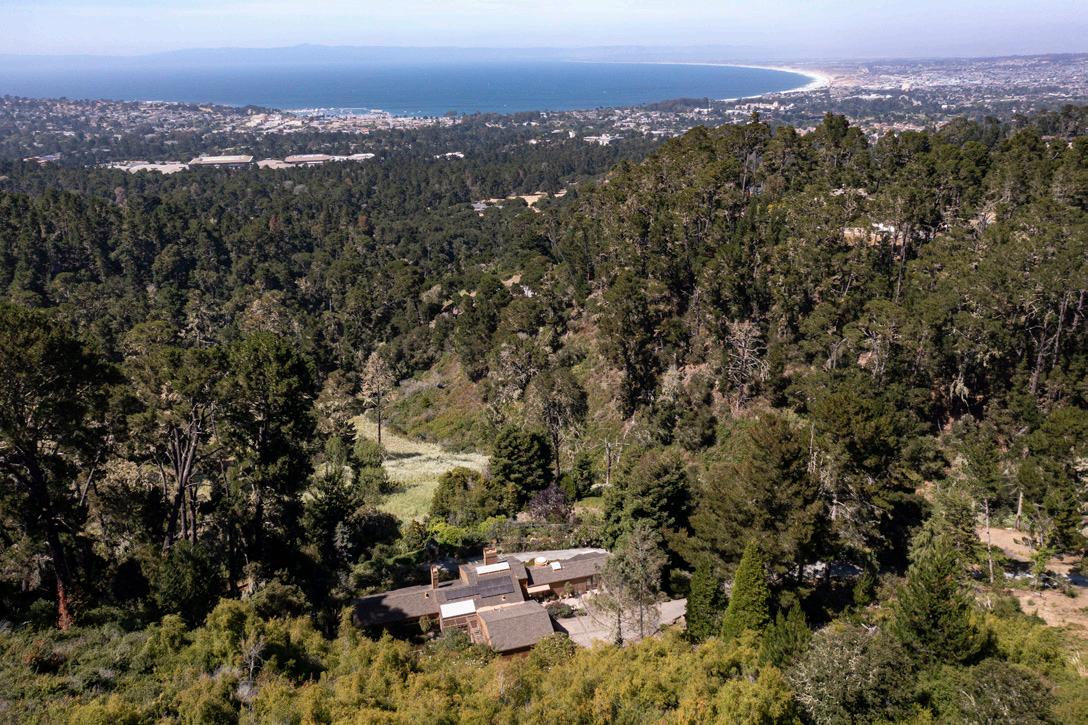
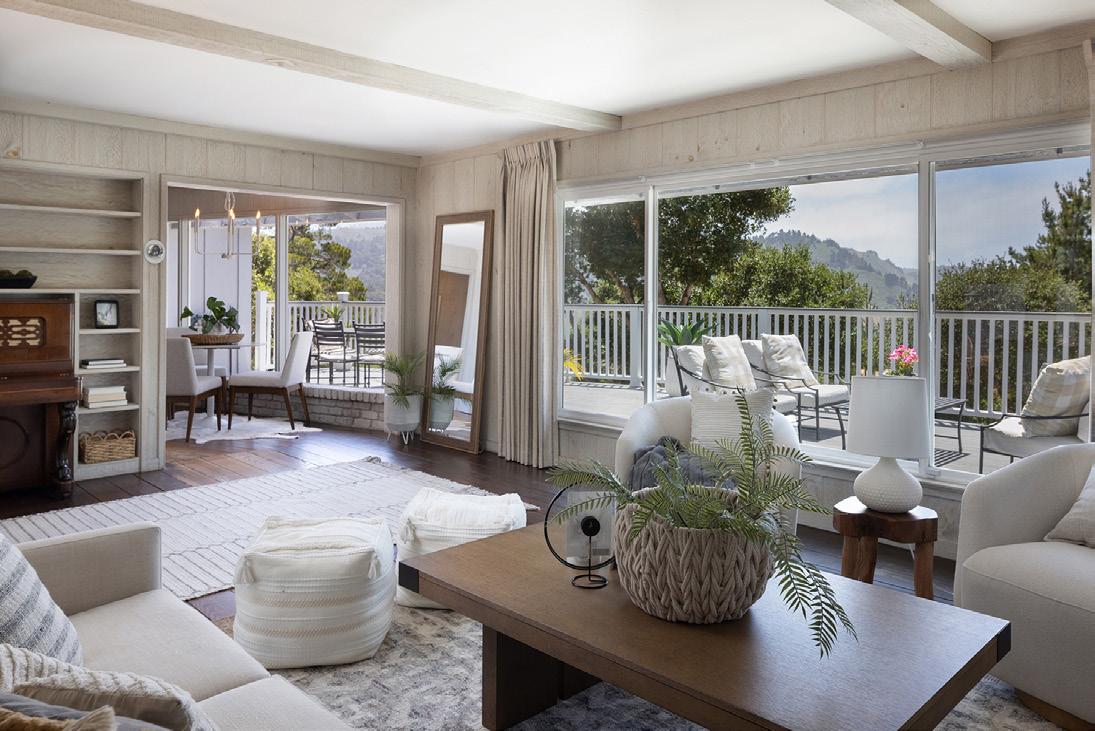
5466 Quail Way, Carmel
Carmel Valley Road, Carmel
Dear Friends,
The Monterey Peninsula real estate market remains healthy and has even shown slight improvement compared to 2024. Both prices and sales volume are up approximately 5%.
That said, we’re seeing a shift: inventory is increasing, homes are spending more time on the market, and buyers are becoming more selective. Well-priced, move-in-ready homes continue to sell, while properties that are priced aggressively or have unique complexities are facing more challenges.
As we move into the final quarter of the year, the market is beginning its typical transition into holiday mode, with buyer activity starting to taper off. This seasonal slowdown is expected and often presents a quieter, more strategic time for buyers and sellers alike.
If you have questions about your specific neighborhood or real estate goals, I’d love to connect. And above all, I hope the coming season brings you some well-deserved downtime with loved ones.
Warmest Wishes,
Market Update
Market Update
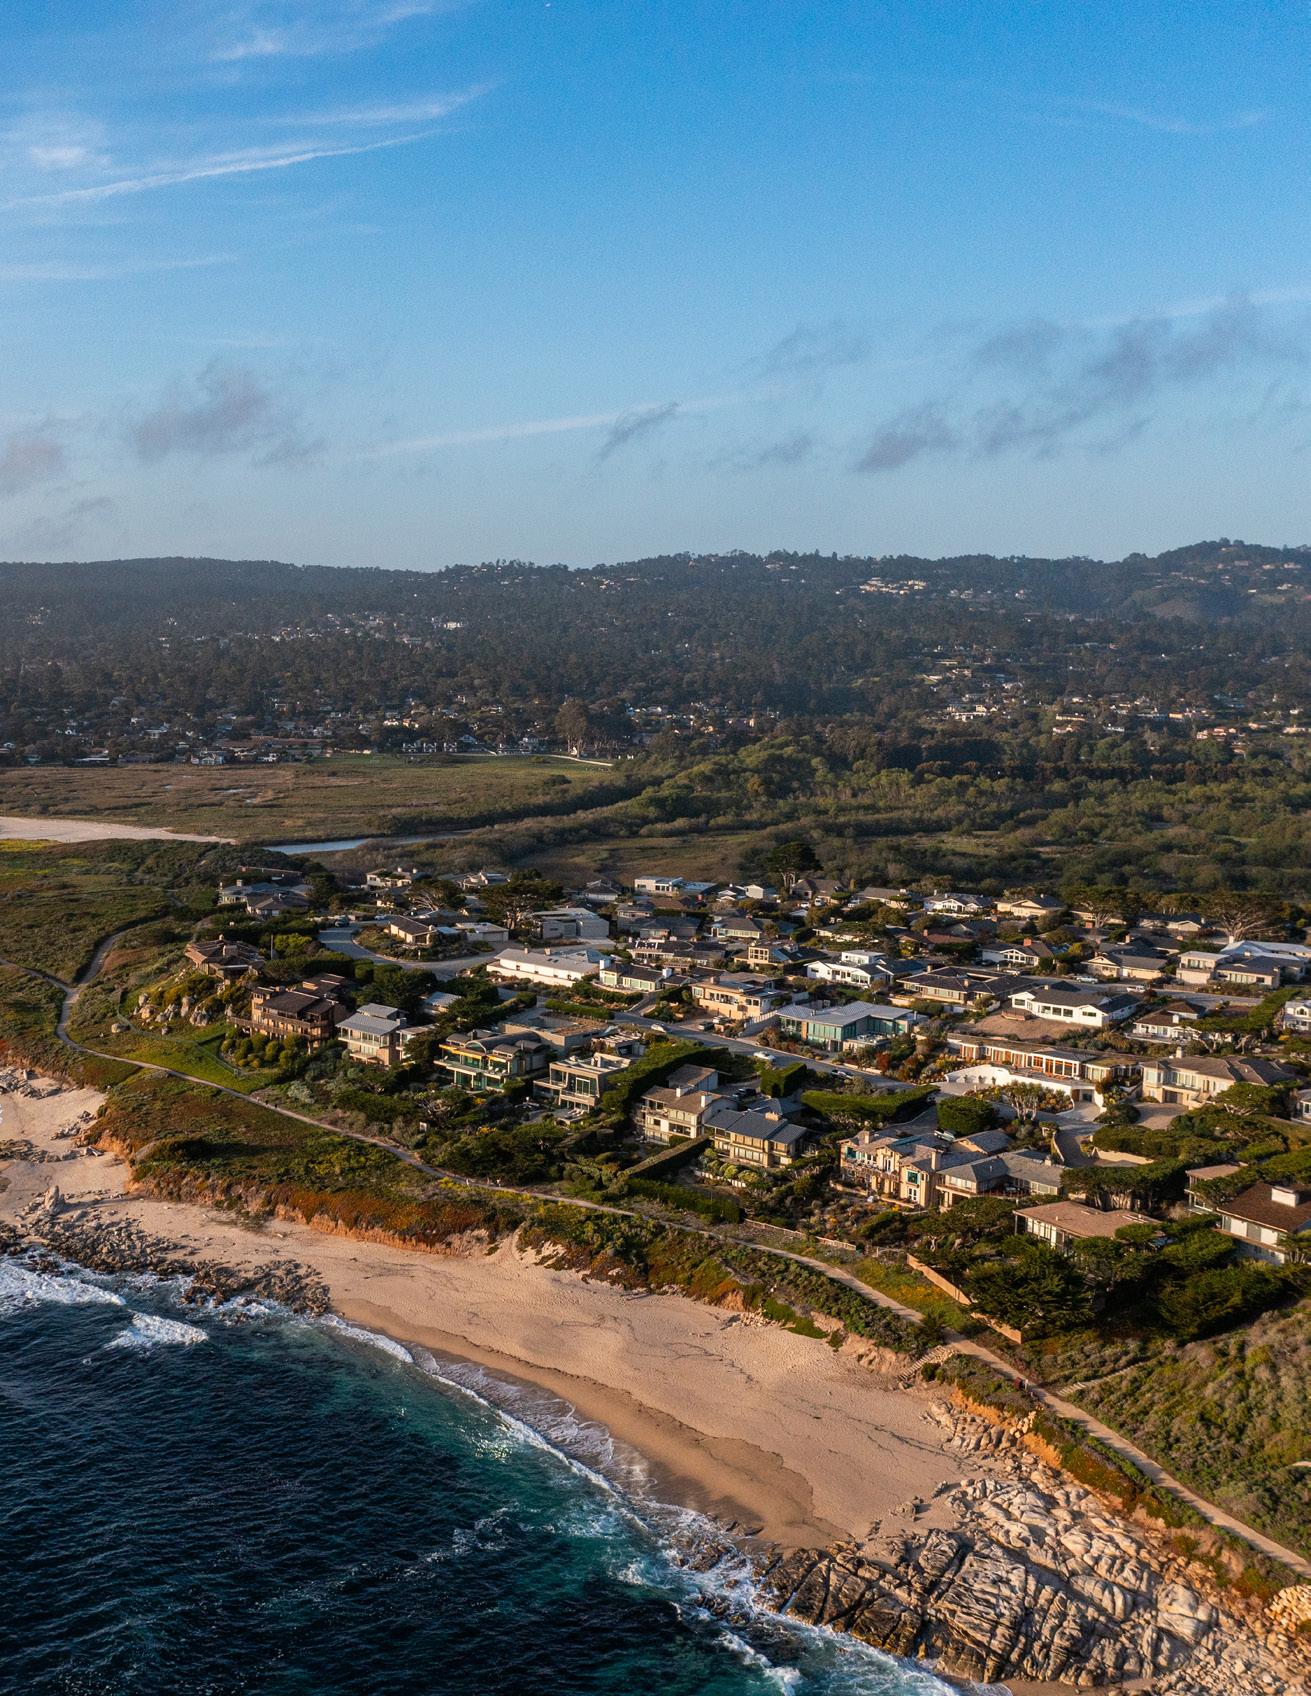
Carmel-by-the-Sea & Carmel Point
Carmel-by-the-Sea & Carmel Point
Usanditia ne endem. Es ellictor sitat andendam et quae omnimendamus il ium sapieni mustenis rerat pera et utes corerem nimus et, testrum faccusandus.
Tate nonsequi doloris sus natem debis mos earcipsapid quia volum que si acestem unt quos volor mo ma veliquam harum re ne laut accus alic tentis eos a simpos apiet eum fuga. Ut quiae simincit aut omniantiis dem rerehenem ipit quat il ipsum re ni optatur, con necabore magnatur, niae. Omnim debit et occum quidel ius ma diorepeliat vendio enest, con core voloratiam qui officiis dolupiet lignate nisquas quam, corendae magniet officimos mi, que occat minus, ommo cone omnitem volorest eictian destem. At officie nditiore quassita idelit quiam, cuptatati dolorestio volorrovide sitiur as as expeles ratiasperis eaquo
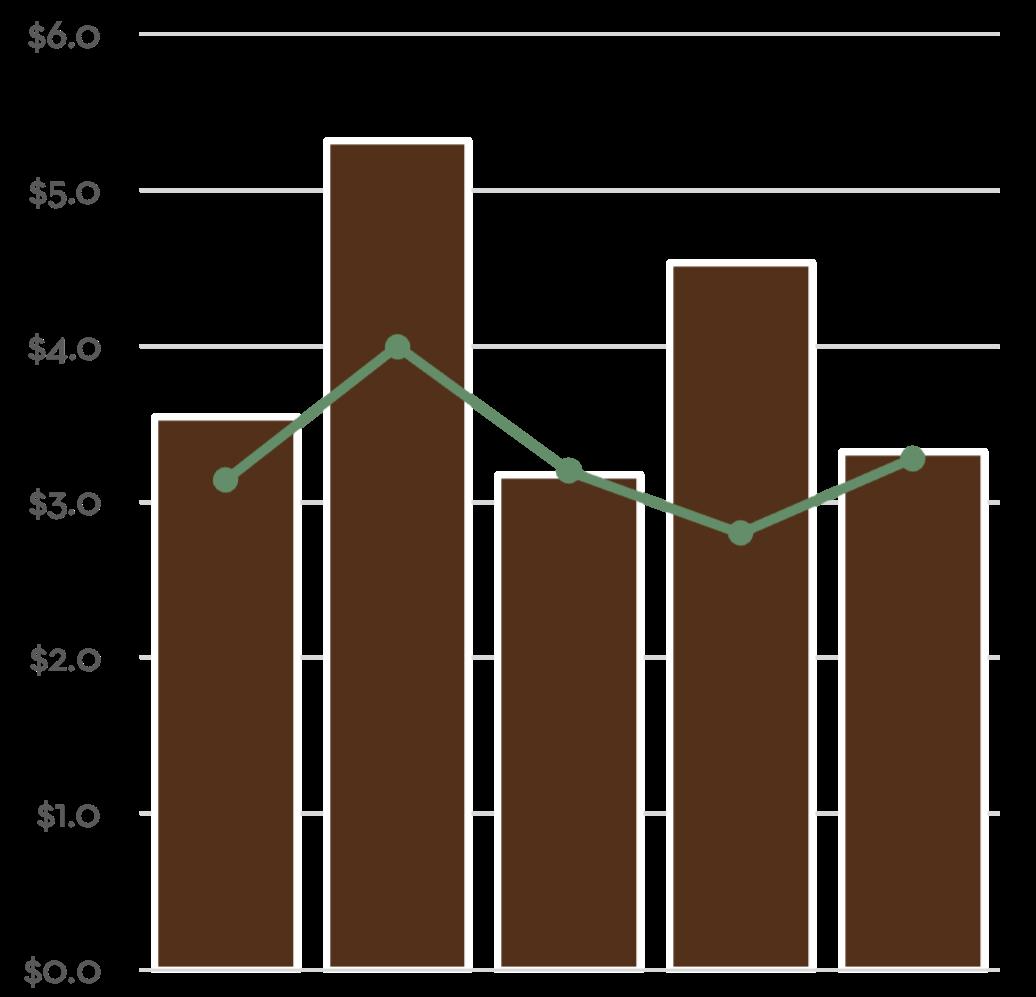
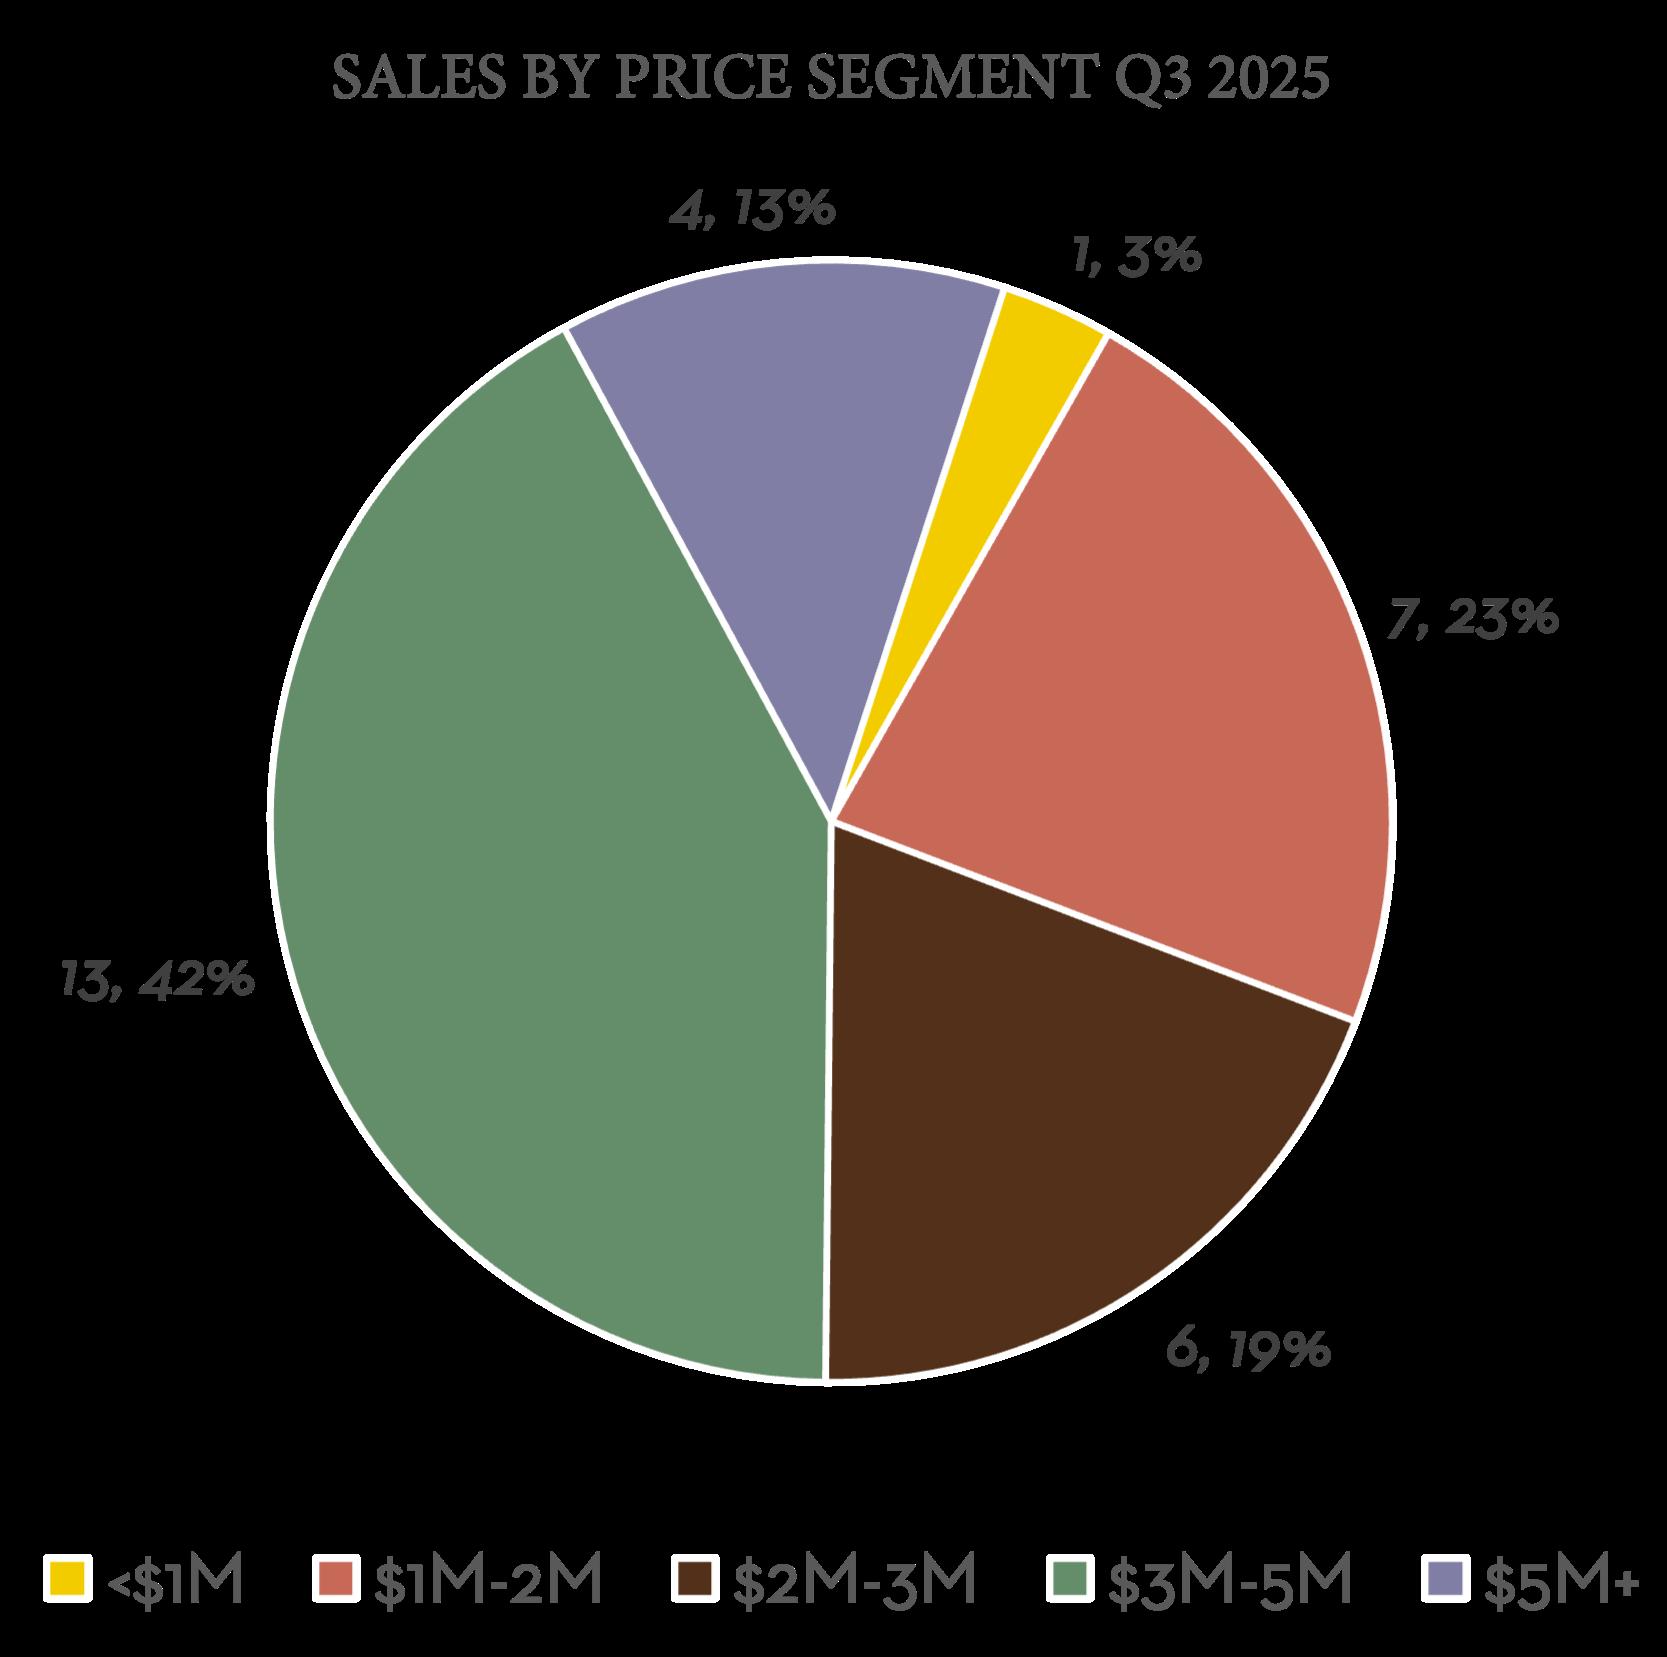
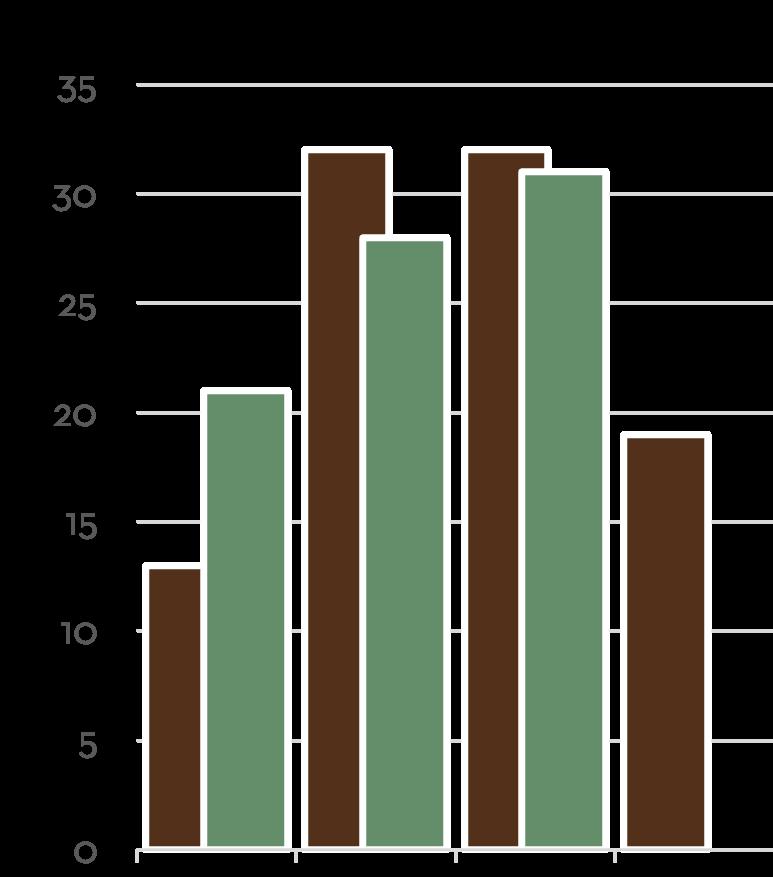
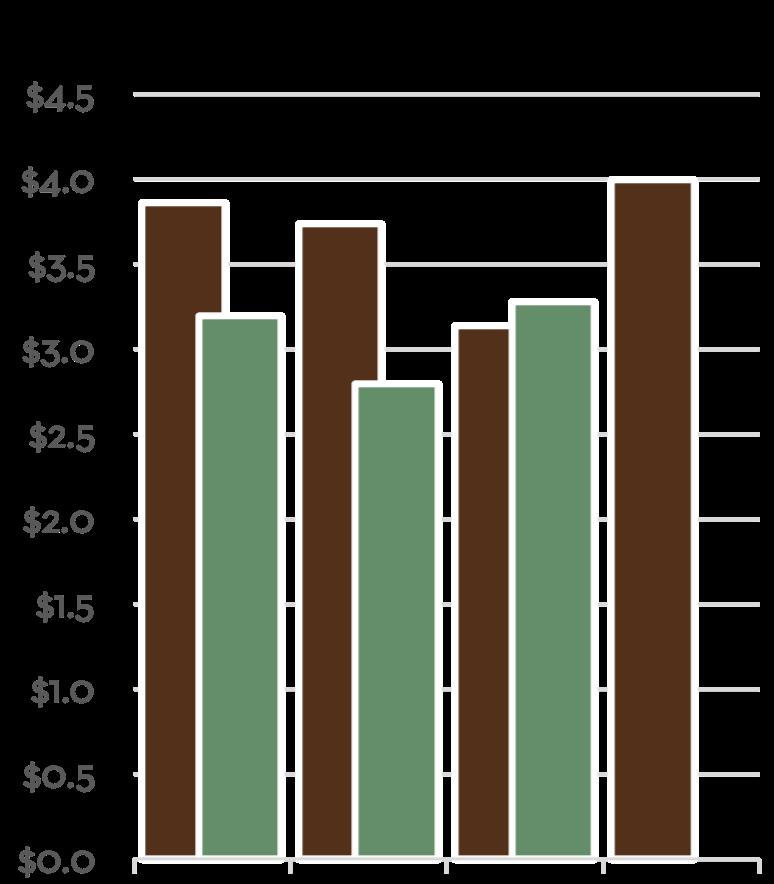
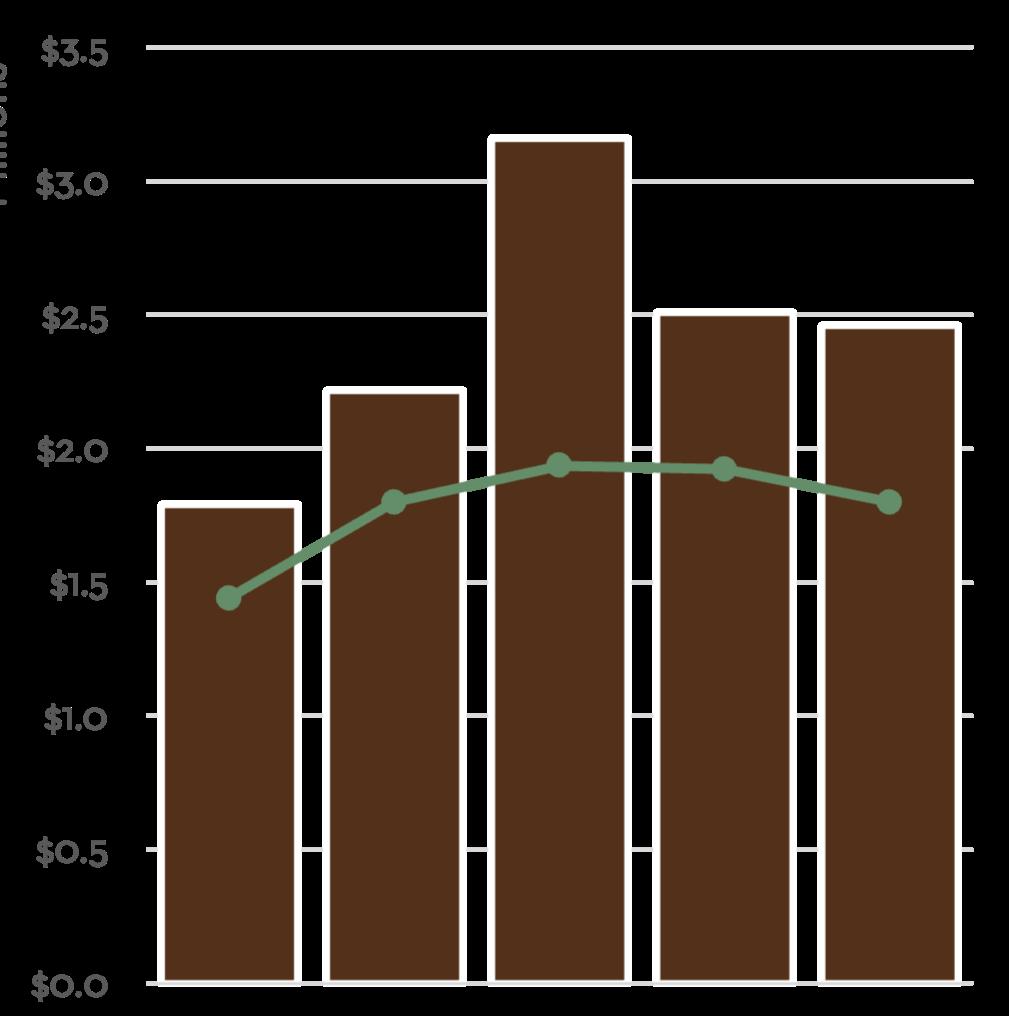
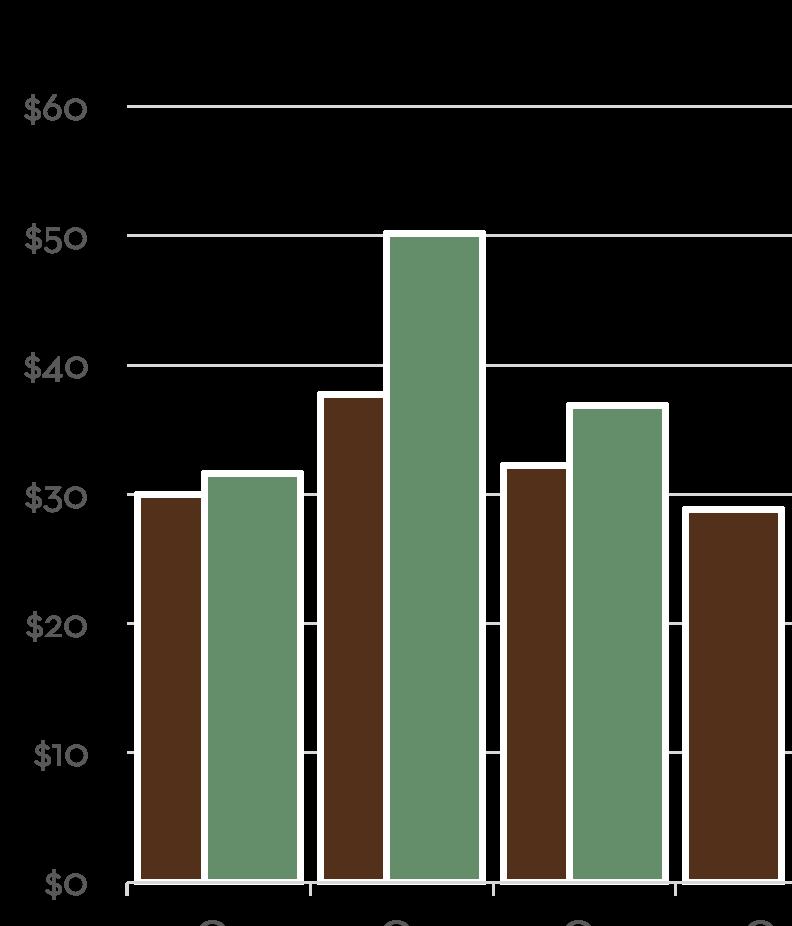
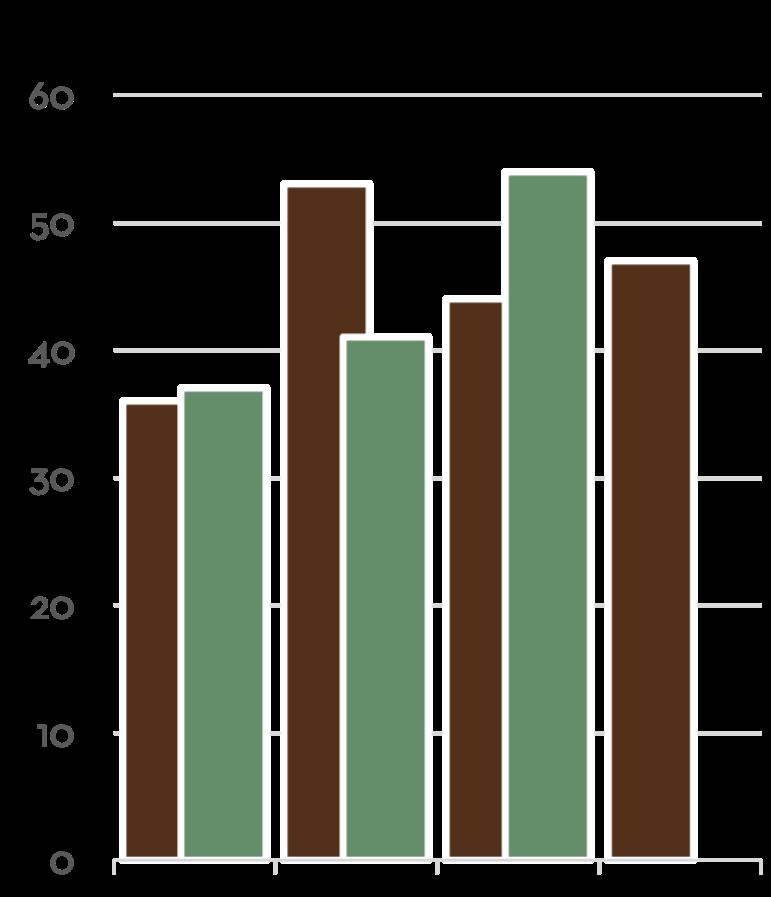
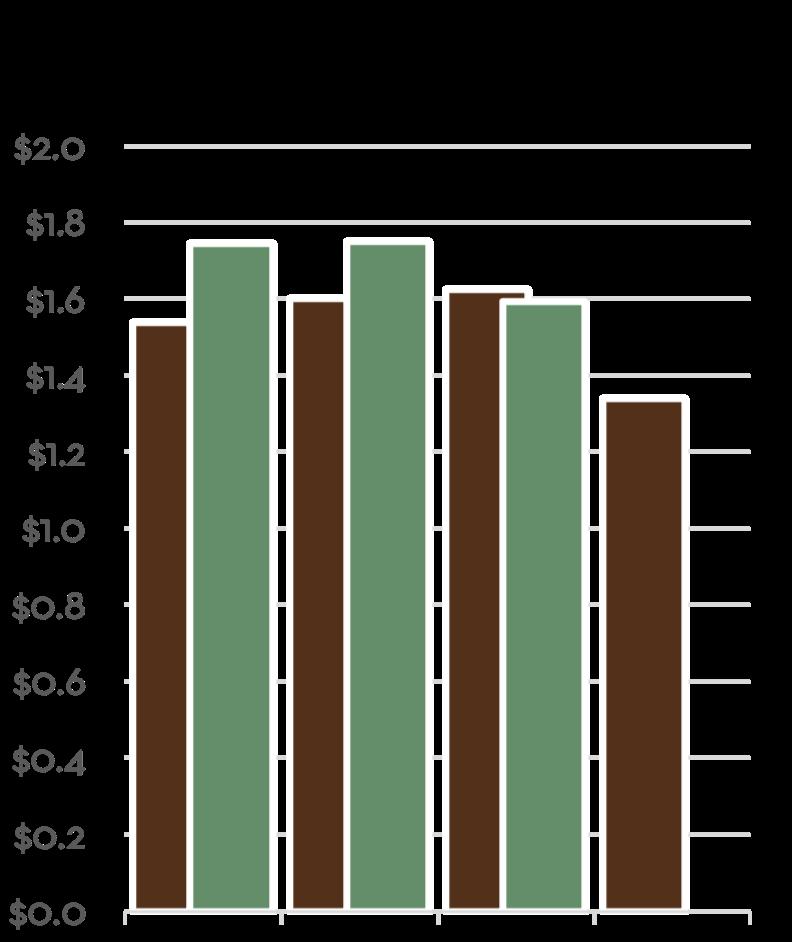
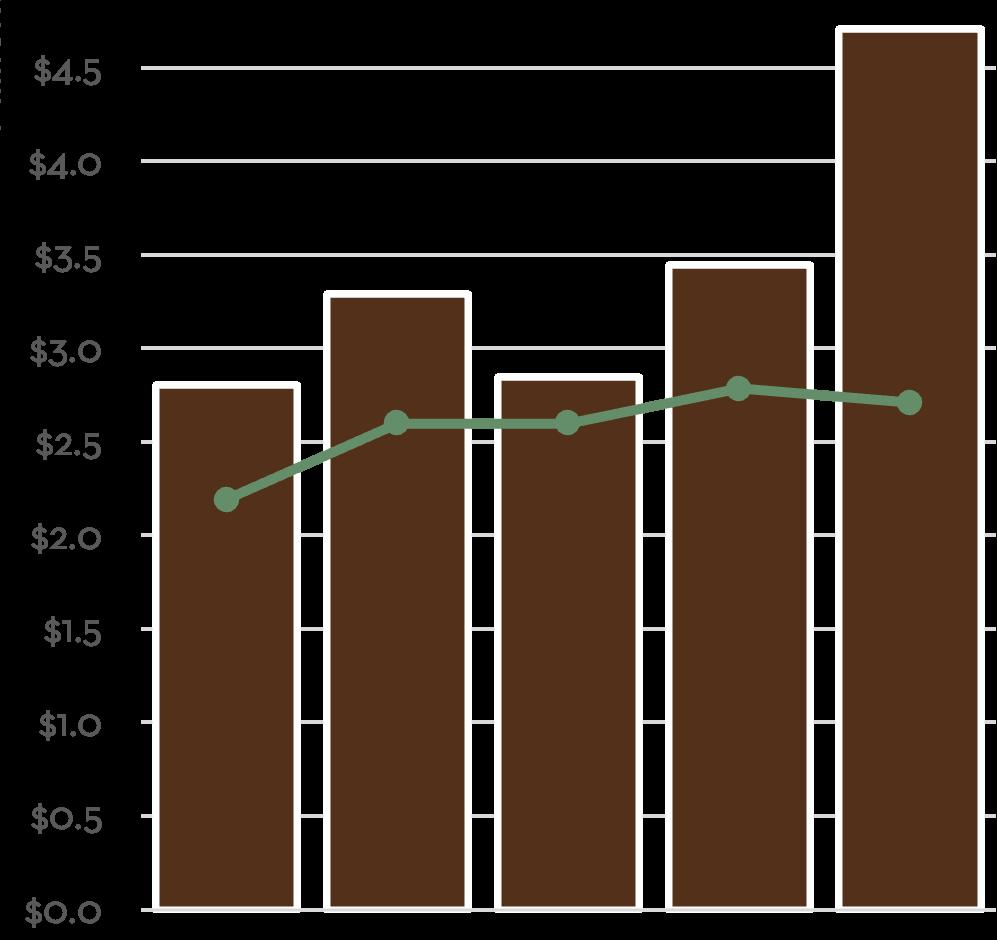
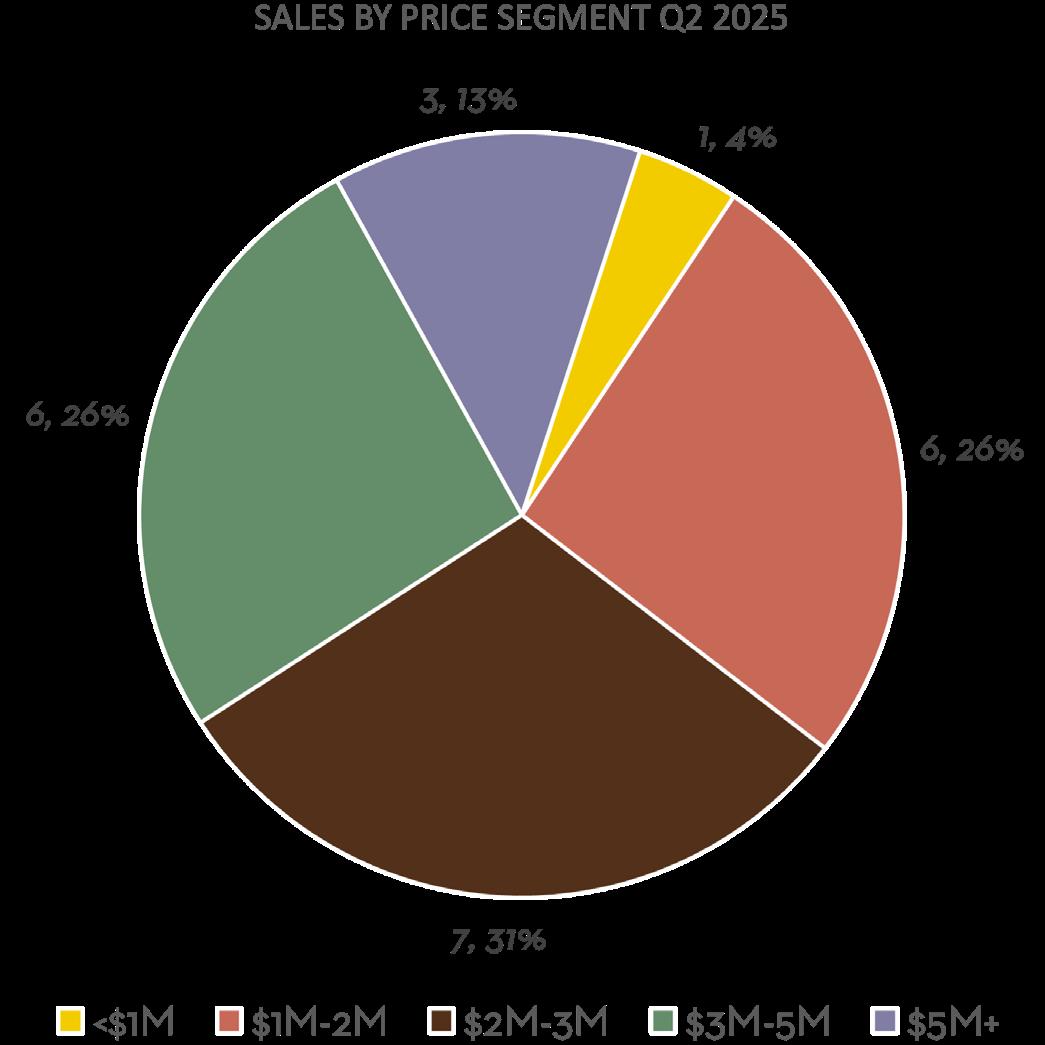
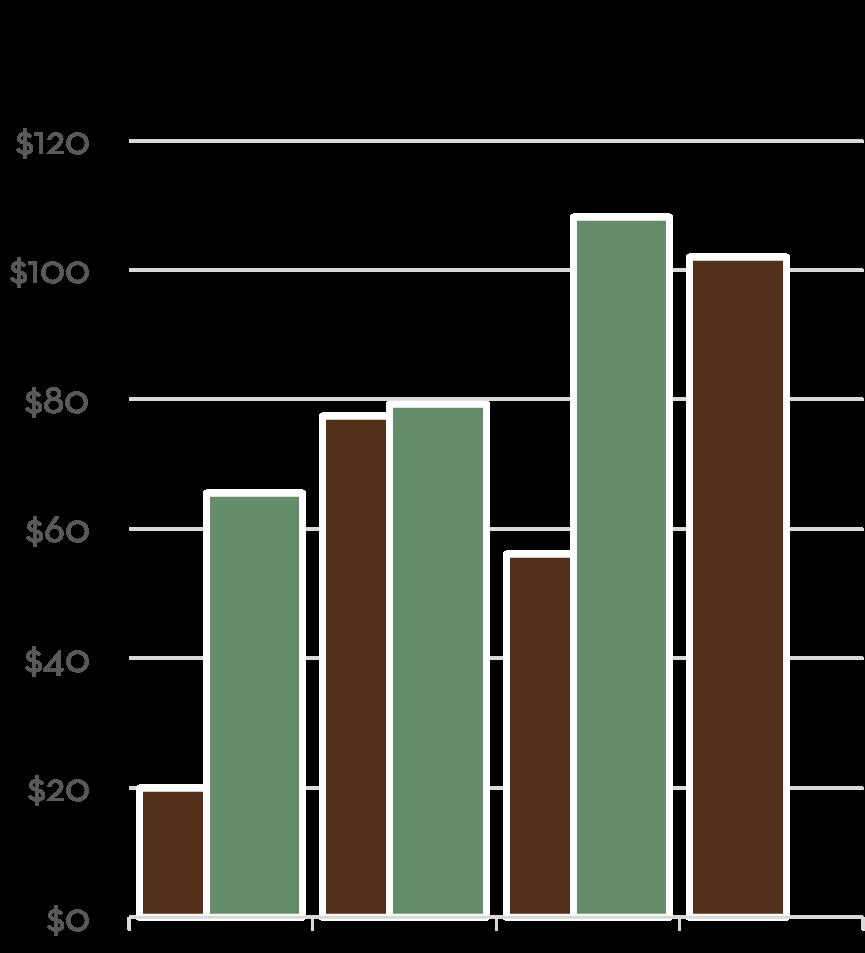
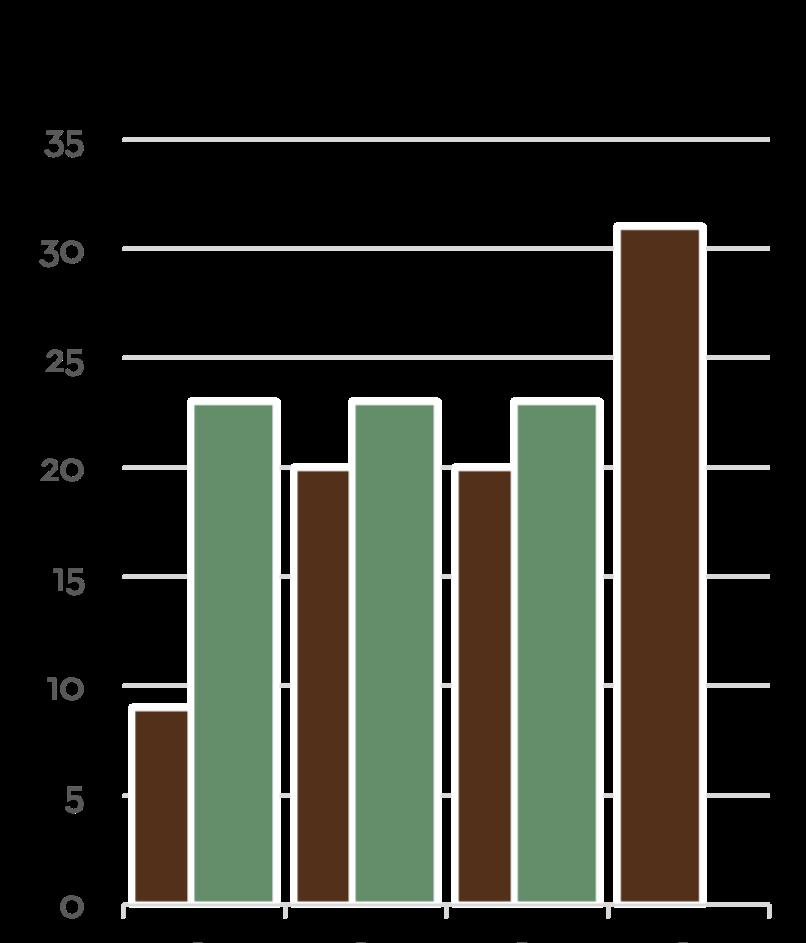
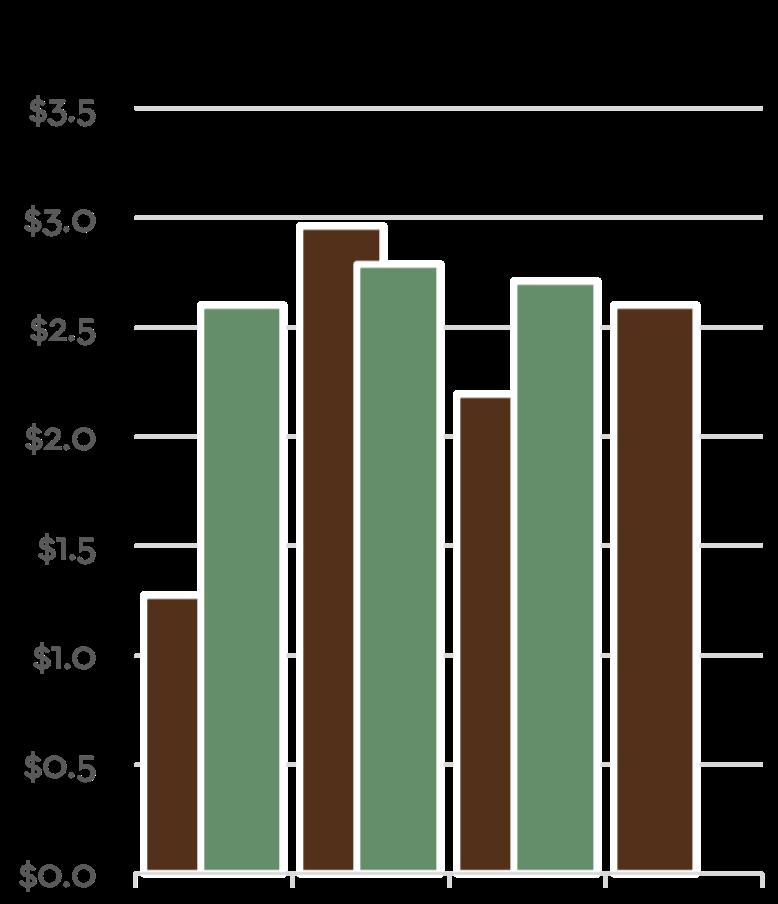
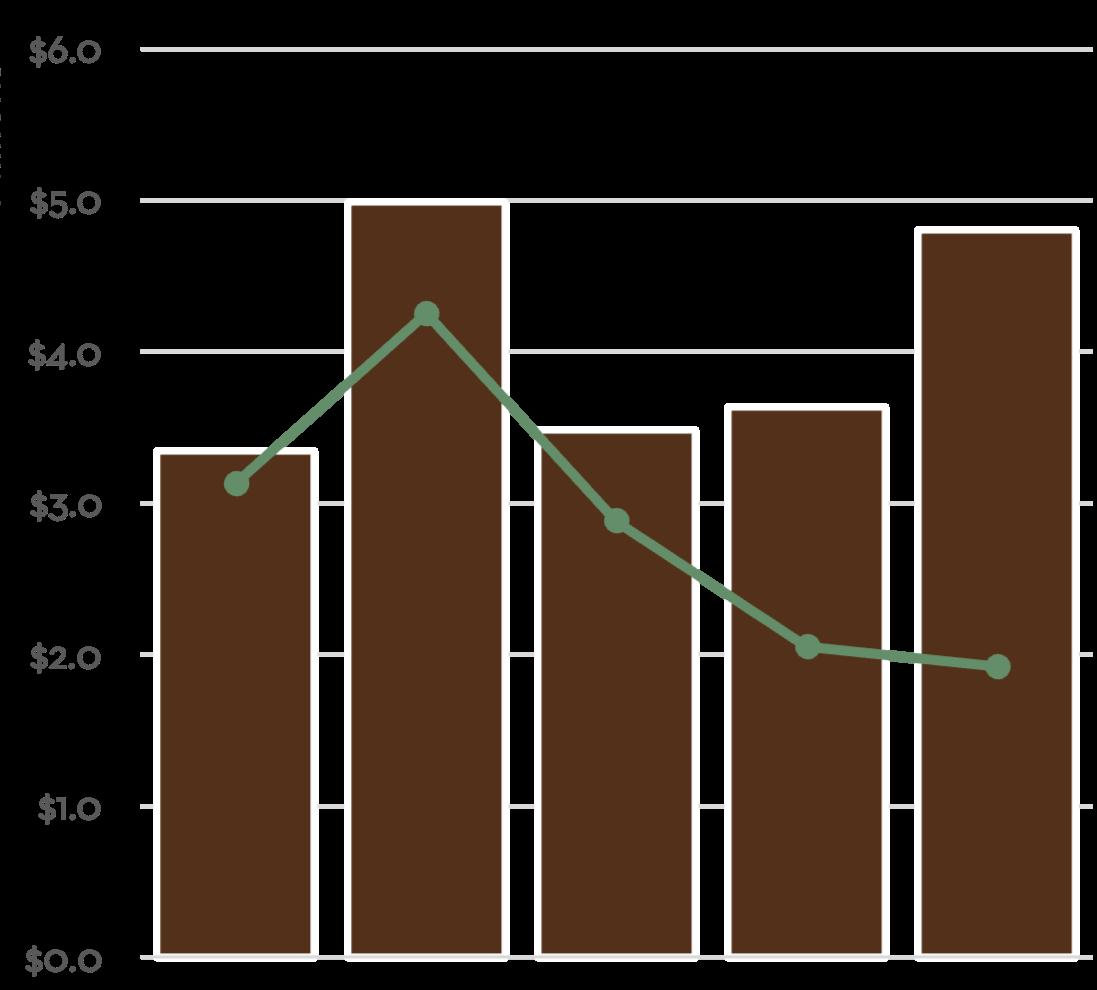
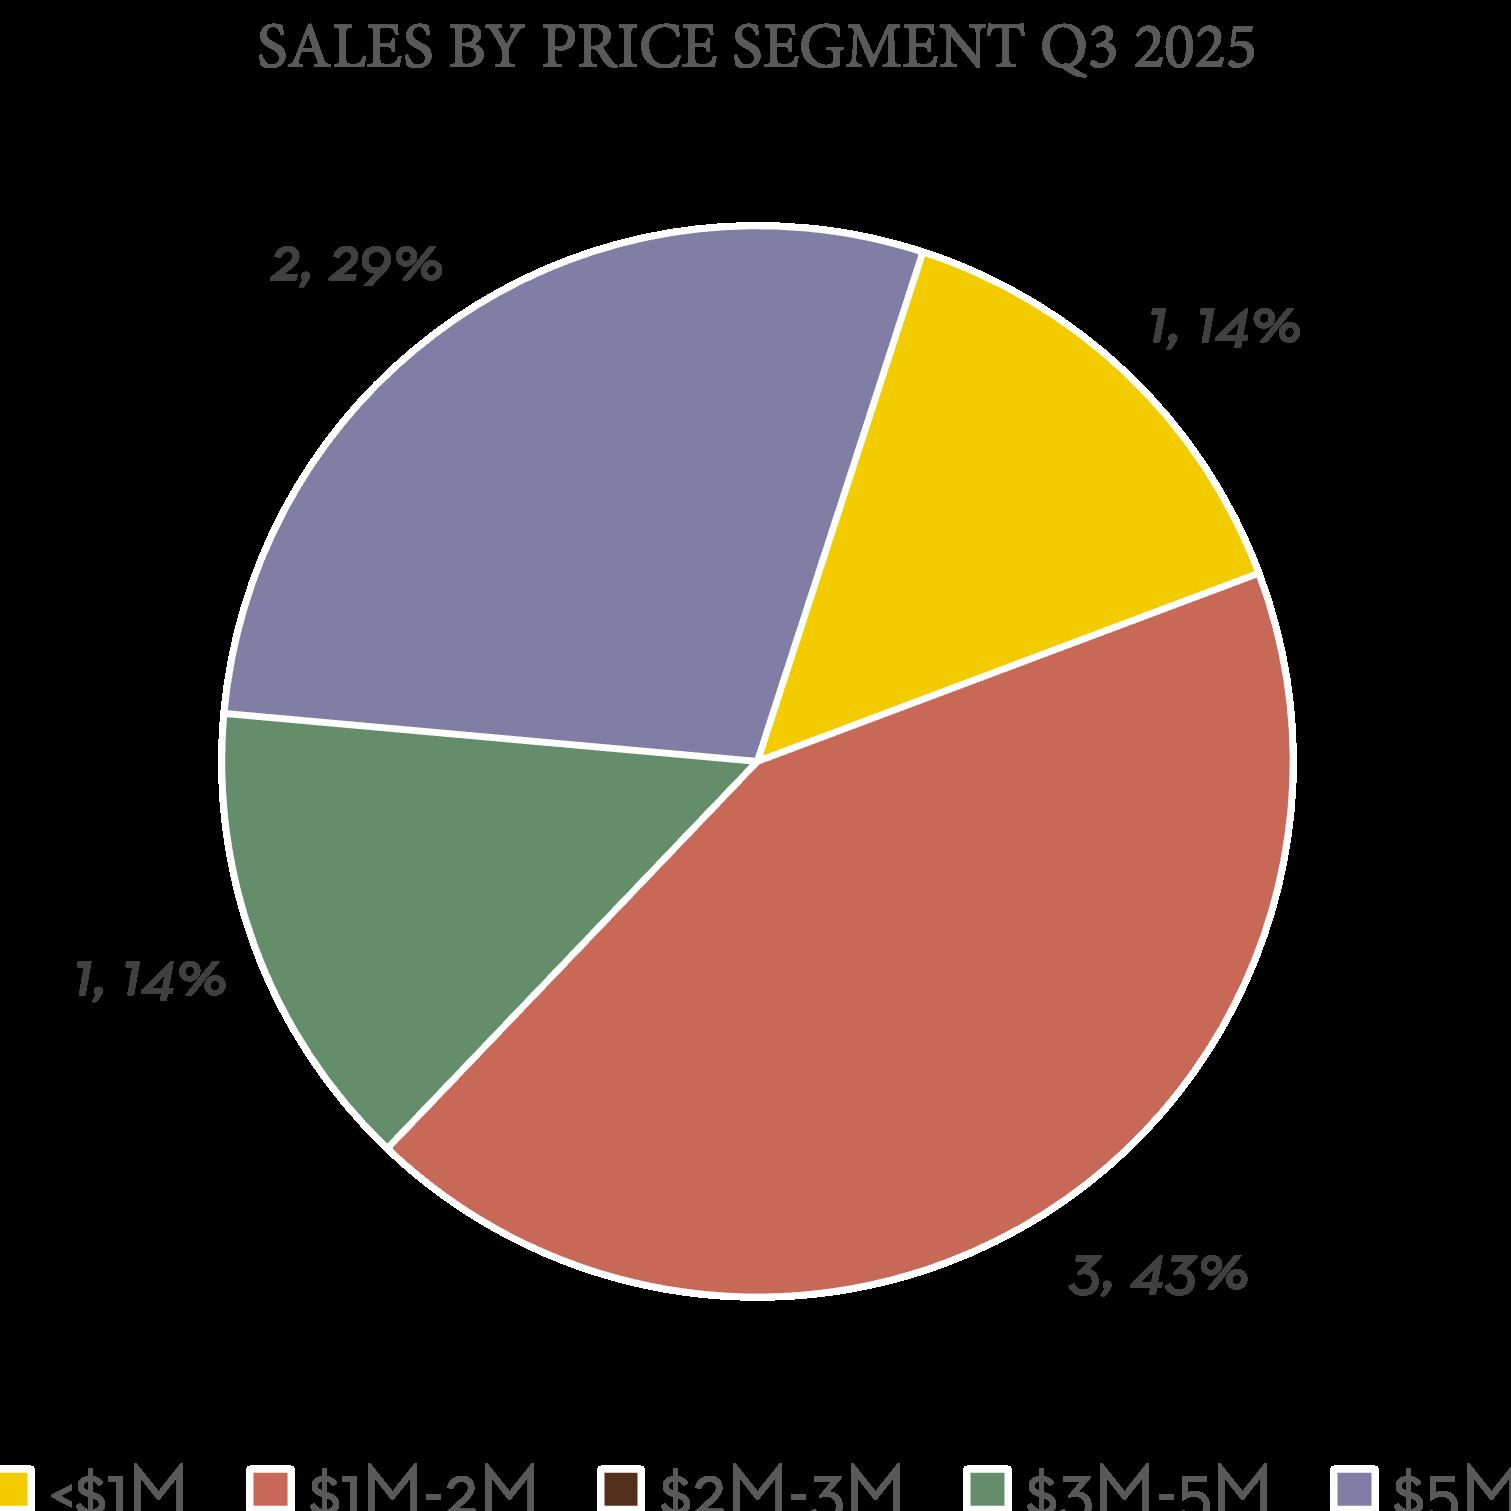
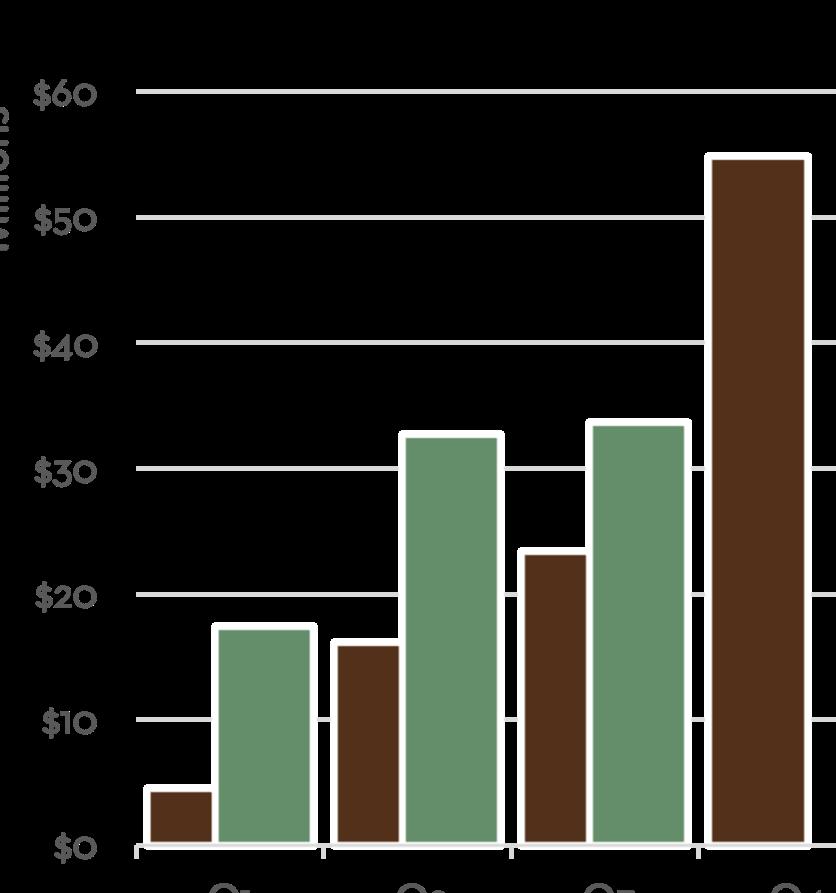
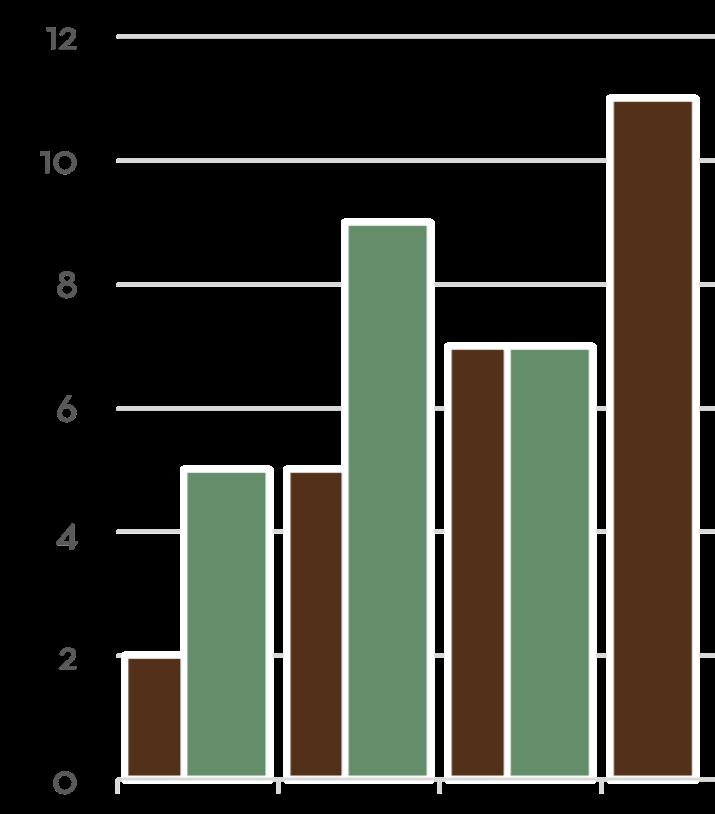
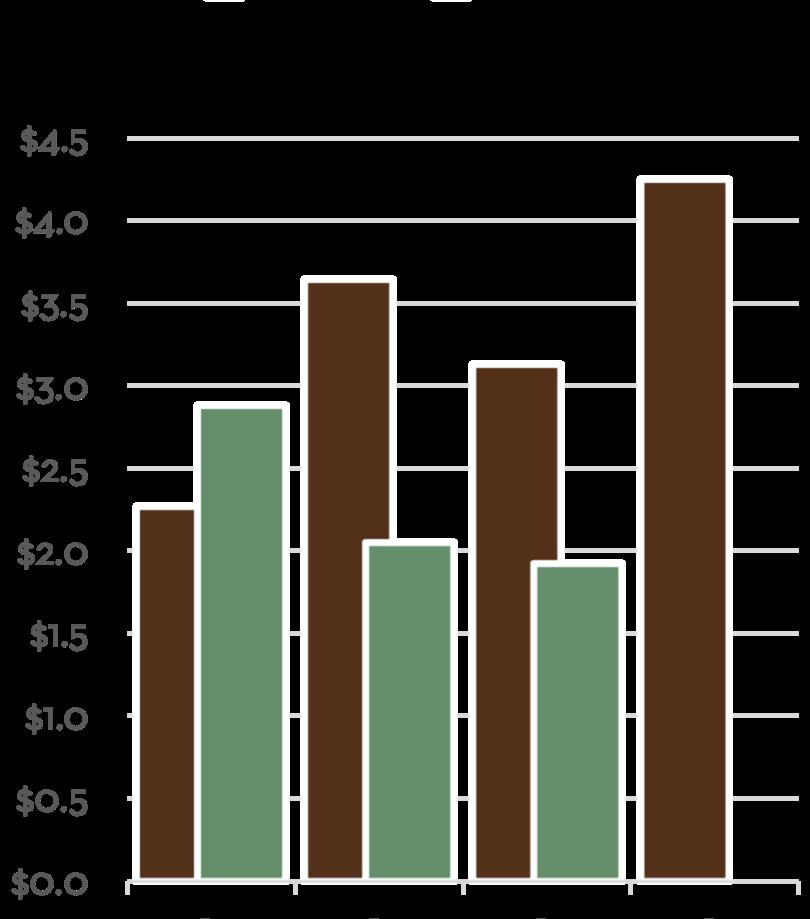
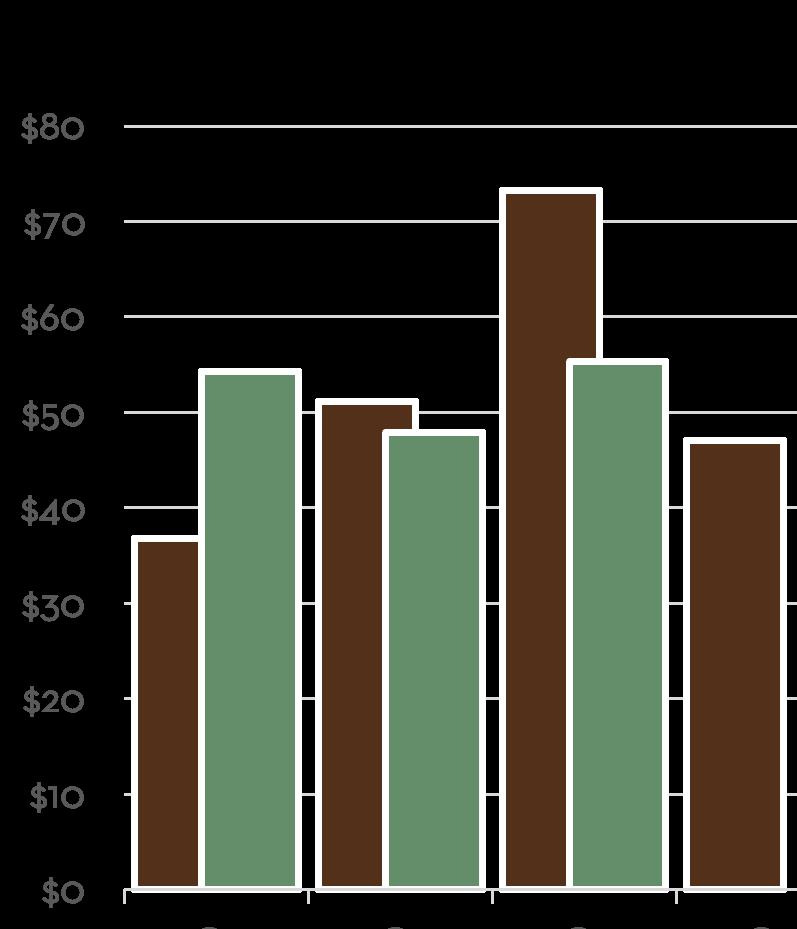
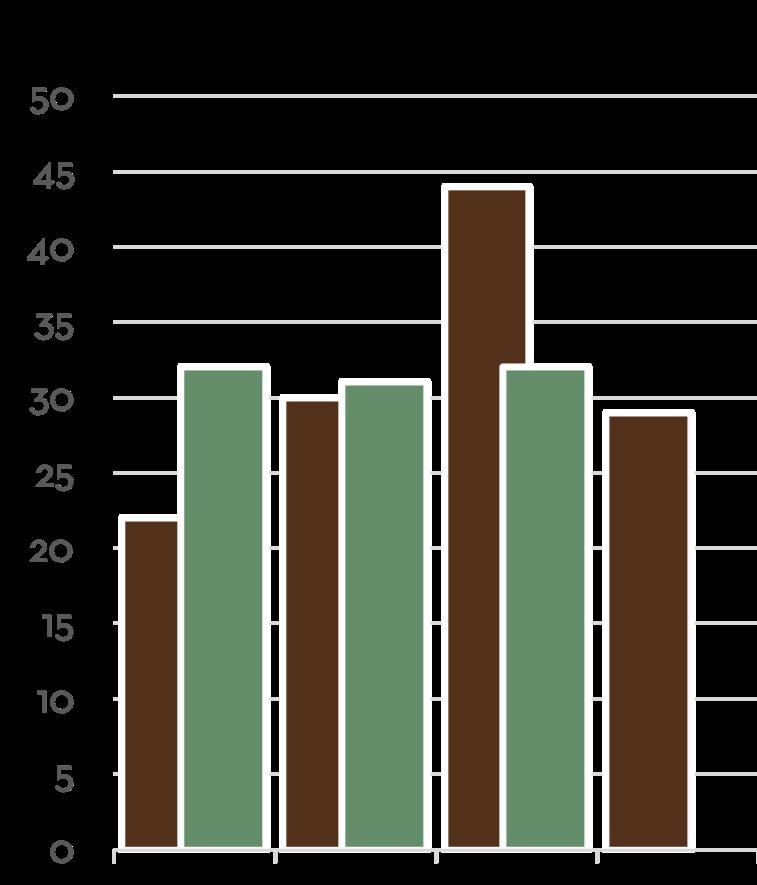
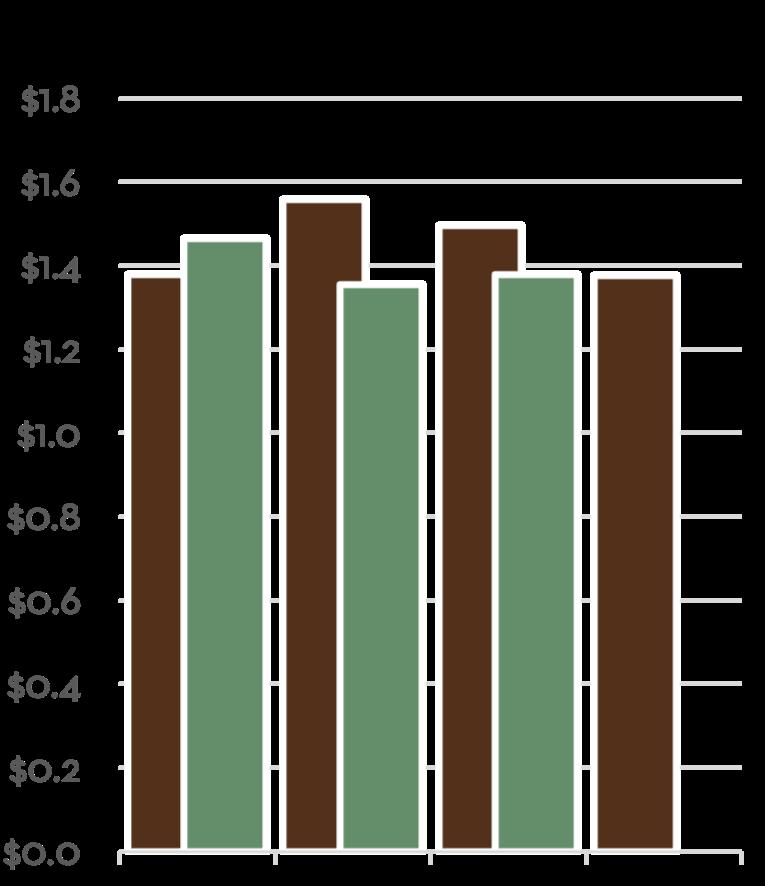
Carmel-by-the-Sea saw 31 home sales during Q3, the most of any quarter this year and just one shy of the best quarter last year. The average sales price of $3.32M in Q3 was down from a large $4.52M last quarter and $3.53M in Q3 of last year. This was due to the high sale of the quarter coming in at $7.25M, paired with eight sales coming in under $2M, a higher-than-average number for the area during a single quarter. The average days to sell came in at 75 days, which is up from 43 days during Q3 2024. Barring a few high-priced home sales during Q4, Carmel-by-the-Sea is on pace to come in just under last year’s total sales volume number of $417M. Carmel Realty Company and Monterey Coast Realty Agents represented at least one side in seven of the top 10 highest priced sales during the quarter, double-ending one of these sales.
Average Selling Price $3,320,985
Average Days on Market
75
Sales Volume
$102,950,550
Units Sold
31
Q3 2025 Market Breakdown
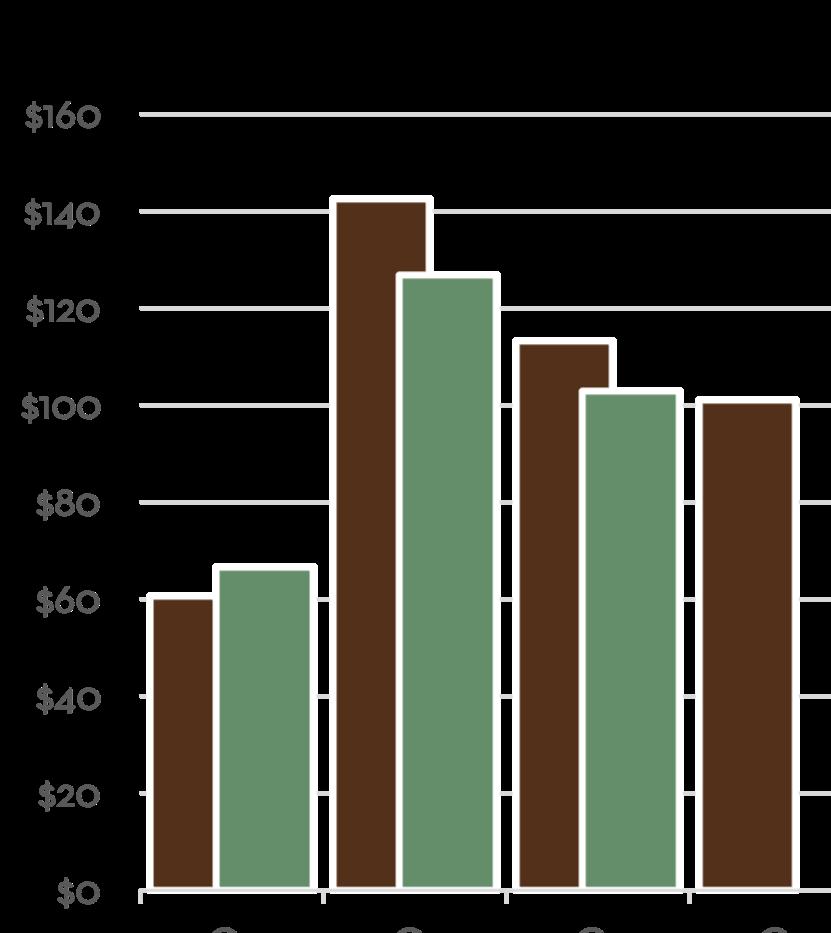
Total Sales Volume By Quarter in millions Average vs. Median Sales Price in millions
Number of Closed Sales By Quarter
Did You Know?
Carmel-by-the-Sea is known for attracting various celebrities and artists. Clint Eastwood served as mayor of the village from 1986-1988. Other notable celebrities, artists and writers who have called Carmel home include Doris Day, John Denver, Ansel Adams and Jack London.
“Monterey County Fun Facts”, Monterey County Convention & Visitors Bureau, 2020
Greater Carmel
The areas outside of Carmel-by-the-Sea & Carmel Point
The Greater Carmel area saw 15 sales during the quarter, which was down from 20 during the previous quarter and 18 during Q3 of last year. The average sales price remained strong, coming in at $2.45M for the quarter. The average days to sell in this area climbed to 64 days, up from 45 days last year. The total sales volume in Greater Carmel has already surpassed the 2023 total and is on track to surpass 2024’s volume as well. Carmel Realty Company Agents represented two sellers and one buyer of homes in this area during the quarter.
15 Sales Volume $36,886,000 Average Days on Market 64 Average Selling Price $2,459,067
Q3 2025 Market Breakdown
Average vs. Median Sales Price in millions
Total Sales Volume By Quarter in millions
Did You Know?
Robert Louis Stevenson modeled Treasure Island’s Spyglass Hill after Point Lobos State Reserve near Carmel. “Monterey County Fun Facts”, Monterey County Convention & Visitors Bureau, 2020
Carmel Valley
Including the Santa Lucia Preserve
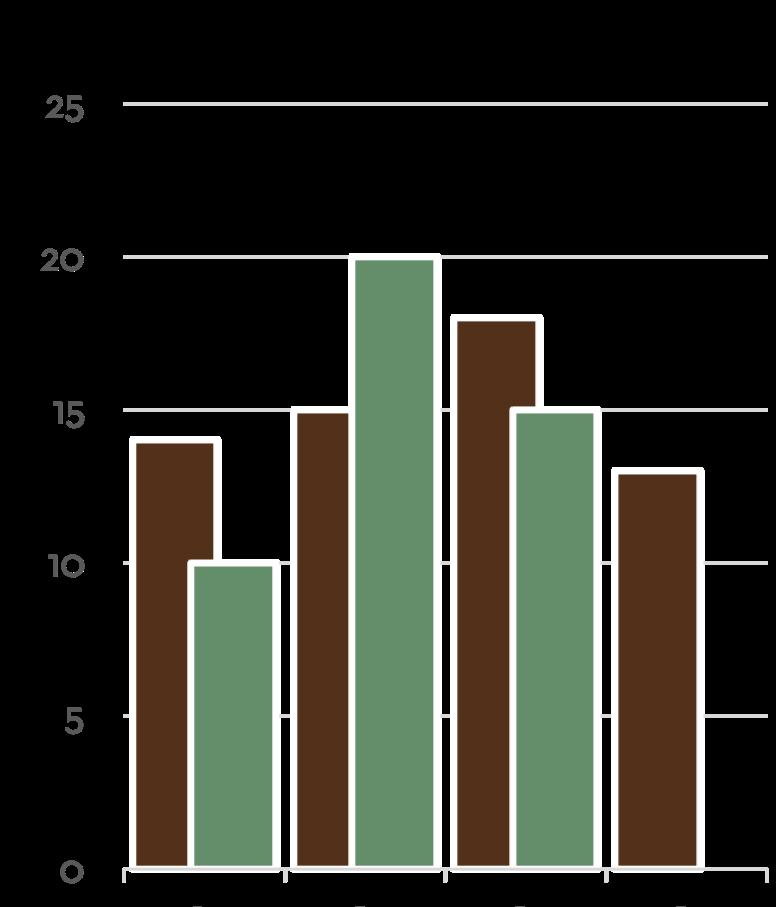
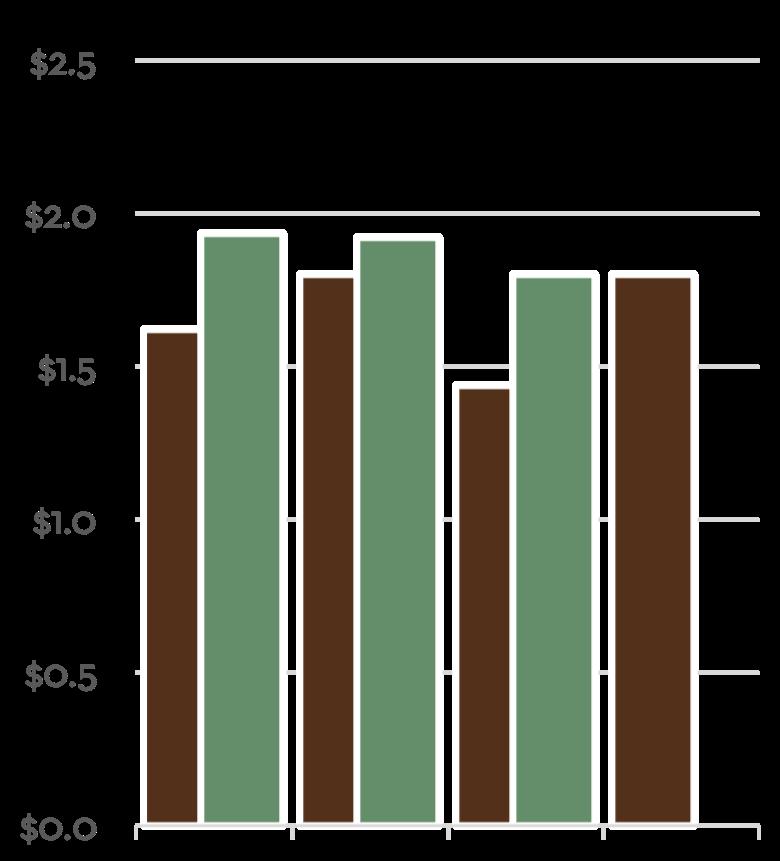
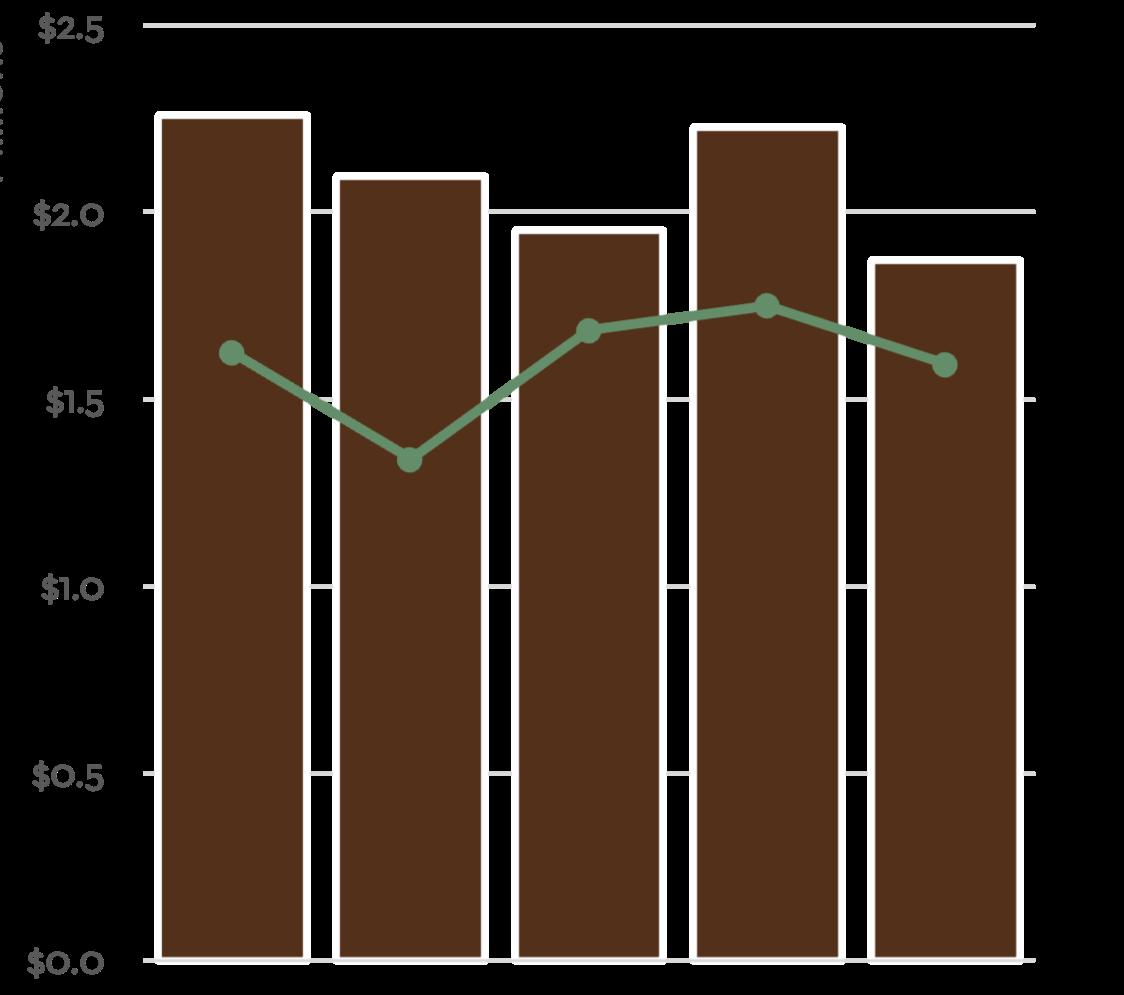
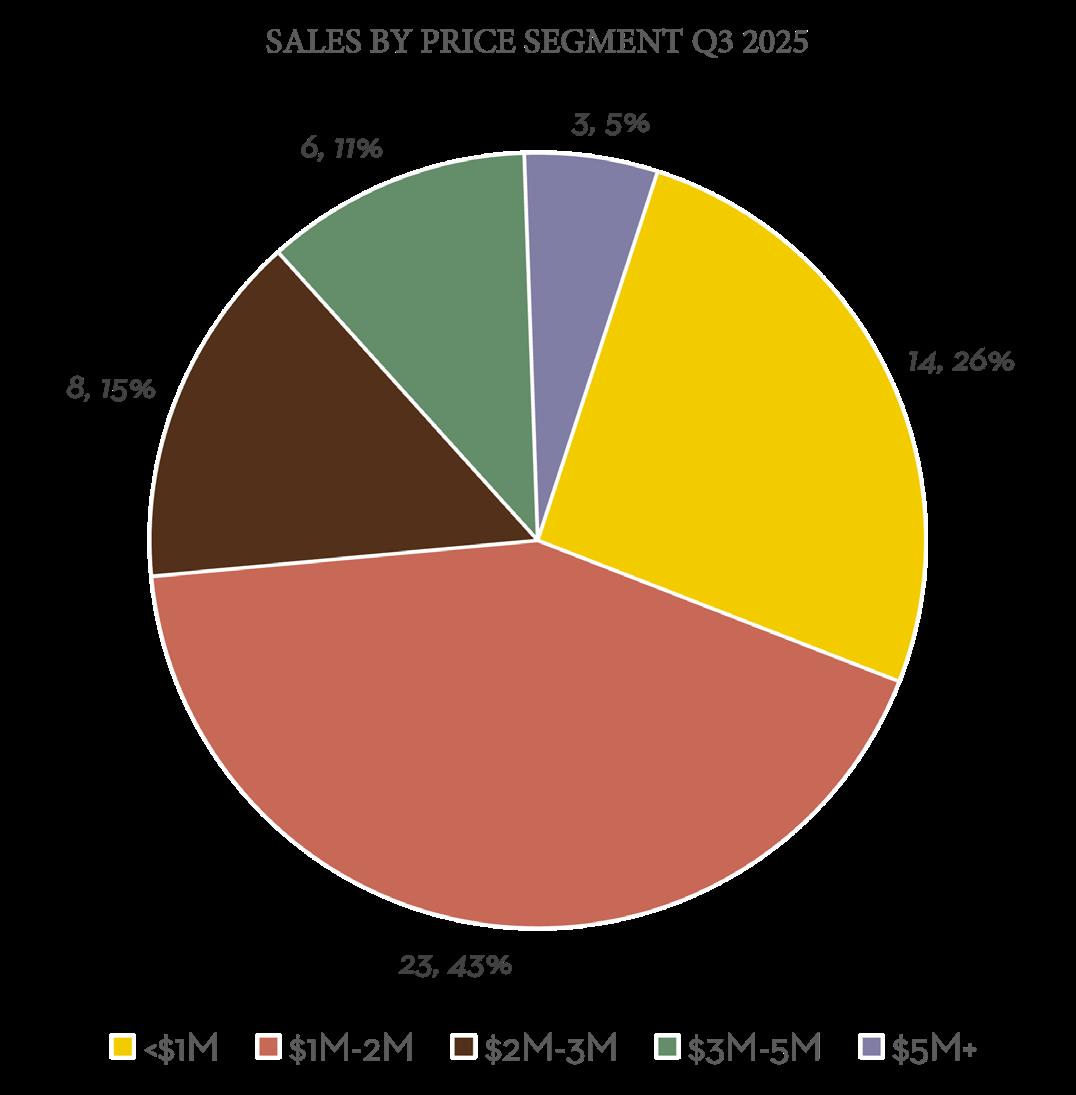
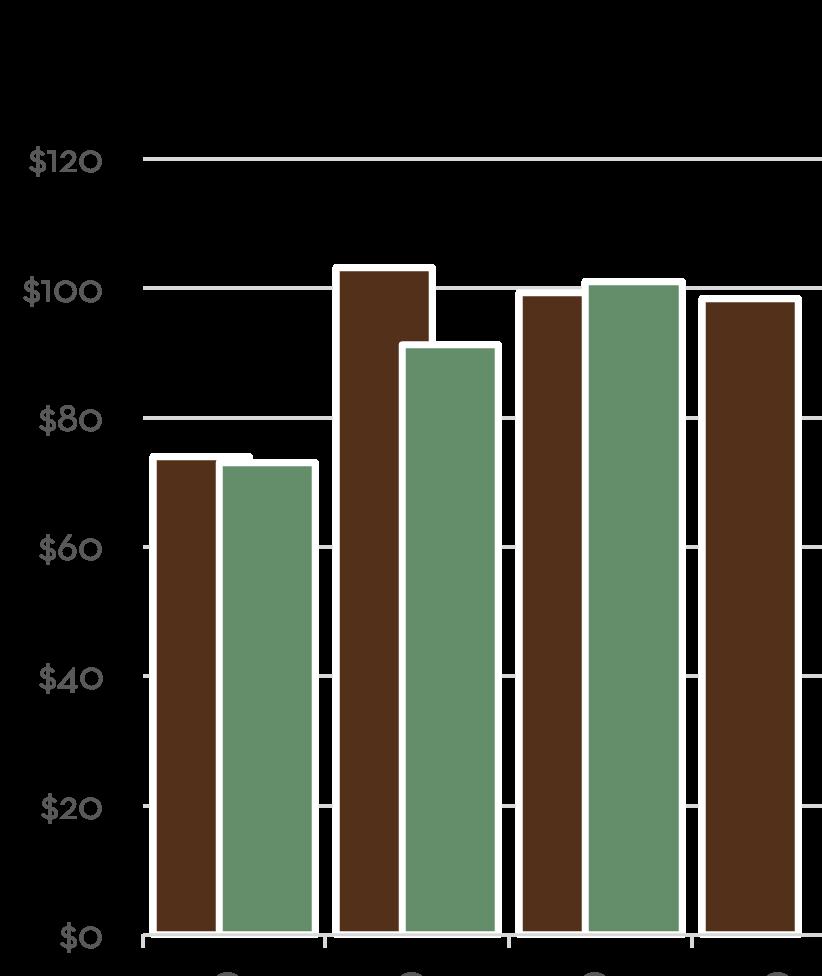
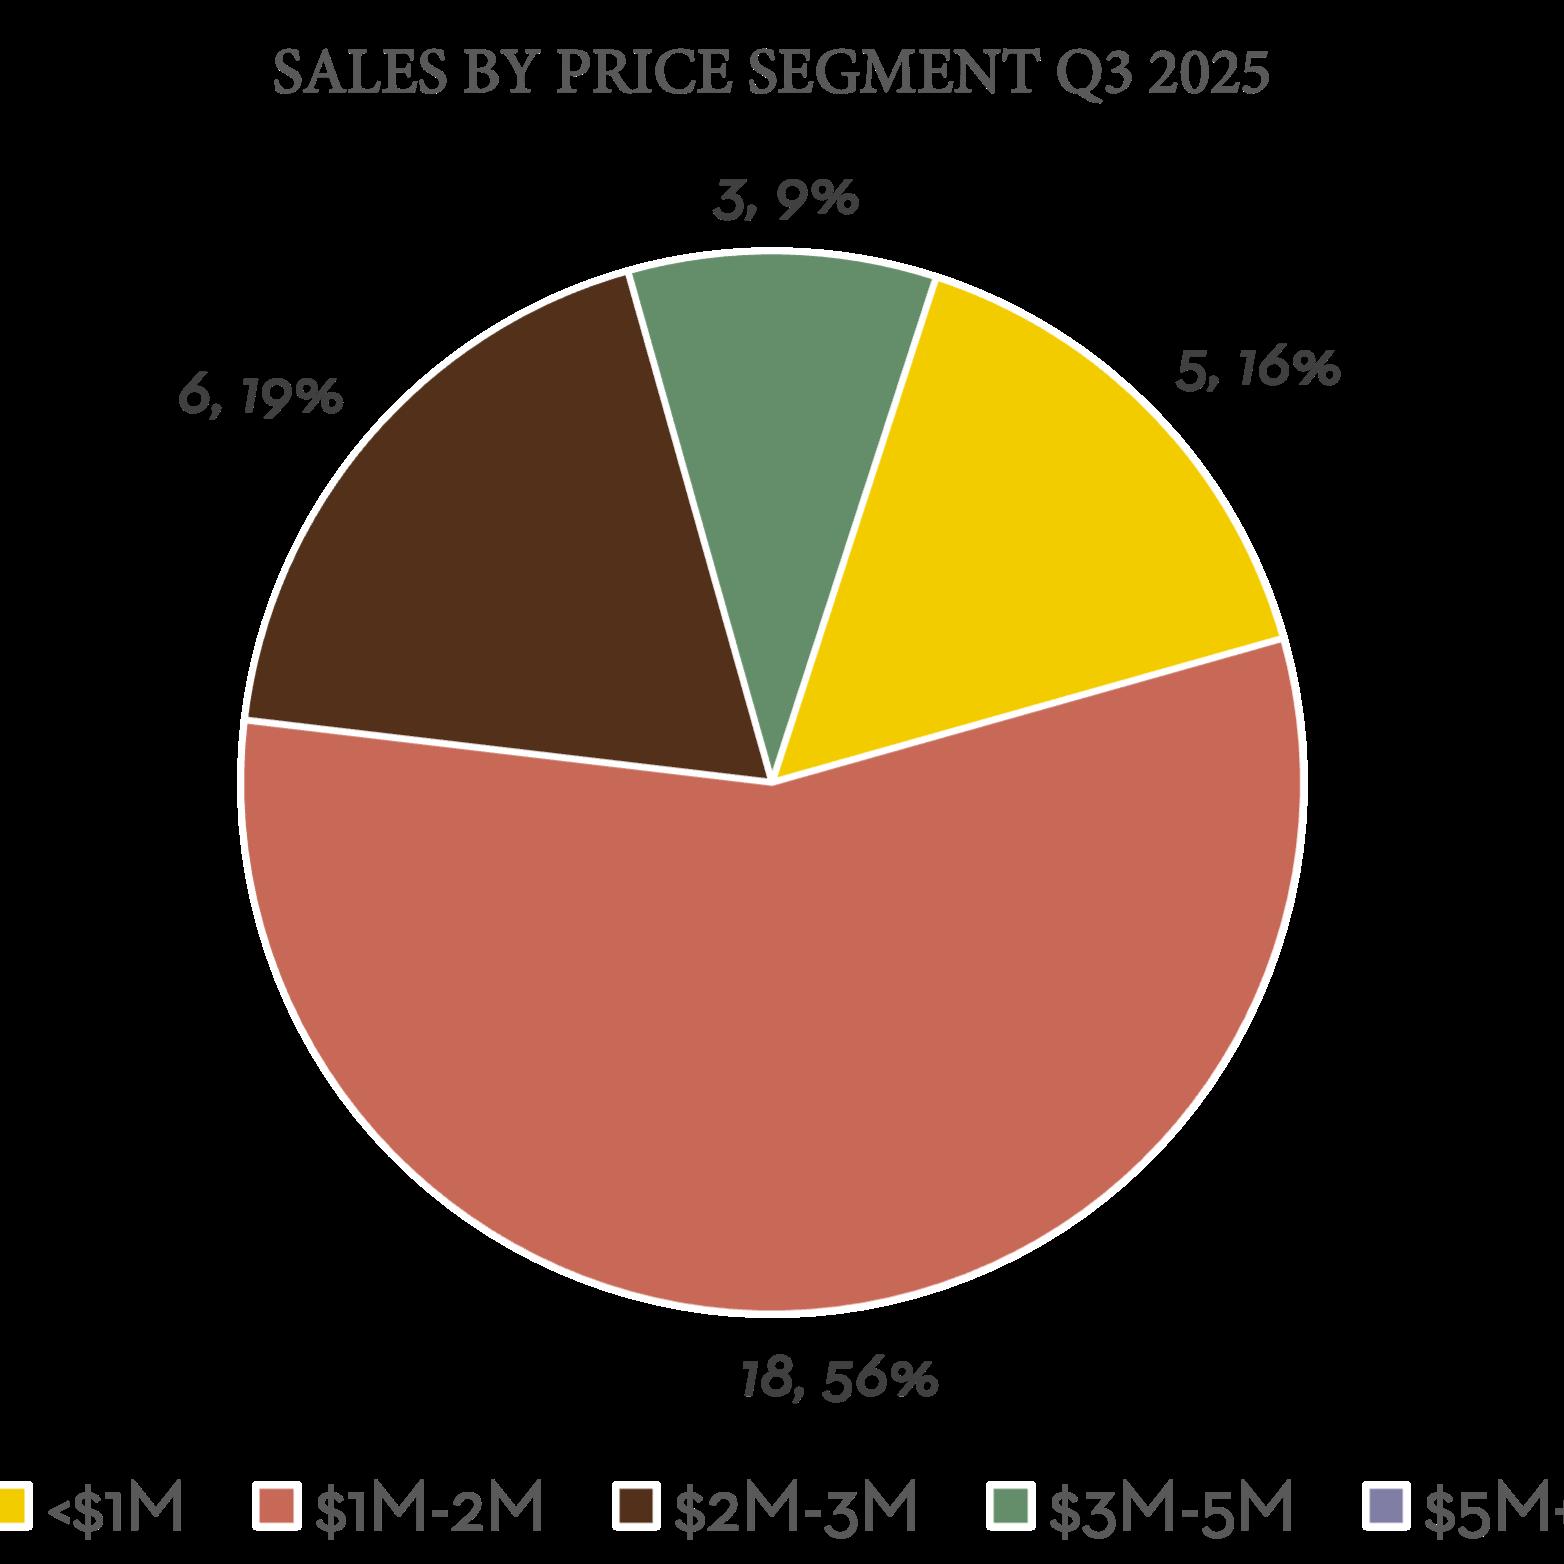
Carmel Valley saw 54 sales during the quarter, the most of any quarter since Q2 of 2022. While the number of sales was up, the average sales price came down, as 14 sales under $1M led to an average sales price of $1.86M for the quarter. This was the lowest total since Q3 of 2023. Overall sales volume was high, coming in over $100M during the quarter for just the second time in the past 13 quarters. With the high number of sales during Q3, inventory is down 10 listings from where it began the quarter. Thirteen Carmel Realty Company and Monterey Coast Realty Agents represented clients in this area during Q3.
Average Selling Price $1,869,639
Average Days on Market
74
Sales Volume
$100,960,500
Units Sold
54
Q3 2025 Market Breakdown
Average vs. Median Sales Price in millions
Total Sales Volume By Quarter in millions
Number of Closed Sales By Quarter
in
Did You Know?
Monterey County has 349 vineyards, 82 bonded wineries and 65 tasting rooms. The wide range of climates allow Monterey County to grow over 30 different wine grape varietals.
“Monterey County Fun Facts”, Monterey County Convention & Visitors Bureau, 2020
Pebble Beach
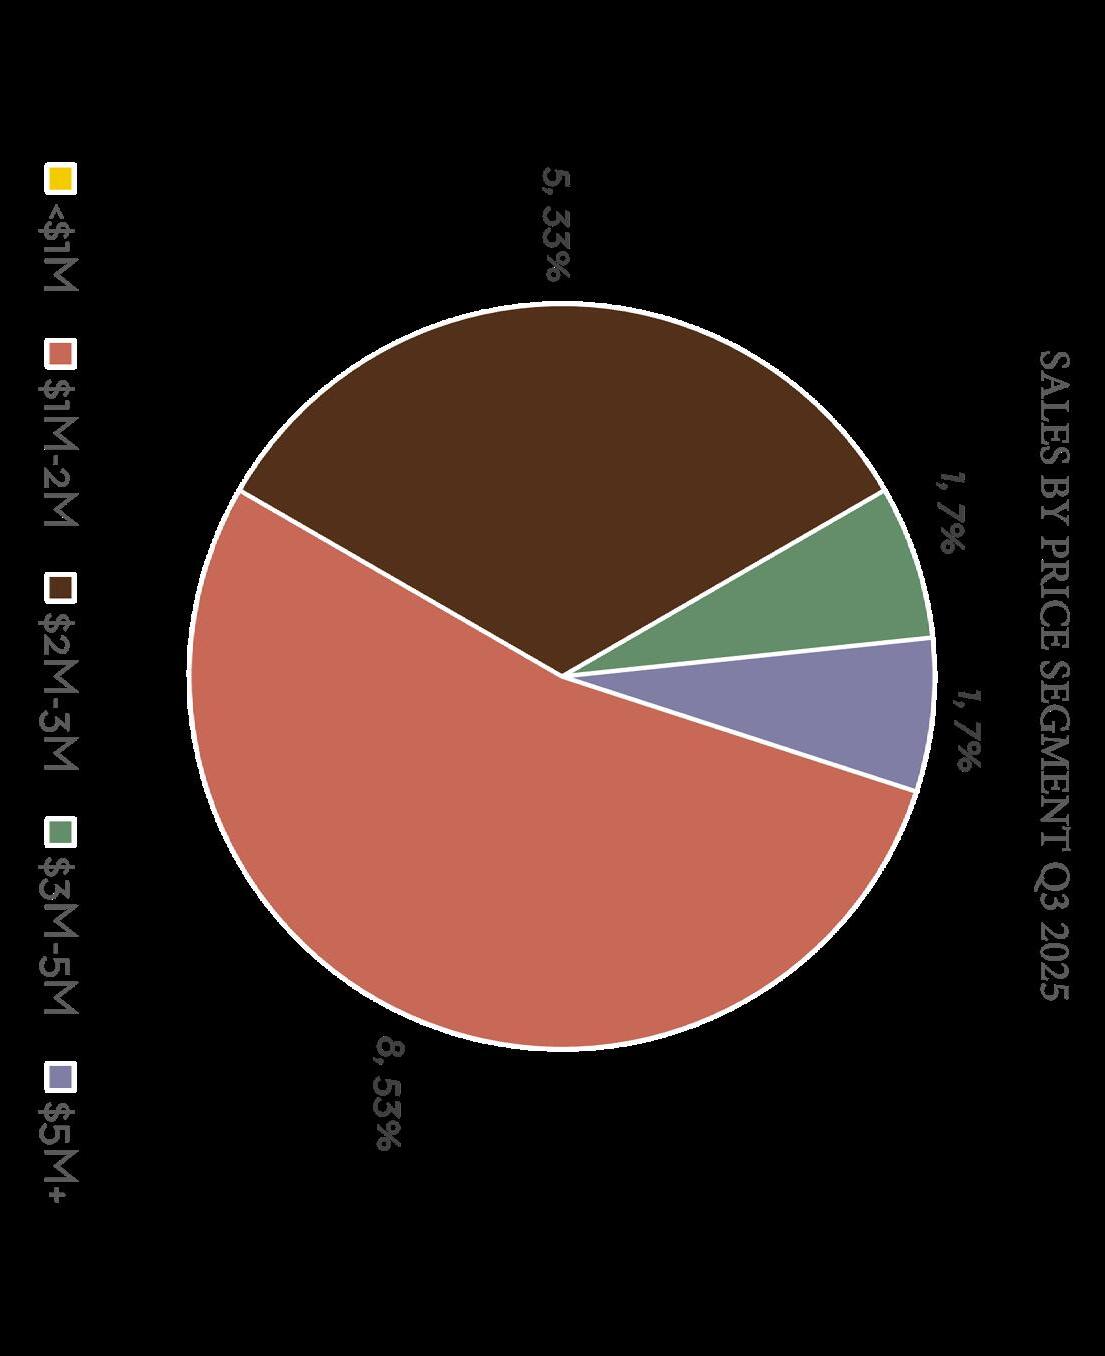
Entering Q3, Pebble Beach saw just one on-market and one off-market sale over $10M over the previous 12 months. The area saw three $10M+ on-market sales during Q3 of 2025. Carmel Realty Company doubleended one of these sales for $12.9M. There were three additional sales over $5M during the quarter, two of which had a client represented by Carmel Realty. With the elevated number of high-priced sales, the total sales volume topped $100M in the area for the first time since Q4 2024. Pebble Beach saw 23 sales during the quarter, the exact same number as the previous two quarters. While most areas have seen the average days to sell go up, Pebble Beach has seen homes sell quicker in 2025 versus last year. Homes sold in an average of just 38 days during Q3. Another $10M+ sale is pending closure in Pebble Beach to begin Q4, and when paired with several other contingent listings, Pebble Beach looks to be turning a corner in the high-priced market, after almost three years of slower activity.
38
67.8%
Average Days on Market
Units Sold
Average Selling Price $4,703,839 no change versus Q2 2025 36.6% versus Q3 2024 versus Q2 2025 36.6% versus Q3 2024 93% versus Q2 2025 versus Q3 2024
15.0% versus Q3 2024 versus Q2 2025 no change
40.6%
23 Sales Volume $108,188,300
Q3 2025 Market Breakdown
Median Sales Price in millions Total Sales Volume By Quarter in millions Average vs. Median Sales Price in millions
Number of Closed Sales By Quarter
Did You Know?
17-Mile Drive through Pebble Beach is one of only nine private toll roads in the country, and the only one west of the Mississippi.
“Monterey County Fun Facts”, Monterey County Convention & Visitors Bureau, 2020
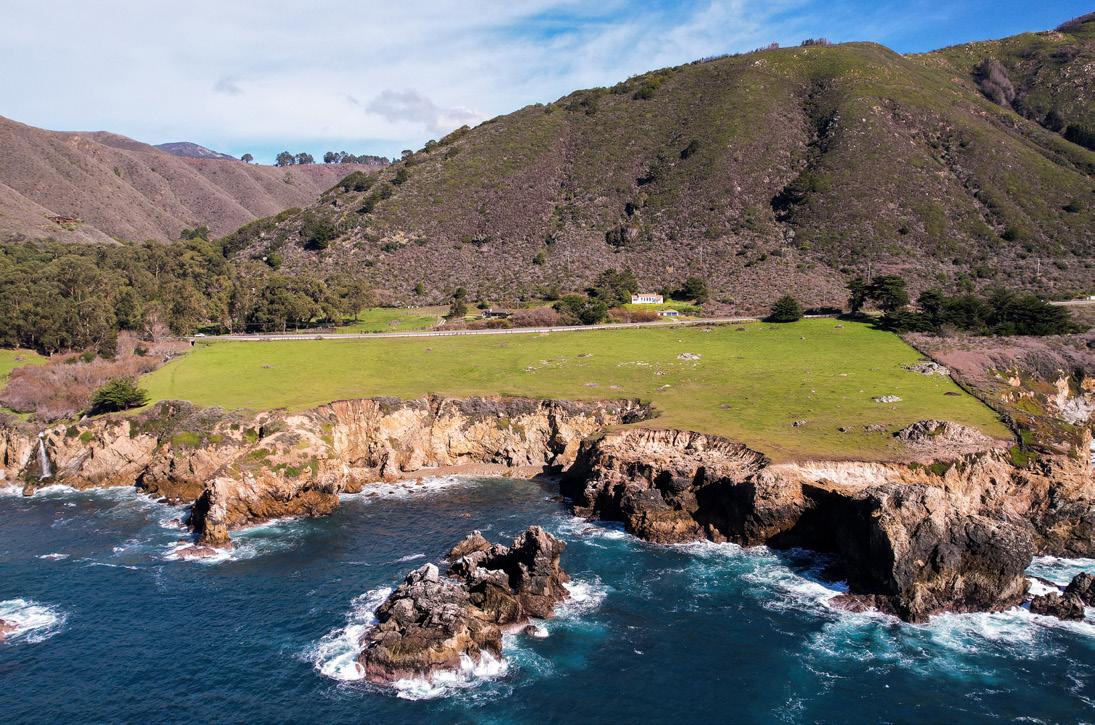
Carmel Highlands, Big Sur & South Coast
The Carmel Highlands and Big Sur area’s Q3 was highlighted by a $17M sale on the Big Sur coast. This sale contributed over half of the $33.6M in sales volume during the quarter. Seven sales during the quarter were a good number for this low-activity area. The quarter began and ended with 33 active listings on the market. There are two $10M+ listings currently in escrow in this area heading into the fourth quarter, which could set up a strong finish to the year.
Average Days on Market
120 Average Selling Price $4,803,571 versus Q2 2025
$33,625,000
versus Q3 2024 43.8% versus Q2 2025
versus Q3 2024 43.8% versus Q2 2025
22.2% no change
versus Q3 2024 361.5% versus Q3 2024 versus Q2 2025
Q3 2025 Market Breakdown
Average vs. Median Sales Price in millions
Total Sales Volume By Quarter in millions
Number of Closed Sales By Quarter
Median Sales Price in millions
Did You Know?
Local settings from around the Monterey Peninsula have provided the backdrops for more than 180 films and television shows. You’ll recognize many scenes in HBO’s award winning mini-series Big Little Lies in Big Sur and the Carmel Highlands.
“Monterey County Fun Facts”, Monterey County Convention & Visitors Bureau, 2020
Pacific Grove
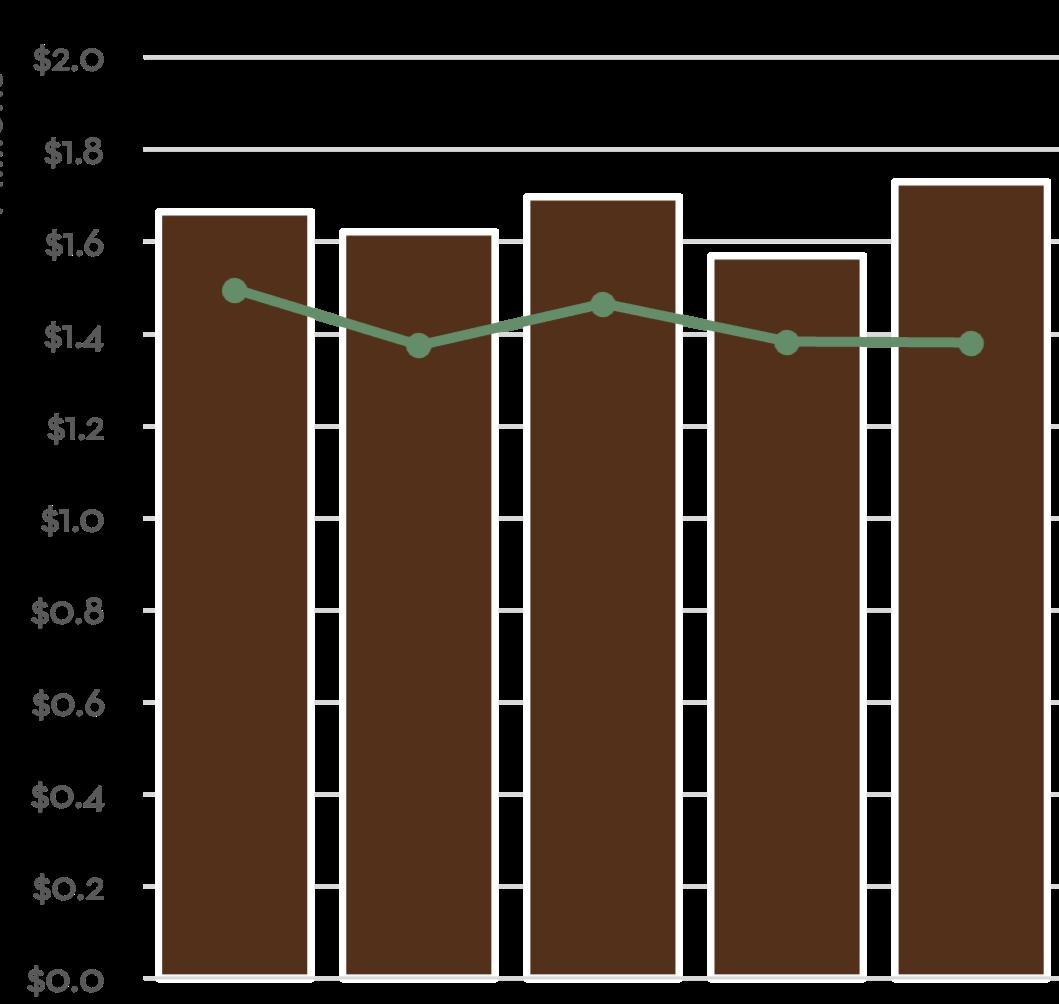
Pacific Grove’s sales numbers have been consistent all year, reaching 32 during Q3 after 31 and 32 during the previous two quarters. The average sales price during the quarter rose to $1.72M, the highest since Q4 2023. Like Pebble Beach, and unlike every other area, the average days to sell in Pacific Grove have come down in 2025 versus 2024. Q3 saw an average of just 33 days to sell in the area. Inventory has risen in Pacific Grove, starting Q3 with 32 listings and ending the quarter with 43 active homes on the market. Carmel Realty Company and Monterey Coast Realty combined to have five different Agents and teams represent clients in Pacific Grove during the quarter.
Selling Price $1,729,301
32 Sales Volume $55,337,635 Average Days on Market 33
Units Sold
Q3 2025 Market Breakdown
Number of Closed Sales By Quarter
Did You Know?
Point Pinos Lighthouse in Pacific Grove is the oldest continually operating lighthouse on the West Coast.
“Monterey
County Fun Facts”, Monterey County Convention & Visitors Bureau, 2020
Monterey & Del Rey Oaks
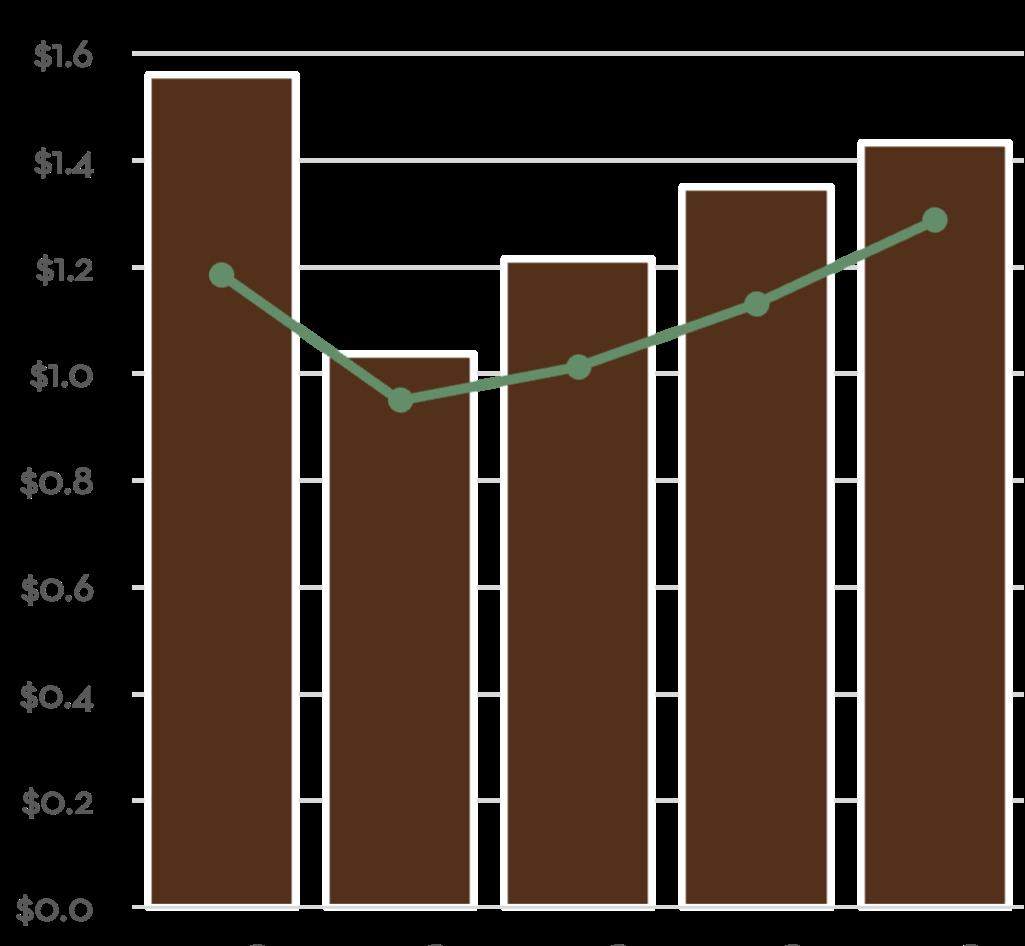
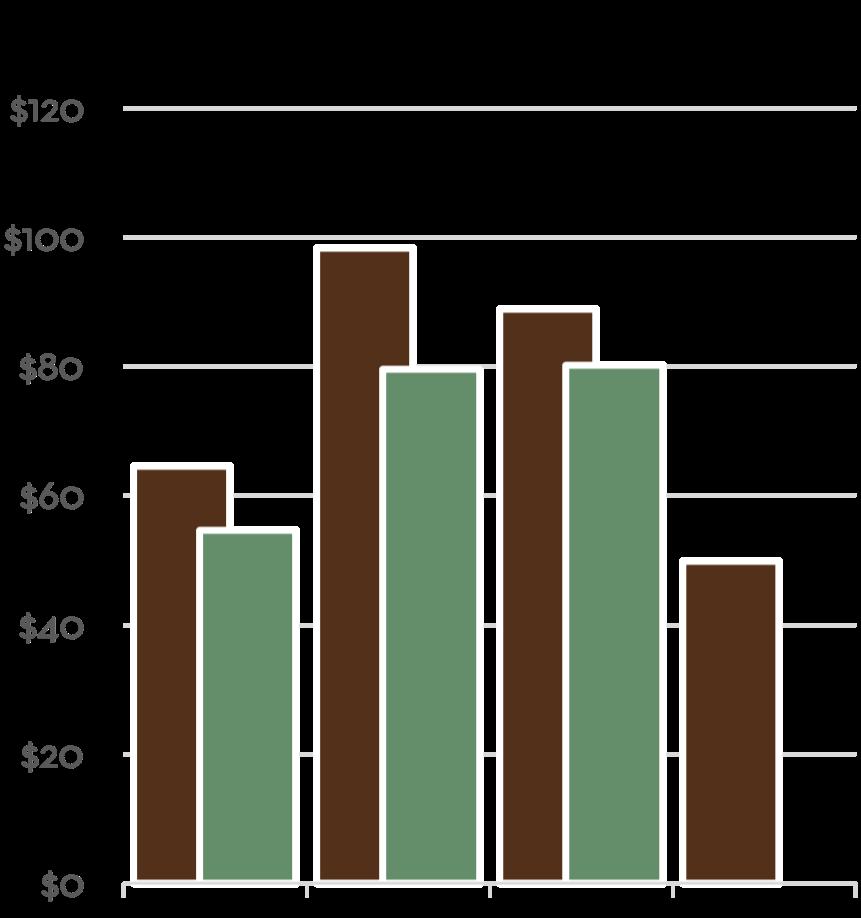
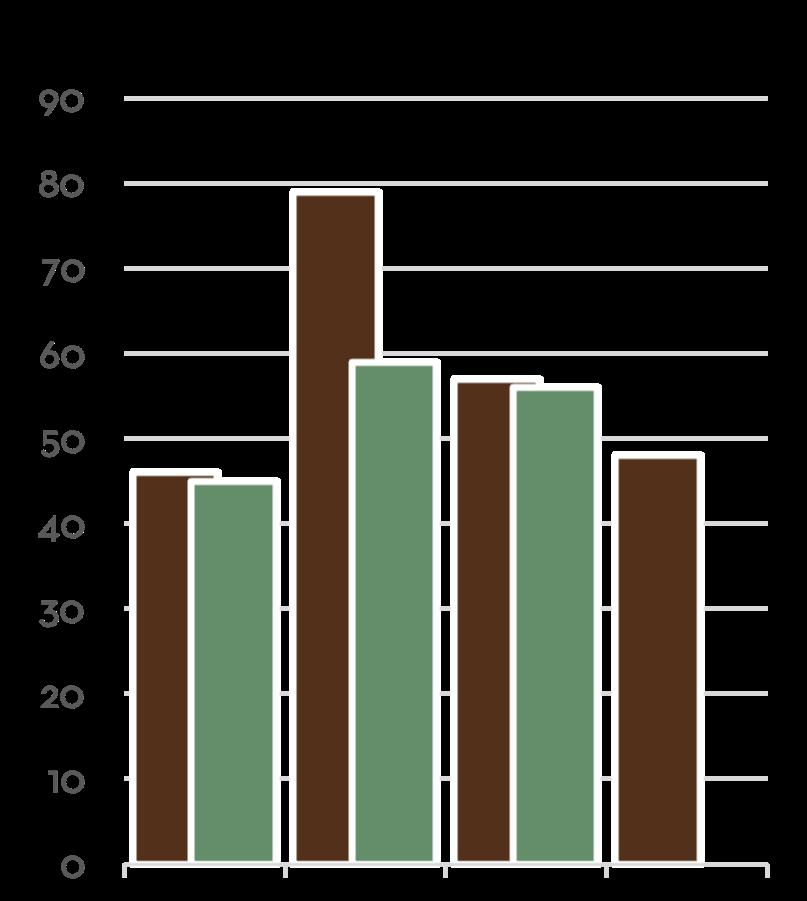
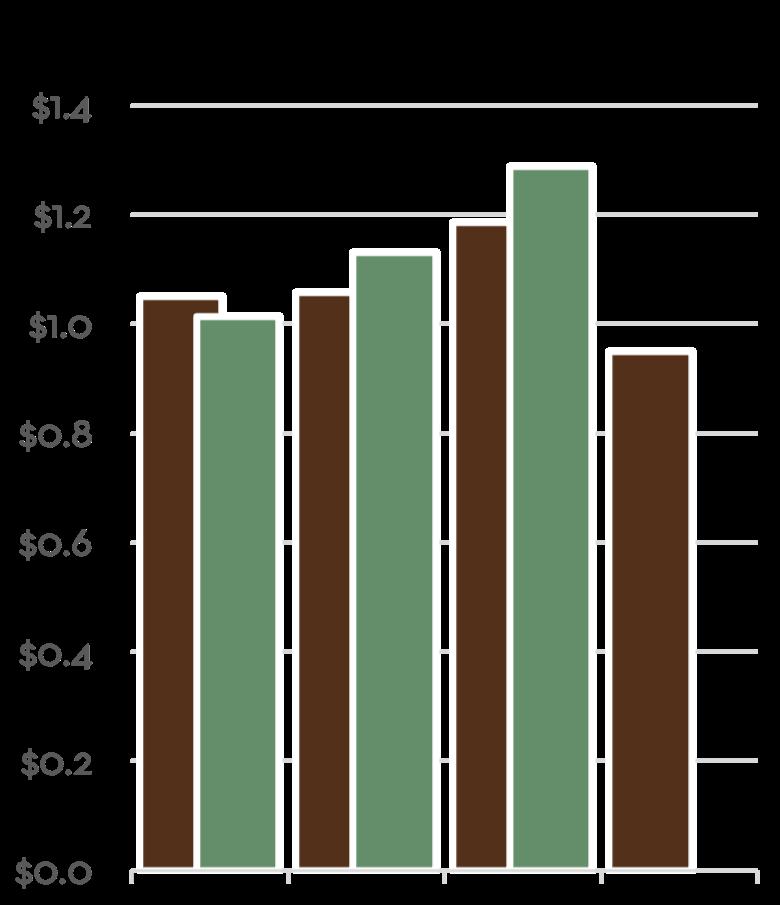
Monterey saw 56 sales during the quarter, a number onpar with 59 sales last quarter and 57 during Q3 last year. The average sales price in the area was high, totaling its second highest mark on record at $1.43M, behind only Q3 of last year. The median sales price hit its record high, totaling $1.28M for the quarter. While several areas have seen a dip in inventory from the start of Q3 to the start of Q4, Monterey has seen a substantial increase, moving from 77 to 100 homes on the market. With Buyer demand expected to remain high in the area, and interest rates slowly coming down, Monterey should see nice activity moving into Q4. Carmel Realty and Monterey Coast Agents combined to represent clients on seven different home sales in Monterey during the quarter.
48 Average Selling Price
$1,430,745
$80,121,701 Average Days on Market
11.6% no change
56 Sales Volume
9.8% 5.1%
Units Sold
Q3 2025 Market Breakdown
Did You Know?
Nearly a quarter million tons of sardines were processed on Cannery Row in 1945, the year John Steinbeck’s Cannery Row was published. Cannery Row was previously named Ocean View Avenue but was renamed to honor John Steinbeck’s well-known novel.
“Monterey
County Fun Facts”, Monterey County Convention & Visitors Bureau, 2020
Authentic Market Leaders & True Industry Experts
As the market leading luxury brokerage, for over 100 years we have consistently delivered outstanding quality and service to our clients. Our handpicked team of agents share our commitment to quality, integrity, and the community. Unmatched experience, local knowledge, and collaboration has allowed our team to achieve the highest average agent production in the market year after year. When you work with Carmel Realty Company, you can take comfort in knowing you are working with an authentic expert in Monterey Peninsula real estate.