2025 marked a solid and steady year in our local real estate market. While homes generally took longer to sell, overall sales activity increased; driven largely by stronger movement in the middle price segments. Pricing remained relatively consistent with the past couple of years, though we saw fewer transactions at the very top of the market.
Buyers are now benefiting from greater negotiating power and the ability to make more deliberate decisions. Notably, activity during the holidays was stronger than in recent years, and January has already shown encouraging momentum. With the first sale in Pebble Beach over $20M entering escrow since 2022, early indicators suggest that 2026 is beginning with promise.
As inventory increases and conditions remain balanced between buyers and sellers, 2026 is shaping up to be a healthy market on both sides. That said, strategy remains essential. Each neighborhood has its own nuances, and understanding them can make a meaningful difference in negotiations and outcomes.
For me, it’s never just about the deal. It’s about building lasting relationships and earning your trust over time. I truly value staying connected and being a resource for you, year after year.
Please don’t hesitate to reach out with any questions. Most importantly, I wish you a happy, healthy, and successful New Year.
Warm regards,
Courtney Jones
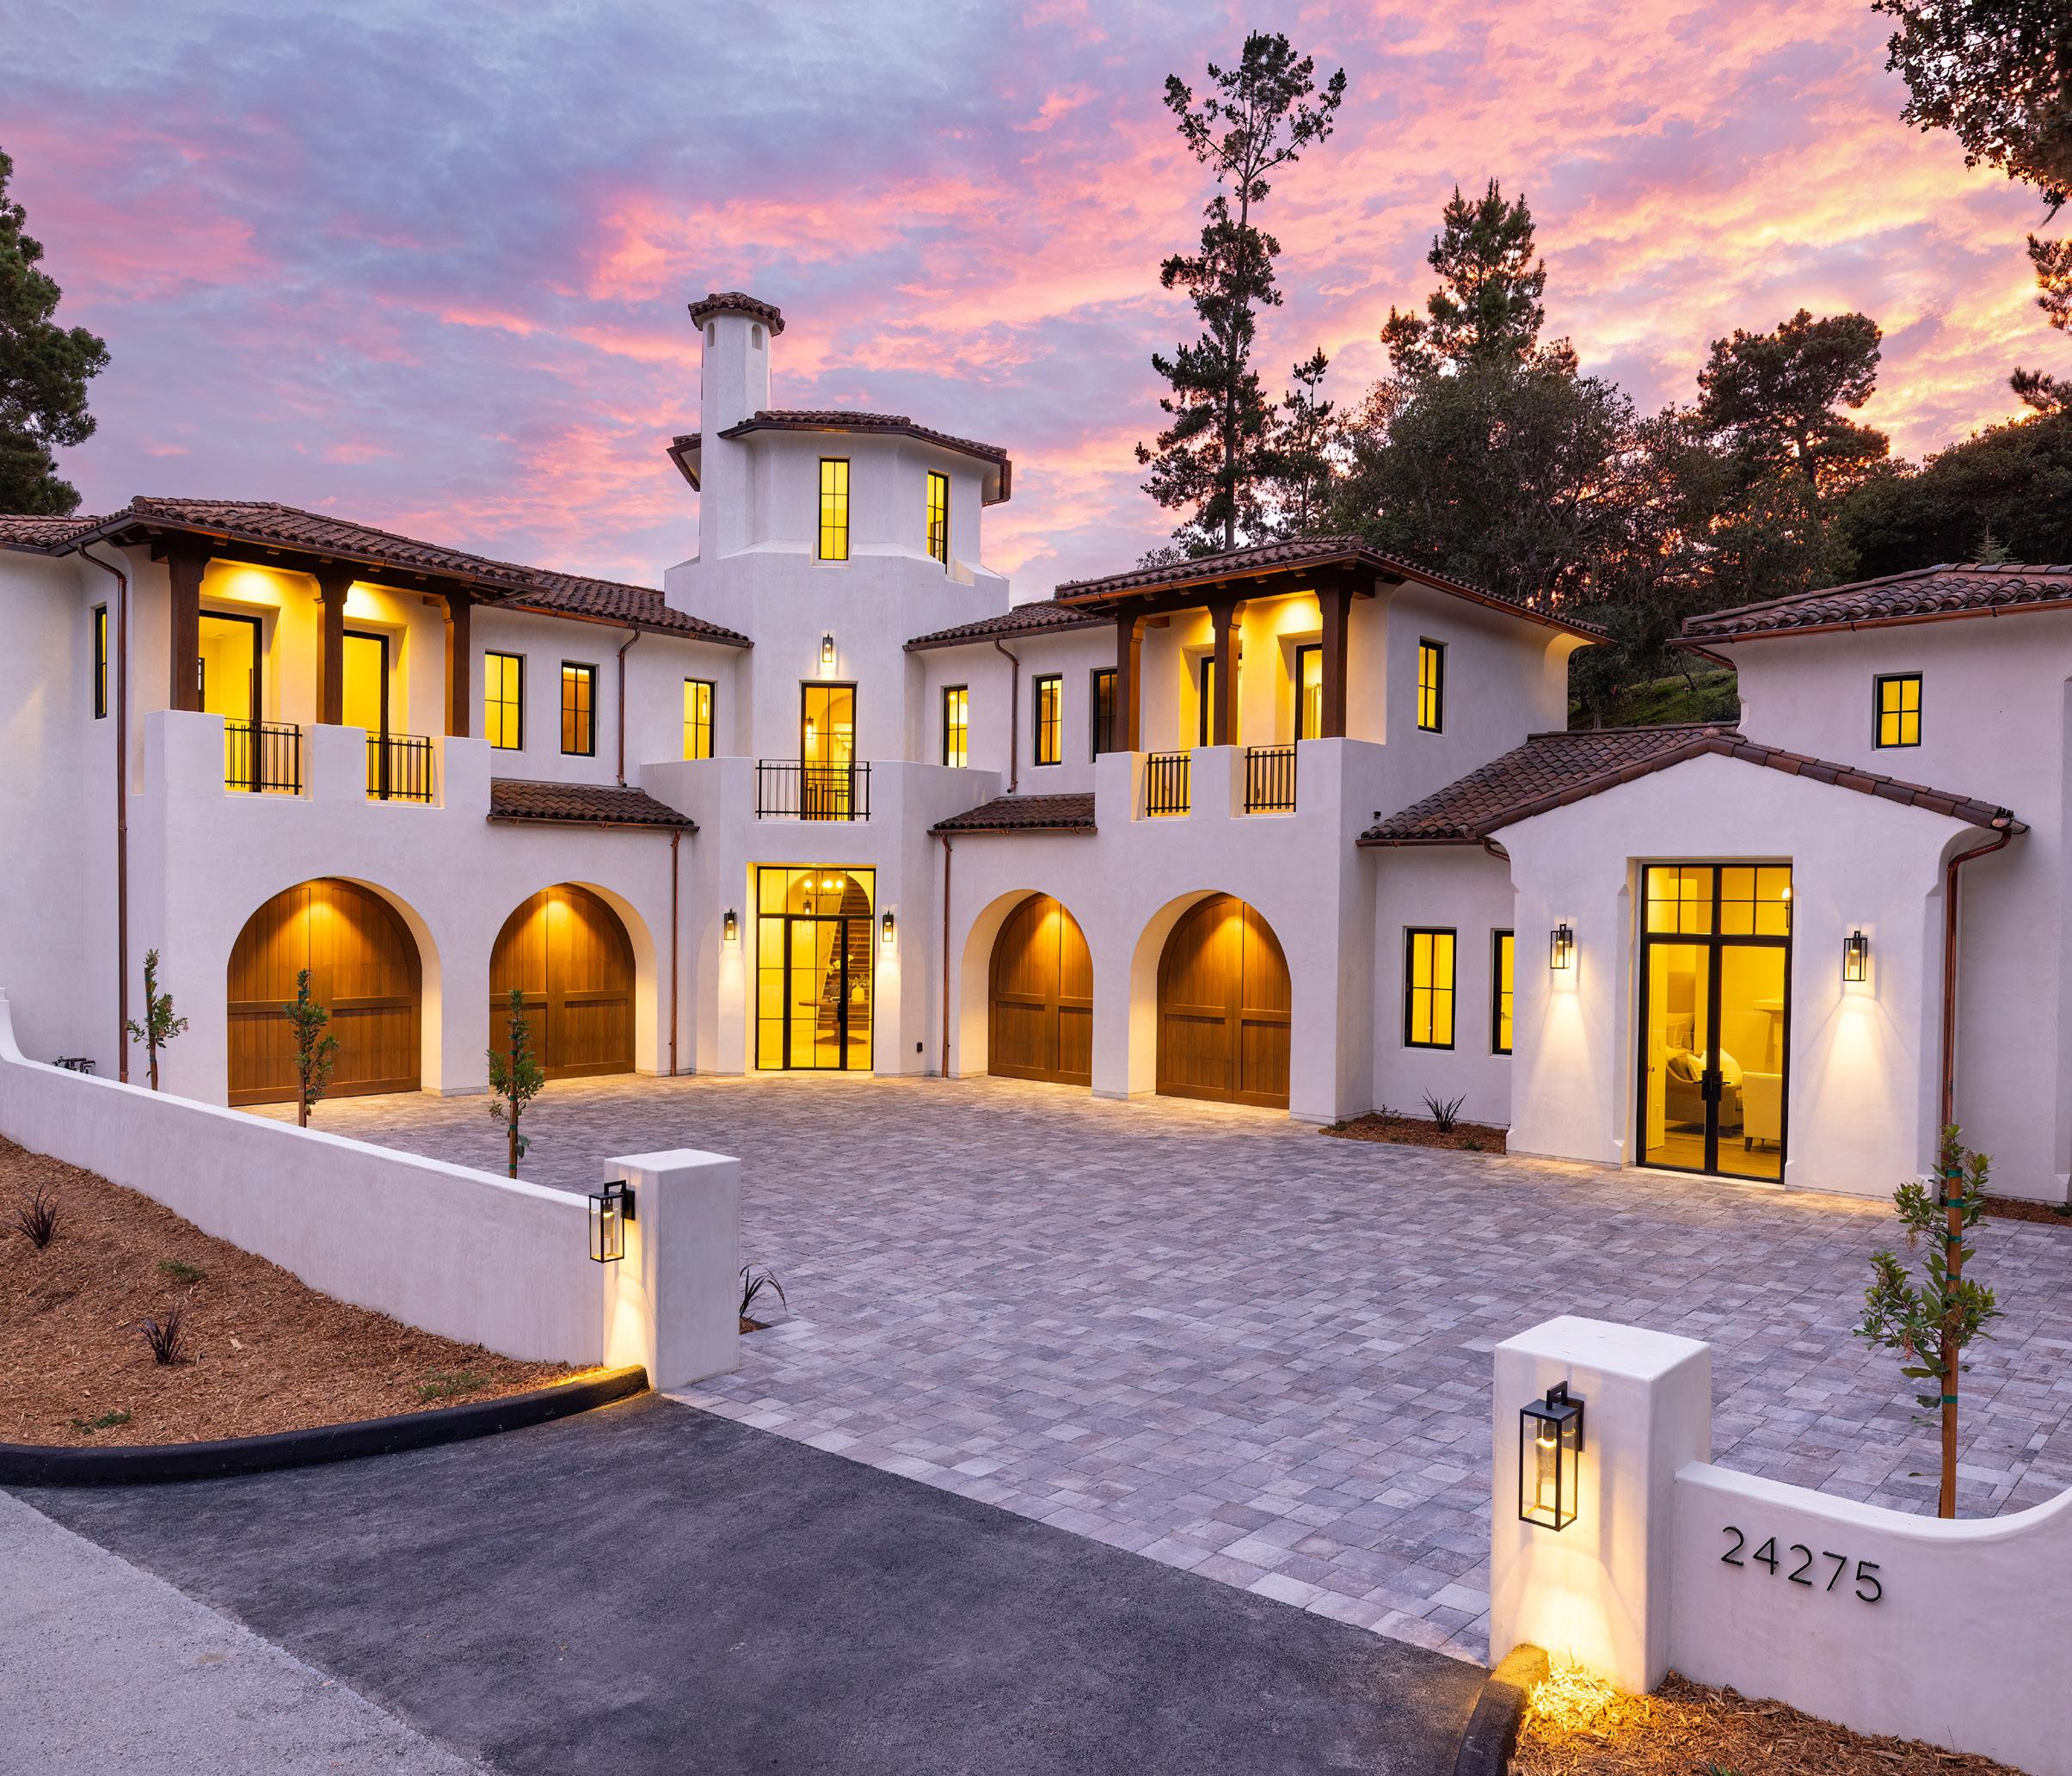
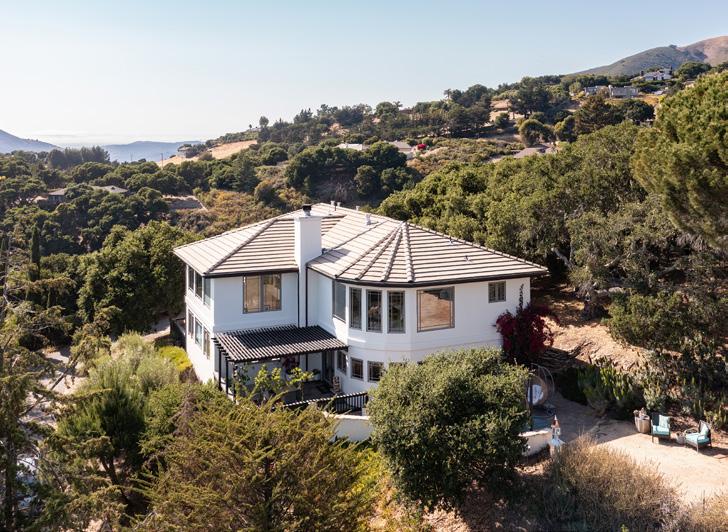
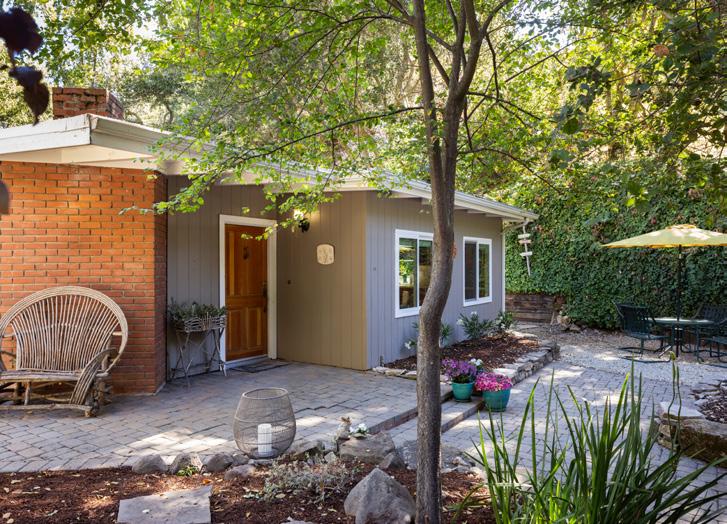
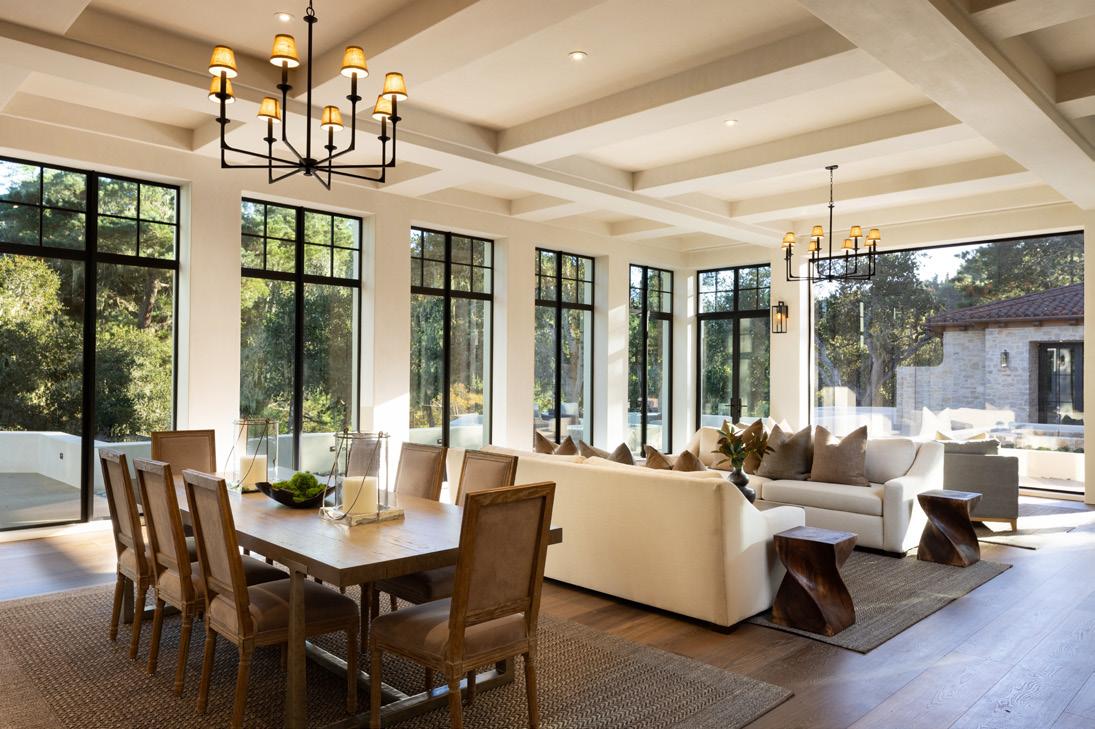
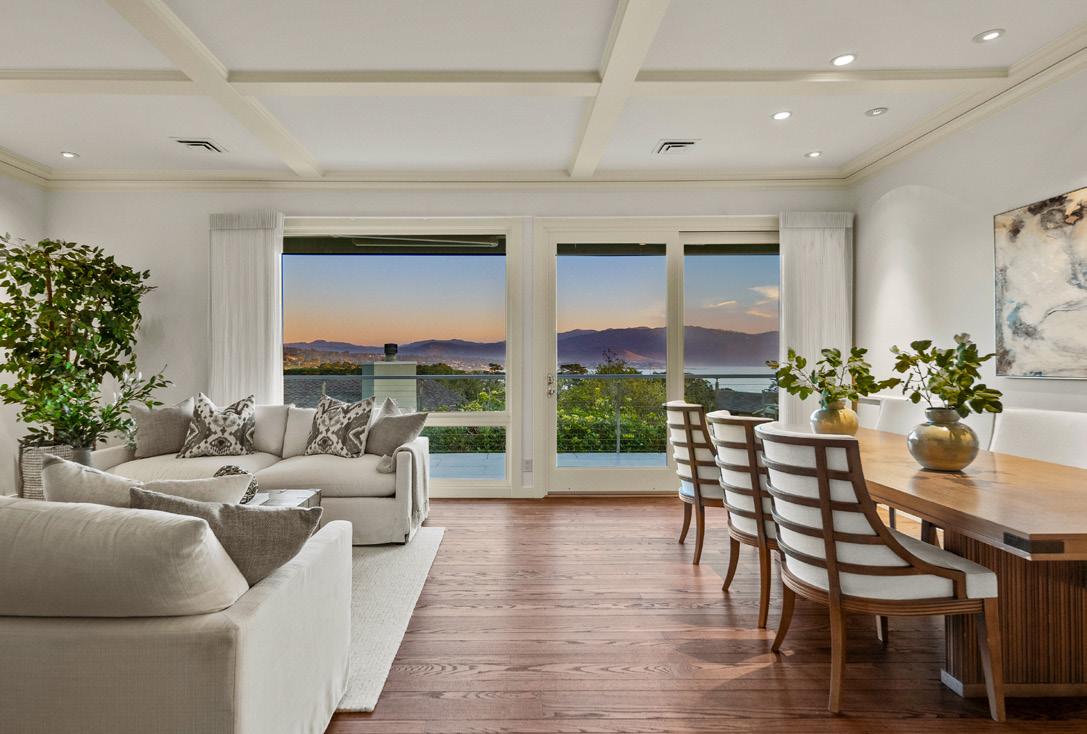
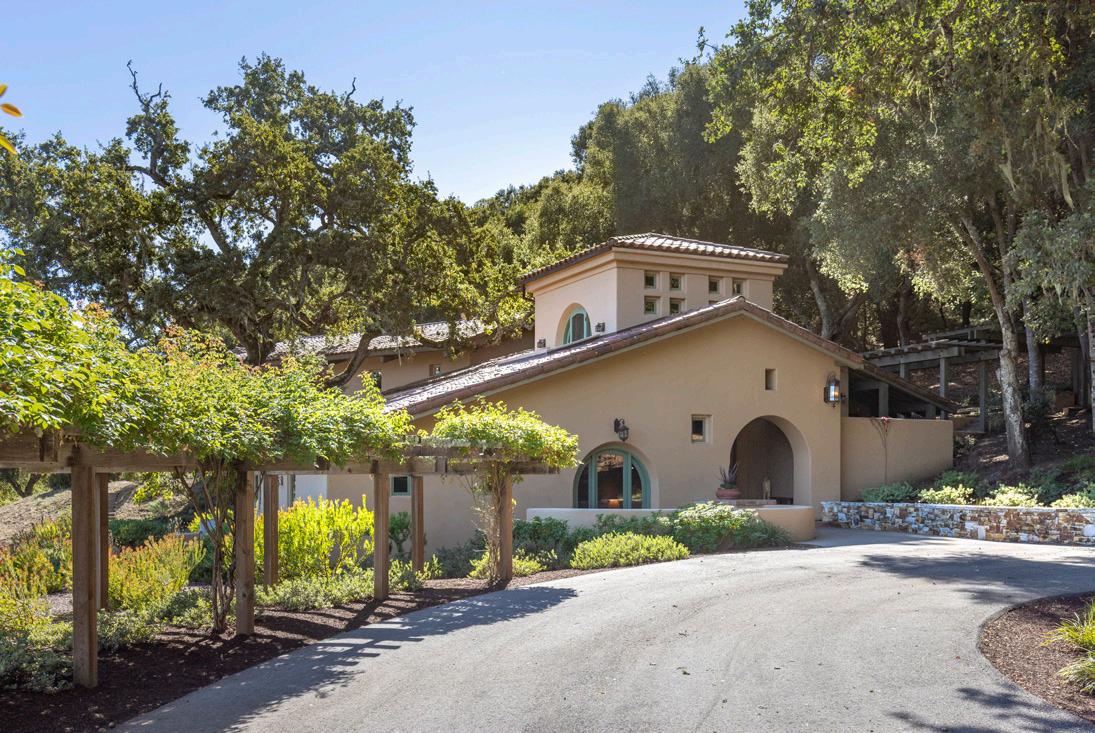
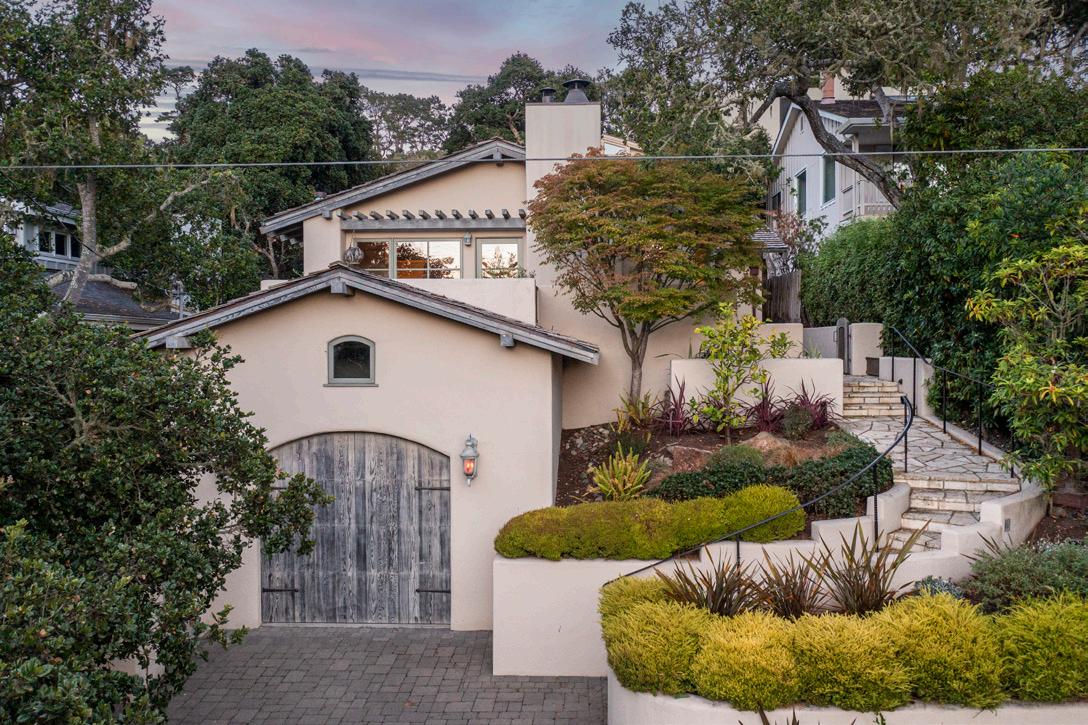
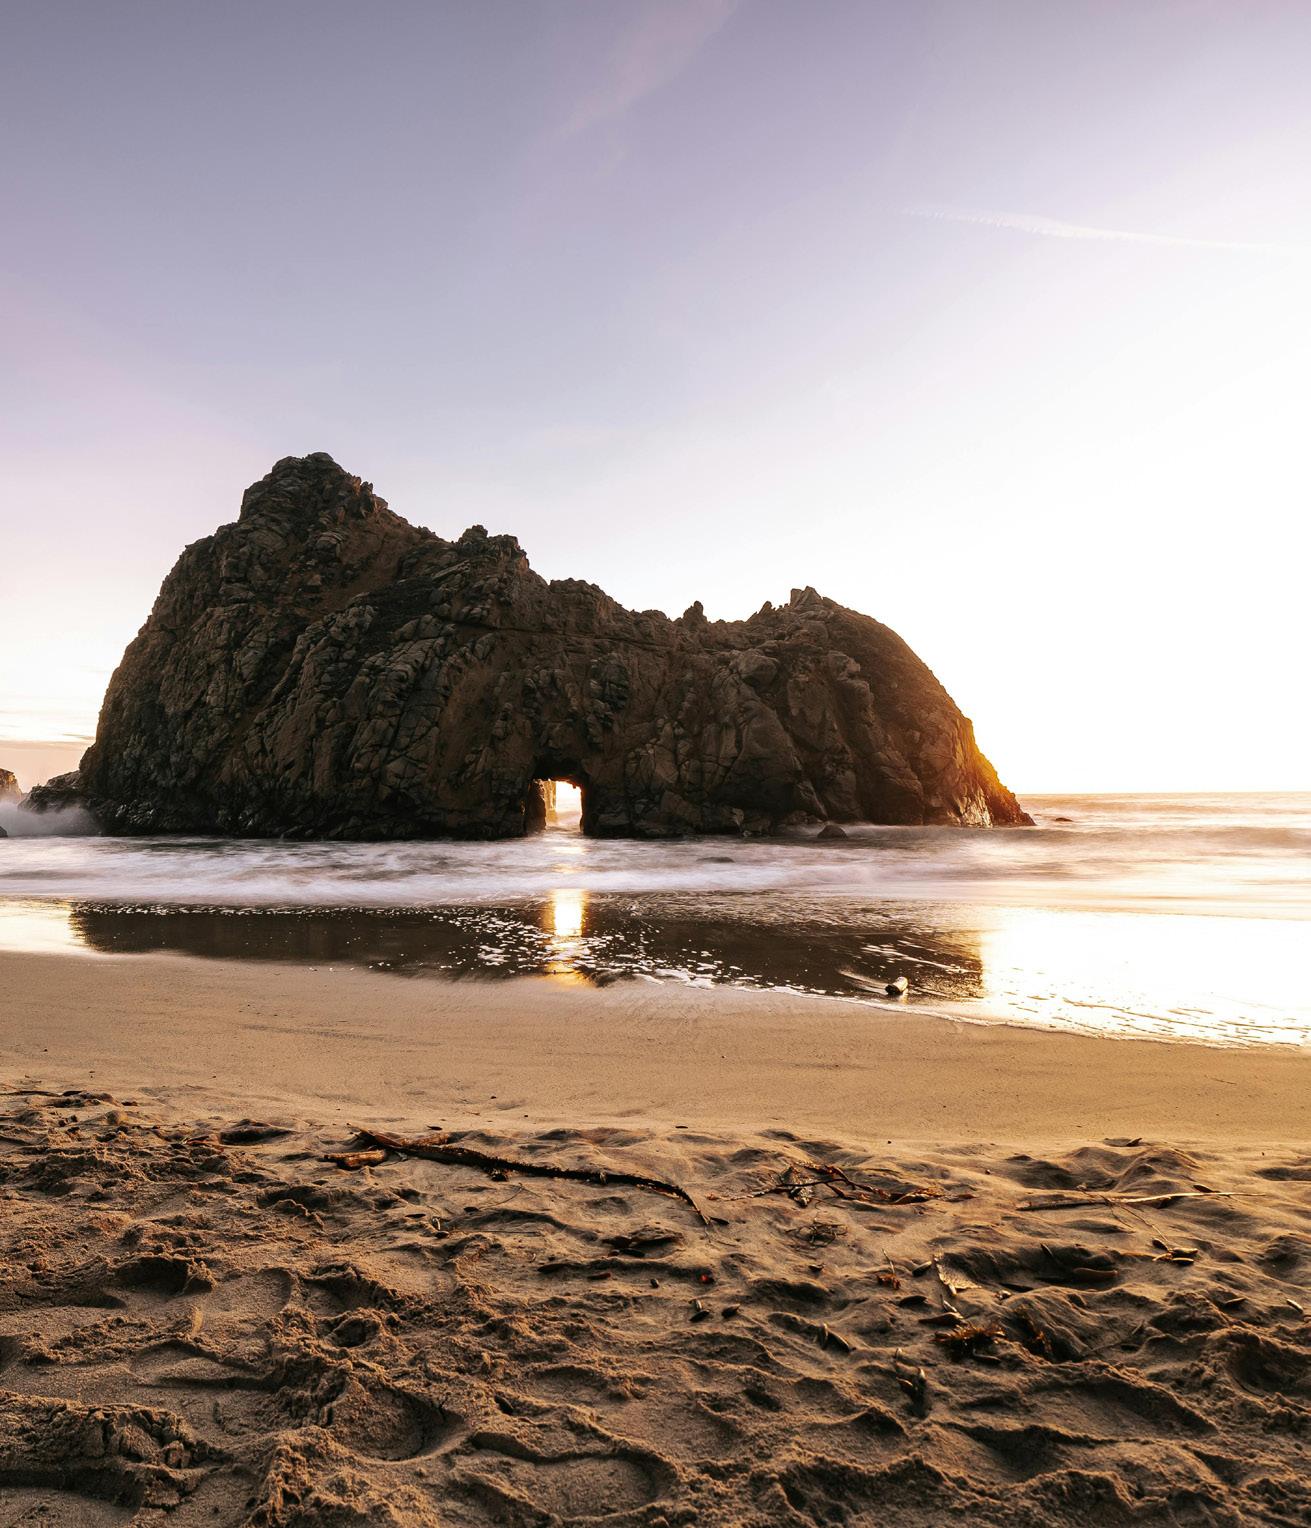
Private Home Above The Lodge at Pebble Beach
3307
Market Update
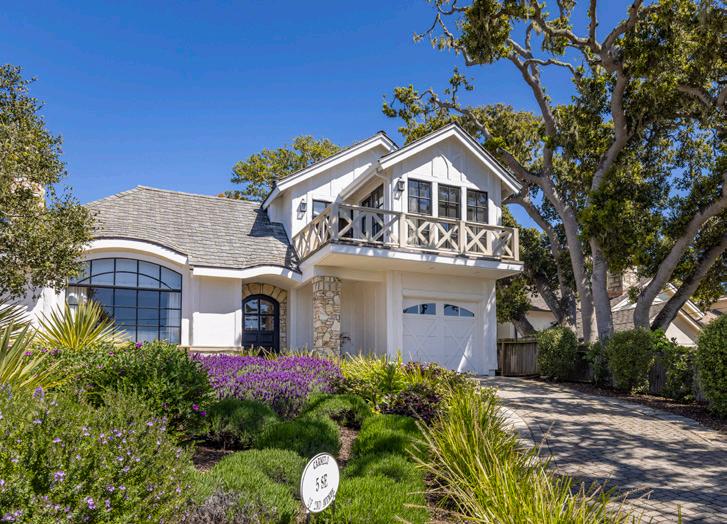
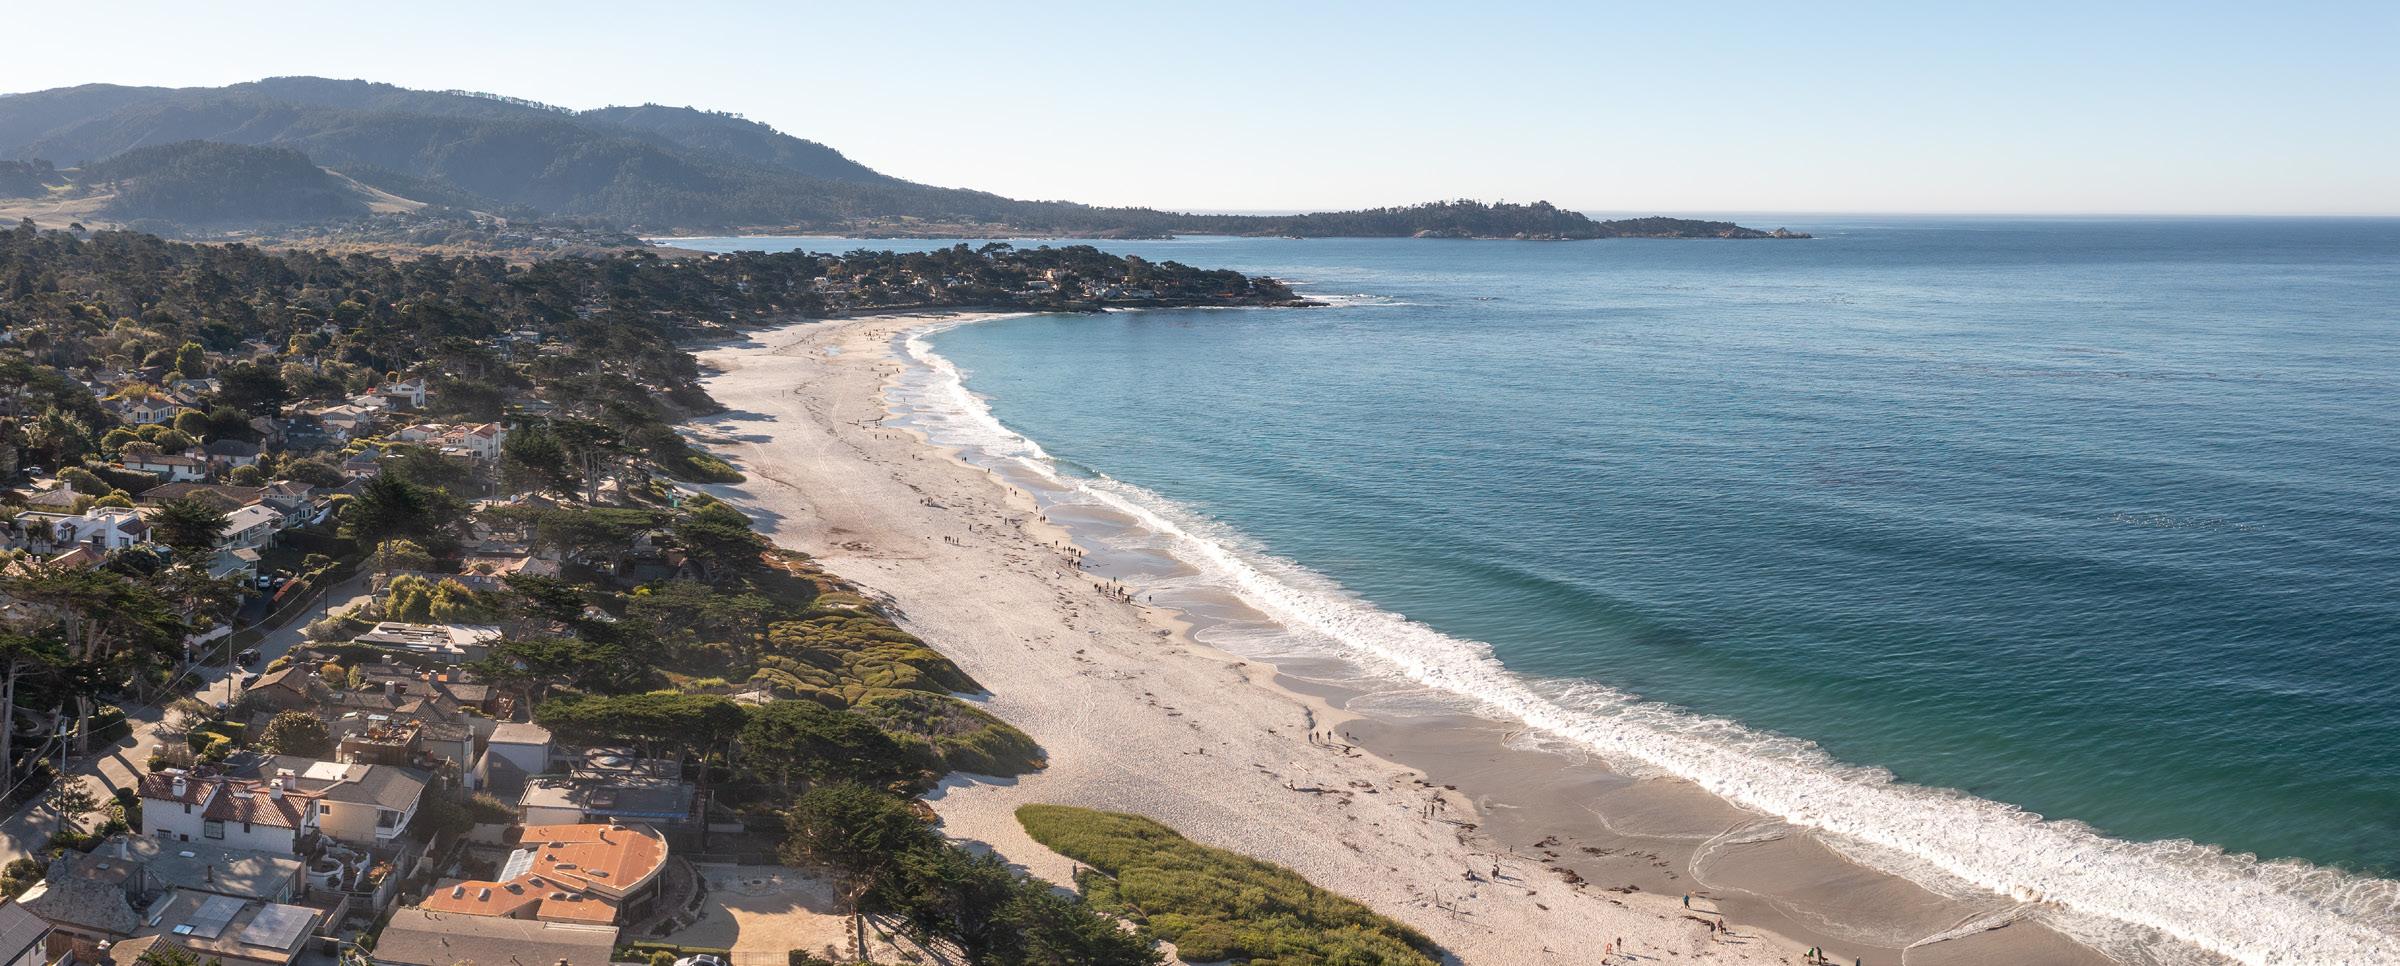
Carmel-by-the-Sea & Carmel Point
Carmel-by-the-Sea & Carmel Point
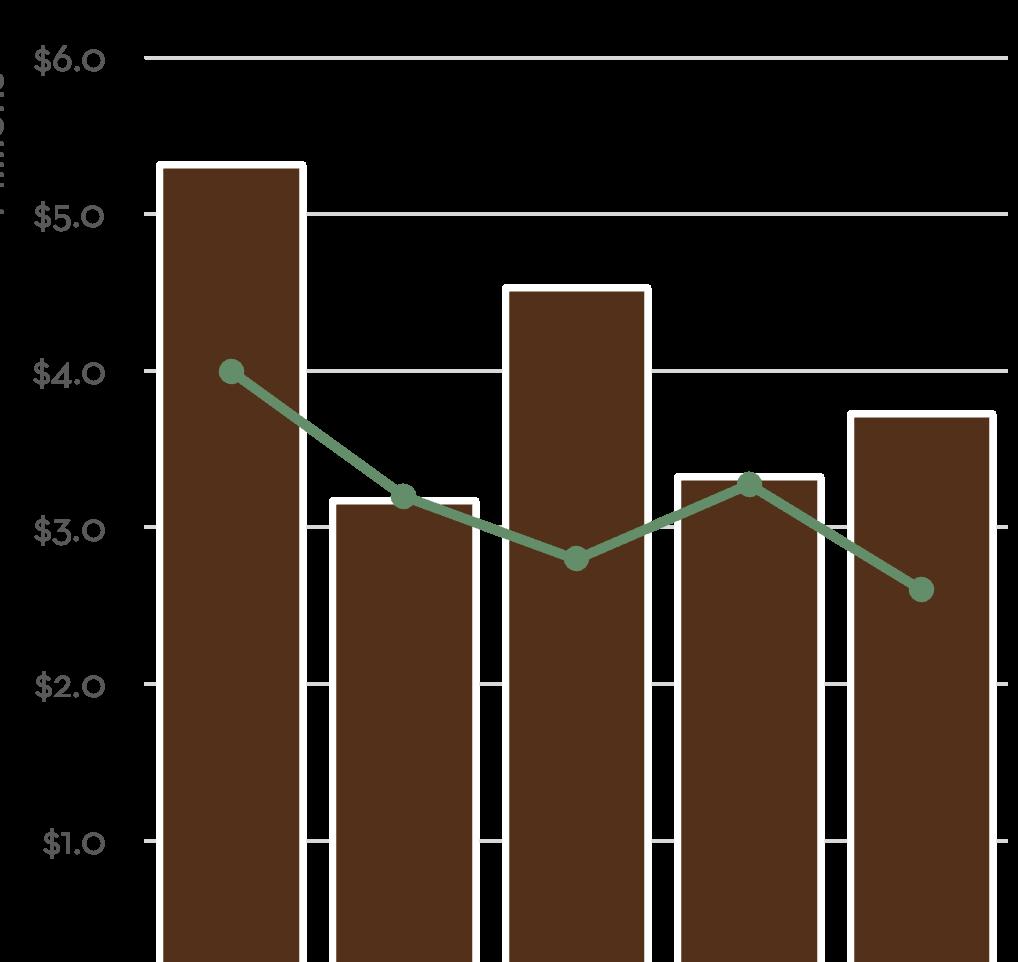
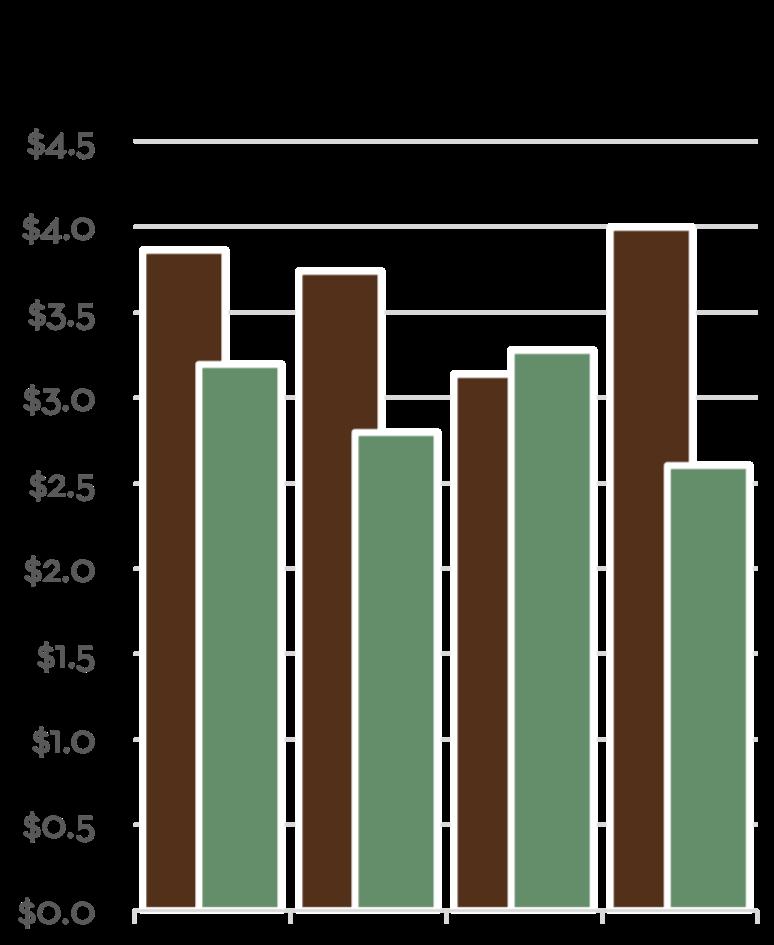
The fourth quarter of 2025 saw 23 sales in Carmel-by-the-Sea, which was down from 32 sales last quarter, but up from 19 during Q4 2024. The average sales price of $3.72M during Q4 was just above 2025’s yearly average sales price of $3.71M. The average number of days to sell in the area during Q4 was just 45 days. This was more typical of a count we saw during 2024, when the average number of days finished at 43 for the year. 2025’s average came in almost 50% higher at 64 days to sell. Carmel Realty Company was proud to have Agents represent the seller of the top sale and the buyer for the second highest sale during Q4.
Usanditia ne endem. Es ellictor sitat andendam et quae omnimendamus il ium sapieni mustenis rerat pera et utes corerem nimus et, testrum faccusandus. Tate nonsequi doloris sus natem debis mos earcipsapid quia volum que si acestem unt quos volor mo ma veliquam harum re ne laut accus alic tentis eos a simpos apiet eum fuga. Ut quiae simincit aut omniantiis dem rerehenem ipit quat il ipsum re ni optatur, con necabore magnatur, niae. Omnim debit et occum quidel ius ma diorepeliat vendio enest, con core voloratiam qui officiis dolupiet lignate nisquas quam, corendae magniet officimos mi, que occat minus, ommo cone omnitem volorest eictian destem. At officie nditiore quassita idelit quiam, cuptatati dolorestio volorrovide sitiur as as expeles ratiasperis eaquo
Carmel-by-the-Sea experienced a modest year in both sales transactions and sales volume. The number of sales came in at 103 for the year, up 7.3% from 96 sales last year. Sales volume was down 8.5% due to the mix of sales that took place during the year. 2025 saw 19 sales over $5M in the area, the same as 2024, but last year these $5M+ sales brought $35M in additional volume. In addition, 2024 saw eight additional sales in the $3M-$5M range than 2025. All this led to an average sales price drop of almost 15% year-overyear. Though average prices were down this year, we still believe homes in the area appreciated somewhere in the 1-5% range, more typical of what was seen across the entire Monterey Peninsula.
Average Selling Price $3,706,691 48.8% 8.5% 14.7%
Average Days on Market
64
Units Sold
103 Sales Volume $381,789,208
versus 2024 versus 2024 versus 2024 versus 2024
7.3%
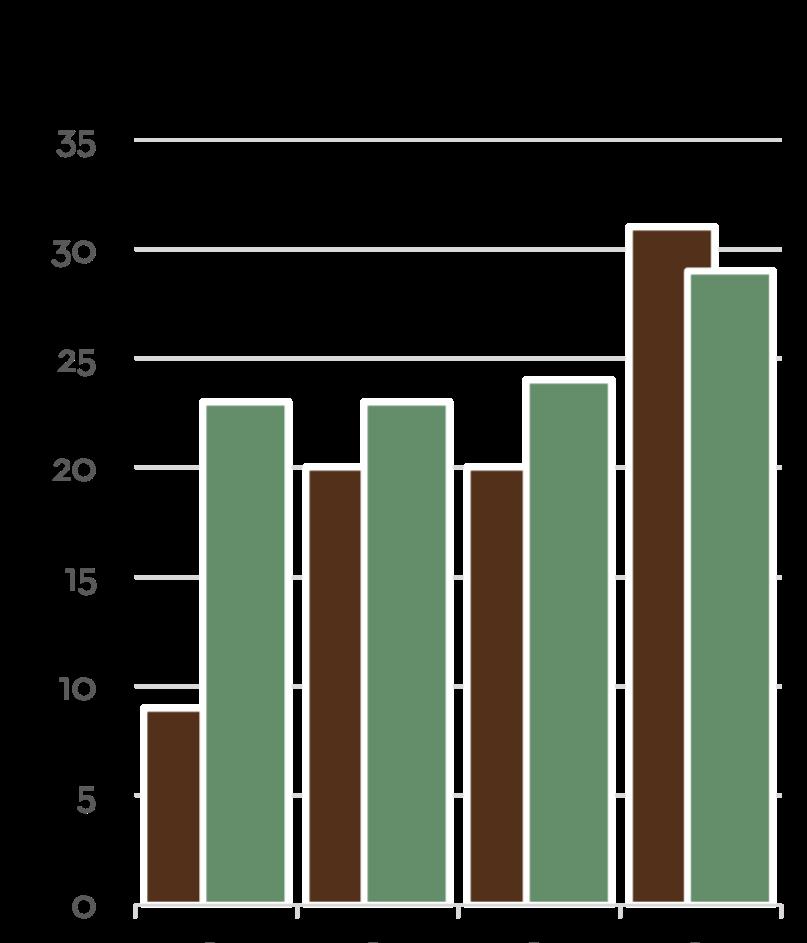
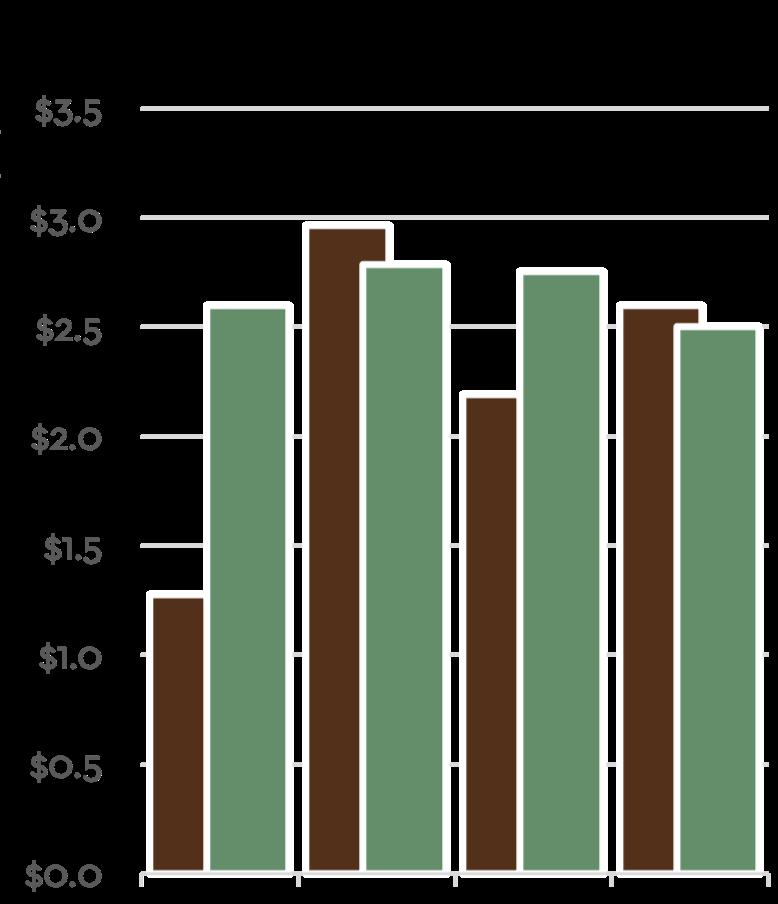
2025 Quarterly Market Breakdown
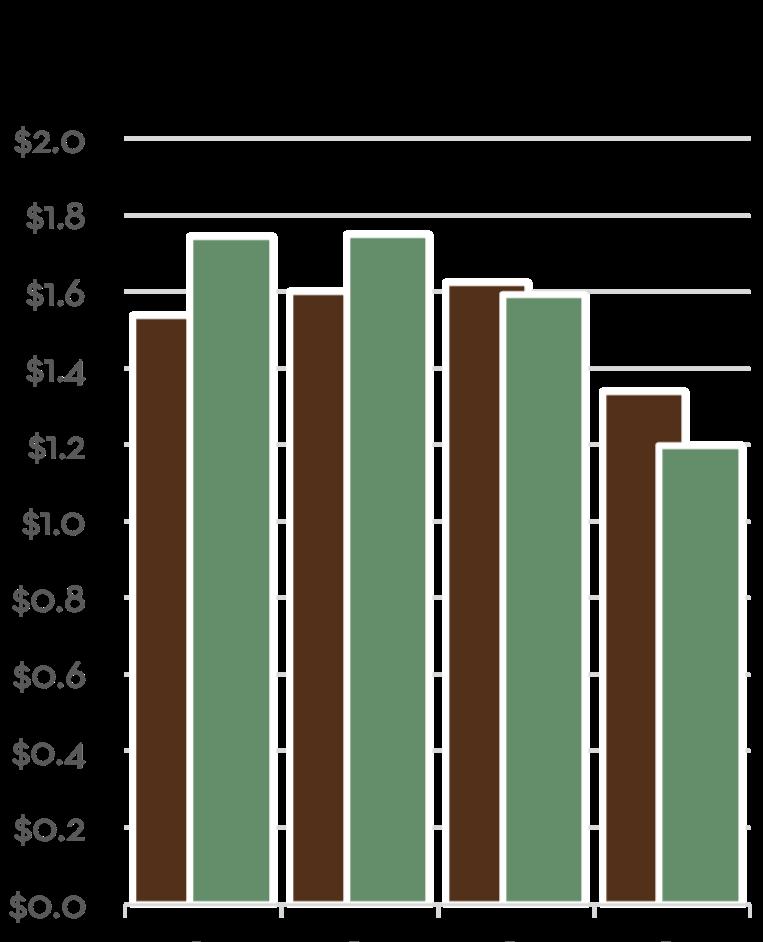
Average vs. Median Sales Price in millions
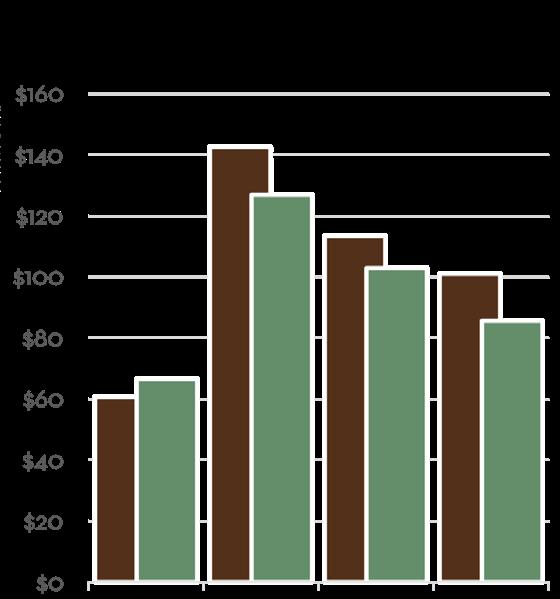
Total Sales Volume By Quarter in millions
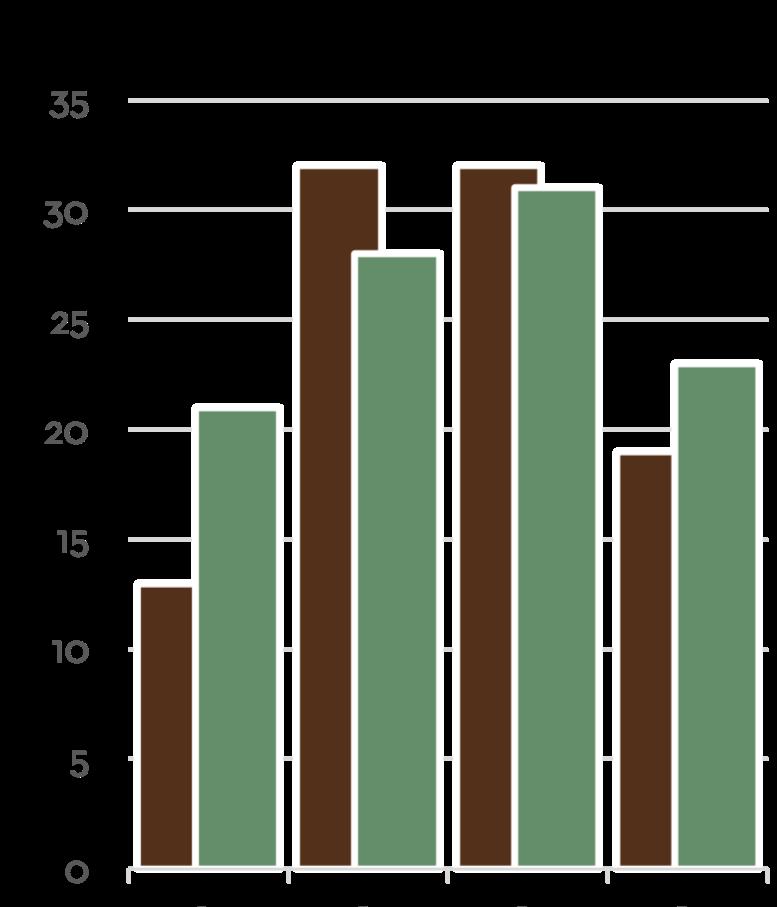
Number of Closed Sales By Quarter
Did You Know?
Median Sales Price in millions
Carmel-by-the-Sea is known for attracting various celebrities and artists. Clint Eastwood served as mayor of the village from 1986-1988. Other notable celebrities, artists and writers who have called Carmel home include Doris Day, John Denver, Ansel Adams and Jack London.
“Monterey County Fun Facts”, Monterey County Convention & Visitors Bureau, 2020
Greater Carmel
Carmel Woods, Mission Fields, Hatton Fields, Carmel Hills, High Meadows, Jacks Peak, Carmel Meadows
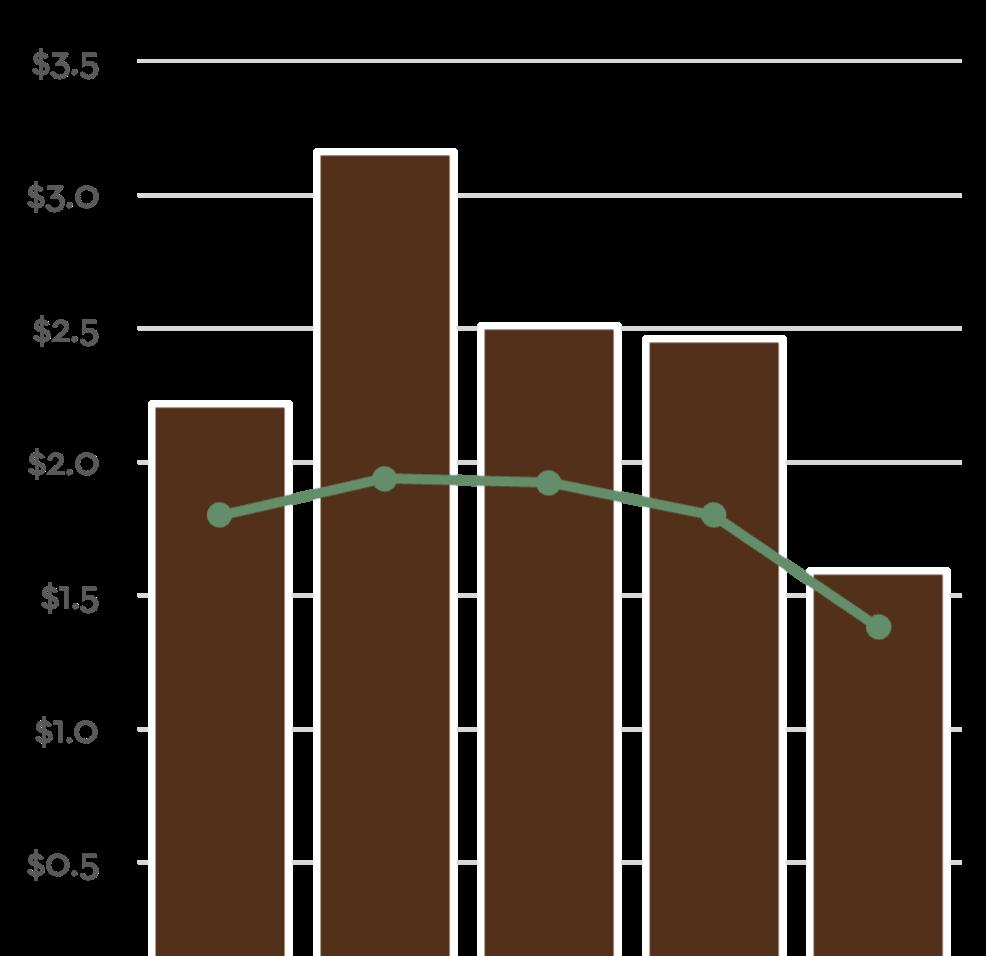
The Greater Carmel area saw 15 sales during Q4 2025, the same as last quarter and two more than Q4 2024. While the number of sales was the same, the average sales price was very low during the quarter, finishing at $1.59M, down 35.3% from last quarter. The number of sales for the year equaled last year’s total of 60 sales. While the average sales price was low during Q4, across 2025 as a whole, the average sales price was strong in the area, reaching a yearly record of $2.38M. Total sales volume for the year was up 10.7% to $142.5M. The average days to sell jumped 35% year-overyear from 40 days to 54 days.
Average Days on Market 54 Average Selling Price $2,375,180 10.7% 10.7%
35.0%
versus 2024 versus 2024 versus 2024
60 Sales Volume
$142,510,800
Units Sold
no change versus 2024
2025 Quarterly Market Breakdown
Average vs. Median Sales Price in millions
Total Sales Volume By Quarter in millions
Number of Closed Sales By Quarter
Median Sales Price in millions
Did You Know?
Robert Louis Stevenson modeled Treasure Island’s Spyglass Hill after Point Lobos State Reserve near Carmel. “Monterey County Fun Facts”, Monterey County Convention & Visitors Bureau, 2020
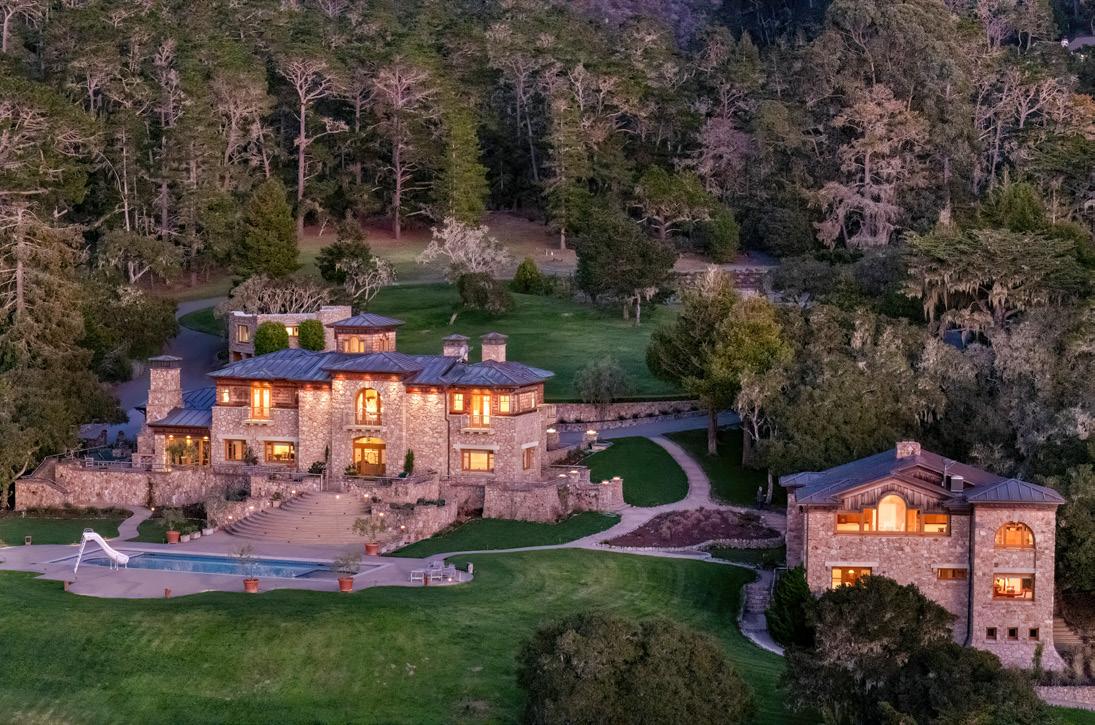
Carmel Valley
Including Santa Lucia Preserve
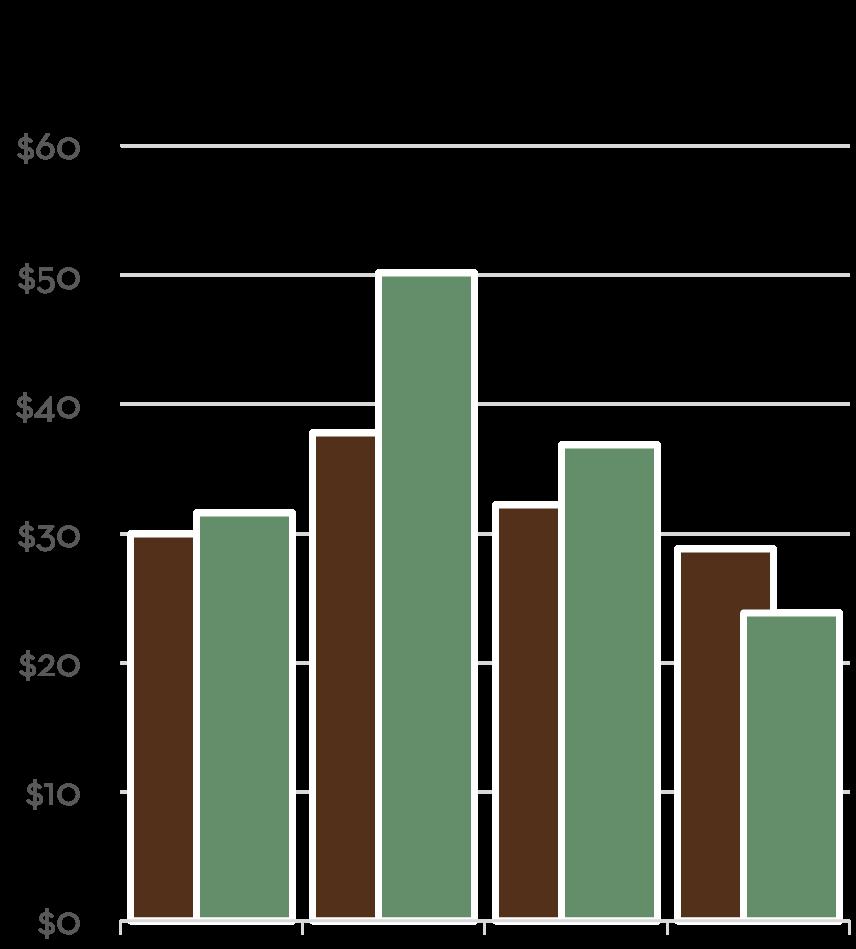
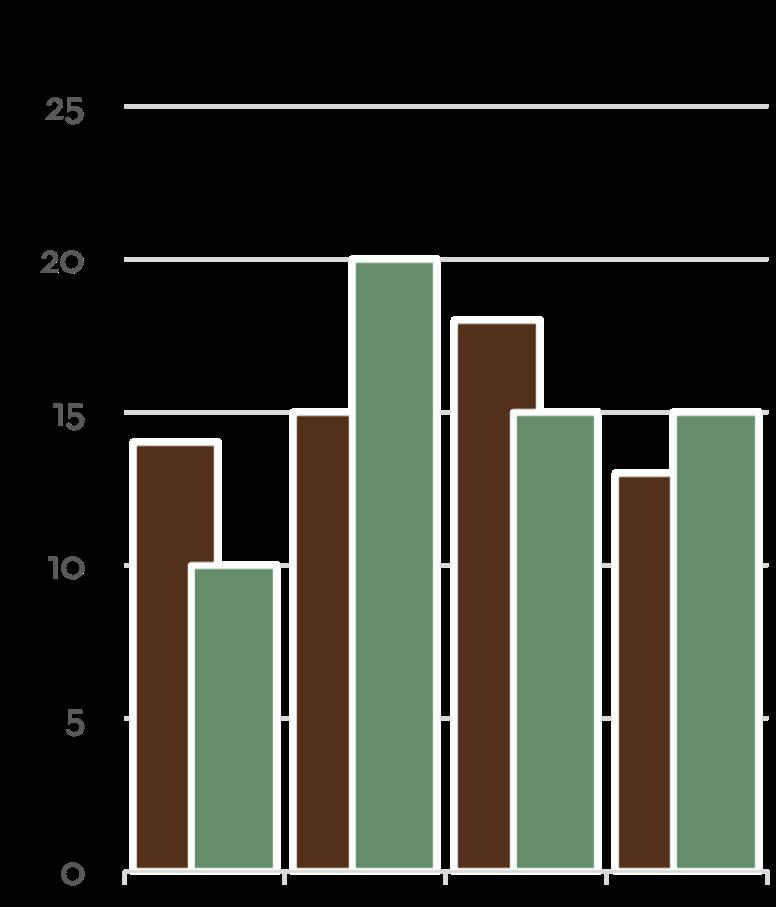
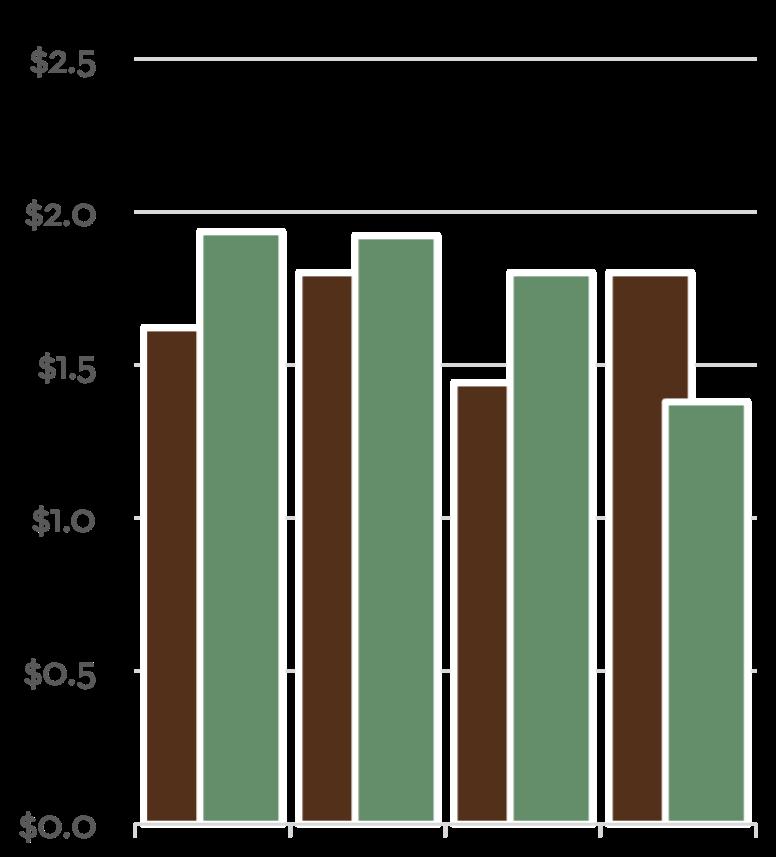
Like Greater Carmel, Carmel Valley saw a much lower average sales price number during Q4 versus the first nine months of the year. The average sales price was $1.54M during the quarter, down over 17% from Q3. The number of sales during the quarter came in at 49, just 5 off Q3’s total, and two more than Q4 last year. Carmel Realty Company & Monterey Coast Realty combined to have eleven different Agents and Agent teams represent clients in this area during Q4.
For the year, Carmel Valley saw 181 sales, up one from 180 in 2024. The average sales price dipped 9.6% from $2.08M in 2024 to $1.88M in 2025, as an increased number of lower-priced homes sold over the course of the year. The average days to sell in this area jumped just over 35%, from an average of 64 days to 84 days, the second highest of all areas, behind only Carmel Highlands.
Average Selling Price $1,882,971 9.6% 35.5% 9.1% 0.6%
Average Days on Market 84
181 Sales Volume $340,817,750
versus 2024 versus 2024 versus 2024 versus 2024 Units Sold
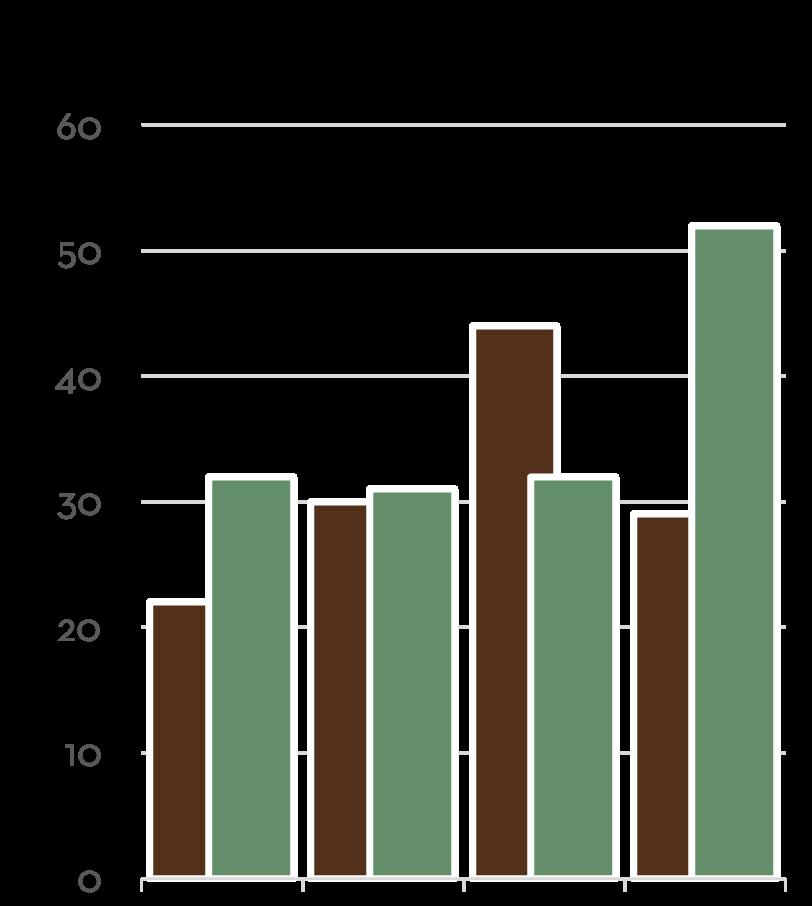
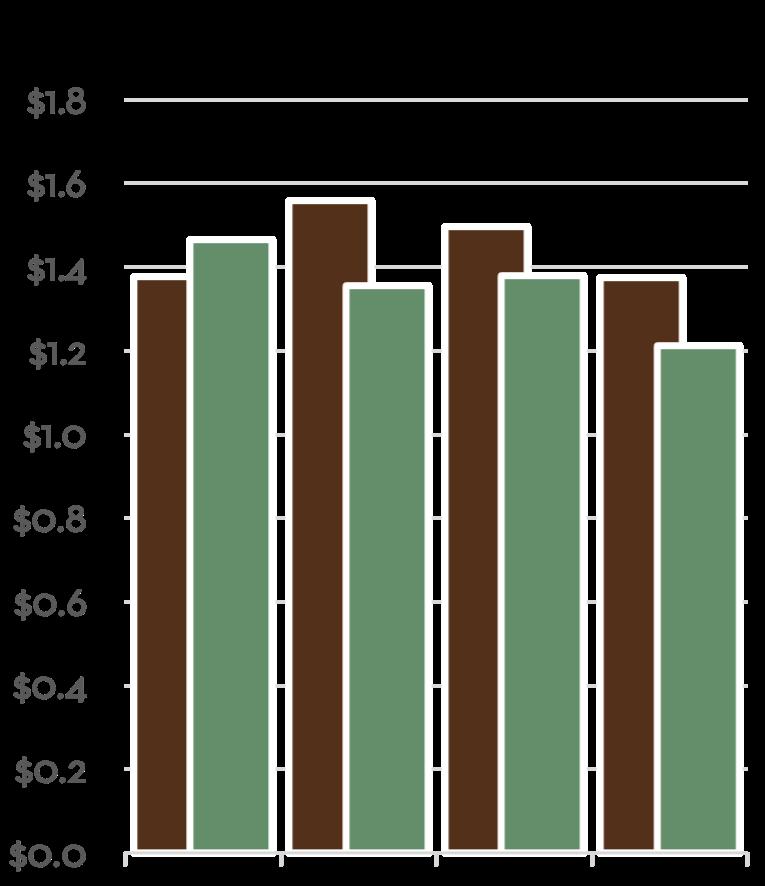
2025 Quarterly Market Breakdown
Average vs. Median Sales Price in millions
Total Sales Volume By Quarter in millions
Number of Closed Sales By Quarter
in
Did You Know?
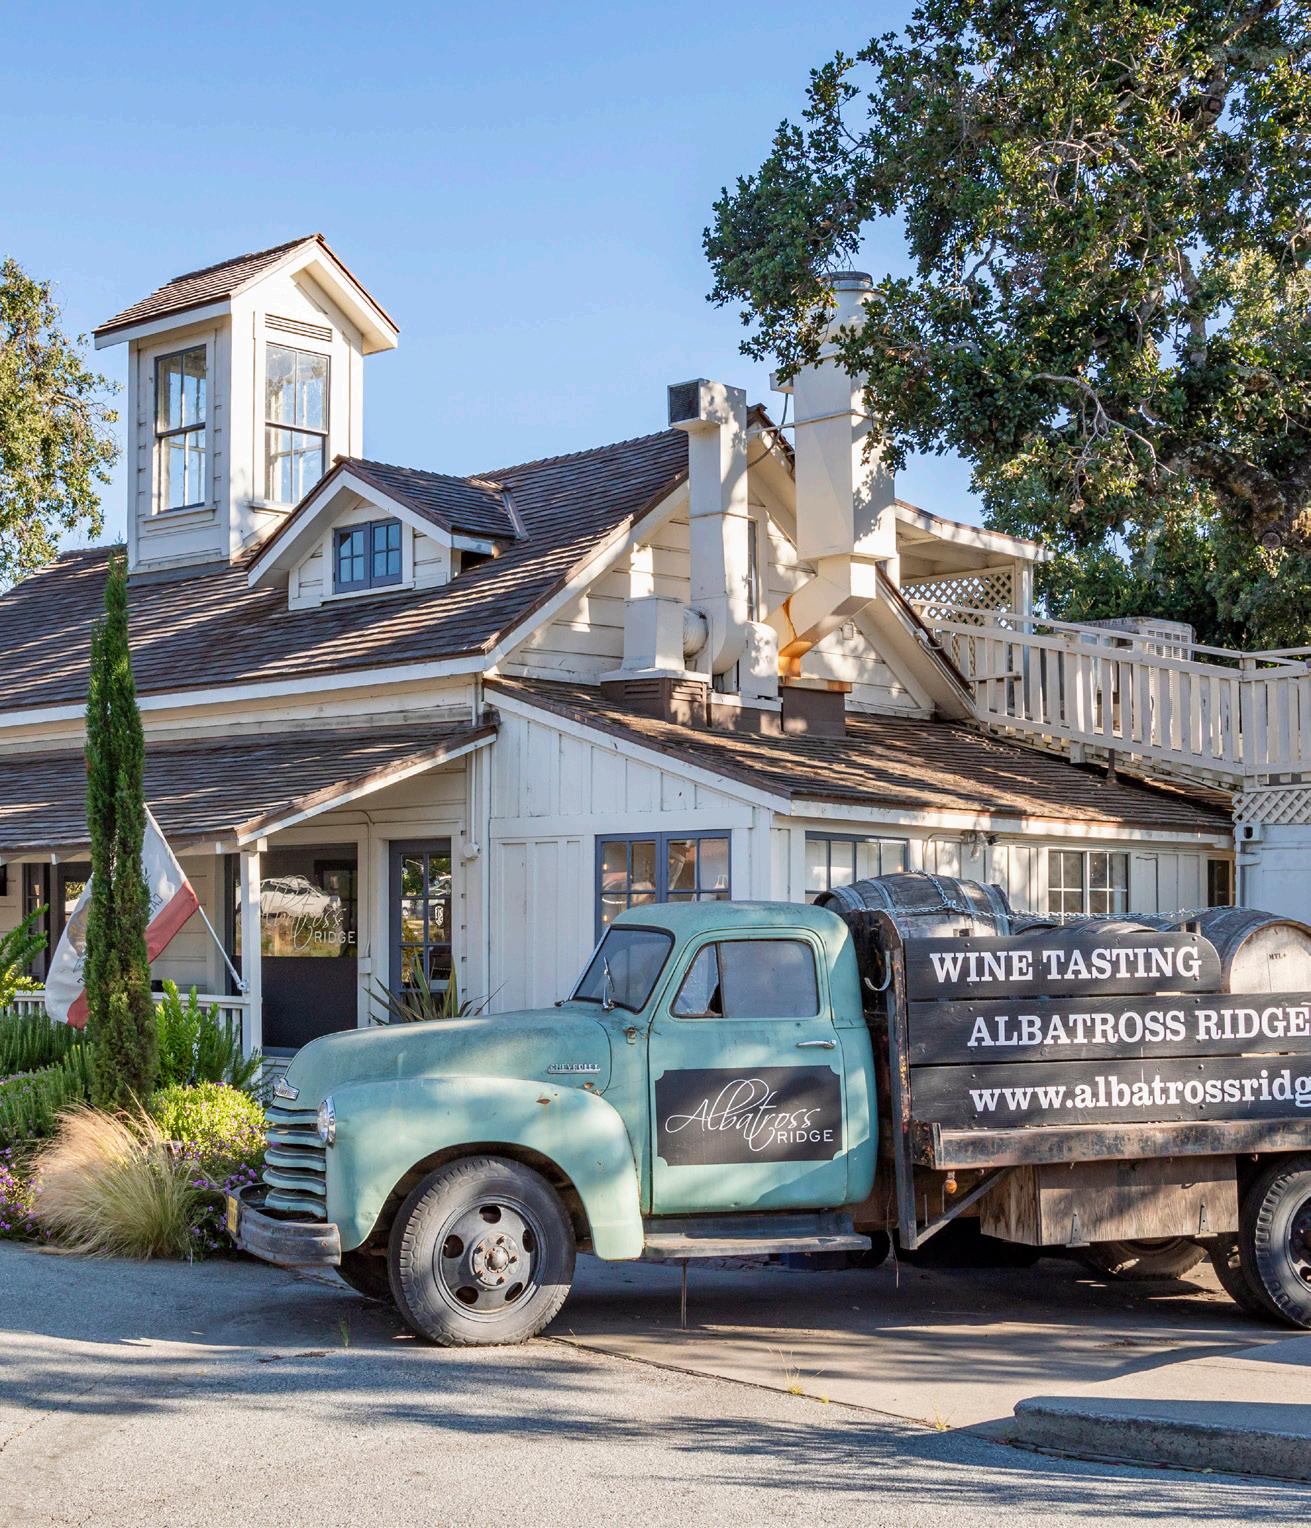
Monterey County has 349 vineyards, 82 bonded wineries and 65 tasting rooms. The wide range of climates allow Monterey County to grow over 30 different wine grape varietals.
“Monterey County Fun Facts”, Monterey County Convention & Visitors Bureau, 2020
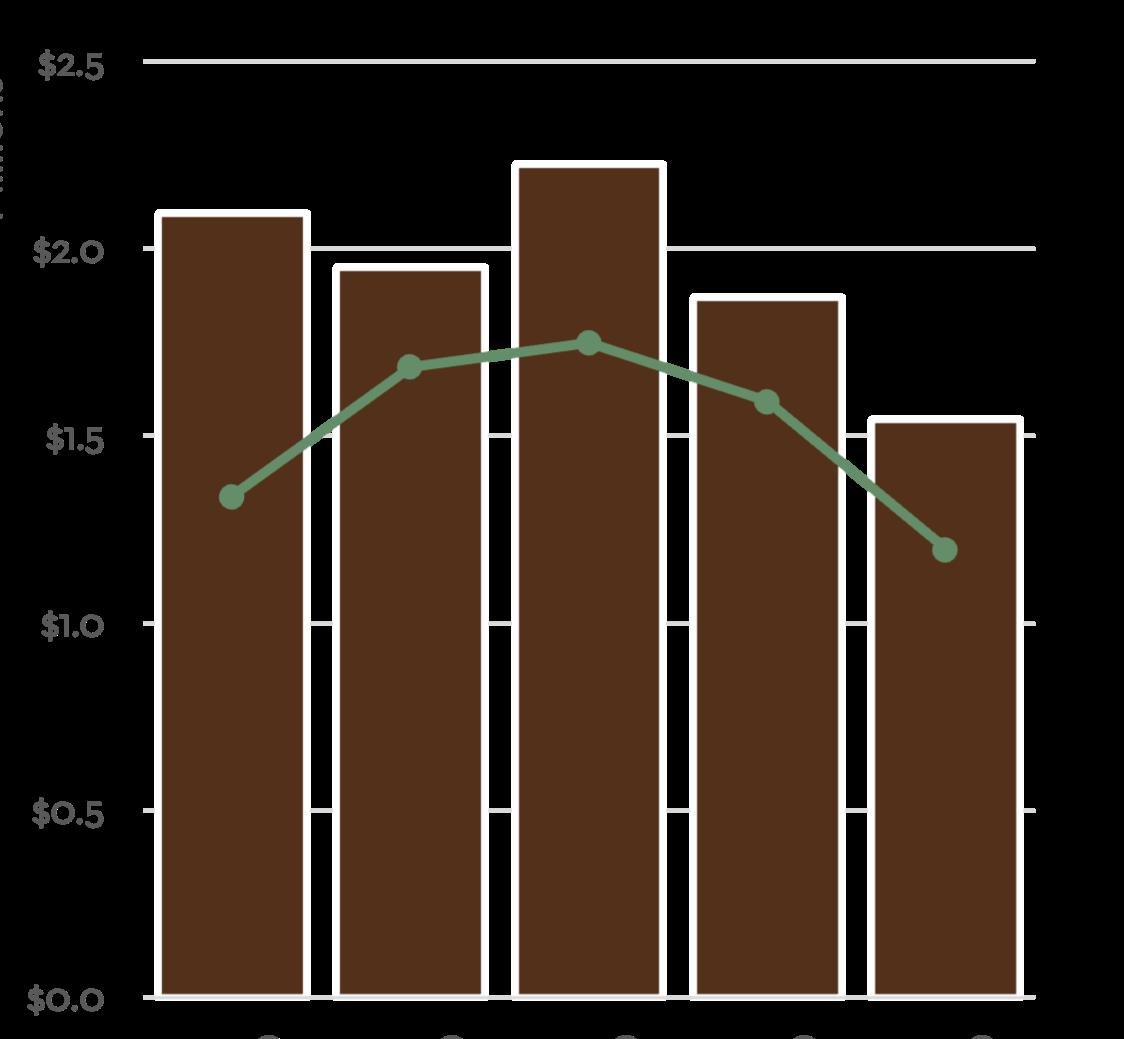
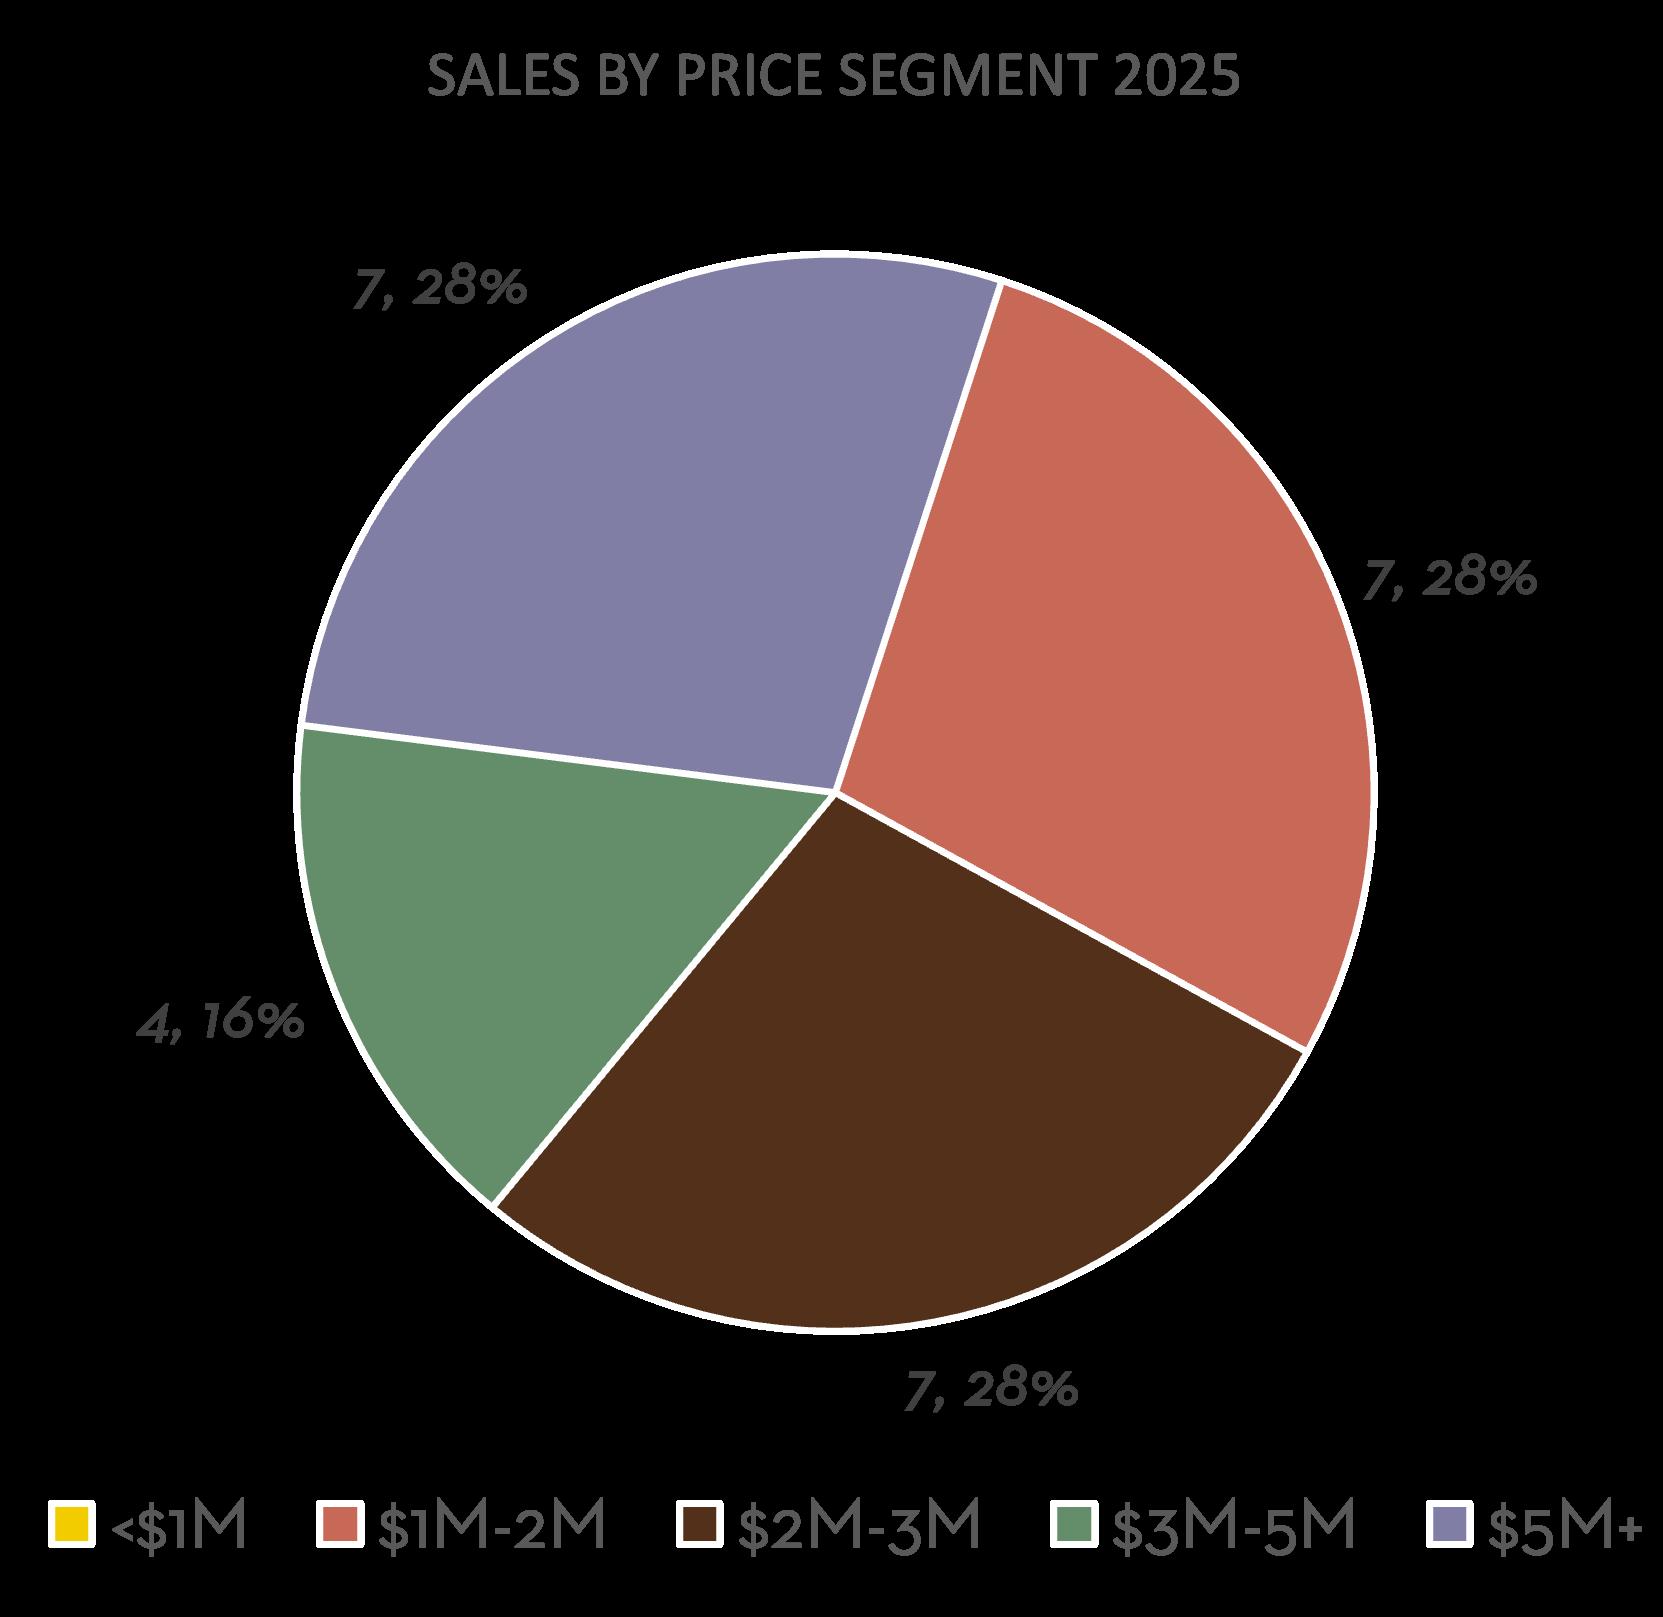
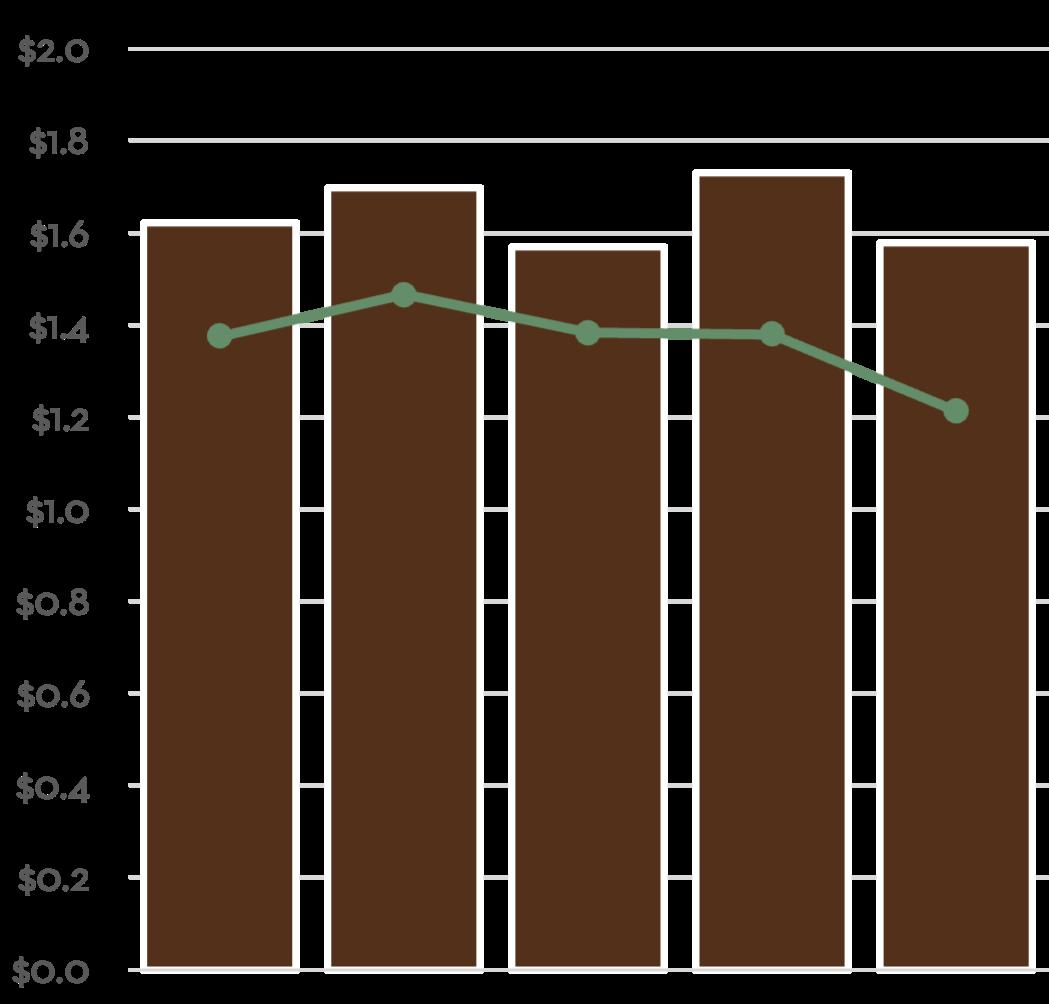
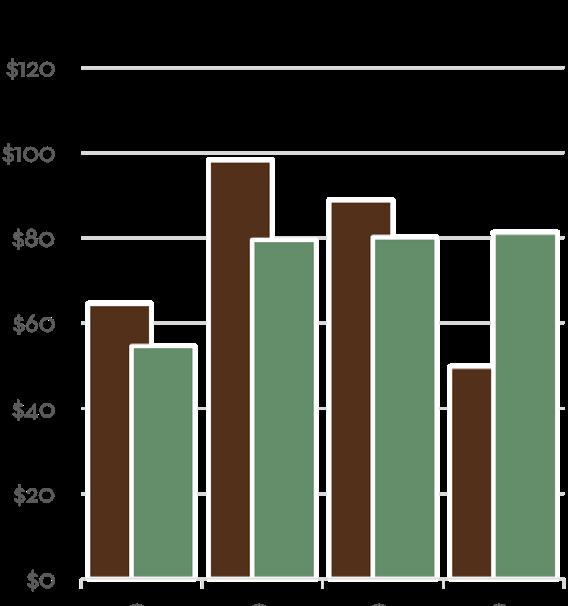
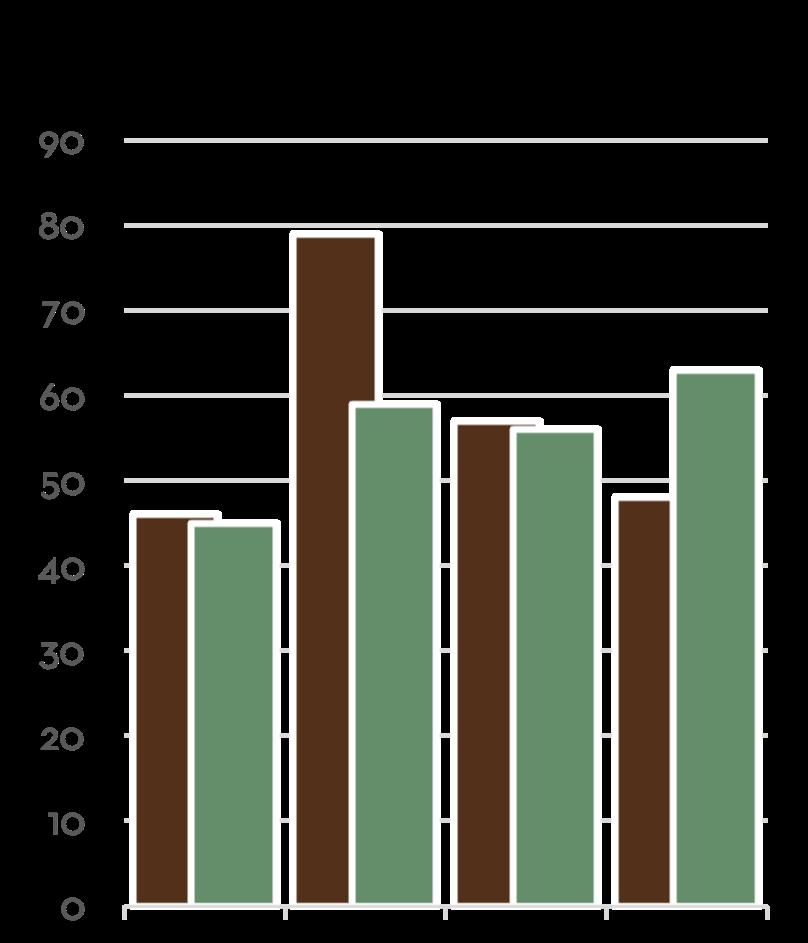
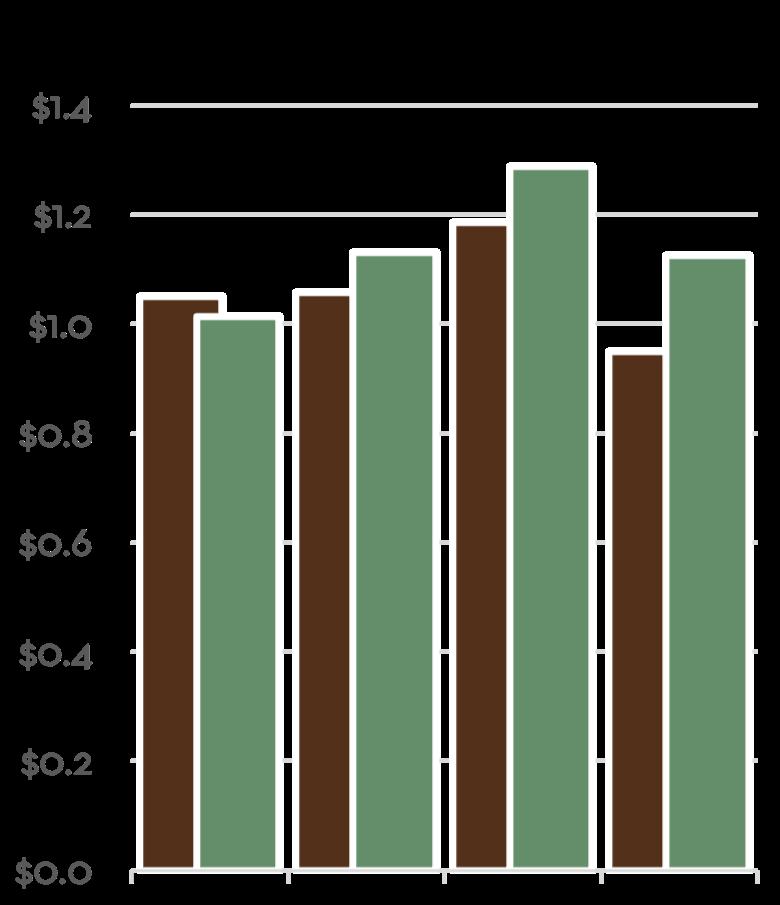
Pebble Beach
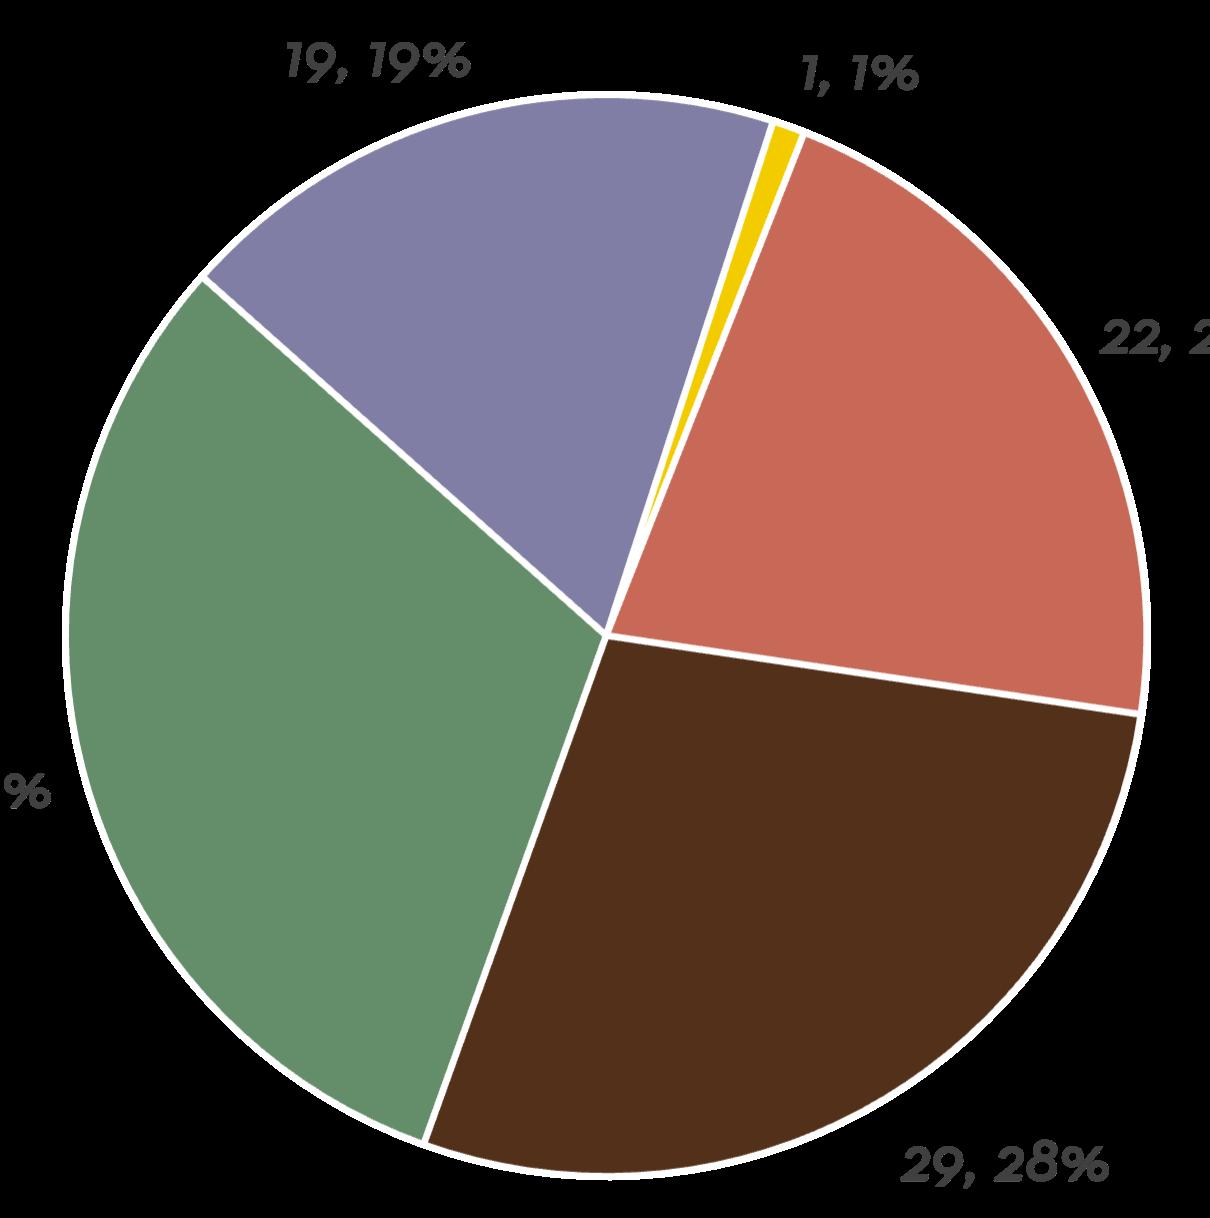
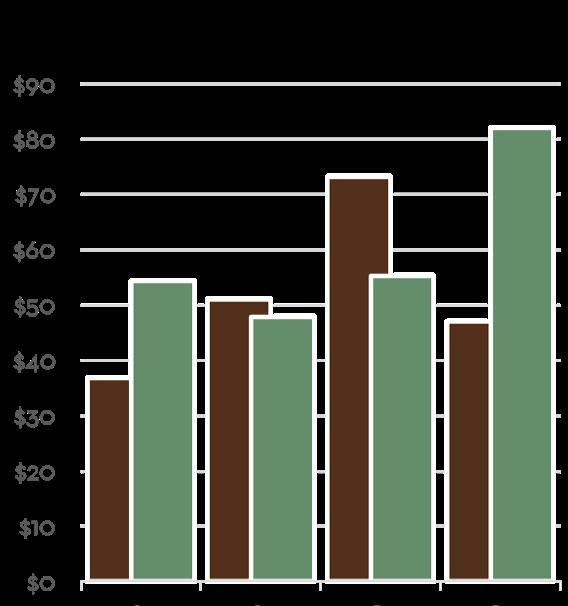
Pebble Beach saw 29 sales during Q4, the most of any quarter this year. The area saw one sale over $10M close during the quarter, a $13.9M sale on Sonado Road double ended by Carmel Realty Company. Carmel Realty Company and Monterey Coast Realty combined to have 10 different agents and teams represent 21 of the 59 transaction sides during Q4, representing over 45% of transaction volume during the quarter (over double than next competing brokerage).
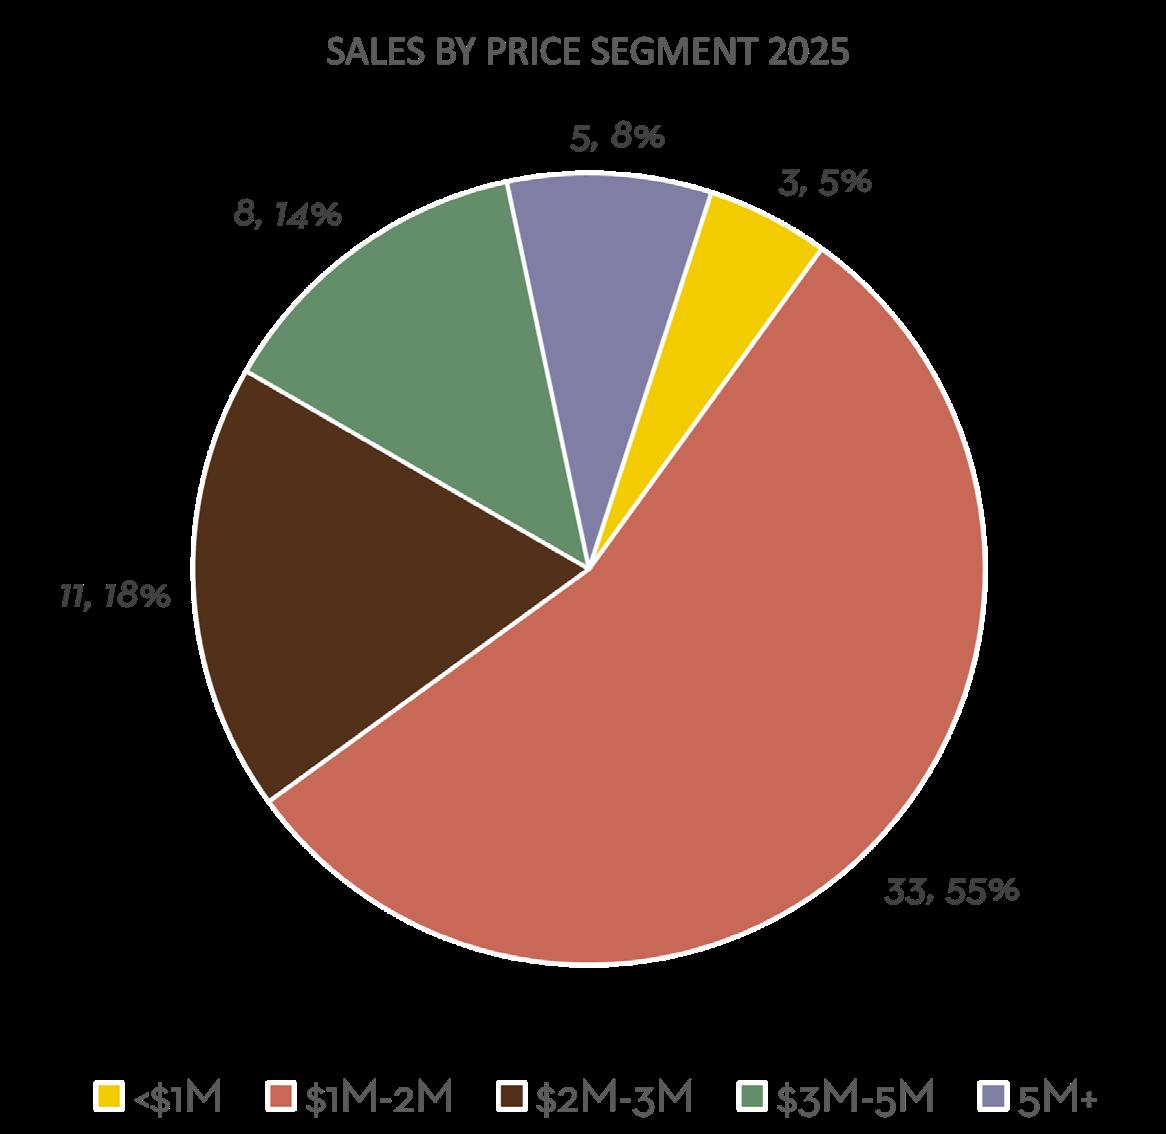
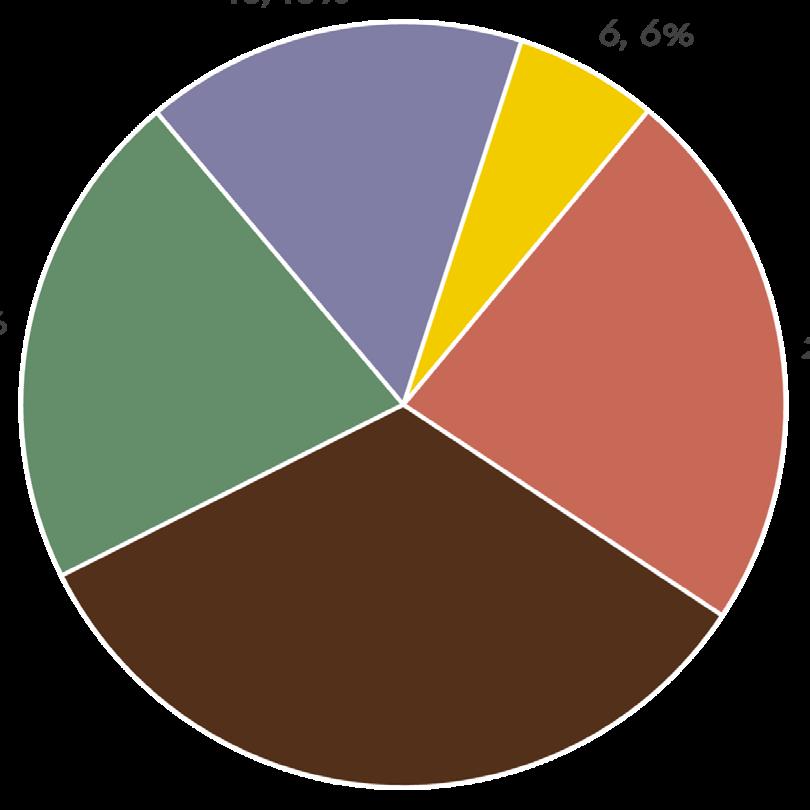
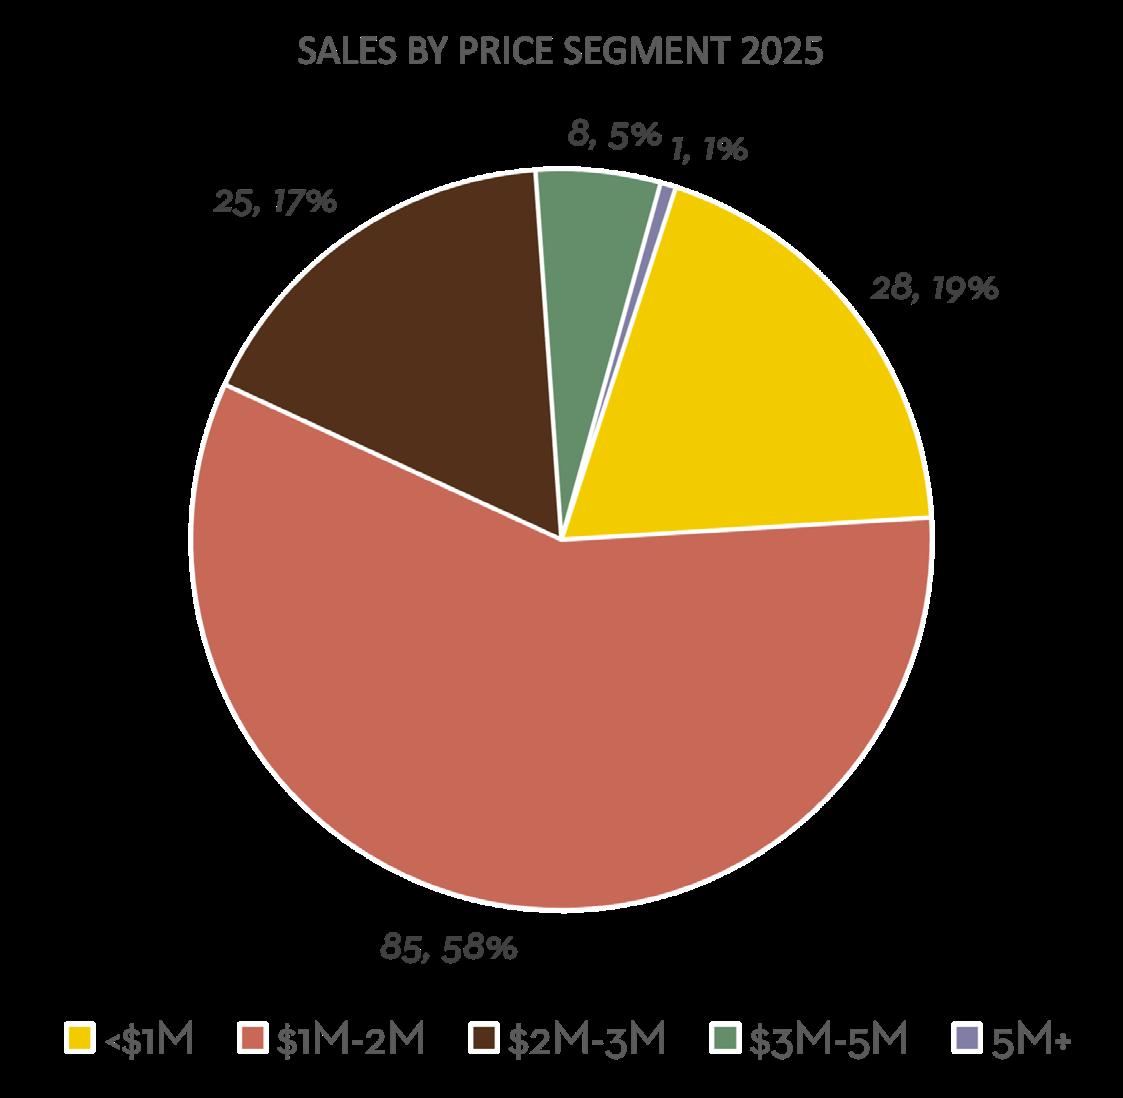
While the Pebble Beach market remains slow compared with prepandemic sales numbers, the area showed growth over the previous two years. 2025 experienced 99 sales during the year, up from 80 sales in 2024 and 75 sales in 2023. The total sales volume was also up 41% year-over-year. The average sales price came in at $3.6M for the year, up about 14% from a very low 2024 total. This figure still trailed 2021 and 2022 averages, when numerous high-priced listings sold, but beat out every other year on record.
Average Days on Market 59 Average Selling Price $3,636,484 13.9% 3.3% 41.0%
Units Sold
99 Sales Volume $360,011,900
23.8%
versus 2024 versus 2024 versus 2024 versus 2024
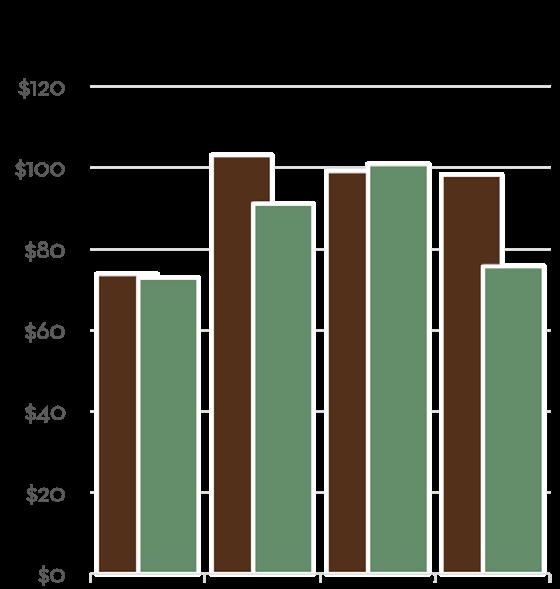
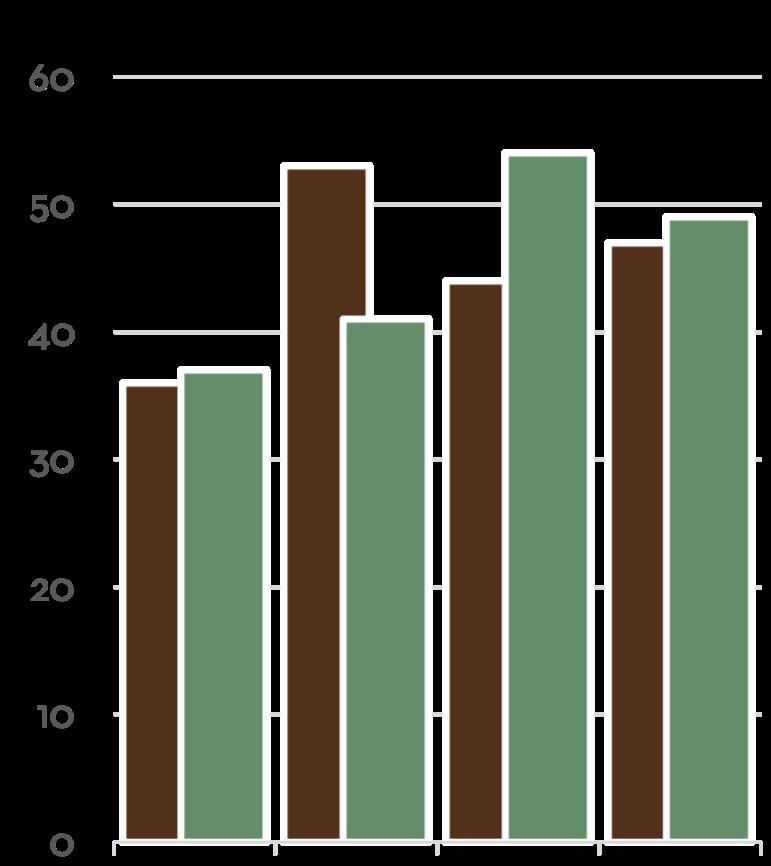
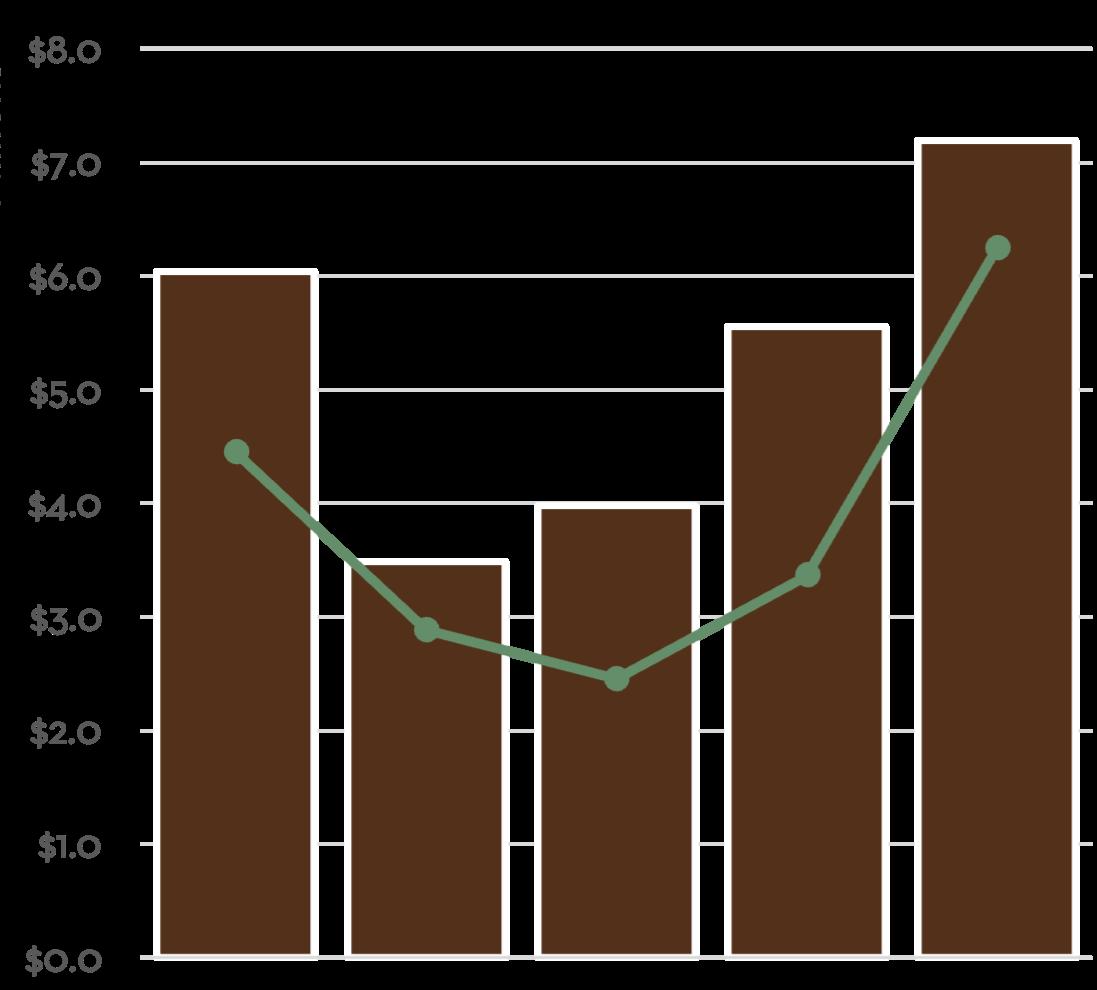
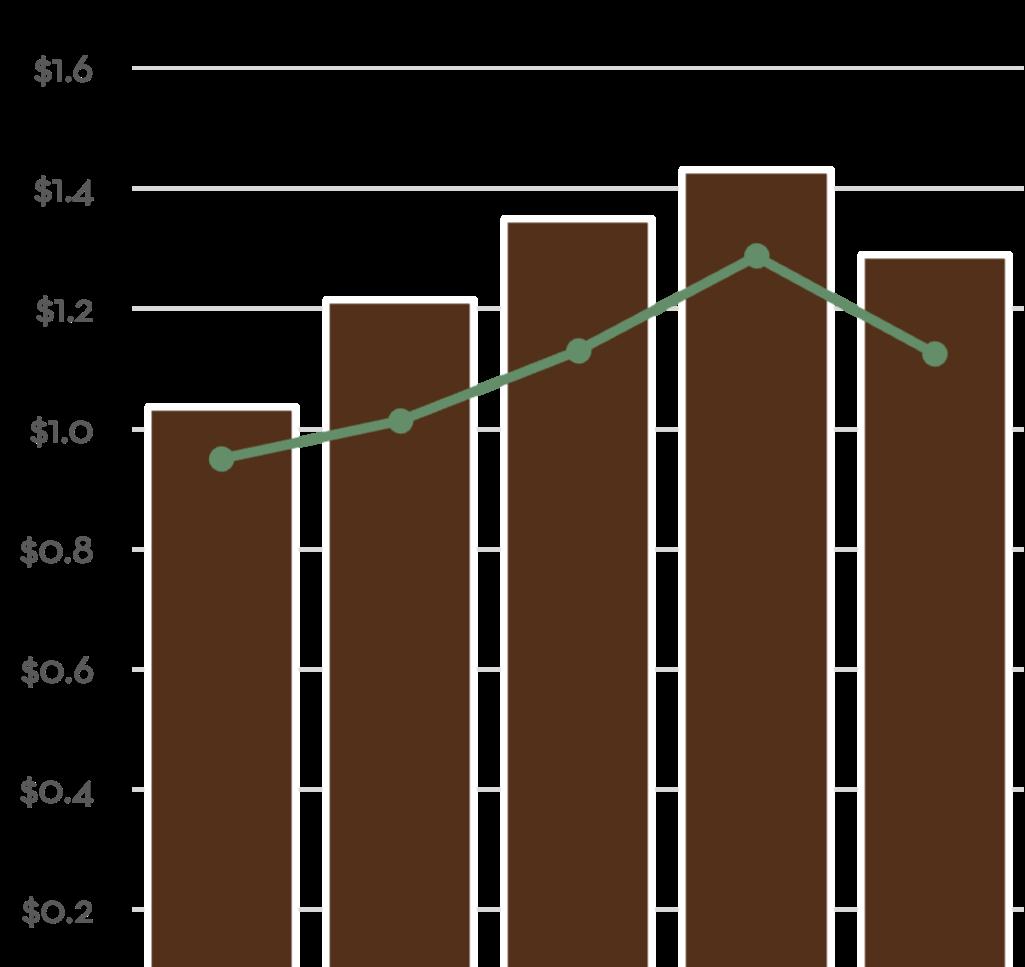
2025 Quarterly Market Breakdown
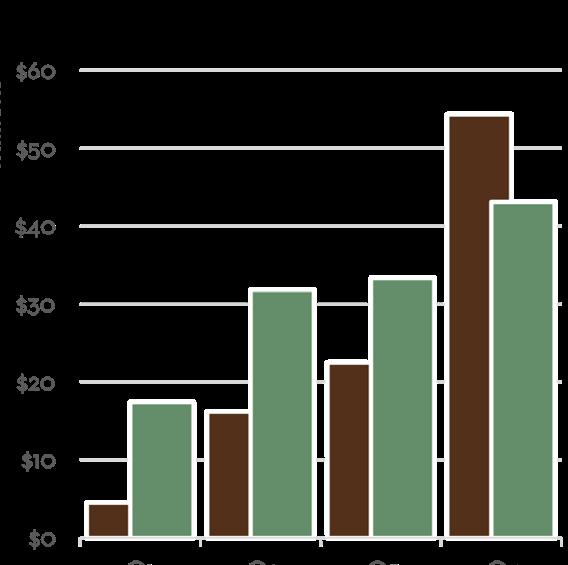
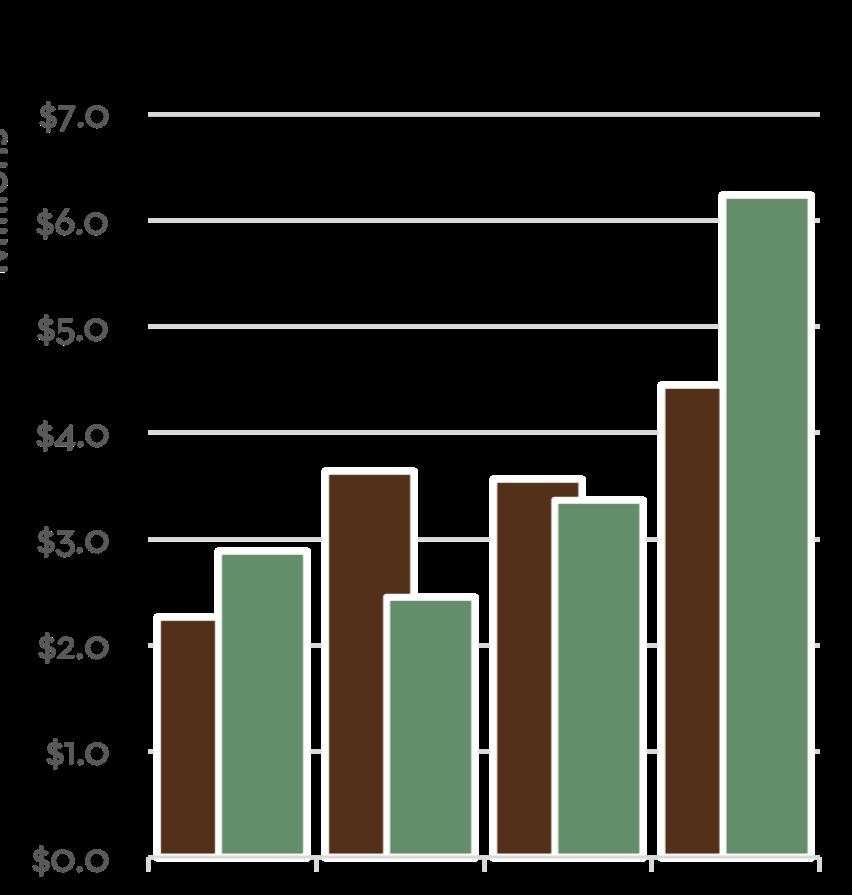
Total Sales Volume By Quarter in millions Average vs. Median Sales Price in millions
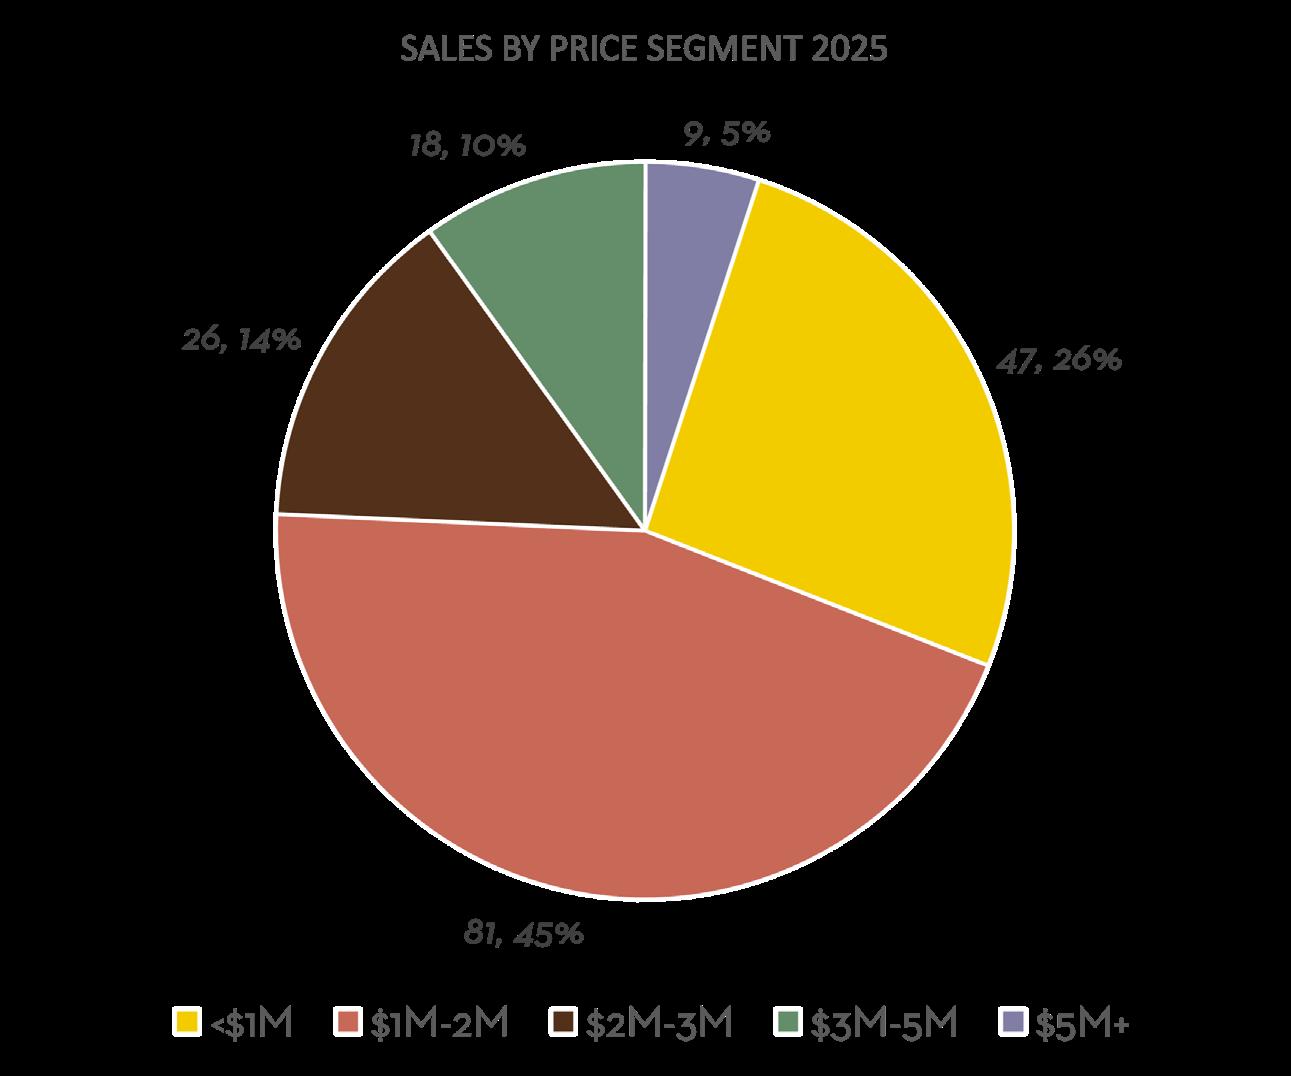
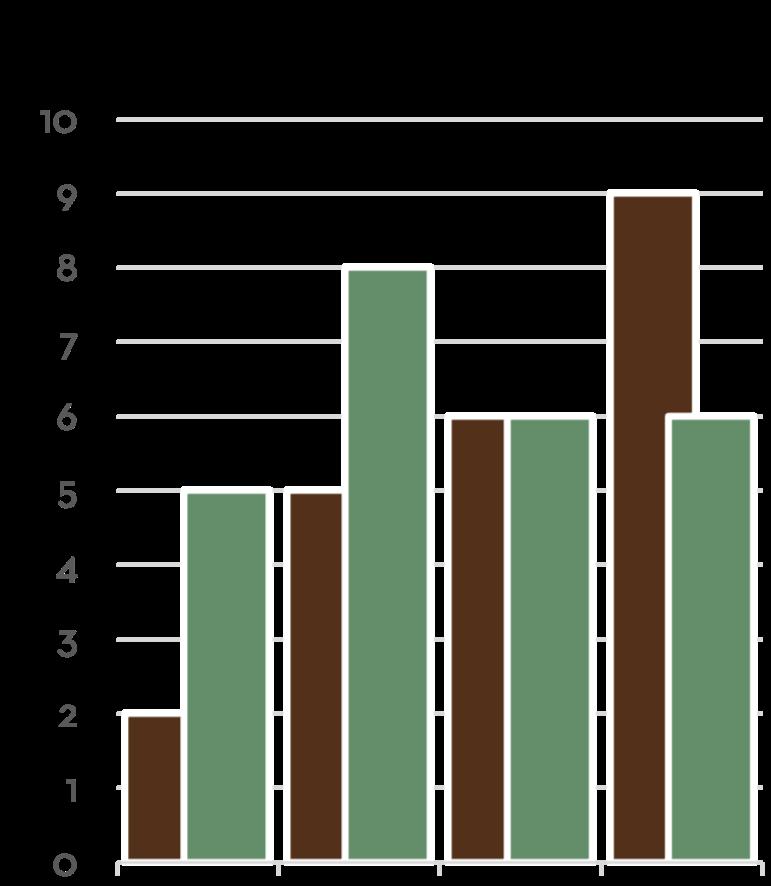
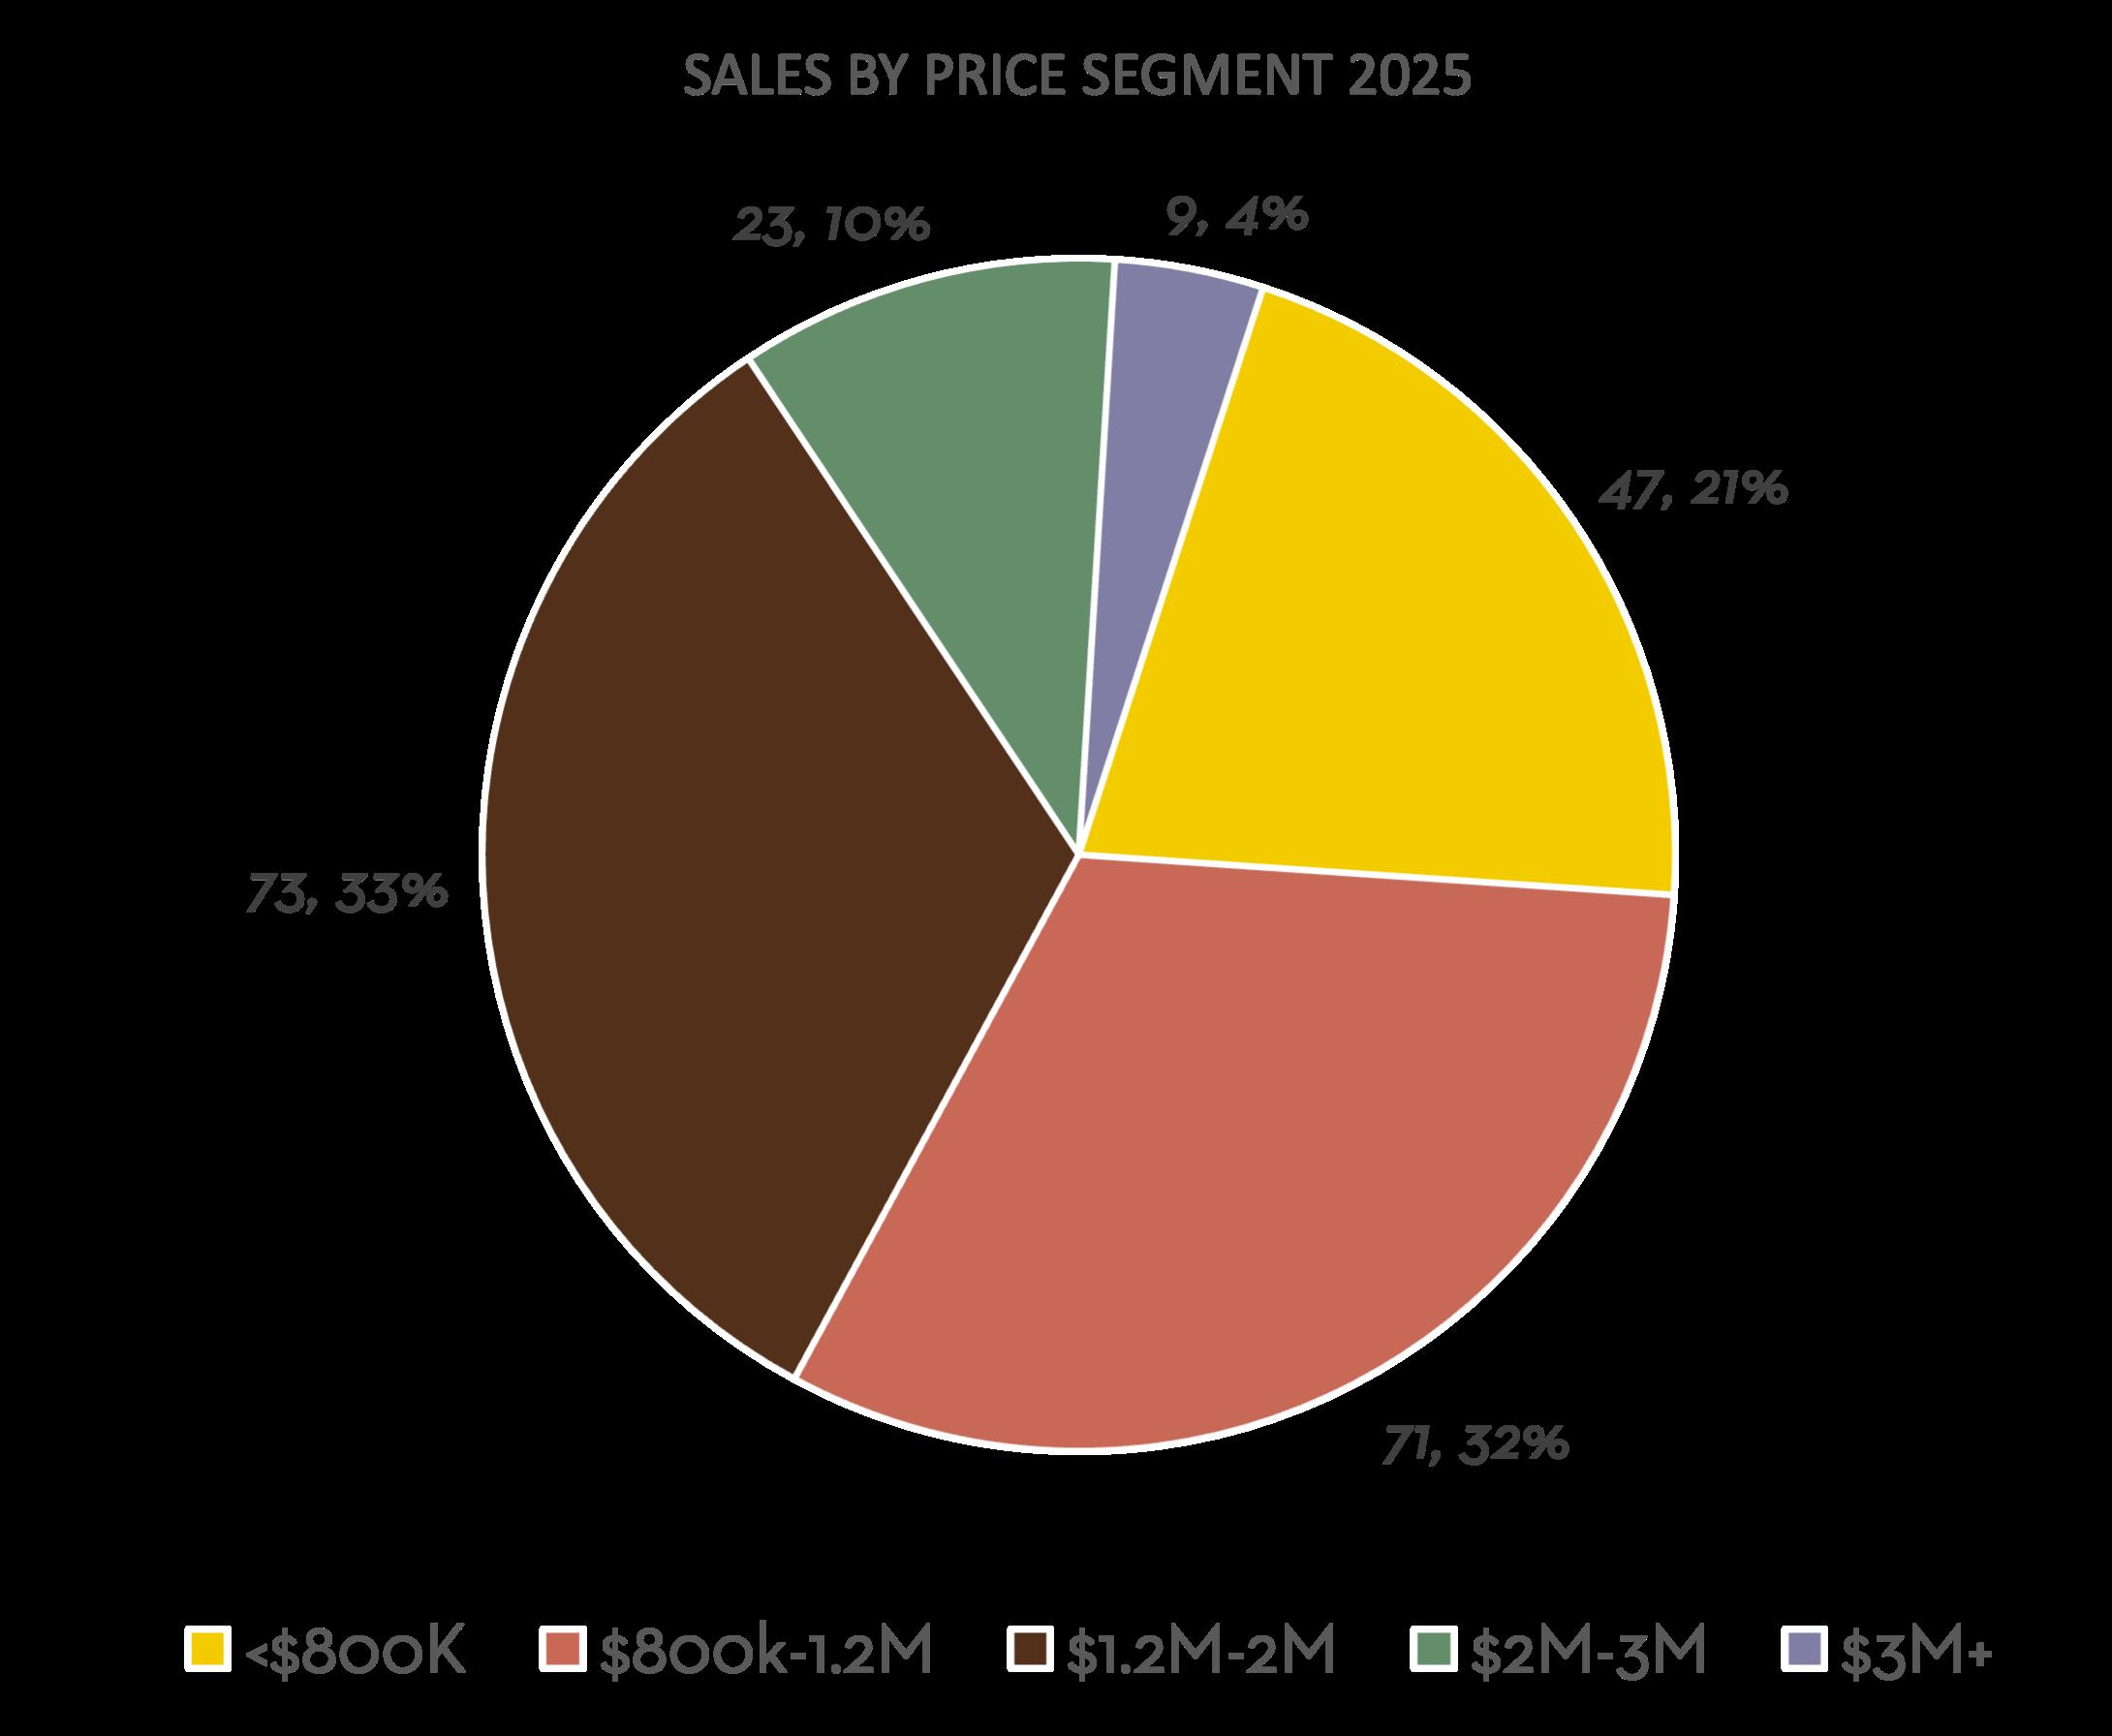
2025 Sales by Segment Number of Closed Sales By Quarter
Did You Know?
17-Mile Drive through Pebble Beach is one of only nine private toll roads in the country, and the only one west of the Mississippi.
“Monterey County Fun Facts”, Monterey County Convention & Visitors Bureau, 2020
Carmel Highlands, Big Sur & South Coast
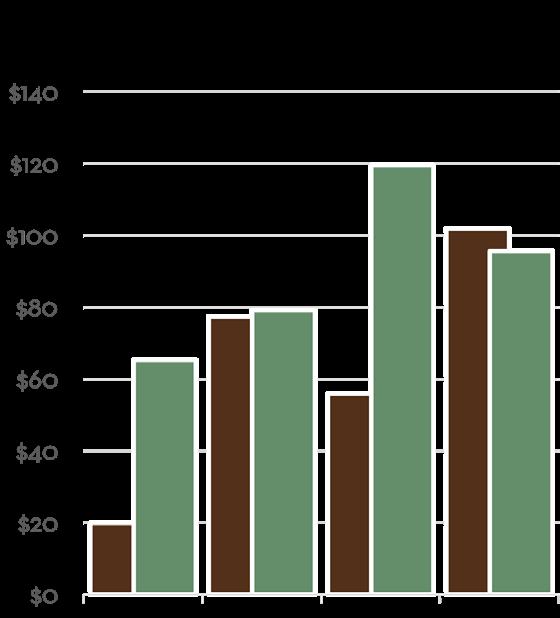
The Carmel Highlands & Big Sur area’s Q4 was highlighted by two $10M+ sales. Carmel Realty Company was proud to represent the seller of one of these large sales. Monterey Coast Realty also double-ended a $2.75M sale in Carmel Highlands. The area saw six total sales during the quarter, matching last quarter’s total. The total sales volume reached its highest mark of the year, totaling $43.1M
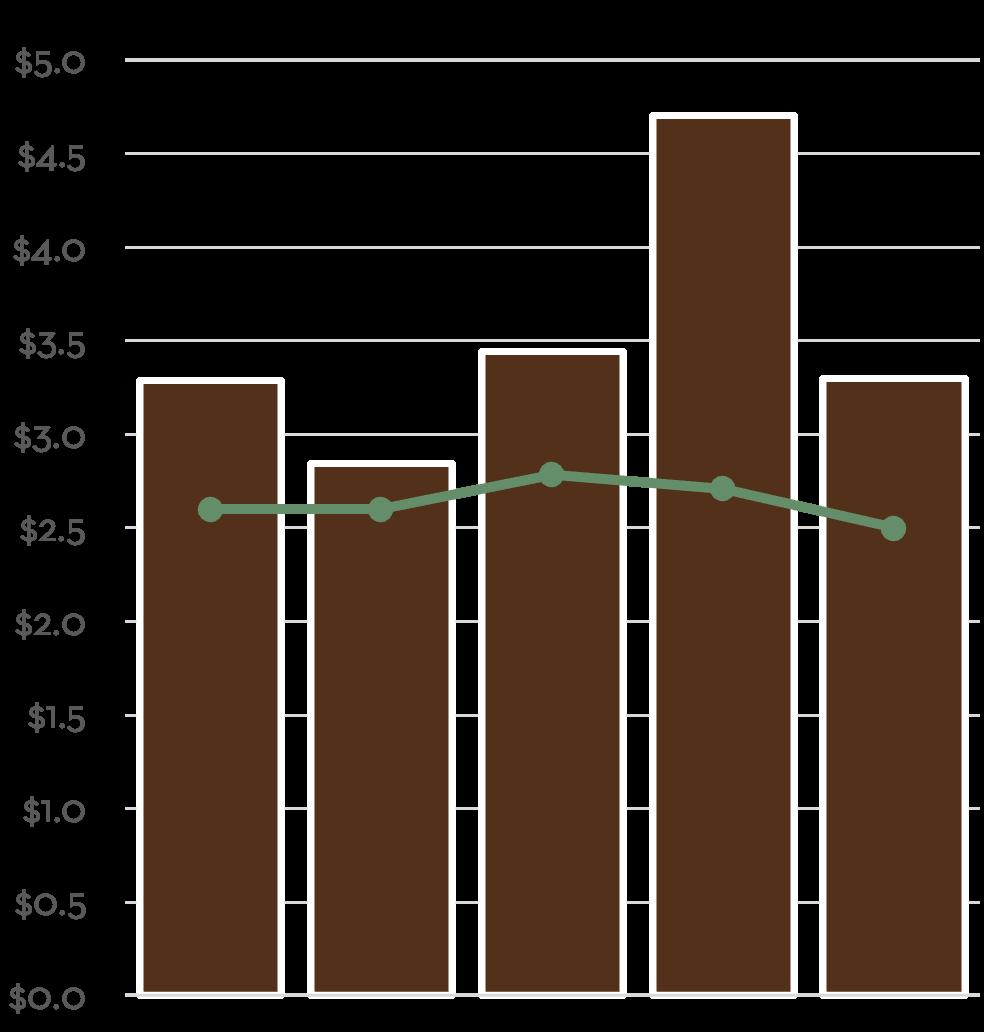
This low-sale area saw 25 closings during 2025, up three sales from last year. With four sales over $10M during the year, along with another three over $5M, the area outpaced last year’s total sales volume by $28M, which was up 28.9%. The average days to sell came in at 108 days. It is not uncommon for this area to see 100+ days on the market, but this is the first time since 2021, after three years with averages in the seventies.
Average Days on Market 108
Units Sold
25 Sales Volume $125,689,552
Average Selling Price $5,027,582 13.5% 38.5% 28.9% 13.6%
2025 Quarterly Market Breakdown
Average vs. Median Sales Price in millions
Total Sales Volume By Quarter in millions
Number of Closed Sales By Quarter
Median Sales Price in millions
Did You Know?
Local settings from around the Monterey Peninsula have provided the backdrops for more than 180 films and television shows. You’ll recognize many scenes in HBO’s award winning mini-series Big Little Lies in Big Sur and the Carmel Highlands.
“Monterey County Fun Facts”, Monterey County Convention & Visitors Bureau, 2020
Pacific Grove
Pacific Grove ended the year with an incredible Q4. The 52 sales during the quarter and $81.9M in sales volume were each the highest figures in over four years, since Q3 2021. The average sales price was down 8.8% quarter-over-quarter, but this is not atypical when a spike in sales numbers occurs. The second-highest MLS sale in Pacific Grove history also took place during the quarter, with Carmel Realty Company representing the buyer on a $7.3M home on Asilomar. Five other Carmel Realty and Monterey Coast Realty Agents also represented clients during the quarter. The surge in Q4 activity, after a steady first three quarters, allowed PG to finish with its best sales unit total (147) since 2022 and best sales volume total ($239M) since 2021. With the increased number of units sold, average sale price finished the year at $1.63M, down just 2.1% year-over-year. Pacific Grove was one of only two areas across the peninsula that saw the average days to sell go down. The area averaged just 38 days to sell during 2025, down from 43 days the previous year. This was the quickest average across all areas.
Average Days on Market
Sales Volume
38 Average Selling Price $1,629,521 2.1% 15.1% 17.6% 11.6%
$239,539,611
Units Sold
versus 2024 versus 2024 versus 2024 versus 2024
147
2025 Quarterly Market Breakdown
Number of Closed Sales By Quarter
Did You Know?
Point Pinos Lighthouse in Pacific Grove is the oldest continually operating lighthouse on the West Coast.
“Monterey County Fun Facts”, Monterey County Convention & Visitors Bureau, 2020
Monterey & Del Rey Oaks
Monterey experienced a very nice end to the year, with Q4 bringing the highest number of sales (63) and the largest total sales volume ($81.2M) of any quarter during the year. The average sales price was down 9.9% from Q3 2025, but up 24.4% from Q4 last year. Carmel Realty Company and Monterey Coast Realty Agents teamed up to sell the highest priced sale in the quarter, a $6.895 estate in Monterra, as well as double-ending two other high-priced sales of $3.95M and $2.95M.
The 2025 yearly average sales price of $1.33M set a record for the Monterey area, up 1.1% from last year. The median sales price also set a record, coming in at $1.15M during 2025. There were seven less units sold in 2025 than 2024, bringing total sales volume down 2% for the year.
Average Days on Market 55
Units Sold
Average Selling Price $1,325,228 1.1% 44.7% 2.0% 3.0%
versus 2024 versus 2024 versus 2024 versus 2024
223 Sales Volume $295,525,922
2025 Quarterly Market Breakdown
Did You Know?
Nearly a quarter million tons of sardines were processed on Cannery Row in 1945, the year John Steinbeck’s Cannery Row was published. Cannery Row was previously named Ocean View Avenue but was renamed to honor John Steinbeck’s well-known novel.
“Monterey
County Fun Facts”, Monterey County Convention & Visitors Bureau, 2020
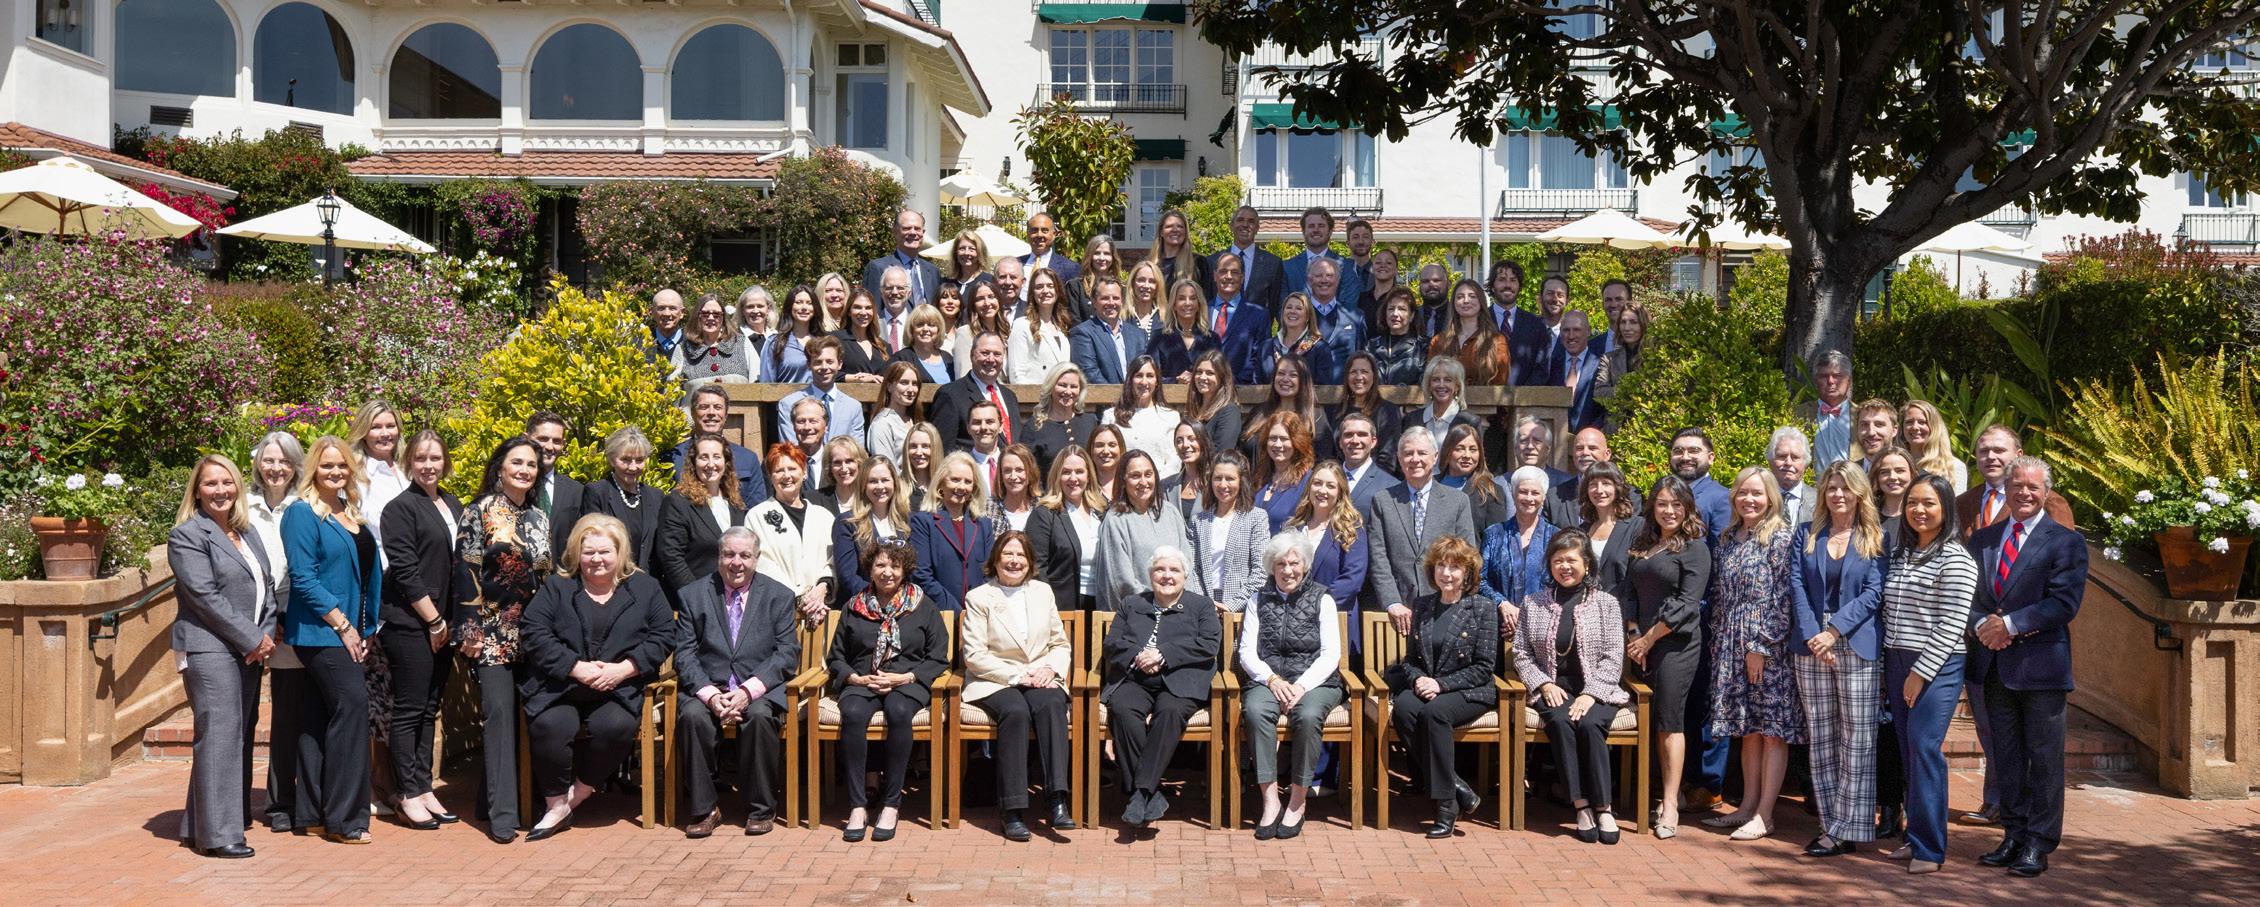
Authentic Market Leaders & True Industry Experts
As the market leading luxury brokerage, for over 100 years we have consistently delivered outstanding quality and service to our clients. Our handpicked team of agents share our commitment to quality, integrity, and the community. Unmatched experience, local knowledge, and collaboration has allowed our team to achieve the highest average agent production in the market year after year. When you work with Carmel Realty Company, you can take comfort in knowing you are working with an authentic expert in Monterey Peninsula real estate.