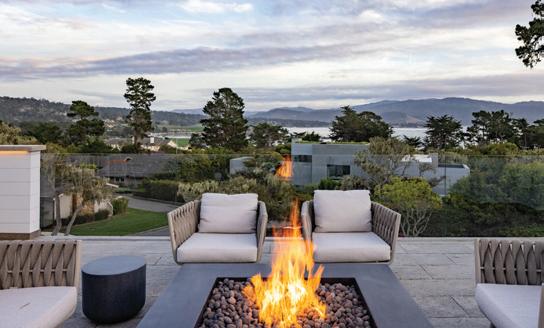
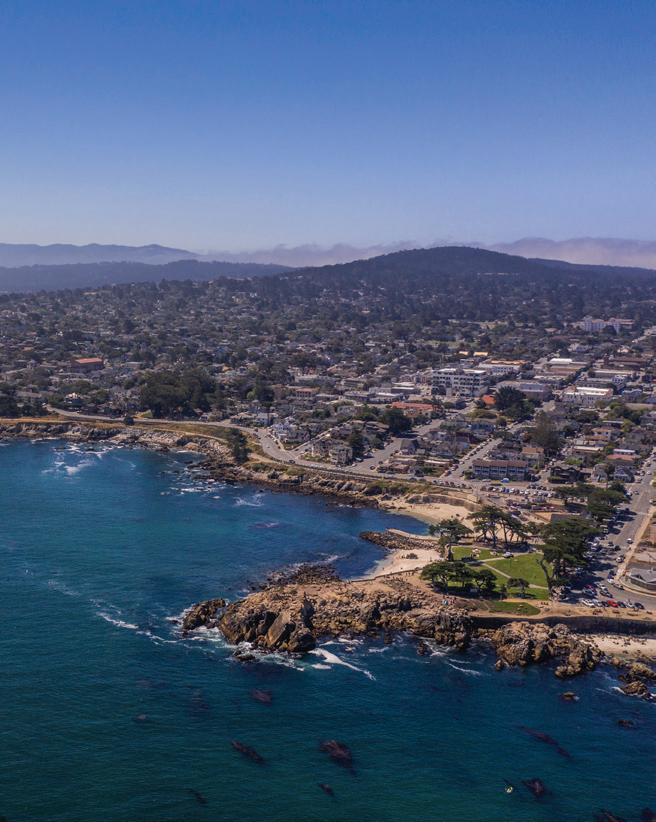
As summer unfolds before transitioning into fall, the third quarter on the Monterey Peninsula traditionally brings a dynamic blend of activity and anticipation. Between the excitement of Monterey Car Week, the arrival of second-home buyers escaping the summer heat elsewhere, and a general uptick in visitor tra c through Carmel-by-theSea, Pebble Beach, and surrounding areas, Q3 o en sets the tone for the year’s real estate narrative. Historically, this is when momentum builds, transaction numbers are strong, luxury buyers return to market, and we gain insights into the trajectory for the year’s end.
is quarter, our in-depth analytics report reveals an intriguing mix of stability, strength, and shi ing trends across the Peninsula’s micro-markets. While overall buyer demand remains resilient, the nuances of each community tell a more detailed story. Across Carmel, Carmel Valley, and the Carmel Highlands through Big Sur, homes took longer to sell this quarter, averages ranging from 65 to 120 days on market. is slower pace re ects more selective buyers (particularly on the higher-end sales), while all other areas averaged under 50 days, showing continued strength in lower to midrange markets. Carmel Valley stood out with 54 sales, its highest level of activity since Q2 2022, signaling renewed enthusiasm for its lifestyle and space. Notably, 13 Carmel Realty Company and sister-brokerage, Monterey Coast Realty, Agents represented clients there, underscoring our rm’s collaboration, leadership, and deep local expertise.
e $2–$3 million range remains the market’s fastest-growing segment, with 29 more sales than last year, while sales under $2 million have declined by 24, indicating rising values and demand for mid-tier luxury properties. At the high end of the market, four MLS sales over $10 million closed in Q3, compared to just one in the rst half of the year, signaling a modest resurgence in ultra-luxury activity. In this exclusive segment, relationships are key to successfully closing transactions. is quarter, our company had the privilege of representing both the buyer and seller in one of these $10M+ deals. At the top end, four $10M+ MLS sales closed in Q3 a er just one in the year’s rst half, highlighting a resurgence in ultra-luxury activity. Overall, the market remains balanced, de ned by patient buyers, steady demand, and enduring con dence in the Peninsula’s lasting appeal.
Each of the nine markets we serve navigate a constant balancing act between supply, demand and pricing. is makes it essential to have experienced, local, expert representation when buying or selling a home. Please reach out to one of our full-time professional agents should you and any of your friends or family be considering a real estate transaction here on the Monterey Peninsula.
We hope you enjoy the following detailed analytic view of our market.
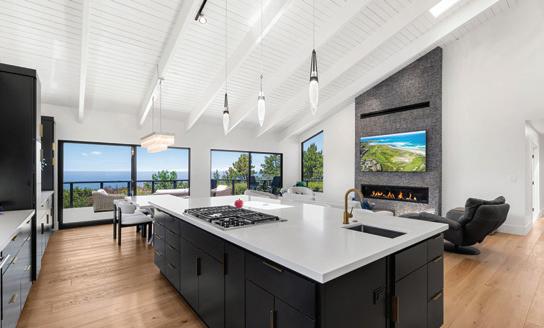
Market Update
Market Update
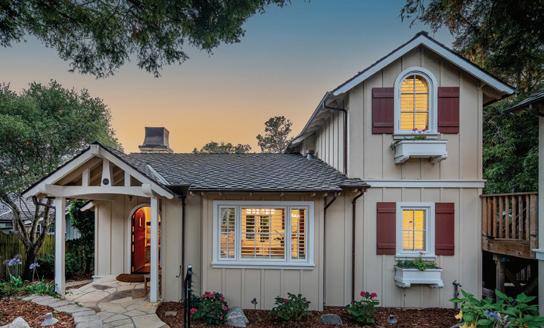
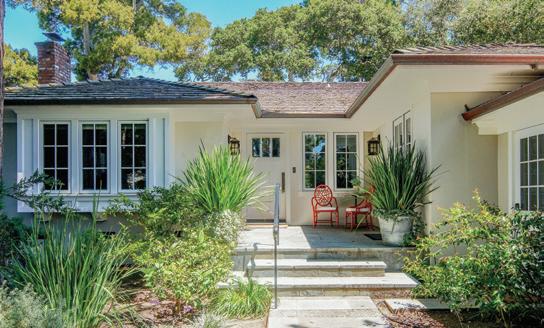
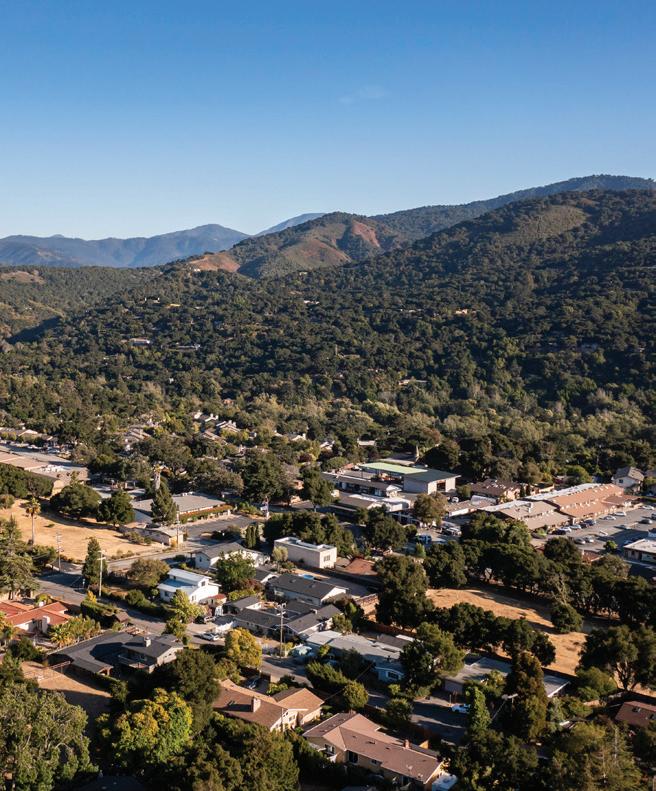
Carmel-by-the-Sea & Carmel Point
Carmel-by-the-Sea & Carmel Point
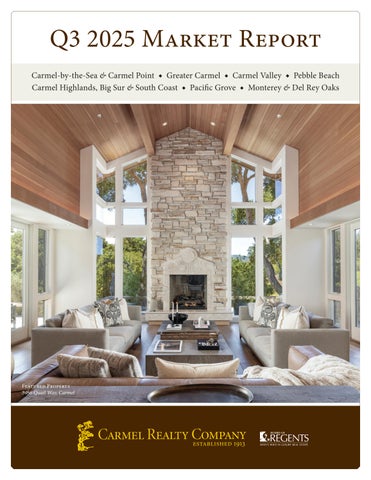
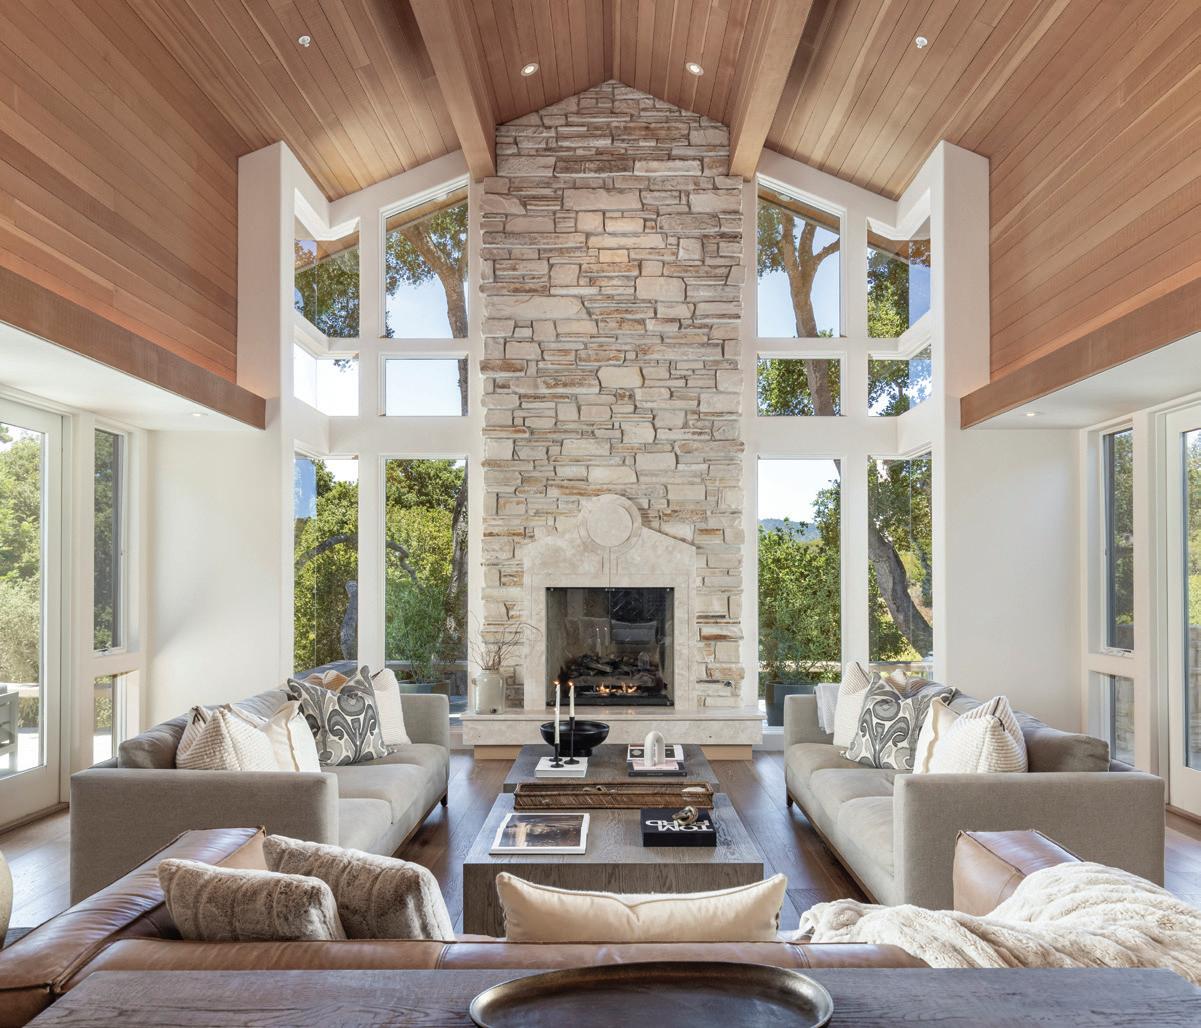
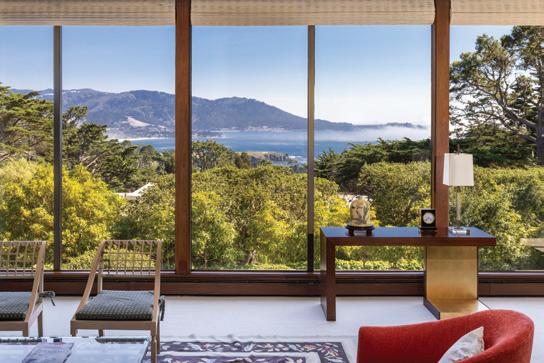
Usanditia ne endem. Es ellictor sitat andendam et quae omnimendamus il ium sapieni mustenis rerat pera et utes corerem nimus et, testrum faccusandus.
Tate nonsequi doloris sus natem debis mos earcipsapid quia volum que si acestem unt quos volor mo ma veliquam harum re ne laut accus alic tentis eos a simpos apiet eum fuga. Ut quiae simincit aut omniantiis dem rerehenem ipit quat il ipsum re ni optatur, con necabore magnatur, niae. Omnim debit et occum quidel ius ma diorepeliat vendio enest, con core voloratiam qui o ciis dolupiet lignate nisquas quam, corendae magniet o cimos mi, que occat minus, ommo cone omnitem volorest eictian destem. At o cie nditiore quassita idelit quiam, cuptatati dolorestio volorrovide sitiur as as expeles ratiasperis eaquo
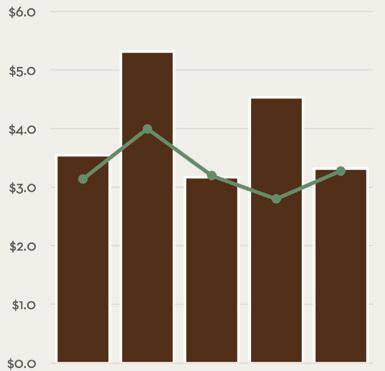
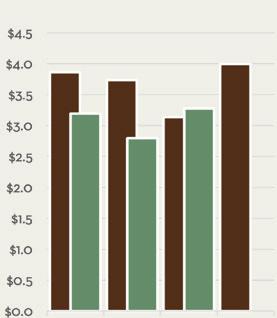
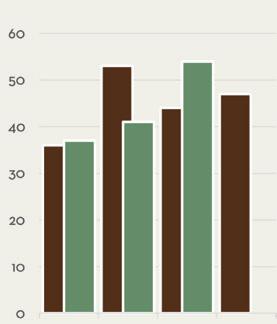
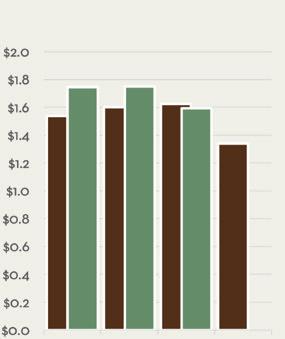
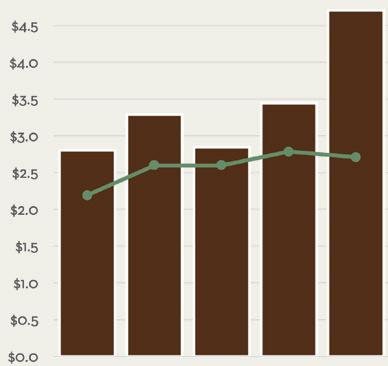
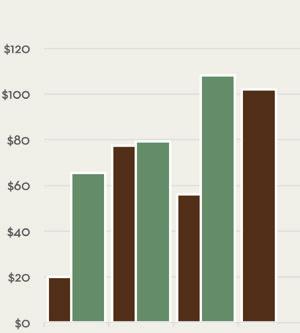
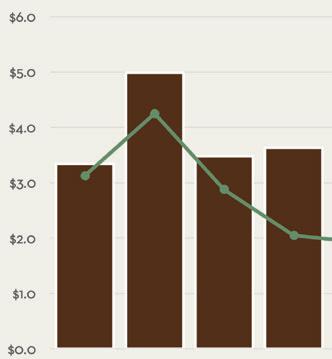
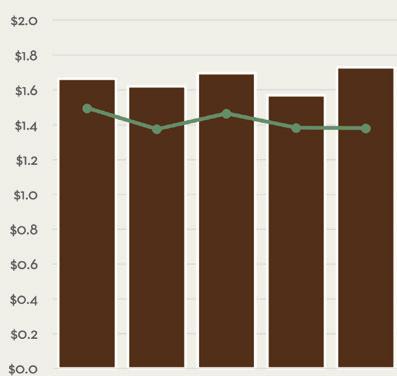
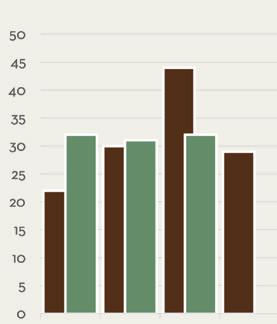
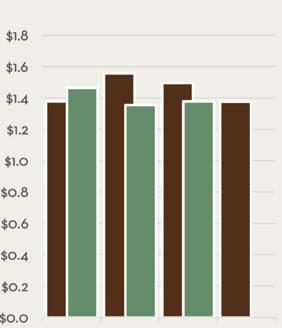
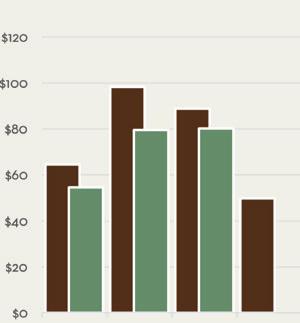
Carmel-by-the-Sea saw 31 home sales during Q3, the most of any quarter this year and just one shy of the best quarter last year. e average sales price of $3.32M in Q3 was down from a large $4.52M last quarter and $3.53M in Q3 of last year. is was due to the high sale of the quarter coming in at $7.25M, paired with eight sales coming in under $2M, a higher-than-average number for the area during a single quarter. e average days to sell came in at 75 days, which is up from 43 days during Q3 2024. Barring a few high-priced home sales during Q4, Carmel-by-the-Sea is on pace to come in just under last year’s total sales volume number of $417M. Carmel Realty Company and Monterey Coast Realty Agents represented at least one side in seven of the top 10 highest priced sales during the quarter, double-ending one of these sales.
Average Selling Price $3,320,985
Average Days on Market
75
Sales Volume
$102,950,550
Units Sold
31
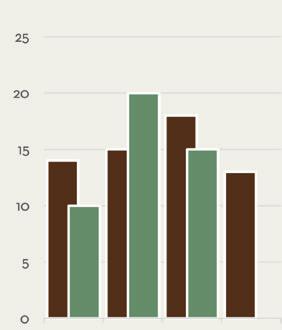
Q3 2025 Market Breakdown
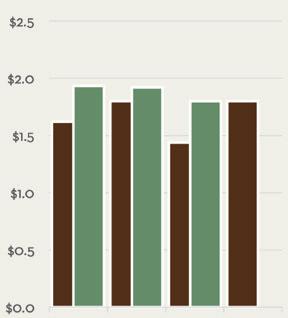
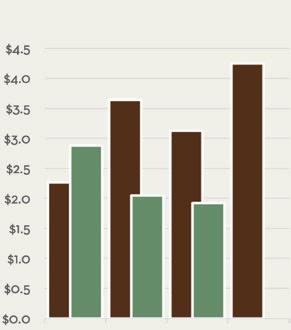
Average vs. Median Sales Price in millions
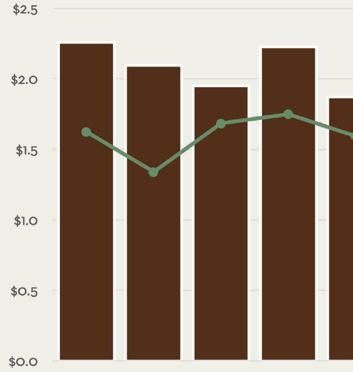
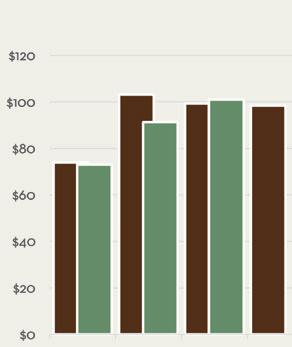
Total Sales Volume By Quarter in millions
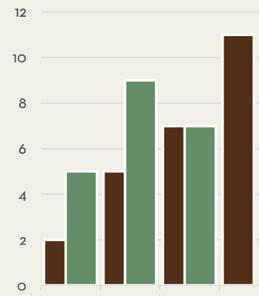
Number of Closed Sales By Quarter
Median Sales Price in millions
Did You Know?
Carmel-by-the-Sea is known for attracting various celebrities and artists. Clint Eastwood served as mayor of the village from 1986-1988. Other notable celebrities, artists and writers who have called Carmel home include Doris Day, John Denver, Ansel Adams and Jack London.
“Monterey County Fun Facts”, Monterey County Convention & Visitors Bureau, 2020
Greater Carmel
e areas outside of Carmel-by-the-Sea & Carmel Point
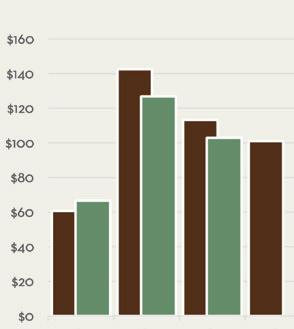
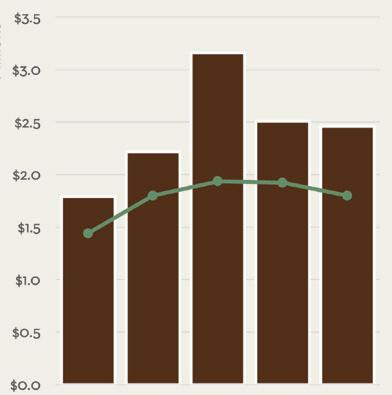
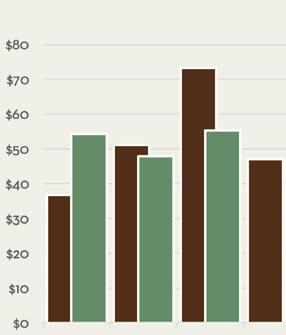
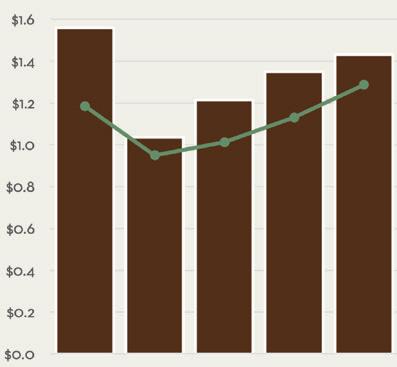
e Greater Carmel area saw 15 sales during the quarter, which was down from 20 during the previous quarter and 18 during Q3 of last year. e average sales price remained strong, coming in at $2.45M for the quarter.
e average days to sell in this area climbed to 64 days, up from 45 days last year. e total sales volume in Greater Carmel has already surpassed the 2023 total and is on track to surpass 2024’s volume as well. Carmel Realty Company Agents represented two sellers and one buyer of homes in this area during the quarter.
Selling Price $2,459,067
15 Sales Volume $36,886,000 Average Days on Market 64
Q3 2025 Market Breakdown
Average vs. Median Sales Price in millions
Total Sales Volume By Quarter in millions
Number of Closed Sales By Quarter
Median Sales Price in millions
Did You Know?
Robert Louis Stevenson modeled Treasure Island’s Spyglass Hill a er Point Lobos State Reserve near Carmel. “Monterey County Fun Facts”, Monterey County Convention & Visitors Bureau, 2020
Carmel Valley
Including the Santa Lucia Preserve
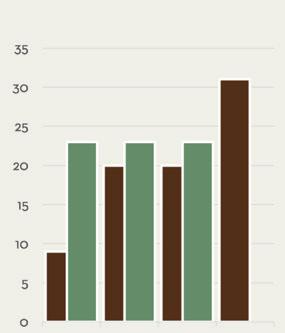
Carmel Valley saw 54 sales during the quarter, the most of any quarter since Q2 of 2022. While the number of sales was up, the average sales price came down, as 14 sales under $1M led to an average sales price of $1.86M for the quarter. is was the lowest total since Q3 of 2023. Overall sales volume was high, coming in over $100M during the quarter for just the second time in the past 13 quarters. With the high number of sales during Q3, inventory is down 10 listings from where it began the quarter. irteen Carmel Realty Company and Monterey Coast Realty Agents represented clients in this area during Q3.
Average Selling Price $1,869,639
Average Days on Market
74
Sales Volume
$100,960,500
Units Sold
54
Q3 2025 Market Breakdown
Average vs. Median Sales Price in millions
Total Sales Volume By Quarter in millions
Number of Closed Sales By Quarter
in millions
“Monterey County Fun Facts”, Monterey County Convention & Visitors Bureau, 2020 Did You Know?
Monterey County has 349 vineyards, 82 bonded wineries and 65 tasting rooms. e wide range of climates allow Monterey County to grow over 30 di erent wine grape varietals.
Pebble Beach
Entering Q3, Pebble Beach saw just one on-market and one o -market sale over $10M over the previous 12 months. e area saw three $10M+ on-market sales during Q3 of 2025. Carmel Realty Company doubleended one of these sales for $12.9M. ere were three additional sales over $5M during the quarter, two of which had a client represented by Carmel Realty. With the elevated number of high-priced sales, the total sales volume topped $100M in the area for the rst time since Q4 2024. Pebble Beach saw 23 sales during the quarter, the exact same number as the previous two quarters. While most areas have seen the average days to sell go up, Pebble Beach has seen homes sell quicker in 2025 versus last year. Homes sold in an average of just 38 days during Q3. Another $10M+ sale is pending closure in Pebble Beach to begin Q4, and when paired with several other contingent listings, Pebble Beach looks to be turning a corner in the high-priced market, a er almost three years of slower activity.
38
67.8%
Average Days on Market
Average Selling Price $4,703,839 no change versus Q2 2025 36.6% versus Q3 2024 versus Q2 2025 36.6% versus Q3 2024 93% versus Q2 2025 versus Q3 2024
15.0% versus Q3 2024 versus Q2 2025 no change
40.6%
23 Sales Volume $108,188,300
Q3 2025 Market Breakdown
Average vs. Median Sales Price in millions
Quarter in
Number of Closed Sales By Quarter
Did You Know? 17-Mile Drive through Pebble Beach is one of only nine private toll roads in the country, and the only one west of the Mississippi.
“Monterey County Fun Facts”, Monterey County Convention & Visitors Bureau, 2020
Carmel Highlands, Big Sur & South Coast
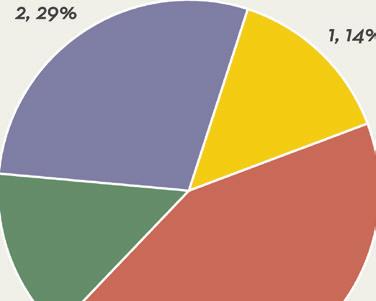
e Carmel Highlands and Big Sur area’s Q3 was highlighted by a $17M sale on the Big Sur coast. is sale contributed over half of the $33.6M in sales volume during the quarter. Seven sales during the quarter were a good number for this low-activity area. e quarter began and ended with 33 active listings on the market. ere are two $10M+ listings currently in escrow in this area heading into the fourth quarter, which could set up a strong nish to the year.
Q3 2024
Average Days on Market
120 Average Selling Price $4,803,571 versus Q2 2025
$33,625,000
7 Sales Volume
22.2% no change
Q3 2024 361.5% versus Q3 2024 versus Q2 2025
Q3 2025 Market Breakdown
Average vs. Median Sales Price in millions
Total Sales Volume By Quarter in millions
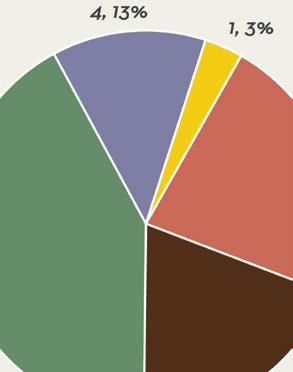
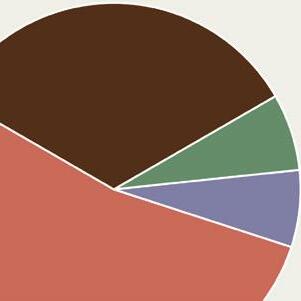
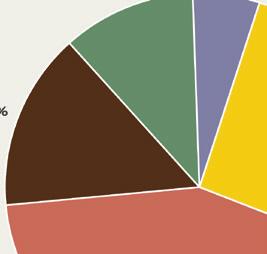
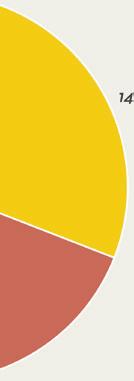
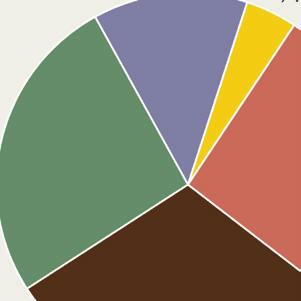
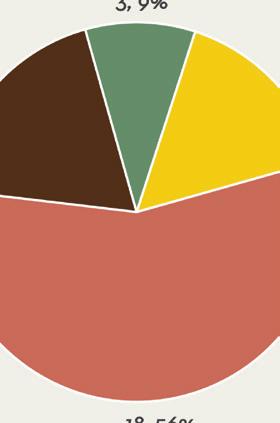
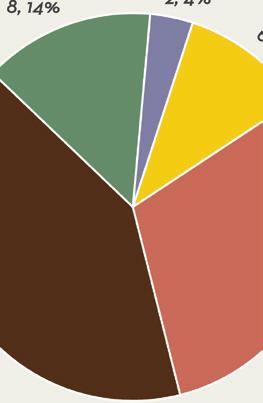
Q3 2025 Sales by Segment
Number of Closed Sales By Quarter
Median Sales Price in millions
Did You Know?
Local settings from around the Monterey Peninsula have provided the backdrops for more than 180 lms and television shows. You’ll recognize many scenes in HBO’s award winning mini-series Big Little Lies in Big Sur and the Carmel Highlands.
“Monterey County Fun Facts”, Monterey County Convention & Visitors Bureau, 2020
Pacific Grove
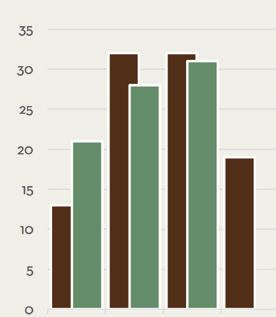
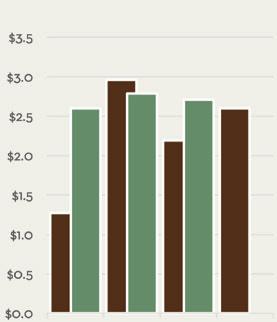
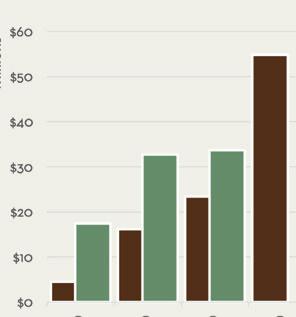
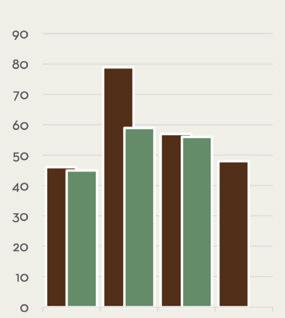
Paci c Grove’s sales numbers have been consistent all year, reaching 32 during Q3 a er 31 and 32 during the previous two quarters. e average sales price during the quarter rose to $1.72M, the highest since Q4 2023. Like Pebble Beach, and unlike every other area, the average days to sell in Paci c Grove have come down in 2025 versus 2024. Q3 saw an average of just 33 days to sell in the area. Inventory has risen in Paci c Grove, starting Q3 with 32 listings and ending the quarter with 43 active homes on the market. Carmel Realty Company and Monterey Coast Realty combined to have ve di erent Agents and teams represent clients in Paci c Grove during the quarter.
2025 Statistics Units Sold
32 Sales Volume $55,337,635 Average Days on Market 33
Q3 2025 Market Breakdown
Average vs. Median Sales Price in millions
Total Sales Volume By Quarter in millions
Number of Closed Sales By Quarter
Median Sales Price in millions
Did You Know?
Point Pinos Lighthouse in Paci c Grove is the oldest continually operating lighthouse on the West Coast.
“Monterey County Fun Facts”, Monterey County Convention & Visitors Bureau, 2020
Monterey & Del Rey Oaks
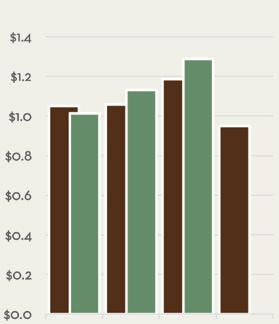
Monterey saw 56 sales during the quarter, a number onpar with 59 sales last quarter and 57 during Q3 last year. e average sales price in the area was high, totaling its second highest mark on record at $1.43M, behind only Q3 of last year. e median sales price hit its record high, totaling $1.28M for the quarter. While several areas have seen a dip in inventory from the start of Q3 to the start of Q4, Monterey has seen a substantial increase, moving from 77 to 100 homes on the market. With Buyer demand expected to remain high in the area, and interest rates slowly coming down, Monterey should see nice activity moving into Q4. Carmel Realty and Monterey Coast Agents combined to represent clients on seven di erent home sales in Monterey during the quarter.
Average Selling Price
$1,430,745 versus Q2 2025
Average Days on Market
48
56 Sales Volume
Units Sold
versus Q3 2024 8.2% versus Q2 2025 0.7% versus Q3 2024 versus Q2 2025 1.8% versus Q3 2024 versus Q2 2025 versus Q3 2024 11.6% no change
$80,121,701
9.8% 5.1%
Q3 2025 Market Breakdown
Average vs. Median Sales Price in millions
Total Sales Volume By Quarter in millions
Number of Closed Sales By Quarter
Median Sales Price in millions
Did You Know?
Nearly a quarter million tons of sardines were processed on Cannery Row in 1945, the year John Steinbeck’s Cannery Row was published. Cannery Row was previously named Ocean View Avenue but was renamed to honor John Steinbeck’s well-known novel.
“Monterey County Fun Facts”, Monterey County Convention & Visitors Bureau, 2020
#1 Locally Owned Brokerage on The Monterey Peninsula
As the current market share leaders in Carmel-by-the-Sea and Pebble Beach and leading luxury brokerage for over 110 years, we have consistently delivered outstanding quality and service to our clients. Our handpicked team of agents share our commitment to quality, integrity, and the community. Unmatched experience, local knowledge, and collaboration has allowed our team to achieve the highest average agent production and dominate the market year a er year.
When you work with Carmel Realty Company, you can take comfort in knowing you are working with an authentic expert in Monterey Peninsula real estate.