
Santa Barbara Area Market Report
SANTA BARBARA AREA REAL ESTATE THROUGH DECEMBER 2025

TOTAL SALES
1,365 (+11% over 2024)
Review in Numbers
SOUTH SANTA BARBARA COUNTY DECEMBER 2025 YTD
SINGLE FAMILY RESIDENCE SALES
998 (+12% over 2024)
CONDOMINIUM SALES
367 (+8% over 2024)
Greetings, and thank you for reading our Fourth Quarter 2025 Market Report.
Throughout the year, we’ve monitored the macro environment and its effect on our local real estate market, largely focused on the impacts of tariffs and interest rates. While the national narrative ended 2025 with a focus on the “frozen” housing market and policy uncertainty, South Santa Barbara County told a remarkably different story.
Our market effectively decoupled from the broader U.S. trend of stagnation. While national sales volumes slumped, the South County closed the year with significant momentum, posting a 14% increase in closed sales compared to Q4 2024. This resilience was driven by the unique micro-climates of our area: the luxury submarkets of Montecito and Hope Ranch— often insulated from interest rate volatility by significant cash purchases—saw robust activity, while the Santa Barbara and Goleta markets continued to attract steady demand despite the “lock-in” effect keeping some inventory off the market.
Furthermore, while national home prices hit new record highs due to scarcity, our local median price demonstrated healthy stability, settling at $1.8MM. We view this stabilization as a positive step toward a balanced market, distinct from the volatility seen elsewhere. However, local challenges remain specific and complex—from navigating insurance to managing tariff-induced construction costs for renovations.
We hope this report provides valuable context for evaluating the real estate market, but the nuances of each submarket, neighborhood and property are unique. Our team is well-seasoned and strategically positioned to capitalize on them for you. Should you have specific inquiries about your submarket, or a specific property, please do not hesitate to contact us. The entire Village Properties team is dedicated to providing you with tailored insights and consistent, exceptional service.
Best regards,
Renee Grubb
S ingle Family
SOUTH SANTA BARBARA COUNTY
DECCEMBER 2025 YTD
AVERAGE SALES PRICE • YTD
$3,640,015
+4% change from 2024
MEDIAN SALES PRICE • YTD
$2,300,000
+6% change from 2024


SOUTH SANTA BARBARA COUNTY DECEMBER 2025 YTD
AVERAGE SALES PRICE • YTD
$1,368,734 +8% change from 2024
MEDIAN SALES PRICE • YTD
$1,093,000 +10% change from 2024
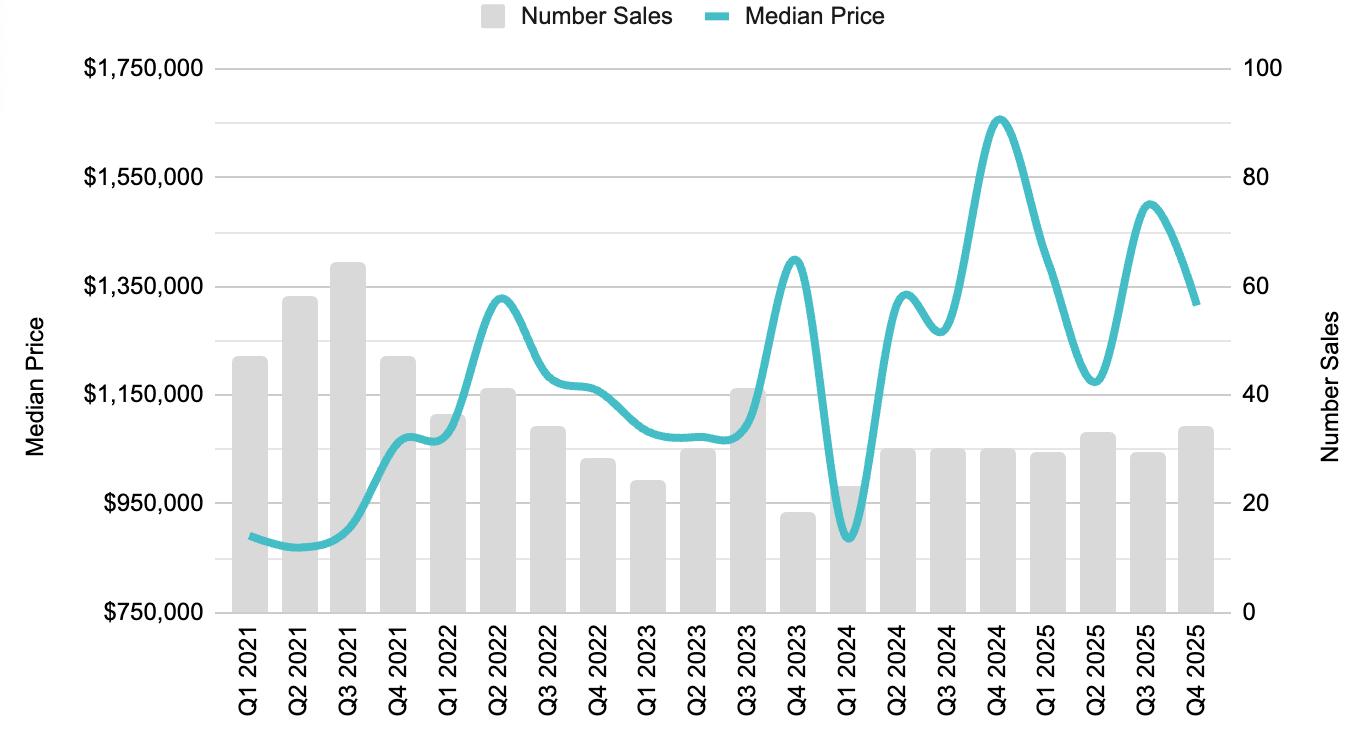
SALES & INVENTORY
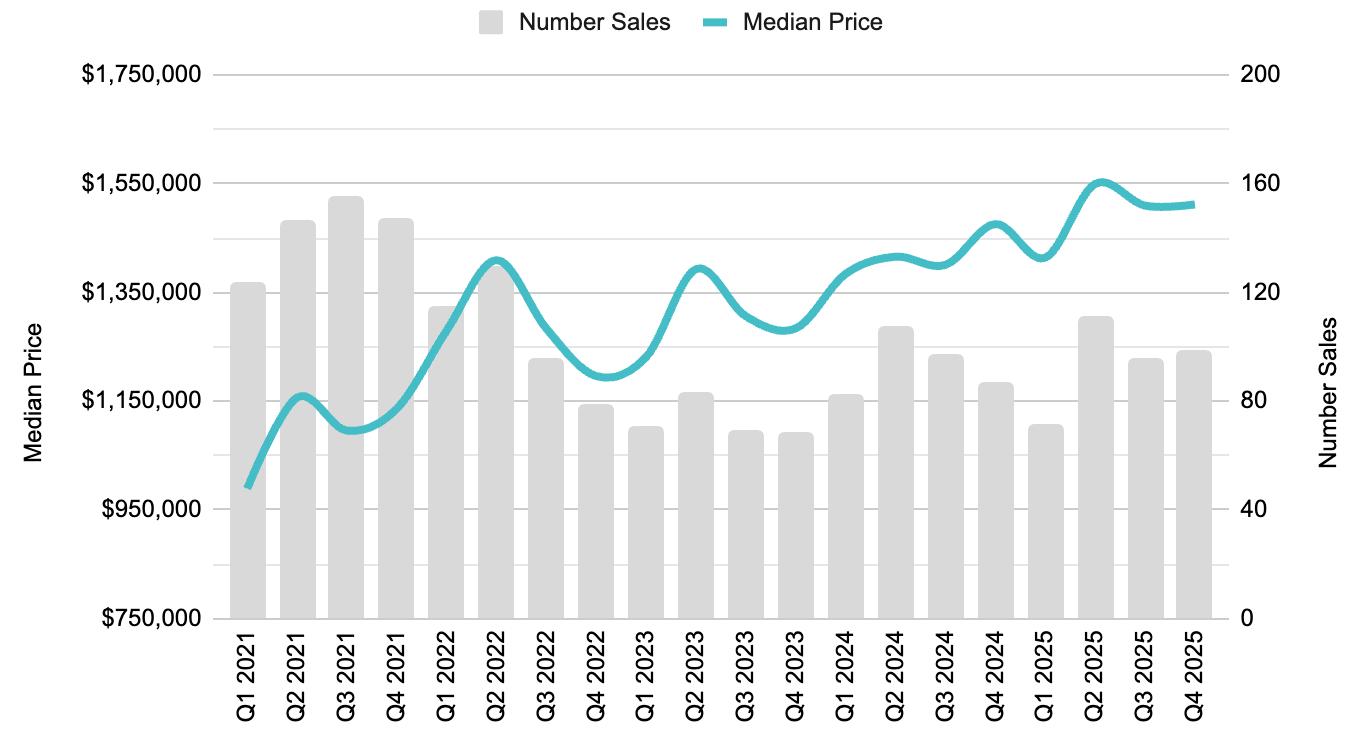
There were 345 closed sales in the Fourth Quarter, an increase of 14% from Q4 2024, and even with Q3. On a seasonal basis over the past five years, sales have decreased by 14% on average from Q3 to Q4, so the fact that sales activity was even with Q3 is notable. The last time there was a flat to positive seasonal change in sales for Q3 and Q4, was Q4 2020, a feverish period when there were 700 sales in the quarter, leading into 2021 - the peak for number of sales over the past 10 years. It’s also worth noting that the distribution of sales per submarket remained relatively unchanged from Q3 and Q4 2024, meaning there was no material mix shift that impacted overall sales or pricing comparisons.
Inventory and Months of Supply (MoS) continued to take steps toward supply/demand equilibrium during the quarter. We started the year at 2.6 MoS, and at times during the Spring, Summer, and Fall, almost hit four months. In line with past years, there was a pullback in new listings at the end of the year, and we ended December with 2.6 Months. Typically four to six MoS equals a neutral, balanced market. Pre-covid in 2018 and 2019, MoS averaged ~4.5 months and declined to a severe undersupply condition, with a trough of 1.1-1.2 Average in 2021 and 2022. Since that time, inventory and MoS has steadily increased every year since, and averaged 3.2 Months for 2025. While technically still undersupplied, we view this as a positive step toward a healthier, more stable market in the long term.
Santa Barbara Area real estate market
SOUTH SANTA BARBARA COUNTY · THROUGH DECEMBER 2025
PRICING
Overall, Median Price for South Santa Barbara County continues to be quite stable. In Q4, Median Price was $1.8MM, down 4% from Q3 and essentially flat from Q4 2024. Since Q2 2024, pricing has been rangebound between $1.8MM and $2MM depending on the Quarter. We view this as a positive dynamic for the market long term as the consistent double digit increases in pricing during 2021 and 2022 (during the severe undersupply condition), were not and are not sustainable. As supply gradually came back to the market starting in 2023, price increases generally became more muted (in the single digit range). Market conditions and especially price performance should always be more closely analyzed by submarket, however.
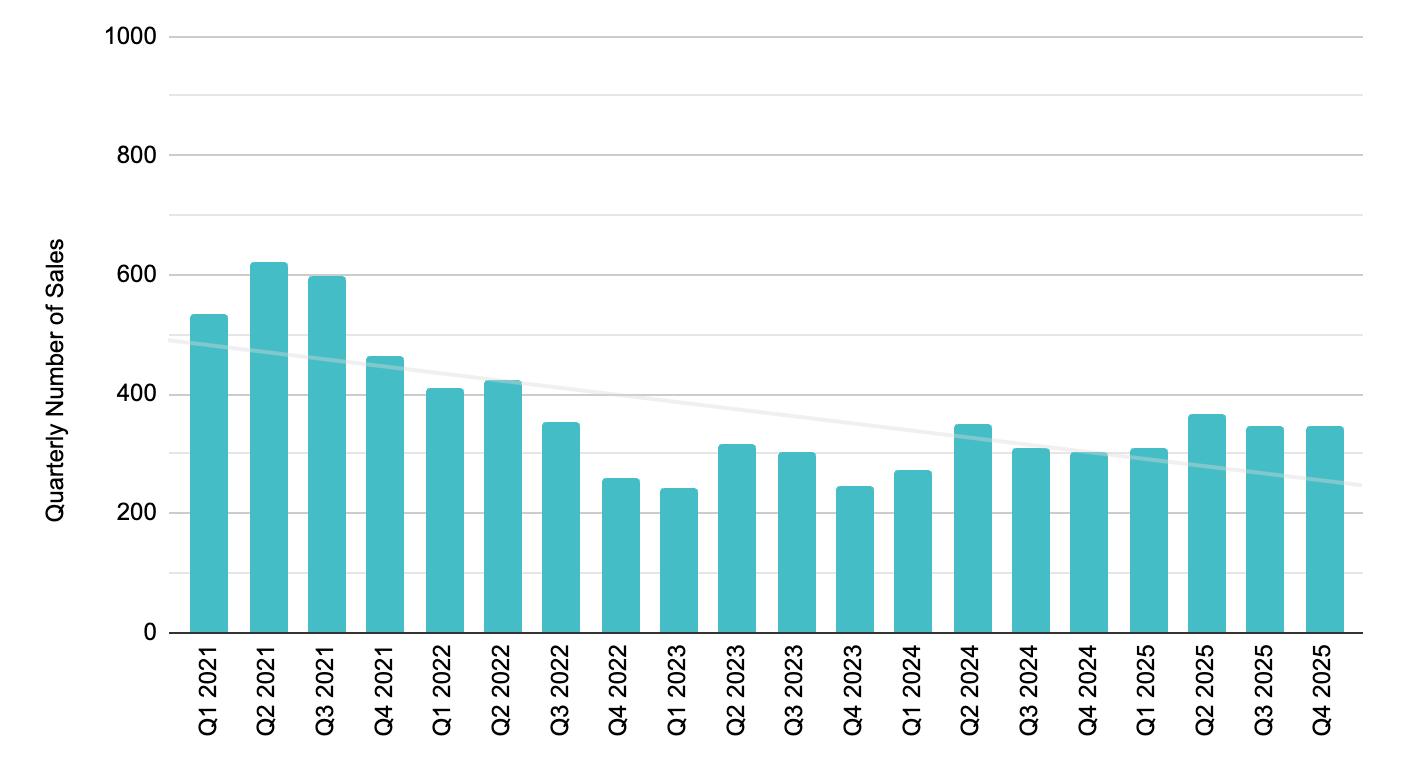
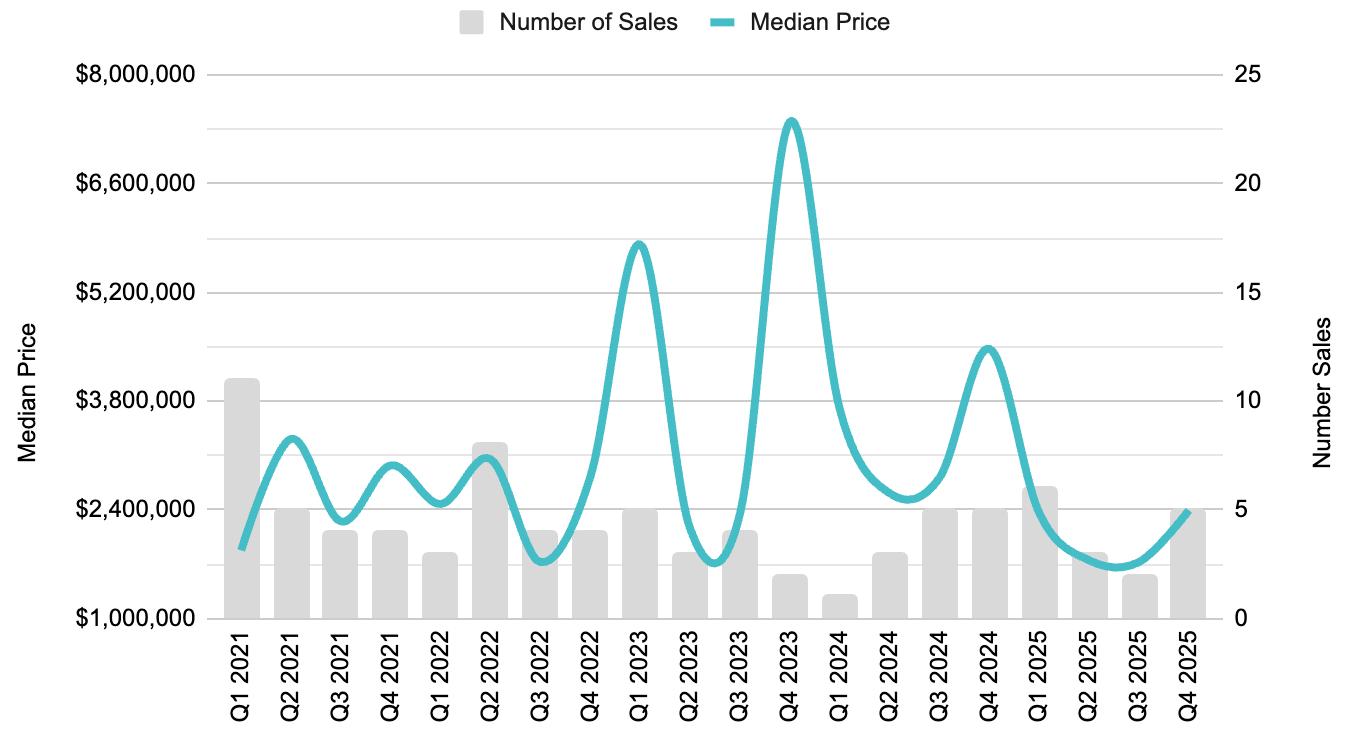
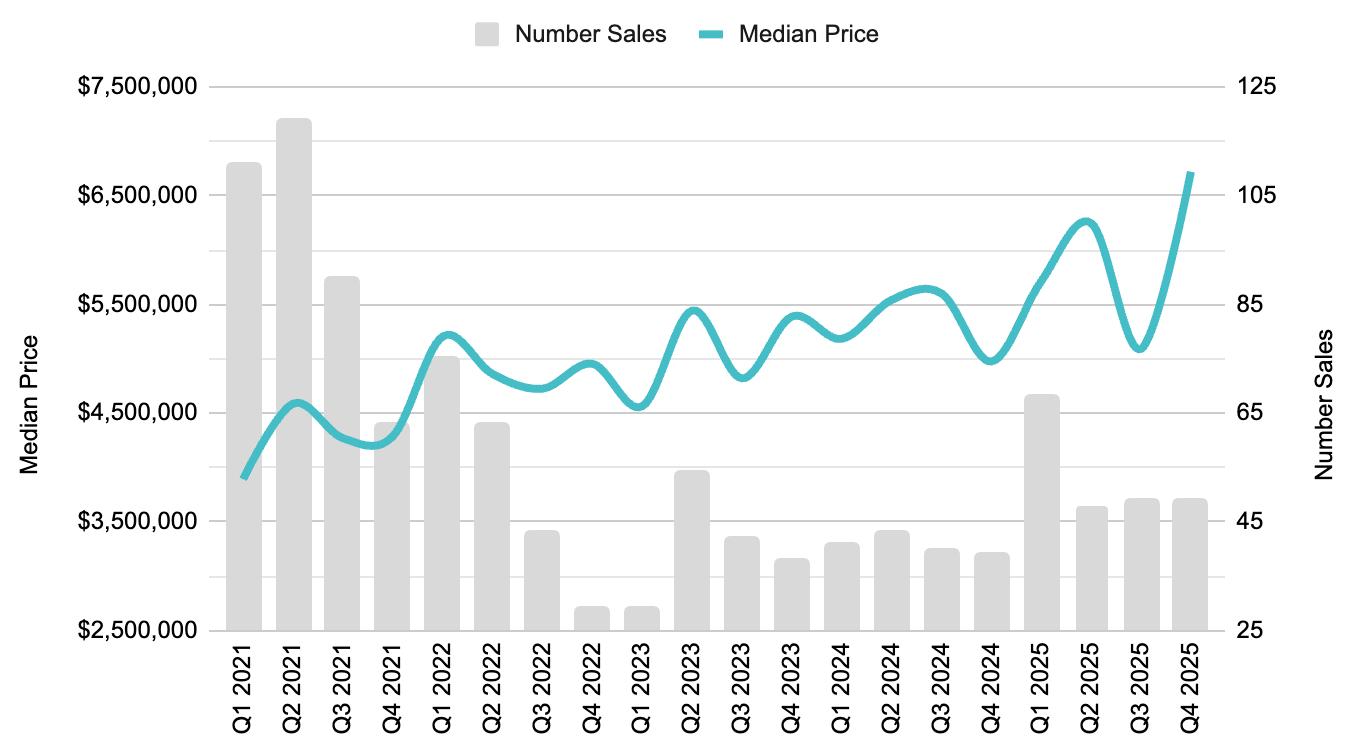
HISTORICAL SALES
On an annual basis, there were 1,365 closed sales in the South County for 2025, representing a 10% increase from 2024. Compared to a 10-Year Average, this still represents a 23% decline in sales. While interest rates have declined more recently within this period, this decline in sales activity was primarily driven by a higher interest rate environment that restricted would-be sellers from trading into replacement properties.
Number of Sales over the past 10 years
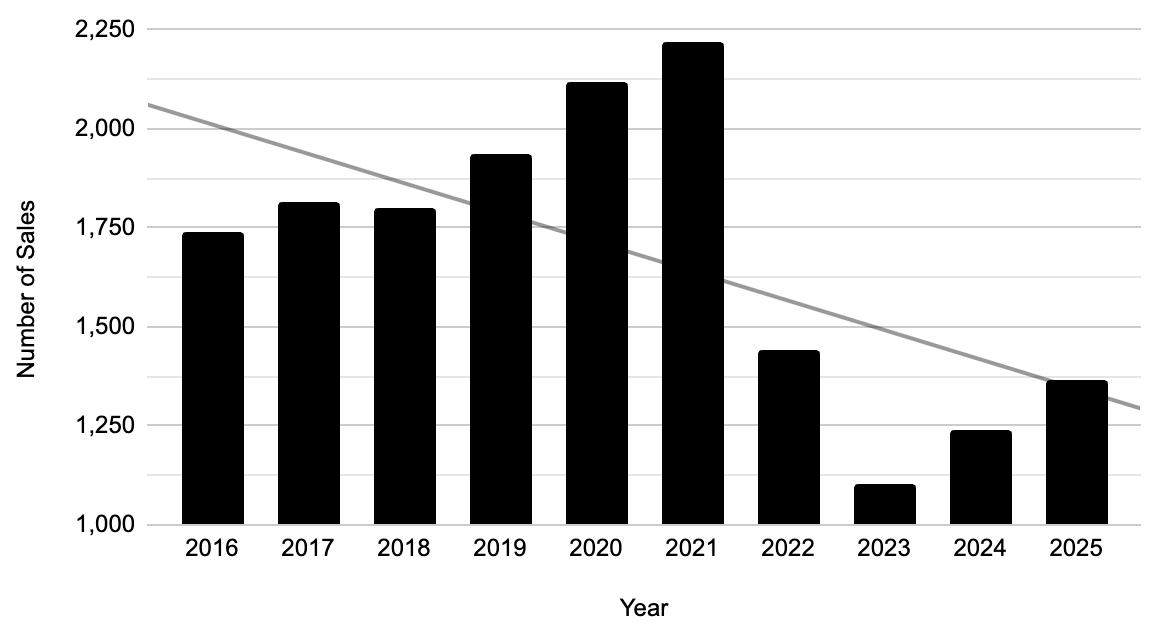
Historical Context (past 10 years)
SOUTH SANTA BARBARA COUNTY
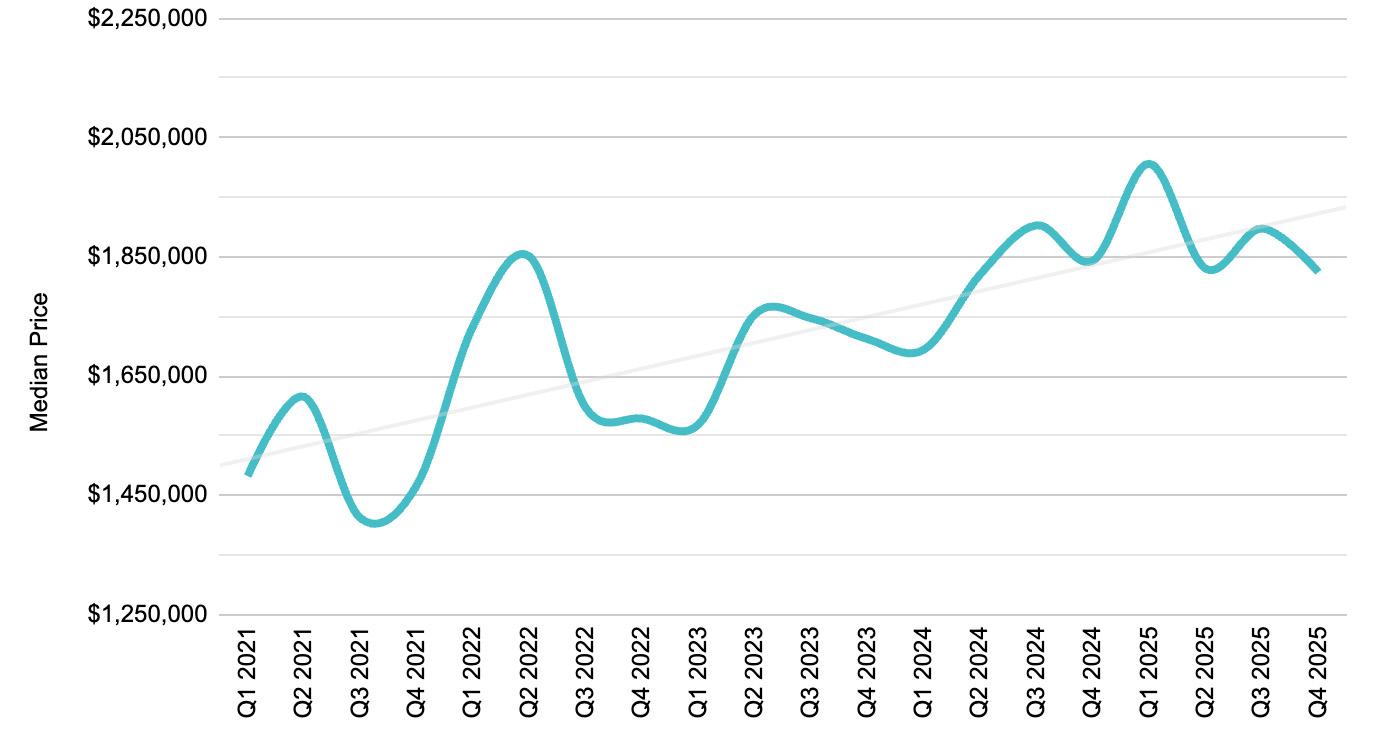
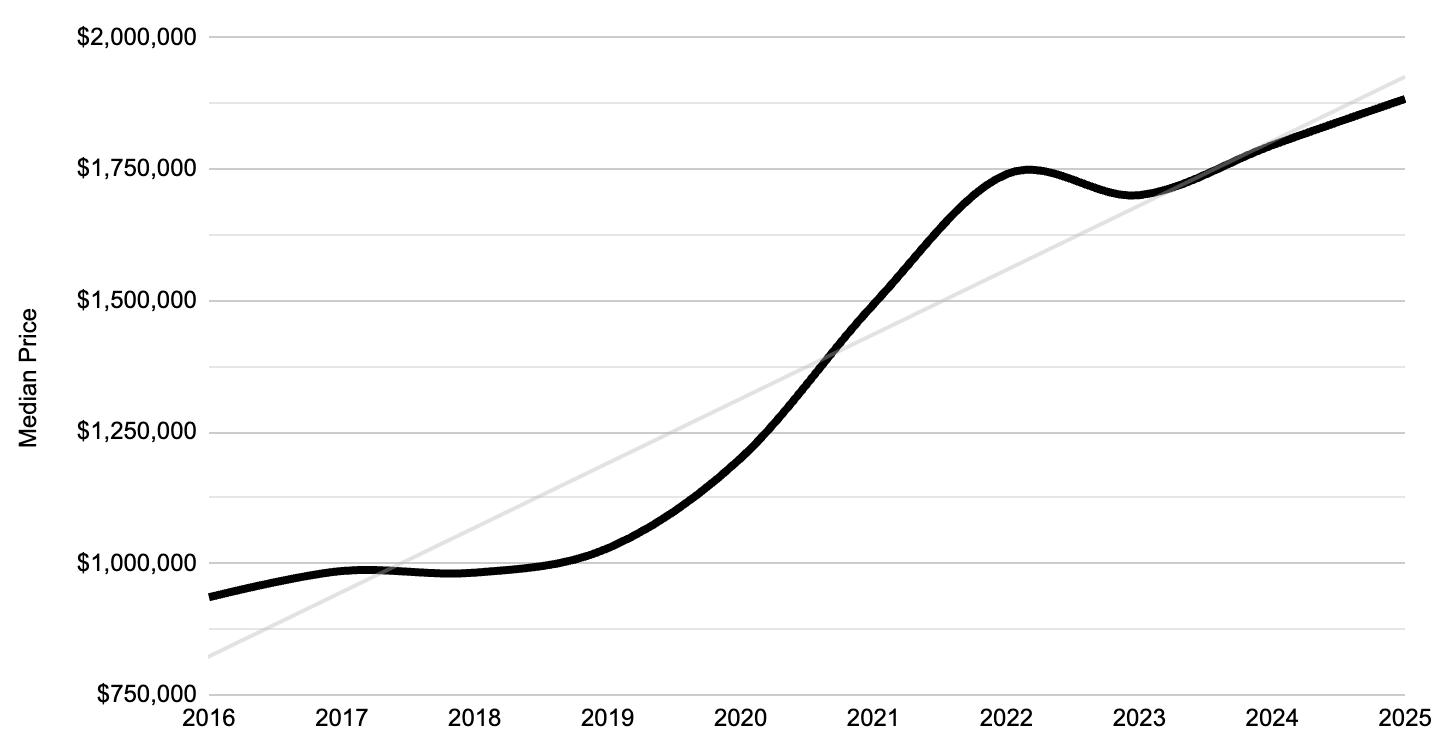
HISTORICAL PRICING
On an annual basis, Median Price was $1.88MM, a 5% increase from 2024, and another new record for our area. Over the past 10 years, Median Price effectively doubled ($935k to $1.88MM), or roughly a 10% increase on average per year over that time, with only one year with a mild contraction (2023 @ -2%).
Median Price
over the past 10 years

$1,300,000 -11% change from 2024 DECEMBER 2025

$938,624
Carpinteria
Over in Carp, there were 34 closed sales in Q4, up 13% YoY.
Median Price came in at $1.3MM, a 21% decline compared to Q4 2024. Similar to Santa Barbara, compared to Q4 2019, Median Price increased 49%. It’s worth highlighting that Q4 2024 was an outlier for Carp, when the Median Price was $1.65MM due to five sales at $6MM, $8MM, $10MM, and $65MM. This quarter, the most notable transactions included two new construction sales at Polo Condos: 135 Polo Way ($4.675MM) and 110 Polo Way ($5.425MM), and 871 Sand Point Rd for $11.65MM.


Summerland
Summerland is another submarket with typically few sales per month/quarter, which makes it tougher to compare. In Q4, there were five closed sales, unchanged YoY. Median Price declined 46%, to $2.4MM. In Q4 2024, there was an $8.5MM sale. The most notable sale in Summerland this quarter was 2556 Whitney Ave for $4.6MM.
DECEMBER 2025

$1,537,500

DECEMBER 2025
$3,990,000 -6% change from 2024

$3,346,713
$3,085,000
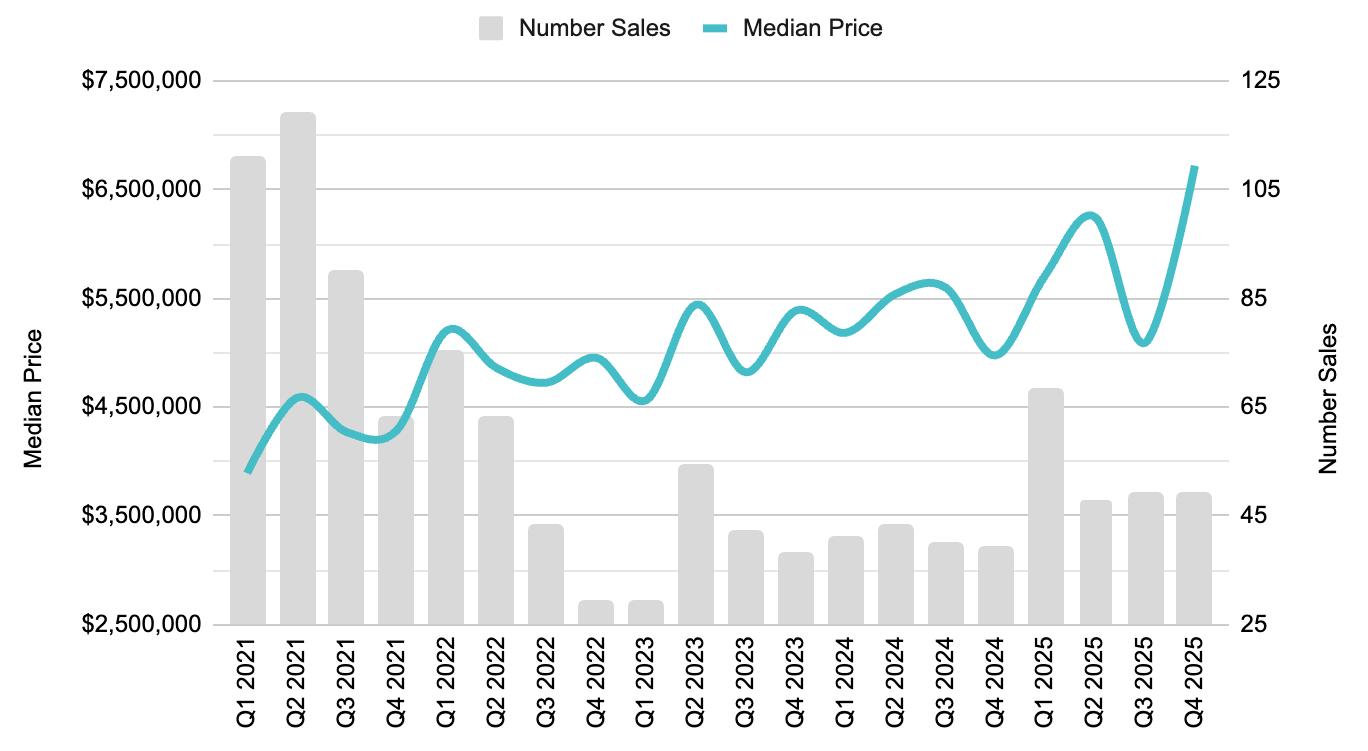
Montecito
The Montecito market continues to exhibit robust demand and had a stellar quarter to end the year. The Number of Sales grew 26% YoY (49 vs. 39 in Q4 2024). But the real story this quarter is in pricing. Median Price rose 35% YoY to $6.7MM. For context, Q4 2019 (the last quarter pre covid), Median Price was $3.2MM (so in six years, Median Price was up 115%). This quarter there were 13 sales over $10MM, six over $20MM, and two over $40MM. The most notable transactions this quarter were 1545 East Valley Rd and an estate on Picacho Ln for $60MM.
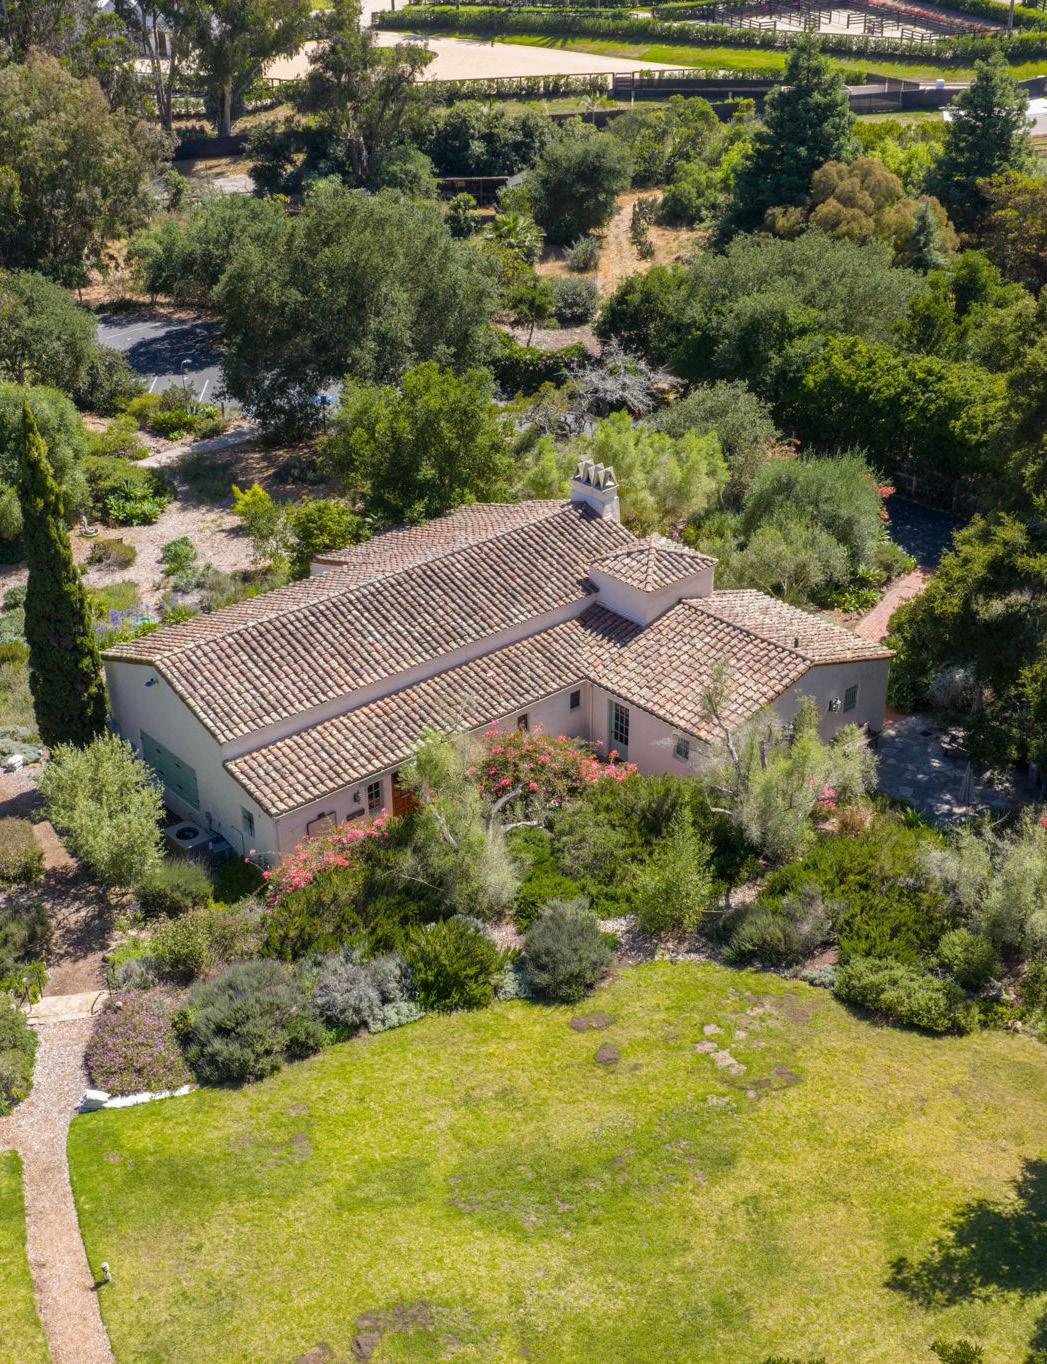
526 SAN YSIDRO ROAD


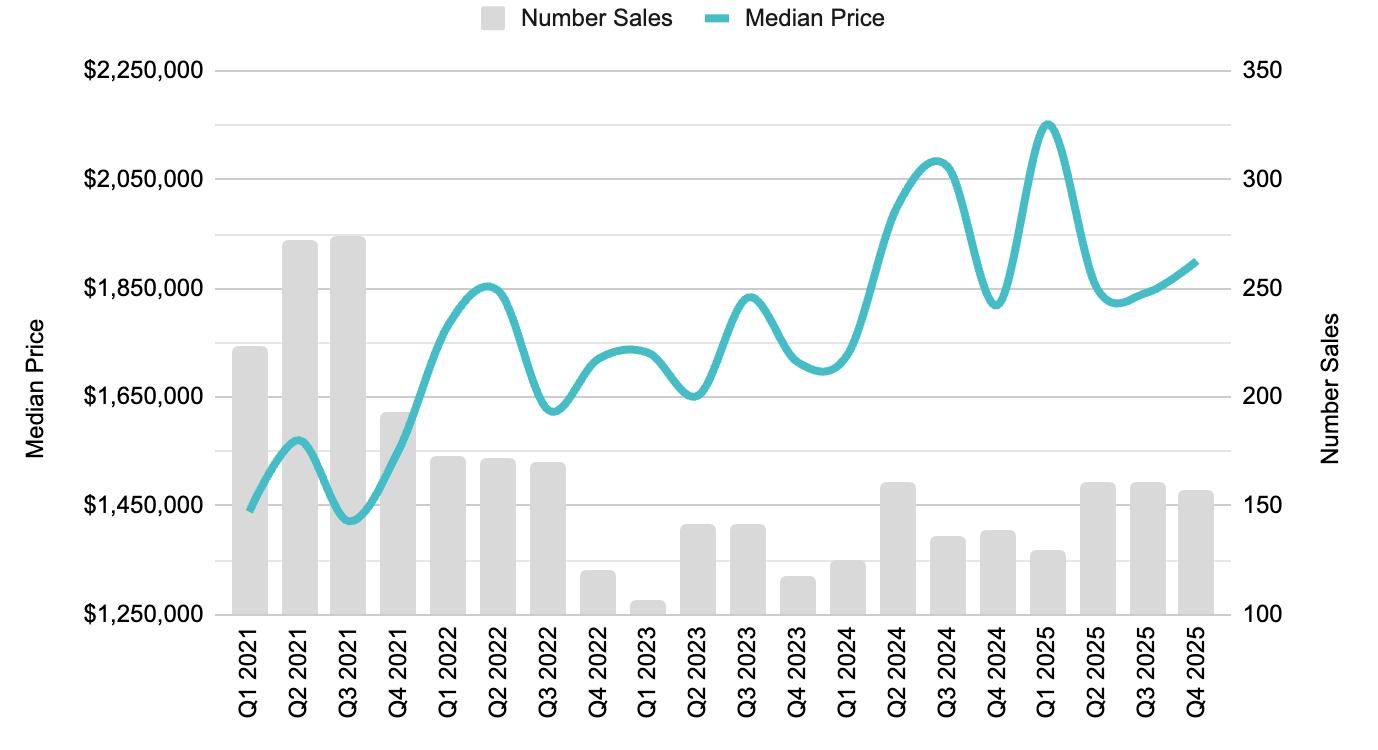
Santa Barbara
While not as dramatic a change as Montecito, Santa Barbara also posted a strong quarter. The Number of Sales grew 13% YoY, and Median Price increased 4%, to $1.9MM. In Q4, there were eight sales over $4MM, the most notable being 2082 Las Canoas Rd for $5.4MM and 3213 Cliff Dr for $10.85MM.
Compared to Q4 2019, Median Price in Santa Barbara was up 50% (compared to 115% in Montecito).
Santa Barbara
DECEMBER 2025
$1,682,500 -1% change from 2024

436
167
$1,377,695
$1,180,000

DECEMBER 2025

Hope Ranch
Month-to-month and quarter-to-quarter comparisons in Hope Ranch are typically difficult as there are so few transactions to analyze, which creates “skew” in key metrics. There were three sales in Q4, on par with Q4 2024, but down from 10 in Q2 and Q3. Median Price was $10.25MM, or +102% YoY. The sales in Hope Ranch this quarter were: 4672 Via Roblada for $7.8MM, 4347 Marina Dr for $10.75MM, and 4475 Via Abrigada for $12.2MM.

Goleta
There were 98 sales in Goleta this quarter, up 14% YoY. The Median Price of $1.5MM was up by 2% compared to Q4 2024, and the third straight quarter that Median Price has held at or above $1.5MM. Generally, Median Pricing in 2023 was $1.3MM, 1.4MM in 2024, and now sits at a new benchmark of $1.5MM. The most notable sales this quarter were 4530 Via Clarice for $4.45MM and 4900 Via Los Santos for $4.5MM, in the Foothills around San Antonia Creek.
DECEMBER 2025
$1,511,732 +2% change from 2024

267
$1,484,750 +10% change from 2024
SALES · YEAR TO DATE
$1,029,930
Santa Ynez Valley Review in Numbers
SANTA YNEZ VALLEY
DECEMBER 2025 YTD
TOTAL SALES
181 (+29% over 2024)
SINGLE FAMILY RESIDENCE SALES
146
(+19% over 2024)
CONDOMINIUM SALES
35 (+30% over 2024)
S ingle Family
SANTA YNEZ VALLEY
DECEMBER 2025 YTD
AVERAGE SALES PRICE • YTD
$2,107,967
+2% change from 2024
MEDIAN SALES PRICE • YTD
$1,764,400
+13% change from 2024

C

SANTA YNEZ VALLEY DECEMBER 2025 YTD
AVERAGE SALES PRICE • YTD
$768,077 +3% change from 2024
MEDIAN SALES PRICE • YTD
$719,900 +9% change from 2024


$735,000

Santa Ynez

SINGLE
FAMILY RESIDENCES • YTD
TOTAL SALES · YEAR TO DATE
5 AVERAGE SALES PRICE · YTD $1,657,533
MEDIAN SALES PRICE · YTD $1,820,000 SINGLE FAMILY RESIDENCES • YTD
TOTAL SALES · YEAR TO DATE
50 AVERAGE SALES PRICE · YTD
$2,878,622
MEDIAN SALES PRICE · YTD
$2,550,000

Global Connections

“Our global partners ensure your home is seen by interested buyers across the world.”
RENEÉ GRUBB Founder & CEO

We are fortunate to be in a place that people all over the world desire to be. We cultivate strategic global relationships that ultimately benefit you by putting your home in front of those people.