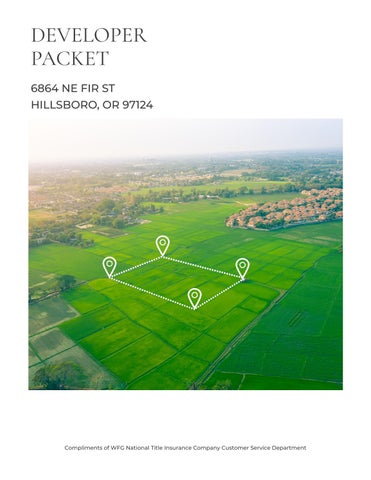
ZONING
Detailed Zoning Information
SCR-OTC (Station Community Residential-Orenco Townsite Conservation)
Zoning Map
Community Jurisdiction
The information contained is provided by WFG’s Customer Service Department to our customers, and while deemed reliable, is not guaranteed.
DETAILS
• Section 12.50.200 Site Design
• Section 12.50.300 Vehicle Parking
• Section 12 50 400 Bicycle Parking/Bicycle and Pedestrian Circulation and Connectivity
• Section 12 50 500Access and Street Standards
• Section 12.50.600 Public Utilities, Site Grading and Storm Water Management Facilities Site Integration
• Section 12 50 700 Design Standards for Residential Development
(Ord 6401 § 1, 2022)
12.21.700 SCR-OTC Station Community Residential – Orenco
Townsite Conservation.
The SCR-OTC zone includes the following sections:
12.21.750
12.21.760
12
(Ord 6401 § 1, 2022)
12.21.710 Purposes.
A Preserve the Historic OrencoTownsite The SCR-OTC zone implements the SCPAStation Community PlanningArea Comprehensive Plan designation in the historic Orenco neighborhood, conserving the historic lotting pattern, open space and architectural character of the townsite, providing opportunities for rehabilitation of existing buildings and construction of compatible new development.
B. ProvideTransit-Supportive Housing Options.The SCR-OTC zone provides for the development of single detached dwellings, middle housing, and accessory dwelling units that are within reasonable proximity to the Orenco Light RailTransit station
12.21.710 Purposes
HousingTypes
12 21 720
12 21 730 Uses
Accessory
Permitted
12 21 740
Uses
by Right
Development
Standards
Variances
andAdjustments
Pertinent
21 770 Other
Regulations
C. Preserve Neighborhood Livability.The SCR-OTC zone encourages livability in an existing historic neighborhood by allowing compatible non-residential uses such as schools, neighborhood commercial, and parks (Ord 6401 § 1, 2022; Ord 6323 § 1, 2019; Ord 6322 § 1, 2019)
12.21.720 Housing Types.
Table 12 21 720-1 lists housing types permitted in the SCR-OTC zone Housing types are defined in Section 12.01.500.
Table 12.21.720-1:
Housing Types Permitted in the SCR-OTC Zone
Permitted subject to additional standards in Section 12 40 190 and Orenco Plan DistrictTownsite architectural standards in Section 12.62.500.
(P) Permitted (C) Conditional (L) Limited (N) Not Permitted (Ord. 6401 § 1, 2022; Ord. 6322 § 1, 2019; Ord. 6294 § 1, 2019)
12.21.730 Uses.
Table 12.21.730-1 lists the permitted, conditionally permitted, limited, and not permitted uses in the SCR-OTC zone
Table 12.21.730-1:
Use Categories in the SCR-OTC Zone
Housing Type Status Notes Single detached dwelling P Duplex P Triplex P Quadplex P Townhouse P Cottage Cluster P Multiple-dwelling structure N Manufactured dwelling L
Manufactured dwelling project N Live-work dwellings N
Use Status Clarifications
Residential Use Categories Household Living P See HousingTypesTable 12 21 720-1 Group Living L/N
Permitted for persons with disabilities with Director’s Interpretation of ReasonableAccommodation (see Section 12 80 050); all other uses not permitted Residential Services N
Residential Business N
Commercial Use Categories - Only Categories Listed Below Permitted
Bed and breakfast inns permitted with Conditional Use approval on lots abutting NEAlder St between NE 68th Ave and NE Century Blvd and subject to additional standards in Section 12 40 130 All other uses not permitted Eating and Drinking Establishments
Commercial Lodging C/N
Small-scale eating and drinking establishment uses permitted on lots abutting NEAlder St between NE 68th Ave and NE Century Blvd.
Small-scale office uses permitted on lots abutting NE Alder St between NE 68thAve and NE Century Blvd. Psilocybin facilities permitted, subject to additional standards in Section 12 40 215 Retail Products and Services
Small-scale retail products and services uses permitted on lots abutting NEAlder St between NE 68thAve and NE Century Blvd
Minor assembly facilities permitted with Conditional Use approval and subject to additional standards in Section 12 40 210 All other uses not permitted
Industrial Use Categories - Not Permitted
Institutional Use Categories
Community Services L/C Emergency shelters are permitted subject to additional standards in Section 12 40 107; all other uses permitted with Conditional Use approval.
L
Office L
C/L/N
Colleges
and Universities N
Detention
N Hospitals N
Facilities
Use Status Clarifications
MajorAssembly Facilities C/N
Religious institutions such as churches, synagogues, mosques, or temples permitted with Conditional Use approval and subject to additional standards in Section 12.40.210.All other uses not permitted.
Schools C
Permitted with Conditional Use approval subject to additional standards in Section 12.40.210.
Infrastructure and Utilities Use Categories
Aviation Uses N
Parks and Open Space C
Permitted with Conditional Use approval. Cemeteries subject to additional standards in Section 12 40 140
Public Safety Facilities C Permitted with Conditional Use approval.
SurfaceAlternative Transportation Facilities P/C/N
Transit facilities permitted Park-and-ride facilities permitted with Conditional Use approval. Storage and maintenance yards not permitted
Telecommunications Facilities C Permitted with Conditional Use approval and subject to additional standards in Section 12.40.240.
Utility Facilities C
With no equipment storage, permitted with Conditional Use approval and subject to additional standards in Section 12.40.260.
(P) Permitted (C) Conditional (L) Limited (N) Not Permitted
(Ord. 6417 § 1, 2022; Ord. 6401 § 1, 2022; Ord. 6322 § 1, 2019; Ord. 6294 § 1, 2019; Ord. 6149 § 1, 2015)
12.21.740Accessory Uses Permitted by Right.
A Accessory Dwelling Units Accessory dwelling units (ADUs) are defined in Section 12 01 500, and are permitted when accessory to single detached dwellings or townhouses subject to additional requirements in Section 12.40.100, and to the requirements of the Orenco Plan District under Subchapter 12 62
B Accessory Structures Accessory structures are defined in Section 12 01 500, and are permitted subject to additional requirements in Section 12.40.104.All accessory structures are subject to the architectural requirements of the Orenco Plan District under Section 12 62 400
C Home Occupations Home occupations are defined in Section 12 01 500, and are permitted subject to additional requirements in Section 12.40.170.
D. Community Recreation Facilities and Community Buildings. Community recreation facilities and community buildings used solely by residents of a specific neighborhood or development are permitted when approved as an amenity of that neighborhood or development during the development process. When accessory to cottage clusters, community buildings are subject to additional requirements in Subsection 12.50.715.E.9.
E Certified or Registered Family Child Care Homes and Residential Homes Certified or registered family child care homes as defined in ORS 329Aare permitted; and certified or registered residential homes as defined in ORS 443 are also permitted.
F Household Energy Production Facilities Household energy production facilities are defined in Section 12 01 500, and are permitted subject to issuance of necessary and appropriate Federal, State and local permits.
G. Amateur or “Ham” Radio Facilities.Amateur or “ham” radio facilities are permitted subject to issuance of necessary and appropriate Federal, State and local permits
H HorticulturalActivities Horticultural activities are defined in Section 12 01 500, and are permitted, excluding commercial buildings or structures. (Ord. 6401 § 1, 2022; Ord. 6323 § 1, 2019; Ord 6120 § 1, 2015)
12.21.750 Development Standards.
Base zone development standards in the SCR-OTC zone are listed inTable 12 21 750-1 Certain standards are illustrated in Figure 12 21 750-A
Table 12.21.750-1:
Development Standards in the SCR-OTC Zone Standard Requirement Clarifications Minimum Lot Size · Residential 7,500 sq ft For townhouse lots, average minimum lot size is 1,500 sq ft · Non-Residential and Mixed-Use None Maximum Lot Size · Residential See clarifications Maximum residential lot size subject to
townsite lot dimensions (see Subsection
· Non-Residential and Mixed-Use None Minimum Density 6 0 du/na
original
12.62.300.A).
Maximum Density
12 0 du/na
Minimum FAR 0 4
Minimum Lot Dimensions*
·
·
Minimum Setbacks*: Residential
· FrontYard
o
o
Clarifications
Maximum density does not apply to duplexes, triplexes, quadplexes, or cottage clusters
Maximum density for townhouses is 25 du/na.
Applicable only to commercial development on lots abutting NEAlder St between NE 68thAve and NE Century Blvd
For townhouse lots, minimum lot width and frontage is 20 feet and minimum lot depth is 65 feet.
Alley frontage not permitted without street frontage on the same lot; flag lots not permitted (see Subsection 12 62 400 I) Exception provided for child lots/parcels in middle housing land divisions under Section 12.80.099.
Minimum front yard setback subordinate to public utility easements
Garage locations subject to additional requirements in Section 12 62 500
Common wall garages permitted with zero side setback, subject to IBC compliance Side yard setbacks on the common wall shall be waived for townhouses permitted underTable 12 21 720-1
o
For cottage clusters, the minimum rear yard setback to dwellings is 10 feet
Garage locations subject to additional requirements in Section 12 62 400
Standard Requirement
50
Width (at front building plane)
feet
150 feet
Frontage 50 feet
Depth
·
dwelling 5
o to
feet
to garage door 19 feet
15
· SideYard 5 feet; sum of 2 side yards at least
feet
· RearYard
10 feet
o to front-loaded dwelling
to rear-loaded dwelling 16 feet to alley
to garage door
less; or 19 feet
Either 5 feet or
or more
* Illustrated in Figure 12 21 750-A Figure 12.21.750-A:
Standard Requirement
Setbacks: Non-Residential and Mixed-Use None All setbacks subordinate to public utility easements and IBC requirements Maximum Setbacks: Residential
FrontYard 20 feet
SideYard None · RearYard None Maximum Setbacks: Non-Residential and Mixed-Use · FrontYard 10 feet · SideYard None · RearYard None Minimum Building Height · Residential* None
Non-Residential and Mixed-Use
< 800 ft from LRTStation 2 stories or 25 feet, whichever is less
> 800 ft. from LRTStation None Maximum Building Height Residential* 2 stories or 35 feet Maximum height for cottage clusters is in Subsection 12 50 715 E 4 Non-Residential and Mixed-Use 3 stories or 40 feet Maximum Lot Coverage None
Useable Open Space Variable
Section 12 50 210
Landscaping
Clarifications Minimum
·
·
·
o
o
Minimum
See
Minimum
Not applicable
Single Detached Dwelling Lot Dimensions Setbacks and Height Requirements in the SCR-OTC Zone
(Ord. 6401 § 1, 2022; Ord. 6323 § 1, 2019; Ord. 6322 § 1, 2019; Ord. 6294 § 1, 2019; Ord. 6283 § 1, 2018; Ord 6120 § 1, 2015)
12.21.760 Variances andAdjustments.
Applications for Variances andAdjustments per Section 12 80 150 to standards in the SCR-OTC zone may be approved under 1 of 4 processes:
A. As a Variance pursuant to Section 12.80.152;
B As a MinorAdjustment in conjunction with a primaryType II orType III application pursuant to Section 12 80 154;
C. As a MajorAdjustment in conjunction with a primaryType III application pursuant to Section 12.80.156; or
D With a Significant Natural Resource Permit application pursuant to Section 12 80 130 (Ord 6401 § 1, 2022; Ord 6322 § 1, 2019; Ord 6120 § 1, 2015)
12.21.770 Other Pertinent Regulations.
C-G MFR-1 MFR-1 SCI SCR -LD SCR -LD SCR -MD SCR -MD SCR -OTC SCR -V SCR -V SFR-6 SFR-7 SFR-7 N E 6 6 T H A V E N E 7 1 S T A V E NE RAINSONG LN N E 7 4 T H A V E NE69THAVE N E C E N T U R Y B L V D N E 6 3 R D A V E NE DEER RUN ST NE MARINA ST N E 6 4 T H C T NE KARLSON CT N E 6 7 T H A V E NE OELRICH ST NE DOGWOOD ST N E 6 8 T H A V E E MAIN ST N E G R E E N R I D G E T E R NE W OODVIEW DR NE ELM ST N E 6 6 T H A V E NE WHITEWOOD DR NE MCMURTRY PL NE QUATAMA S T N E 6 4 T H W A Y NESTONEBRIARLN N E 6 6 T H A V E N E 7 1 S T A V E NE AUTUMNWOOD TER N E 6 3 R D W A Y N E N ELLY ST N E WOODSONG ST N E G A R D E N R I D G E T E R N E 6 9 T H A V E N E 6 4 T H P L N E I D Y L W A Y N E 6 1 S T P L N E 6 4 T H T E R NE DANBURYAVE NE W ILLOWGROV E S T NE ORE NCO RIDGE CT NE SOUTHBROOK CT NE B LACK TA IL W AY NE MEADOW GATE CT N E 6 3 R D P L N E 6 4 T H P L N E G R E E N R I D G E P L NE MARINA CT NE GOLDEN ASH LN NESHALEEN ST N E 6 3 R D T E R NE ELM ST N E S L O A N E W A Y NE SHERBORNE ST NE ASHMONT ST NE CHE S TNUT S T N EMARINA CT N E 6 4 T H C T N E 6 2 N D A V E NE FIR ST N E A L DERCREEK PL NE ROCKRIDGE PL N E 6 3 R D A V E NE FOREST LN N E 7 0 T H A V E N E 6 5 T H C T N E K A L A H A R I R I D G E A V E This map s a copy of public record and s provided solely for nform ation purposes W FG National Tit e assumes no liab ity for variations, f any, in d mens ons, area or location of the prem ises or the locat on of mprovements Customer Serv ice D epartment 12909 SW 68th Parkway, Suite 350 Portl and, OR 97223 (503) 603-1700 cs@w fgnationaltitle.com 0 190 380 95 Fee t
Subject Property Tax Lots Commercial Indust rial Multi Family Mixed Use Residential Single Family ²
Zoni ng
Overlay Information 1N234DA02100
GENERAL
Jurisdiction: Hillsboro
City Zoning (updated 9/2016): SCR-OTC (confirm with Hillsboro City Planning department)
Annexation Proposal / Effective Date / Action / File : WA0510 / 03/22/2010 / Completed annexation to a district / http://library.oregonmetro.gov/annexation/WA0510.pdf
Within Urban Growth Boundary: Yes
Plat: Property is not part of a subdivision
Assessor Area: 3
Zipcode: 97124
SERVICES and DISTRICTS
Community Participation Organization CPO9
Within Enhanced Sheriff's Patrol District [ESPD]
(*Updated July 31st each calendar year): No
Fire District (*Updated July 31st each calendar year): Not in a Fire District - Possibly served by a municipal fire department
Fire Management Zone: 5382
Garbage Hauler: Evergreen Disposal
Garbage Dropbox: Washington County Dropbox
Within Metro's district boundary (*Updated July 31st each calendar year): Yes
ODOT District: 2B
Recreation District (*Updated July 31st each calendar year): Not in a recreation district - possibly served by a city parks and recreation department
Park System Development Charge: No park SDC to collect
THPRD Special Area : Not in a THPRD Special Area
Sanitation District (*Updated July 31st each calendar year): Clean Water Services
School District (*Updated July 31st each calendar year): HILLSBORO
Service District for Lighting Assessment Area/zone: Not in an Assessment Area.
Within Urban Road Maintenance District [URMD]
(*Updated July 31st each calendar year): No
PLANNING
North Bethany Plan Area: Not in North Bethany Sub Area
Community Plan Map: East Hillsboro
Area of Special Concern: 2
Historic & Cultural Resource Inventory: Not located within Historic and Cultural Resource Overlay District
POD Date Zoned: POD:8-5/27/69
Ground Water Resouce Area: Not located within a Ground Water Resource Area
VOTING and REPRESENTATION
Election Precinct: 329
Commissioner District: 4- Jerry Willey
CENSUS and DEMOGRAPHICS
Census Tract: 032408
Census Blockgroup: 410670324081
Census Block: Block 1017
* The data layers used to derive items in the report are assembled from multiple sources. Report items flagged with an asterisk (*) are derived from the taxcode layer maintained by the Washington County Department of Assessment and Taxation. The taxcode layer is updated once a year on July 31st and may not reflect final/proposed annexations or boundary adjustments. All information should be verified with individual service districts.
6864 NE FIR ST, HILLSBORO, OR, 97124 Washington County T1N R2W S34 Latitud TAXLO Tax Lot R Numb Tax Lot Buildin Market Land U Year Bu Sale Da Sale Pr Market Market State G Class County Site Address 6864 NE FIR ST POLITICAL BOUNDARIES Jurisdiction HILLSBORO Neighborhood CPO9 hillsboro/orenco Voting Precinct 329.00000000 Metro Council District 4 Metro Councilor Juan Carlos Gonzalez Metro Councilor Email juancarlos gonzalez@oregonmetro gov US Congressional District 1 Oregon House District 30 +50 m 200 ft Lea et
RLIS
(http://lea etjs com) | Tiles: © Metro
LAND
Oregon Senate District 15
USE AND PLANNING Local Zoning SCR-OTC Generalized Zoning MUR Classi ed Zoning MUR1 Watershed Rock Creek-Tualatin River Sub-Watershed Upper Rock Creek Basin Willamette Sub-Basin Tualatin Flood Plain Outside Wetland Not in a wetland
Growth Boundary Inside Urban/Rural Reserve
Name
Quad Name Hillsboro
DISTRICTS Garbage Hauler Evergreen Disposal Commercial Hauler Evergreen Disposal Dropbox Provider Washington County Dropbox School District HILLSBORO School District Number 1J Oregon Dept. of Ed. Dist. ID 2239 Natl. Center for Ed. Statistics Dist. ID 4100023 Water District Park District Sewer District Clean Water Services District Fire District Fire Management Zone 4984 CENSUS INFORMATION Census Tract 324 08000000 Census Block Group 1
Urban
Reserve
USGS
SERVICE
Data Resource Center
600 Northeast Grand Avenue, Portland, OR 97232
503-797-1742
drc@oregonmetro.gov
© Oregon Metro www.oregonmetro.gov/rlis
This Web site is offered as a public service, integrating various government records into a region-wide mapping system The property assessment records are a multi-county integration of Clackamas, Multnomah and Washington County records MetroMap blends each county's records into a common database on a quarterly basis Therefore, to view each county's of cial records, go to their respective web sites or of ces The other MetroMap data are derived from city, county, state, federal and Metro sources. The metadata (data about the data) are included on this site, including the sources to be consulted for veri cation of the information contained herein. It describes some cases where Metro blends city and county records by generalizing the disparities Metro assumes no legal responsibility for the compilation of multi-source government information displayed by Metro Map Users of this information are cautioned to verify all information
Census Block Population (2010) 2393
COMMUNITY
INFORMATION
Demographics
Traffic Counts
The information contained is provided by WFG’s Customer Service Department to our customers, and while deemed reliable, is not guaranteed.
6864 NE Fir St, Hillsboro, OR 97124
Online Pop-Facts: Population Quick Facts Pop-Facts: Population Quick Facts 6864 NE Fir St, Hillsboro, OR 97124 0 - 1 mi Population 2027 Projection 26,569 2022 Estimate 24,932 2010 Census 18,108 2000 Census 10,411 Growth 2022-2027 6.56% Growth 2010-2022 37.69% Growth 2000-2010 73.93% 2022 Est. Population by Age 24,932 Age 0 to 4 1,673 6.71% Age 5 to 9 1,467 5.89% Age 10 to 14 1,638 6.57% Age 15 to 17 869 3.49% Age 18 to 20 743 2.98% Age 21 to 24 900 3.61% Age 25 to 34 4,208 16.88% Age 35 to 44 4,796 19.24% Age 45 to 54 3,552 14.25% Age 55 to 64 2,288 9.18% Age 65 to 74 1,741 6.98% Age 75 to 84 844 3.38% Age 85 and over 212 0.85% Age 16 and over 19,870 79.70% Age 18 and over 19,284 77.35% Age 21 and over 18,541 74.36% Age 65 and over 2,797 11.22% 2022 Est. Median Age 37.02 2022 Est. Average Age 37.12
6864 NE Fir St, Hillsboro, OR 97124 Sitewise
2022 Est. Population by Single-Classification Race 24,932 White Alone 16,129 64.69% Black or African American Alone 984 3.95% American Indian and Alaska Native Alone 121 0.48% Asian Alone 5,304 21.27% Native Hawaiian and Other Pacific Islander Alone 85 0.34% Some Other Race Alone 966 3.87% Two or More Races 1,343 5.39% 2022 Est. Population by Ethnicity (Hispanic or Latino) 24,932 Hispanic or Latino 3,093 12.41% Not Hispanic or Latino 21,839 87.59% 2022 Est. Population by Sex 24,932 Male 12,372 49.62% Female 12,560 50.38%
6864 NE Fir St, Hillsboro, OR 97124 Sitewise Online Pop-Facts: Population Quick Facts Pop-Facts: Population Quick Facts 6864 NE Fir St, Hillsboro, OR 97124 0 - 1 mi
Copyright © Claritas, LLC 2022. All rights reserved.
6864 NE Fir St, Hillsboro, OR 97124 Sitewise Online Pop-Facts: Household Quick Facts Pop-Facts: Household Quick Facts 6864 NE Fir St, Hillsboro, OR 97124 0 - 1 mi Households 2027 Projection 11,081 2022 Estimate 10,425 2010 Census 7,391 2000 Census 4,091 Growth 2022-2027 6.29% Growth 2010-2022 41.05% Growth 2000-2010 80.68% 2022 Est. Households by Household Income 10,425 Income Less than $15,000 438 4.20% Income $15,000 to $24,999 280 2.69% Income $25,000 to $34,999 327 3.13% Income $35,000 to $49,999 482 4.63% Income $50,000 to $74,999 1,235 11.85% Income $75,000 to $99,999 1,548 14.85% Income $100,000 to $124,999 1,375 13.19% Income $125,000 to $149,999 1,153 11.06% Income $150,000 to $199,999 1,532 14.69% Income $200,000 to $249,999 789 7.57% Income $250,000 to $499,999 878 8.42% Income $500,000 or more 388 3.73% 2022 Est. Average Household Income $ 146,941 2022 Est. Median Household Income $ 116,399 2022 Median HH Inc. by Single-Classification Race White Alone $ 113,277 Black or African American Alone $ 94,615 American Indian and Alaska Native Alone $ 94,740 Asian Alone $ 155,489 Native Hawaiian and Other Pacific Islander Alone $ 115,501 Some Other Race Alone $ 44,319 Two or More Races $ 108,978 Hispanic or Latino $ 107,234 Not Hispanic or Latino $ 117,312 2022 Est. Households by Household Type 10,425 Family Households 6,324 60.66% Nonfamily Households 4,101 39.34% 2022 Est. Group Quarters Population 9
2022 Est. Households by Household Size 10,425 1-person 3,105 29.79% 2-person 3,561 34.16% 3-person 1,692 16.23% 4-person 1,235 11.85% 5-person 527 5.06% 6-person 183 1.75% 7-or-more-person 122 1.17% 2022 Est. Average Household Size 2.39 6864 NE Fir St, Hillsboro, OR 97124 Sitewise Online Pop-Facts: Household Quick Facts Pop-Facts: Household Quick Facts 6864 NE Fir St, Hillsboro, OR 97124 0 - 1 mi
2022 Est. HHs by Type by Presence of Own Children 6,324 Married-Couple Family, own children 2,293 36.26% Married-Couple Family, no own children 2,700 42.69% Male Householder, own children 191 3.02% Male Householder, no own children 168 2.66% Female Householder, own children 576 9.12% Female Householder, no own children 395 6.25% Copyright © Claritas, LLC 2022. All rights reserved. 6864 NE Fir St, Hillsboro, OR 97124 Sitewise Online Pop-Facts: Household Quick Facts Pop-Facts: Household Quick Facts 6864 NE Fir St, Hillsboro, OR 97124 0 - 1 mi
6864 NE Fir St, Hillsboro, OR 97124
Online
Demographic Snapshot (Part 1) Pop-Facts: Demographic Snapshot (Part 1) 6864 NE Fir St, Hillsboro, OR 97124 0 - 1 mi Population 2027 Projection 26,569 2022 Estimate 24,932 2010 Census 18,108 2000 Census 10,411 Growth 2022-2027 6.56% Growth 2010-2022 37.69% Growth 2000-2010 73.93% 2022 Est. Population by Single-Classification Race 24,932 White Alone 16,129 64.69% Black or African American Alone 984 3.95% American Indian and Alaska Native Alone 121 0.48% Asian Alone 5,304 21.27% Native Hawaiian and Other Pacific Islander Alone 85 0.34% Some Other Race Alone 966 3.87% Two or More Races 1,343 5.39% 2022 Est. Population Hispanic or Latino by Origin 24,932 Not Hispanic or Latino 21,839 87.59% Hispanic or Latino 3,093 12.41% Hispanic or Latino by Origin 3,093 Mexican 2,246 72.63% Puerto Rican 139 4.51% Cuban 38 1.23% All Other Hispanic or Latino 669 21.64% 2022 Est. Hisp. or Latino Pop by Single-Classification Race 3,093 White Alone 1,842 59.54% Black or African American Alone 36 1.18% American Indian and Alaska Native Alone 45 1.46% Asian Alone 30 0.98% Native Hawaiian and Other Pacific Islander Alone 2 0.08% Some Other Race Alone 901 29.13% Two or More Races 237 7.65%
Sitewise
Pop-Facts:
2022 Est. Pop by Race, Asian Alone, by Category 5,304 Chinese, except Taiwanese 563 10.61% Filipino 551 10.38% Japanese 253 4.77% Asian Indian 2,300 43.36% Korean 305 5.75% Vietnamese 643 12.13% Cambodian 142 2.68% Hmong 33 0.63% Laotian 114 2.14% Thai 0 0.00% All other Asian Races, including 2 or more 401 7.56% 2022 Est. Population by Ancestry 24,932 Arab 1 0.00% Czech 97 0.39% Danish 93 0.37% Dutch 243 0.97% English 1,826 7.32% French (except Basque) 380 1.52% French Canadian 195 0.78% German 2,137 8.57% Greek 143 0.57% Hungarian 53 0.21% Irish 1,681 6.74% Italian 749 3.01% Lithuanian 19 0.08% Norwegian 755 3.03% Polish 482 1.94% Portuguese 29 0.12% Russian 125 0.50% Scottish 423 1.70% Scotch-Irish 147 0.59% Slovak 8 0.03% Subsaharan African 249 1.00% Swedish 472 1.89% Swiss 120 0.48% Ukrainian 40 0.16% United States or American 651 2.61% Welsh 239 0.96% West Indian (except Hisp. groups) 2 0.01% Other Ancestries 10,816 43.38% Ancestry Unclassified 2,758 11.06% 2022 Est. Pop Age 5+ by Language Spoken At Home 23,259 Speak only English 16,045 68.99% 6864
Online Pop-Facts: Demographic Snapshot (Part 1) Pop-Facts: Demographic Snapshot (Part 1) 6864 NE Fir St, Hillsboro, OR 97124 0 - 1 mi
NE Fir St, Hillsboro, OR 97124 Sitewise
Speak Asian or Pacific Island Language 2,792 12.00% Speak IndoEuropean Language 2,487 10.69% Speak Spanish 1,646 7.08% Speak Other Language 289 1.24% 6864 NE Fir St, Hillsboro, OR 97124 Sitewise Online Pop-Facts: Demographic Snapshot (Part 1) Pop-Facts: Demographic Snapshot (Part 1) 6864 NE Fir St, Hillsboro, OR 97124 0 - 1 mi
2022 Est. Population by Sex 24,932 Male 12,372 49.62% Female 12,560 50.38% 2022 Est. Population by Age 24,932 Age 0 to 4 1,673 6.71% Age 5 to 9 1,467 5.89% Age 10 to 14 1,638 6.57% Age 15 to 17 869 3.49% Age 18 to 20 743 2.98% Age 21 to 24 900 3.61% Age 25 to 34 4,208 16.88% Age 35 to 44 4,796 19.24% Age 45 to 54 3,552 14.25% Age 55 to 64 2,288 9.18% Age 65 to 74 1,741 6.98% Age 75 to 84 844 3.38% Age 85 and over 212 0.85% Age 16 and over 19,870 79.70% Age 18 and over 19,284 77.35% Age 21 and over 18,541 74.36% Age 65 and over 2,797 11.22% 2022 Est. Median Age 37.02 2022 Est. Average Age 37.12 6864
Pop-Facts: Demographic Snapshot (Part 1) 6864 NE Fir St, Hillsboro, OR 97124 0 - 1 mi
NE Fir St, Hillsboro, OR 97124 Sitewise Online Pop-Facts: Demographic Snapshot (Part 1)
2022 Est. Male Population by Age 12,372 Age 0 to 4 882 7.13% Age 5 to 9 758 6.13% Age 10 to 14 854 6.90% Age 15 to 17 439 3.55% Age 18 to 20 376 3.04% Age 21 to 24 435 3.51% Age 25 to 34 2,097 16.95% Age 35 to 44 2,456 19.85% Age 45 to 54 1,809 14.62% Age 55 to 64 1,106 8.94% Age 65 to 74 728 5.89% Age 75 to 84 354 2.86% Age 85 and over 79 0.64% 2022 Est. Median Age, Male 36.41 2022 Est. Average Age, Male 36.14 2022 Est. Female Population by Age 12,560 Age 0 to 4 792 6.30% Age 5 to 9 709 5.65% Age 10 to 14 785 6.25% Age 15 to 17 430 3.42% Age 18 to 20 367 2.92% Age 21 to 24 465 3.71% Age 25 to 34 2,111 16.80% Age 35 to 44 2,339 18.63% Age 45 to 54 1,743 13.88% Age 55 to 64 1,182 9.41% Age 65 to 74 1,013 8.07% Age 75 to 84 490 3.90% Age 85 and over 133 1.06% 2022 Est. Median Age, Female 37.65 2022 Est. Average Age, Female 38.10
NE
Sitewise Online
Demographic Snapshot (Part 1) Pop-Facts: Demographic Snapshot (Part 1) 6864 NE Fir St, Hillsboro, OR 97124 0 - 1 mi
6864
Fir St, Hillsboro, OR 97124
Pop-Facts:
2022 Est. Pop Age 15+ by Marital Status 20,153 Total, Never Married 6,450 32.01% Males, Never Married 3,494 17.34% Females, Never Married 2,956 14.67% Married, Spouse present 10,137 50.30% Married, Spouse absent 804 3.99% Widowed 743 3.69% Males, Widowed 111 0.55% Females, Widowed 632 3.14% Divorced 2,018 10.02% Males, Divorced 836 4.15% Females, Divorced 1,182 5.87% 2022 Est. Pop Age 25+ by Edu. Attainment 17,640 Less than 9th grade 290 1.64% Some High School, no diploma 372 2.11% High School Graduate (or GED) 2,320 13.15% Some College, no degree 3,030 17.18% Associate Degree 1,293 7.33% Bachelor's Degree 4,938 27.99% Master's Degree 3,312 18.77% Professional School Degree 420 2.38% Doctorate Degree 1,665 9.44% 2022 Est. Pop. Age 25+ by Edu. Attain., Hisp./Lat. 1,632 No High School Diploma 314 19.23% High School Graduate 393 24.10% Some College or Associate's Degree 526 32.25% Bachelor's Degree or Higher 398 24.42% Copyright © Claritas, LLC 2022. All rights reserved. 6864 NE Fir St, Hillsboro, OR 97124 Sitewise Online Pop-Facts: Demographic Snapshot (Part 1) Pop-Facts: Demographic Snapshot (Part 1) 6864 NE Fir St, Hillsboro, OR 97124 0 - 1 mi
6864 NE Fir St, Hillsboro, OR 97124 Sitewise Online Pop-Facts: Demographic Snapshot (Part 2) Pop-Facts: Demographic Snapshot (Part 2) 6864 NE Fir St, Hillsboro, OR 97124 0 - 1 mi Households 2027 Projection 11,081 2022 Estimate 10,425 2010 Census 7,391 2000 Census 4,091 Growth 2022-2027 6.29% Growth 2010-2022 41.05% Growth 2000-2010 80.68% 2022 Est. Households by Household Type 10,425 Family Households 6,324 60.66% Nonfamily Households 4,101 39.34% 2022 Est. Group Quarters Population 9 2022 HHs by Ethnicity: Hispanic/Latino 918 8.80% 2022 Est. Households by HH Income 10,425 Income < $15,000 438 4.20% Income $15,000 to $24,999 280 2.69% Income $25,000 to $34,999 327 3.13% Income $35,000 to $49,999 482 4.63% Income $50,000 to $74,999 1,235 11.85% Income $75,000 to $99,999 1,548 14.85% Income $100,000 to $124,999 1,375 13.19% Income $125,000 to $149,999 1,153 11.06% Income $150,000 to $199,999 1,532 14.69% Income $200,000 to $249,999 789 7.57% Income $250,000 to $499,999 878 8.42% Income $500,000+ 388 3.73% 2022 Est. Average Household Income $ 146,941 2022 Est. Median Household Income $ 116,399 2022 Median HH Income by Single-Class. Race or Ethn. White Alone $ 113,277 Black or African American Alone $ 94,615 American Indian and Alaska Native Alone $ 94,740 Asian Alone $ 155,489 Native Hawaiian and Other Pacific Islander Alone $ 115,501 Some Other Race Alone $ 44,319 Two or More Races $ 108,978 Hispanic or Latino $ 107,234
Not Hispanic or Latino $ 117,312
6864 NE Fir St, Hillsboro, OR 97124 Sitewise Online
Pop-Facts: Demographic Snapshot (Part 2)
1 mi
Pop-Facts: Demographic Snapshot (Part 2)
6864
NE Fir St, Hillsboro, OR 97124 0
-
2022 Est. Family HH Type by Presence of Own Children 6,324 Married-Couple Family, own children 2,293 36.26% Married-Couple Family, no own children 2,700 42.69% Male Householder, own children 191 3.02% Male Householder, no own children 168 2.66% Female Householder, own children 576 9.12% Female Householder, no own children 395 6.25% 2022 Est. Households by Household Size 10,425 1-person 3,105 29.79% 2-person 3,561 34.16% 3-person 1,692 16.23% 4-person 1,235 11.85% 5-person 527 5.06% 6-person 183 1.75% 7-or-more-person 122 1.17% 2022 Est. Average Household Size 2.39 2022 Est. Households by Presence of People Under 18 10,425 Households with 1 or more People under Age 18 3,205 30.75% Households with No People under Age 18 7,220 69.25% Households with 1 or more People under Age 18 3,205 Married-Couple Family 2,341 73.05% Other Family, Male Householder 205 6.41% Other Family, Female Householder 624 19.48% Nonfamily, Male Householder 20 0.63% Nonfamily, Female Householder 14 0.44% Households with No People under Age 18 7,220 Married-Couple Family 2,651 36.71% Other Family, Male Householder 155 2.15% Other Family, Female Householder 349 4.84% Nonfamily, Male Householder 1,989 27.56% Nonfamily, Female Householder 2,075 28.74% 6864
Pop-Facts: Demographic
Pop-Facts: Demographic Snapshot (Part 2) 6864 NE Fir St, Hillsboro, OR 97124 0 - 1 mi
NE Fir St, Hillsboro, OR 97124 Sitewise Online
Snapshot (Part 2)
2022 Est. Households by Number of Vehicles 10,425 No Vehicles 596 5.72% 1 Vehicle 4,761 45.67% 2 Vehicles 3,630 34.82% 3 Vehicles 961 9.21% 4 Vehicles 320 3.07% 5 or more Vehicles 157 1.51% 2022 Est. Average Number of Vehicles 1.65 Family Households 2027 Projection 6,721 2022 Estimate 6,324 2010 Census 4,656 2000 Census 2,734 Growth 2022-2027 6.28% Growth 2010-2022 35.84% Growth 2000-2010 70.31% 2022 Est. Families by Poverty Status 6,324 2022 Families at or Above Poverty 6,126 96.87% 2022 Families at or Above Poverty with Children 2,609 41.25% 2022 Families Below Poverty 198 3.13% 2022 Families Below Poverty with Children 115 1.82% 2022 Est. Pop Age 16+ by Employment Status 19,870 In Armed Forces 0 0.00% Civilian - Employed 14,471 72.83% Civilian - Unemployed 528 2.66% Not in Labor Force 4,871 24.51% 2022 Est. Civ. Employed Pop 16+ by Class of Worker 14,269 For-Profit Private Workers 11,273 79.01% Non-Profit Private Workers 1,134 7.95% Local Government Workers 831 5.82% State Government Workers 359 2.52% Federal Government Workers 133 0.93% Self-Employed Workers 534 3.74% Unpaid Family Workers 4 0.03% 6864 NE Fir St, Hillsboro, OR 97124 Sitewise Online Pop-Facts: Demographic Snapshot (Part 2) Pop-Facts: Demographic Snapshot (Part 2) 6864 NE Fir St, Hillsboro, OR 97124 0 - 1 mi
6864 NE Fir St, Hillsboro, OR 97124 Sitewise Online Pop-Facts: Demographic Snapshot (Part 2)
2022 Est. Civ. Employed Pop 16+ by Occupation 14,269 Architect/Engineer 2,421 16.97% Arts/Entertainment/Sports 354 2.48% Building Grounds Maintenance 144 1.01% Business/Financial Operations 1,015 7.11% Community/Social Services 362 2.54% Computer/Mathematical 1,171 8.21% Construction/Extraction 211 1.48% Education/Training/Library 534 3.74% Farming/Fishing/Forestry 71 0.50% Food Prep/Serving 499 3.50% Healthcare Practitioner/Technician 1,019 7.14% Healthcare Support 252 1.76% Maintenance Repair 98 0.69% Legal 182 1.27% Life/Physical/Social Science 250 1.75% Management 1,824 12.78% Office/Admin. Support 1,123 7.87% Production 729 5.11% Protective Service 124 0.87% Sales/Related 1,113 7.80% Personal Care/Service 230 1.61% Transportation/Moving 543 3.81% 2022 Est. Pop 16+ by Occupation Classification 14,269 Blue Collar 1,581 11.08% White Collar 11,367 79.67% Service & Farm 1,320 9.25% 2022 Est. Workers Age 16+ by Transp. To Work 14,086 Drove Alone 10,084 71.59% Car Pooled 1,390 9.87% Public Transportation 1,037 7.36% Walked 424 3.01% Bicycle 251 1.78% Other Means 161 1.14% Worked at Home 740 5.25% 2022 Est. Workers Age 16+ by Travel Time to Work* Less than 15 minutes 5,705 15 to 29 Minutes 4,357 30 to 44 Minutes 1,646 45 to 59 Minutes 931 60 or more Minutes 700
Pop-Facts: Demographic Snapshot (Part 2) 6864 NE Fir St, Hillsboro, OR 97124 0 - 1 mi
2022 Est. Avg. Travel Time to Work in Minutes* 23.05 2022 Est. Occupied Housing Units by Tenure 10,425 Owner-Occupied 5,745 55.11% Renter-Occupied 4,680 44.89% 2022 Occupied Housing Units: Avg. Length of Residence Owner-Occupied 9 Renter-Occupied 5 6864 NE Fir St, Hillsboro, OR 97124 Sitewise Online Pop-Facts: Demographic Snapshot (Part 2) Pop-Facts: Demographic Snapshot (Part 2) 6864 NE Fir St, Hillsboro, OR 97124 0 - 1 mi
2022 Est. Owner Occupied Housing Units by Value 5,745 Value Less than $20,000 21 0.36% Value $20,000 to $39,999 10 0.17% Value $40,000 to $59,999 25 0.44% Value $60,000 to $79,999 52 0.91% Value $80,000 to $99,999 30 0.52% Value $100,000 to $149,999 22 0.38% Value $150,000 to $199,999 39 0.68% Value $200,000 to $299,999 263 4.57% Value $300,000 to $399,999 1,089 18.95% Value $400,000 to $499,999 1,681 29.27% Value $500,000 to $749,999 1,896 33.00% Value $750,000 to $999,999 553 9.63% Value $1,000,000 to $1,499,999 33 0.58% Value $1,500,000 to $1,999,999 1 0.01% Value $2,000,000 or more 29 0.51% 2022 Est. Median All Owner-Occupied Housing Unit Value $ 478,584 2022 Est. Housing Units by Units in Structure 10,958 1 Unit Attached 1,861 16.98% 1 Unit Detached 4,331 39.52% 2 Units 19 0.17% 3 or 4 Units 248 2.26% 5 to 19 Units 2,059 18.79% 20 to 49 Units 614 5.60% 50 or More Units 1,604 14.63% Mobile Home or Trailer 223 2.04% Boat, RV, Van, etc. 0 0.00% Dominant structure type 1 Unit Detached 2022 Est. Housing Units by Year Structure Built 10,958 Housing Units Built 2014 or Later 2,480 22.63% Housing Units Built 2010 to 2013 771 7.03% Housing Units Built 2000 to 2009 3,896 35.55% Housing Units Built 1990 to 1999 2,987 27.26% Housing Units Built 1980 to 1989 398 3.64% Housing Units Built 1970 to 1979 124 1.13% Housing Units Built 1960 to 1969 148 1.35% Housing Units Built 1950 to 1959 40 0.36% Housing Units Built 1940 to 1949 30 0.27% Housing Units Built 1939 or Earlier 86 0.78% 2022 Est. Median Year Structure Built** 2004 Dominant Year Structure Built 2000 to 2009 6864 NE Fir
Sitewise
Pop-Facts: Demographic Snapshot (Part 2) Pop-Facts: Demographic Snapshot (Part 2) 6864 NE Fir St, Hillsboro, OR 97124 0 - 1 mi
St, Hillsboro, OR 97124
Online
6864 NE Fir St, Hillsboro, OR 97124
Sitewise Online
Pop-Facts: Demographic Snapshot (Part 2)
Pop-Facts: Demographic Snapshot (Part 2) 6864 NE Fir St, Hillsboro, OR 97124 0 - 1 mi
Copyright © Claritas, LLC 2022. All rights reserved.
* This row intentionally left blank. No Total Category.
**1939 will appear when at least half of the Housing Units in this reports area were built in 1939 or earlier.
6864 NE Fir St, Hillsboro, OR 97124 Sitewise Online Pop-Facts: Census Demographic Overview (Part 1) Pop-Facts: Census Demographic Overview (Part 1) 6864 NE Fir St, Hillsboro, OR 97124 0 - 1 mi Population 2027 Projection 26,569 2022 Estimate 24,932 2010 Census 18,108 2000 Census 10,411 Growth 2022-2027 6.56% Growth 2010-2022 37.69% Growth 2000-2010 73.93% 2010 Population by Single-Classification Race 18,108 White Alone 13,027 71.94% Black or African American Alone 499 2.75% American Indian and Alaska Native Alone 110 0.61% Asian Alone 2,872 15.86% Native Hawaiian and Other Pacific Islander Alone 70 0.38% Some Other Race Alone 688 3.80% Two or More Races 843 4.66% 2010 Population By Ethnicity 18,108 Not Hispanic or Latino 16,053 88.65% Hispanic or Latino 2,054 11.35% 2010 Hispanic or Latino by Single-Classification Race 2,054 White Alone 1,184 57.64% Black or African American Alone 22 1.09% American Indian and Alaska Native Alone 32 1.57% Asian Alone 18 0.87% Native Hawaiian and Other Pacific Islander Alone 1 0.07% Some Other Race Alone 643 31.30% Two or More Races 153 7.45% 2010 Population by Sex 18,108 Male 8,886 49.07% Female 9,222 50.93% Male/Female Ratio 0.96
6864 NE Fir St, Hillsboro, OR 97124 Sitewise Online
Pop-Facts: Census Demographic Overview (Part 1)
2010 Population by Age 18,108 Age 0 to 4 1,565 8.64% Age 5 to 9 1,189 6.57% Age 10 to 14 1,048 5.78% Age 15 to 17 552 3.05% Age 18 to 20 534 2.95% Age 21 to 24 1,039 5.74% Age 25 to 34 4,080 22.53% Age 35 to 44 3,207 17.71% Age 45 to 54 2,033 11.23% Age 55 to 64 1,616 8.92% Age 65 to 74 787 4.35% Age 75 to 84 353 1.95% Age 85 and over 103 0.57% Age 16 and over 14,115 77.95% Age 18 and over 13,754 75.96% Age 21 and over 13,220 73.01% Age 65 and over 1,244 6.87% 2010 Median Age 32.66
Pop-Facts: Census Demographic Overview (Part 1) 6864 NE Fir St, Hillsboro, OR 97124 0 - 1 mi
2010 Male Population by Age 8,886 Age 0 to 4 817 9.19% Age 5 to 9 618 6.95% Age 10 to 14 548 6.17% Age 15 to 17 275 3.10% Age 18 to 20 251 2.82% Age 21 to 24 460 5.17% Age 25 to 34 2,021 22.75% Age 35 to 44 1,677 18.87% Age 45 to 54 977 11.00% Age 55 to 64 711 8.01% Age 65 to 74 349 3.93% Age 75 to 84 144 1.62% Age 85 and over 37 0.42% 2010 Median Age, Male 32.29 2010 Female Population by Age 9,222 Age 0 to 4 748 8.12% Age 5 to 9 571 6.20% Age 10 to 14 499 5.41% Age 15 to 17 277 3.00% Age 18 to 20 283 3.07% Age 21 to 24 579 6.28% Age 25 to 34 2,059 22.33% Age 35 to 44 1,530 16.60% Age 45 to 54 1,056 11.45% Age 55 to 64 905 9.81% Age 65 to 74 439 4.76% Age 75 to 84 209 2.27% Age 85 and over 66 0.72% 2010 Median Age, Female 33.03 Copyright © Claritas,
6864 NE Fir St, Hillsboro, OR 97124 Sitewise Online Pop-Facts: Census Demographic Overview (Part 1) Pop-Facts: Census Demographic Overview (Part 1) 6864 NE Fir St, Hillsboro, OR 97124 0 - 1 mi
LLC 2022. All rights reserved.
6864 NE Fir St, Hillsboro, OR 97124 Sitewise Online Pop-Facts: Census Demographic Overview (Part 2) Pop-Facts: Census Demographic Overview (Part 2) 6864 NE Fir St, Hillsboro, OR 97124 0 - 1 mi Households 2027 Projection 11,081 2022 Estimate 10,425 2010 Census 7,391 2000 Census 4,091 Growth 2022-2027 6.29% Growth 2010-2022 41.05% Growth 2000-2010 80.68% 2010 Households by Household Type 7,391 Family Households 4,656 62.99% Non-family Households 2,735 37.01% 2010 Group Quarters Population 8 2010 Hispanic or Latino Households 588 7.96% 2010 Households by Household Size 7,391 1-person 2,035 27.53% 2-person 2,511 33.97% 3-person 1,261 17.06% 4-person 999 13.52% 5-person 378 5.12% 6-person 121 1.63% 7-or-more-person 86 1.17%
2010 Households by Type and Presence of Children 7,391 Married-Couple Family, own children 1,775 24.02% Male Householder, own children 146 1.98% Female Householder, own children 432 5.85% Married-Couple Family, no own children 1,890 25.57% Male Householder, no own children 125 1.69% Female Householder, no own children 287 3.88% Non-family Households 2,735 37.01% 2010 Households by Presence of People Under Age 18 7,391 HH with 1 or More People Under Age 18: 2,466 33.37% Households with No People Under Age 18: 4,925 66.63% HH with 1 or More People Under Age 18: 2,466 Married-Couple Family 1,813 73.51% Other Family, Male Householder 158 6.40% Other Family, Female Householder 469 19.02% Nonfamily, Male Householder 16 0.64% Nonfamily, Female Householder 11 0.43% Households with No People Under Age 18: 4,925 Married-Couple Family 1,852 37.61% Other Family, Male Householder 113 2.30% Other Family, Female Householder 250 5.08% Nonfamily, Male Householder 1,332 27.05% Nonfamily, Female Householder 1,377 27.96% 2010 Occupied Housing Units by Tenure 7,391 Owner-Occupied 4,250 57.50% Renter-Occupied 3,141 42.50% Copyright © Claritas, LLC 2022. All rights reserved. 6864 NE Fir St, Hillsboro, OR 97124 Sitewise Online Pop-Facts: Census Demographic Overview (Part 2) Pop-Facts: Census Demographic Overview (Part 2) 6864 NE Fir St, Hillsboro, OR 97124 0 - 1 mi
6864 NE Fir St, Hillsboro, OR 97124 Sitewise Online Retail Market Power Opportunity Gap Report By Retail Store Types Retail Market Power Opportunity Gap Report By Retail Store Types 6864 NE Fir St, Hillsboro, OR 97124 0 - 1 mi 2022 Demand 2022 Supply Opportunity Gap/Surplus Total retail trade including food and drink (NAICS 44, 45 and 722) $ 457,725,964 $ 234,167,248 $ 223,558,716 Total retail trade (NAICS 44 and 45) $ 402,924,079 $ 212,141,831 $ 190,782,246 Motor vehicle and parts dealers (NAICS 441) $ 92,078,773 $ 26,593,793 $ 65,484,979 Automobile dealers (NAICS 4411) $ 77,895,249 $ 24,059,730 $ 53,835,520 New car dealers (NAICS 44111) $ 69,187,849 $ 19,328,094 $ 49,859,755 Used car dealers (NAICS 44112) $ 8,707,400 $ 4,731,636 $ 3,975,764 Other motor vehicle dealers (NAICS 4412) $ 8,367,386 $ 951,266 $ 7,416,119 Recreational vehicle dealers (NAICS 44121) $ 3,280,568 $ 633,746 $ 2,646,822 Motorcycle, boat, and other motor vehicle dealers (NAICS 44122) $ 5,086,817 $ 317,521 $ 4,769,297 Boat dealers (NAICS 441222) $ 1,961,396 $ 0 $ 1,961,396 Motorcycle, ATV, and all other motor vehicle dealers (NAICS 441228) $ 3,125,422 $ 317,521 $ 2,807,901 Automotive parts, accessories, and tire stores (NAICS 4413) $ 5,816,139 $ 1,582,797 $ 4,233,342 Automotive parts and accessories stores (NAICS 44131) $ 3,679,686 $ 648,259 $ 3,031,427 Tire dealers (NAICS 44132) $ 2,136,453 $ 934,538 $ 1,201,915 Furniture and home furnishings stores (NAICS 442) $ 9,443,400 $ 8,163,665 $ 1,279,735 Furniture stores (NAICS 4421) $ 5,179,924 $ 710,204 $ 4,469,721 Home furnishings stores (NAICS 4422) $ 4,263,475 $ 7,453,461 - $ 3,189,986 Floor covering stores (NAICS 44221) $ 2,105,822 $ 2,463,309 - $ 357,487 Other home furnishings stores (NAICS 44229) $ 2,157,654 $ 4,990,152 - $ 2,832,498 Window treatment stores (NAICS 442291) $ 102,053 $ 291,104 - $ 189,051 All other home furnishings stores (NAICS 442299) $ 2,055,601 $ 4,699,048 - $ 2,643,447 Electronics and appliance stores (NAICS 443) $ 5,382,462 $ 5,595,633 - $ 213,171 Household appliance stores (NAICS 443141) $ 1,245,049 $ 88,643 $ 1,156,406 Electronics stores (NAICS 443142) $ 4,137,414 $ 5,506,990 - $ 1,369,576 Building material and garden equipment and supplies dealers (NAICS 444) $ 29,362,547 $ 12,411,797 $ 16,950,750 Building material and supplies dealers (NAICS 4441) $ 25,253,457 $ 10,093,782 $ 15,159,675 Home centers (NAICS 44411) $ 14,075,657 $ 4,997,182 $ 9,078,475 Paint and wallpaper stores (NAICS 44412) $ 863,172 $ 145,401 $ 717,772 Hardware stores (NAICS 44413) $ 2,292,219 $ 462,666 $ 1,829,553 Other building material dealers (NAICS 44419) $ 8,022,408 $ 4,488,533 $ 3,533,875 Lawn and garden equipment and supplies stores (NAICS 4442) $ 4,109,091 $ 2,318,015 $ 1,791,076 Outdoor power equipment stores (NAICS 44421) $ 838,967 $ 0 $ 838,967 Nursery, garden center, and farm supply stores (NAICS 44422) $ 3,270,123 $ 2,318,015 $ 952,108 Food and beverage stores (NAICS 445) $ 59,164,104 $ 47,330,870 $ 11,833,235 Grocery stores (NAICS 4451) $ 52,112,364 $ 45,846,791 $ 6,265,573 Supermarkets and other grocery (except convenience) stores (NAICS 44511) $ 50,004,663 $ 44,993,745 $ 5,010,918 Convenience stores (NAICS 44512) $ 2,107,701 $ 853,047 $ 1,254,655 Specialty food stores (NAICS 4452) $ 1,516,486 $ 0 $ 1,516,486
Meat markets (NAICS 44521) $ 458,098 $ 0 $ 458,098 Fish and seafood markets (NAICS 44522) $ 180,532 $ 0 $ 180,532 Fruit and vegetable markets (NAICS 44523) $ 314,367 $ 0 $ 314,367 Other specialty food stores (NAICS 44529) $ 563,488 $ 0 $ 563,488 Baked goods and confectionery and nut stores (NAICS 445291 + 445292) $ 298,630 $ 0 $ 298,630 All other specialty food stores (NAICS 445299) $ 264,858 $ 0 $ 264,858 Beer, wine, and liquor stores (NAICS 4453) $ 5,535,255 $ 1,484,078 $ 4,051,176 Health and personal care stores (NAICS 446) $ 22,200,463 $ 7,155,031 $ 15,045,431 Pharmacies and drug stores (NAICS 44611) $ 19,274,963 $ 6,925,933 $ 12,349,029 Cosmetics, beauty supplies, and perfume stores (NAICS 44612) $ 1,288,171 $ 0 $ 1,288,171 Optical goods stores (NAICS 44613) $ 609,641 $ 84,371 $ 525,270 Other health and personal care stores (NAICS 44619) $ 1,027,687 $ 144,726 $ 882,961 Food (health) supplement stores (NAICS 446191) $ 366,889 $ 0 $ 366,889 All other health and personal care stores (NAICS 446199) $ 660,798 $ 144,726 $ 516,072 Gasoline stations (NAICS 447) $ 30,057,324 $ 3,418,730 $ 26,638,594 Clothing and clothing accessories stores (NAICS 448) $ 16,986,193 $ 5,004,326 $ 11,981,867 Clothing stores (NAICS 4481) $ 11,110,816 $ 1,236,109 $ 9,874,707 Men's clothing stores (NAICS 44811) $ 526,150 $ 73,368 $ 452,783 Women's clothing stores (NAICS 44812) $ 1,939,401 $ 146,558 $ 1,792,843 Children's and infants' clothing stores (NAICS 44813) $ 380,118 $ 118,092 $ 262,026 Family clothing stores (NAICS 44814) $ 6,691,881 $ 459,789 $ 6,232,093 Clothing accessories stores (NAICS 44815) $ 554,537 $ 136,583 $ 417,954 Other clothing stores (NAICS 44819) $ 1,018,729 $ 301,719 $ 717,010 Shoe stores (NAICS 4482) $ 2,357,981 $ 498,759 $ 1,859,222 Jewelry, luggage, and leather goods stores (NAICS 4483) $ 3,517,395 $ 3,269,458 $ 247,937 Jewelry stores (NAICS 44831) $ 2,307,090 $ 237,279 $ 2,069,811 Luggage and leather goods stores (NAICS 44832) $ 1,210,305 $ 3,032,179 - $ 1,821,874 Sporting goods, hobby, musical instrument, and book stores (NAICS 451) $ 6,804,911 $ 5,465,398 $ 1,339,513 Sporting goods, hobby, and musical instrument stores (NAICS 4511) $ 6,145,077 $ 5,204,619 $ 940,457 Sporting goods stores (NAICS 45111) $ 4,582,912 $ 3,025,123 $ 1,557,790 Hobby, toy, and game stores (NAICS 45112) $ 1,184,737 $ 1,609,335 - $ 424,598 Sewing, needlework, and piece goods stores (NAICS 45113) $ 173,381 $ 427,143 - $ 253,762 Musical instrument and supplies stores (NAICS 45114) $ 204,047 $ 143,019 $ 61,028 Book stores and news dealers (NAICS 4512) $ 659,834 $ 260,778 $ 399,056 Book stores (NAICS 451211) $ 616,196 $ 260,778 $ 355,418 News dealers and newsstands (NAICS 451212) $ 43,638 $ 0 $ 43,638 General merchandise stores (NAICS 452) $ 51,144,064 $ 47,459,896 $ 3,684,169 Department stores (NAICS 4522) $ 6,619,024 $ 638,060 $ 5,980,964 Other general merchandise stores (NAICS 4523) $ 44,525,041 $ 46,821,835 - $ 2,296,795 Warehouse clubs and supercenters (NAICS 452311) $ 40,154,928 $ 46,445,643 - $ 6,290,715 All other general merchandise stores (NAICS 452319) $ 4,370,113 $ 376,193 $ 3,993,920 6864 NE Fir St, Hillsboro, OR 97124 Sitewise Online Retail Market Power Opportunity Gap Report By Retail Store Types Retail Market Power Opportunity Gap Report By Retail Store Types 6864 NE Fir St, Hillsboro, OR 97124 0 - 1 mi 2022 Demand 2022 Supply Opportunity Gap/Surplus
6864 NE Fir St, Hillsboro, OR 97124 Sitewise
* GAFO (General merchandise, Apparel, Furniture and Other) represents sales at stores that sell merchandise normally sold in department stores. This category is not included in Total Retail Sales Including Eating and Drinking Places.
Miscellaneous store retailers (NAICS 453) $ 9,110,217 $ 6,518,542 $ 2,591,675 Florists (NAICS 4531) $ 416,086 $ 0 $ 416,086 Office supplies, stationery, and gift stores (NAICS 4532) $ 2,100,600 $ 1,261,921 $ 838,679 Office supplies and stationery stores (NAICS 45321) $ 889,759 $ 164,454 $ 725,305 Gift, novelty, and souvenir stores (NAICS 45322) $ 1,210,841 $ 1,097,467 $ 113,374 Used merchandise stores (NAICS 4533) $ 1,358,308 $ 822,557 $ 535,751 Other miscellaneous store retailers (NAICS 4539) $ 5,235,222 $ 4,434,064 $ 801,158 Pet and pet supplies stores (NAICS 45391) $ 1,512,904 $ 3,030,267 - $ 1,517,363 Art dealers (NAICS 45392) $ 931,379 $ 19,609 $ 911,770 Manufactured (mobile) home dealers (NAICS 45393) $ 556,828 $ 1,527 $ 555,301 All other miscellaneous store retailers (NAICS 45399) $ 2,234,112 $ 1,382,661 $ 851,450 Tobacco stores (NAICS 453991) $ 505,191 $ 420,137 $ 85,054 All other miscellaneous store retailers (except tobacco stores) (NAICS 453998) $ 1,728,920 $ 962,524 $ 766,396 Non-store retailers (NAICS 454) $ 71,189,621 $ 37,024,153 $ 34,165,468 Electronic shopping and mail-order houses (NAICS 4541) $ 67,571,531 $ 36,966,213 $ 30,605,318 Vending machine operators (NAICS 4542) $ 494,660 $ 0 $ 494,660 Direct selling establishments (NAICS 4543) $ 3,123,431 $ 57,940 $ 3,065,491 Fuel dealers (NAICS 45431) $ 1,461,426 $ 5,869 $ 1,455,557 Other direct selling establishments (NAICS 45439) $ 1,662,005 $ 52,071 $ 1,609,934 Food services and drinking places (NAICS 722) $ 54,801,885 $ 22,025,417 $ 32,776,468 Special food services (NAICS 7223) $ 4,352,258 $ 702,454 $ 3,649,804 Food service contractors (NAICS 72231) $ 3,450,995 $ 702,454 $ 2,748,540 Caterers (NAICS 72232) $ 821,508 $ 0 $ 821,508 Mobile food services (NAICS 72233) $ 79,756 $ 0 $ 79,756 Drinking places (alcoholic beverages) (NAICS 7224) $ 2,007,411 $ 251,378 $ 1,756,032 Restaurants and other eating places (NAICS 7225) $ 48,442,217 $ 21,071,585 $ 27,370,632 Full-service restaurants (NAICS 722511) $ 24,619,727 $ 8,433,396 $ 16,186,330 Limited-service restaurants (NAICS 722513) $ 20,224,388 $ 9,559,898 $ 10,664,490 Cafeterias, grill buffets, and buffets (NAICS 722514) $ 515,657 $ 319,920 $ 195,736 Snack and nonalcoholic beverage bars (NAICS 722515) $ 3,082,446 $ 2,758,370 $ 324,075 GAFO* $ 89,763,131 $ 71,690,178 $ 18,072,953 General Merchandise Stores-452 $ 51,144,064 $ 47,459,896 $ 3,684,169 Clothing & Clothing Accessories Stores-448 $ 16,986,193 $ 5,004,326 $ 11,981,867 Furniture & Home Furnishings Stores-442 $ 9,443,400 $ 8,163,665 $ 1,279,735 Electronics & Appliance Stores-443 $ 5,382,462 $ 5,595,633 - $ 213,171 Sporting Goods, Hobby, Book, Music Stores-451 $ 6,804,911 $ 5,465,398 $ 1,339,513 Office Supplies, Stationery, Gift Stores-4532 $ 2,100,600 $ 1,261,921 $ 838,679
Online Retail Market Power Opportunity Gap Report By Retail Store Types Retail Market Power Opportunity Gap Report By Retail Store Types 6864 NE Fir St, Hillsboro, OR 97124 0 - 1 mi 2022 Demand 2022 Supply Opportunity Gap/Surplus
6864 NE Fir St, Hillsboro, OR 97124
Sitewise Online
Retail Market Power Opportunity Gap Report By Retail Store Types
Retail Market Power Opportunity Gap Report By
Retail Store Types
Retail Market Power data is derived from two major sources of information. The demand data is derived from the Consumer Expenditure Survey (CE Survey or CEX), which is fielded by the U.S. Bureau of Labor Statistics (BLS). The supply data is derived from the Census of Retail Trade (CRT), which is made available by the U.S. Census. Additional data sources are incorporated to create both supply and demand estimates. The difference between demand and supply represents the opportunity gap or surplus available for each merchandise line in the specified reporting geography. When this difference is positive (demand is greater than the supply), there is an opportunity gap for that merchandise line; when the difference is negative (supply is greater than demand), there is a surplus.
Copyright © 2022 Environics Analytics. All rights reserved.
6864 NE Fir St, Hillsboro, OR 97124 0 - 1 mi 2022 Demand 2022 Supply Opportunity Gap/Surplus