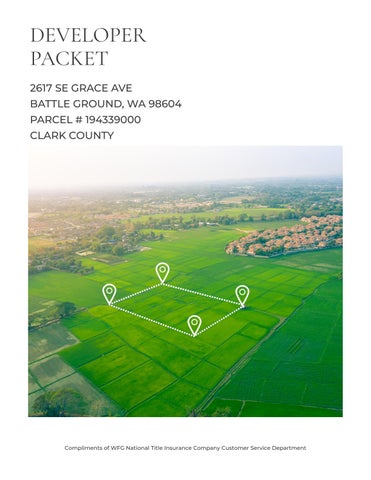
TABLE OF
Property Details
Custom Maps
Zoning Information
Community Information
-Demographics
-Traffic Counts
CONTENT S The information contained is provided by WFG’s Customer Service Department to our customers, and while deemed reliable, is not guaranteed.
The information contained is provided by WFG’s Customer Service Department to our customers, and while deemed reliable, is not guaranteed.
PROPERTY Property Information
Assessors Tax Map
Vesting Deed
Exhibit A
County GIS Details DETAILS
ClarkCountyPropertyProfileInformation
Parcel#:194339000
RefParcel#:
Owner:Cosner,JanetA
CoOwner:
Site:2617SEGraceAve
BattleGroundWA98604-8635
Mail:2617SEGraceAve
BattleGroundWA98604-8635
Zoning:R5Residential5Units/Acre(R5)
SchoolDist:119BattleGround
Census:2002040408
LandUse:11Household,SingleFamilyUnits
Legal:#26SEC11T3NR2EWM5.31A
ASSESSMENT&TAXINFORMATION
MarketTotal:$574,074.00
MarketLand:$574,074.00
MarketImpr:
AssessedTotal:$574,074.00
Exemption:
Taxes:$4,536.84
LevyCode:119090
LevyRate:78202
SALE&LOANINFORMATION
SaleDate:
SaleAmount:
Document#:
DeedType:Deed
LoanAmount:
Lender:
LoanType:
InterestType:
TitleCo:
PROPERTYCHARACTERISTICS
ParcelType:PRIMELAND
YearBuilt:1960
Bedrooms:4
Bathrooms:1
BuildingTotal: 1stFloor:2,319SqFt
2ndFloor:
AC:
BsmtFin/Unfin:/ LotSize:531Acres(231,304SqFt)
LotWidth/Depth:462/462
Garage:
HeatSource:FA
Fireplace: ImprType:01Ranch
Plat/Subdiv:
Map:478-C1
Waterfront:
Watershed:SalmonCreek-FrontalColumbiaRiver
Recreation: Latitude:45761679
Longitude:-12252416
SentryDynamics,Inc anditscustomersmakenorepresentations,warrantiesorconditions,expressorimplied,astotheaccuracyor completenessofinformationcontainedinthisreport
IMPROVEMENT1
BldgDesc:CONVENTIONAL
Bedrooms:4
Baths,Full:1
Stories:1
ParcelID:194339000
Description:RANCH
1stFloor:2,319SqFt Condition:AVERAGE
2ndFloor: Use:RESIDENTIAL
Baths,3/4: YearBuilt:1960(1960)
Quality:
Baths,1/2: BsmtFin: RoofingMatl:CMP
Baths,1/4: BsmtUnfin:
Deck: BldgFinTotal:2,319SqFt
Garage:
Carport:
ExtWall:SS AC: #Fireplaces:1
HeatType:BB
%Complete:100.00%
IMPROVEMENT2
BldgDesc:MOBILEHOME
Bedrooms:2
Stories:1
ParcelID:194339000
Description:RANCH
1stFloor:924SqFt Condition:AVERAGE
Baths,Full:1 2ndFloor: Use:MOBILEHOME
Baths,3/4: YearBuilt:1978(1978)
Quality:
Baths,1/2: BsmtFin: RoofingMatl:AL
Baths,1/4: BsmtUnfin: Garage:
Deck: BldgFinTotal:924SqFt Carport:
ExtWall:AL AC: #Fireplaces:1
HeatType:FA %Complete:10000%
IMPROVEMENT3
BldgDesc:GENERALPURPOSE BUILDING
ParcelID:194339000
Stories: Description:
Bedrooms: 1stFloor: Condition:AVERAGE
Baths,Full: 2ndFloor: Use:OUTBUILDING
Baths,3/4: YearBuilt:1965(1965)
Quality:
Baths,1/2: BsmtFin: RoofingMatl:MT
Baths,1/4: BsmtUnfin: Garage:
Deck: BldgFinTotal: Carport:
ExtWall:MT AC: #Fireplaces:0
HeatType: %Complete:10000%
This map/plat is being furnished as an aid in locating the herein described land in relation to adjoining streets, natural boundaries and other land, and is not a survey of the land depicted Except to the extent a policy of title insurance is expressly modi ed by endorsement, if any, the company does not insure dimensions, distances, location of easements, acreage or other matters shown thereon
ParcelID:194339000
SentryDynamics,Inc anditscustomersmakenorepresentations, warrantiesorconditions,expressorimplied,astotheaccuracyor completenessofinformationcontainedinthisreport
AerialMap
Exhibit
The real property described above is commonly known as: [__________] [__________] __________ [__________] [__________] __________ Buyer Initials Date Seller Initials Date 2617 SE Grace Avenue Battle Ground, WA 98604
“A”
Property Owner COSNER JANET A
Property Type: Real Property Status: Active Site Address: 2617 SE GRACE AVE, BATTLE GROUND,
Addresses) Abbreviated Description: #26 SEC 11 T3N R2EWM 5.31A Tax Status: Regular Info for Senior/Disabled Property Tax Exemption Owner Mailing Address 2617 SE GRACE AVE BATTLE GROUND WA , 98604 US Property Site Address 2617 SE GRACE AVE, BATTLE GROUND, WA 98604 Google Maps Street View Administrative Data Info... Jurisdiction Battle Ground Land Use Planning Comprehensive Plan Designation UL Comprehensive Plan Overlay(s) none Urban Growth Area Battle Ground Zoning DesignationCodes Residential 5 units/acre (R5) Zoning Overlay(s) none Miscellaneous Census Tract 404.08 Drainage District n/a Neighborhood n/a Park District n/a Public Safety Burning Allowed No EMS Response Area AMR Fire District FD 3 Increased Wildfire Danger Area No Police Jurisdiction Battle Ground Police Dept Schools School District Name Battle Ground Elementary School Attendance Area Tukes Valley Middle School Attendance Area Tukes Valley High School Attendance Area Battle Ground Transportation Electoral Data Board of County Councilors District 5 Camas Council Ward n/a CPU Commissioner District 1 Election Precinct 575 Legislative District 18 Library District Fort Vancouver Regional Library Port District No Port District School District Board Director District Director District 2 Sewer Board District Battle Ground State Weed Board District 3 Land Data Approximate Area Info... 231,304 sq. ft. 5.31 acres Clark County Road Atlas Page 28 DOR Land Use Code Info... 11 Section-Township-Range NE 1/4,S11,T3N,R2E PDF Subdivision no data Survey 008140 014093 015099 022167 Sales History Date of Sale 01/01/1900 Document Type J Document Number SC # 85-2-02371-8 Excise Number 0 Sale Amount $0.00 Assessment Data Info... 2023 Uncertified Values Market Value Land Value $827,360.00 Building Value $0.00 Total Property $827,360.00 Taxable Value Info Total $827,360.00 2022 Values for 2023 Taxes Market Value as of January 1, 2022 Land Value $574,074.00 Building Value $0.00 Total Property $574,074.00 Taxable Value Info... Total $574,074.00 2021 Values for 2022 Taxes Market Value as of January 1, 2021 Land Value $423,931.00 Building Value $0.00 Total Property $423,931.00 Taxable Value Info... Total $363,931.00 General Assessor Neighborhood 77 Re-valuation Cycle 3
PROPERTY INFORMATION CENTER Account Summary Property Identification Number: 194339000 MapsOnline Fact Sheet
WA 98604 (Situs
Property assessment value is valid as of the date printed on the linked notice of value. The notice of value will not reflect any updates to property value that occurred after the notice mail date Please contact the Assessor's office if you have a question about your assessed value.
If you have questions concerning the data on this page, please contact the Clark County Assessor’s Office. Main Phone: (564) 397-2391, Email: assessor@clark.wa.gov
Public Transportation Benefit Area Yes Traffic Impact Fee (TIF) District Battle Ground Transportation Analysis Zone 444 Utilities CPU Lighting Utility District n/a Last Street Sweeping n/a Sewer District Battle Ground Waste Collection Provider Waste Connections Waste Collection Day Service Schedule Water District Clark Public Utilities Notice of Value 2023 2022 2021 2020 2019 2018 2017
C-TRAN
PROPERTY INFORMATION CENTER
Land & Building Details
Property Identification Number: 194339000 MapsOnline Fact Sheet
Property Type: Real
Property Status: Active
Site Address: 2617 SE GRACE AVE, BATTLE GROUND, WA 98604 (Situs Addresses)
Abbreviated Description: #26 SEC 11 T3N R2EWM 5.31A
Tax Status: Regular
Info for Senior/Disabled Property Tax Exemption
& Imagery Property Photo Photo Date: 05/24/2005
for
Building Sketch Building 1 Summary Information Building Style RANCH Number of Bedrooms 2 Number of Bedrooms Approved for Septic System 4 FULL BATH 1 HEAT TYPE FA Fireplace WD-STV 1.00 Details 1 MOBILE HOME 924 sq. ft. Effective Year Built 1978 Actual Year Built 1978 Building Type MOBILE HOME Construction Quality FAIR Condition AVERAGE Building 2 Summary Information Building Style RANCH Number of Bedrooms 4 Number of Bedrooms Approved for Septic System 4 FULL BATH 1 HEAT TYPE BB Fireplace FIRE1-SIN 1.00 Details 1 MAIN 2319 sq. ft. Effective Year Built 1960 Actual Year Built 1960 Building Type CONVENTIONAL Construction Quality FAIR Condition FAIR Building 3 Details 1 GENERAL PURPOSE BUILDING 1152 sq. ft. Effective Year Built 1965 Actual Year Built 1965 Building Type OUTBUILDING
Photos
Click photo
printable image
If you have questions concerning the data on this page, please contact the Clark County Assessor’s Office. Main Phone: (564) 397-2391, Email: assessor@clark.wa.gov
Construction Quality CLASS 2 OUTBUILDING Condition AVERAGE
PROPERTY INFORMATION CENTER
Environmental Constraints
Property Identification Number: 194339000 MapsOnline Fact Sheet
Property Type: Real
Property Status: Active
Site Address: 2617 SE GRACE AVE, BATTLE GROUND, WA 98604 (Situs Addresses)
Abbreviated Description: #26 SEC 11 T3N R2EWM 5.31A
Tax Status: Regular
Info for Senior/Disabled Property Tax Exemption
Cultural Resources
Archaeological Probability: ModerateHigh High
Archaeological Site Buffer: Yes
Historic Site: No Mapping Indicators
Forest Practice Moratorium Info...
none
Geological Hazards Info...
Geological Hazard:
Liquefaction: Very Low to Low
NEHRP Class: C
Slope Stability:
Habitat and Species Resources Info...
Habitat and Species Impacts: Yes
Habitat Area: Oak Woodland
Adjacent to Habitat Area: Oak Woodland
Wetlands and Soil Types
Critical Aquifer Recharge Area: Category 2 Recharge Areas
FEMA Map / FIRM Panel: Info...
53011C0244D
FEMA Flood Map Service Center
Flood Hazard Area: Info... Outside Flood Area
Shoreline
Designation: none
Soil Types / Class: Non-Hydric / DoB Non-Hydric / HlA Hydric / HtA
Water Resource Inventory Area: Name: SALMONWASHOUGAL Sub-Basin: Salmon
Watershed: Salmon Creek
Sub Watershed: Salmon Creek (r.m. 14.66)
Wetland Class: No Mapping Indicators
Wetland Inventory: Info... Potential Presence
Septic Document Details
Application Date July 7, 2006
As-Built: February 2, 1990
Last Inspected October 15, 2021
Permit: October 23, 1989
onlineRME Docs (external site) November 28, 2014 March 16, 2018 October 15, 2021
Water Well Details
none
If you have any questions concerning the data on this page, please contact the land use department in your jurisdiction. For properties not within a city limits, contact Clark County Community Development. Main Phone: (564) 397-2375, Email: commdev@clark.wa.gov
PROPERTY INFORMATION CENTER
If you have any questions concerning the data on this page, please contact Clark County Treasurer's Office. Main Phone: (564) 397-2252, Email: treasoff@clark.wa.gov
Property Owner COSNER JANET A
Payment Options
Other
Summary
Tax
Property
Site Address: 2617
Addresses) Abbreviated Description: #26 SEC 11 T3N R2EWM 5.31A Tax Status: Regular Info for Senior/Disabled Property Tax Exemption Owner Mailing Address 2617 SE GRACE AVE BATTLE GROUND WA, 98604 Property Location Address 2617 SE GRACE AVE, BATTLE GROUND, WA 98604 Google Maps Street View Bing Maps Birds Eye 2023 Tax Information Pay Online Payment service fees: Free E-Check, 2.39% Credit Card, $3.95 Debit Card Tax Code Area: 119090 Millage Rate:
Tax and Assessment Distribution Tax Statements Tax Bill Summary Taxable Value $574,074.00 Tax Amount $4,536.84 Tax Paid $4,536.84 1st Half Billed - Does not reflect payments Amount Billed $2,268.49 Payment Due Date Apr. 30, 2023 2nd Half Billed - Does not reflect payments Amount Billed $2,268.35 Payment Due Date Oct. 31, 2023 Tax Years Owing *Interest & Penalty calculates on delinquent taxes Tax Year Statement ID Amount Billed Calc Date* Interest Penalty Total Due Tax History Tax Year Statement ID Billed Paid Interest Paid Penalty Paid 2023 128818 $4,536.84 $4,536.84 $0.00 $0.00 2022 128922 $3,760.94 $3,760.94 $0.00 $0.00 2021 129058 $2,857.89 $2,857.89 $0.00 $0.00 2020 129201 $2,240.27 $2,240.27 $0.00 $0.00 2019 129369 $1,693.19 $1,693.19 $84.60 $50.74 2018 129494 $2,069.29 $2,069.29 $144.78 $62.04 2017 129589 $1,527.06 $1,527.06 $0.00 $0.00 2016 129673 $1,390.18 $1,390.18 $0.00 $0.00 2015 129997 $1,367.96 $1,367.96 $0.00 $0.00 2014 130121 $1,720.34 $1,720.34 $0.00 $0.00 2013 130222 $1,647.10 $1,647.10 $0.00 $0.00 2012 130350 $1,559.90 $1,559.90 $0.00 $0.00 2011 130449 $1,595.46 $1,595.46 $0.00 $0.00 2010 130537 $523.40 $523.40 $0.00 $0.00 2009 130719 $471.87 $471.87 $0.00 $0.00 2008 453416 $559.64 $559.64 $0.00 $0.00 2007 291049 $642.33 $642.33 $0.00 $0.00 2006 132668 $1,269.25 $1,269.25 $0.00 $0.00
Property Identification Number: 194339000 MapsOnline Fact Sheet Property Type: Real
Status: Active
SE GRACE AVE, BATTLE GROUND, WA 98604 (Situs
7.8201873759
AAAsepticServicesLLc
P.O. Box 1615
Battle Ground, WA 98604
Mail To: Janet A Cosner
2617 SE Grace Ave Battle Ground, WA 98604
(360) 687-8960
PROPERTY INFORMATION
Location: 2617 SE GRACE AV
BATTLE GROUND
Tax ID: 194339000 Lot:
Residential, Single Family Use:
GENERAL SYSTEM TYPE: Gravity system
ON ID: ON0009418
ON-SITE WASTEWATER TREATMENT SYSTEM INSPECTION REPORT
Inspected: 10/15/2021 - Inspection Type: ROUTINE - Correction Status: No corrections needed
Company: Certification - Level 2 AAA septic Services LLc
GENERAL
CONDITIONS
Fold Here Fold Here
Submitted 10/18/2021 by: Shelby Orth Work Performed By: Jay May
GENERAL INSPECTION NOTES No Deficiencies Noted The General Site and System Conditions were: Fully Inspected All Components accessible for maintenance, secure and in good condition: YES Surfacing effluent from any component (including mound seepage): NO Components appear to be watertight - no visual leaks: YES Improper encroachment (roads, buildings, etc.) onto component(s): NO Component settling problems observed: NO Abnormal ponding present for one or more of the disposal components: NO Subsurface components adequately covered YES Site maintenance required (e.g. Landscape maintenance) If yes, describe in comments: NO
COMMENTS &
SITE
SYSTEM
ONSITE SEWAGE SYSTEM INSPECTION DETAIL TANK: Septic Tank - 2 Compartment This component was: Fully Inspected Component appears to be functioning as intended: YES Effluent level within operational limits (if NO explain in comments): YES All required baffles in place (N/A = No baffles required): YES Effluent Filter Cleaned (N/A = Not Present): N/A Compartment 1 Scum accumulation (Inches, if other specify): 11 Compartment 1 Sludge accumulation (Inches, if other specify): 5 Compartment 2 Scum accumulation (Inches, if other specify): 0 Compartment 2 Sludge accumulation (Inches, if other specify): 5 Pumping needed: NO Approximate Gallons to be pumped (if needed) by Certified Pumper: Drainfield (disposal): Gravity This component was: Fully Inspected Component appears to be functioning as intended: YES Ponding present? If YES explain in comments: NO This report indicates certain characteristics of the onsite sewage system at the time of visit. In no way is this report a guarantee of operation or future performance. View inspection reports online at www.onlinerme.com Page 1 of 1 ReportID: 1010120
&
Chapter 17.106 RESIDENTIALDISTRICTS (R3, R5, R7, R10, R12, R16, R20)
17.106.010 Purpose.
17.106.020 Uses.
17.106.030 Dimensional requirements.
17.106.035 Density transfer provisions.
17.106.040 Single-family and duplex design standards.
17.106.050 Neighborhood retail.
17.106.060 Cottage housing standards.
17.106.070 Multifamily development standards.
17.106.080 Townhouse development standards.
17.106.090 Institutional and nonresidential development standards.
17.106.010 Purpose.
It is the city’s intent that residential neighborhoods be developed and preserved against intrusions by incongruous land uses.
These districts are intended to: recognize, maintain and protect established residential areas; establish densities where a full range of community services and facilities are present or will be present at the time of development; and provide for additional related uses such as schools, parks, churches and other uses necessary to serve the immediate residential areas.
A. The R3, R5 and R7 districts are intended to establish and recognize existing neighborhoods that are predominantly occupied by detached residential structures. These districts allow between three and seven units per acre. New development will be predominantly detached residential with flexibility to provide attached units and allow for a variety of lot sizes. The application of the districts to individual
areas will be based on existing development patterns, access to goods and services and environmental constraints.
B. The R10, R12, R16 and R20 districts are intended to establish new and recognize existing neighborhoods of higher residential densities composed of both attached and detached housing. New development is predominantly attached housing with allowances and flexibility to provide small lot detached housing.The application of the districts to individual areas will be based on existing development patterns, access to goods and services and environmental constraints. (Ord. 17-06 § 2 (part), 2017: Ord. 04-024 § 16 (part), 2004: Ord. 99-004 § 4 (part), 1999)
17.106.020 Uses.
The following list includes the uses that are permitted, conditional or prohibited in the residential zones. “P” means permitted outright, “C” means permitted via a conditional use permit, “X” means prohibited.
Permitted Uses in Residential Zones Use R3 R5 R7 R10 R12 R16 R20 Churches, including cemeteries and customary accessory buildings and uses, subject to BGMC 17 135 050 C C C C C C C Single-family detached buildings P P P P P P P Cottage housing P P P P P P X Single-family detached buildings, existing P P P P P P P Single-family attached dwellings (townhouses) X X P P P P P Two-family dwellings (duplexes) X X C P P P X Two-family dwellings (duplexes) on corner lots X P P P P P X Manufactured homes on individual lots, subject to the requirements of BGMC
P P P P P P P Accessory apartments,
Attached P P P P P P P Detached P P P P P P P Adult care homes (six or fewer residents) as defined in BGMC
P1 P1 P1 P1 P1 P1 P1
Table 17.106-1
17.135.102
subject to BGMC 17 135 010
17.103.020
Group living (seven or more residents) as defined in BGMC 17 103 325
housing as defined in BGMC 17.103.700
home parks, subject to BGMC 17 135 100
day care centers as part of a project incorporating residential units meeting the minimum densities ofTable 17.106-2
day care centers as regulated by RCW 35.63.185 and with conformity demonstrated through the city’s business license program
occupations, defined in BGMC 17 103 360 and subject to the supplementary regulations of BGMC 17.135.090
1 Adult care homes are permitted by right subject to an inspection by the building official for compliance with applicable state law
Use R3 R5 R7 R10 R12 R16 R20
C C C C C C C Transitional
C C C C C C C Apartments X X C P P P P Manufactured
X X X X C C C Commercial
X X X X P P P Family
P P P P P P P Carports and garages P P P P P P P Utility storage buildings and implement sheds P P P P P P P Guest houses, but not including accessory apartments P P P X X X X Swimming pools and tennis courts P P P P P P P Gardens and noncommercial greenhouses P P P P P P P Home
P P P P P P P Clubs, lodges, fraternal institutions and other places of
for membership groups C C C C C C C Neighborhood retail, pursuant to BGMC 17.106.050 P P P P P P P Accessory uses and structures
incidental
uses P P P P P P P Parks, playgrounds P P P P P P P Golf courses and country clubs C C C C C C C Public and semipublic buildings, structures and uses including public and private schools P P P P P P P Mobile food pod X X X X X X X
assembly
normally
to one or more permitted principal
(Ord 22-20 § 2, 2022; Ord 21-35 § 2, 2021; Ord 20-09 § 2 (part), 2020: Ord 17-06 § 2 (part), 2017: Ord 1504 § 23 (part), 2015: Ord 13-07 § 16, 2013: Ord 06-07 § 3, 2006; Ord 05-014 § 2, 2005; Ord 04-024 § 16 (part), 2004: Ord. 00-024 § 2 (part), 2000; Ord. 00-004 § 1(B), 2000; Ord. 99-004 § 4 (part), 1999)
17.106.030 Dimensional requirements.
Dimensional requirements within the residential districts shall be in accordance with Table 17.106-2.
Lot
Residential
Development Standards R3 R5 R7 R10 R12 R16 R20 Minimum average lot area (square feet) 10,500 6,300 4,500 N/A N/A N/A N/A Minimum average lot area for density transfer (square feet) 8,000 4,600 3,300 N/A N/A N/A N/A Minimum lot area (square feet) 6,300 4,000 3,000 2,000 2,000 2,000 2,000 Maximum density (units per gross acre) 3 5 7 10 12 16 20 Minimum density (units per net acre) 1 N/A N/A N/A 5 6 8 10 Minimum lot frontage (feet) 30 25 2 20 2 20 2 16 2 16 2 16 Minimum setbacks (feet) Residence front yard 3, 7 Minimum 10 Minimum 10 Minimum 10 Minimum 10 Minimum 10 Minimum 10 Minimum 10 Garage (minimum) 4 20 20 20 20 20 20 20 Side yard 5, 7 5 5 5 5 5 5 5 Street side yard7 10 10 10 10 10 10 10 Rear yard 4, 7 20 6 20 6 10 10 10 10 10
Table 17.106-2
Refer toTable 17.131-1 for landscaping requirements
1 Net acres shall be based on the total area of the site minus public-private road rights-of-way, stormwater facilities, and land voluntarily or required to be set aside for parks, open space or environmental protection
2 Lots may be approved without any frontage where they are part of a cottage development where appropriate easements are granted to gain access to the public or private street and the shared parking areas.
3 Attached front porches may intrude into required minimum front yard setbacks up to six feet.
4 Garages accessed via alleys may be located zero lot line to the edge of alley right-of-way if side entry and five feet from edge of alley right-of-way if front entry
5 Where a permitted use by the code, townhouses are not required to meet the side yard setback on the attached side(s)
6 Structures such as patio covers, decks, and bay windows are permitted to be set back ten feet Arear yard setback abutting a park, open space, wetland, or other critical area may be reduced to ten feet
7 Eaves, cornices, chimneys and similar projections may extend over a required front, rear, or side yard by not more than two feet per BGMC 17.129.030.
(Ord. 22-20 § 2, 2022; Ord. 20-09 § 2 (part), 2020: Ord. 17-06 § 2 (part), 2017: Ord. 16-15 § 2 (part), 2016: Ord. 13-07 § 17, 2013: Ord 06-07 § 4, 2006; Ord 04-024 § 16 (part), 2004: Ord 00-024 § 2 (part), 2000; Ord 00004 § 1(C), 2000; Ord 99-004 § 4 (part), 1999)
17.106.035 Density transfer provisions.
A. To provide for the protection of natural resources and to meet the density goals of the comprehensive plan, density may be transferred from one portion of a site due to wetland, greenway or critical area regulations to other buildable portions of the site consistent with the requirements of this section.
B. In no case shall any portion of a residential development exceed one hundred twenty percent of the density permitted by the underlying zone, and in no case shall the overall density of a residential development exceed the density permitted by the base zone.
R3 R5 R7 R10 R12 R16 R20 Maximum building lot coverage (%) 50 50 50 60 60 70 80 Maximum height (feet) 35 35 35 35 45 45 45
C. Density transfer provisions shall be limited to development within the R3, R5, and R7 zoning districts.
D. Portions of sites identified as sensitive due to the presence of steep slopes, unstable land, historical or archaeological sites, wetlands and buffers, commons, land voluntarily or mandatorily set aside for parks and open space or other permanent physical development limitations, as may be determined or approved by the planning director or hearing examiner, may be eligible for transfer of density. Land set aside or encumbered to accommodate the facilities, utilities or rights-of-way that, including required or existing rights-of-way, stormwater facilities or other utilities required to serve the development, shall not be eligible for density transfer, except as provided for in Chapter 17.128 BGMC, Parks, Recreation and Open Spaces.
E. The maximum number of units which can be transferred is limited to the number of whole units (fractions of units shall be rounded down) which would have been allowed on the unbuildable area described in subsection D of this section, not to exceed one hundred twenty percent of the maximum density allowed by the base zone on any portion of the site, as set forth in Table 17.106-2; provided, however, the maximum number of units shall be calculated based on the gross area of the site, minus any public road right-of-way The maximum density allowed on any site shall not exceed that permitted by the base zone, and will be dependent upon site characteristics and other factors. Nothing in this subsection shall be construed as to guarantee a minimum density on a given site. (Ord. 17-06 § 2 (part), 2017: Ord. 04-024 § 16 (part), 2004)
17.106.040 Single-family and duplex design standards.
A. Applicability The provisions of this section shall apply to all new residential development projects within the city of Battle Ground.
B. Architectural Variety To assure variety in architecture and to reduce the dominance of garages on the streetscape, the following provisions shall apply to new single-family dwellings and duplex structures:
1. No five contiguous lots shall have repetitious facades. Each single-family residence shall contain a covered front porch or entry and pathways to the public sidewalks. Facades shall be substantially different beyond mirrored plans and shall contain at least five of the following design features:
a. Dormers;
b. Bay windows;
c. Pillars or post;
d. Varied facade with at least three offset walls;
e. Varied rooflines such as hipped or pitched roofs;
f. Window trim (minimum three inches wide);
g. Decorative patterns on exterior finish (e.g., scales/shingles, wainscoting, and similar features);
h. Use of contrasting materials, such as brick or stone, on a minimum of twenty-five percent of the facade;
i. Other architectural elements that the planning director finds compatible with the residential character of the subdivision, not including color, glass, or lighting.
2. Garages.These additional design standards are for garages and only apply to the primary front setback:
a. Attached front-loaded garages can be set forward no more than ten feet from the front face of the residential structure or covered front porch. To qualify as a covered front porch under this subsection, the porch must extend the full length of the street fronting building facade that is not devoted to the garage.
b. Attached side-loaded garages shall have windows, doors or other architectural treatments covering at least thirty percent of the wall facing the street.
c. Detached garages shall be set back behind the front edge of the primary residential building unless approved by the planning director
3. Alleys. Where houses are served by alleys, all garages and on-site parking shall be accessible from the alley and the facade of the house facing the public street shall be designed as the front of the house including, but not limited to, a primary building entrance consisting of inward swinging door(s), porches, windows and pathways to the public sidewalks. (Ord. 22-20 § 2, 2022; Ord. 17-06 § 2 (part), 2017: Ord. 16-15 § 2 (part), 2016: Ord. 15-04 § 23 (part), 2015: Ord. 13-07 § 18, 2013: Ord. 09-08 § 11, 2009; Ord. 07-15 § 6, 2007: Ord. 05-014 § 3, 2005: Ord. 04-024 § 16 (part), 2004: Ord. 01-006 § 1, 2001: Ord. 99-004 § 4 (part), 1999)
17.106.050 Neighborhood retail.
A. Neighborhood Retail. Neighborhood retail uses shall be permitted as a conditional use pursuant to Chapter 17.148 BGMC throughout all residential districts, unless the neighborhood retail site was approved through the subdivision review process, subject to the provisions of site plan approval (Chapter 17.143 BGMC).The following criteria shall be met for neighborhood retail uses:
1. Uses shall be limited to the following:
a. Retail sales of groceries or disposable household items;
b. Personal service establishments;
c. Professional offices;
d. Restaurants and other food service establishments not exceeding one thousand square feet in seating area.
2. No single building housing a collection of uses shall have more than four thousand square feet of gross floor area dedicated to nonresidential uses.All neighborhood retail uses shall be enclosed in a single building.
3. Neighborhood retail uses shall be located on a parcel that is sufficient to accommodate all required development standards and conditions but which does not exceed fifteen thousand square feet.
4. No neighborhood retail use shall be located within one-quarter mile of any other commercial retail use or commercial zone.
5. Neighborhood retail uses shall be on lots located at the corner of the intersection of two public streets, one of which shall have a functional classification of major collector or higher and both of which shall have sidewalks.
6. Buildings shall observe the setbacks required in the zone within which they are located, but shall have no parking or maneuvering separating the building and the sidewalk.
7. At least fifty percent of the street-facing facade shall be comprised of windows or open store fronts that allow views into the building. No reflective coating or other method of limiting views is permitted.
8. Buildings shall be designed with respect to height, scale, massing and architectural feature and constructed with materials that are compatible with surrounding neighborhood architecture.
9. Signs associated with neighborhood retail uses shall not exceed thirty-two square feet in area and five feet in height, shall not be internally lit, neon or flashing, and shall be subject to all other applicable provisions of Chapter 17.139 BGMC, Signs.
10. Neighborhood retail uses shall provide parking consistent with Chapter 17.133 BGMC to a maximum of seven off-street parking spaces. On-street parking may be utilized to meet this requirement. Off-street parking shall be located to the side or rear of the building.All other provisions of Chapters 17.133 and 17.143 BGMC shall be applicable.
11. The side and rear property lines shall be improved with a B3 buffer, with fencing associated with such buffer in compliance with BGMC 17.135.080.
12. Neighborhood retail uses shall be restricted to the ground floor of the structure they occupy
13. Residential uses are permitted on the second floors of neighborhood retail buildings.
14. Drive-through, drive-up or other similar development types are not allowed. (Ord. 17-06 § 2 (part), 2017: Ord. 04-024 § 16 (part), 2004: Ord. 99-004 § 4 (part), 1999)
17.106.060 Cottage housing standards.
A. The total floor area of each cottage shall not exceed one thousand two hundred square feet. Floor area shall not include any space with a floor-to-ceiling height of less than six feet.
B. Cottage housing shall comply with the density provisions of the underlying zone except within the R5 and R7 districts where one and one-half cottage units are allowed in place of each allowed singlefamily unit.
C. Aminimum of four and a maximum of twelve cottages are allowed in any single cluster and development.
D. The height limit is twenty-five feet; provided, that all parts of the roof above eighteen feet shall be pitched with a slope of at least 6:12.
E. Cottage units shall be oriented around, and have covered porches and main entries facing, a common usable open space of at least two hundred fifty square feet per unit that is generally square or round.
F Each cottage shall be provided with private use open space contiguous to the cottage of at least two hundred fifty square feet with no dimension of less than ten feet. Private open space shall be
oriented to the common open space area.
G. Acovered porch of at least sixty square feet in size with a minimum dimension of six feet on any side shall be provided for each cottage.
H. Vehicular parking shall be provided in a shared parking facility that is clustered and separated from adjacent common areas, rights-of-way and residential units by landscaping. Parking areas shall not occupy more than fifty percent of the lot frontage.
I. Setbacks for the exterior of the project shall be the same as the base zoning district. There are no required setbacks for interior lot lines provided the ten-foot minimum separation to buildings shall be met.
J. Interior fences may not exceed thirty-six inches in height.
K. Apedestrian pathway a minimum of four feet in width shall connect the public street with all cottages and from the shared parking areas to all cottages.
L. Each cottage shall be located on a separate lot or shall be a condominium. (Ord. 17-06 § 2 (part), 2017: Ord. 09-08 § 12, 2009: Ord. 07-15 § 10, 2007: Ord. 04-024 § 16 (part), 2004)
17.106.070 Multifamily development standards.
In addition to the standards required through site plan review or other chapters of this title, the following provisions shall apply to multifamily development:
A. Building Location and Orientation. Multifamily development shall be constructed consistent with the following requirements:
1. Parking lots shall be located to the side and/or behind buildings designed pursuant to Chapter 17.133 BGMC.
2. Units adjacent to public or private streets shall have the primary building entrances located on the facade facing the street or meet additional architectural variety standards.
B. PedestrianAccess and Circulation. Pedestrian access routes shall be provided from the public street(s) to all primary building entrances in the form of a continuous separated pathway of at least five feet in width. Pedestrian routes that cross driveways or vehicular access aisles shall be composed of treated surfaces, such as scored, brushed, stamped and colored concrete and brick pavers, in order to differentiate the pedestrian system from the vehicular system. Where pedestrian routes cross
driveways or vehicular access aisles, different paving material shall be provided as noted above. Pedestrian circulation routes shall be a minimum of five feet in width.
C. Building Modulation. Building facade modulation or appropriate architectural treatment shall occur at least every twenty-five feet along the length of facades facing adjacent properties or public streets. Minimum modulation depth shall be three feet.
D. Architectural Variety All building elevations facing a public or private street that do not provide primary entrances along the right-of-way must be designed with additional architectural features in the combination of windows, porches, and/or balconies.
E. Roof Line Variation. Roof lines shall be varied to break up the overall bulk and mass of multifamily buildings. Roof line variation shall be accomplished by using one or more of the following methods: vertical or horizontal offset ridge line, variations in roof pitch, or other technique shown to break up the overall bulk and mass of the building.
F Building Variation. Developments with multiple structures shall use appropriate architectural variations and use of colors to differentiate buildings within the development.
G. Recreation.Apartment complex development of twelve units or more shall provide common open space/recreation areas on site for use and enjoyment of owners and residents within the development, according to the following minimum provisions:
1. The designated recreational area shall be a minimum of fifteen percent of the overall site area. Recreation space must be designed to serve as a centralized recreational facility, not merely leftover space along the edges of required yards and standard landscaping. This area may include open space area(s), play structures, sport courts, outdoor recreational features, trails and paths, community gardens or other similar types of facilities.
2. Open space/recreation areas do not include the following: parking lots, driveways, private/public street rights-of-way, required storage areas, etc. (Ord. 19-22 § 2, 2019: Ord. 17-06 § 2 (part), 2017: Ord. 16-15 § 2 (part), 2016: Ord. 15-04 § 23 (part), 2015; Ord. 13-07 § 19, 2013: Ord. 04-024 § 16 (part), 2004)
17.106.080 Townhouse development standards. In addition to the standards required through this chapter or other chapters of this title, the following provisions shall apply to townhouse development:
A. Each townhouse shall be located on its own lot of record created through a land division process.
B. No more than six townhouses shall be allowed in a single building.
C. Townhouses shall comply with the design standards for single-family residences pursuant to BGMC 17.106.040. (Ord. 17-06 § 2 (part), 2017: Ord. 04-024 § 16 (part), 2004)
17.106.090 Institutional and nonresidential development standards. In order to address impacts and increased incompatibility between residential and nonresidential development, nonresidential uses and institutional uses not addressed elsewhere in this title shall comply with the following provisions:
A. Landscaped buffers of ten feet in width and meeting the B2 standard shall be provided along all property lines which abut a residentially zoned property.
B. Apaved pedestrian connection a minimum of six feet in width shall be provided from the public street(s) serving the site to the primary building entrance.
C. Off-street parking shall be located behind or to the side of the building.
D. Buildings shall be oriented towards and located not more than thirty feet from the front property line, or shall be designed to provide clear and unfettered pedestrian access to the building and add design elements to the building facade that create a sense of arrival.
E. Aminimum of twenty percent of the site shall be landscaped. (Ord. 17-06 § 2 (part), 2017: Ord. 06-07 § 5, 2006: Ord. 04-024 § 16 (part), 2004)
The Battle Ground Municipal Code is current through Ordinance 23-12, passed May 1, 2023.
Disclaimer:The city clerk’s office has the official version of the Battle Ground Municipal Code. Users should contact the city clerk’s office for ordinances passed subsequent to the ordinance cited above.
City Website: https://www.cityofbg.org/
CityTelephone: (360) 342-5000
Code Publishing Company
COMMUNITY
INFORMATION
Demographics
Traffic Counts
The information contained is provided by WFG’s Customer Service Department to our customers, and while deemed reliable, is not guaranteed.
2617 SE Grace Ave, Battle Ground, WA 98604
2617 SE Grace Ave, Battle Ground, WA 98604 Sitewise Online
Population Quick Facts
Pop-Facts: Population Quick Facts 2617 SE Grace Ave, Battle Ground, WA 98604 0 - 3 mi Population 2027 Projection 35,323 2022 Estimate 32,816 2010 Census 26,395 2000 Census 17,311 Growth 2022-2027 7.64% Growth 2010-2022 24.33% Growth 2000-2010 52.48% 2022 Est. Population by Age 32,816 Age 0 to 4 2,608 7.95% Age 5 to 9 2,338 7.13% Age 10 to 14 2,396 7.30% Age 15 to 17 1,498 4.56% Age 18 to 20 1,338 4.08% Age 21 to 24 1,765 5.38% Age 25 to 34 4,586 13.98% Age 35 to 44 3,941 12.01% Age 45 to 54 4,031 12.28% Age 55 to 64 3,732 11.37% Age 65 to 74 2,914 8.88% Age 75 to 84 1,272 3.88% Age 85 and over 396 1.21% Age 16 and over 24,982 76.13% Age 18 and over 23,976 73.06% Age 21 and over 22,638 68.98% Age 65 and over 4,582 13.96% 2022 Est. Median Age 34.74 2022 Est. Average Age 36.74
Pop-Facts:
2022 Est. Population by Single-Classification Race 32,816 White Alone 29,274 89.21% Black or African American Alone 275 0.84% American Indian and Alaska Native Alone 299 0.91% Asian Alone 833 2.54% Native Hawaiian and Other Pacific Islander Alone 169 0.52% Some Other Race Alone 657 2.00% Two or More Races 1,309 3.99% 2022 Est. Population by Ethnicity (Hispanic or Latino) 32,816 Hispanic or Latino 2,494 7.60% Not Hispanic or Latino 30,322 92.40% 2022 Est. Population by Sex 32,816 Male 16,229 49.45% Female 16,587 50.55% Copyright © Claritas, LLC 2022. All rights reserved. 2617 SE Grace Ave, Battle Ground, WA 98604 Sitewise Online Pop-Facts: Population Quick Facts Pop-Facts: Population Quick Facts 2617 SE Grace Ave, Battle Ground, WA 98604 0 - 3 mi
Online Pop-Facts: Household Quick Facts Pop-Facts: Household Quick Facts 2617 SE Grace Ave, Battle Ground, WA 98604 0 - 3 mi Households 2027 Projection 11,560 2022 Estimate 10,730 2010 Census 8,604 2000 Census 5,707 Growth 2022-2027 7.74% Growth 2010-2022 24.71% Growth 2000-2010 50.77% 2022 Est. Households by Household Income 10,730 Income Less than $15,000 557 5.19% Income $15,000 to $24,999 347 3.24% Income $25,000 to $34,999 406 3.78% Income $35,000 to $49,999 919 8.57% Income $50,000 to $74,999 1,424 13.28% Income $75,000 to $99,999 1,650 15.38% Income $100,000 to $124,999 1,541 14.37% Income $125,000 to $149,999 1,245 11.61% Income $150,000 to $199,999 1,332 12.41% Income $200,000 to $249,999 662 6.17% Income $250,000 to $499,999 474 4.42% Income $500,000 or more 172 1.60% 2022 Est. Average Household Income $ 119,612 2022 Est. Median Household Income $ 100,994 2022 Median HH Inc. by Single-Classification Race White Alone $ 103,552 Black or African American Alone $ 79,263 American Indian and Alaska Native Alone $ 78,075 Asian Alone $ 49,958 Native Hawaiian and Other Pacific Islander Alone $ 63,704 Some Other Race Alone $ 80,243 Two or More Races $ 76,804 Hispanic or Latino $ 86,094 Not Hispanic or Latino $ 102,381 2022 Est. Households by Household Type 10,730 Family Households 8,480 79.03% Nonfamily Households 2,250 20.97%
2617
SE Grace Ave, Battle Ground, WA 98604
Sitewise
2022 Est. Group Quarters Population 194 2022 Est. Households by Household Size 10,730 1-person 1,830 17.05% 2-person 3,269 30.47% 3-person 1,888 17.60% 4-person 1,875 17.48% 5-person 982 9.15% 6-person 477 4.45% 7-or-more-person 408 3.80% 2022 Est. Average Household Size 3.04 2617 SE Grace Ave, Battle Ground, WA 98604 Sitewise Online Pop-Facts: Household Quick Facts Pop-Facts: Household Quick Facts 2617 SE Grace Ave, Battle Ground, WA 98604 0 - 3 mi
2022 Est. HHs by Type by Presence of Own Children 8,480 Married-Couple Family, own children 3,551 41.87% Married-Couple Family, no own children 3,284 38.73% Male Householder, own children 278 3.28% Male Householder, no own children 205 2.42% Female Householder, own children 700 8.26% Female Householder, no own children 462 5.45% Copyright © Claritas, LLC 2022. All rights reserved. 2617 SE Grace Ave, Battle Ground, WA 98604 Sitewise Online Pop-Facts: Household Quick Facts Pop-Facts: Household Quick Facts 2617 SE Grace Ave, Battle Ground, WA 98604 0 - 3 mi
2617 SE Grace Ave, Battle Ground, WA 98604 Sitewise Online Pop-Facts: Demographic Snapshot (Part 1)
Pop-Facts: Demographic Snapshot (Part 1) 2617 SE Grace Ave, Battle Ground, WA 98604 0 - 3 mi Population 2027 Projection 35,323 2022 Estimate 32,816 2010 Census 26,395 2000 Census 17,311 Growth 2022-2027 7.64% Growth 2010-2022 24.33% Growth 2000-2010 52.48% 2022 Est. Population by Single-Classification Race 32,816 White Alone 29,274 89.21% Black or African American Alone 275 0.84% American Indian and Alaska Native Alone 299 0.91% Asian Alone 833 2.54% Native Hawaiian and Other Pacific Islander Alone 169 0.52% Some Other Race Alone 657 2.00% Two or More Races 1,309 3.99% 2022 Est. Population Hispanic or Latino by Origin 32,816 Not Hispanic or Latino 30,322 92.40% Hispanic or Latino 2,494 7.60% Hispanic or Latino by Origin 2,494 Mexican 1,788 71.72% Puerto Rican 92 3.68% Cuban 28 1.13% All Other Hispanic or Latino 585 23.47% 2022 Est. Hisp. or Latino Pop by Single-Classification Race 2,494 White Alone 1,585 63.57% Black or African American Alone 17 0.67% American Indian and Alaska Native Alone 40 1.61% Asian Alone 15 0.62% Native Hawaiian and Other Pacific Islander Alone 9 0.36% Some Other Race Alone 600 24.07% Two or More Races 227 9.09%
2022 Est. Pop by Race, Asian Alone, by Category 833 Chinese, except Taiwanese 261 31.41% Filipino 191 22.99% Japanese 11 1.31% Asian Indian 15 1.80% Korean 6 0.75% Vietnamese 159 19.16% Cambodian 29 3.49% Hmong 5 0.59% Laotian 12 1.49% Thai 5 0.59% All other Asian Races, including 2 or more 137 16.43% 2022 Est. Population by Ancestry 32,816 Arab 55 0.17% Czech 38 0.12% Danish 207 0.63% Dutch 472 1.44% English 2,498 7.61% French (except Basque) 797 2.43% French Canadian 278 0.85% German 5,490 16.73% Greek 11 0.03% Hungarian 62 0.19% Irish 2,062 6.28% Italian 711 2.17% Lithuanian 20 0.06% Norwegian 1,451 4.42% Polish 517 1.58% Portuguese 53 0.16% Russian 1,051 3.20% Scottish 716 2.18% Scotch-Irish 349 1.06% Slovak 6 0.02% Subsaharan African 24 0.07% Swedish 825 2.51% Swiss 219 0.67% Ukrainian 778 2.37% United States or American 1,413 4.30% Welsh 143 0.44% West Indian (except Hisp. groups) 6 0.02% Other Ancestries 7,732 23.56% Ancestry Unclassified 4,832 14.72% 2022 Est. Pop Age 5+ by Language Spoken At Home 30,208
Pop-Facts:
Pop-Facts: Demographic Snapshot (Part 1) 2617
Ground,
98604 0 - 3 mi
2617 SE Grace Ave, Battle Ground, WA 98604 Sitewise Online
Demographic Snapshot (Part 1)
SE Grace Ave, Battle
WA
Speak only English 26,536 87.84% Speak Asian or Pacific Island Language 330 1.09% Speak IndoEuropean Language 2,253 7.46% Speak Spanish 956 3.16% Speak Other Language 133 0.44% 2617 SE Grace Ave, Battle Ground, WA 98604 Sitewise Online Pop-Facts: Demographic Snapshot (Part 1) Pop-Facts: Demographic Snapshot (Part 1) 2617 SE Grace Ave, Battle Ground, WA 98604 0 - 3 mi
SE Grace Ave, Battle Ground, WA 98604 Sitewise Online
Pop-Facts: Demographic Snapshot (Part 1)
2022 Est. Population by Sex 32,816 Male 16,229 49.45% Female 16,587 50.55% 2022 Est. Population by Age 32,816 Age 0 to 4 2,608 7.95% Age 5 to 9 2,338 7.13% Age 10 to 14 2,396 7.30% Age 15 to 17 1,498 4.56% Age 18 to 20 1,338 4.08% Age 21 to 24 1,765 5.38% Age 25 to 34 4,586 13.98% Age 35 to 44 3,941 12.01% Age 45 to 54 4,031 12.28% Age 55 to 64 3,732 11.37% Age 65 to 74 2,914 8.88% Age 75 to 84 1,272 3.88% Age 85 and over 396 1.21% Age 16 and over 24,982 76.13% Age 18 and over 23,976 73.06% Age 21 and over 22,638 68.98% Age 65 and over 4,582 13.96% 2022 Est. Median Age 34.74 2022 Est. Average Age 36.74
2617
2617
0 - 3 mi
Pop-Facts: Demographic Snapshot (Part 1)
SE Grace Ave, Battle Ground, WA 98604
2617 SE Grace Ave, Battle Ground, WA 98604 Sitewise Online
Demographic Snapshot (Part 1)
2022 Est. Male Population by Age 16,229 Age 0 to 4 1,350 8.32% Age 5 to 9 1,186 7.31% Age 10 to 14 1,248 7.69% Age 15 to 17 757 4.66% Age 18 to 20 684 4.22% Age 21 to 24 899 5.54% Age 25 to 34 2,356 14.52% Age 35 to 44 1,925 11.86% Age 45 to 54 1,954 12.04% Age 55 to 64 1,799 11.09% Age 65 to 74 1,367 8.42% Age 75 to 84 559 3.44% Age 85 and over 147 0.91% 2022 Est. Median Age, Male 33.45 2022 Est. Average Age, Male 35.72 2022 Est. Female Population by Age 16,587 Age 0 to 4 1,259 7.59% Age 5 to 9 1,153 6.95% Age 10 to 14 1,148 6.92% Age 15 to 17 741 4.47% Age 18 to 20 654 3.94% Age 21 to 24 866 5.22% Age 25 to 34 2,230 13.45% Age 35 to 44 2,017 12.16% Age 45 to 54 2,077 12.52% Age 55 to 64 1,933 11.65% Age 65 to 74 1,547 9.33% Age 75 to 84 713 4.30% Age 85 and over 249 1.50% 2022 Est. Median Age, Female 36.21 2022 Est. Average Age, Female 37.70
Pop-Facts: Demographic Snapshot (Part 1) 2617 SE Grace Ave, Battle Ground, WA 98604 0 - 3 mi
Pop-Facts:
2022 Est. Pop Age 15+ by Marital Status 25,474 Total, Never Married 6,955 27.30% Males, Never Married 3,574 14.03% Females, Never Married 3,380 13.27% Married, Spouse present 13,893 54.54% Married, Spouse absent 752 2.95% Widowed 1,210 4.75% Males, Widowed 245 0.96% Females, Widowed 965 3.79% Divorced 2,662 10.45% Males, Divorced 1,112 4.36% Females, Divorced 1,551 6.09% 2022 Est. Pop Age 25+ by Edu. Attainment 20,873 Less than 9th grade 259 1.24% Some High School, no diploma 743 3.56% High School Graduate (or GED) 6,189 29.65% Some College, no degree 5,529 26.49% Associate Degree 2,473 11.85% Bachelor's Degree 3,709 17.77% Master's Degree 1,494 7.16% Professional School Degree 276 1.32% Doctorate Degree 199 0.95% 2022 Est. Pop. Age 25+ by Edu. Attain., Hisp./Lat. 1,201 No High School Diploma 257 21.40% High School Graduate 275 22.93% Some College or Associate's Degree 370 30.85% Bachelor's Degree or Higher 298 24.83% Copyright © Claritas, LLC 2022. All rights reserved. 2617
Sitewise Online Pop-Facts: Demographic Snapshot (Part 1) Pop-Facts: Demographic Snapshot (Part 1) 2617 SE Grace Ave, Battle Ground, WA 98604 0 - 3 mi
SE Grace Ave, Battle Ground, WA 98604
2617 SE Grace Ave, Battle Ground, WA 98604 Sitewise Online
Demographic Snapshot (Part 2)
Pop-Facts: Demographic Snapshot (Part 2) 2617 SE Grace Ave, Battle Ground, WA 98604 0 - 3 mi Households 2027 Projection 11,560 2022 Estimate 10,730 2010 Census 8,604 2000 Census 5,707 Growth 2022-2027 7.74% Growth 2010-2022 24.71% Growth 2000-2010 50.77% 2022 Est. Households by Household Type 10,730 Family Households 8,480 79.03% Nonfamily Households 2,250 20.97% 2022 Est. Group Quarters Population 194 2022 HHs by Ethnicity: Hispanic/Latino 570 5.32% 2022 Est. Households by HH Income 10,730 Income < $15,000 557 5.19% Income $15,000 to $24,999 347 3.24% Income $25,000 to $34,999 406 3.78% Income $35,000 to $49,999 919 8.57% Income $50,000 to $74,999 1,424 13.28% Income $75,000 to $99,999 1,650 15.38% Income $100,000 to $124,999 1,541 14.37% Income $125,000 to $149,999 1,245 11.61% Income $150,000 to $199,999 1,332 12.41% Income $200,000 to $249,999 662 6.17% Income $250,000 to $499,999 474 4.42% Income $500,000+ 172 1.60% 2022 Est. Average Household Income $ 119,612 2022 Est. Median Household Income $ 100,994 2022 Median HH Income by Single-Class. Race or Ethn. White Alone $ 103,552 Black or African American Alone $ 79,263 American Indian and Alaska Native Alone $ 78,075 Asian Alone $ 49,958 Native Hawaiian and Other Pacific Islander Alone $ 63,704 Some Other Race Alone $ 80,243 Two or More Races $ 76,804
Pop-Facts:
Hispanic or Latino $ 86,094 Not Hispanic or Latino $ 102,381
Sitewise Online Pop-Facts:
Pop-Facts: Demographic Snapshot (Part 2) 2617
0 - 3 mi
2617 SE Grace Ave, Battle Ground, WA 98604
Demographic Snapshot (Part 2)
SE Grace Ave, Battle Ground, WA 98604
Pop-Facts: Demographic Snapshot (Part 2)
Pop-Facts:
2022 Est. Family HH Type by Presence of Own Children 8,480 Married-Couple Family, own children 3,551 41.87% Married-Couple Family, no own children 3,284 38.73% Male Householder, own children 278 3.28% Male Householder, no own children 205 2.42% Female Householder, own children 700 8.26% Female Householder, no own children 462 5.45% 2022 Est. Households by Household Size 10,730 1-person 1,830 17.05% 2-person 3,269 30.47% 3-person 1,888 17.60% 4-person 1,875 17.48% 5-person 982 9.15% 6-person 477 4.45% 7-or-more-person 408 3.80% 2022 Est. Average Household Size 3.04 2022 Est. Households by Presence of People Under 18 10,730 Households with 1 or more People under Age 18 4,887 45.54% Households with No People under Age 18 5,843 54.46% Households with 1 or more People under Age 18 4,887 Married-Couple Family 3,735 76.43% Other Family, Male Householder 310 6.34% Other Family, Female Householder 801 16.40% Nonfamily, Male Householder 32 0.65% Nonfamily, Female Householder 9 0.17% Households with No People under Age 18 5,843 Married-Couple Family 3,097 53.00% Other Family, Male Householder 174 2.98% Other Family, Female Householder 361 6.18% Nonfamily, Male Householder 946 16.18% Nonfamily, Female Householder 1,266 21.66%
2617 SE Grace Ave, Battle Ground, WA 98604 Sitewise Online
0 - 3 mi
Demographic Snapshot (Part 2) 2617 SE Grace Ave, Battle Ground, WA 98604
2022 Est. Households by Number of Vehicles 10,730 No Vehicles 463 4.32% 1 Vehicle 2,148 20.02% 2 Vehicles 3,857 35.95% 3 Vehicles 2,495 23.25% 4 Vehicles 1,224 11.41% 5 or more Vehicles 542 5.05% 2022 Est. Average Number of Vehicles 2.36 Family Households 2027 Projection 9,131 2022 Estimate 8,480 2010 Census 6,824 2000 Census 4,567 Growth 2022-2027 7.68% Growth 2010-2022 24.26% Growth 2000-2010 49.42% 2022 Est. Families by Poverty Status 8,480 2022 Families at or Above Poverty 8,050 94.94% 2022 Families at or Above Poverty with Children 3,635 42.86% 2022 Families Below Poverty 429 5.06% 2022 Families Below Poverty with Children 294 3.46% 2022 Est. Pop Age 16+ by Employment Status 24,982 In Armed Forces 0 0.00% Civilian - Employed 15,418 61.72% Civilian - Unemployed 766 3.07% Not in Labor Force 8,798 35.22% 2022 Est. Civ. Employed Pop 16+ by Class of Worker 15,075 For-Profit Private Workers 10,086 66.91% Non-Profit Private Workers 1,120 7.43% Local Government Workers 1,176 7.80% State Government Workers 622 4.13% Federal Government Workers 326 2.17% Self-Employed Workers 1,630 10.81% Unpaid Family Workers 113 0.75%
Pop-Facts: Demographic
2) Pop-Facts: Demographic Snapshot (Part 2) 2617 SE Grace Ave, Battle Ground, WA 98604 0 - 3 mi
2617 SE Grace Ave, Battle Ground, WA 98604 Sitewise Online
Snapshot (Part
2617 SE Grace Ave, Battle Ground, WA 98604 Sitewise Online Pop-Facts: Demographic Snapshot (Part 2)
2022 Est. Civ. Employed Pop 16+ by Occupation 15,075 Architect/Engineer 432 2.86% Arts/Entertainment/Sports 297 1.97% Building Grounds Maintenance 403 2.67% Business/Financial Operations 639 4.24% Community/Social Services 220 1.46% Computer/Mathematical 266 1.76% Construction/Extraction 1,309 8.68% Education/Training/Library 827 5.49% Farming/Fishing/Forestry 23 0.15% Food Prep/Serving 693 4.60% Healthcare Practitioner/Technician 861 5.71% Healthcare Support 719 4.77% Maintenance Repair 570 3.78% Legal 87 0.58% Life/Physical/Social Science 83 0.55% Management 1,683 11.17% Office/Admin. Support 1,657 10.99% Production 826 5.48% Protective Service 335 2.22% Sales/Related 1,451 9.63% Personal Care/Service 347 2.30% Transportation/Moving 1,346 8.93% 2022 Est. Pop 16+ by Occupation Classification 15,075 Blue Collar 4,051 26.88% White Collar 8,504 56.41% Service & Farm 2,519 16.71% 2022 Est. Workers Age 16+ by Transp. To Work 14,783 Drove Alone 11,796 79.80% Car Pooled 1,282 8.67% Public Transportation 93 0.63% Walked 279 1.89% Bicycle 20 0.14% Other Means 159 1.08% Worked at Home 1,153 7.80% 2022 Est. Workers Age 16+ by Travel Time to Work* Less than 15 minutes 2,486 15 to 29 Minutes 4,302 30 to 44 Minutes 3,984 45 to 59 Minutes 1,517 60 or more Minutes 1,366
Pop-Facts: Demographic Snapshot (Part 2) 2617 SE
Ground, WA 98604 0 - 3 mi
Grace Ave, Battle
2022 Est. Avg. Travel Time to Work in Minutes* 33.10 2022 Est. Occupied Housing Units by Tenure 10,730 Owner-Occupied 8,228 76.68% Renter-Occupied 2,502 23.32% 2022 Occupied Housing Units: Avg. Length of Residence Owner-Occupied 10 Renter-Occupied 5 2617 SE Grace Ave, Battle Ground, WA 98604 Sitewise Online Pop-Facts: Demographic Snapshot (Part 2) Pop-Facts: Demographic Snapshot (Part 2) 2617 SE Grace Ave, Battle Ground, WA 98604 0 - 3 mi
2022 Est. Owner Occupied Housing Units by Value 8,228 Value Less than $20,000 94 1.14% Value $20,000 to $39,999 105 1.28% Value $40,000 to $59,999 73 0.89% Value $60,000 to $79,999 45 0.55% Value $80,000 to $99,999 4 0.05% Value $100,000 to $149,999 28 0.34% Value $150,000 to $199,999 56 0.68% Value $200,000 to $299,999 763 9.27% Value $300,000 to $399,999 1,898 23.07% Value $400,000 to $499,999 1,990 24.19% Value $500,000 to $749,999 1,992 24.21% Value $750,000 to $999,999 854 10.37% Value $1,000,000 to $1,499,999 248 3.01% Value $1,500,000 to $1,999,999 52 0.63% Value $2,000,000 or more 26 0.32% 2022 Est. Median All Owner-Occupied Housing Unit Value $ 452,644 2022 Est. Housing Units by Units in Structure 11,175 1 Unit Attached 363 3.25% 1 Unit Detached 9,019 80.71% 2 Units 99 0.89% 3 or 4 Units 163 1.46% 5 to 19 Units 472 4.23% 20 to 49 Units 302 2.70% 50 or More Units 283 2.53% Mobile Home or Trailer 463 4.15% Boat, RV, Van, etc. 11 0.10% Dominant structure type 1 Unit Detached 2022 Est. Housing Units by Year Structure Built 11,175 Housing Units Built 2014 or Later 2,253 20.16% Housing Units Built 2010 to 2013 510 4.56% Housing Units Built 2000 to 2009 2,597 23.24% Housing Units Built 1990 to 1999 2,703 24.18% Housing Units Built 1980 to 1989 974 8.71% Housing Units Built 1970 to 1979 1,285 11.50% Housing Units Built 1960 to 1969 339 3.04% Housing Units Built 1950 to 1959 169 1.51% Housing Units Built 1940 to 1949 111 1.00% Housing Units Built 1939 or Earlier 234 2.10% 2022 Est. Median Year Structure Built** 1999 2617
Sitewise Online Pop-Facts: Demographic
2) Pop-Facts: Demographic Snapshot (Part 2) 2617 SE Grace Ave, Battle Ground, WA 98604 0 - 3 mi
SE Grace Ave, Battle Ground, WA 98604
Snapshot (Part
2617 SE Grace Ave, Battle Ground, WA 98604 Sitewise Online
Pop-Facts: Demographic Snapshot (Part 2)
Dominant Year Structure Built
Copyright © Claritas, LLC 2022. All rights reserved.
* This row intentionally left blank. No Total Category.
**1939 will appear when at least half of the Housing Units in this reports area were built in 1939 or earlier.
2617 SE Grace Ave, Battle Ground, WA 98604
1990 to 1999
0 - 3 mi
2617 SE Grace Ave, Battle Ground, WA 98604 Sitewise Online Pop-Facts: Census Demographic Overview (Part 1)
Pop-Facts: Census Demographic Overview (Part 1) 2617 SE Grace Ave, Battle Ground, WA 98604 0 - 3 mi Population 2027 Projection 35,323 2022 Estimate 32,816 2010 Census 26,395 2000 Census 17,311 Growth 2022-2027 7.64% Growth 2010-2022 24.33% Growth 2000-2010 52.48% 2010 Population by Single-Classification Race 26,395 White Alone 24,291 92.03% Black or African American Alone 175 0.66% American Indian and Alaska Native Alone 196 0.74% Asian Alone 438 1.66% Native Hawaiian and Other Pacific Islander Alone 78 0.29% Some Other Race Alone 436 1.65% Two or More Races 780 2.95% 2010 Population By Ethnicity 26,395 Not Hispanic or Latino 24,986 94.66% Hispanic or Latino 1,408 5.34% 2010 Hispanic or Latino by Single-Classification Race 1,408 White Alone 846 60.07% Black or African American Alone 9 0.63% American Indian and Alaska Native Alone 22 1.58% Asian Alone 9 0.63% Native Hawaiian and Other Pacific Islander Alone 4 0.28% Some Other Race Alone 397 28.21% Two or More Races 121 8.60% 2010 Population by Sex 26,395 Male 12,999 49.25% Female 13,396 50.75% Male/Female Ratio 0.97
Online
Pop-Facts: Census Demographic Overview (Part 1)
2010 Population by Age 26,395 Age 0 to 4 2,129 8.07% Age 5 to 9 2,349 8.90% Age 10 to 14 2,462 9.33% Age 15 to 17 1,470 5.57% Age 18 to 20 1,113 4.22% Age 21 to 24 1,137 4.31% Age 25 to 34 3,134 11.87% Age 35 to 44 3,678 13.93% Age 45 to 54 3,542 13.42% Age 55 to 64 2,824 10.70% Age 65 to 74 1,519 5.75% Age 75 to 84 708 2.68% Age 85 and over 330 1.25% Age 16 and over 18,951 71.80% Age 18 and over 17,985 68.14% Age 21 and over 16,872 63.92% Age 65 and over 2,557 9.69% 2010 Median Age 33.10
2617 SE Grace Ave, Battle Ground, WA 98604 Sitewise
Pop-Facts: Census Demographic Overview (Part 1) 2617 SE Grace Ave, Battle Ground, WA 98604 0 - 3 mi
2010 Male Population by Age 12,999 Age 0 to 4 1,092 8.40% Age 5 to 9 1,161 8.93% Age 10 to 14 1,303 10.02% Age 15 to 17 786 6.05% Age 18 to 20 594 4.57% Age 21 to 24 571 4.39% Age 25 to 34 1,469 11.30% Age 35 to 44 1,818 13.99% Age 45 to 54 1,710 13.15% Age 55 to 64 1,378 10.60% Age 65 to 74 705 5.42% Age 75 to 84 306 2.35% Age 85 and over 106 0.81% 2010 Median Age, Male 31.76 2010 Female Population by Age 13,396 Age 0 to 4 1,037 7.74% Age 5 to 9 1,189 8.87% Age 10 to 14 1,159 8.65% Age 15 to 17 684 5.11% Age 18 to 20 519 3.87% Age 21 to 24 566 4.23% Age 25 to 34 1,665 12.43% Age 35 to 44 1,859 13.88% Age 45 to 54 1,832 13.68% Age 55 to 64 1,446 10.80% Age 65 to 74 814 6.07% Age 75 to 84 402 3.00% Age 85 and over 224 1.67% 2010 Median Age, Female 34.28
2617 SE Grace Ave,
Sitewise Online Pop-Facts: Census Demographic Overview (Part 1) Pop-Facts: Census Demographic Overview (Part 1) 2617 SE Grace Ave, Battle Ground, WA 98604 0 - 3 mi
Copyright © Claritas, LLC 2022. All rights reserved.
Battle Ground, WA 98604
2617 SE Grace Ave, Battle Ground, WA 98604 Sitewise Online
Pop-Facts: Census Demographic Overview (Part 2)
Pop-Facts: Census Demographic Overview (Part 2) 2617 SE Grace Ave, Battle Ground, WA 98604 0 - 3 mi Households 2027 Projection 11,560 2022 Estimate 10,730 2010 Census 8,604 2000 Census 5,707 Growth 2022-2027 7.74% Growth 2010-2022 24.71% Growth 2000-2010 50.77% 2010 Households by Household Type 8,604 Family Households 6,824 79.31% Non-family Households 1,780 20.69% 2010 Group Quarters Population 176 2010 Hispanic or Latino Households 311 3.62% 2010 Households by Household Size 8,604 1-person 1,394 16.20% 2-person 2,689 31.25% 3-person 1,489 17.30% 4-person 1,560 18.13% 5-person 781 9.07% 6-person 364 4.24% 7-or-more-person 328 3.81%
2010 Households by Type and Presence of Children 8,604 Married-Couple Family, own children 2,838 32.98% Male Householder, own children 223 2.59% Female Householder, own children 555 6.45% Married-Couple Family, no own children 2,674 31.08% Male Householder, no own children 164 1.90% Female Householder, no own children 370 4.30% Non-family Households 1,780 20.69% 2010 Households by Presence of People Under Age 18 8,604 HH with 1 or More People Under Age 18: 3,903 45.37% Households with No People Under Age 18: 4,701 54.63% HH with 1 or More People Under Age 18: 3,903 Married-Couple Family 2,987 76.54% Other Family, Male Householder 248 6.36% Other Family, Female Householder 637 16.32% Nonfamily, Male Householder 24 0.62% Nonfamily, Female Householder 7 0.17% Households with No People Under Age 18: 4,701 Married-Couple Family 2,525 53.71% Other Family, Male Householder 138 2.95% Other Family, Female Householder 288 6.13% Nonfamily, Male Householder 755 16.05% Nonfamily, Female Householder 995 21.16% 2010 Occupied Housing Units by Tenure 8,604 Owner-Occupied 6,645 77.23% Renter-Occupied 1,959 22.77%
Copyright Online Pop-Facts: Census Demographic Overview (Part 2) Pop-Facts: Census Demographic Overview (Part 2) 2617 SE Grace Ave, Battle Ground, WA 98604 0 - 3 mi
© Claritas, LLC 2022. All rights reserved.
2617 SE Grace Ave, Battle Ground, WA 98604
Sitewise
2617 SE Grace Ave, Battle Ground, WA 98604 Sitewise Online Retail Market Power Opportunity Gap Report By Retail Store Types Retail Market Power Opportunity Gap Report By Retail Store Types 2617 SE Grace Ave, Battle Ground, WA 98604 0 - 3 mi 2022 Demand 2022 Supply Opportunity Gap/Surplus Total retail trade including food and drink (NAICS 44, 45 and 722) $ 584,916,542 $ 456,944,162 $ 127,972,378 Total retail trade (NAICS 44 and 45) $ 521,225,175 $ 410,936,682 $ 110,288,492 Motor vehicle and parts dealers (NAICS 441) $ 118,360,162 $ 69,447,194 $ 48,912,967 Automobile dealers (NAICS 4411) $ 99,682,464 $ 61,177,328 $ 38,505,137 New car dealers (NAICS 44111) $ 88,576,008 $ 61,177,328 $ 27,398,681 Used car dealers (NAICS 44112) $ 11,106,456 $ 0 $ 11,106,456 Other motor vehicle dealers (NAICS 4412) $ 10,679,507 $ 949,499 $ 9,730,007 Recreational vehicle dealers (NAICS 44121) $ 4,196,223 $ 890,446 $ 3,305,777 Motorcycle, boat, and other motor vehicle dealers (NAICS 44122) $ 6,483,283 $ 59,053 $ 6,424,230 Boat dealers (NAICS 441222) $ 2,502,124 $ 59,053 $ 2,443,071 Motorcycle, ATV, and all other motor vehicle dealers (NAICS 441228) $ 3,981,159 $ 0 $ 3,981,159 Automotive parts, accessories, and tire stores (NAICS 4413) $ 7,998,189 $ 7,320,367 $ 677,822 Automotive parts and accessories stores (NAICS 44131) $ 5,057,630 $ 3,569,518 $ 1,488,112 Tire dealers (NAICS 44132) $ 2,940,559 $ 3,750,849 - $ 810,289 Furniture and home furnishings stores (NAICS 442) $ 11,178,077 $ 7,270,445 $ 3,907,632 Furniture stores (NAICS 4421) $ 6,123,607 $ 4,118,300 $ 2,005,307 Home furnishings stores (NAICS 4422) $ 5,054,470 $ 3,152,145 $ 1,902,325 Floor covering stores (NAICS 44221) $ 2,433,983 $ 1,602,321 $ 831,662 Other home furnishings stores (NAICS 44229) $ 2,620,487 $ 1,549,824 $ 1,070,663 Window treatment stores (NAICS 442291) $ 128,292 $ 0 $ 128,292 All other home furnishings stores (NAICS 442299) $ 2,492,195 $ 1,549,824 $ 942,371 Electronics and appliance stores (NAICS 443) $ 6,925,956 $ 1,562,703 $ 5,363,254 Household appliance stores (NAICS 443141) $ 1,678,790 $ 0 $ 1,678,790 Electronics stores (NAICS 443142) $ 5,247,166 $ 1,562,703 $ 3,684,464 Building material and garden equipment and supplies dealers (NAICS 444) $ 39,143,838 $ 24,203,559 $ 14,940,279 Building material and supplies dealers (NAICS 4441) $ 33,715,566 $ 22,616,448 $ 11,099,118 Home centers (NAICS 44411) $ 18,691,515 $ 11,781,685 $ 6,909,829 Paint and wallpaper stores (NAICS 44412) $ 1,146,830 $ 2,239,652 - $ 1,092,821 Hardware stores (NAICS 44413) $ 2,955,769 $ 2,804,910 $ 150,860 Other building material dealers (NAICS 44419) $ 10,921,452 $ 5,790,201 $ 5,131,251 Lawn and garden equipment and supplies stores (NAICS 4442) $ 5,428,272 $ 1,587,111 $ 3,841,161 Outdoor power equipment stores (NAICS 44421) $ 1,112,499 $ 329,584 $ 782,914 Nursery, garden center, and farm supply stores (NAICS 44422) $ 4,315,773 $ 1,257,527 $ 3,058,246 Food and beverage stores (NAICS 445) $ 77,174,366 $ 85,259,494 - $ 8,085,129 Grocery stores (NAICS 4451) $ 68,690,037 $ 78,364,175 - $ 9,674,139 Supermarkets and other grocery (except convenience) stores (NAICS 44511) $ 65,952,114 $ 75,684,762 - $ 9,732,648 Convenience stores (NAICS 44512) $ 2,737,923 $ 2,679,414 $ 58,508 Specialty food stores (NAICS 4452) $ 2,011,426 $ 4,062,072 - $ 2,050,645
Meat markets (NAICS 44521) $ 607,926 $ 12,125 $ 595,801 Fish and seafood markets (NAICS 44522) $ 239,312 $ 21,007 $ 218,306 Fruit and vegetable markets (NAICS 44523) $ 417,200 $ 940,557 - $ 523,357 Other specialty food stores (NAICS 44529) $ 746,988 $ 3,088,383 - $ 2,341,395 Baked goods and confectionery and nut stores (NAICS 445291 + 445292) $ 396,585 $ 87,462 $ 309,122 All other specialty food stores (NAICS 445299) $ 350,403 $ 3,000,920 - $ 2,650,517 Beer, wine, and liquor stores (NAICS 4453) $ 6,472,903 $ 2,833,247 $ 3,639,656 Health and personal care stores (NAICS 446) $ 29,861,367 $ 15,219,596 $ 14,641,771 Pharmacies and drug stores (NAICS 44611) $ 25,911,135 $ 14,361,115 $ 11,550,020 Cosmetics, beauty supplies, and perfume stores (NAICS 44612) $ 1,735,857 $ 0 $ 1,735,857 Optical goods stores (NAICS 44613) $ 830,647 $ 0 $ 830,647 Other health and personal care stores (NAICS 44619) $ 1,383,727 $ 858,481 $ 525,246 Food (health) supplement stores (NAICS 446191) $ 492,915 $ 460,637 $ 32,278 All other health and personal care stores (NAICS 446199) $ 890,812 $ 397,844 $ 492,968 Gasoline stations (NAICS 447) $ 40,133,475 $ 16,734,430 $ 23,399,046 Clothing and clothing accessories stores (NAICS 448) $ 20,972,024 $ 7,383,987 $ 13,588,037 Clothing stores (NAICS 4481) $ 13,742,974 $ 3,726,072 $ 10,016,902 Men's clothing stores (NAICS 44811) $ 615,626 $ 0 $ 615,626 Women's clothing stores (NAICS 44812) $ 2,403,471 $ 2,195,385 $ 208,086 Children's and infants' clothing stores (NAICS 44813) $ 532,794 $ 0 $ 532,794 Family clothing stores (NAICS 44814) $ 8,269,123 $ 1,175,771 $ 7,093,352 Clothing accessories stores (NAICS 44815) $ 671,167 $ 0 $ 671,167 Other clothing stores (NAICS 44819) $ 1,250,793 $ 354,916 $ 895,877 Shoe stores (NAICS 4482) $ 2,986,569 $ 132,390 $ 2,854,179 Jewelry, luggage, and leather goods stores (NAICS 4483) $ 4,242,482 $ 3,525,526 $ 716,956 Jewelry stores (NAICS 44831) $ 2,763,330 $ 3,525,526 - $ 762,196 Luggage and leather goods stores (NAICS 44832) $ 1,479,152 $ 0 $ 1,479,152 Sporting goods, hobby, musical instrument, and book stores (NAICS 451) $ 8,295,736 $ 4,643,109 $ 3,652,627 Sporting goods, hobby, and musical instrument stores (NAICS 4511) $ 7,480,545 $ 4,521,996 $ 2,958,549 Sporting goods stores (NAICS 45111) $ 5,434,985 $ 2,791,878 $ 2,643,107 Hobby, toy, and game stores (NAICS 45112) $ 1,514,323 $ 1,657,513 - $ 143,190 Sewing, needlework, and piece goods stores (NAICS 45113) $ 248,824 $ 0 $ 248,824 Musical instrument and supplies stores (NAICS 45114) $ 282,414 $ 72,605 $ 209,808 Book stores and news dealers (NAICS 4512) $ 815,190 $ 121,113 $ 694,077 Book stores (NAICS 451211) $ 758,861 $ 121,113 $ 637,748 News dealers and newsstands (NAICS 451212) $ 56,329 $ 0 $ 56,329 General merchandise stores (NAICS 452) $ 66,624,398 $ 114,780,870 - $ 48,156,471 Department stores (NAICS 4522) $ 8,407,306 $ 2,391,674 $ 6,015,632 Other general merchandise stores (NAICS 4523) $ 58,217,092 $ 112,389,196 - $ 54,172,103 Warehouse clubs and supercenters (NAICS 452311) $ 52,568,746 $ 111,594,657 - $ 59,025,911 All other general merchandise stores (NAICS 452319) $ 5,648,345 $ 794,538 $ 4,853,807 2617 SE Grace Ave, Battle Ground, WA 98604 Sitewise Online Retail Market Power Opportunity Gap Report By Retail Store Types Retail Market Power Opportunity Gap Report By Retail Store Types 2617 SE Grace Ave, Battle Ground, WA 98604 0 - 3 mi 2022 Demand 2022 Supply Opportunity Gap/Surplus
2617 SE Grace Ave, Battle Ground, WA 98604
* GAFO (General merchandise, Apparel, Furniture and Other) represents sales at stores that sell merchandise normally sold in department stores. This category is not included in Total Retail Sales Including Eating and Drinking Places.
Miscellaneous store retailers (NAICS 453) $ 11,439,897 $ 23,675,189 - $ 12,235,292 Florists (NAICS 4531) $ 550,221 $ 29,784 $ 520,437 Office supplies, stationery, and gift stores (NAICS 4532) $ 2,587,341 $ 1,038,535 $ 1,548,806 Office supplies and stationery stores (NAICS 45321) $ 1,085,674 $ 354,736 $ 730,938 Gift, novelty, and souvenir stores (NAICS 45322) $ 1,501,667 $ 683,799 $ 817,868 Used merchandise stores (NAICS 4533) $ 1,683,063 $ 4,783,476 - $ 3,100,413 Other miscellaneous store retailers (NAICS 4539) $ 6,619,272 $ 17,823,393 - $ 11,204,122 Pet and pet supplies stores (NAICS 45391) $ 1,901,731 $ 4,909,651 - $ 3,007,921 Art dealers (NAICS 45392) $ 1,113,789 $ 4,911 $ 1,108,878 Manufactured (mobile) home dealers (NAICS 45393) $ 719,427 $ 32,096 $ 687,331 All other miscellaneous store retailers (NAICS 45399) $ 2,884,326 $ 12,876,735 - $ 9,992,409 Tobacco stores (NAICS 453991) $ 716,132 $ 164,555 $ 551,577 All other miscellaneous store retailers (except tobacco stores) (NAICS 453998) $ 2,168,194 $ 12,712,180 - $ 10,543,986 Non-store retailers (NAICS 454) $ 91,115,880 $ 40,756,106 $ 50,359,775 Electronic shopping and mail-order houses (NAICS 4541) $ 86,350,194 $ 40,756,106 $ 45,594,087 Vending machine operators (NAICS 4542) $ 642,605 $ 0 $ 642,605 Direct selling establishments (NAICS 4543) $ 4,123,082 $ 0 $ 4,123,082 Fuel dealers (NAICS 45431) $ 1,992,503 $ 0 $ 1,992,503 Other direct selling establishments (NAICS 45439) $ 2,130,579 $ 0 $ 2,130,579 Food services and drinking places (NAICS 722) $ 63,691,368 $ 46,007,480 $ 17,683,887 Special food services (NAICS 7223) $ 5,094,671 $ 2,386,776 $ 2,707,896 Food service contractors (NAICS 72231) $ 4,028,278 $ 2,386,776 $ 1,641,503 Caterers (NAICS 72232) $ 971,608 $ 0 $ 971,608 Mobile food services (NAICS 72233) $ 94,784 $ 0 $ 94,784 Drinking places (alcoholic beverages) (NAICS 7224) $ 2,028,833 $ 1,024,066 $ 1,004,768 Restaurants and other eating places (NAICS 7225) $ 56,567,862 $ 42,596,639 $ 13,971,224 Full-service restaurants (NAICS 722511) $ 28,251,421 $ 18,394,734 $ 9,856,687 Limited-service restaurants (NAICS 722513) $ 24,027,367 $ 18,780,836 $ 5,246,531 Cafeterias, grill buffets, and buffets (NAICS 722514) $ 612,474 $ 526,249 $ 86,225 Snack and nonalcoholic beverage bars (NAICS 722515) $ 3,676,602 $ 4,894,820 - $ 1,218,219 GAFO* $ 113,998,778 $ 135,642,152 - $ 21,643,373 General Merchandise Stores-452 $ 66,624,398 $ 114,780,870 - $ 48,156,471 Clothing & Clothing Accessories Stores-448 $ 20,972,024 $ 7,383,987 $ 13,588,037 Furniture & Home Furnishings Stores-442 $ 11,178,077 $ 7,270,445 $ 3,907,632 Electronics & Appliance Stores-443 $ 6,925,956 $ 1,562,703 $ 5,363,254 Sporting Goods, Hobby, Book, Music Stores-451 $ 8,295,736 $ 4,643,109 $ 3,652,627 Office Supplies, Stationery, Gift Stores-4532 $ 2,587,341 $ 1,038,535 $ 1,548,806
Sitewise Online Retail Market Power Opportunity Gap Report By Retail Store Types Retail Market Power Opportunity Gap Report By Retail Store Types 2617 SE Grace Ave, Battle Ground, WA 98604 0 - 3 mi 2022 Demand 2022 Supply Opportunity Gap/Surplus
2617 SE Grace Ave, Battle Ground, WA 98604 Sitewise Online
Retail Market Power Opportunity Gap Report By Retail Store Types
Retail Market Power Opportunity Gap Report By
Retail Store Types
Retail Market Power data is derived from two major sources of information. The demand data is derived from the Consumer Expenditure Survey (CE Survey or CEX), which is fielded by the U.S. Bureau of Labor Statistics (BLS). The supply data is derived from the Census of Retail Trade (CRT), which is made available by the U.S. Census. Additional data sources are incorporated to create both supply and demand estimates. The difference between demand and supply represents the opportunity gap or surplus available for each merchandise line in the specified reporting geography. When this difference is positive (demand is greater than the supply), there is an opportunity gap for that merchandise line; when the difference is negative (supply is greater than demand), there is a surplus.
Copyright © 2022 Environics Analytics. All rights reserved.
2617 SE Grace Ave, Battle Ground, WA 98604 0 - 3 mi 2022 Demand 2022 Supply Opportunity Gap/Surplus