HELP ME CHOOSE THE RIGHT PATH FOR MY THESIS! 100 YEARS OF CHANGE IN THE ARCTIC
Who are the winners and losers?
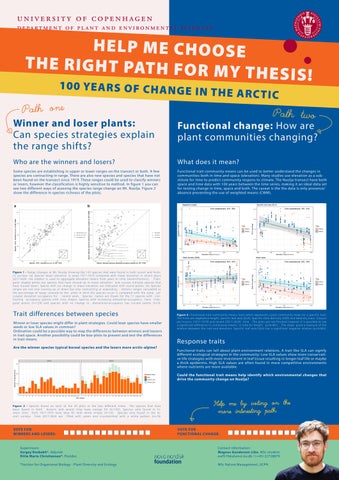
Some species are establishing in upper or lower ranges on the transect or both. A few species are contracting in range. There are also new species and species that have not been found on the transect since 1919. These ranges could be used to classify winners or losers, however the classification is highly sensitive to method. In figure 1 you can see two different ways of assesing the species range change on Mt. Nuolja. Figure 2 show the difference in species richness of the plots.
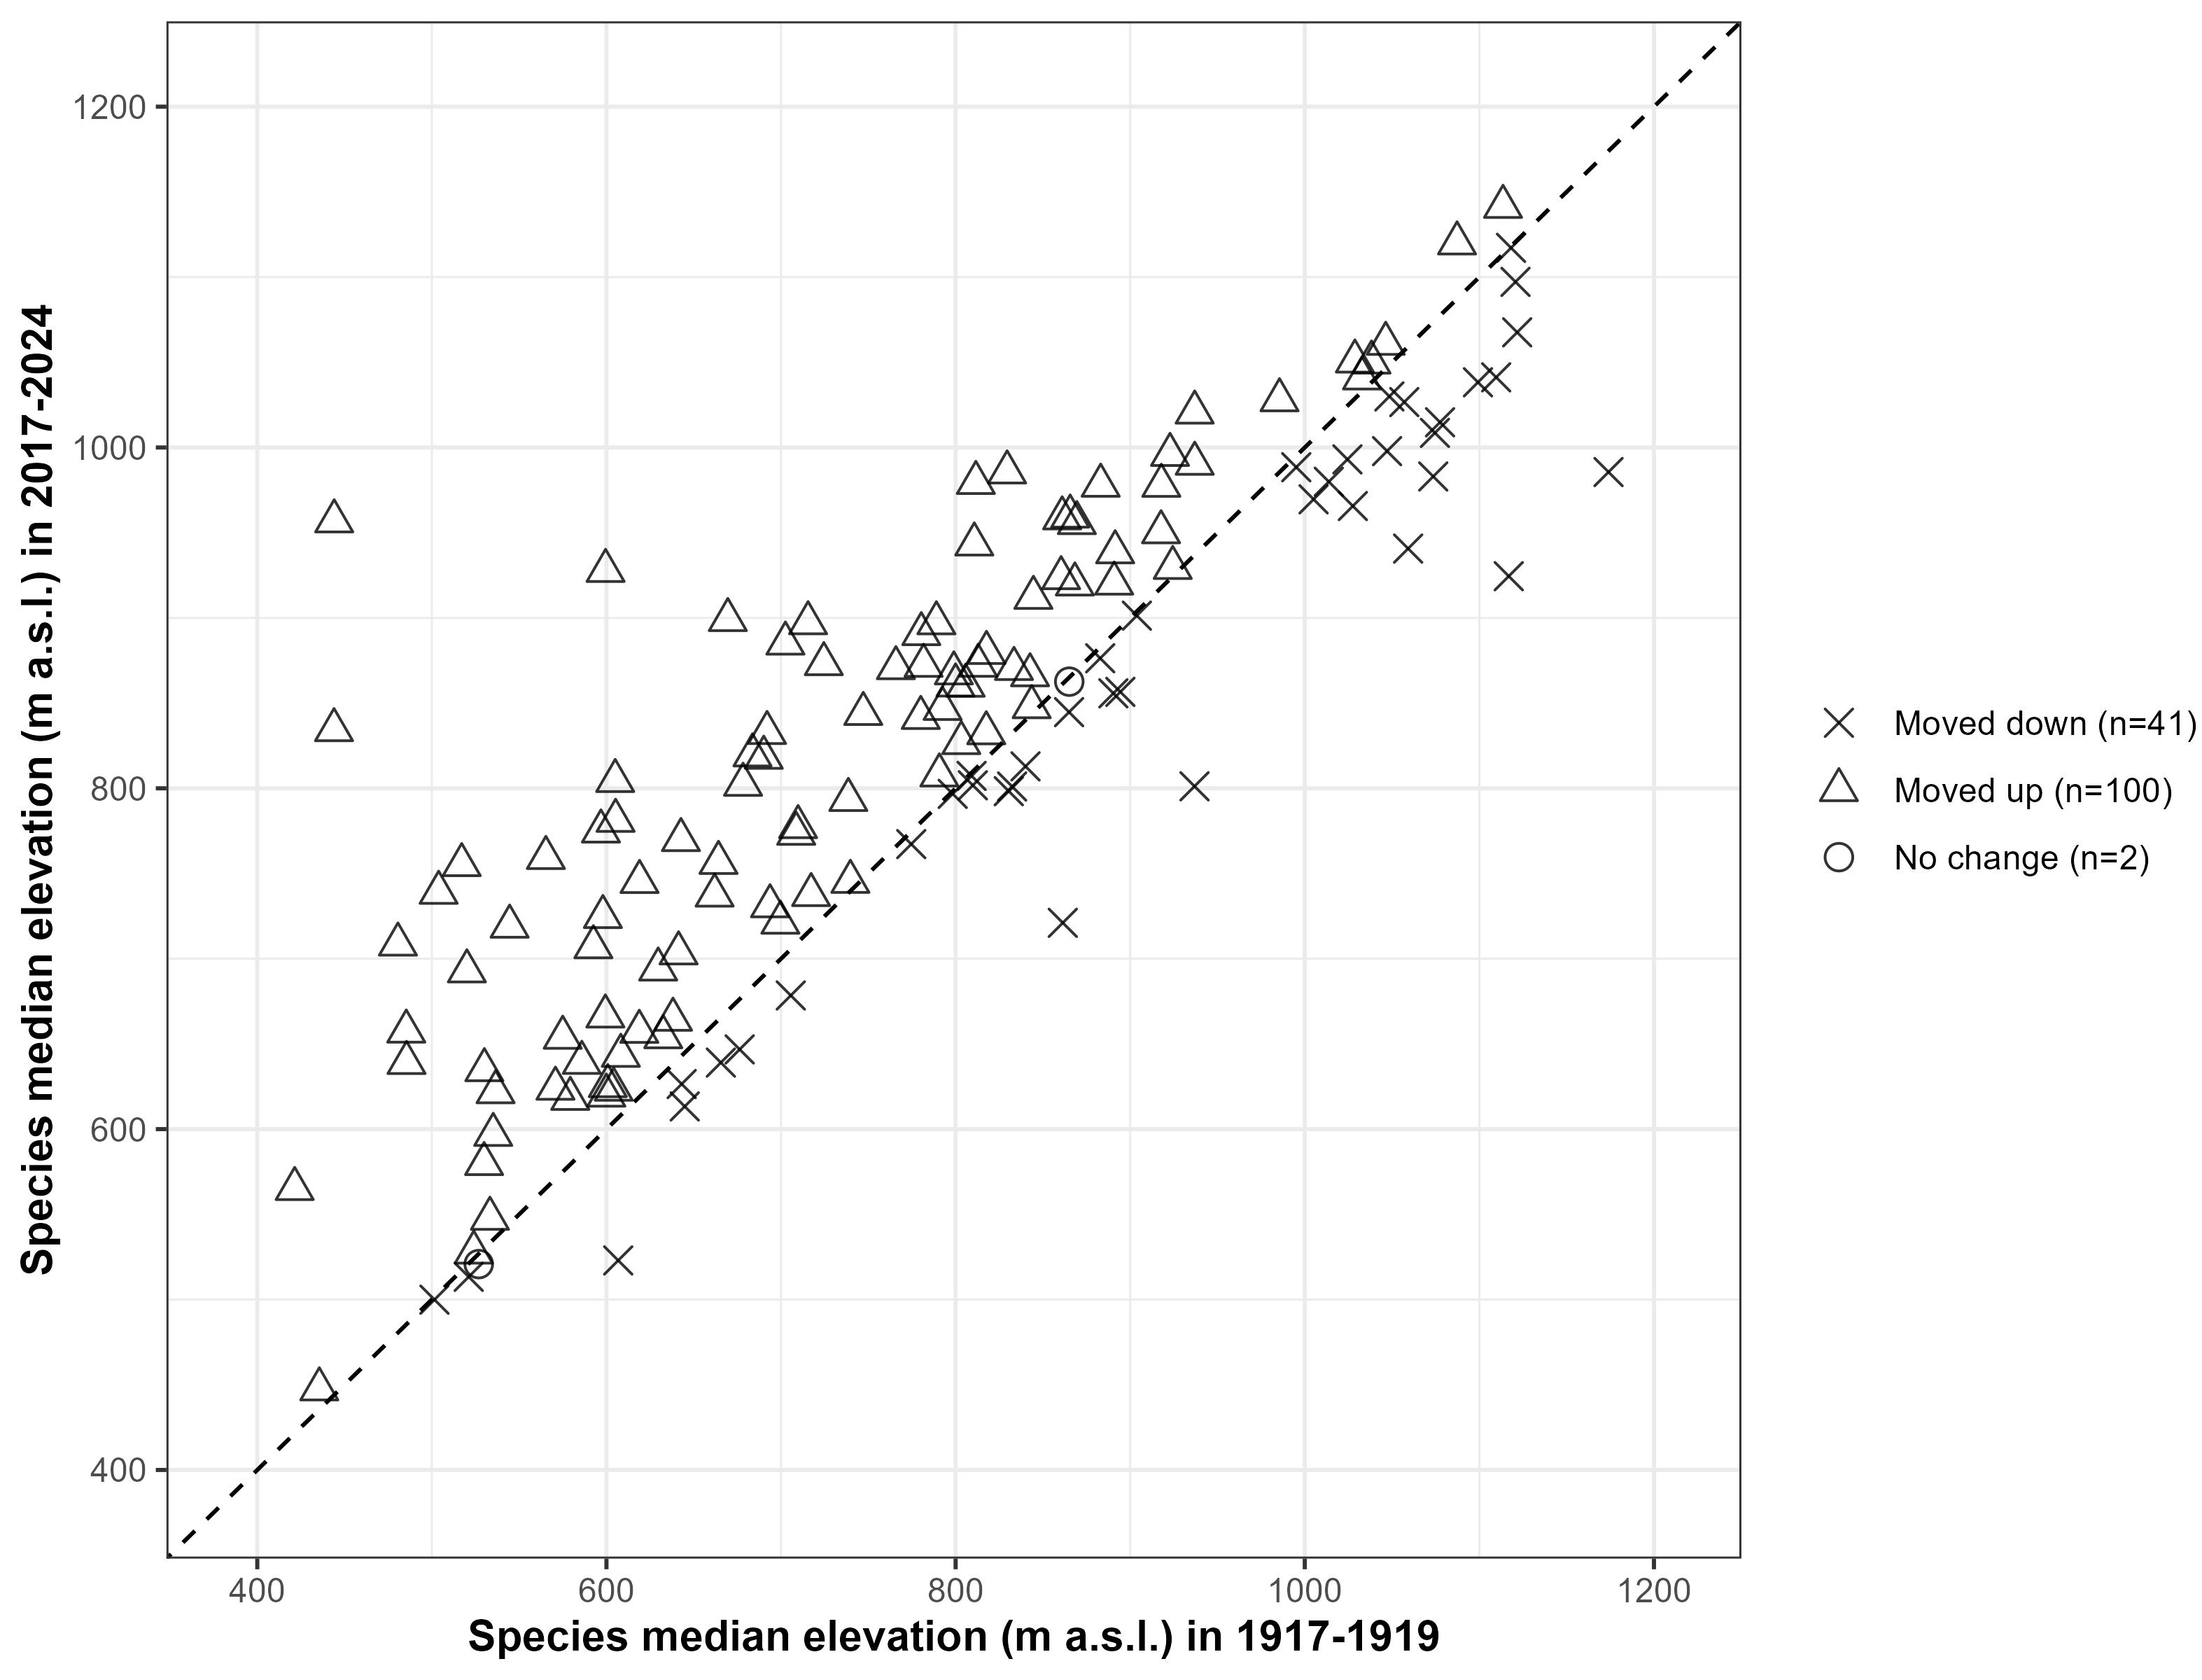
Figure 1 - Range changes at Mt. Nuolja showing the 143 species that were found in both recent and historic surveys. (a) Species mean elevation in years 1917-1919 compared with mean elevation in recent years 2017-2024, the median is used to aggregate elevation means from years to time (recent/historic). Triangular shaped points are species that have moved up in mean elevation and crosses indicate species that have moved down. Specie with no change in mean elevation are indicated with round points. (b) Species ranges are not only moving up or down but also contracting or expanding. Historic ranges calculated as the percentage of range covered by the plots in wich the species occur is compared with the same calculated elevation occupancy for recent years. Species names are shown for the 11 species with contracting occupancy (points with cross shape). Species with increasing altitudinal-occupancy have triangular points (n=129) and species with no change in elevational-occupancy has circular points (n=3)
Trait differences between species
Winner er loser species might differ in plant strategies. Could loser species have smaller seeds or low SLA values in common?
Ordination could be a possible way to map the differences between winners and loosers in trait space. Another possibility could be box-plots to present and test the differences in trait means.
Are the winner species typical boreal species and the losers more arctic-alpine?
What does it mean?
Functional trait community means can be used to better understand the changes in communities both in time and space (elevation). Many studies use elevation as a substitute for time to predict community respons to climate. The Nuolja transect have both space and time data with 100 years between the time series, making it an ideal data set for testing change in time, space and both. The caveat is the the data is only presence/ absence preventing the use of weighted means (CWM).
Figure 2 - Species found on each of the 20 plots in the two different times. The species that have been found in both historic and recent time have orange fill (n=143). Species only found in historic time from 1917-1919 have blue fill with white stripes (n=13). Species only found in the recent surveys from 2017-2024 are filled with green and crosshatched with a white pattern (n=76)
Supervisors: Sergey Rosbakh* , Adjunkt
Ditte Marie Christiansen* , Postdoc
Figure 3 - Functional trait community means. Each point represents a plot community mean for a specific trait. The Traits are vegetative height, specific leaf area (SLA), Specific stem densisty (SSD) and Seed dry mass. Colours are historic (1917-1919) and recent (2017-2024) time. The plots are not finished however it is possible to see a significant difference in community means in time for height (p=0.001) . The slope gives a measure of the relation between the trait and elevation. Specific leaf area (SLA) has a significant negative relation (p=0.003).
Response traits
Functional traits can tell about plant environment relations. A trait like SLA can signify different ecological strategies in the community: Low SLA values show more conservative life strategies with more investment in leaf tissue resulting in longer leaf life or maybe a thick epidermis. High SLA values are often found in more competitive environments where nutrients are more available.
Could the functional trait means help identify which environmental changes that drive the community change on Nuolja?