Spatial Sensation
DATA-DRIVEN APPROACHES TO MULTISENSORY DESIGN
Summer 2025 Research + Innovation Intern

Summer 2025 Research + Innovation Intern
This report investigates emerging approaches to the design and analysis of human sensation. It is written in a way that mirrored my process of discovery. As such, readers will encounter design theory, cognitive science, and computer programming as part of a single narrative. To ensure that this report is skimmable, I have implemented a legend-based system. Each icon below represents a different intended audience. However, a complete read-through is the best way to experience this research.
Conceptual summary and narrative exposition. Primary focus on big ideas.
Focus on design theory, precedent studies, and spatial concepts.
The “how”. Focus on methods of calculation, analysis, and data management.
Optical dominance:
When design relies too heavily on the visual sense to facilitate its functionality.
At its purest, architecture is a way to frame human experience. Our profession is privileged with a unique lens for understanding how humans navigate their world, and the tools to sculpt that experience. But over time, especially as design technology advances and the speed of production accelerates, the dependence of architecture on visual language has grown. Canadian architect Bruce Mau argues that “we have allowed two of our sensory domains—sight and sound—to dominate our design imagination. In fact, when it comes to the culture of architecture and design, we create and produce almost exclusively for one sense—the visual.” 1
This optical dominance causes us to create spaces that, at best, do not stimulate our other senses; and at worst lead to discomfort and even illness of inhabitants2. This can harm a design’s usability and performance, reducing the impact of a client’s investment. Conversely, expanding the scope of sensory activation within the design process allows us to create spaces that nourish their users, while leveraging human psychology to enrich programmatic functions and performance.
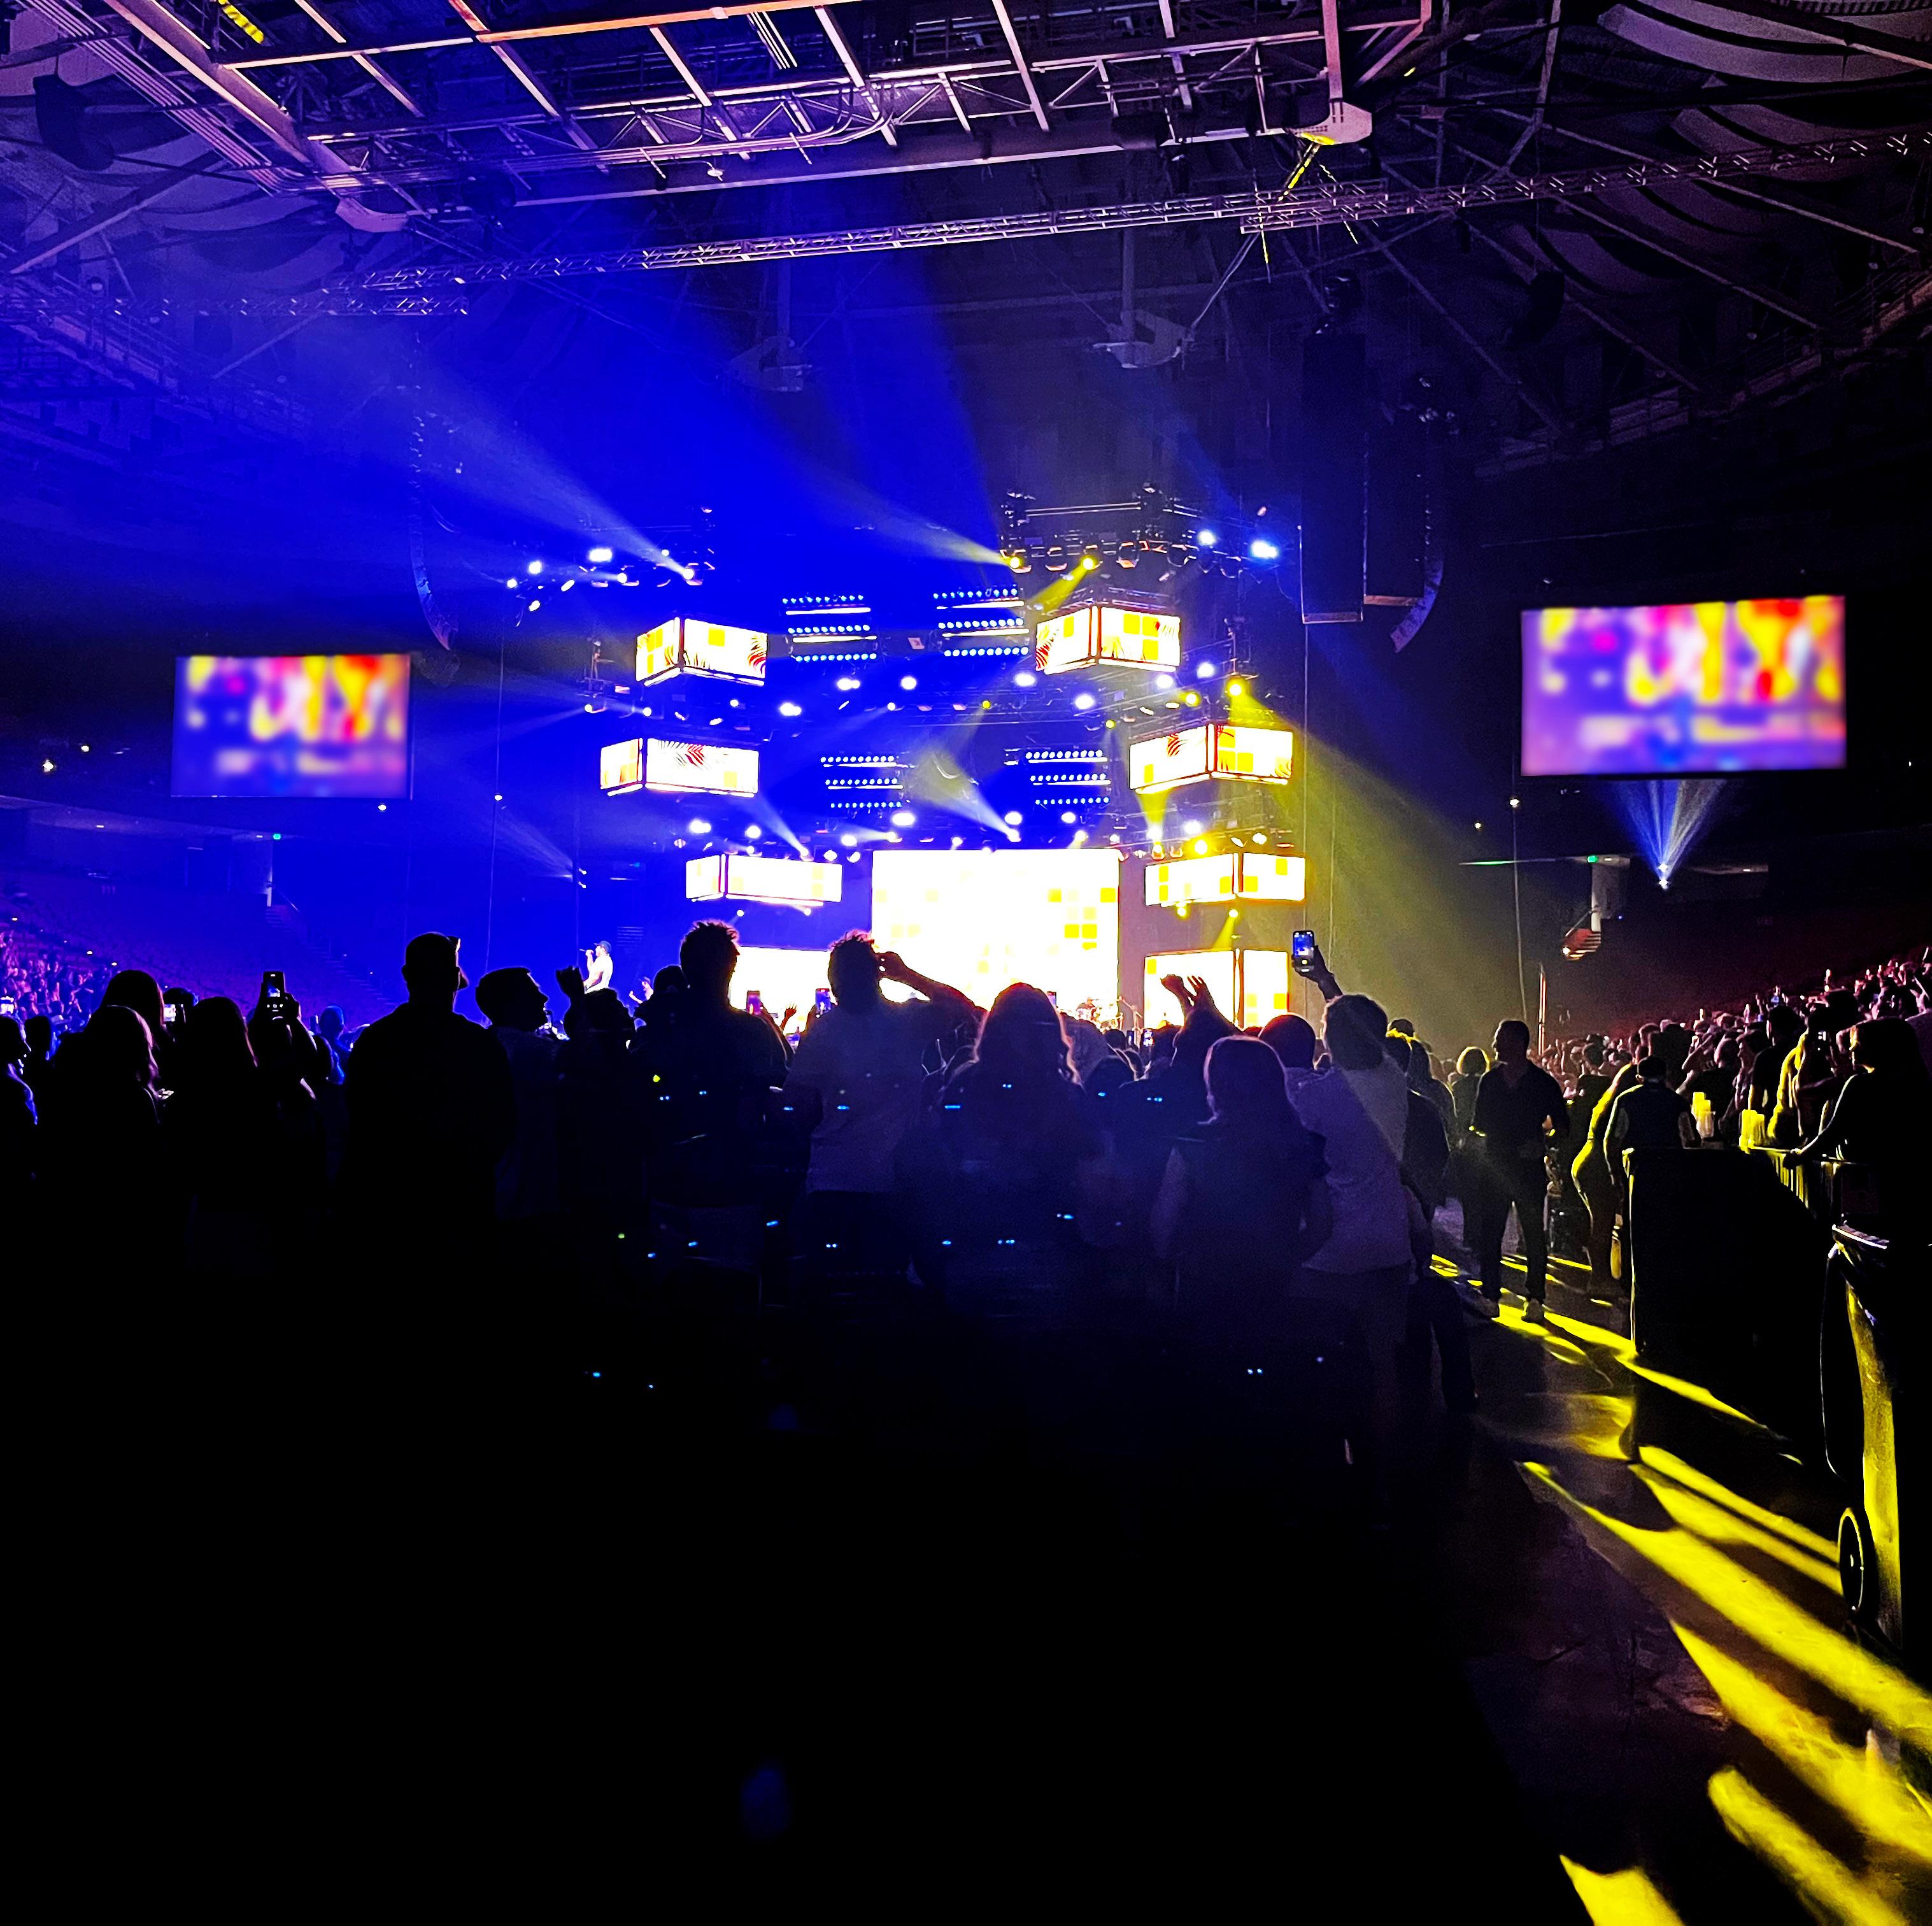
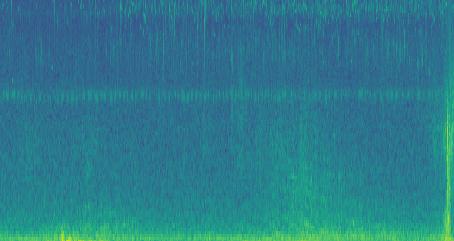
A graph of ambient noise in an urban environment.

Healthcare architecture provides abundant examples. It is no surprise that the sensory environment can reduce stress and accelerate healing, but the magnitude of these effects and the simplicity of eliciting them is surprising. In some cases, intentionally-designed soundscapes have been associated with faster recovery from cardiovascular stress in lab environments3 and reductions in the postoperative pain of child patients4. But these effects can also be negative. Examples of hyperacusis –intense, noise-induced ear pain caused by repeated exposure to loud environments -- are growing increasingly prevalent as urban environments get louder5.
“[Sensory elements] have been leveraged in past design to convey whether users ‘belong’.”
Sensory elements are also key in defining the identity of a space. Material textures, ambient noise, or even the wind can stick in the mind of a user and define a space as “unique.” This has also been leveraged in past design to convey whether users “belong,” in subtle or unsubtle ways6. This can be seen in the design language found in music venues: a disco club conjures a starkly different image from a warehouse hosting a punk show, and which environment is more attractive depends heavily on who you’re asking. When leveraged in an architectural context, these sensory markers can be used to create a specific identity for a space based on its intended users. This makes multisensory design an invaluable tool in crafting shared experiences and spaces that build community.
Multisensory elements help our brains understand the experience of moving through space. By building an understanding of how this process works, how we can manipulate it, and why it matters, we can design the spatial experience to elevate the human experience. This is the power of multisensory architecture.
One Space. Two Identities.


1. Abbas, Sarah, Nathalie Okdeh, Rabih Roufayel, Hervé Kovacic, Jean-Marc Sabatier, Ziad Fajloun, and Ziad Abi Khattar. “Neuroarchitecture: How the Perception of Our Surroundings Impacts the Brain.” Biology (Basel) 13, no. 220 (March 28, 2024): 4. https://doi.org/10.3390/biology13040220.
2. Spence, Charles. “Senses of Place: Architectural Design for the Multisensory Mind.” Cognitive Research: Principles and Implications 5, no. 1 (September 18, 2020): 3. https://doi.org/10.1186/s41235-020-00243-4.
3. Calcaterra, Valeria, Selene Ostuni, Irene Bonomelli, Simonetta Mencherini, Marco Brunero, Elisa Zambaiti, Savina Mannarino, et al. “Music Benefits on Postoperative Distress and Pain in Pediatric Day Care Surgery.” Pediatric Reports 6, no. 3 (September 29, 2014). https://doi.org/10.4081/pr.2014.5534.
4. Babisch, Wolfgang. “Cardiovascular Effects of Noise.” Noise and Health 13, no. 52 (2011): 201. https://doi.org/10.4103/1463-1741.80148.
5. Owen, David. “Is Noise Pollution the next Big Public-Health Crisis?” The New Yorker, 2019. https://www.newyorker.com/magazine/2019/05/13/ is-noise-pollution-the-next-big-public-health-crisis.
6. S Boucherit, Djihed Berkouk, Tallal Abdel, M Masullo, and L Maffei. “A Review of Inclusive Design and Multisensory Interactions Studies and Applications in Public Spaces.” IOP Conference Series 1113, no. 1 (December 1, 2022): 012017–17. https://doi.org/10.1088/1755-1315/1113/1/012017.
1. LS3P. “Adaptive Repositioning.” Issuu, March 24, 2025. https://issuu.com/ ls3p/docs/adaptive_repositioning.
Multisensory:
Engaging a network of multiple senses to communicate a message or idea.
The multisensory identity of a space is a sum of many parts. These parts are what we sense when we navigate a space, and are ultimately what contributes to our perception of it. But how does each sense affect our perception of space? And which ones should we prioritize in design?
Perception:
Our idea of a place. This can be purely visual, but likely includes invormation gathered by many senses.
These are questions that researchers in design and multisensory theory have been investigating for decades. Fortunately, a wealth of research and literature on the subject exists, outlining some foundational theories that can be adopted for multisensory architecture:
1. Human sensation exists in a hierarchy. Our brains dedicate different amounts of processing power to each of our senses1
2. The perceived identity of spaces and objects is a sum of sensory information processed by our bodies2.
3. Addressing multiple senses at once enables us to create architecture that nourishes the whole mind and increases design impact3
Re-creation of a sensory diagram originally designed by Morton Heilig to map the information gathered by our brains1

A key component of our frequent inclination towards design that prioritizes visual stimulation has to do with how our brains work. It is no secret that human capacity for sensation is heavily dependent on which sense we’re using. An early hierarchy for this capacity was established by virtual reality pioneer Morton Heilig, who theorized that different senses took up different amounts of a human’s attention: 70% for vision, 20% for sound, 5% for smell, 4% for touch, and just 1% for taste1. More scientific maps of our brain reveal that more than half of its cortex is dedicated to processing visual information4.
It’s unsurprising, then, that we are predisposed to use visual stimulation as our primary medium when designing space. Even the tools we use are overwhelmingly visual – sketching is an indispensable form of design communication5. How can we overcome this natural dependency to use our other senses in greater detail?
A potential answer can be found in the practice of deliberate sensory deprivation. Our brains have a certain amount of plasticity when it comes to how we sense things, and when one sense disappears, we perceive others more powerfully. This plasticity has been illustrated in cases of blindness, where the loss of visual information causes the brain to sharpen its perception of auditory stimuli6. By temporarily removing our ability to perceive visual aspects of space – both in the site analysis and design processes –we can perceive our other senses more deeply and begin to design spaces that nourish our whole brain. This practice is already being used in creative research methods7, and more widespread adoption could lead to a paradigm shift in the AEC industry’s approach to design thinking and representation.

Synesthaesia:
When senses stimulate each other in the human brain, leading to cross-sensory informational relationships. Common examples include seeing sounds or hearing colors.
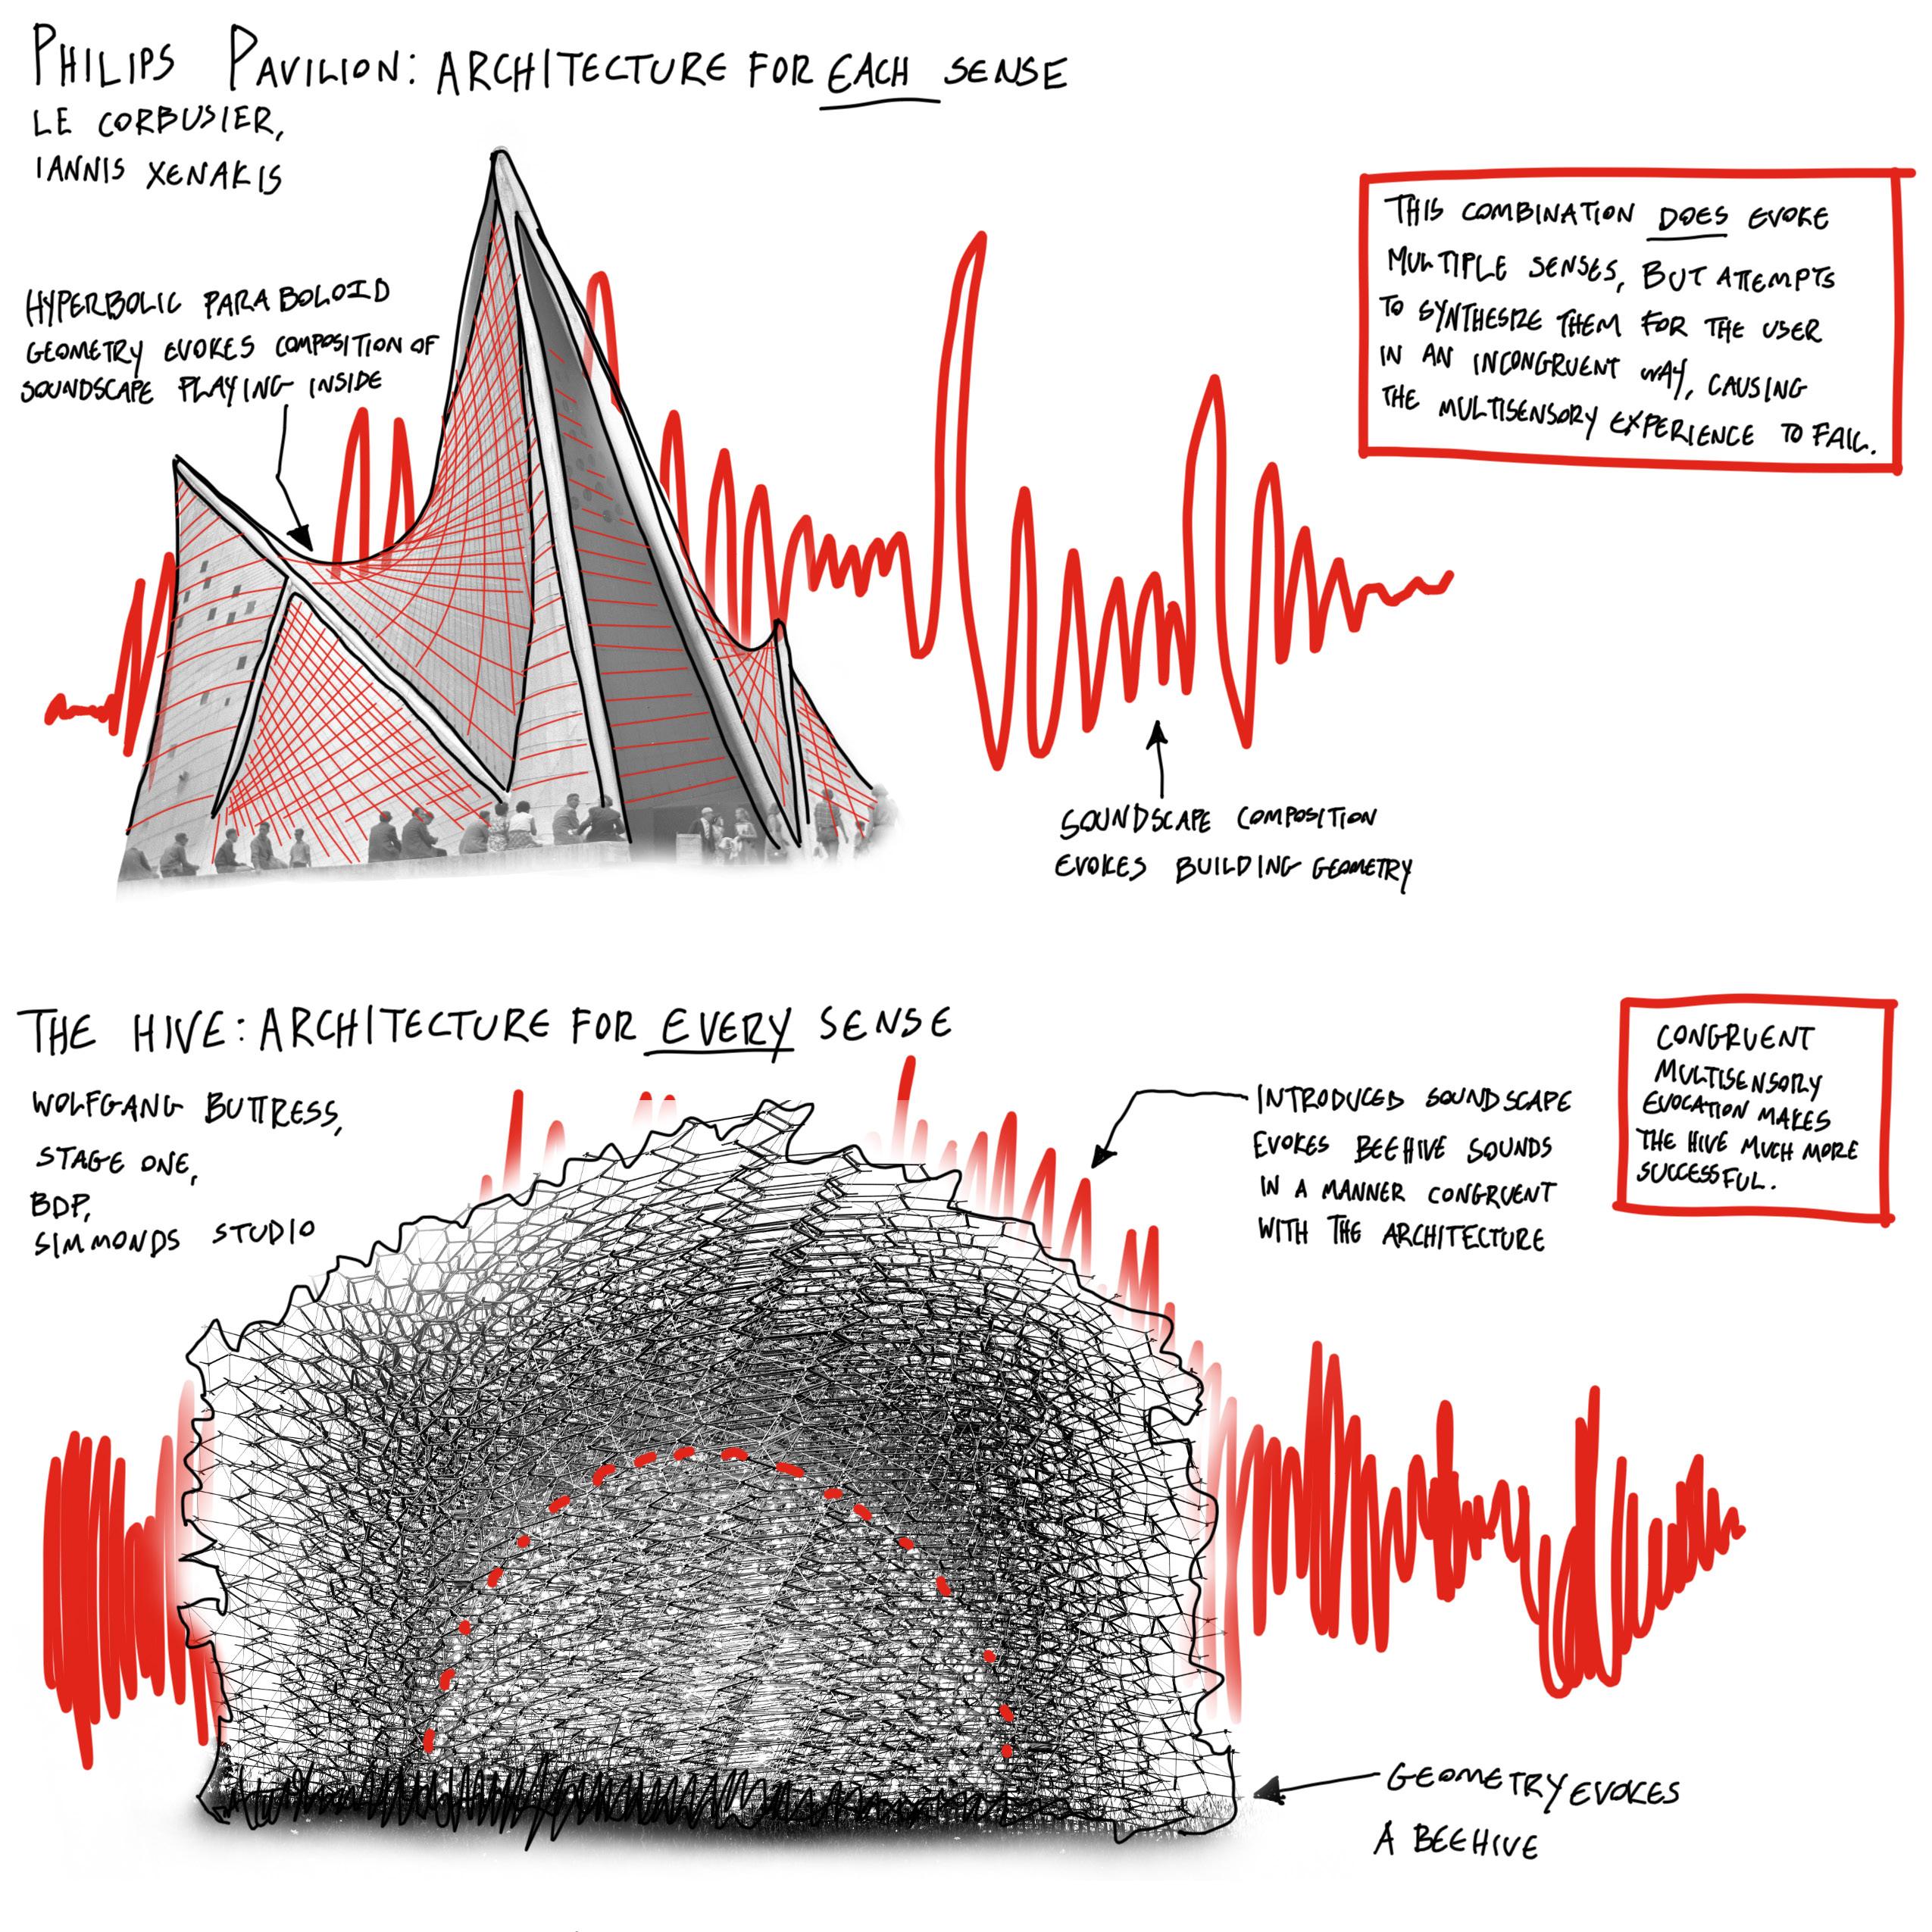
When thinking about the senses in relation to design, there are a few theoretical hurdles that are important to address. The most important of these is the difference between design for each of the senses and design for all of them. That distinction may seem silly, but it reflects two very different approaches to architecture and the brain.
Some theorists and designers in recent architectural history have recognized the importance of nonvisual stimuli in their work. Even as far back as 1958, Le Corbusier and avant-garde composer Iannis Xenakis attempted to elicit forced synesthaesia (seeing sound and hearing colors, for example) in their work on the Phillips Pavilion8. However, it was Finnish architect Juhani Pallasmaa who began to think about architecture as a multisensory phenomenon3. He was particularly critical of architecture’s status as a “retinal journey”9 at a time when emerging digital design approaches were pushing architecture towards sculpture and away from experience. He also proposed two additional senses to be included when discussing multisensory architecture: Proprioception and kinesthesia9.

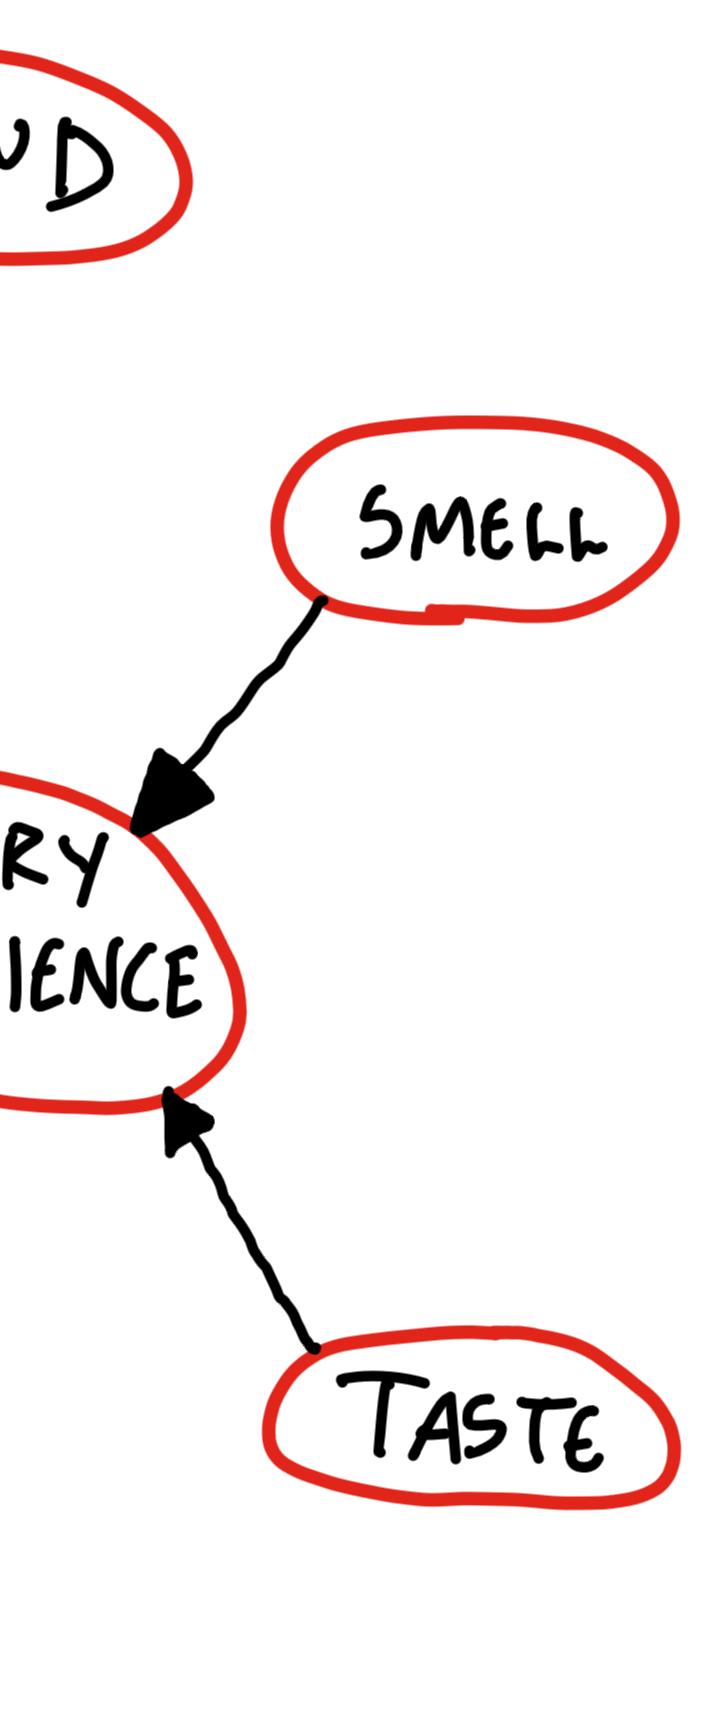
These proposed senses are important for two primary reasons. Practically, they give us more ways to think about how motion through space can elicit sensation and create feeling. But far more importantly, they provide an example for how human interpretation calls upon an intertwined network of senses. The experience of motion through space addresses many senses at once: your vision guides you towards a particular destination, the tactile experience of each step helps you track how far you’ve gone, your ears interpret what’s behind you, and so on. The inclusion of proprioception and kinesthesia in Pallasmaa’s writings on architectural sensation makes a case for the consideration of the human senses as a network-based system, rather than as individual interpreters of space. From this, we can extrapolate that spatial readings are facilitated by all components of this network, rather than individual senses.

Shitsukan:
A reading of an object and its quality. This factors in multisensory components like materiality, texture, size, weight, and color.
In neuroscience, multisensory readings of physical objects are called “shitsukan” – perceptions of material quality2. While being inherently multisensory, not all senses must be activated or engaged to render shitsukan. Take, for example, seeing a wooden table in a space. You’re not touching it, but you have an idea of how its texture might feel and how heavy it is. This overall experience you are drawing from is shitsukan.
This visual evocation of sensation gives us clues as to how we can weave multisensory experience into architecture. By drawing on our network of senses, we can evoke temperature and scent through views overlooking a garden, or image through sound from audio of a bubbling stream playing in a dark room.


What is the shitsukan of each material? How could we influence it through design?

Shitsukan is a valuable tool to formulate spatial identity through sensation and evocation, but it requires care in its implementation. A key pitfall of shitsukan-centered approaches is sensory incongruency, where the identities evoked by sensory elements contradict each other3. For example, a restaurant with a relaxed, refined visual atmosphere and a noisy, reverberant soundscape could produce confusion and agitation in guests trying to socialize10. In these situations, our brains must decide which sensory cues to follow and which to disregard, leading to conflicting reactions and behavior between users. This example illustrates that the very presence of sensory stimuli in architecture is not enough to create a positive impact. Rather, we must apply the same rigorous architectural storycraft to sensory elements that we do to visual and formal ones.
How can we draw upon these systems of sensation – both real and imagined – to create impactful architecture? We can begin to look for clues in precedent projects.
Wolfgang Buttress / Stage One / BDP / Simmonds Studio
Built exploration of the lives and perspectives of bees. This sculpture/ architecture has been exhibited twice: first at the 2015 Milan Expo and now permanently at Kew. The core structure is an inhabitable 17m cuboid truss meant to evoke the interlocking structure of a beehive. This is static but serves as the frame for a dynamic installation that amplifies/actuates activity found in beehives. This activity is driven by accelerometer data collected in real time from beehives around Kew Gardens. The motion of the bees causes fluctuations in the 1000-LED array that is mounted to the overall structure and drives an artificial symphony that can be heard within the structure. During the Milan Expo installation, the Hive’s surroundings were populated with raised beds containing pollinator grasses, giving visitors a “bee’s-eye” view of the landscape.
This system is a compelling example of how a combination of architecture, sensing, and actuation can reveal the invisible and create desirable, programmable space in the process. It is worth noting that the Milan Expo installation also contained event space, control rooms, and a kitchen. The permanent Kew installation contains a large void beneath the structure that is used as flexible event space. It also features a station where visitors can listen to/feel inaudible vibrations that bees use to communicate.
This project illustrates how multisensory elements can facilitate architectural worldbuilding in highly constrained spaces2.
Responds to its spatial situation not only through static form, but through dynamic performance. Pulse (Janet Echelman) is integrated into the fountain, spraying steam as trains pass underneath. This brings the workings of the city’s public transit system to the human scale and celebrates them. Both static and dynamic versions of this celebration are present. While Pulse is built into the site, glass pavilions provide a more static allusion to the role that public transit and human-scale access plays in Philadelphia’s urban fabric. Paths in the fountain (which shoot up steam when Pulse is active) trace the subway lines that cross beneath Dilworth Park.
Dilworth Park illustrates how multisensory elements can bring the unseen workings of space into view, using them to build a unique spatial identity3.
Carsten Nicolai
Painted fence. This piece visualizes the sonification of the Olympic rings. It’s quite abstract - however, I have included it as a concise example of a simple, static, design that still communicates the nature of sound. There is a lot of rhythm going on - there are five cycle groups, each at a different scale. This shifts a user’s perception of space as they navigate through the pattern.
Aside from its literal sonic meaning, the pattern is meant to represent the looping nature of the Olympic games. It might be interesting to adapt this conceptual approach to represent the temporal progression of a game or event in an arena. This could be achieved through transcription of swells in the volume of a crowd, or by devising some kind of algorithm.
IFO spectrum is a compelling example of how multisensory elements can be evoked for visual storytelling. Although it is a very abstract example, it contextualizes how simple the implementation of shitsukanbased design can be4.
Sensation is important in every work of architecture, but in some cases, leveraging it can have dramatic practical implications for the functionality of spatial programming. There is no better case for the magnitude of this fact than arenas. These spaces must fulfill many programmatic roles at the same time — namely, crucial infrastructural functions like the safe movement of people, equipment, and merchandise. The use of multisensory design is critical for juggling all these requirements.
Multisensory design is also an indispensable tool for designers looking to create unique, equitable experiences in these spaces. Humans gather in large groups for many reasons, often with an undertone of celebration. Arenas serve as a space for these gatherings, facilitating fandom, entertainment, and community. When we enter spaces like this, our senses are inundated with sights, sounds and smells. Even taste plays a factor, and touch is stimulated through kinesthetic and proprioceptive engagement as referenced above.
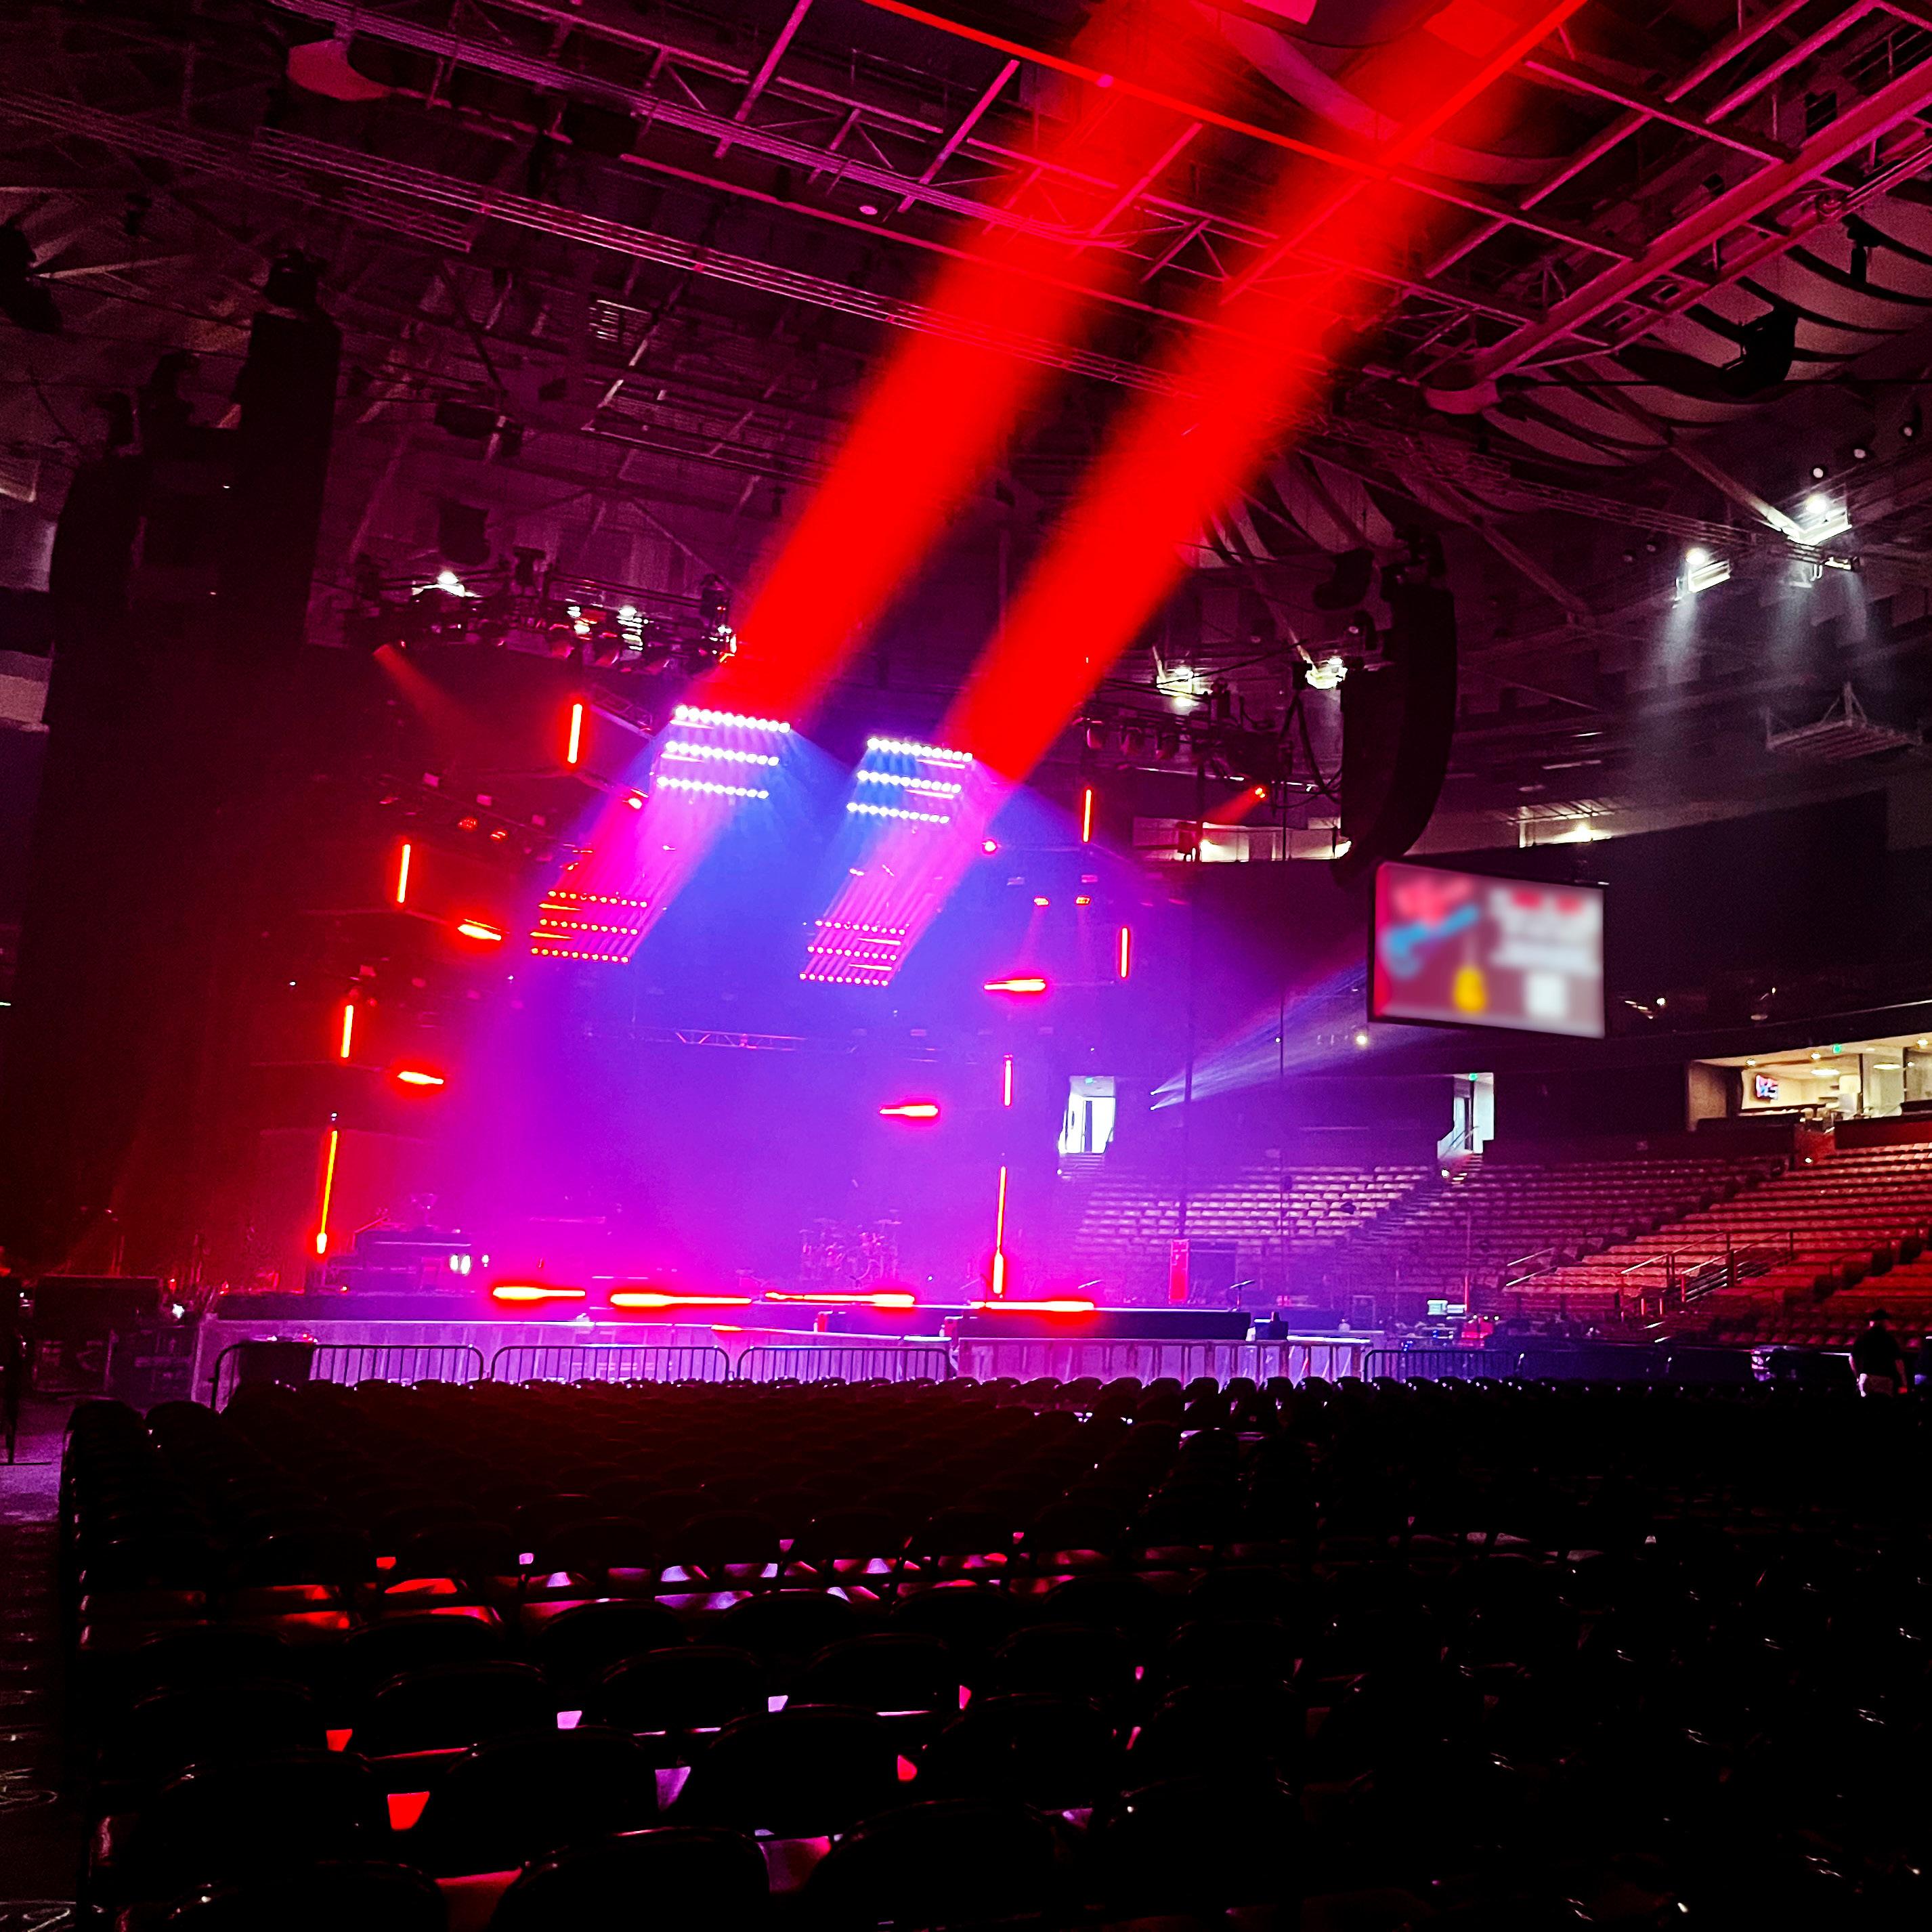
Light, sound, kinesthesis, and smell are all heavily stimulated by an arena environment.

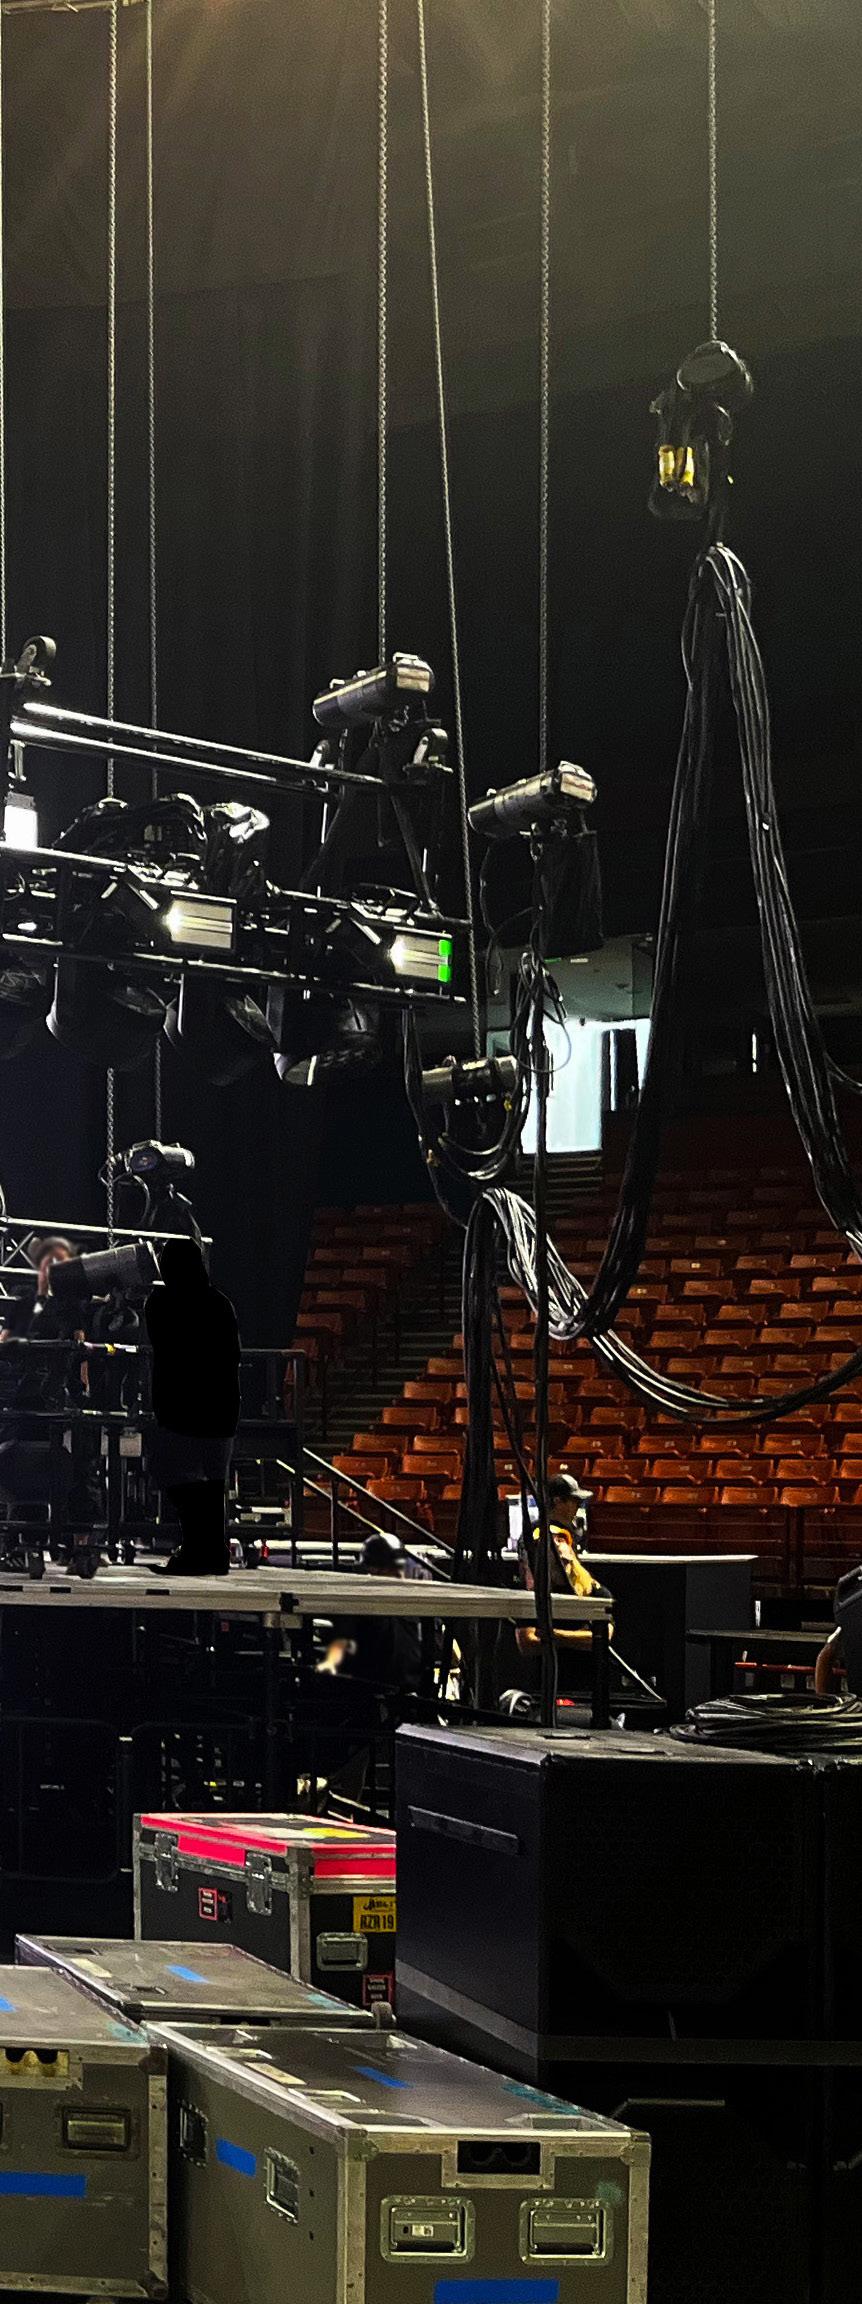
Everyone should be allowed an equal level of access to the unique spatial experience of an arena. This doesn’t just apply to the audience – arenas are spaces of sensation for the athletes, performers, and tour crew members who make experiences possible. As such, creating spaces that balance safety, efficiency, and functionality is an issue of equitable design. Multisensory approaches can help us juggle these lofty goals to create spaces that nourish the mind, serve the community, and maximize client investments, all at the same time.
1. Heilig, Morton Leonard. “EL Cine Del Futuro: The Cinema of the Future.” Presence: Teleoperators and Virtual Environments 1, no. 3 (January 1992): 279–94. https:// doi.org/10.1162/pres.1992.1.3.279.
2. Komatsu, Hidehiko, and Naokazu Goda. “Neural Mechanisms of Material Perception: Quest on Shitsukan.” Neuroscience 392 (November 2018): 329–47. https://doi.org/10.1016/j.neuroscience.2018.09.001.
3. Spence, Charles. “Senses of Place: Architectural Design for the Multisensory Mind.” Cognitive Research: Principles and Implications 5, no. 1 (September 18, 2020): 3. https://doi.org/10.1186/s41235-020-00243-4.
4. Felleman, D. J., and D. C. Van Essen. “Distributed Hierarchical Processing in the Primate Cerebral Cortex.” Cerebral Cortex 1, no. 1 (January 1, 1991): 1–47. https://doi.org/10.1093/cercor/1.1.1.
5. Goel, Vinod. “Sketches of Thought,” 1995. https://doi.org/10.7551/ mitpress/6270.001.0001.
6. Huber, Elizabeth, Kelly Chang, Ivan Alvarez, Aaron Hundle, Holly Bridge, and Ione Fine. “Early Blindness Shapes Cortical Representations of Auditory Frequency within Auditory Cortex.” Journal of Neuroscience 39, no. 26 (June 26, 2019): 5143–52. https://doi.org/10.1523/JNEUROSCI.2896-18.2019.
7. Henshaw, Victoria, Kate McLean, Dominic Medway, Chris Perkins, and Gary Warnaby. Designing with Smell. Routledge, 2017.
8. Samuel Zwerger. “Notation as Design. Iannis Xenakis’s Philips Pavilion.” GAM, August 5, 2022. https://gam.tugraz. at/2022/08/05/13-12-zwergen-samuel-notation-as-design/.
9. Holl, Steven, Juhani Pallasmaa, and Alberto Pérez Gómez. Questions of Perception : Phenomenology of Architecture. San Francisco: William Stout ; Tokyo, 2008.
10. Blesser, Barry, and Linda-Ruth Salter. Spaces Speak, Are You Listening? : Experiencing Aural Architecture. Cambridge (Massachusetts) ; London: The Mit Press, 2009.
11. Esposito, Dario, Stefania Santoro, and Domenico Camarda. “Agent-Based Analysis of Urban Spaces Using Space Syntax and Spatial Cognition Approaches: A Case Study in Bari, Italy.” Sustainability 12, no. 11 (June 5, 2020): 4–5. https://doi.org/10.3390/su12114625.
12. Perkins, Chris, and Kate McLean. “Smell Walking and Mapping.” Manchester University Press EBooks, April 30, 2020. https://doi.org/10.7765/9781526152 732.00017.
13. McLean, Kate. “Smellfie Kit.” Sensory Maps, 2020. https://sensorymaps.com/ wp-content/uploads/2024/07/Smellfie_Kit_2020_compressed.pdf.
1. Heilig, Morton Leonard. EL Cine Del Futuro: The Cinema of the Future. January 1992. Print. Presence: Teleoperators and Virtual Environments. Vol. 1. https://doi. org/10.1162/pres.1992.1.3.279.
2. Hadden, Mark. The Hive at Kew Gardens. n.d. Photograph. https://www. wolfgangbuttress.com/the-hive-at-kew.
3. Echelman, Janet. Pulse. 2018. Photograph. https://www.echelman.com/project/ pulse.
4. Carsten Nicolai’s Artwork on Olympic Park Fence. 2012. Photograph. https:// www.migso-pcubed.com/case-studies/london-olympics-case-study/.
Qualitative:
Pertaining to data that cannot directly be numericalized. This data is often experiential including texture, color, or weight.
Design-related data can take a number of different forms, but collection and analysis approaches usually operate in a qualitative or quantitative way. This limitation is useful because it allows designers to assemble different analytical toolsets for different applications. Traditionally, qualitative data is collected through creative or experiential research methods, while quantitative data is collected using modeling, simulation, and computational analysis.
Quantitative:
Data that is numerical and can be counted using our traditional approach to mathematics.
However, this is not always the case. Advanced design theory allows us to blur the categorical boundary, quantifying experience and qualifying numbers.
By building a deeper understanding of data collection and analysis methods, we can begin assembling a toolkit that will allow us to blend the best aspects of qualitative and quantitative approaches. This toolkit in turn opens new doors to new multisensory design solutions.

Creative Research Method:
A method for data collection that falls outside of the traditional, often quantitative-first practices of academia and the sciences. These methods can be very rewarding, giving us access to new kinds of qualitative information.
How can we create architecture based on something as subjective as the human experience?
Traditional methods of qualitative data collection are typically non-numerical. This means that they are collected without the use of mathematical or scientific instruments, relying instead on creative methods that allow users to express their experience in a replicable way. These approaches often rely on a focus group, which is composed of people who can be thought of as “sensory agents.” The term “agent” – an individual entity within a system who can perceive and interact with their environment and other agents – is borrowed from Agent-Based Modeling, a quantitative approach to build a more robust understanding of multisensory experience within a space, and even begin to visualize it through more traditional mapping methods1.
A great example of qualitative data collection at the intersection of sensation and architecture is Kate McLean’s Smellfie Kit, a guide to “smellwalking”2, or more broadly, “sensewalking”. This guide serves as a precedent for architects looking to implement similar approaches in their space analysis process, laying out structures for the assessment, organization, and recording of olfactory data, a type of sensory data that is nearly impossible to capture but is incredibly impactful in building a user’s perception, identity, and memory of a place.
Kate McLean’s smell map of Amsterdam1.

To explore a space guided only by one’s non-visual senses, sometimes through intentional sensory deprivation. Sensewalking can trick our brain into making new readings about a place.
McLean relies on four key “stages” to facilitate the sensewalking process. In stage one, users center themselves, refocusing their senses to use smell as the primary source of spatial information. By relying on the nose as a replacement for the eyes, sensewalkers experience the world through an altered state of perception3.
Swapping one sense for another also helps our brain overcome informational limitations outlined in Research Foundations. When we are able to perceive all 5 senses fully, less than 1% of all sensory information processed by our brain has anything to do with smell4.
After removing sight from that equation, that percentage rises to around 8%. The removal of sound and taste causes the percentage to rise even more. This phenomenon underscores why we need to center a single sensory phenomenon in the qualitative analysis process: it allows us to feel and perceive in great detail, giving us the amount of information needed to begin thinking about how to sculpt an experience.
Sensory exploration through smellwalking2.

A “net” smell that describes the prevailing olfactory reading of a sensewalked space. The development of these sensory summaries allows us to pursue new mapping methods that break away from traditional cartographic conventions. Could we do the same with sound, touch, and even taste to create a purely experience-informed map of space?
Stages two and three of McLean’s sensewalking toolkit focus on active exploration of place and space through smell. In stage two, this is done using the guidance of a sensewalker’s other senses, while stage three employs a combination of guided and unguided exploration. What’s most interesting about this portion of her process is not her proposed methods of exploration, but her approach to data collection. McLean gives her sensewalkers a table to record four “smellnotes” per stage of the process, along with a final “summary smell” created by the user in stage four.
The user also records qualities of the smell – namely intensity, duration, how much they liked/disliked it, and if they expected it – allowing McLean to compare the collected data in a way that is both qualitative and quantitative. By providing a pre-existing data recording structure for users, McLean greatly simplifies the amount of effort it takes for users to understand and communicate their sensory experience, and makes it easier for her to compare and act on data later. This could be further simplified through a digital version of the smellnote table that is accessible through the web.
McLean’s smellnotes provide a strong precedent for other forms of qualitative data collection for a range of senses, especially when quantitative analysis approaches are too time-consuming or cumbersome to justify. By giving a focus group a fixed approach by which to analyze a space, and a fixed set of parameters by which to record its qualities, we can employ an agent-based approach similar to what we could simulate on a computer.
The difference is that the agents in this participatory approach to data collection are not approximations of people, but people themselves. They navigate space in a context- and perceptionbased way that a computer will never be able to fully capture5.
A smellprint describing the synthesis of a place’s sensory elements into a perceived identity3.
“Sensewalking can be used to assess the function and performance of many aspects of existing construction.”
One of the most powerful aspects of Smellfie-style analysis is its versatility. Sensewalking is applicable across pretty much any scale and doesn’t require any specific focus group size. It can also be done completely analog if necessary. Technology might be helpful for the processing and visualization of data, but it’s not crucial to its collection.
Finally, sensewalking can be applied in contexts that stretch far beyond smell. Since it is a tool for recording place-based perception, sensewalking can be used to assess the function and performance of many aspects of existing construction, fitting into existing evaluation structures like the AIA’s Framework for Design Excellence. Particularly when it comes to focus areas like Design for Well-Being, sensewalking can be used to map zones of comfort, social nourishment, and movement6. In the same manner, it can also give us clues as to why spaces might not be functioning as intended.
It is important to remember that sensewalking is based on the subjective perception of a space’s users, rather than objective data or science. So, while it may not always make logical sense, the data that this qualitative analysis process renders are often closely tied to how users perceive a space2.
Creative research methods can also facilitate participatory design5.

The applications of sensewalking are many, limited only by a project’s access to time and participants. One drawback of the approaches laid out by the Smellfie Kit is that they require significant forethought before deployment, requiring architects to refine a specific and limited set of conditions they wish to analyze. As with anything subjective, there are also implicit biases
in both the facilitators and participants in this process. The impact of these biases could be reduced with a larger focus group, but that increases the overall length and complexity of the analysis process.
Some of these issues could also be solved with emerging technologies. By digitizing Smellfie-style analysis, we could reduce the time required
to process data and even integrate qualitative maps into a BIM framework, making them more actionable in the design process. Extended reality technologies like virtual reality and mixed reality could also let us practice sensewalking at different stages throughout the design process.
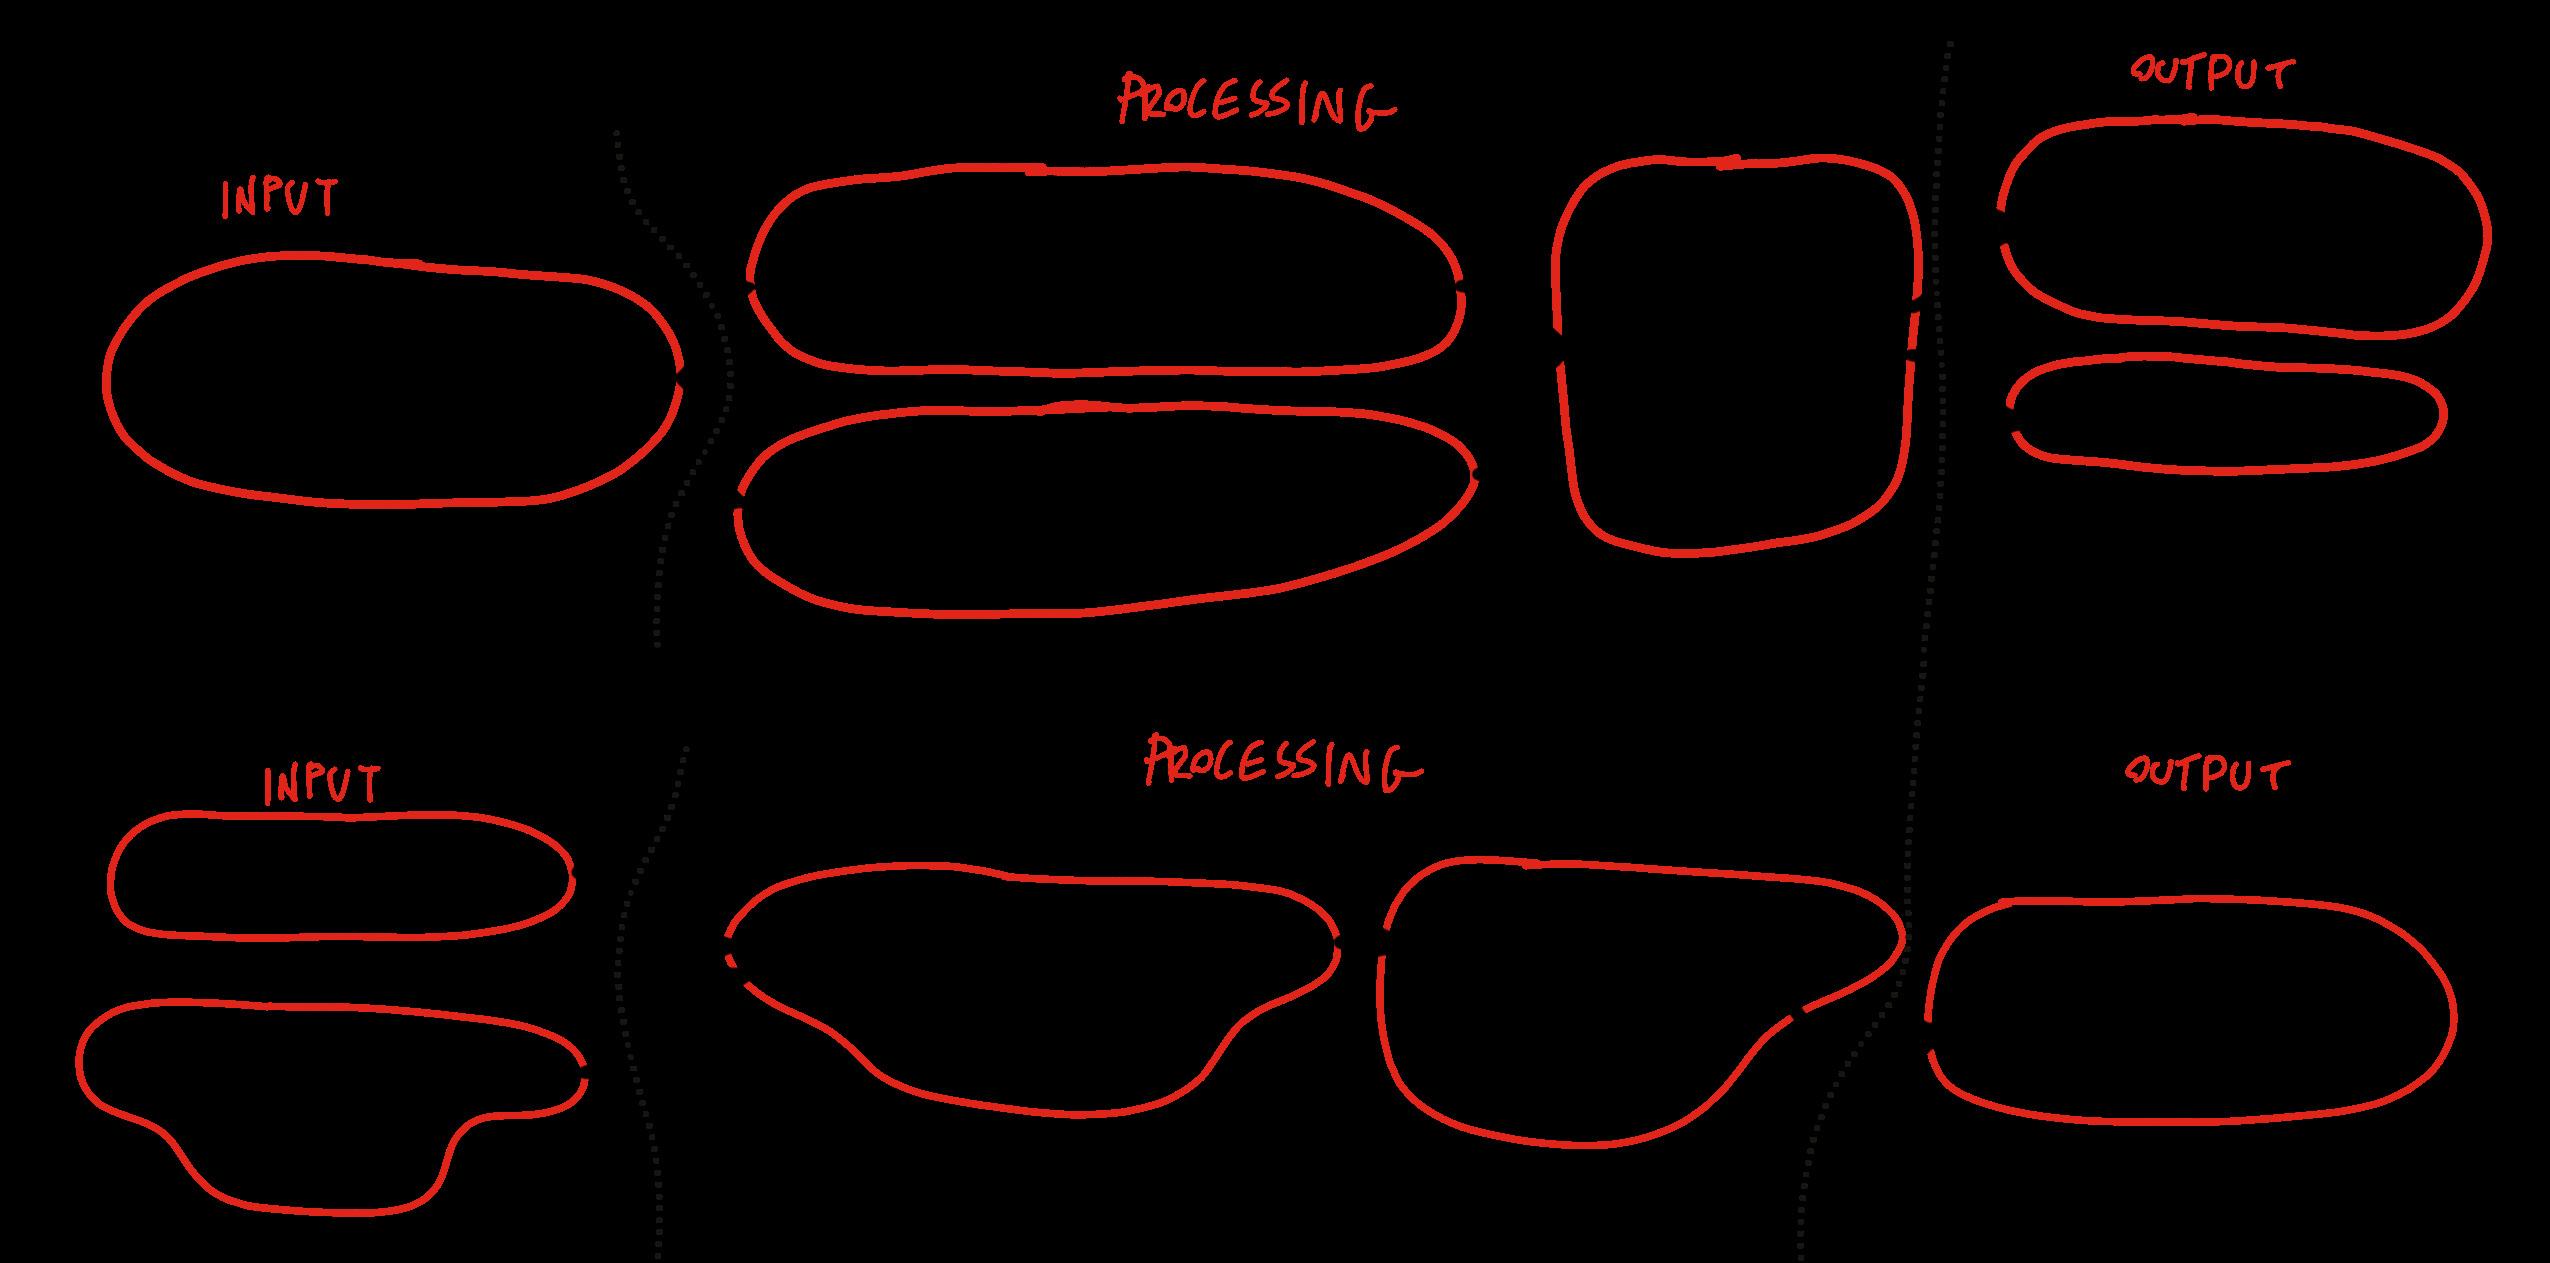
“Sound- and vision-driven spatial experience can be thought of as a system. Our eyes and ears pass perceived geometry, program, and sound to our brains as inputs. Our brain processes this data and outputs all kinds of readings. These include information about how comfortable, loud, or busy a space may be, even going so far as to pull us toward certain spots in a room. “
How can we understand and quantify elements such as acoustics, visibility, flow, and space syntax to make better design decisions?
Aspects of spatial experience that interface with our senses of sight and sound are much easier to record but require more detailed and structured analysis to leverage in architectural design. While these aspects of space could be assessed using qualitative sensewalking methods, sight, and sound are more closely tied to building geometry, creating opportunities for quantitative exploration that still speak to human experience7.
Sound- and vision-driven spatial experience can be thought of as a system. Our eyes and ears pass perceived geometry, program, and sound to our brains as inputs. Our brain processes this data and outputs all kinds of readings. These include information about how comfortable, loud, or busy a space may be, even going so far as to pull us toward certain spots in a room.
By understanding how these readings are made and simulating them in proposed designs, we can use human psychology as a design tool to create spaces that are more comfortable and efficient.
A re-creation of the graph of complexity-based spatial relationships in a theoretical floorplan6
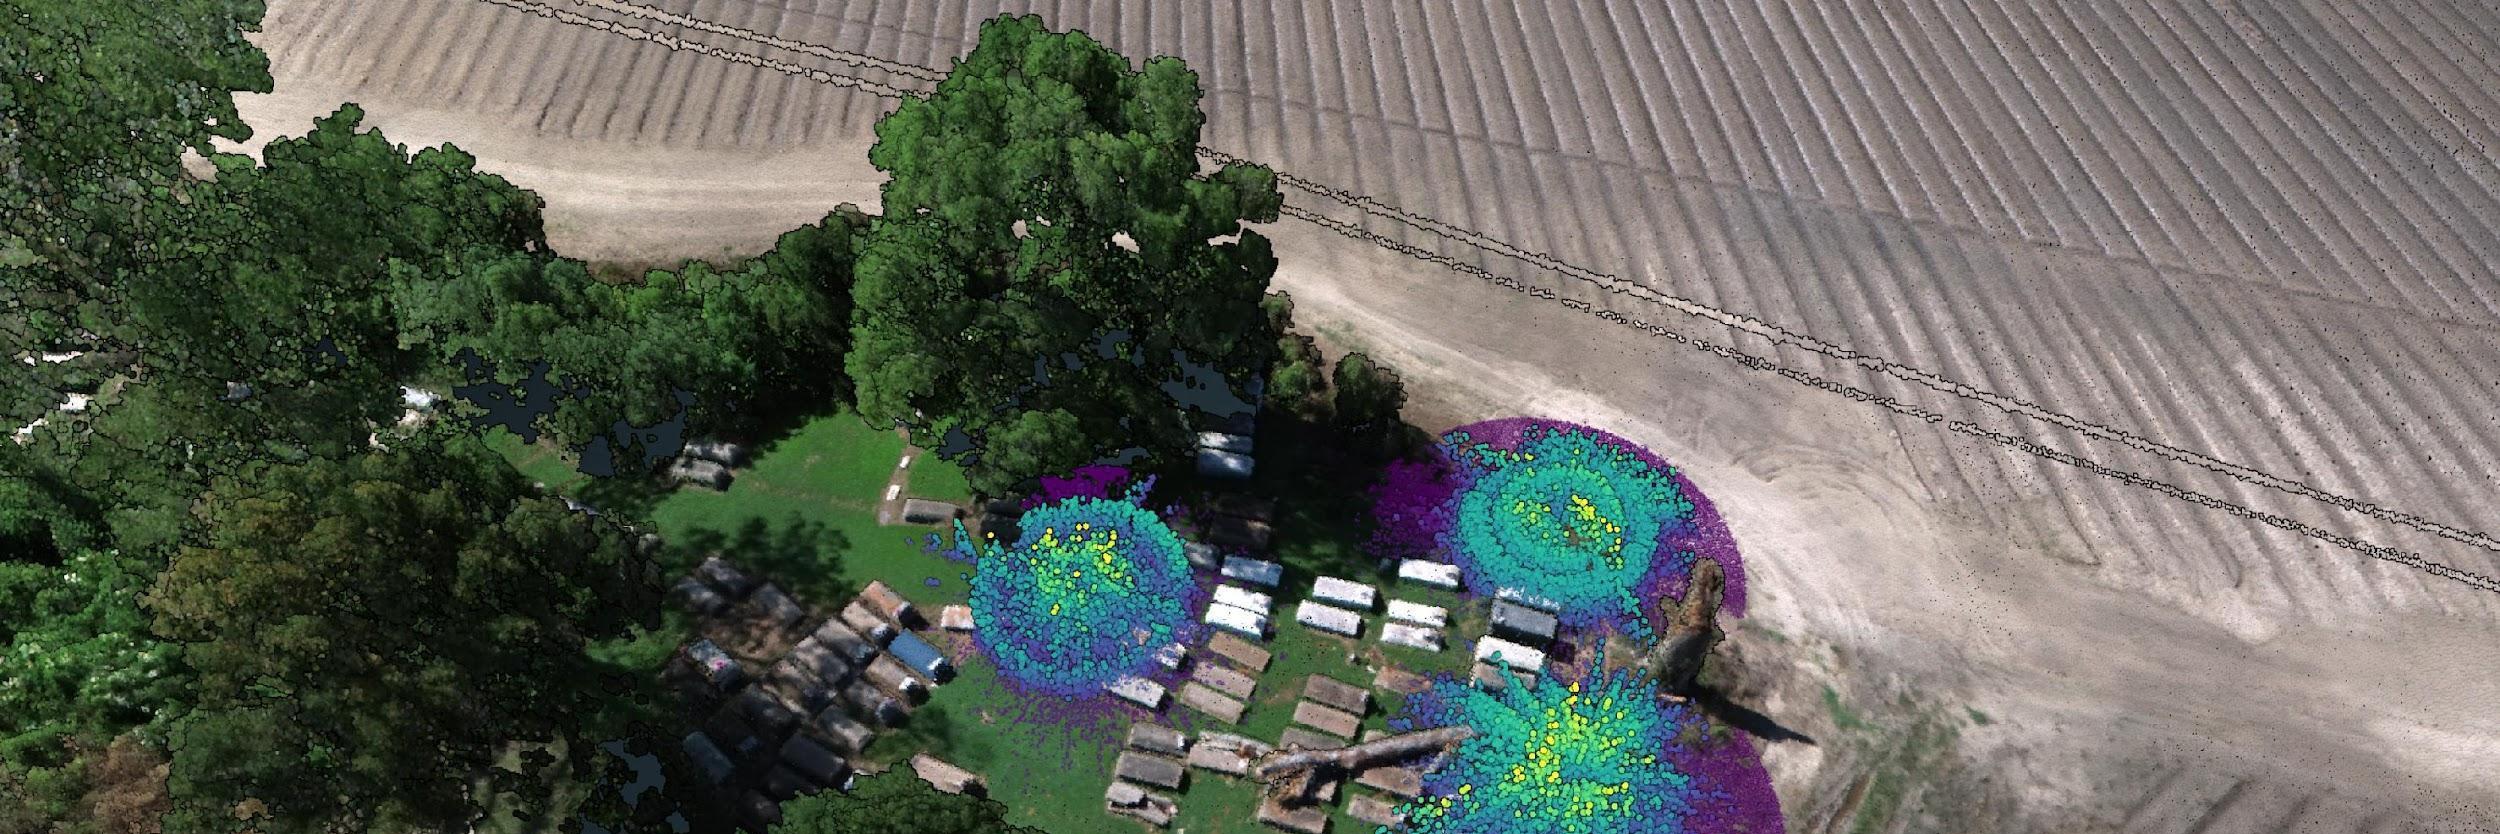

Soundscape visualizations mapped onto their corresonding location in a 3D-scanned landscape7

Decoding the links between building geometry, vision, and our brains is crucial for this process. Fortunately, there is a deep body of research into visibility, spatial connection, and how to make inferences about psychological readings using architectural
Recent technological advances in the AEC industry have also made it easier to conduct this kind of analysis. The widespread adoption of BIM and rapid advances in 3D scanning mean we can capture building geometry with ease. Separately, architectural theorists like Michael Benedikt, Bill Hiller, and J.A.F. Teklenburg have developed a multitude of equations that allow us to infer spatial readings . But the two have not evolved in tandem. Spatial reading analysis has largely operated in two dimensions, hampering its adoption as a tool for the multidisciplinary design of spatial experience. By developing an enhanced, BIM-adaptive approach to the computation of spatial experience, LS3P can create highperformance design and defend its value proposition to clients.
In this way, the computational analysis of spatial experience can act as a tool and framework to promote design excellence.

Computational Design:
An approach to design thinking that uses math, algorithmic repetition, and code to solve design challenges.
Computational design allows us new ways of understanding what’s going on in the spaces we design. This is particularly true in complex projects. It’s not any one software or tool, but rather an approach that leans into the math, code, and data that underpin the digital practice pipelines we use every day.
It can speed up the design process through automation and smart BIM practices, but that’s not its main purpose. Rather, it gives us the ability to assess otherwise-unseen patterns and building performance, making it a tool to push design excellence to new heights10.
The utility of computational design does come with caveats. Knowledge-based barriers to entry and limited access to computing power make computational design analysis a non-universal solution when creating sensory experiences. Scale and scope are very important, especially when you’re problem-seeking and don’t have a well-defined idea of what you’re looking for10 .
The intuitive way to think about this limitation is through a cost/ benefit relationship. Before conducting a computational analysis, it is important to think about whether the benefits (potential conclusions or inferences) justify the cost (the difficulty, time, and digital resources needed to run this process. Most analyses are not strenuous enough that this relationship plays a huge role, but large models and detailed simulations require forethought and planning.
A piece of code that traces paths between an origin point and a boundary object. In this case, the origin represents a user in a space, while the boundary represents room geometry.
Vector Calculator:
A piece of code that computes data for points along a traced path using linear algebra. This veector-based calculation is crucial when working with space syntax.
To explore various analysis techniques and develop a refined, unified approach to the computational analysis of spatial experience, I developed a group of data processing and computational design tools that can be run within a BIM environment.
To do this required careful consideration of the cost/benefit relationship, especially since my goal was to implement these tools on a large, highly complex Revit model in a case study. My computational design explorations left me with custom tools tailored to the analysis of spatial experience and rapid iteration upon the resulting information. These tools include:
• Room Engine: An algorithm to identify rooms, creating highperformance representations of their interior geometry.
• Syntax Suite: A raytracer and vector calculator to compute and map psychological effects of space within a 3D model.
I also used Pachyderm Acoustics11, a hybrid acoustical simulation, to conduct iterative acoustical studies. Its materials-based approach and highly detailed simulation engine makes it an invaluable tool at a variety of scales.

A computational practice where the behavior of “agents” -- in this case, approximations of different users in a space --are modeled to analyze their actions and interactions.
Qualitative and quantitative approaches may seem like they sit opposite each other, but they go hand in hand.
Qualitative approaches are far more trustworthy, because even though they aren’t empirical and require more effort to complete, they are structured on the sensation and experience of real people. However, quantitative approaches render objective information in detail, and in cases where analysis is limited or where there is a high degree of programmatic complexity, they can be more useful.
My case study addresses a space that is so highly specialized and flexible that it would be impossible to render sufficient design data from a single approach.
By deploying these approaches in their distinct use cases, we can assemble a patchwork understanding of spatial experience that helps us push design excellence to new heights.
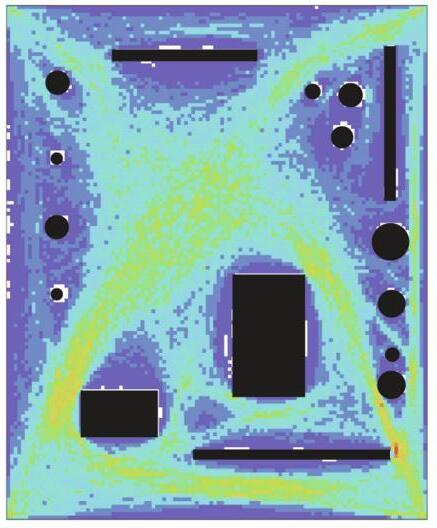
Computational agent-based modeling techniques to assess pedestrian circulation in a hypothetical park8.
1. Esposito, Dario, Stefania Santoro, and Domenico Camarda. “Agent-Based Analysis of Urban Spaces Using Space Syntax and Spatial Cognition Approaches: A Case Study in Bari, Italy.” Sustainability 12, no. 11 (June 5, 2020): 4–5. https:// doi.org/10.3390/su12114625.
2. Perkins, Chris, and Kate McLean. “Smell Walking and Mapping.” Manchester University Press EBooks, April 30, 2020. https://doi.org/10.7765/978152615273 2.00017.
3. McLean, Kate. “Smellfie Kit.” Sensory Maps, 2020. https://sensorymaps.com/wpcontent/uploads/2024/07/Smellfie_Kit_2020_compressed.pdf.
4. Zimmermann, M. “The Nervous System in the Context of Information Theory.” Human Physiology, 1989, 166–73. https://doi.org/10.1007/978-3-642-73831-9_7.
5. Chopra, Ayush, Shashank Kumar, Nurullah Giray-Kuru, Ramesh Raskar, and Arnau Quera-Bofarull. “On the Limits of Agency in Agent-Based Models.” ArXiv (Cornell University), September 14, 2024. https://doi.org/10.48550/arxiv.2409.10568.
6. American Institute of Architects. “AIA Framework for Design Excellence.” www.aia.org, n.d. https://www.aia.org/design-excellence/ aia-framework-design-excellence.
7. Hillier, B. “The Hidden Geometry of Deformed Grids: Or, Why Space Syntax Works, When It Looks as Though It Shouldn’t.” Environment and Planning B: Planning and Design 26, no. 2 (April 1999): 169–91. https://doi.org/10.1068/b4125.
8. Mohamed, Abdelbaseer A., and Claudia van der Laag Yamu. “Space Syntax Has Come of Age: A Bibliometric Review from 1976 to 2023.” Journal of Planning Literature 39, no. 2 (October 19, 2023): 203–17. https://doi. org/10.1177/08854122231208018.
9. Davis, Larry S., and Michael L. Benedikt. “Computational Models of Space: Isovists and Isovist Fields.” Computer Graphics and Image Processing 11, no. 1 (September 1979): 49–72. https://doi.org/10.1016/0146-664x(79)90076-5.
10. Atherton, Ethan. “Empowering Innovation with Computational Design.” LS3P, July 7, 2025. https://issuu.com/ls3p/docs/ empowering_innovation_with_computational_design.
11. Harten, Arthur van der. “Pachyderm Acoustical Simulation: Towards OpenSource Sound Analysis.” Architectural Design 83, no. 2 (March 2013): 138–39. https://doi.org/10.1002/ad.1570.
1. McLean, Kate. Spring Scents & Smells of the City of Amsterdam. 2014. Print. https://sensorymaps.com/?projects=smellmap-amsterdam.
2. McLean, Kate. “Smellwalk Intro Kit,” May 2020. 2. https://sensorymaps.com/ wp-content/uploads/2020/05/Smellwalk_Intro_Kit_%C2%A9KateMcLean_2015_ compressed.pdf.
3. McLean, Kate. What Smells like “Home” to You? December 8, 2017. Atlas Obscura. https://www.atlasobscura.com/articles/art-mapping-smellsmellscapes-kate-mclean.
4. McLean, Kate. Smellwalking Guide. 2020. Photograph. Smellfie Kit 2020. https://sensorymaps.com/wp-content/uploads/2024/07/Smellfie_Kit_2020_ compressed.pdf.
5. Willis, Jane, and Rebecka Fleetwood-Smith. Sensing Spaces of Healthcare. 2024. https://hospitalsenses.co.uk/wp-content/uploads/2024/02/sensing-spaces-ofhealthcare_creative-study_evaluation-report_final_14.02.24.pdf.
6. Chou, Richard. “Space Syntax: Urban Network & Spatial Relations.” Data Mining the City, March 22, 2022. https://medium.com/data-mining-the-city-2022/ space-syntax-urban-network-spatial-relations-7679de91beb.
7. Brooks, Joseph, Carlos Roman, Brendan Harmon, Annicia Streete, and Nicholas Serrano. “Visualizing Spatial Audio in Digital Landscapes.” Journal of Digital Landscape Architecture 10 (July 2025): 547.
8. Yamu, Claudia, and Akkelies van Nes. Introduction to Space Syntax in Urban Studies. S.L.: Springer Nature, 2021.
“Some shows at the Well have brought up to 27 semi trailers’ worth of lights, sound, and other equipment.”
The Well is a midsize arena in Greenville, South Carolina. Home to the Greenville Swamp Rabbits hockey team, it also hosts a wide variety of touring shows of all genres, from rock to ice skating to country music. The Well is facing a challenge—as the production value around touring acts continues to increase, so too does the technical and logistical complexity of hosting them.
Some shows at the Well have brought up to 27 semi trailers’ worth of lights, sound, and other equipment. Like many other arenas throughout the United States, the Well was designed in the late 1980’s, built in the early 1990’s, and hasn’t really had a major update since. This makes it increasingly difficult for the arena to maintain relevance in the southeastern US tour circuit, especially as other arenas begin to update their facilities or are constructed anew.
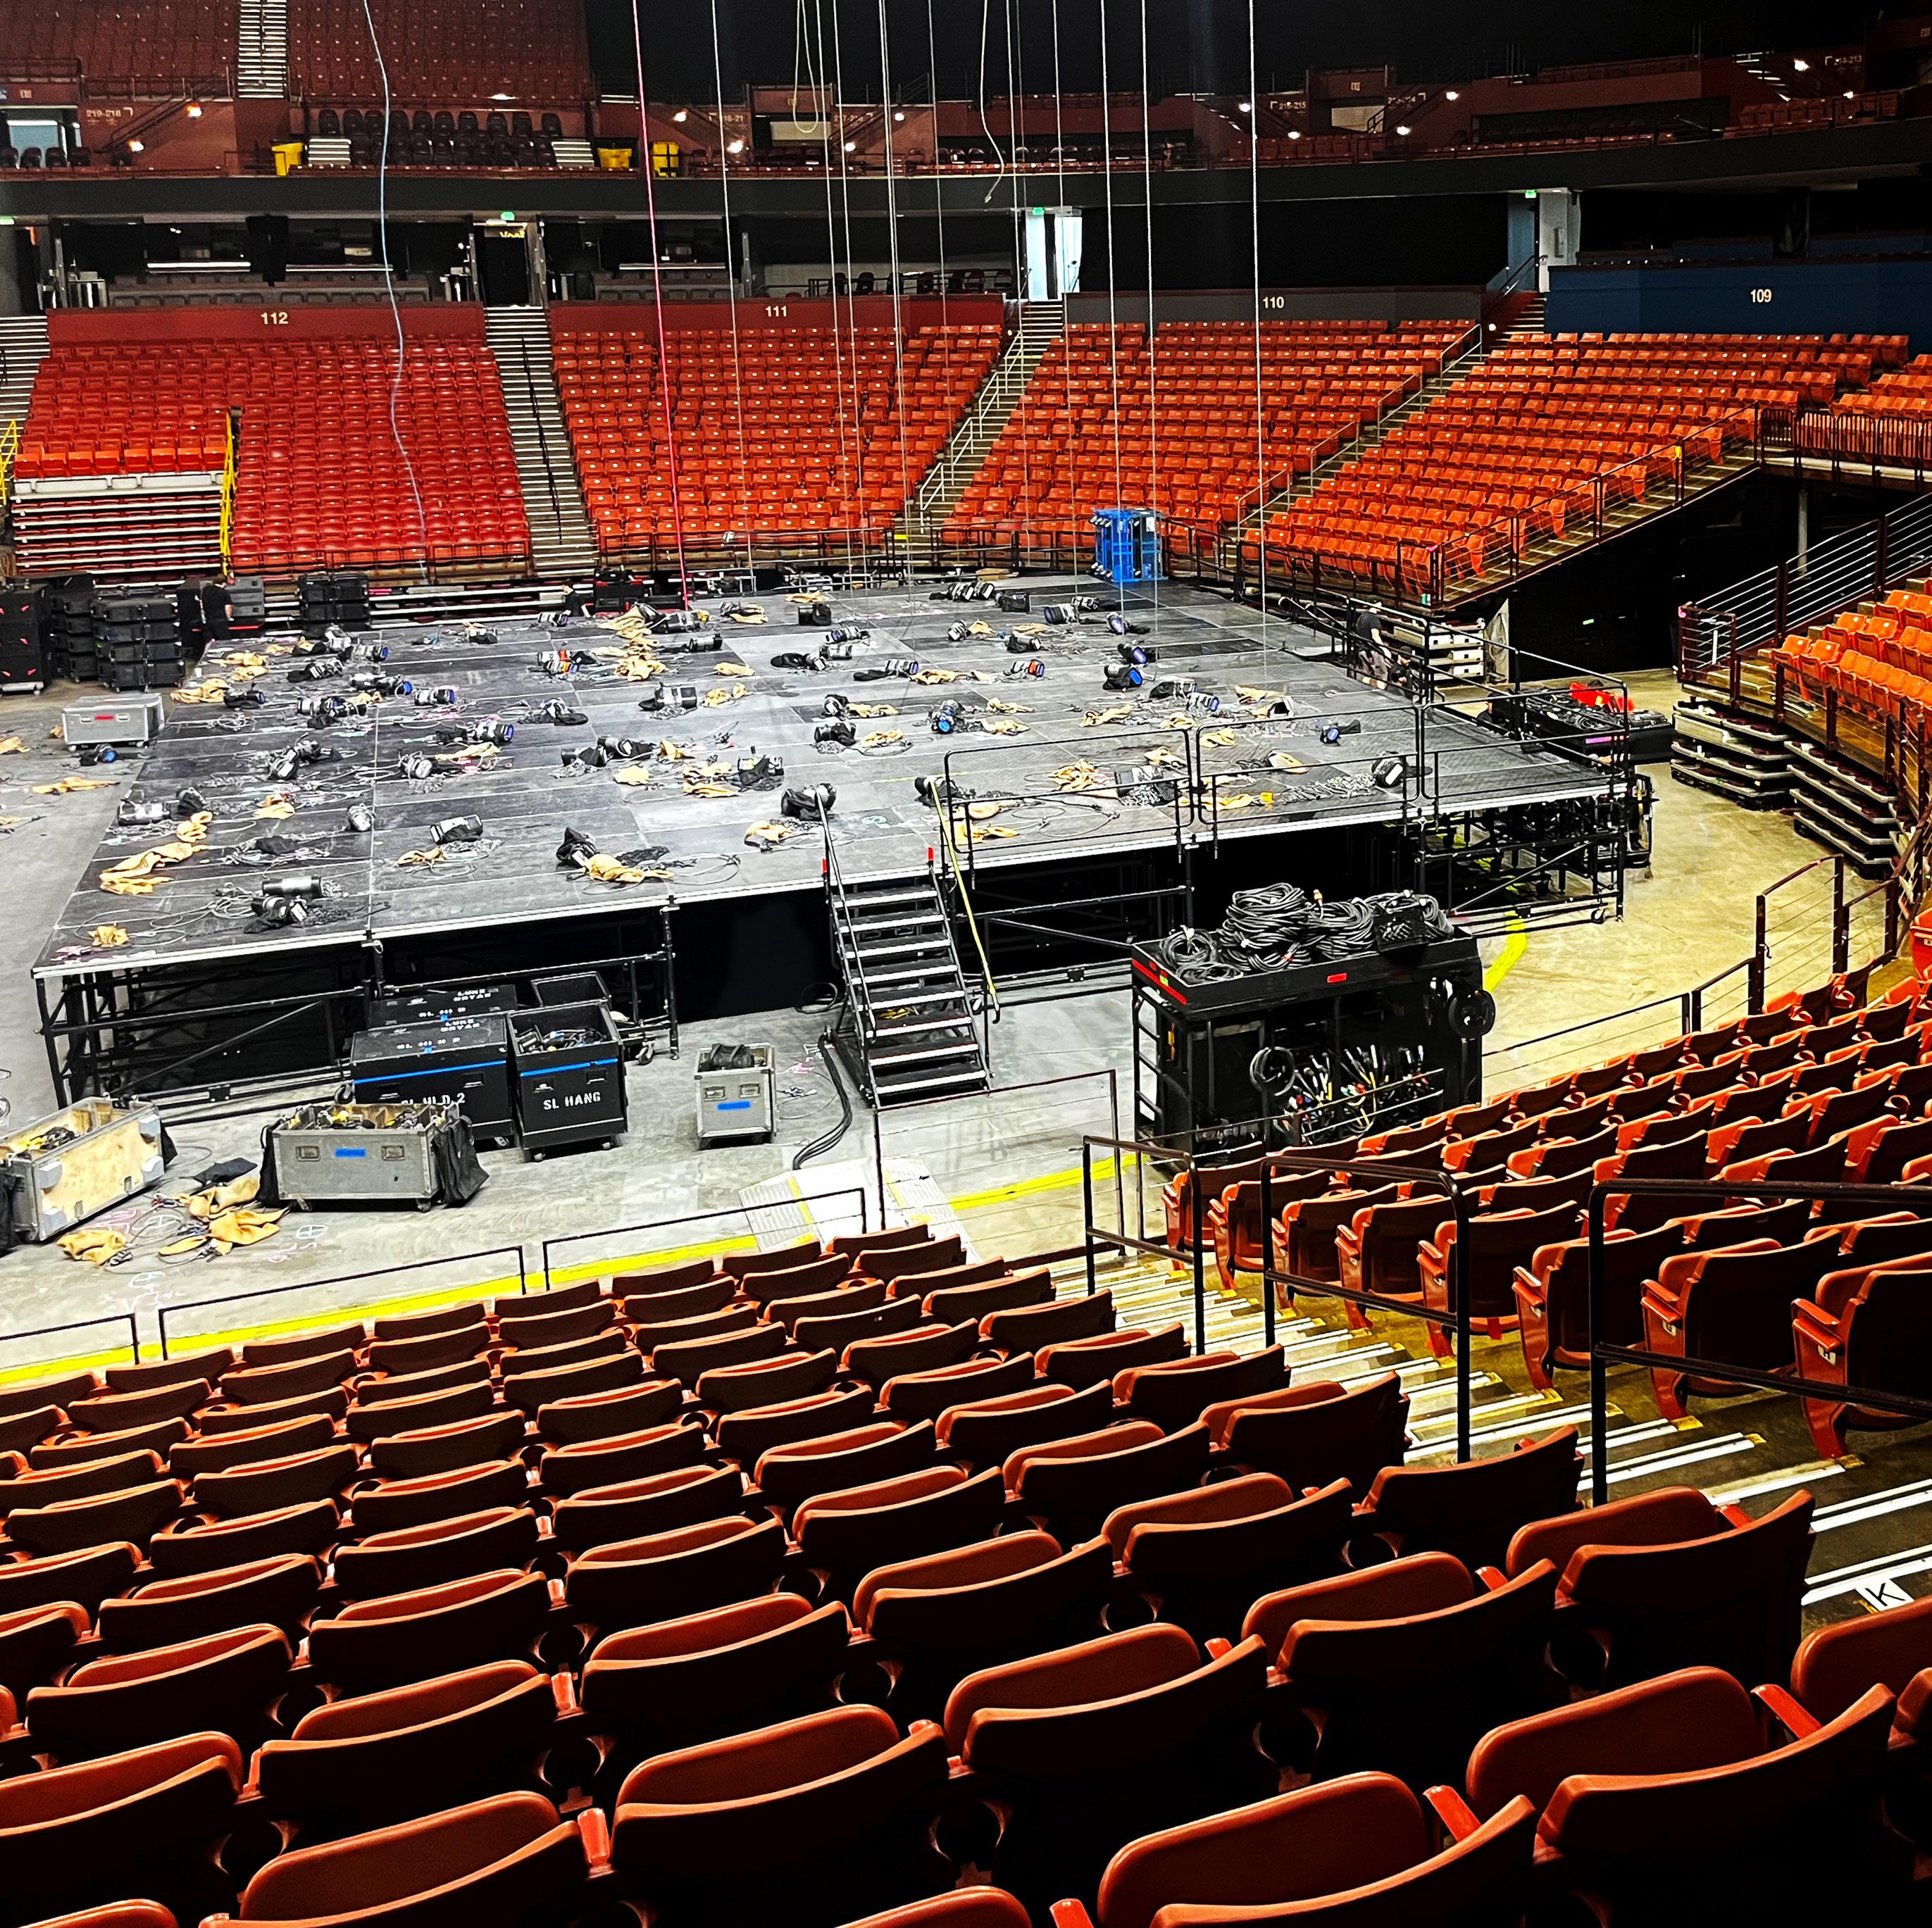
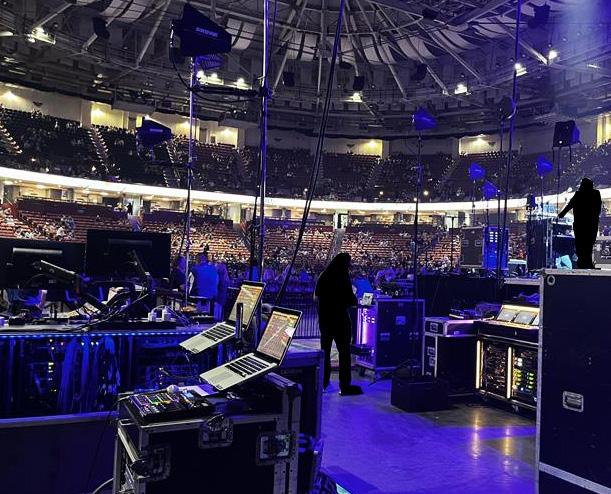
Pre-show setup at The Well.
“The profile of performers at the Well has a far greater impact on whether people show up than the condition of the building, so the experience of the talent and their touring crew must be prioritized in any conversation about renovations.”
The nature of renovations at The Well adds another level of complexity to the issue of facilities updates. Both back- and front-of-house need improvement, which raises the question of priority. Although front-of-house infrastructure helps to facilitate the movement and experience of the concertgoing public -- and, by extension, the arena’s profit stream -- the back-of-house infrastructure is the impetus for that profit stream. The profile of performers at the Well has a far greater impact on whether people show up than the condition of the building, so the experience of the talent and their touring crew must be prioritized in any conversation about renovations.
The architecture of arena back-of-house facilities is subject to intense programmatic constraints. Although it is the back side of the arena for the concertgoing public, it is the front door for touring talent. It’s also subject to rigorous program: in the span of 6 hours, millions of dollars’ worth of lights, audio cables, pyrotechnic equipment, and speakers pass through its walls. “Back-of-house” is a misnomer -- this space is the primary artery by which the rest of the arena can survive. In the same manner, built interventions in this space must abide by its constraints. There’s a strong possibility that a 600-pound road case full of amplifiers could crash into your design, and any hindrance to the rate of circulation means a potential financial loss for the arena.
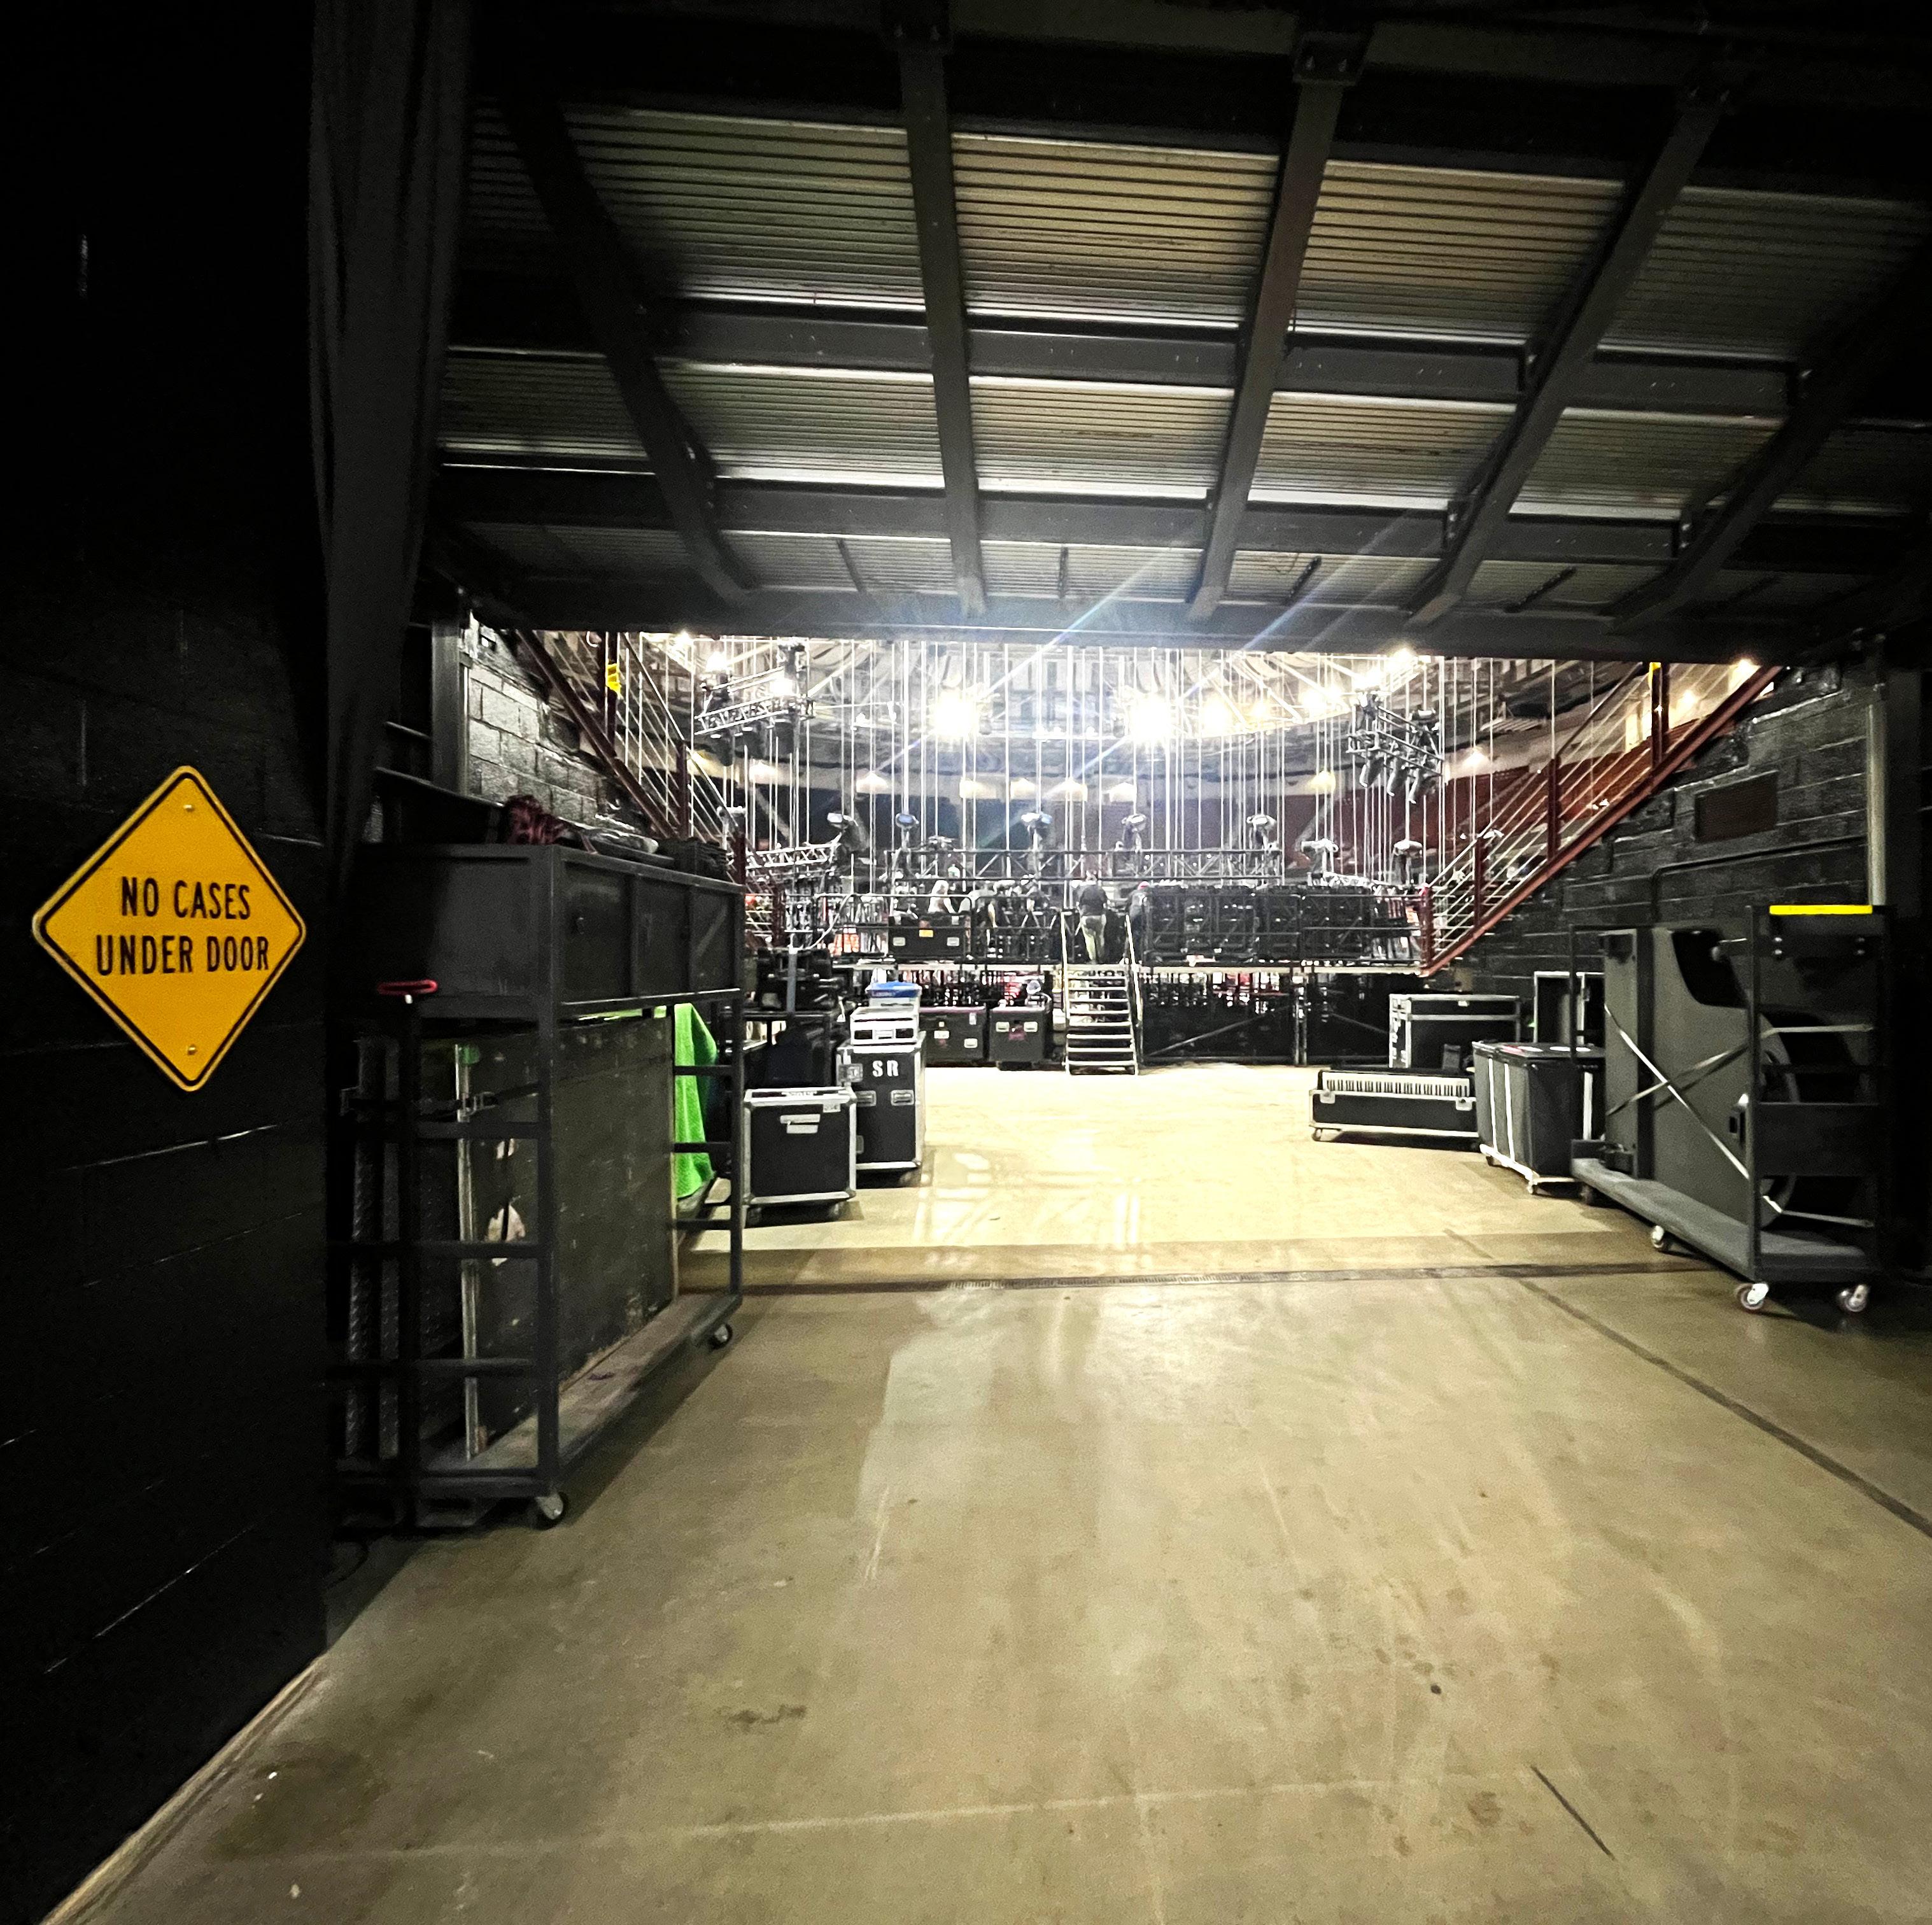
The main passageway from back-of-house to the arena.
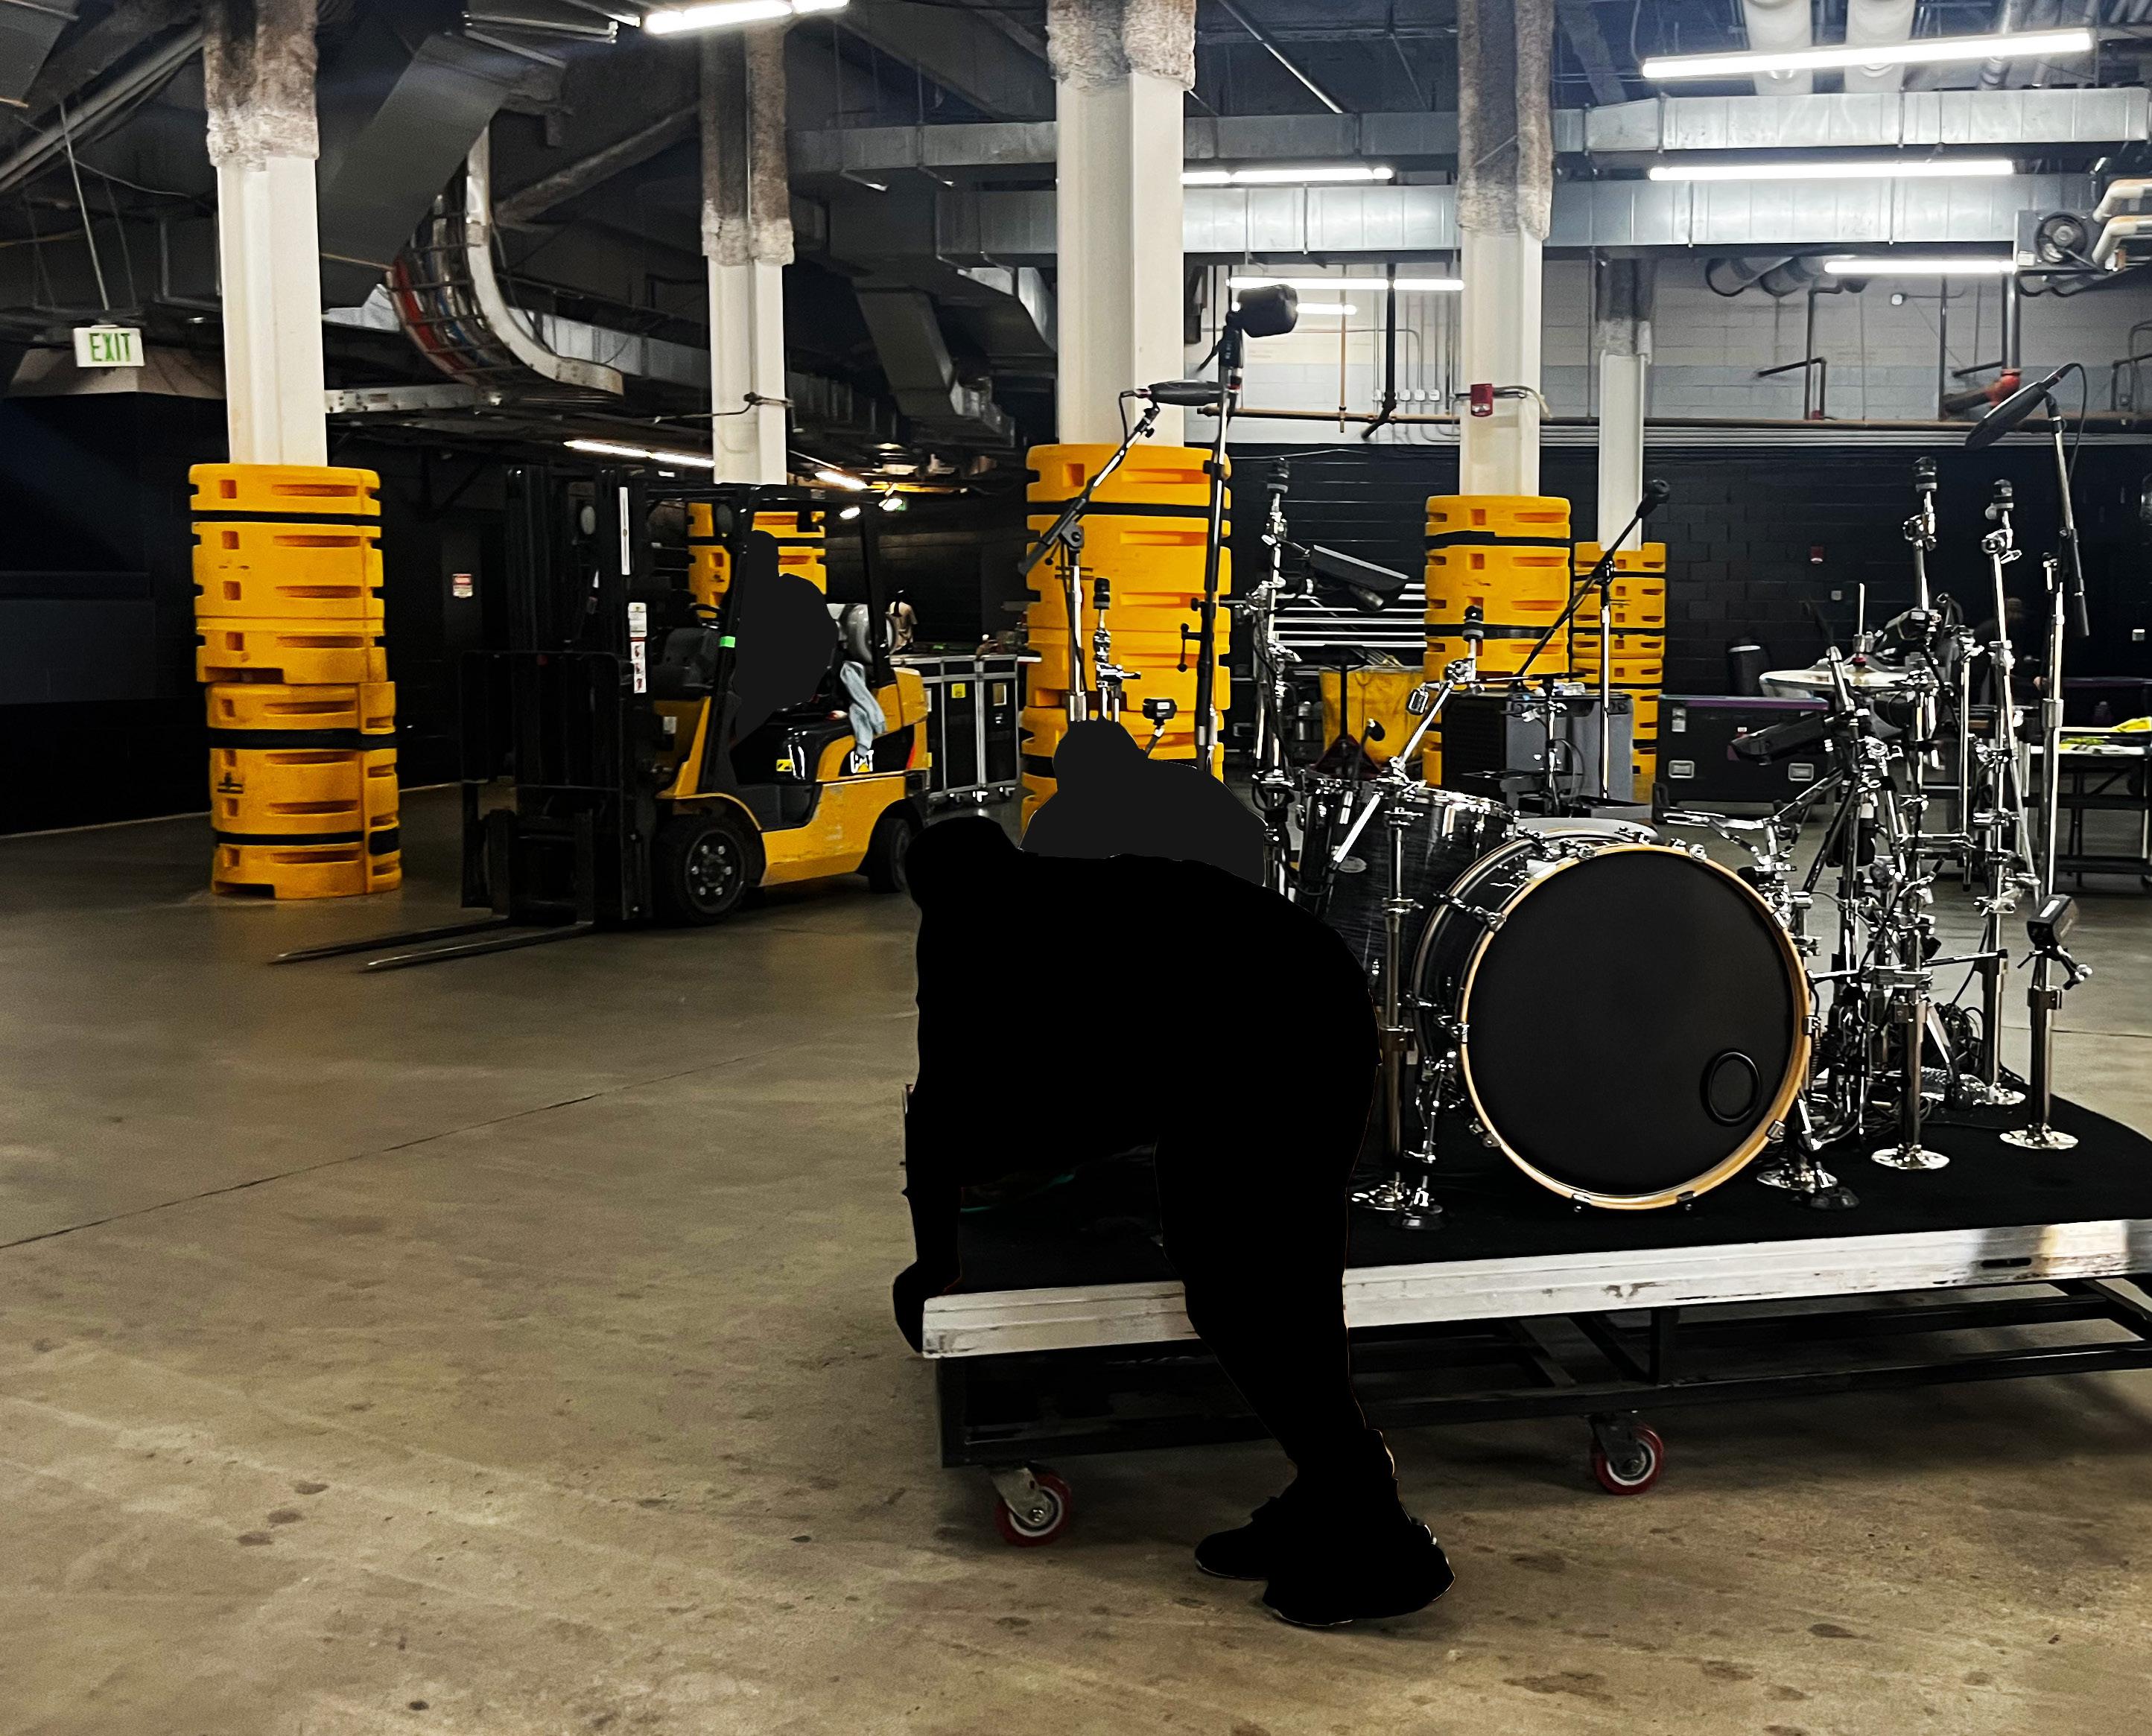

This is the situation at The Well. A constrained, outdated back-ofhouse facility means inefficient show logistics and an experience for talent that is unceremonious. And although major improvements to the area are proposed, including an expansion of back-of-house, questions still remain.
• How can we improve and direct circulation to maximize the arena’s efficiency?
• Are there ways to delineate space so that talent and their tour crews have a back-of-house experience that feels purpose-built for their needs?
• How can we transform The Well into a symbol for Greenville’s unique identity?
By leveraging multisensory design theory and new analysis strategies, we can begin to think about answers.
The practice of analyzing a space to better understand its challenges and areas of remediation. Rather than approaching spatial challenges in a solutions-oriented way, this practice facilitates the analytical development of site-specific design questions.
Unpacking the complex design challenges that the Well is facing requires a broad, multisensory toolkit for both on- and off-site analysis.
I was lucky enough to embed with the team working on the Well and got to experience the spatial conditions of back-of-house facilities firsthand. I shadowed them on two site visits, giving me a wealth of data from which to develop solutions. I was able to meld that experiential data with quantitative analysis to identify key opportunities for improvement to the Well’s spatial program.
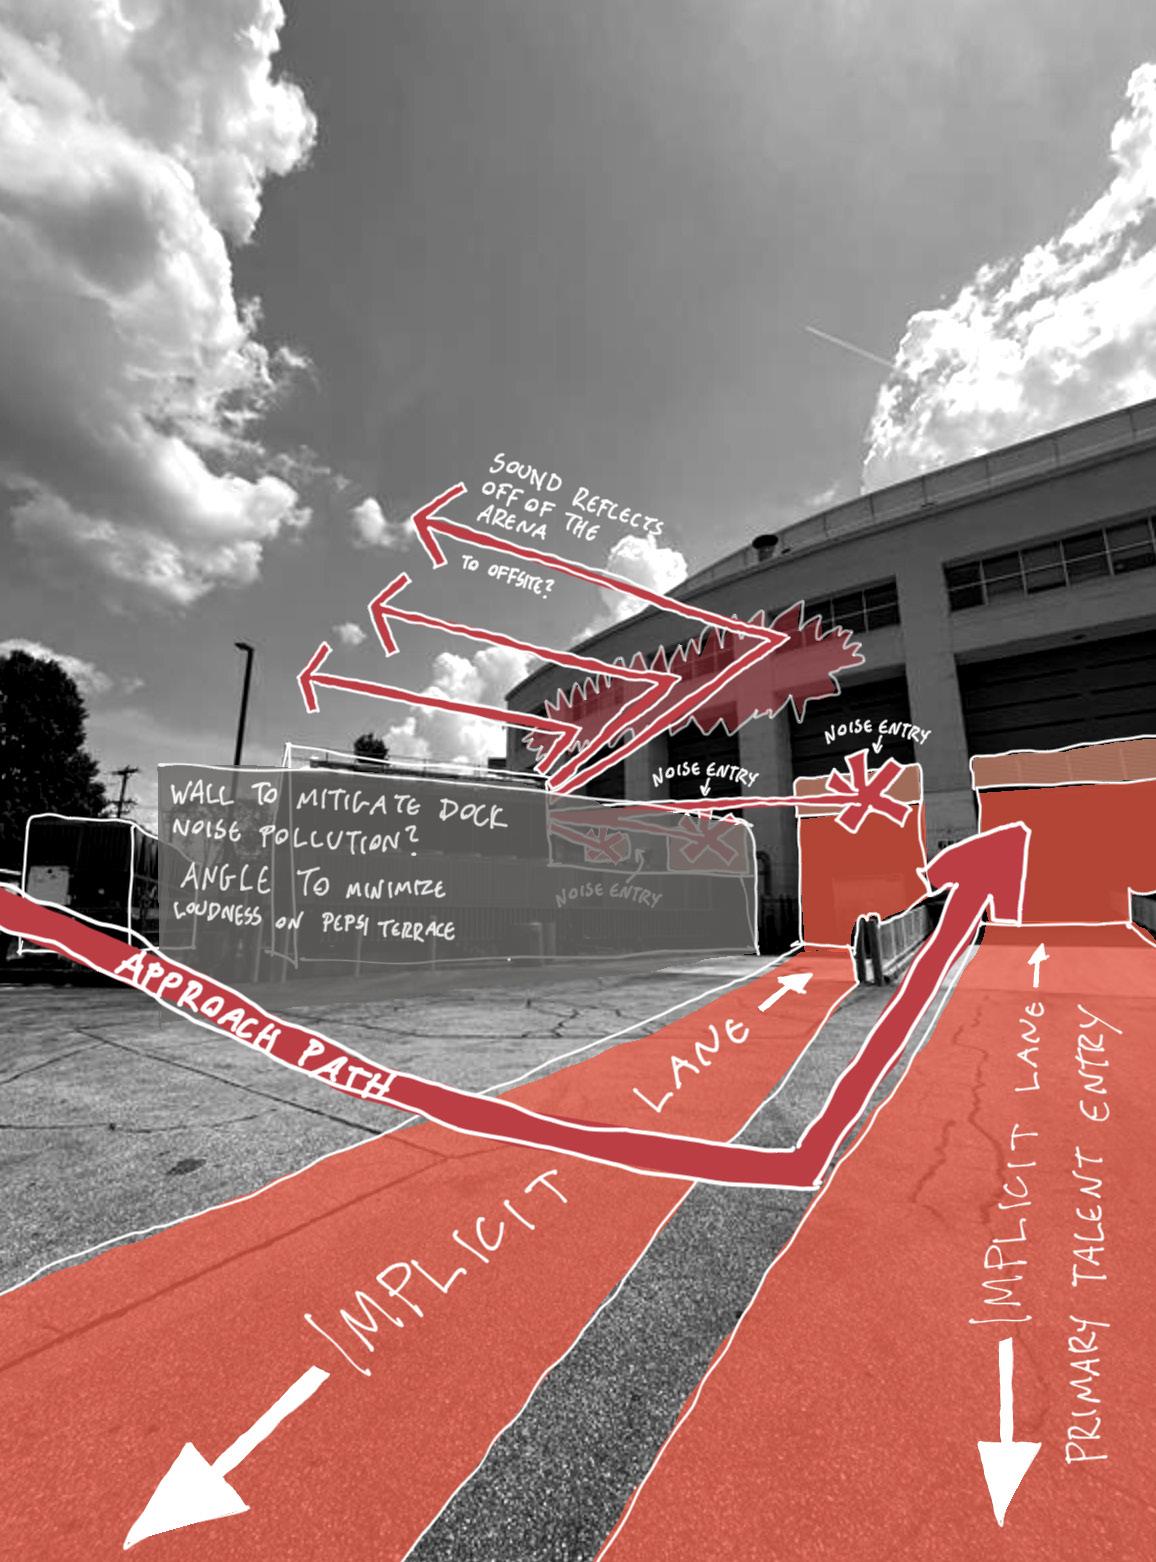
I made my first trip to the Well with a blank sketchbook and an open mind, with the goal of feeling the space. Rather than entering the arena from the public-facing concourse, I entered through the back-of-house facilities, mirroring the path that a performer might take. Upon my arrival at the arena’s loading dock, I was met with the scream of a massive exposed mechanical system, amplified by the concrete that surrounded me. As I walked across the loading dock, I wondered how humans would navigate space while semi-trucks and tour buses moved in and out.


Once I passed through a security checkpoint tucked away at the far end of the loading dock, I realized that the interior marshalling area faced similar challenges. With just two bays for trucks to load and unload, equipment would have to be staged all over the arena’s event level before it could be set up. The canteen/breakroom -- the only private space in the arena available for tour crewmembers -- sat directly adjacent to the marshalling area, suggesting that the noise, motion, and emotional stress of the back-of-house program could be potentially inescapable in interior event-level spaces.
The spatial experience for the talent wasn’t very choreographed either. To get to their dressing rooms, artists would have to cross the entire marshalling area, including the primary vomitory that facilitates the motion of equipment into the arena bowl. The corridor leading to the dressing rooms could often be lined with road cases as well, making any transition between the relative peace of the dressing rooms and the chaos of the marshalling area sudden and jarring. Most notably, there was very little that made me feel like I was in a unique space, apart from a Greenville Swamp Rabbits mural on one of the concrete walls.
My second visit was every intern’s dream - I got to go to a concert for work. I embedded with the Well team again to observe how people and equipment moved in and out of the back-of-house facilities during a tour. This particular tour was on the smaller side, with only about 10 semi trucks’ worth of equipment, but that is still a logistical challenge for the Well’s 2 loading bays.
I arrived at 7AM, as a highly choreographed dance of unloading, setup, and rigging was taking place. Even for this relatively small show, road cases
quickly lined the corridors and marshalling area. The only constant in the lead-up to showtime was movement. A mobile coffee shop set up in a small alcove off of the marshalling area, while cases began to back up into the rest of the back-of-house spaces. However, these cases began to create space in their own right. In one spot, they formed a sort of makeshift breakroom where tour crew members played cards while the performance was in progress.
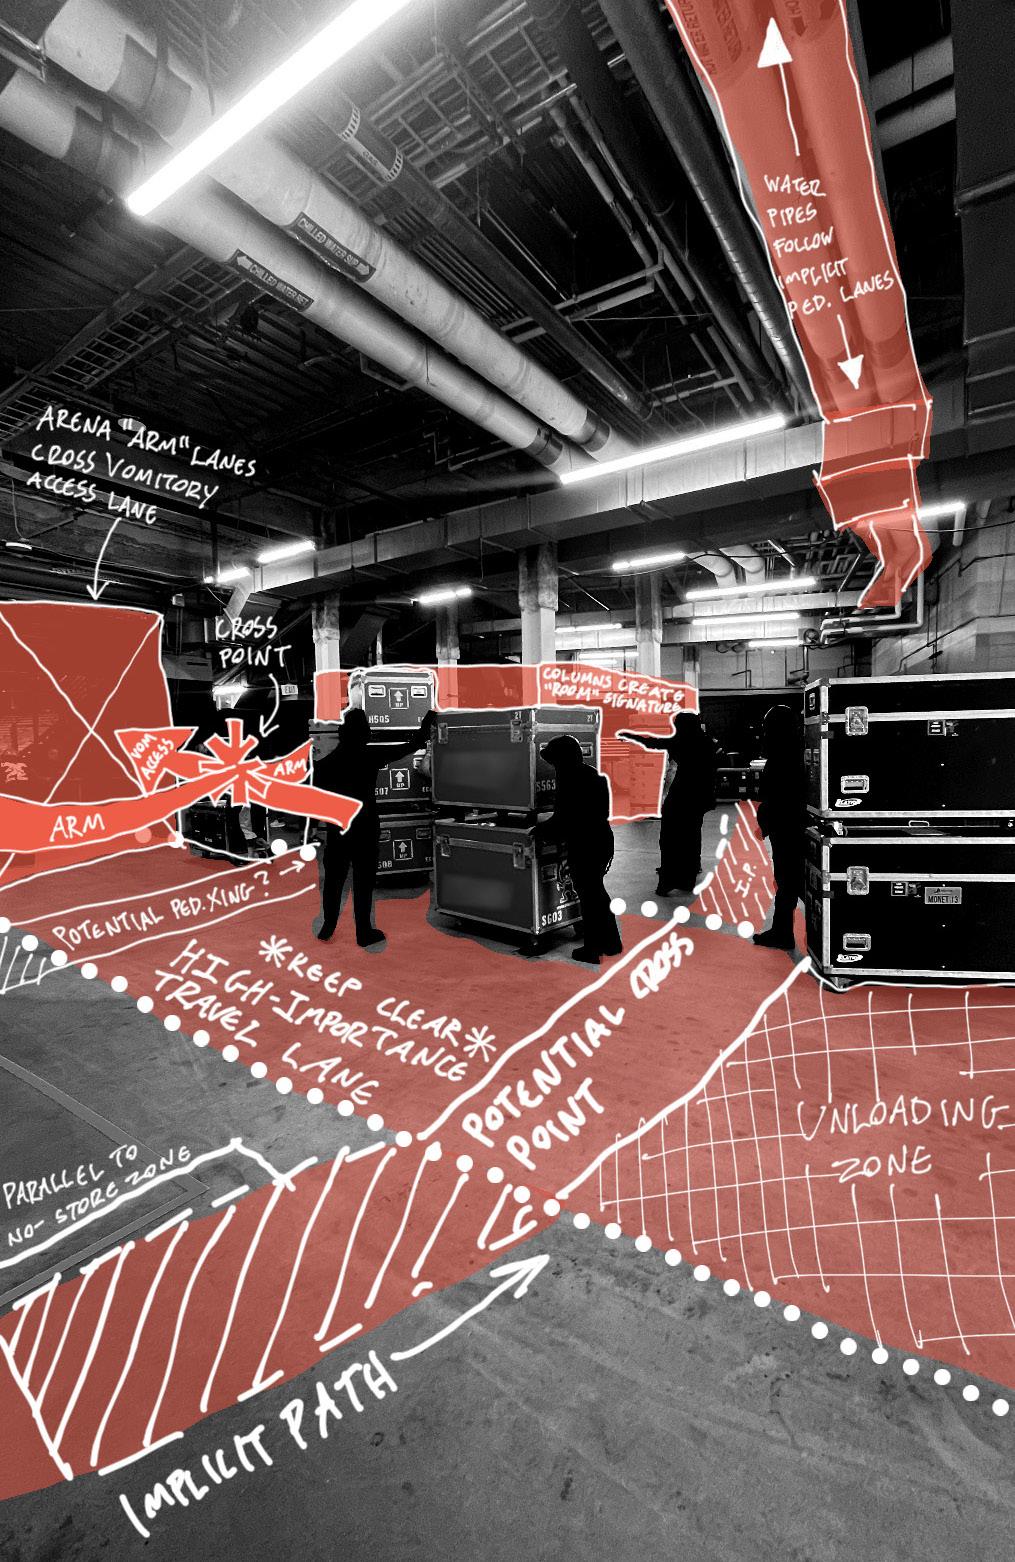
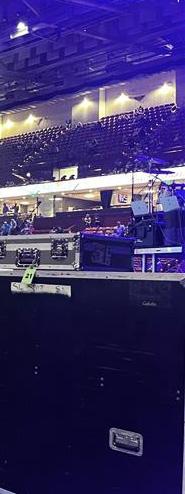
This visit confirmed many of my initial observations. The “talent corridor,” as I began calling it, was barely private. The tour’s video crew, which usually operates out of a truck, set up their consoles less than 20 feet from the dressing rooms, because there was nowhere in the loading dock for them to park. Furthermore, the lack of any transitional design language made it very easy to accidentally wander past green rooms and dressing rooms, breaking any illusion of privacy that talent might have.
Despite the spatial constraints, the arena’s production crew took extra steps to make the artist experience feel unique to the Well. A custom neon sign made for the tour by a local artist hung on the wall of the talent corridor. The show I went to fell on the talent’s birthday, and there were various decorations scattered around the arena to make it feel celebratory.
There was a personal touch to the arena that made it feel unique. By extending and amplifying that personal touch through design, we could enhance the unique identity of the Well.
A practice of data analysis that not only computes relevant values, but structures those values in a relevant way. In this case, the structure was a 3D representation of a room’s interior volume.
My next step was to identify which areas of the Well needed the most help, and which interventions would have the greatest positive impact.
I did this by building a quantitative model of the spatial and psychological properties of the Well’s existing and potential conditions. Using space syntax, isovist theory, and lots of custom code, I was able to run analyses of the Well’s BIM model to quantify and map its users’ spatial experience.
Quantitative data modeling at the arena scale is not easy, especially in three dimensions. I was able to greatly simplify certain aspects of this approach by programming relatively easy-to-use tools, but this approach is still more cumbersome than a traditional spatial analysis process. However, in a complex system like the Well’s back-of-house, every design decision has trade-offs, winners, and losers, and thus must be justified.
Quantitative approaches allow us to make justifications and compare outcomes, both internally and to clients.
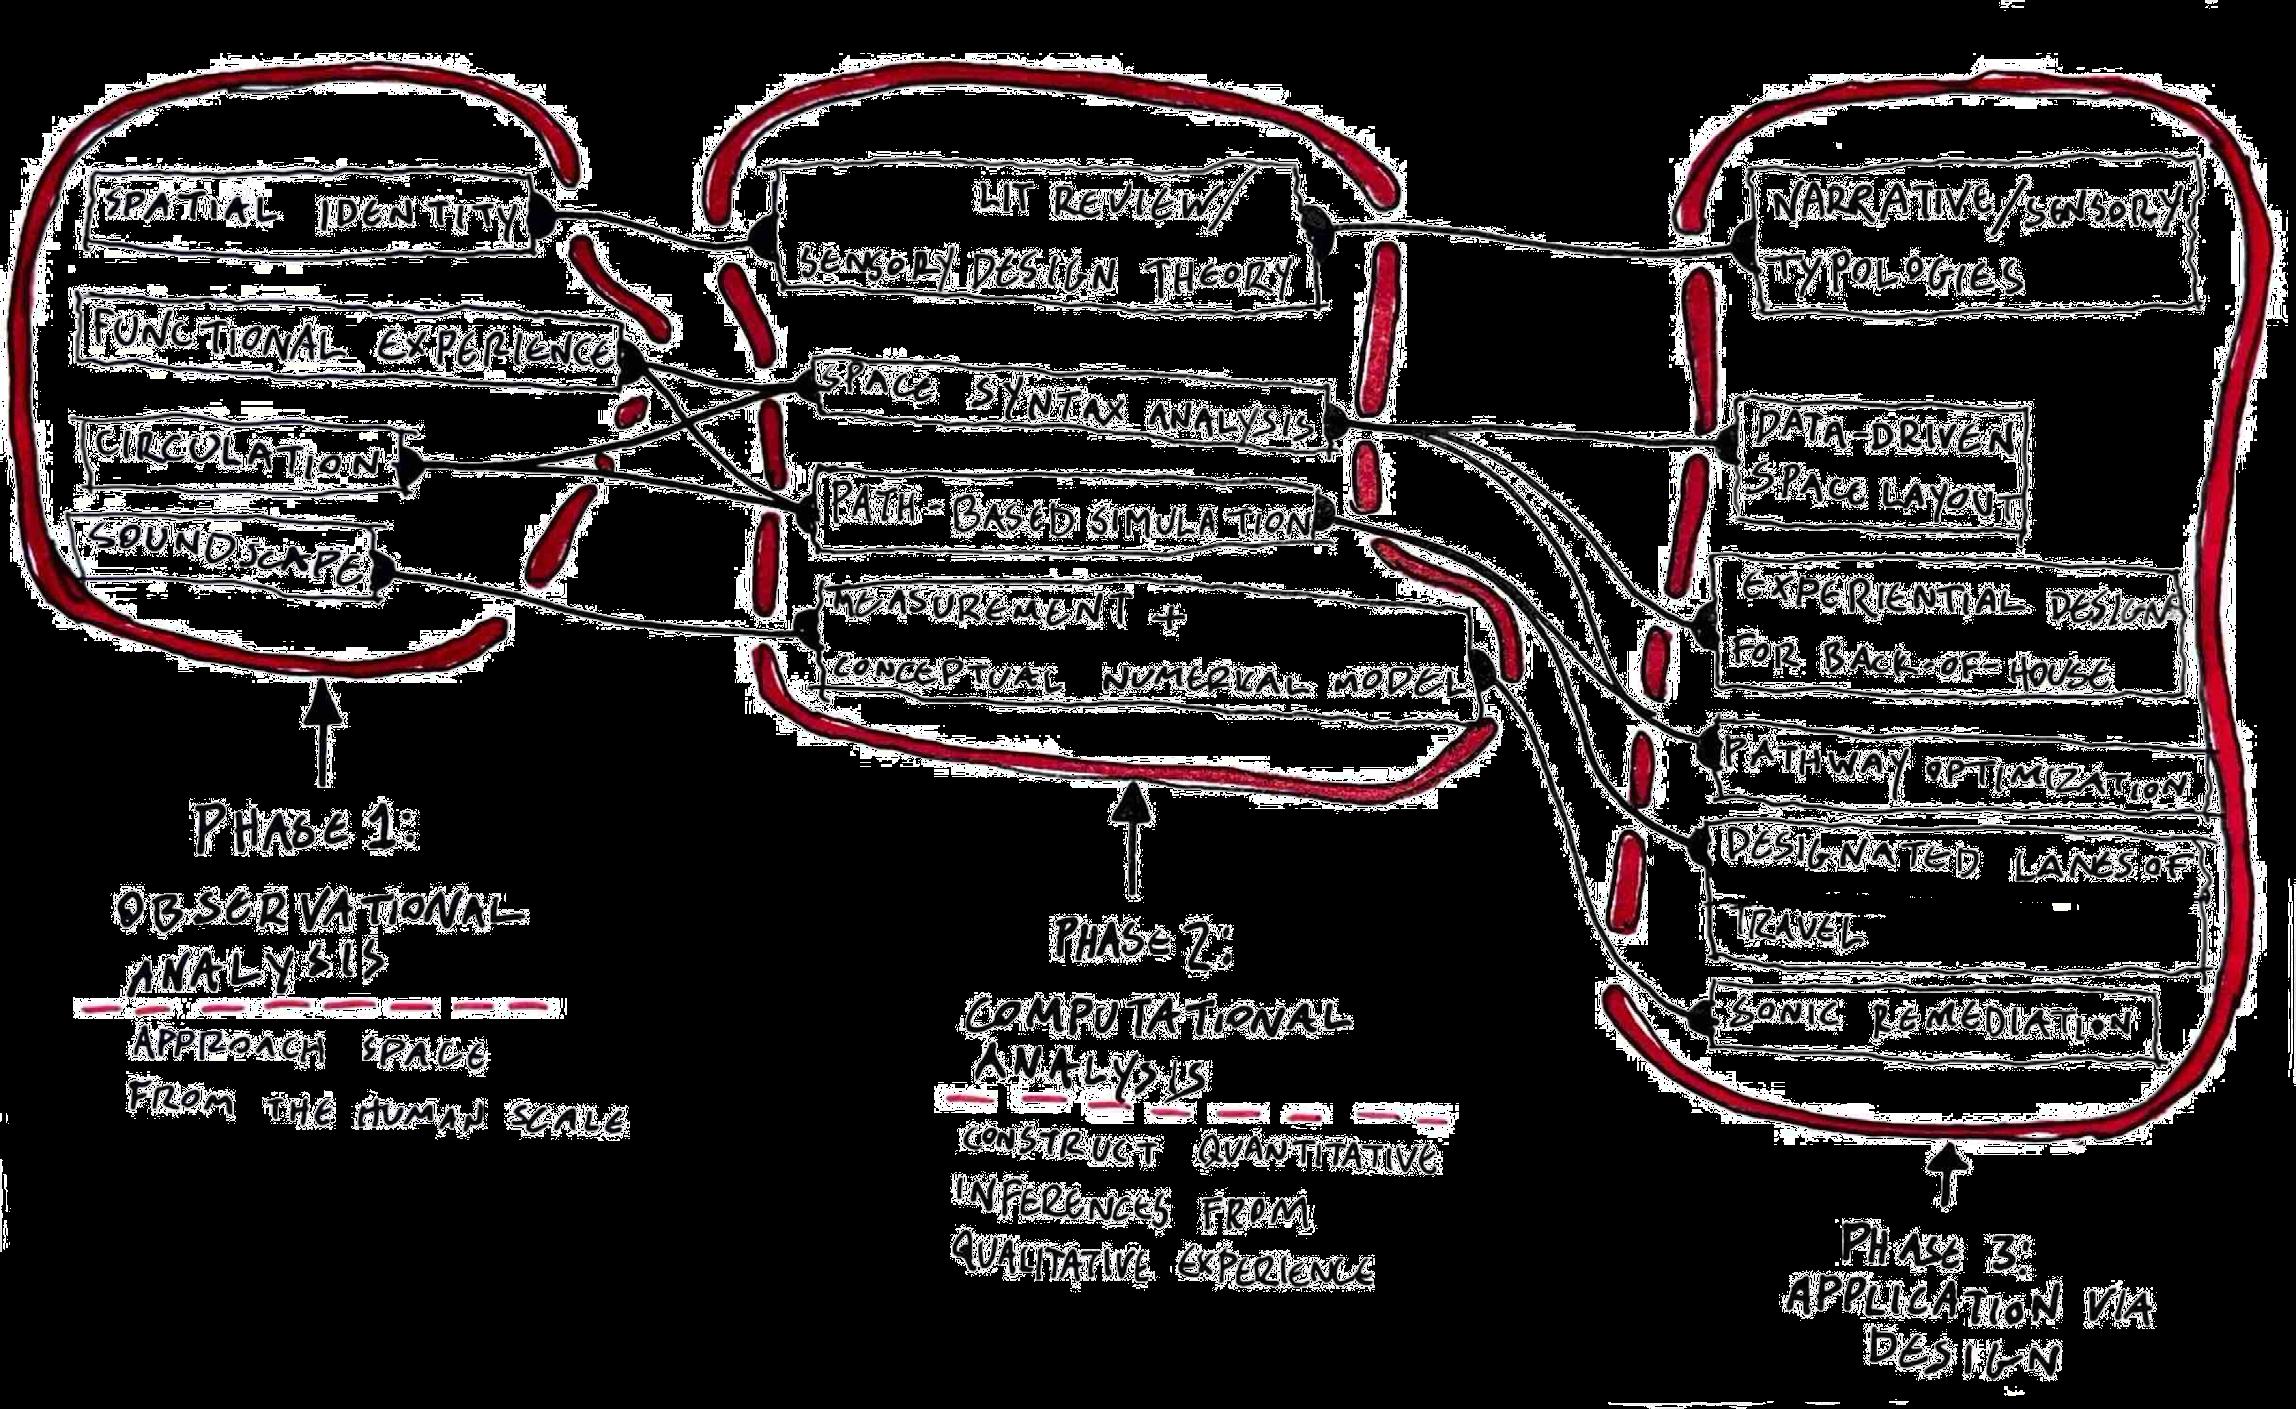
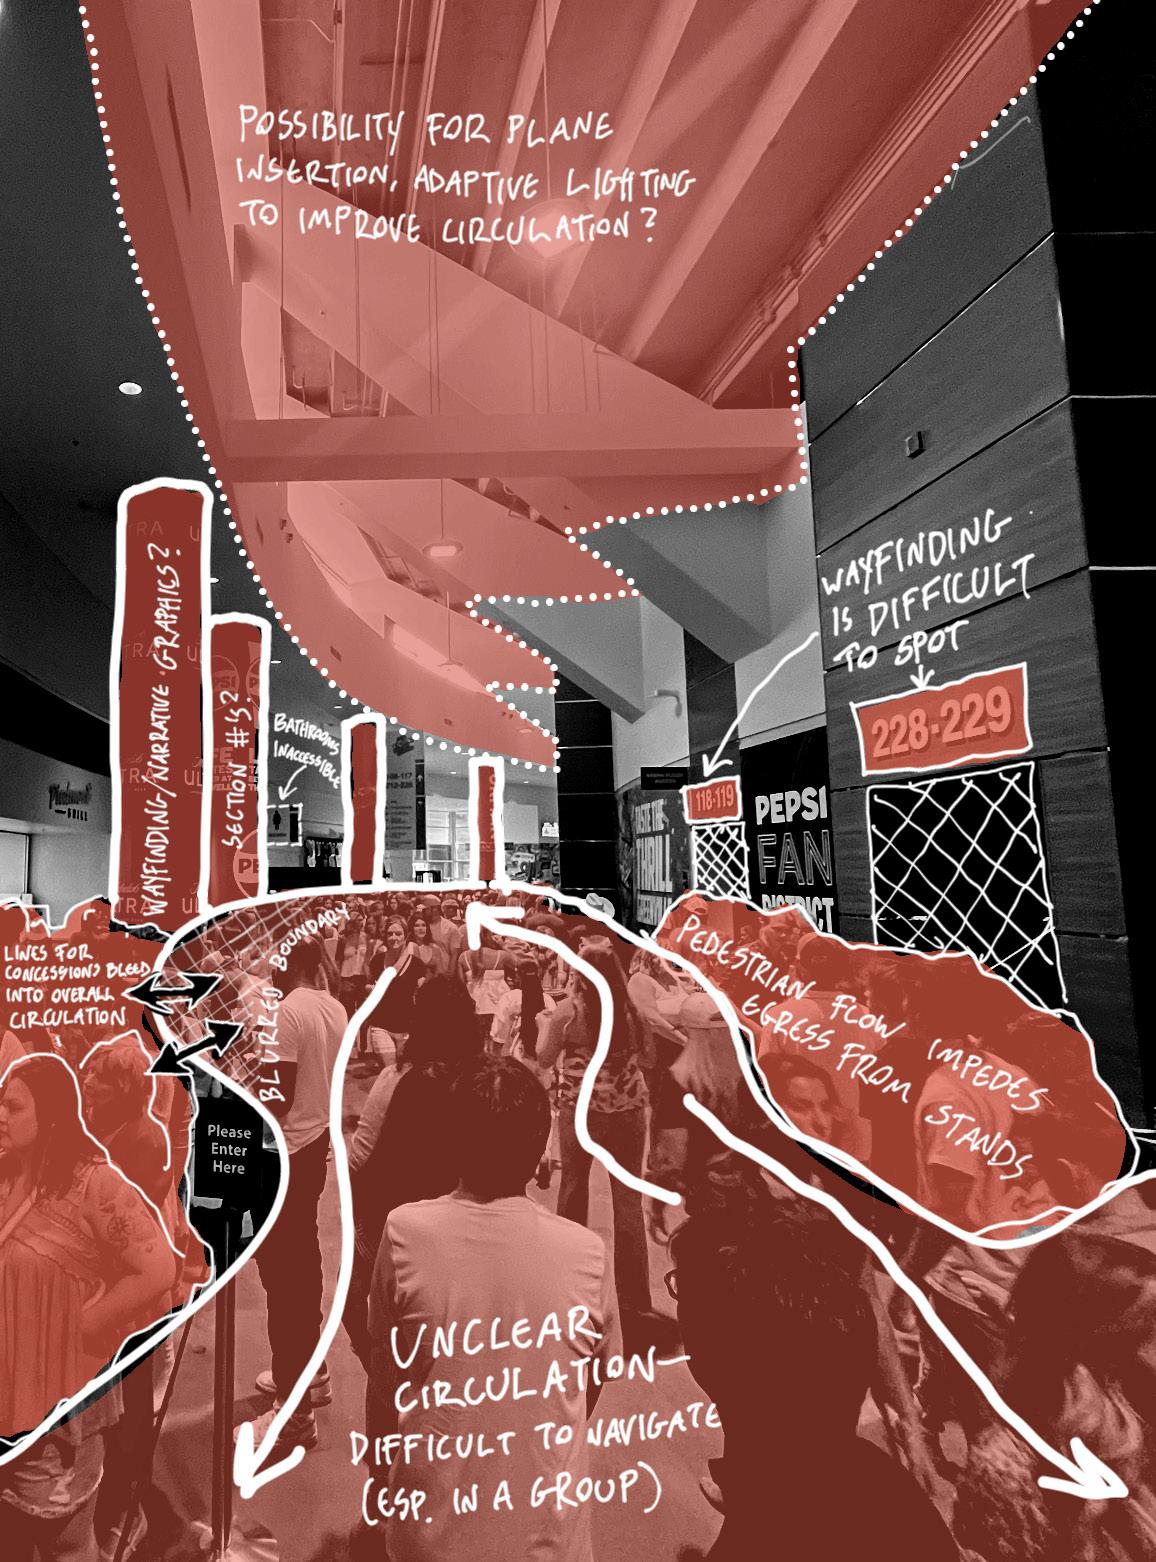
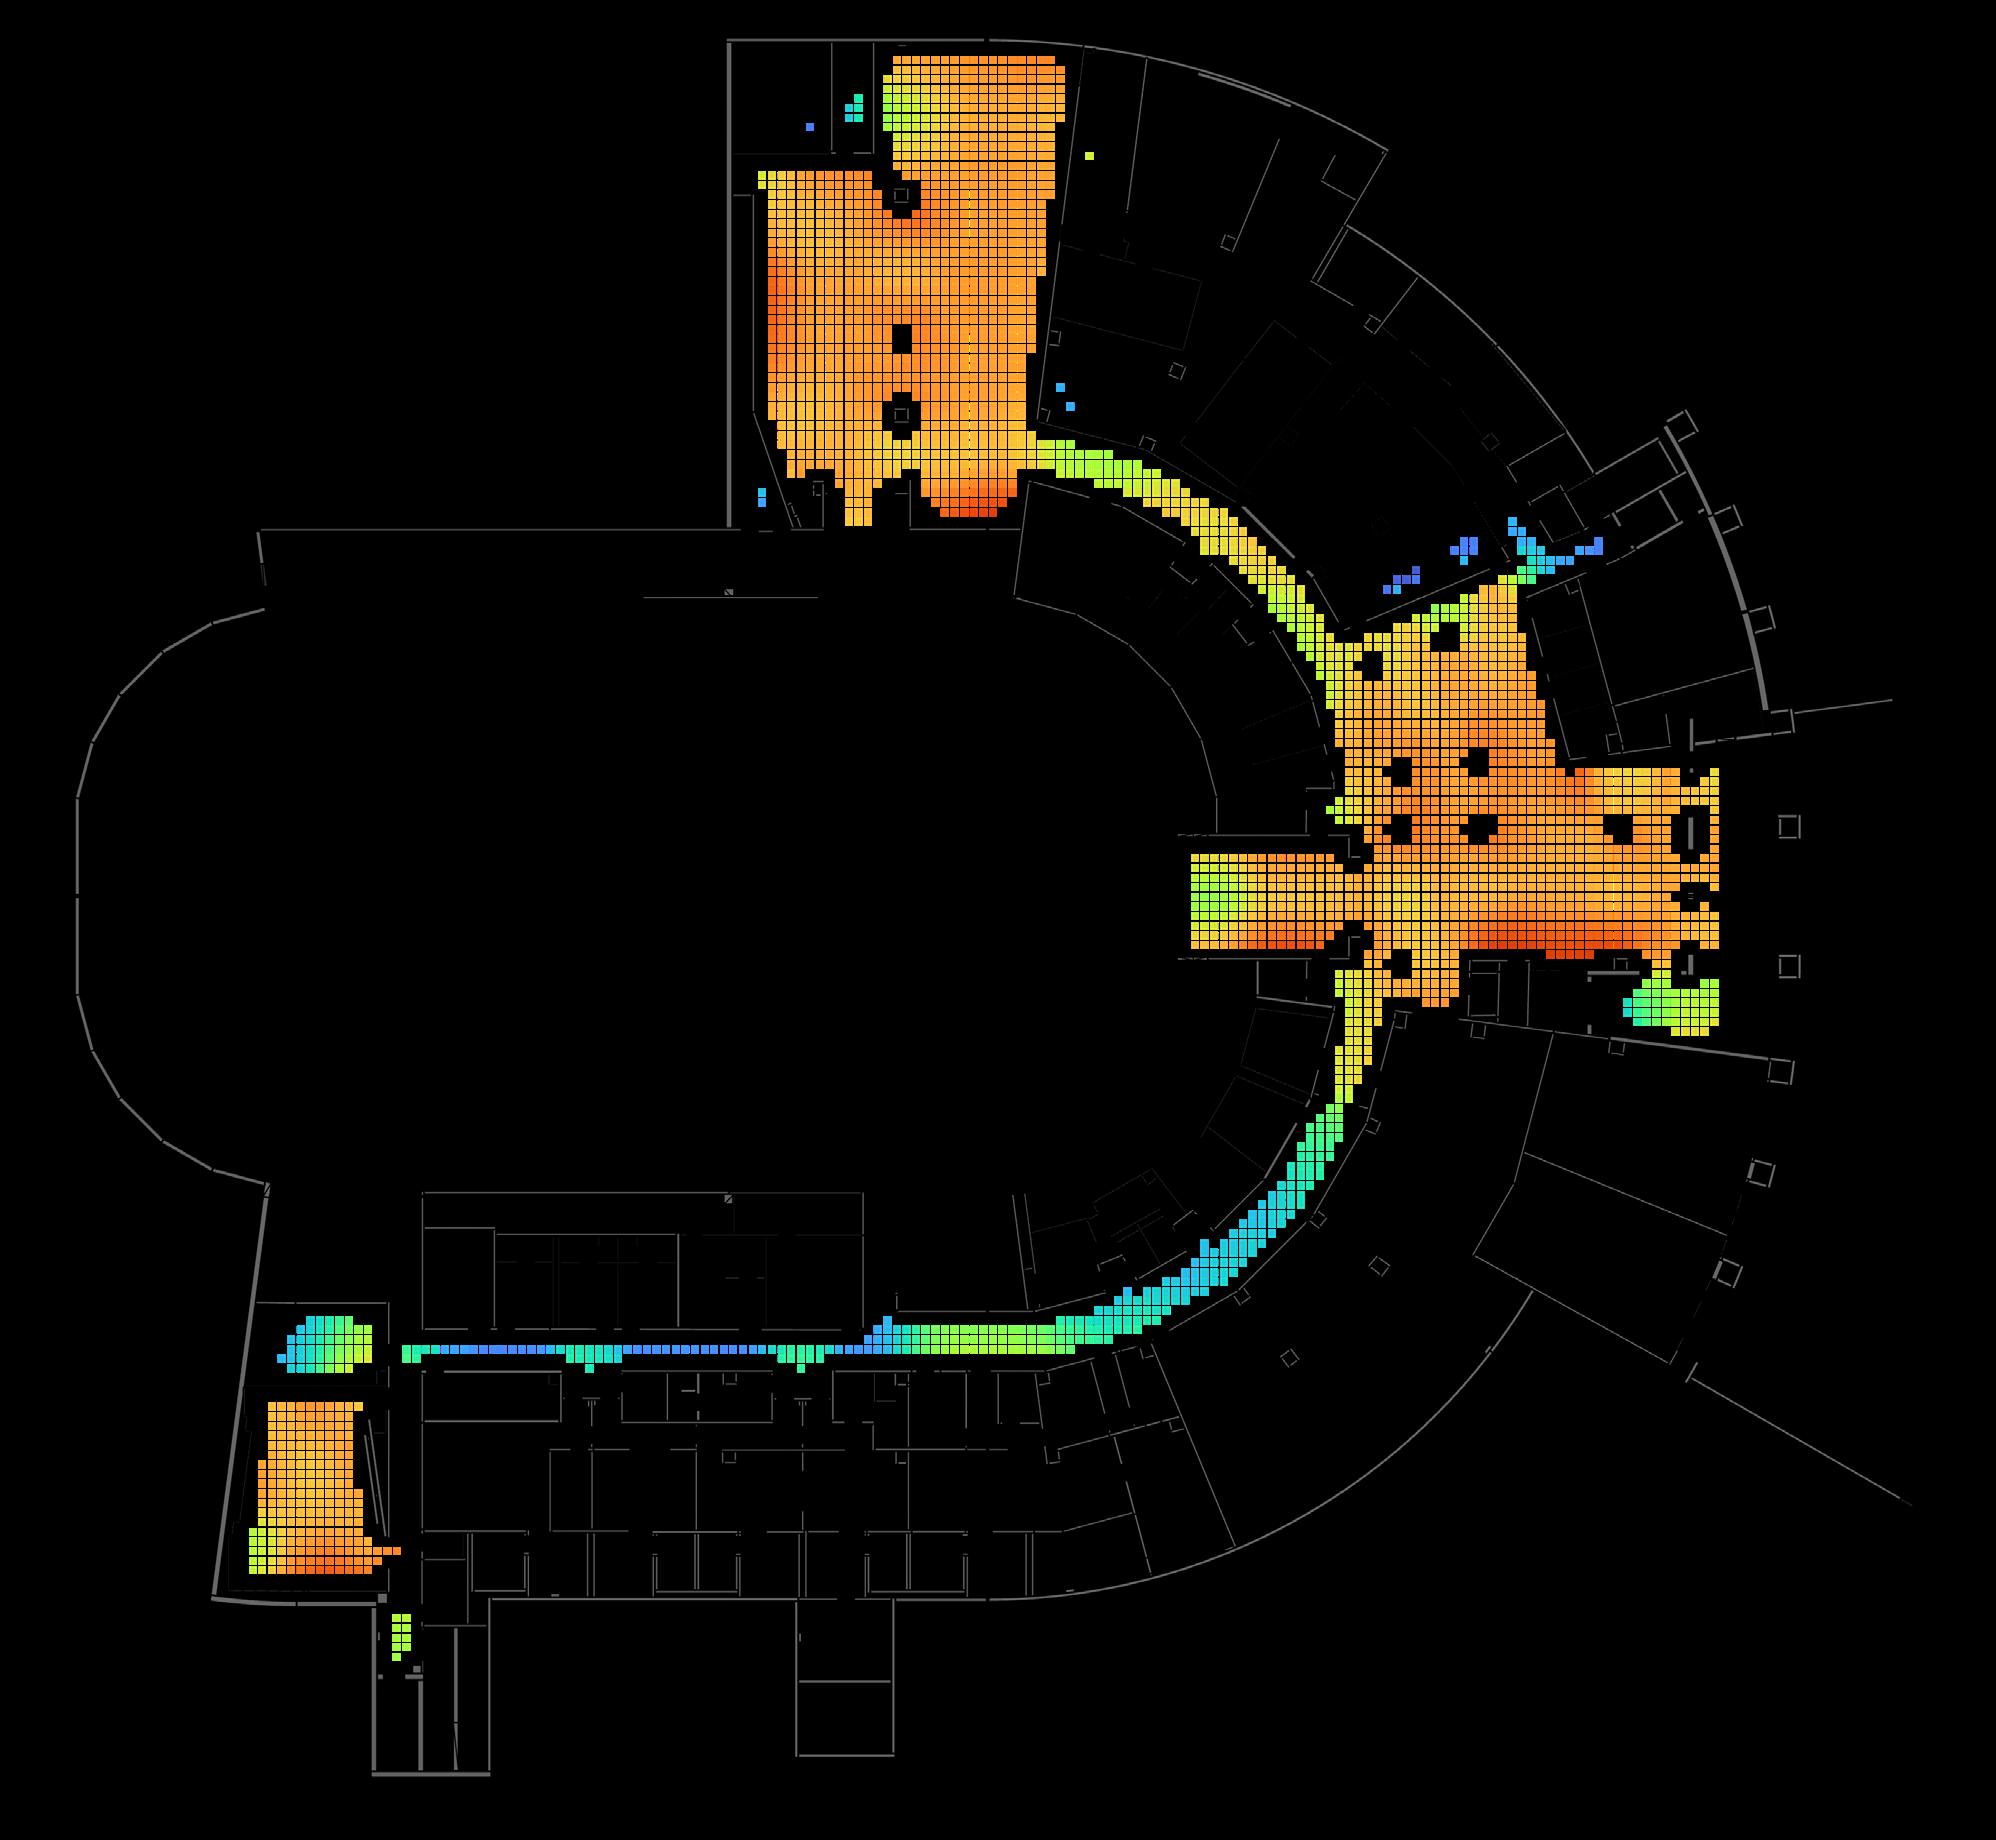
My analysis of the Well’s backof-house focused on circulation in its marshaling areas. My goal was to choreograph a circulatory hierarchy in space that would improve the navigational experience of all user groups.
By analyzing specific wayfindingrelated isovist and space syntax properties, I built a model of existing circulatory conditions to assess how changes to the geometry of the space could affect them.
As with any digital modeling project, using only the data that is necessary was of utmost importance. Any architect who has opened a Revit project with 17 linked models knows how slow these models can get. I wanted to avoid this, so I drew upon isovist theory and space syntax to analyze properties of the space that would allow me to look for implied paths and corridors.


Occlusivity: How enclosed a space feels

strong pull

Drift Magnitude:
Areas that kinesthetically attract users
weak pull
To more adequately assess changes in spatial conditions, I needed to understand both existing and potential conditions.
Conducting spatial analysis for both scenarios allowed me to understand and communicate how changes to the overall spatial layout of the Well could affect user experience. It also helped me think through ways to respond to those effects through built interventions.



Areas with a low occlusivity score feel enclosed and can be preceived as implicit rooms.
Areas with a high occlusivity score limit vision between spaces, and can be perceived as a threshold or wall-like sensation.


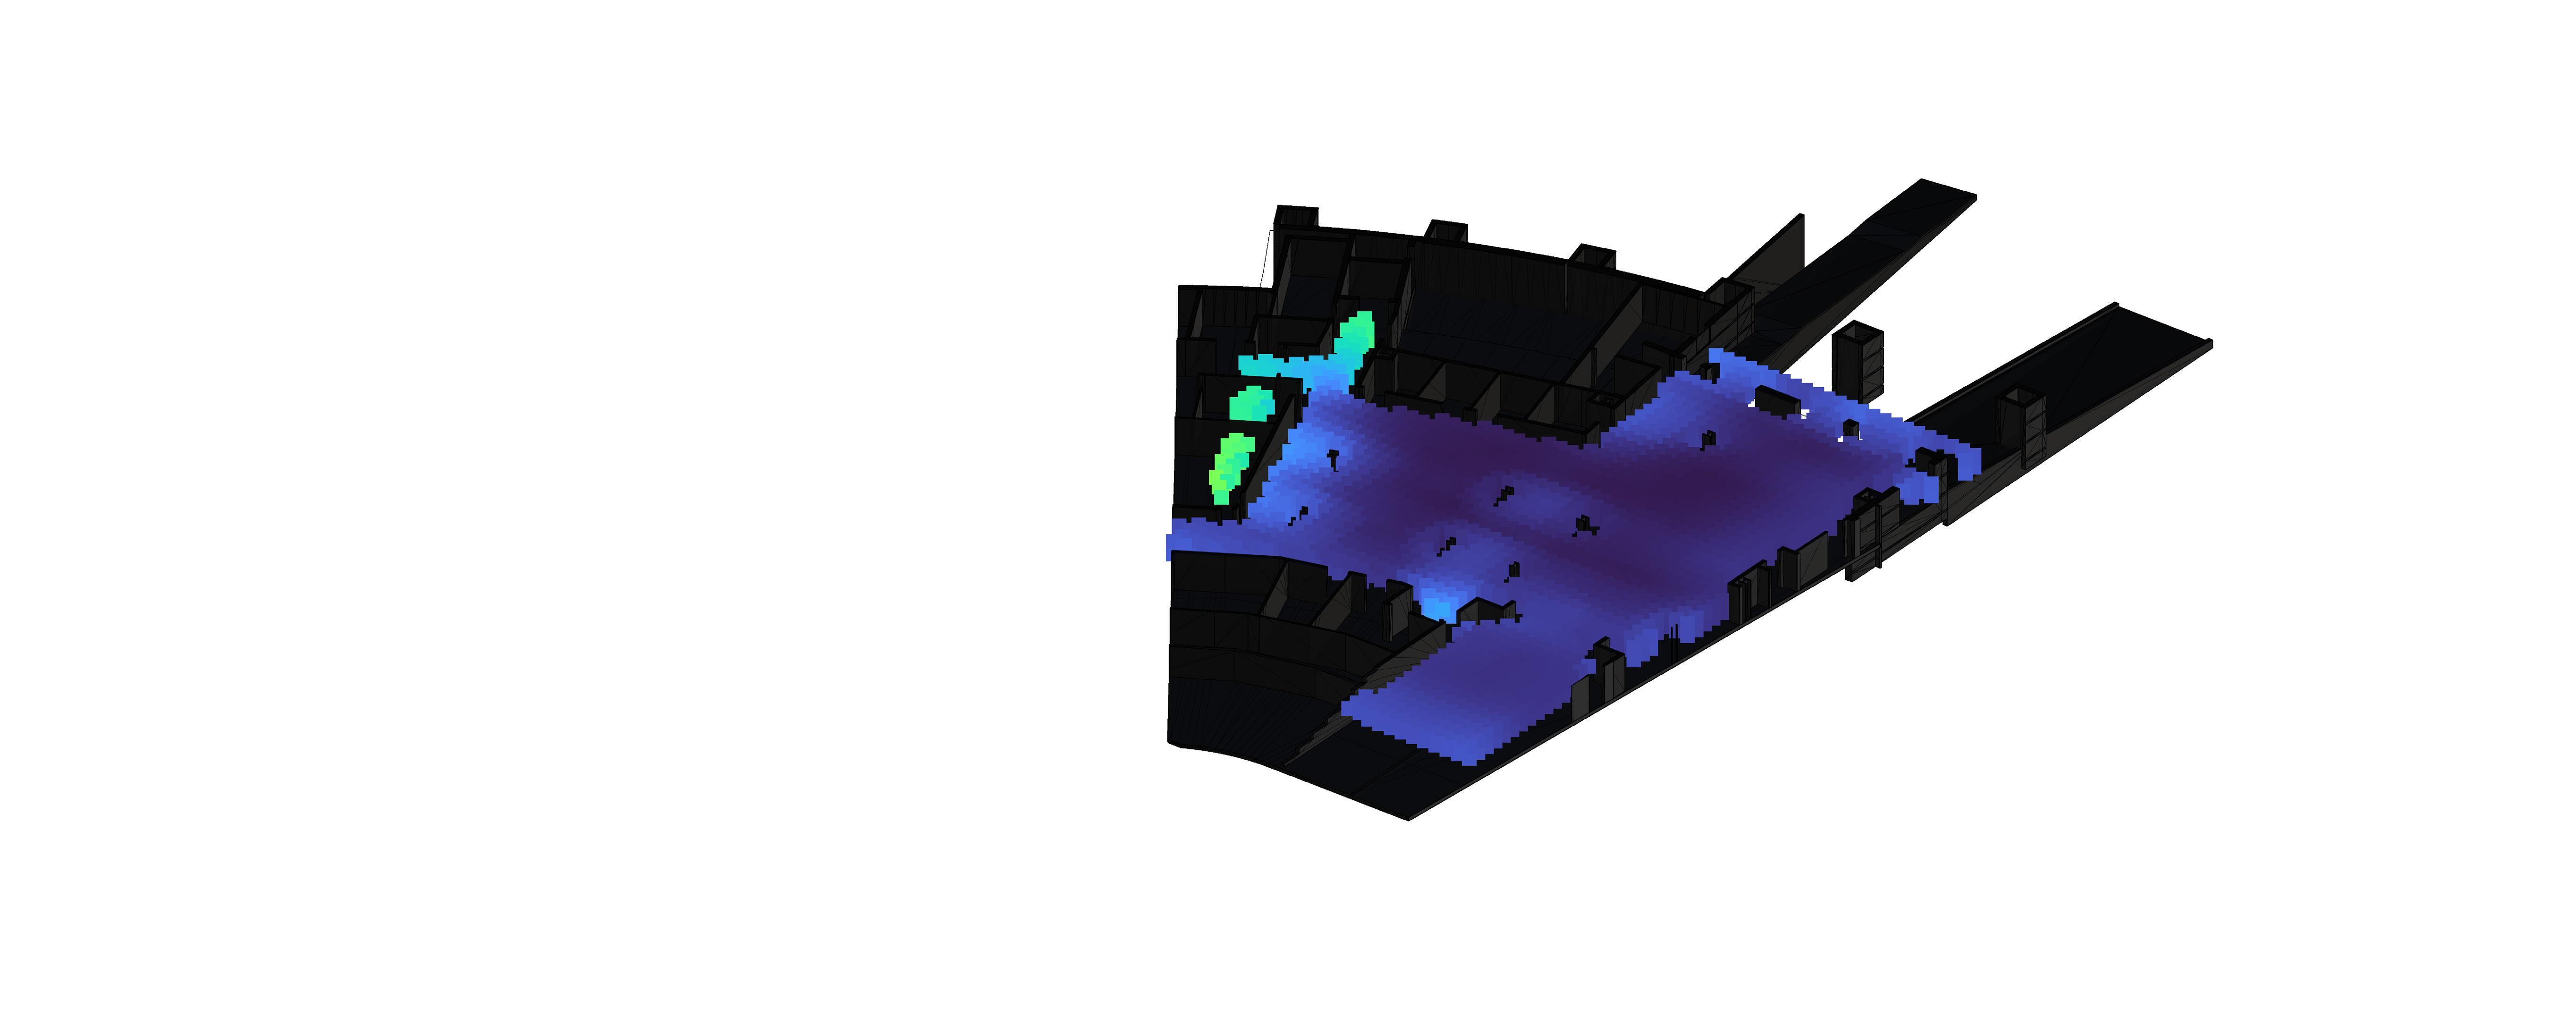
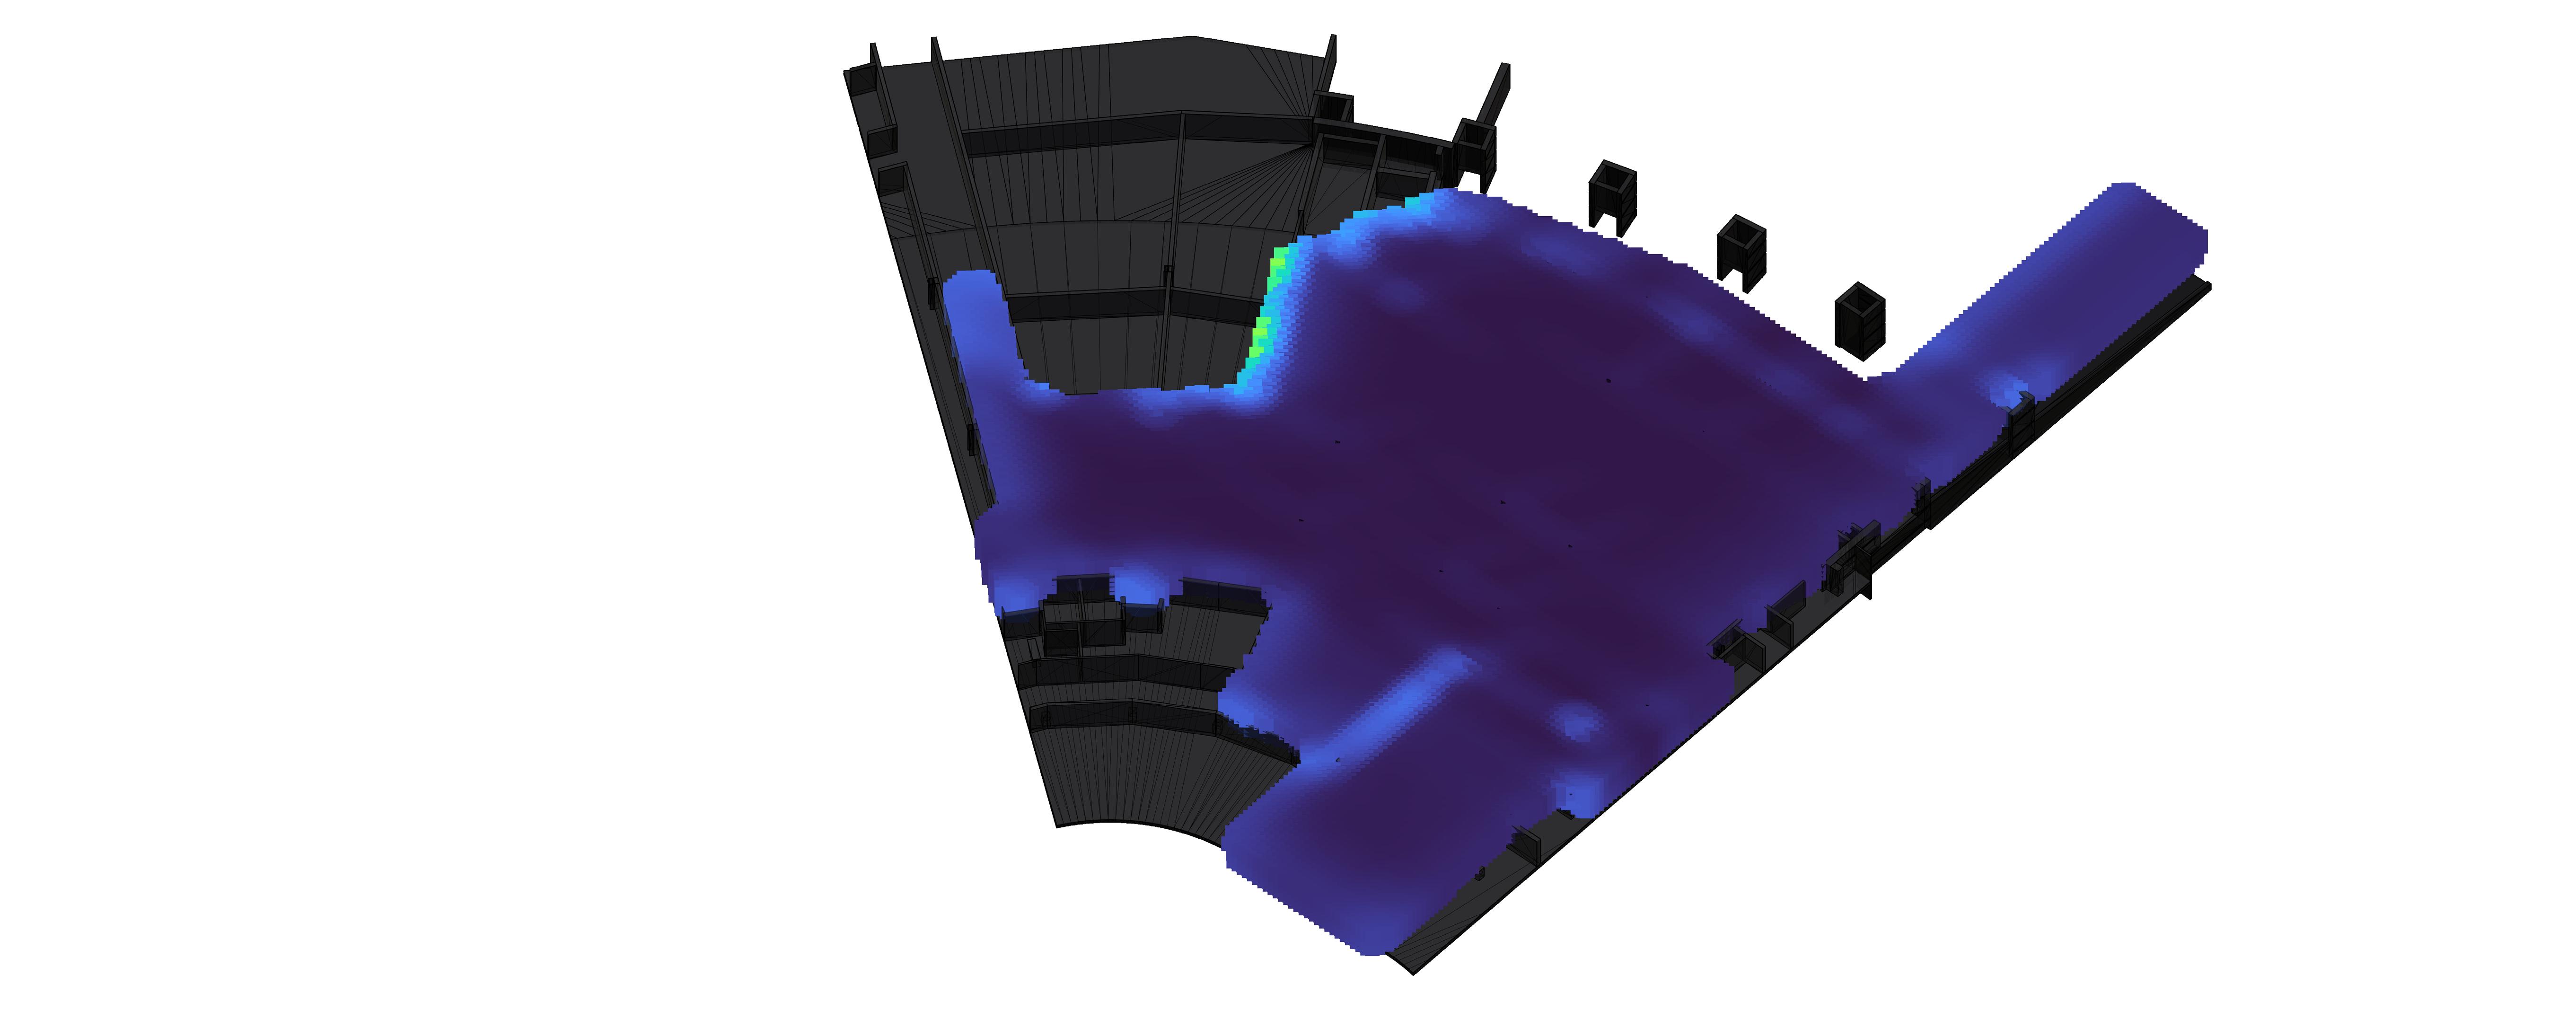
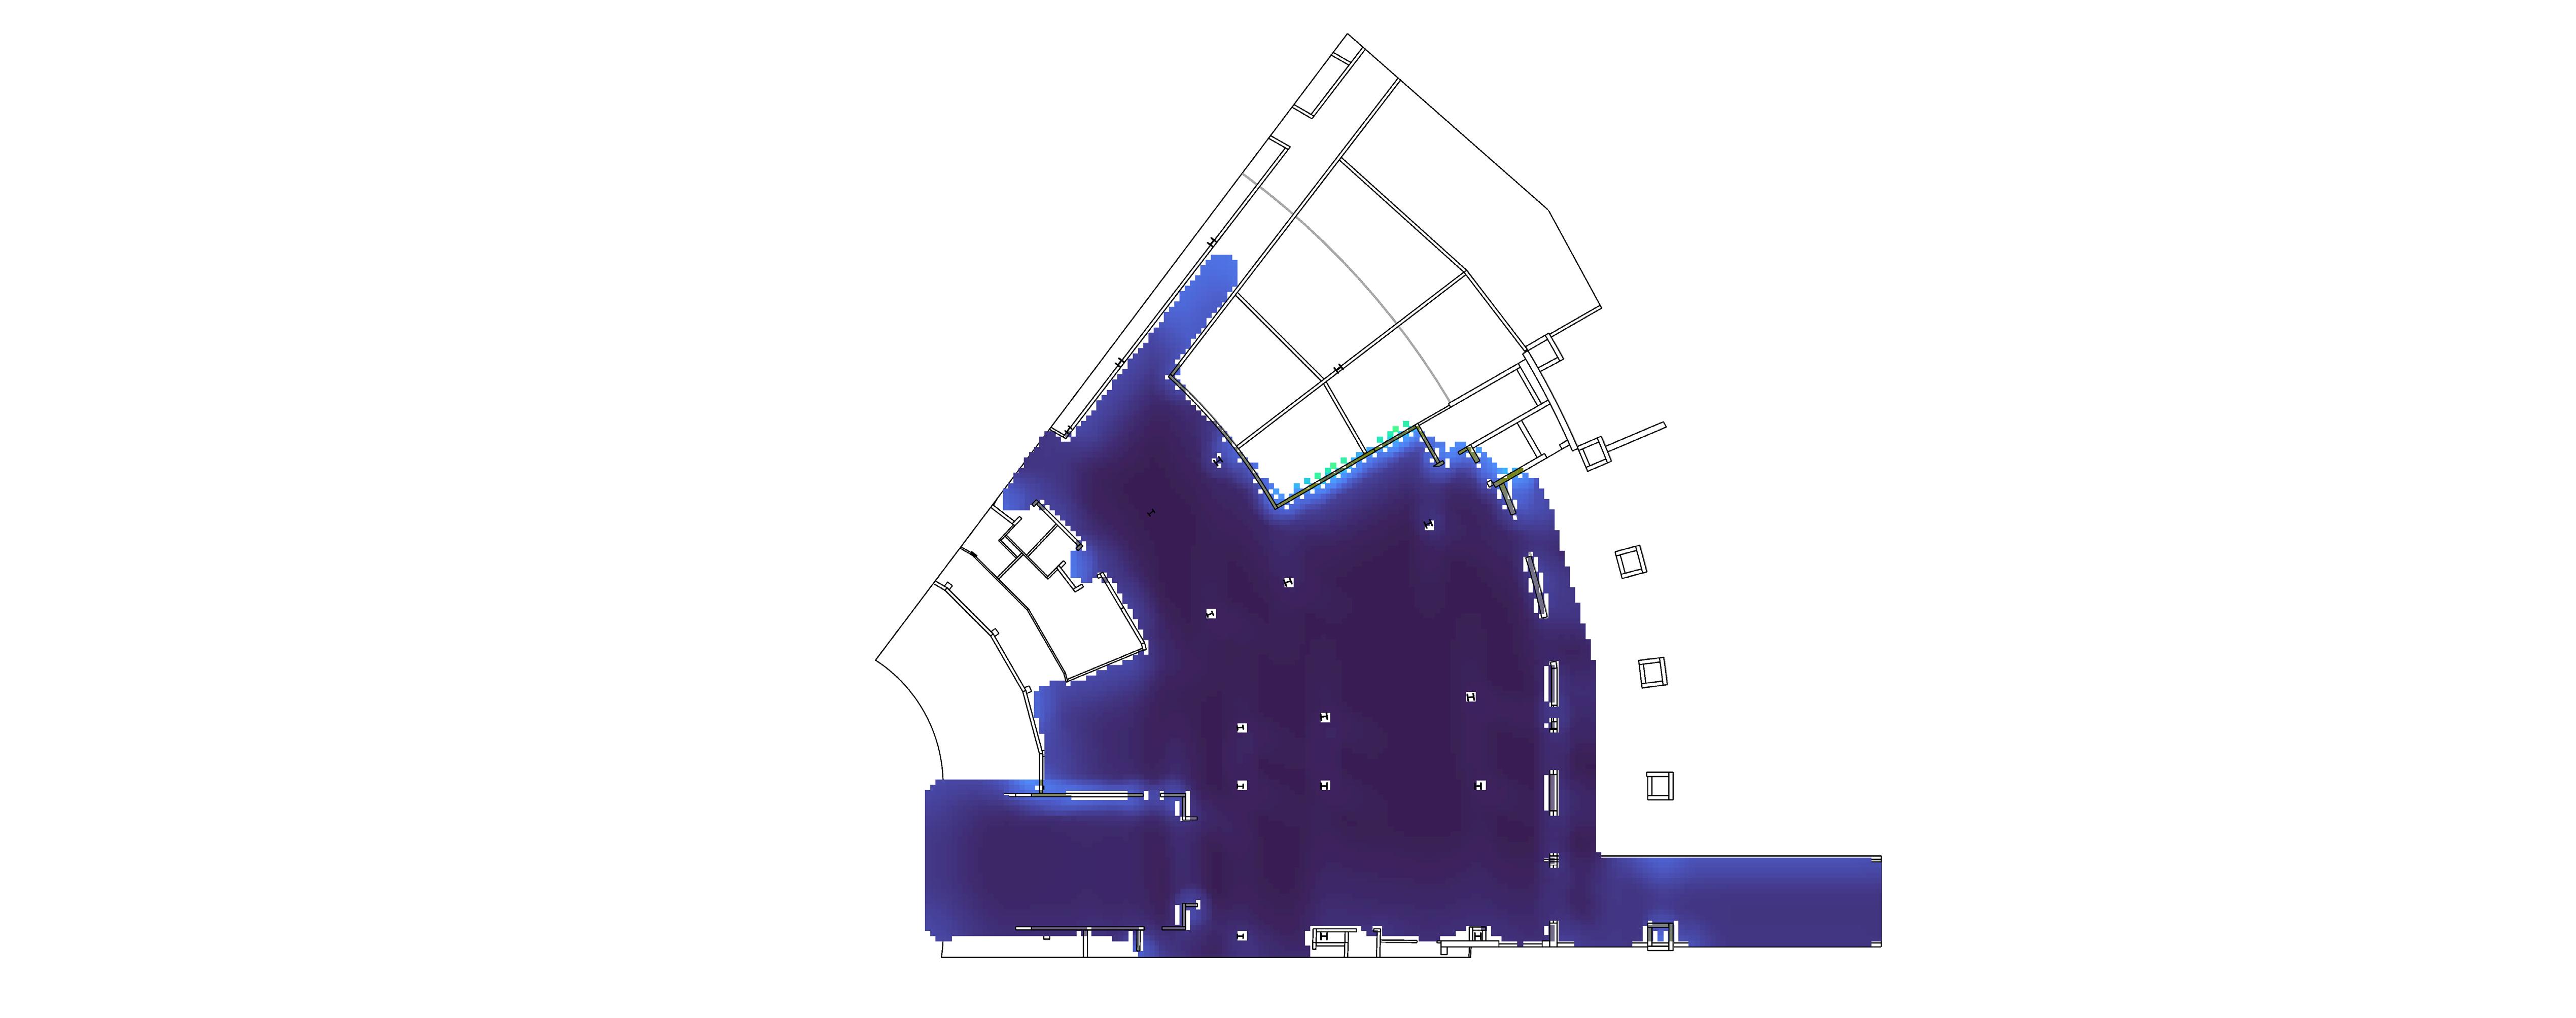
Areas with a low compaction score feel open and suitable for intense circulation. These areas typically mark optimal lanes of travel for fast-moving or unwieldy objects.

“comfortable”pedestrianpath?
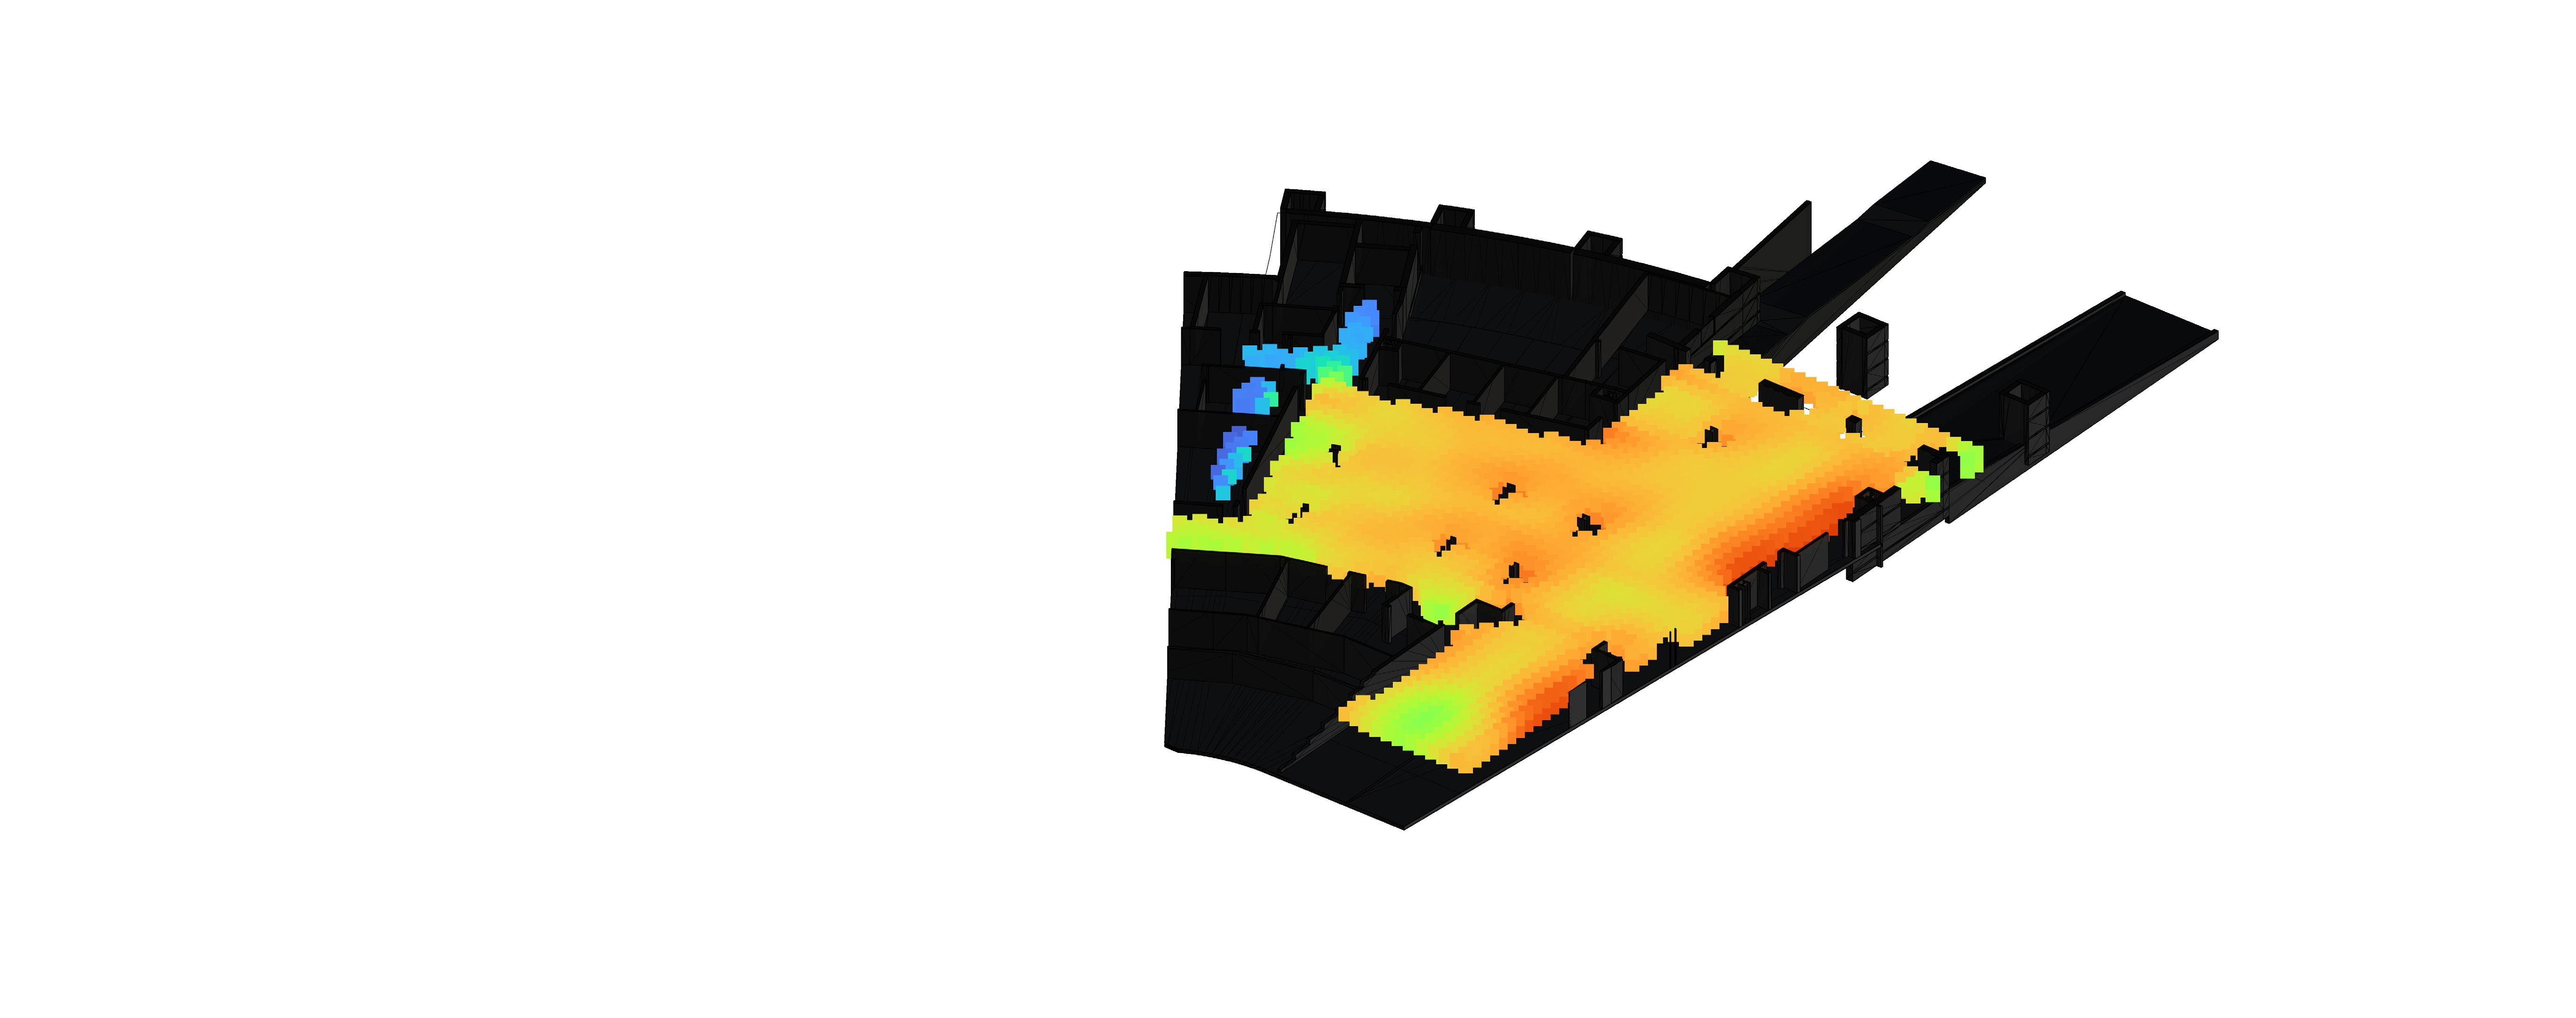
drift destinations

High drift magnitude areas indicate where users are most likely to gravitate towards. This “pulling” sensation can be leveraged to structure implicit circulation networks.
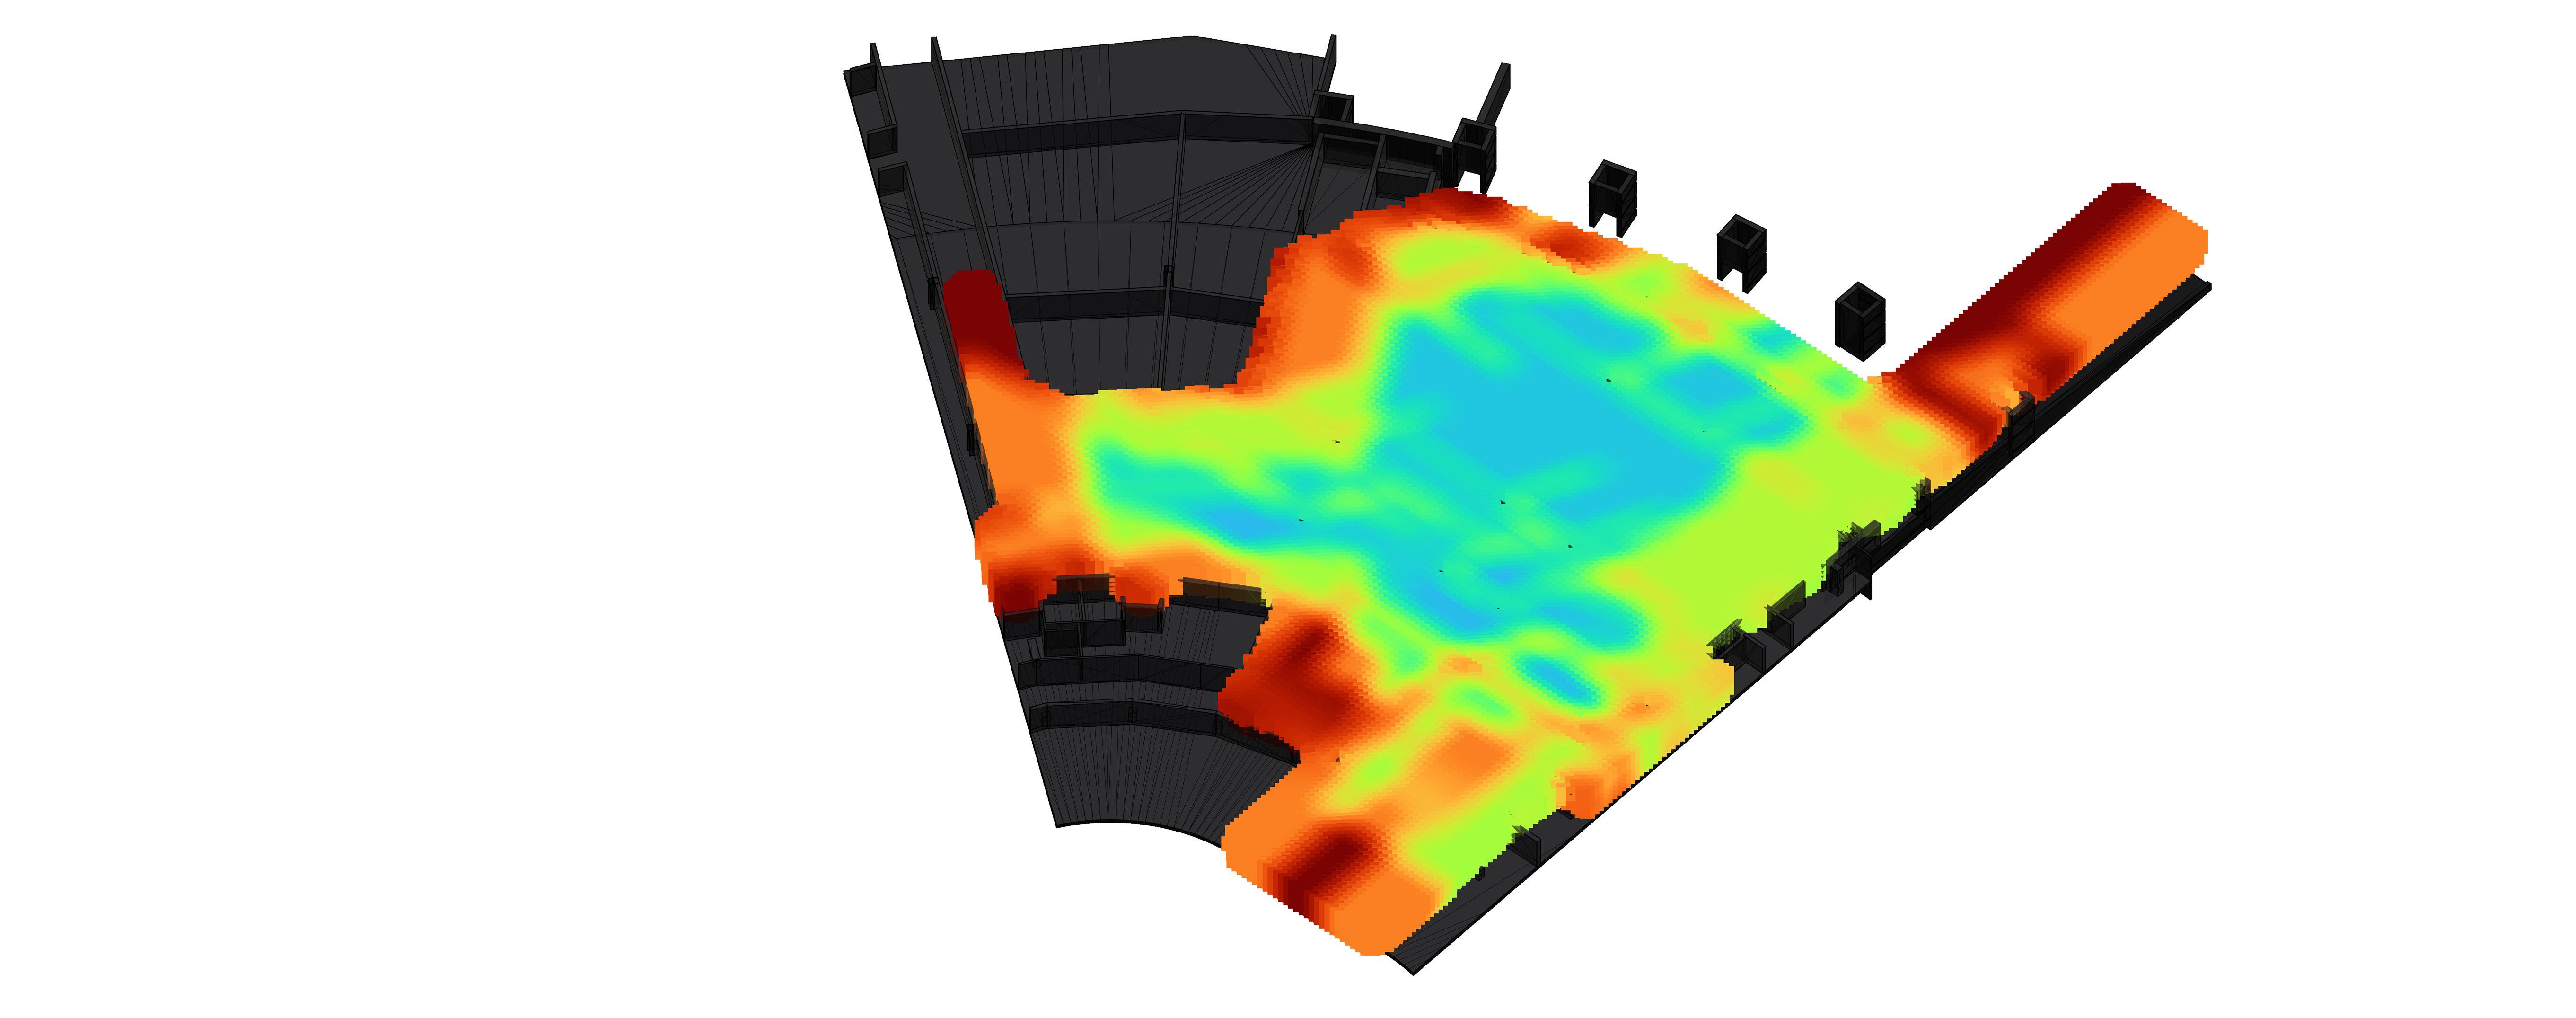
visual barriers implicit rooms / “open” space

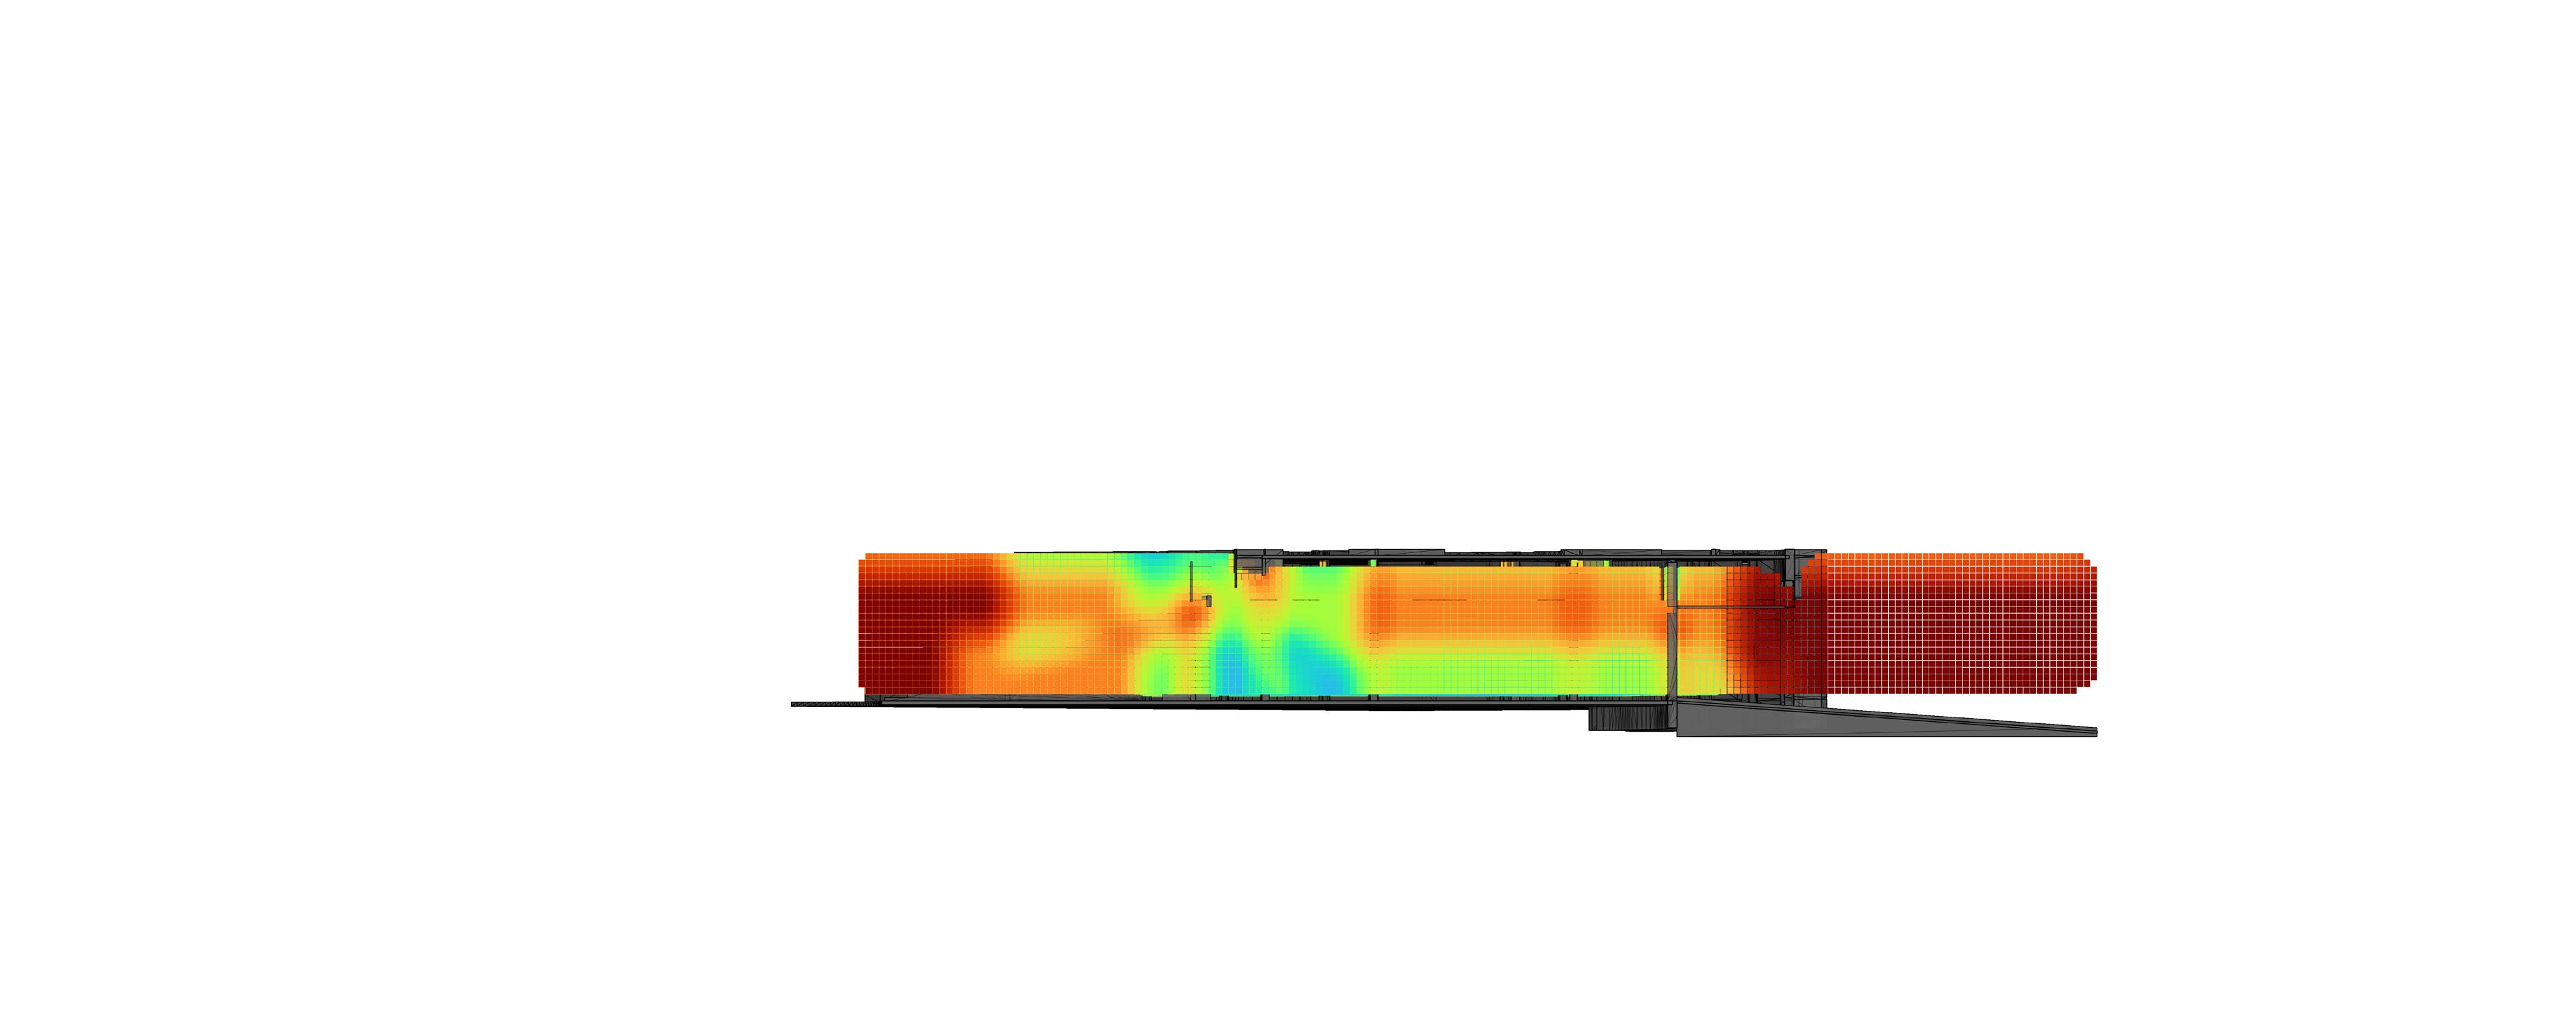


An expanded marshaling area creates new implicit rooms and removes perceived thresholds within the broader space.
circulation region compact expansive


circulation region high-intensity lanes (trucks, cases)
Increased open space makes compaction scores drop, increasing the suitability of the space for the high-speed circulation of large objects.
This change in site conditions shifts the behavior of circulation from network-based to region-based. It also removes structure from the overall circulatory system of the space.

drift destinations potential drift paths

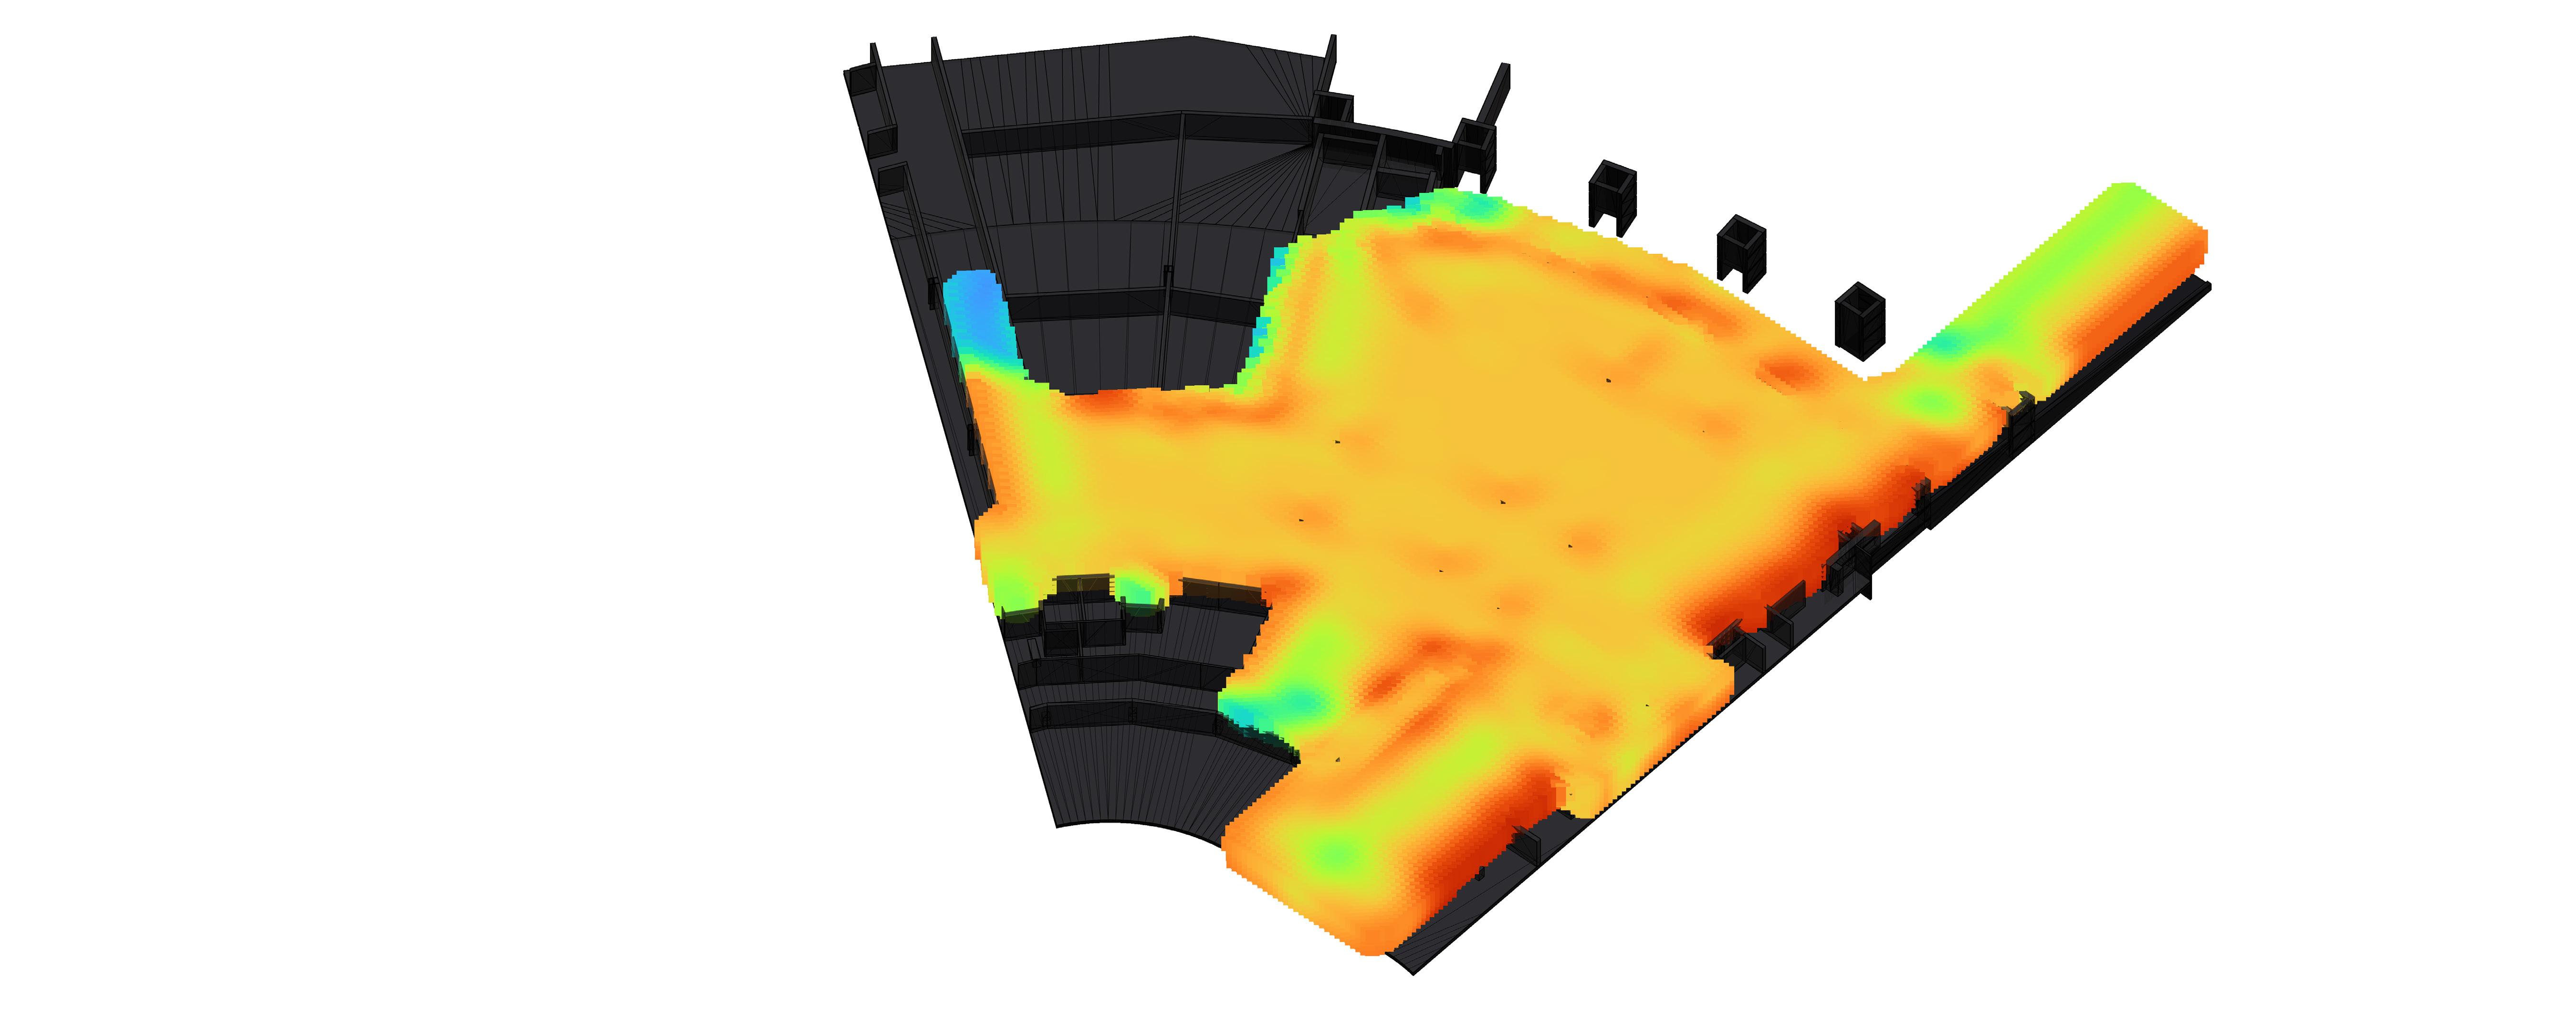


The increased open space afforded by an expansion of the marshalling area heightens the visibility of drift destinations. This inflates their drift magnitude scores. This effect hints at an increase in the probability that pedestrian users will travel across the space by foot to reach paths that “pull” them in. If leveraged successfully, this could greatly benefit the circulation of the space.
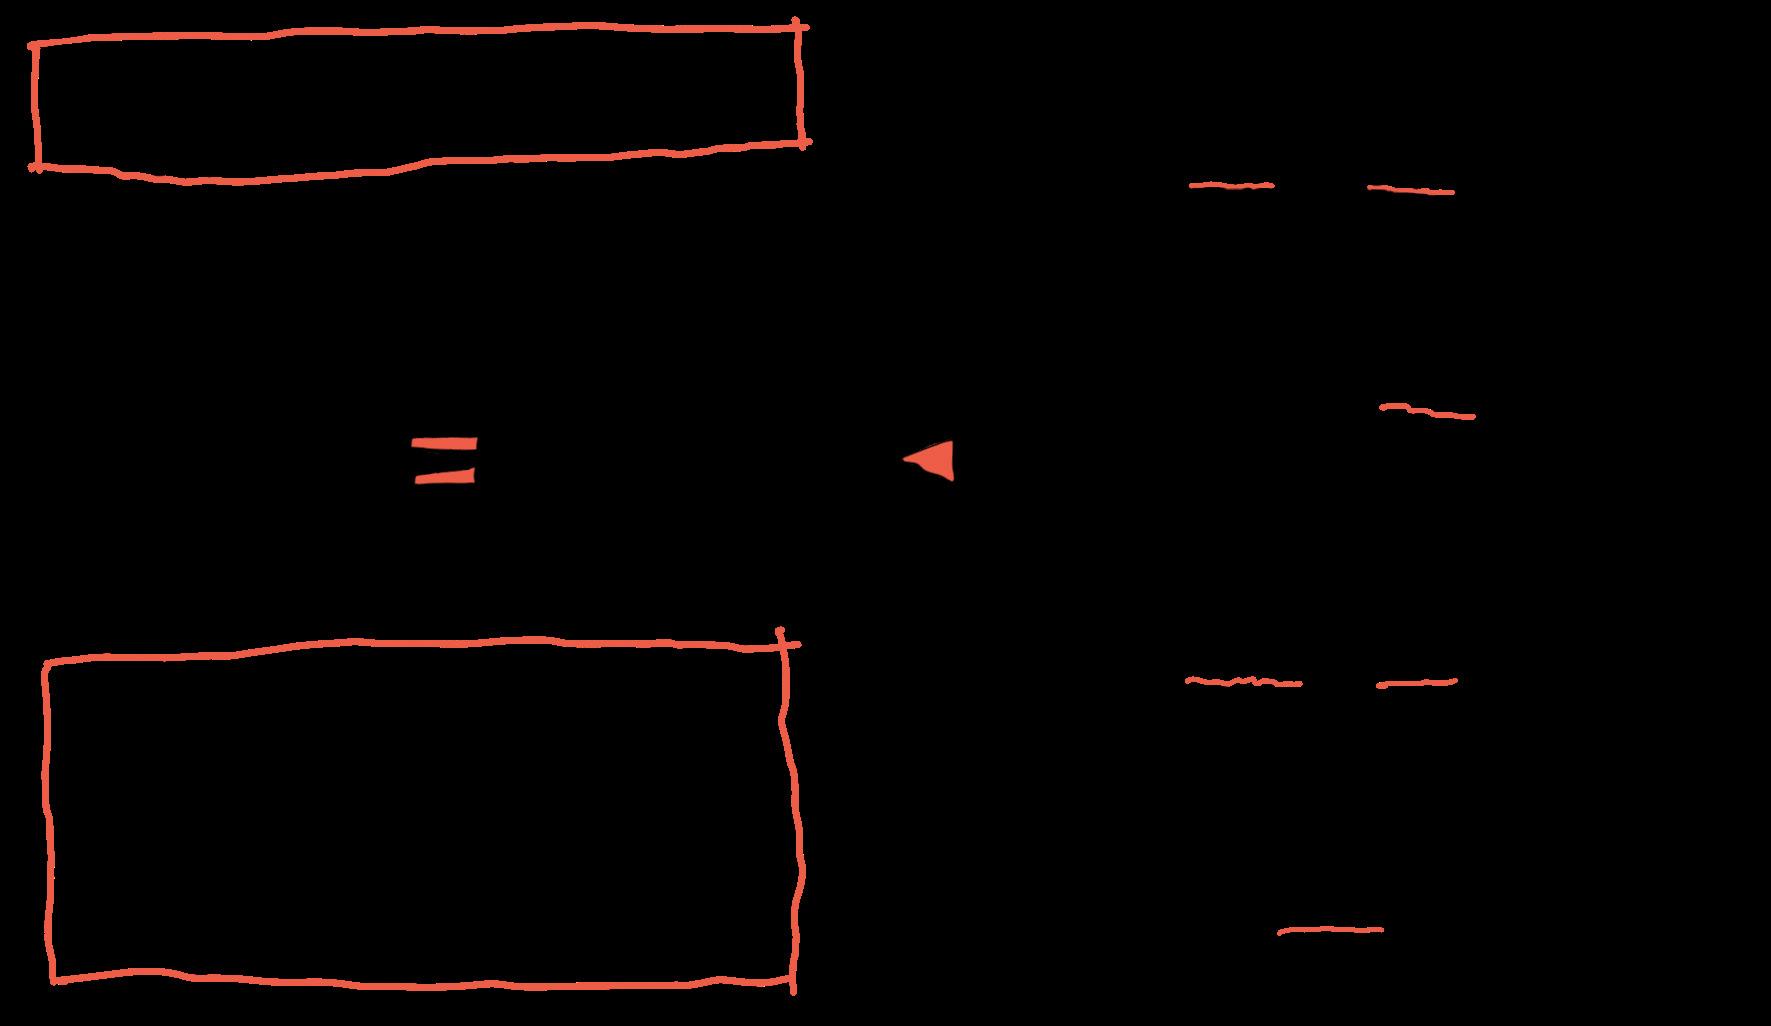
Once I understood the layers of existing conditions, I developed a method to combine them using decision logic to infer where implied circulatory pathways might be.
I vetted this approach using simple shoebox models before I applied it to the arena.



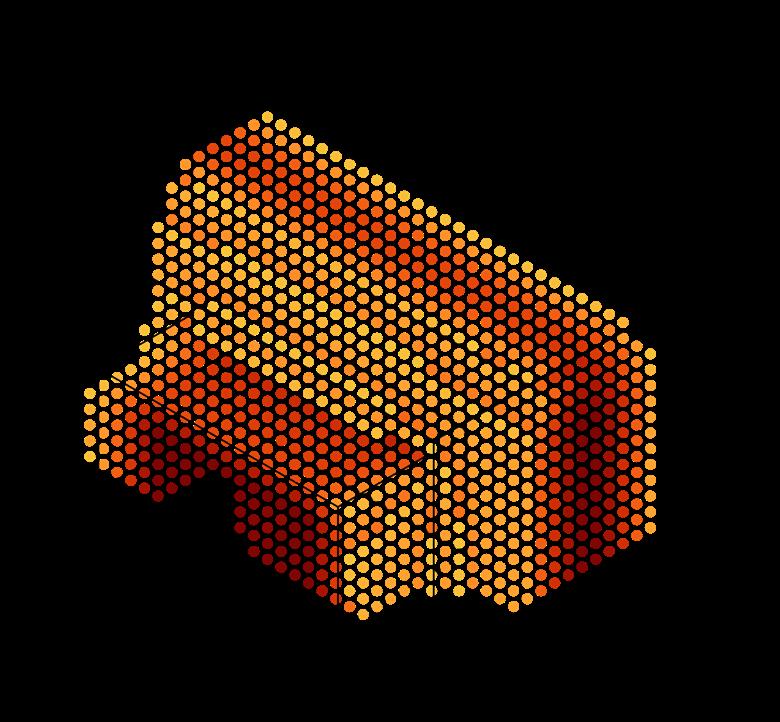




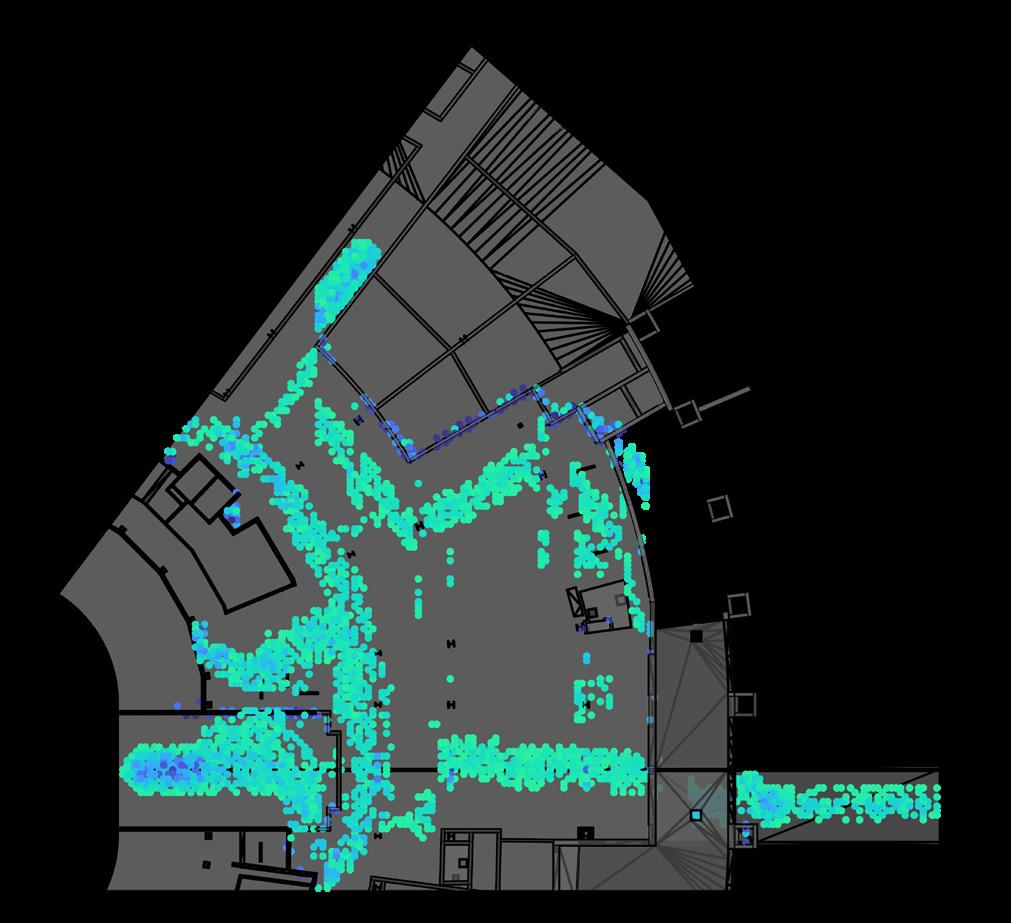
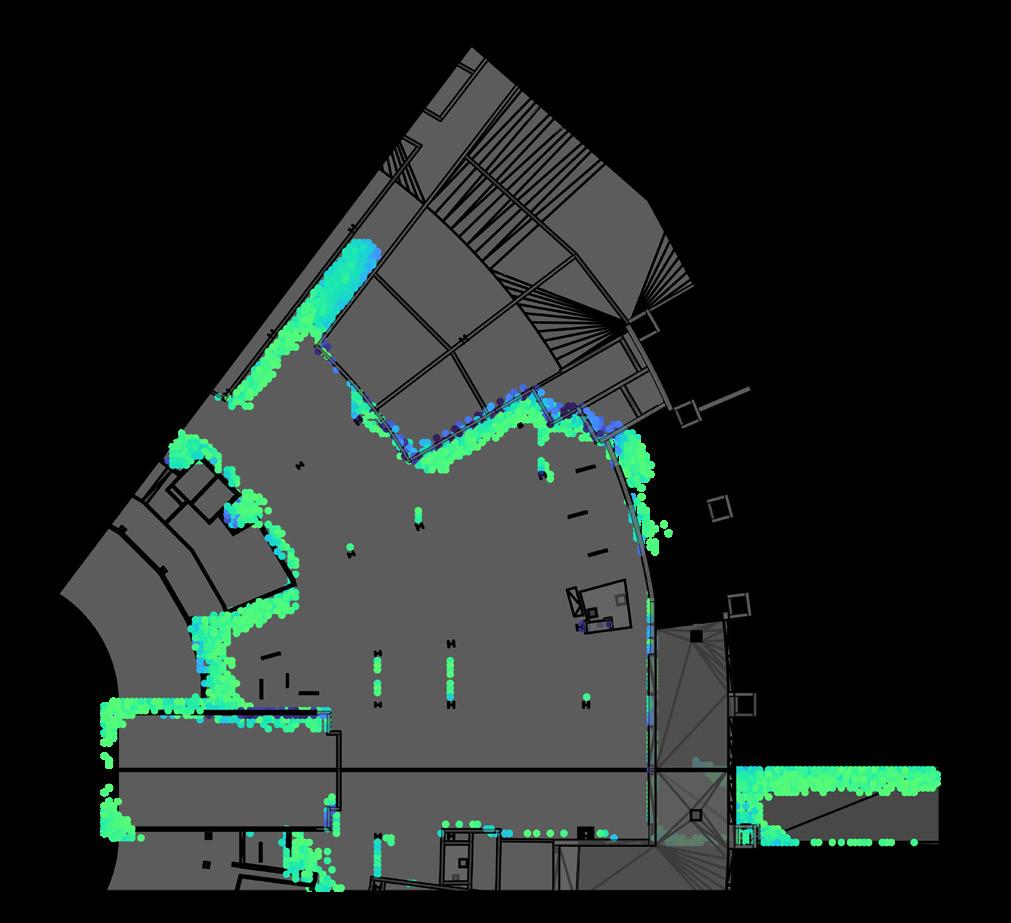

drift magnitude occlusivity compaction sight distances
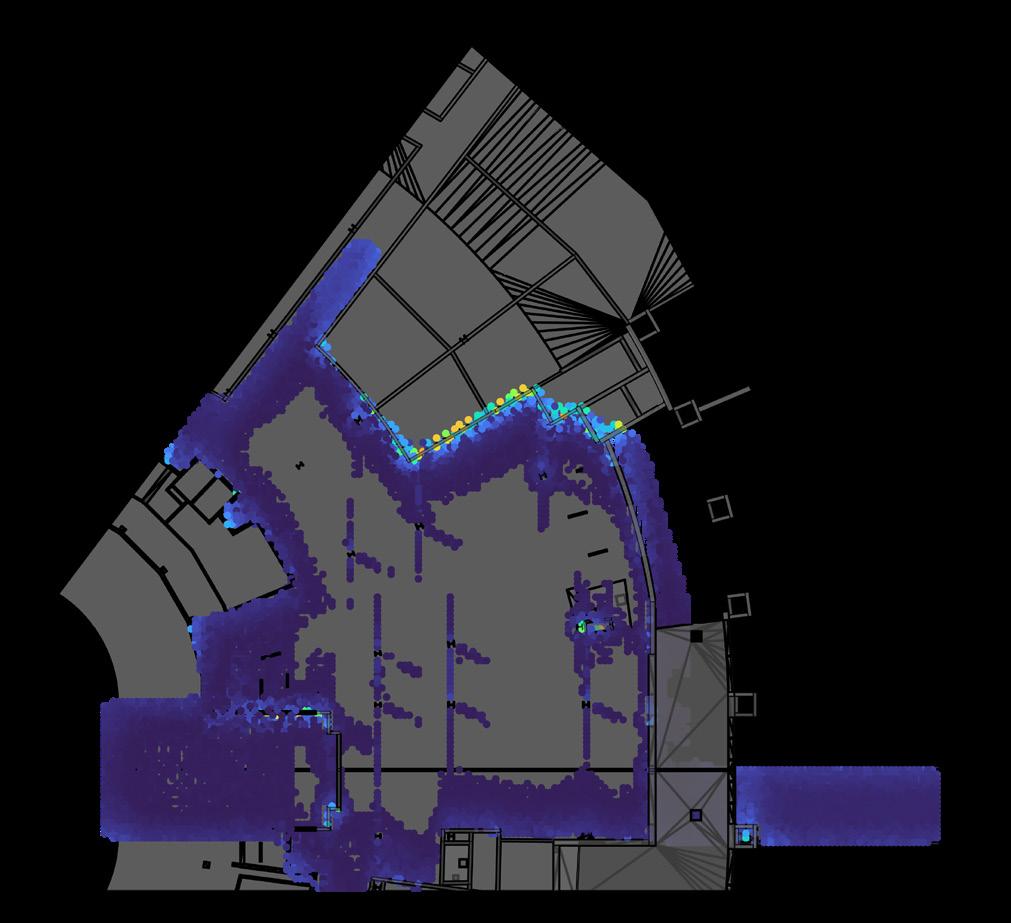
I conducted the same approach for a potential design.
This allowed me to make inferences about how circulatory conditions could change, and what new problems might need addressing.
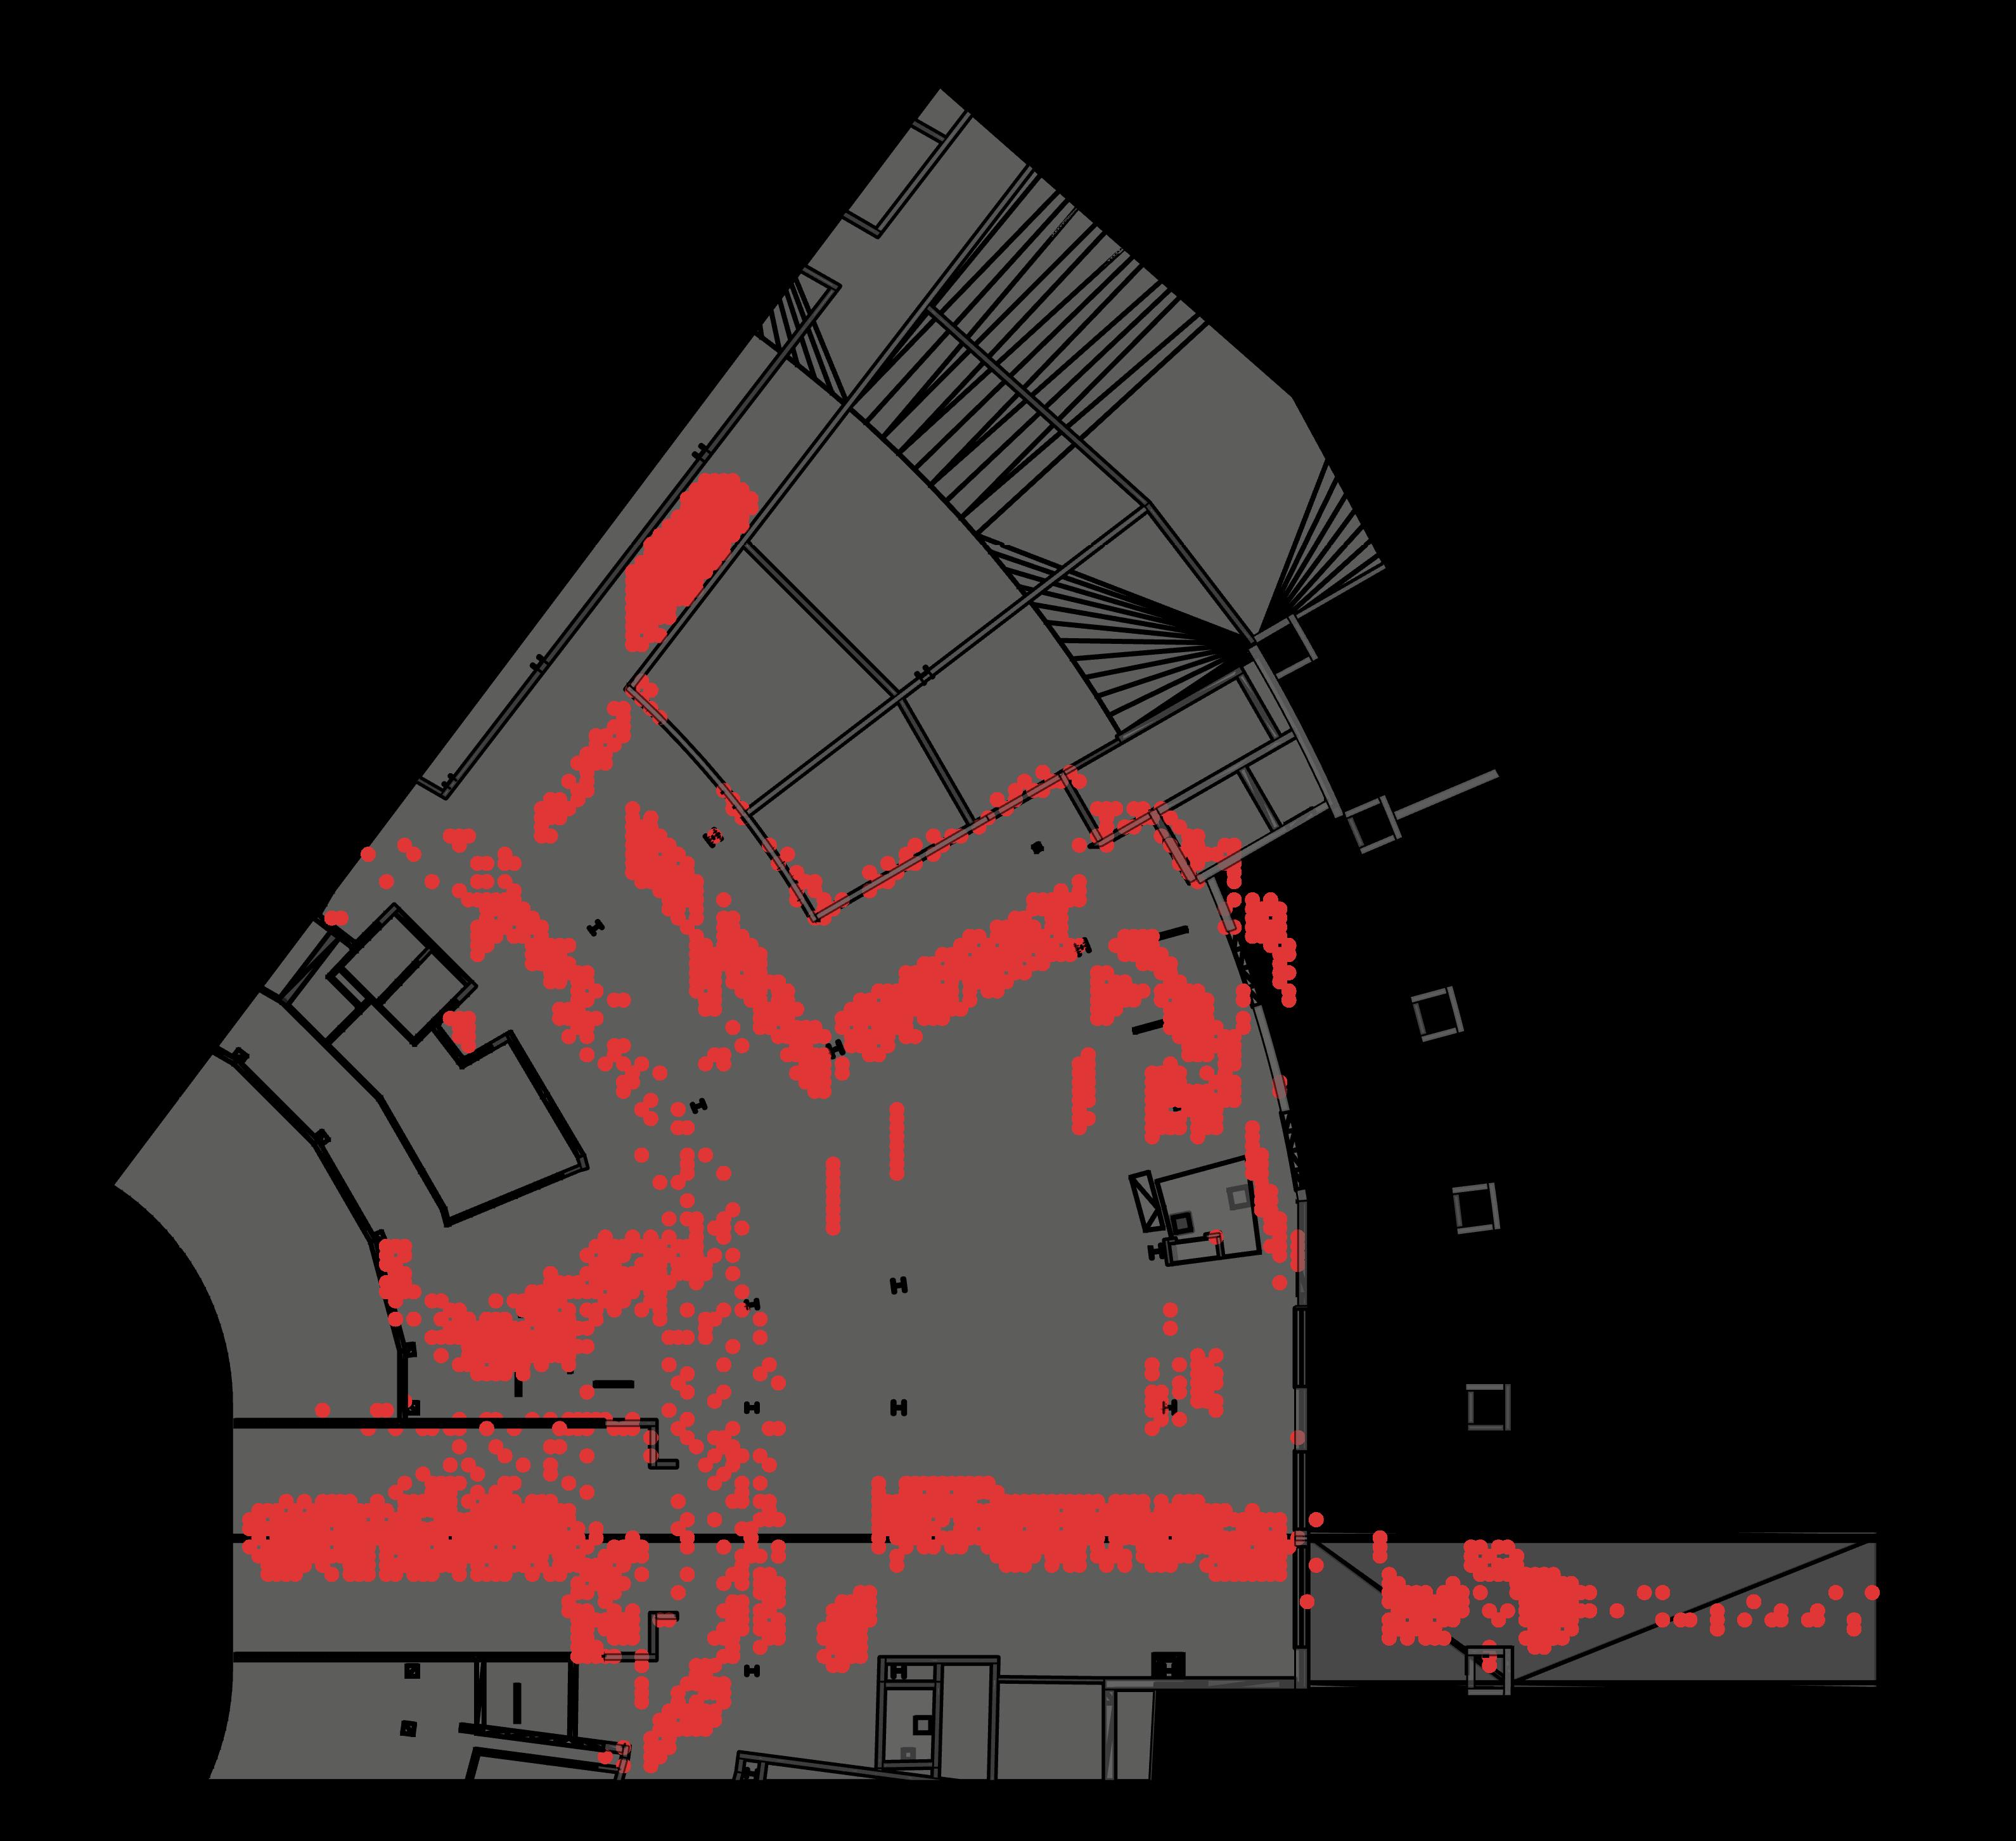
calculated corridors
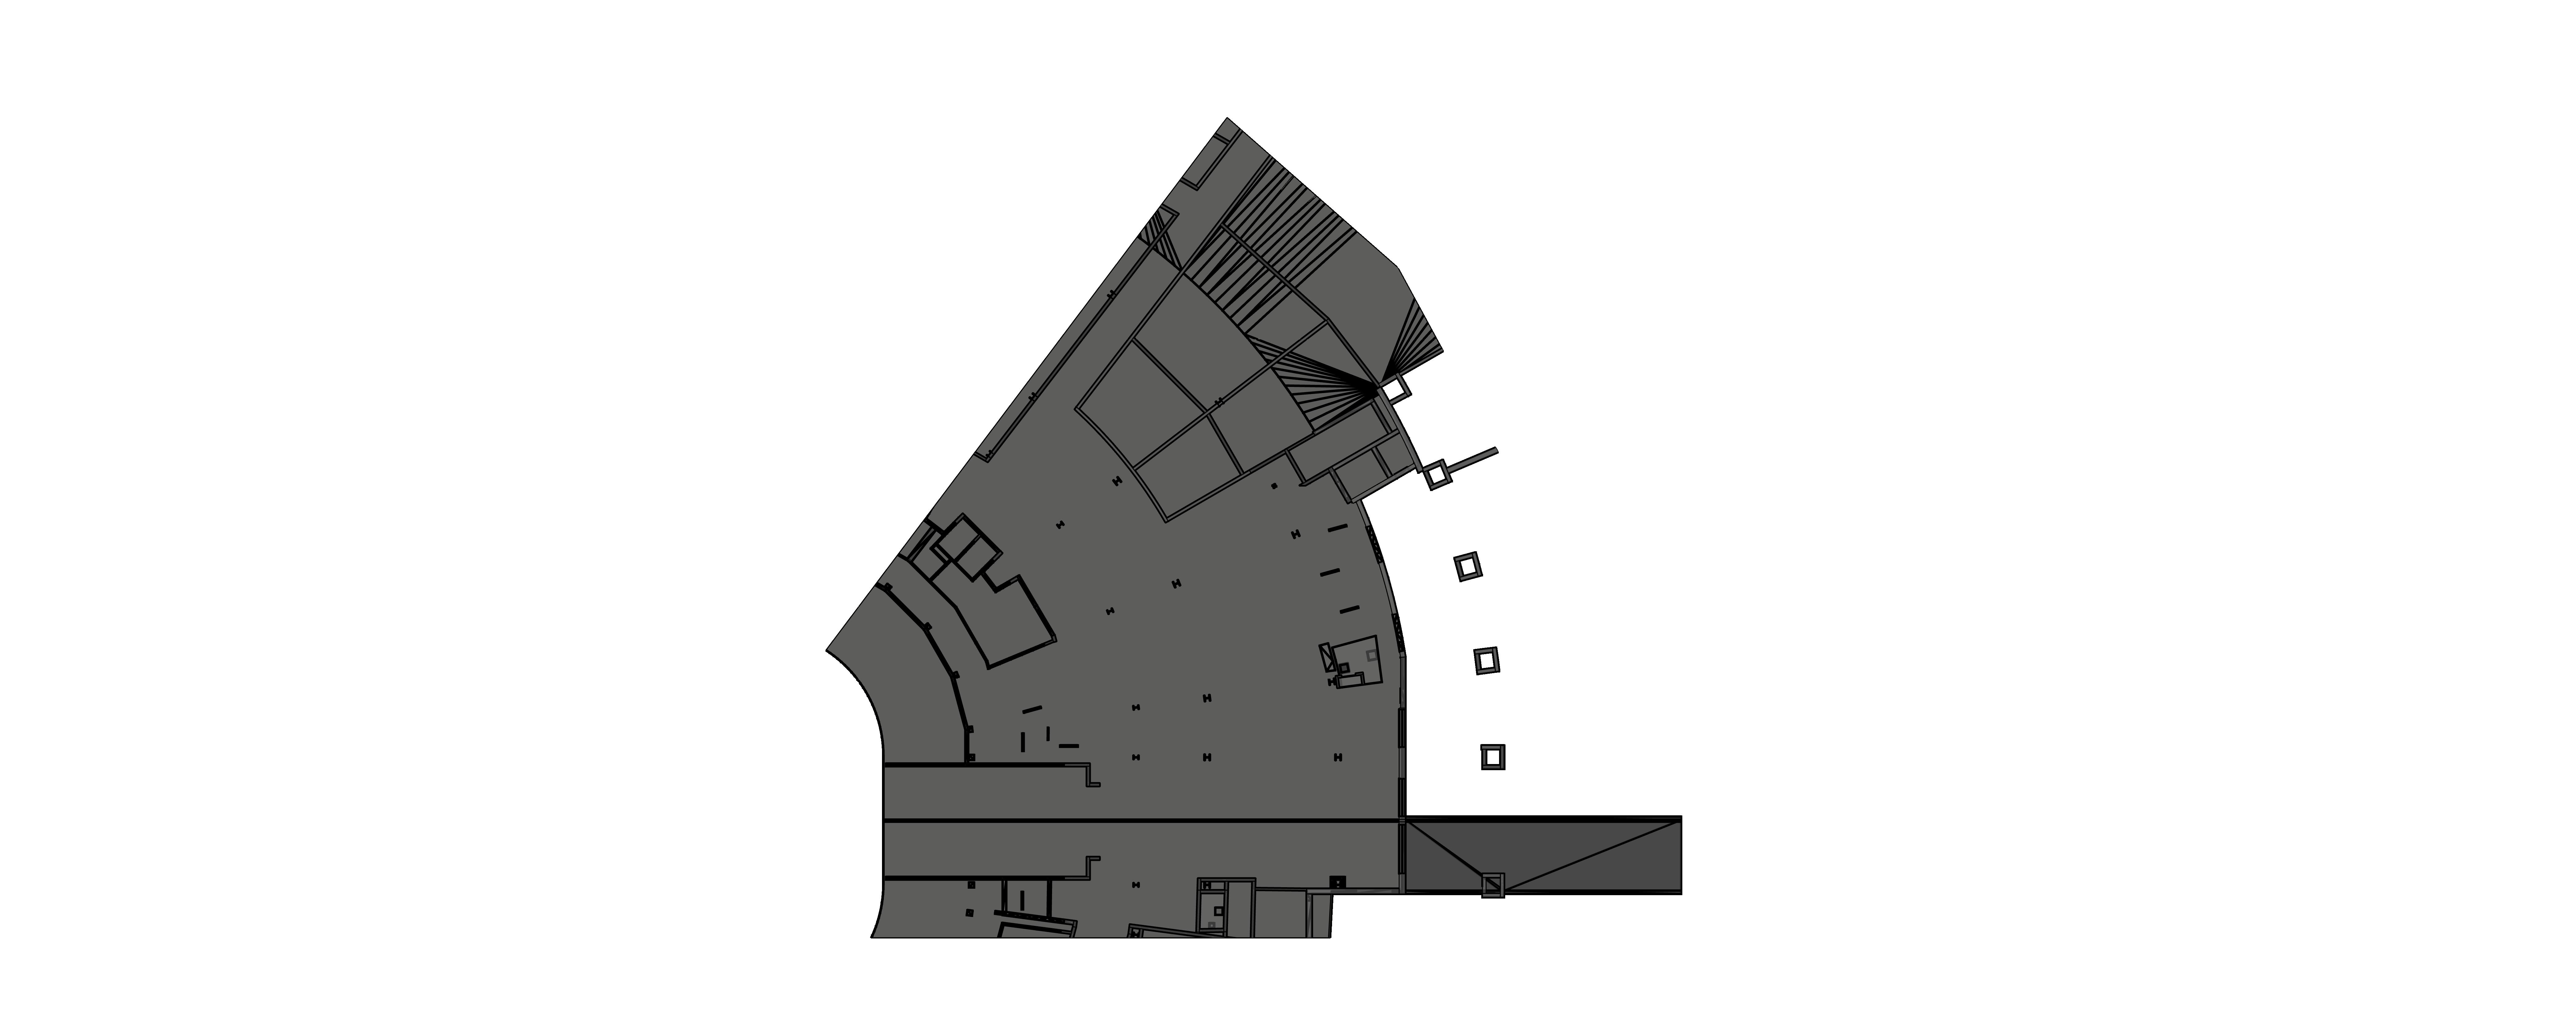
talent lane
support lane
equipment lane
Talent Lane:
A lane of travel designed to facilitate the quick ingress of booked talent at The Well, while minimizing interaction between them and the equipment lanes.

Support Lane:
A lane of travel for the highintensity ingress and egress of tour crewmembers. This lane primarily passes through loading and unloading areas, increasing direct access to their work areas.
Equipment Lane:
A zone reserved for the movement of equipment through the marshaling area. This lane is optimized to avoid talent and support lanes to minimize potential human/equipment collisions.
“Geometrical divisions of space directly correlate to increases in the space syntax and isovist property scores that indicate potential existence of an implicit pathway, suggesting that their use could be beneficial in optimizing wayfinding and circulation2.”
How can we improve the performance the Well’s of existing circulatory pathways and begin to define new ones?
By understanding theories of spatial perception, we can establish a toolkit that allows us to add to, subtract from, and divide implicit spaces. The most versatile ways to do this are with thresholds -- usually expressed using changes in color, lighting conditions, or materiality -- and horizontal planes1. Use of these geometrical divisions of space directly correlate to increases in the space syntax and isovist property scores that indicate potential existence of an implicit pathway, suggesting that their use could be beneficial in optimizing wayfinding and circulation2 .
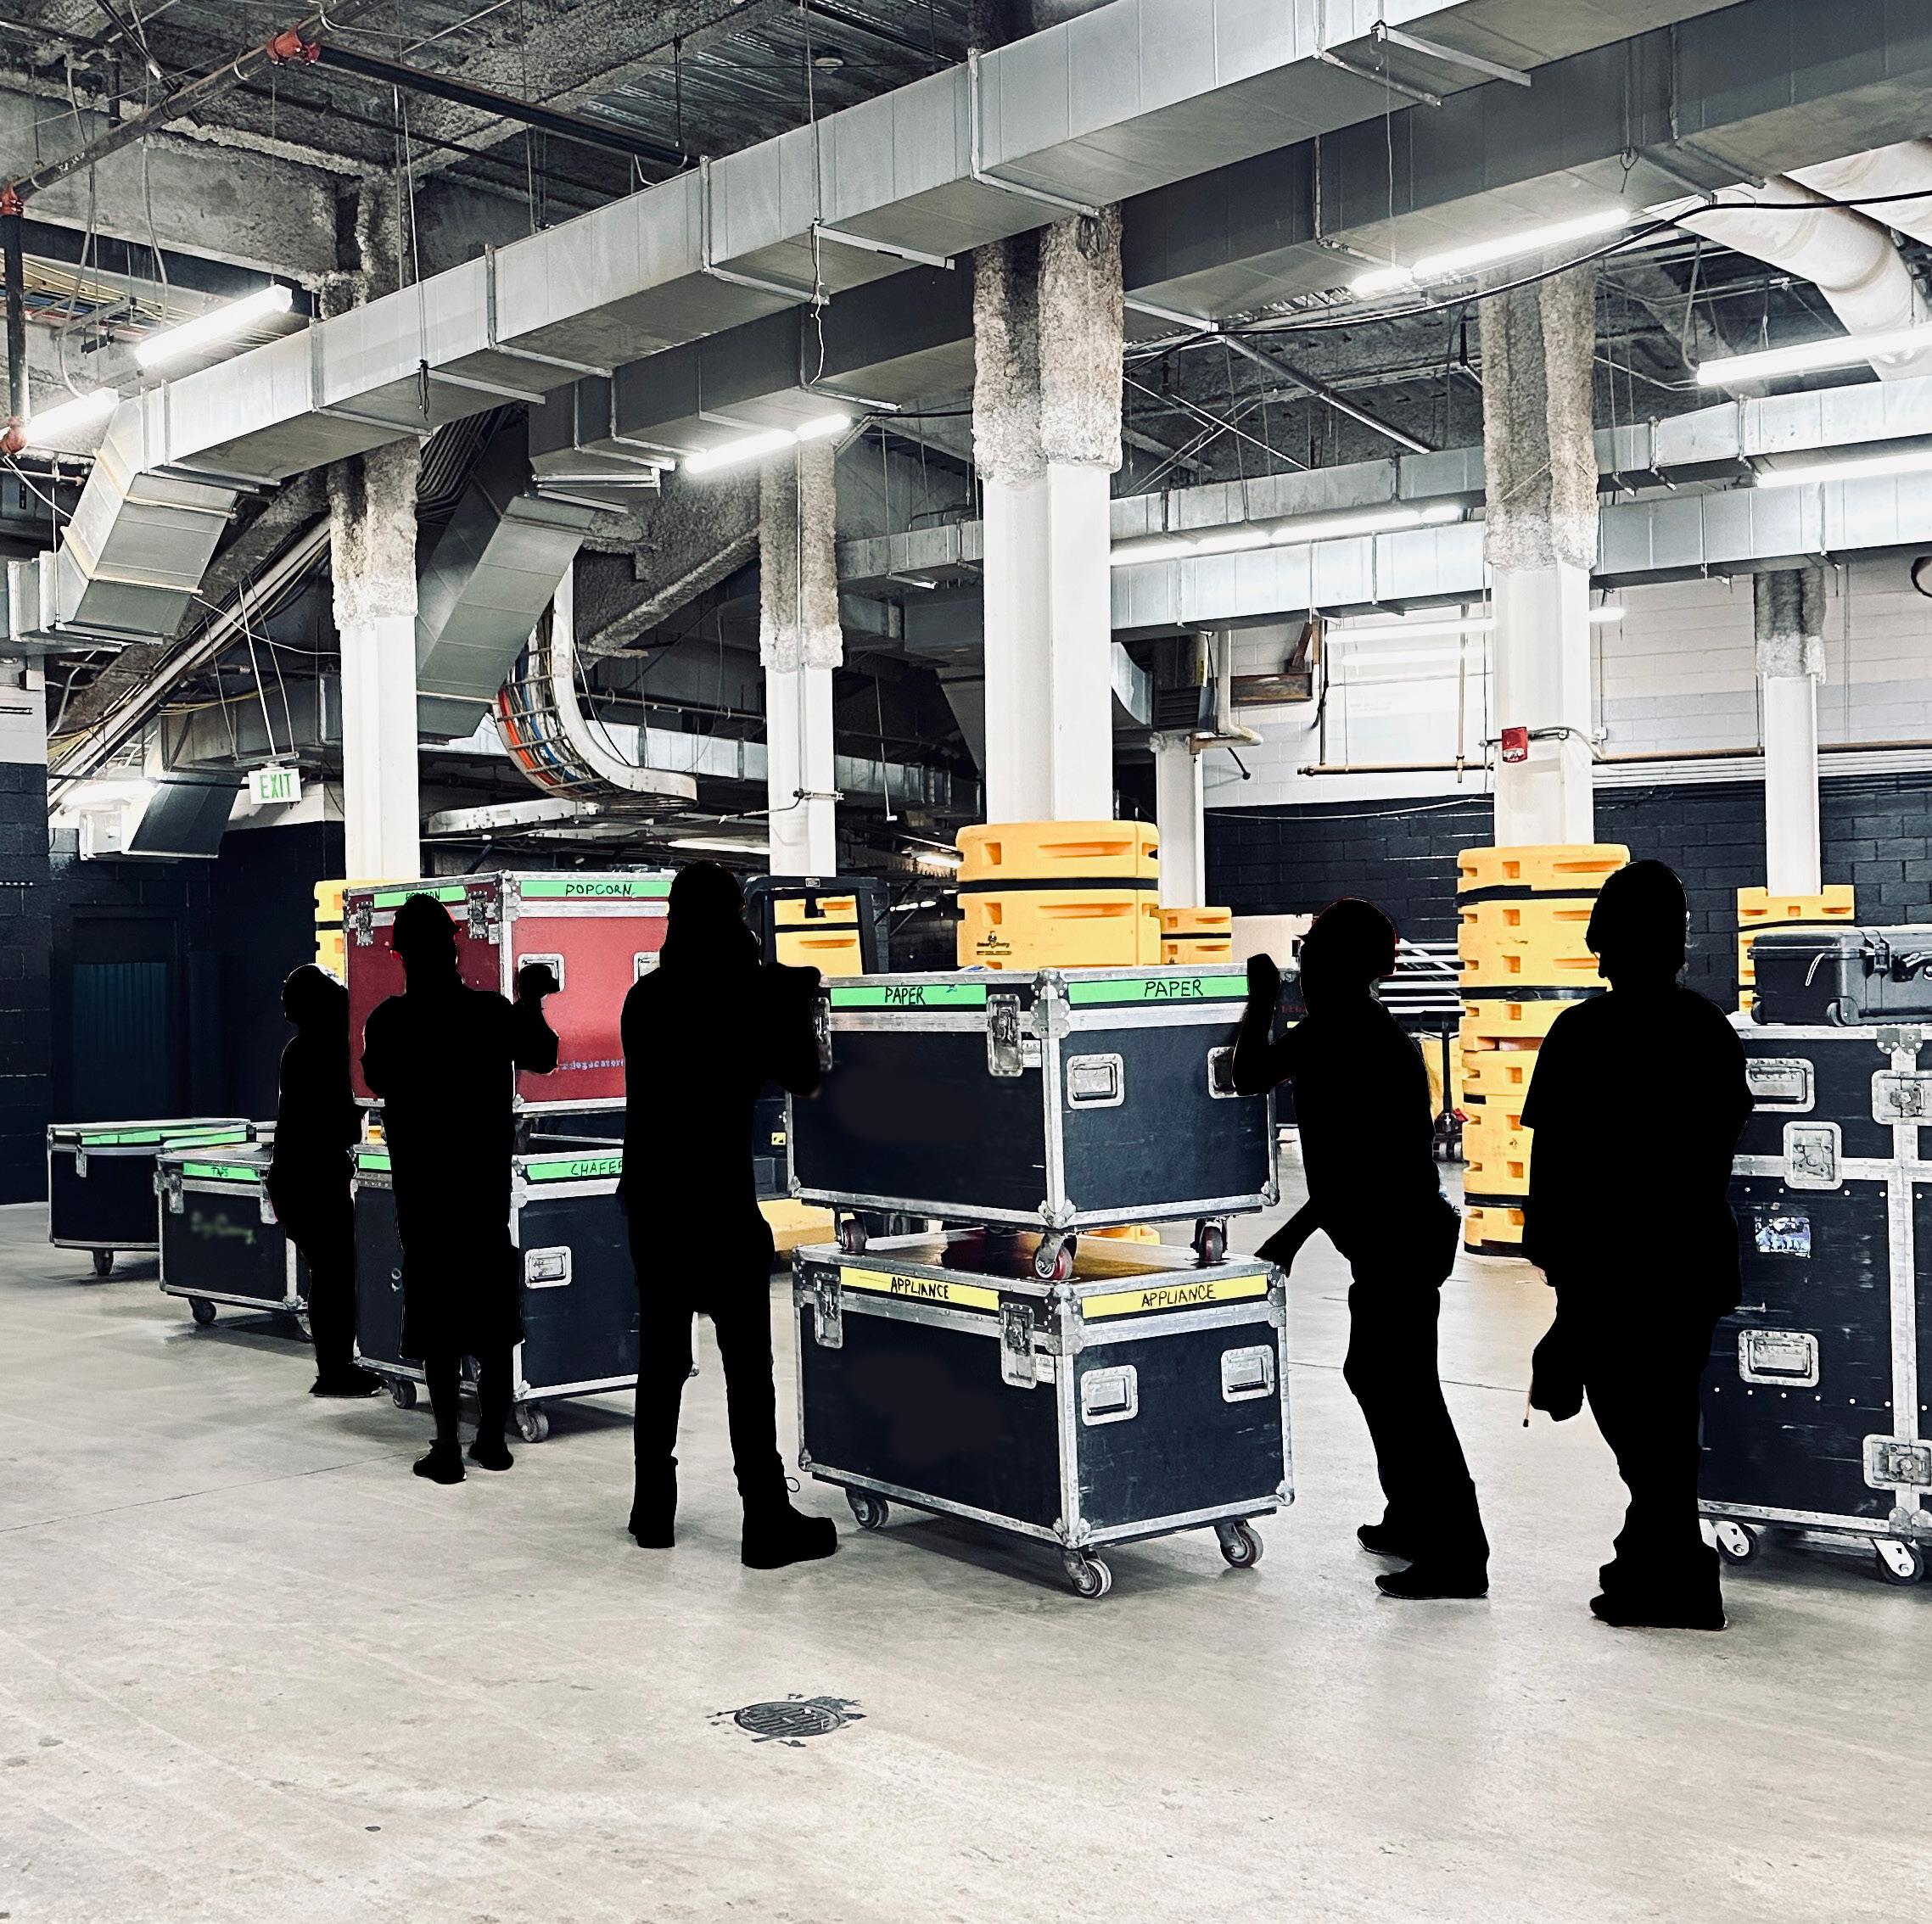
Key lanes of equipment travel act as implicit corridors when shows are loading and unloading.
The use of thresholds for wayfinding isn’t novel, but the implementation of unconventional approaches like planes and multisensory elements isn’t common either. One example of this approach is the Center for the Blind and Visually Impaired, by Taller de Arquitectura - Mauricio Rocha
in Mexico City, MX. This project takes advantage of what we are naturally predisposed to see as paths3. In spaces without welldefined circulation, humans tend to follow edges. By leveraging and reinforcing this psychology, Rocha was able to create bold circulatory paths without the need for traditional hallways.
The same effects can be observed and enhanced at the Well. By populating horizontal planes over key circulatory pathways, we can increase their pathway-correlated isovist property scores, indicating a stronger perception of the areas as corridors by users.
Hard boundaries at the Center create implicit corridors1
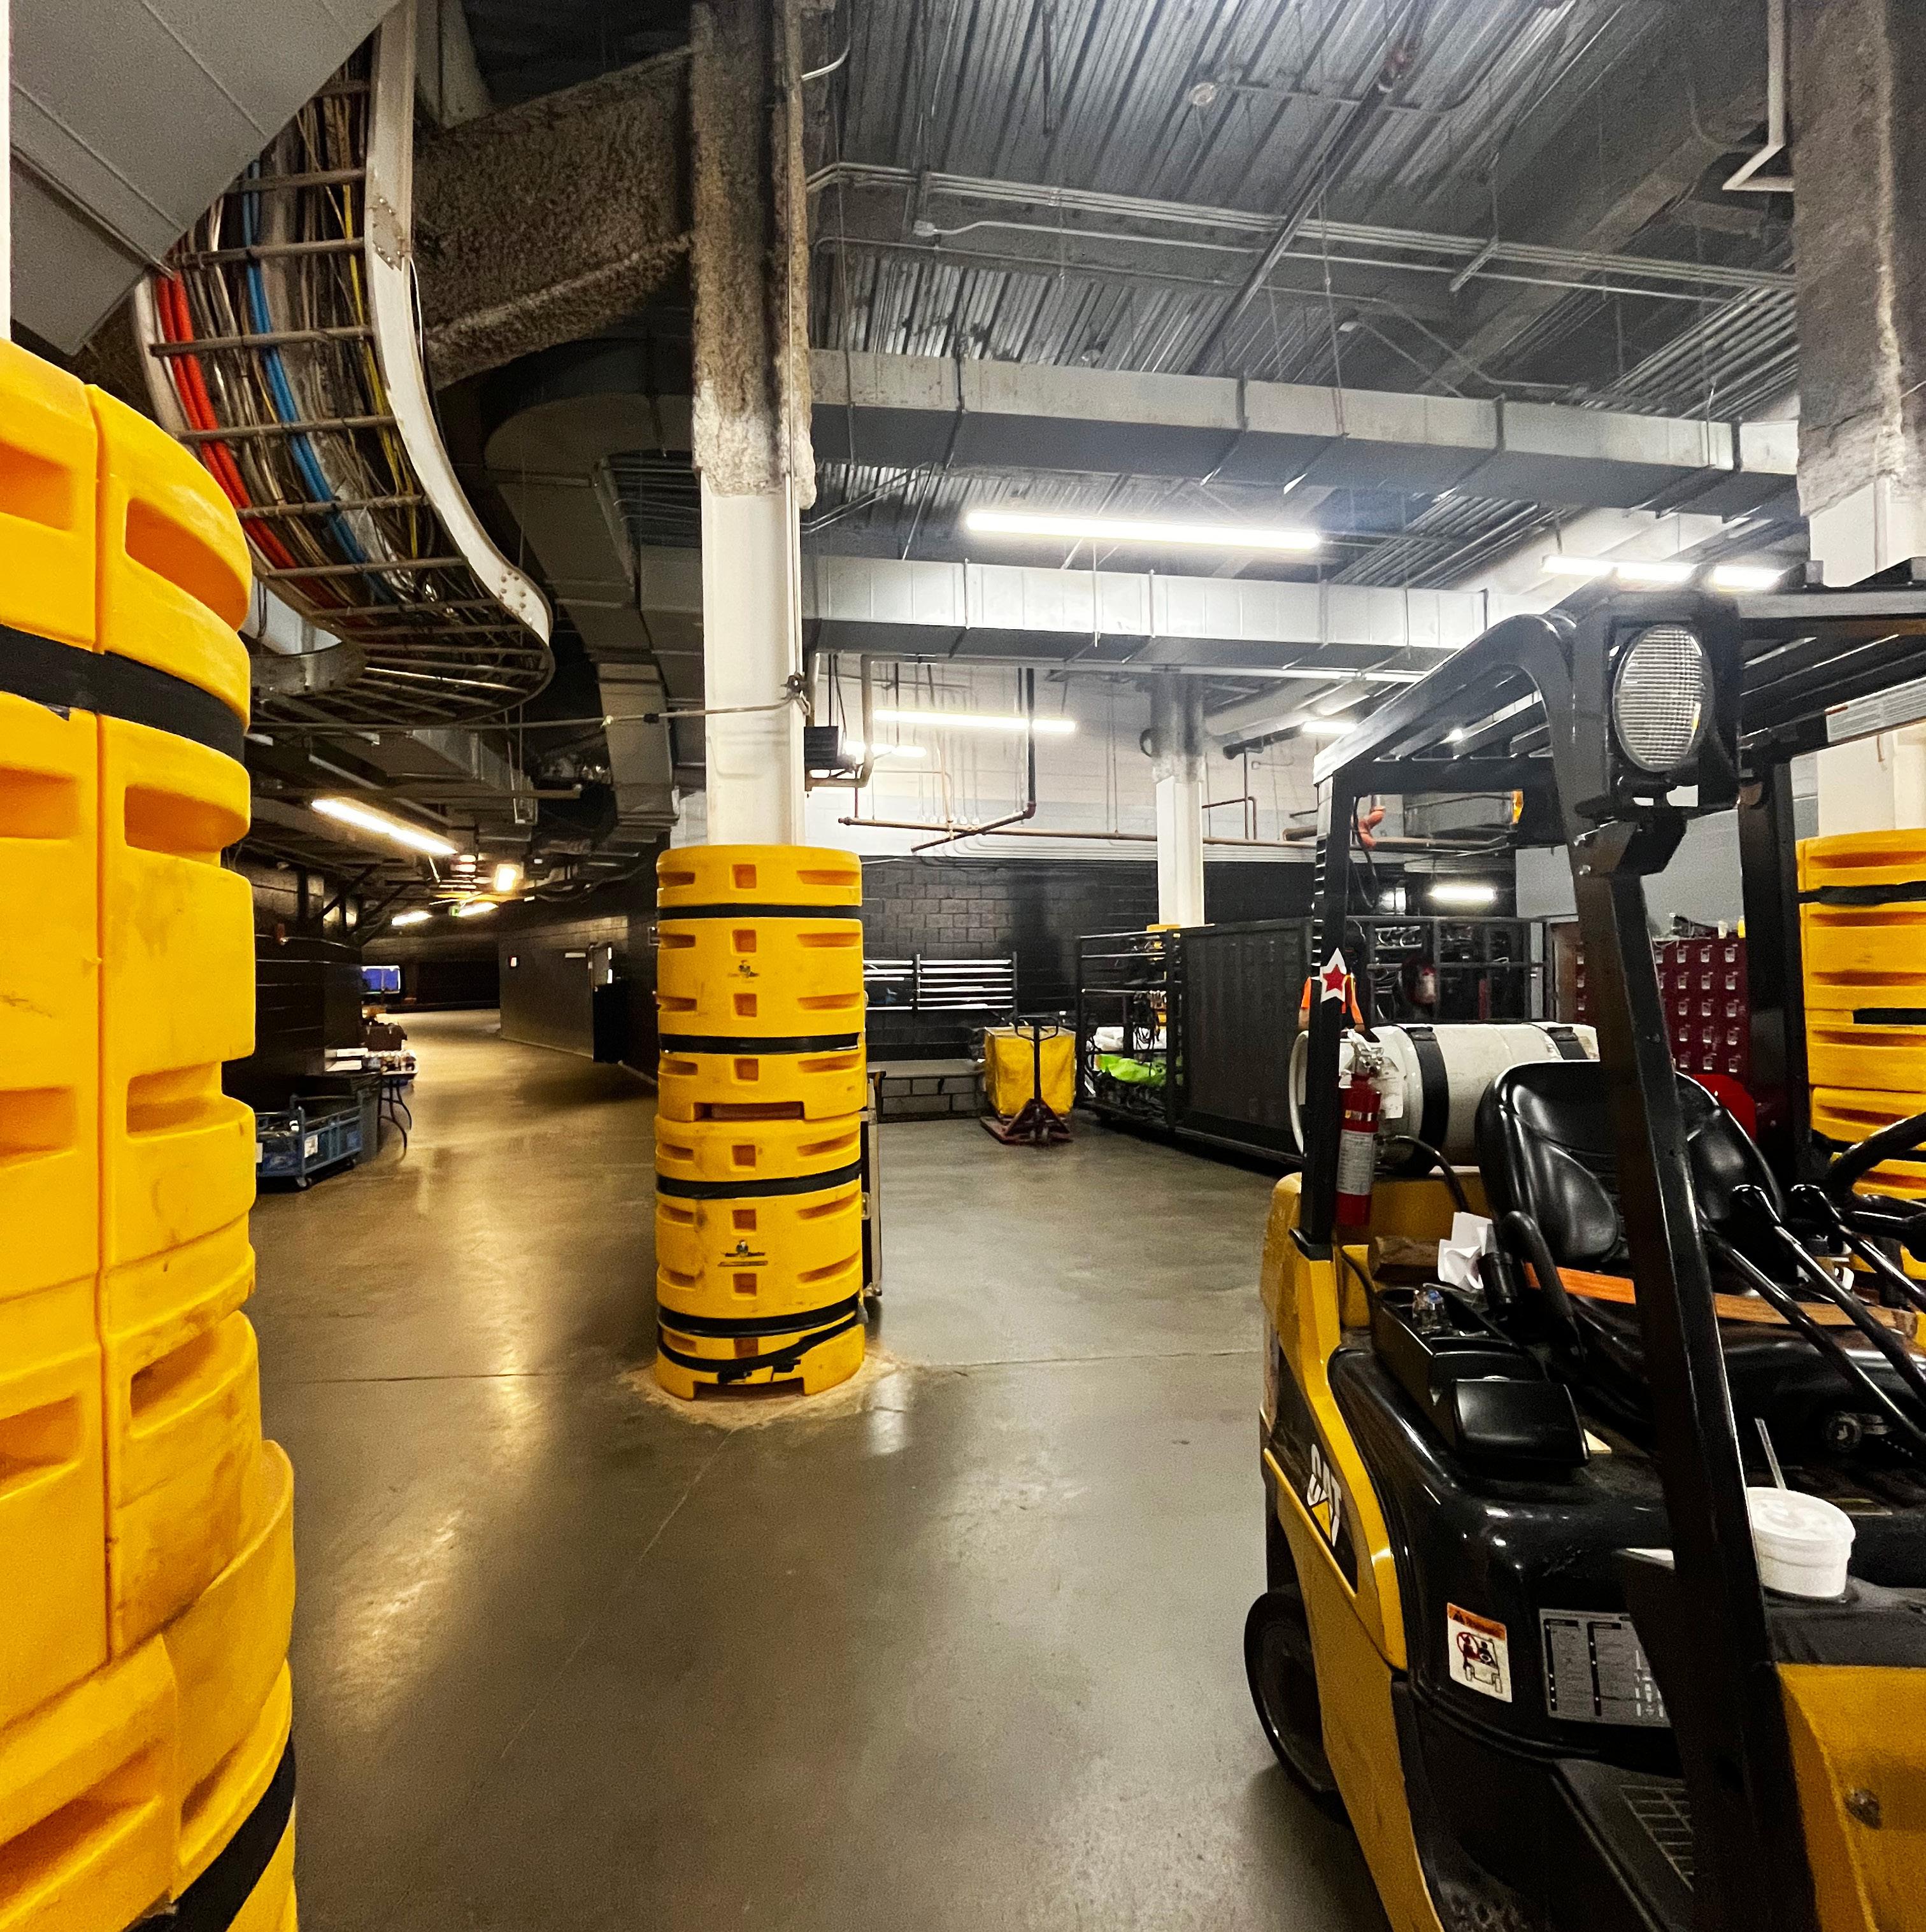
Is there a way to echo these boundaries to reinforce the Well’s existing corridors?
In the same manner, horizontal planes can create and reinforce spatial thresholds. Rocha does this in two ways: first through perpendicularly abutting planes, and secondarily through the casting of shadows onto the ground plane1.
Although this approach is far more orientation-specific, and thus less versatile, it can still be adapted to a variety of spatial layouts.
This phenomenon is already observable at the Well. The dramatic difference in how the corridors and marshalling area
are read is a prime example. The sudden change in ceiling height acts as the introduction of a horizontal plane perpendicular to the space’s primary circulatory pathway. By introducing these thresholds in other contexts, the space could be further divided to delineate zones and corridors.
Perpendicular planes at the Center1

Mechanical infrastructure at the Well creates similar geometric conditions.
High drift magnitude scores at the edges of the loading duck suggest an implicit lane of pedestrian travel.



However, some spatial relationships are so powerful that by recognizing them and leaning into them, you can sculpt space with almost no intervention at all.
The loading dock at the Well is an example of this phenomenon. The edges of the dock have a very high drift magnitude score, indicating that the dock’s inhabitants feel a strong psychological pull towards them4. By understanding that there is a pre-existing implicit corridor that structures the dock’s circulation, we can work to preserve it in any potential improvements.
It’s important to remember that neither of these interventions will ever be a substitute for a wall or sign, and that they are based on pure psychology. This means that users can ignore these spatial readings, reducing the magnitude of their effects. However, in spaces with restrictive, program-driven constraints like the back-ofhouse at the Well, these interventions can be a useful substitute for traditional approaches like walls or literal corridors.
Remediation:
To reverse or heal an existing damage.
How can we use acoustics as a design tool to aid in spatial programming?
Although acoustics were not the primary challenge at the Well, the metrics-based framework for simulation established using isovist and space syntax analysis can be applied in a similar problemseeking approach. This is particularly true in the case of the Well’s loading dock, where noise bursts from an adjacent mechanical system, potentially drowning out critical communication in a compact space full of large, moving objects. Through simplified acoustic studies, the sonic performance of this space can be assessed and modeled, allowing us to visualize how sound waves might travel.
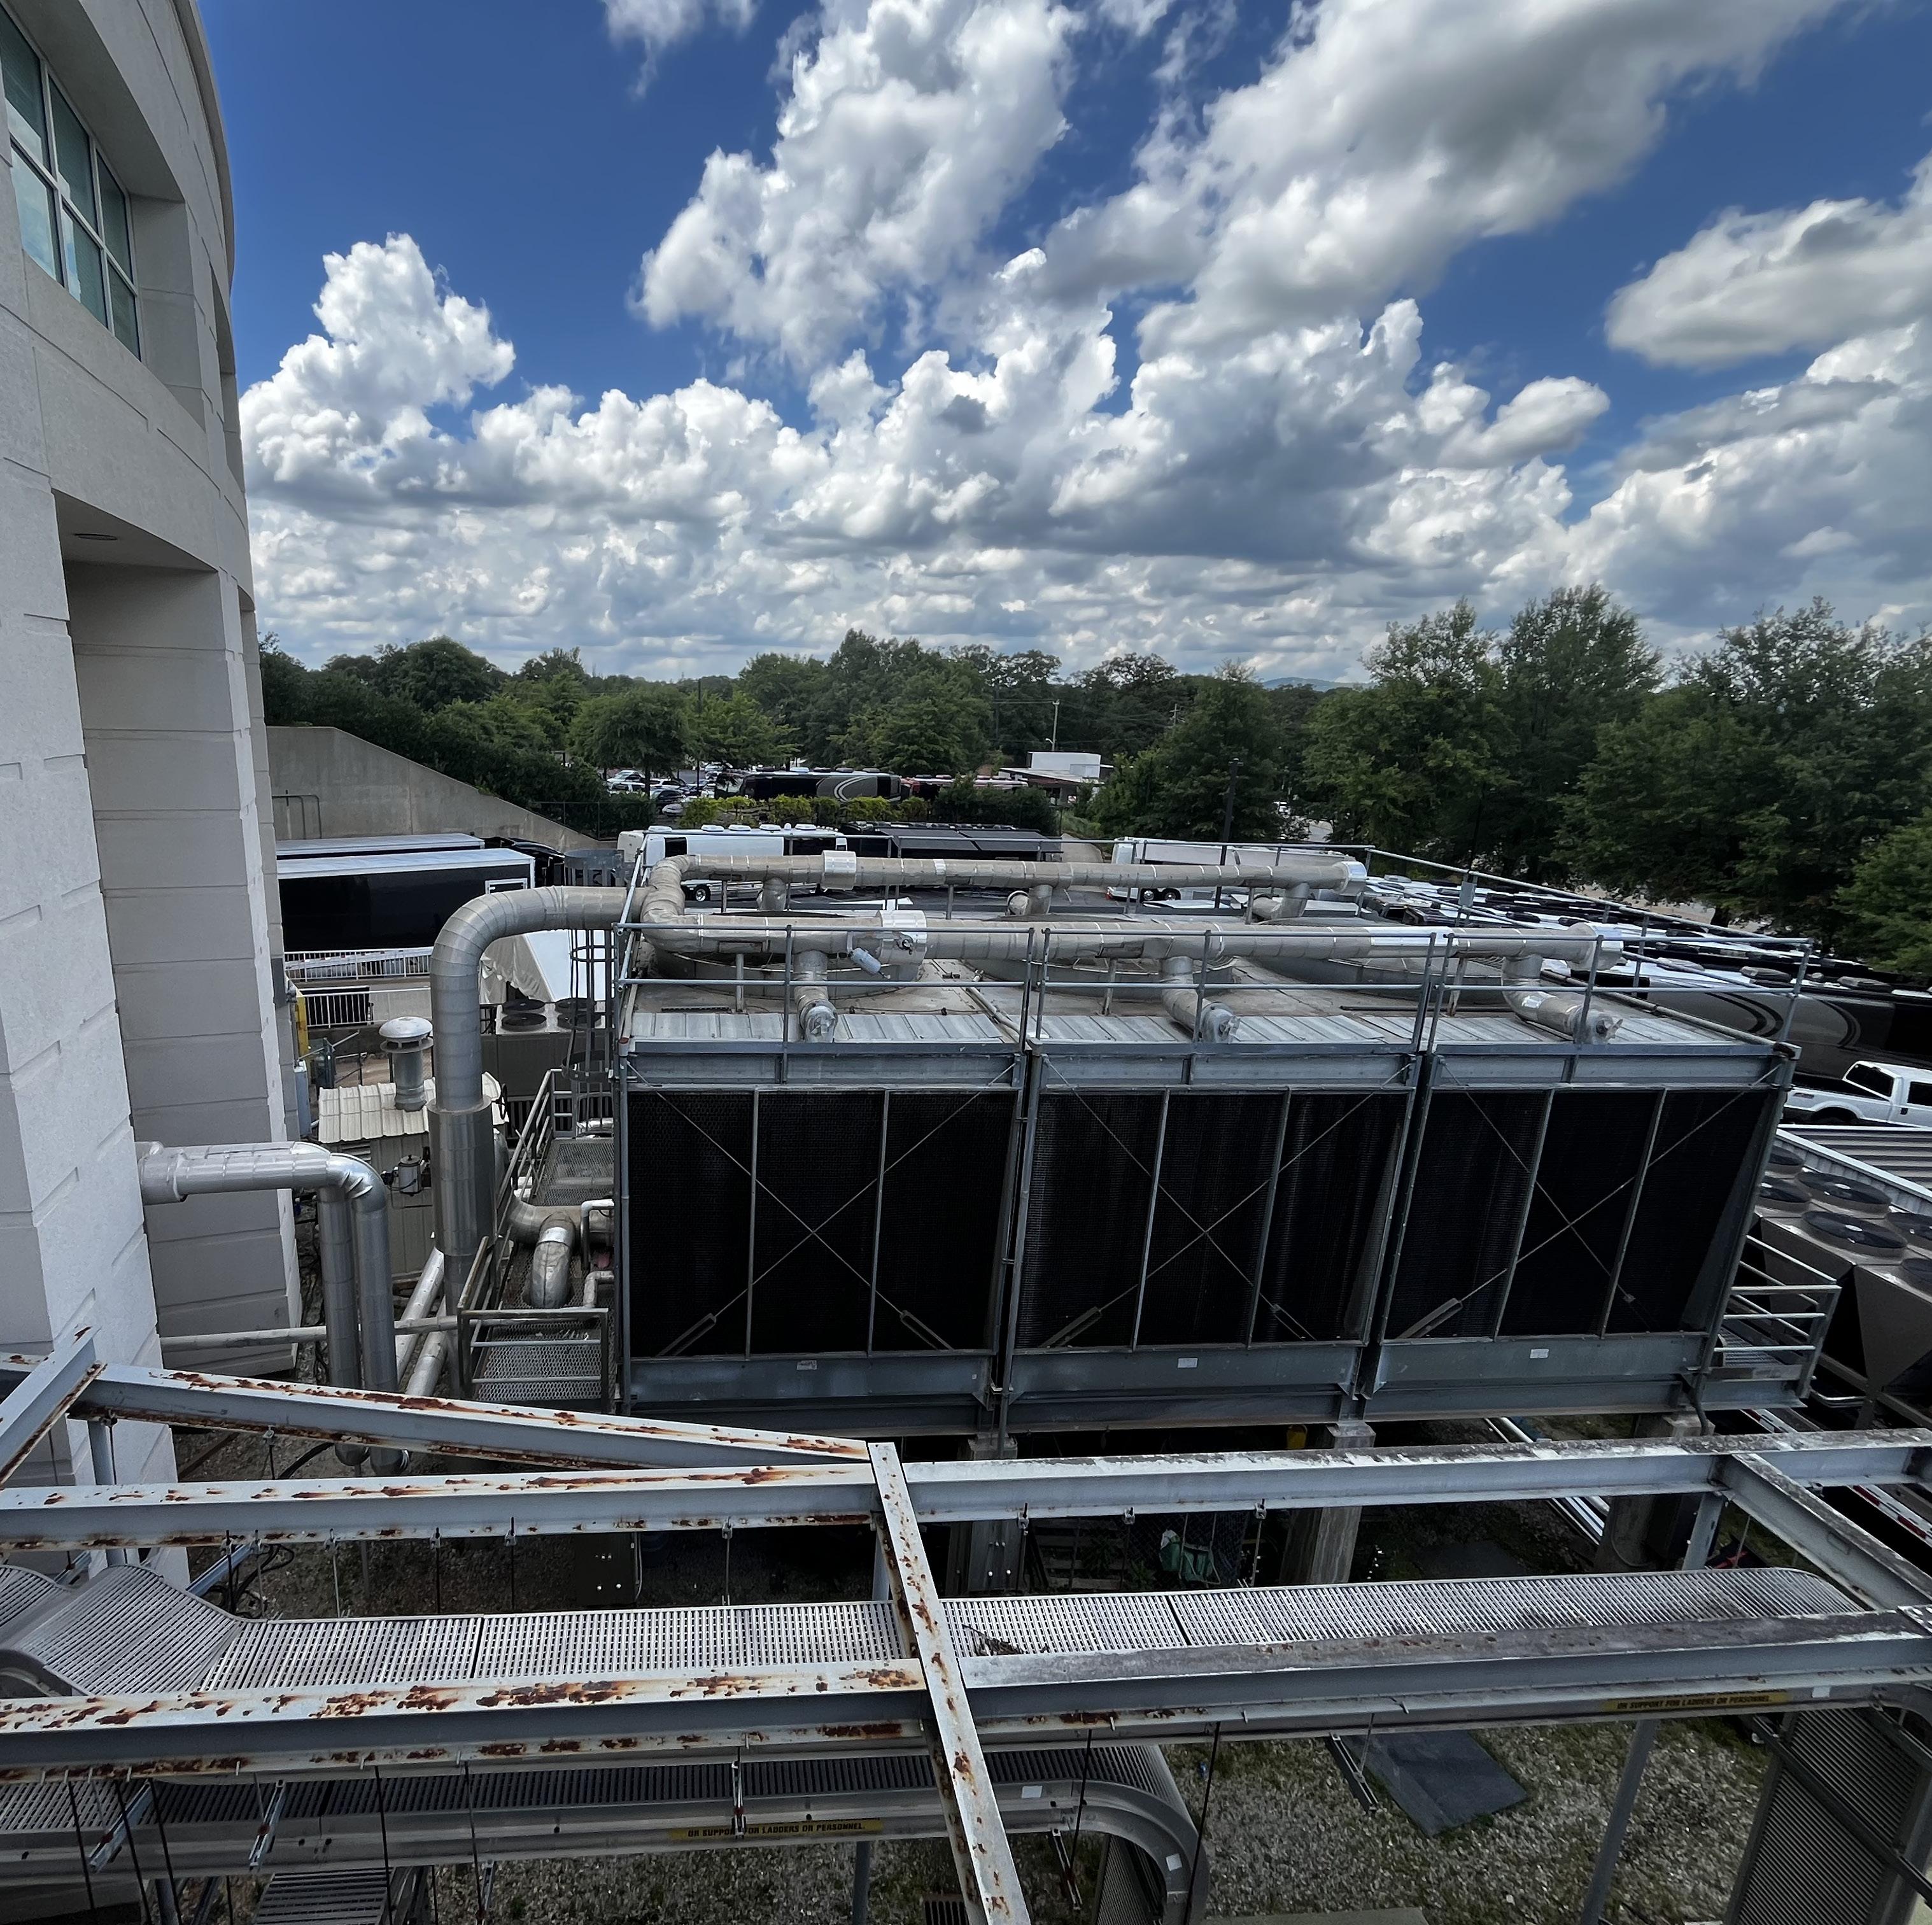
The exposed mechanicals responsible for most of the Well’s back-of-house noise pollution.
Similarly, we can iterate upon this model, allowing us to test the performance of potential geometrical and material interventions.
Although it is not the most numerically precise way to design acoustics, the ability to “guess and check” enables architects to work in a way that is like the traditional iterative design process, even when working with a physically complex phenomenon like sound, which bounces and reflects off building geometry.
Deploying this process at the Well allows us to infer that the best way to mitigate mechanical noise on the loading dock is by directing it upwards. By applying the same simplified acoustic study approach to a model of potential site conditions, we can begin to compare design options in a quantitative, metrics-driven way.

In the existing loading dock, sound is emitted by the mechanical system and reflected, spreading it further than it might’ve otherwise gone.
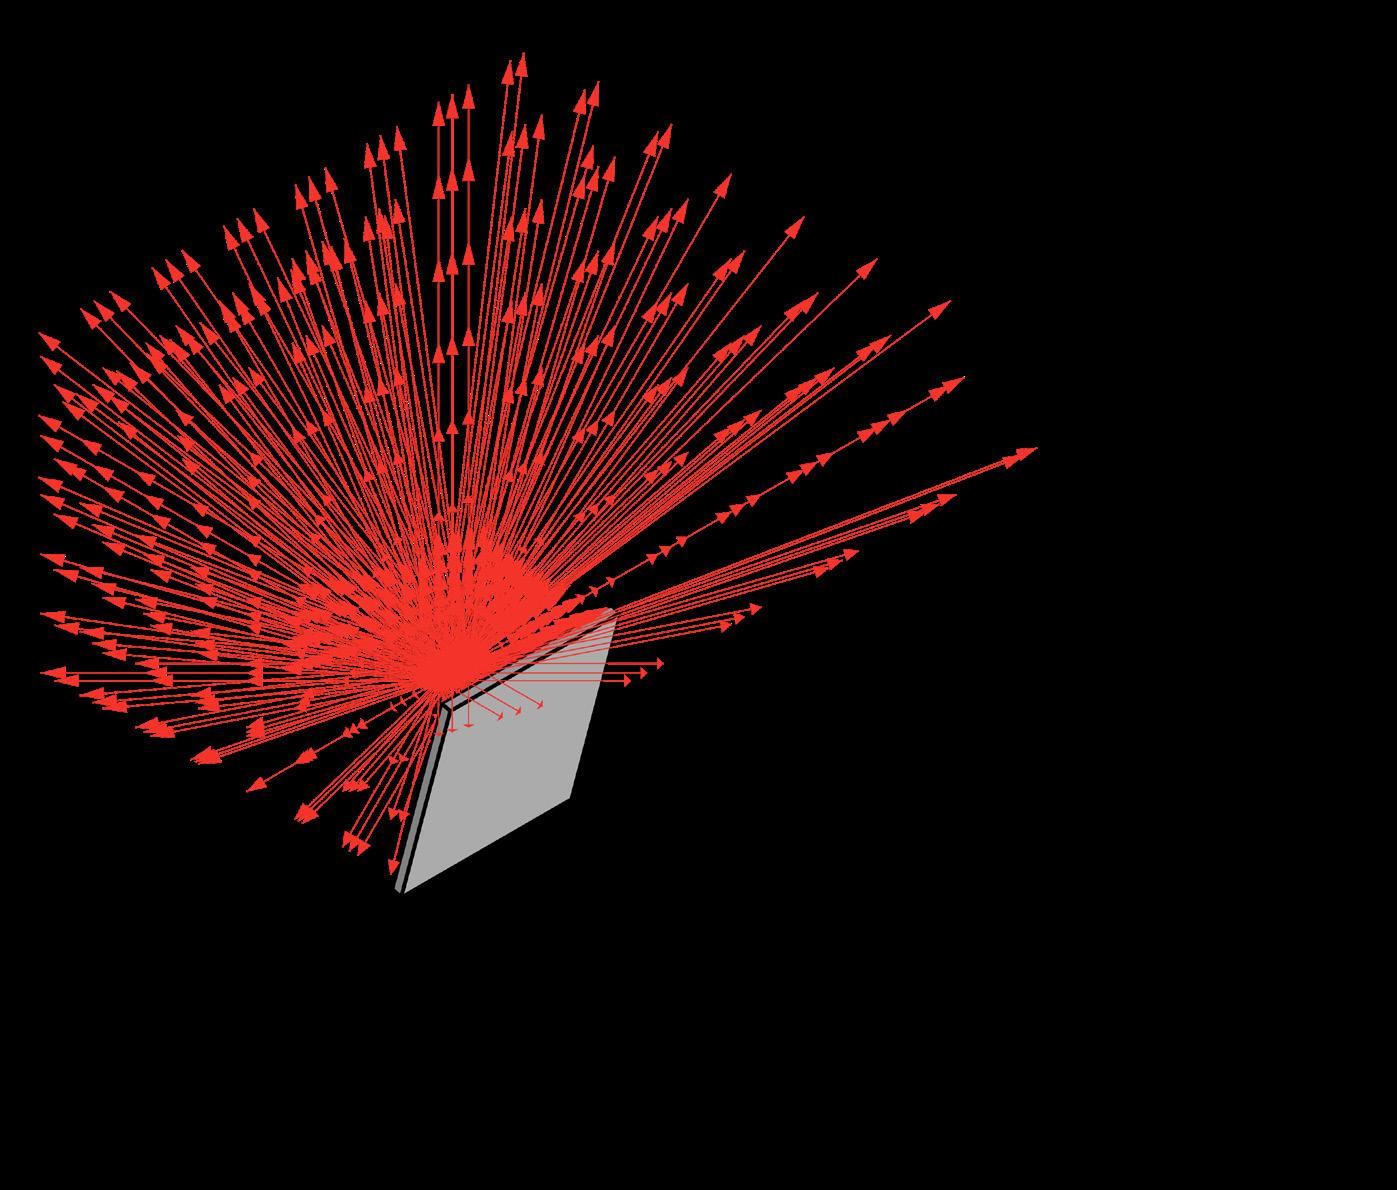
An angled sound barrier could reflect noise back towards the building to be further dissipated.

A vertical barrier shoots sound upwards in a more directed gesture, but could also amplify it on its way out of the loading dock.
1. Anfarch.org. “Exploring Multi-Sensory Design in Architecture: Insights from Betsy Nolan’s Presentation.” Academy of Neuroscience for Architecture, 2023. https:// anfarch.org/research-topics/sensory-perception-and-the-built-environment/ page/exploring-multi-sensory-design-in-architecture-insights-from-betsy-nolanspresentation.
2. Isovists.org. “4.2 Isovist Measure Definitions – Isovists.org,” 2024. https:// isovists.org/user-guide-category/4-2-isovist-measure-definitions/.
3. Gordoa, Luis. “Center for the Blind and Visually Impaired, Mauricio Rocha.” Eartharchitecture.org, November 5, 2024. https://eartharchitecture.org/?p=1870.
4. Dalton, Ruth, and Nick Dalton. “OmniVista:an Application for Isovist Field and Path Analysis.” Proceedings of 3rd International Space Syntax Symposium Atlanta, May 1, 2001.
1. Gordoa, Luis. Center for the Blind and Visually Impaired, Mauricio Rocha. November 5, 2024. Photograph. Earth Architecture. https://eartharchitecture. org/?p=1870.
Perceptual:
Information pertaining to the multisensory.
Spatial Reading:
Our brain’s synthesized summary (or shitsukan) of a space.
How do you efficiently measure perceptual aspects of space?
Our perception of space is a sum of many factors. Each of our senses renders massive amounts of data, giving us more information than we could possibly recognize1. This data is what our brain synthesizes when we read space. This process is intuitive -- so intuitive that it can be difficult to articulate it with words. This reading skill is something that designers practice ad nauseam. It works to our advantage in the design process, but its application is limited. In highly complex spaces with hard constraints, our design intuition doesn’t always provide the information that we need, or the necessary metrics to support our proposed changes. It can also be hard to exercise the same intuition when looking at a digital representation of a proposed space, making it less useful once we get into iterative design.
These tensions of the design process hint at a big question:
How do you quantifiably “read” a space?
There are plenty of existing frameworks to read space. These frameworks can be as simple as sketching or photography, or as complex as AI-assisted LiDAR scanning2. Most approaches across this spectrum of complexity yield valuable information, but no design team has time to implement them all. With this limitation in mind, the need for a “happy medium” approach becomes clear.
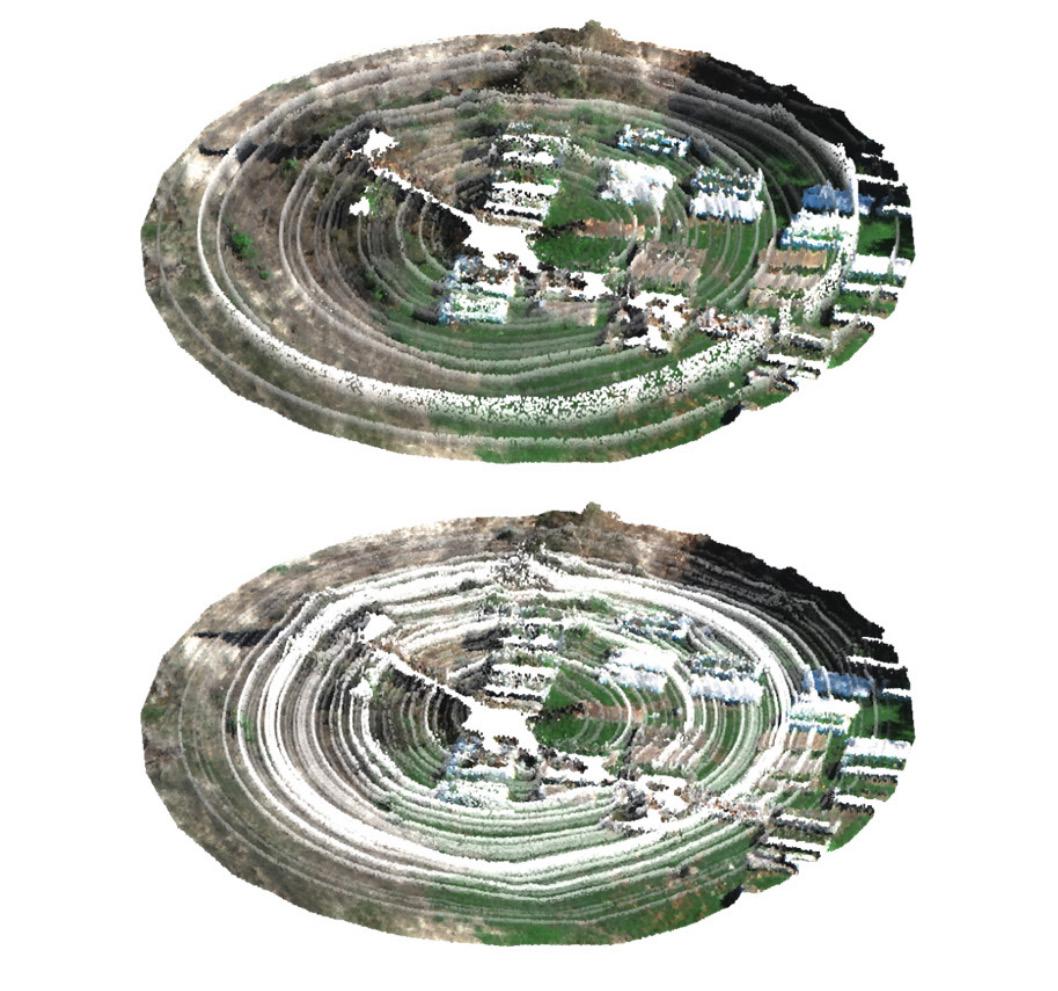
Landscape sounds converted to data and visualized as deformations of a corresponding 3D scan1
Connectivity Analysis:
A computational technique to measure the amount of connections between various spaces in a network.
Space syntax is a versatile and scalable solution for quantitative spatial readings.
It was conceived in the late 1970s by Bill Hillier to analyze the psychological and social effects of spatial layouts on their inhabitants through approximations of human spatial readings2. What is interesting about this approach is that it’s rooted in a system of mathematical equations, rather than a specific software or use case. This makes it usable in a wide variety of contexts.
Practically, a space syntax analysis can be conducted in one of two scales. Initially, it was developed to be used at a cityscape or regional scale2. In this context, it can be used to measure the connectivity of street networks, allowing planners to better understand which corridors of a city are most traveled. Delineating areas of high and low connectivity can be very useful when proposing large-scale changes to the built environment.
However, connectivity analyses barely scratch the surface of how space syntax can be used in architectural contexts. After all, while urban circulation networks are important, we are best equipped to shape the human experience at a building scale.
How can we shift this data-rich approach to a workable scale?
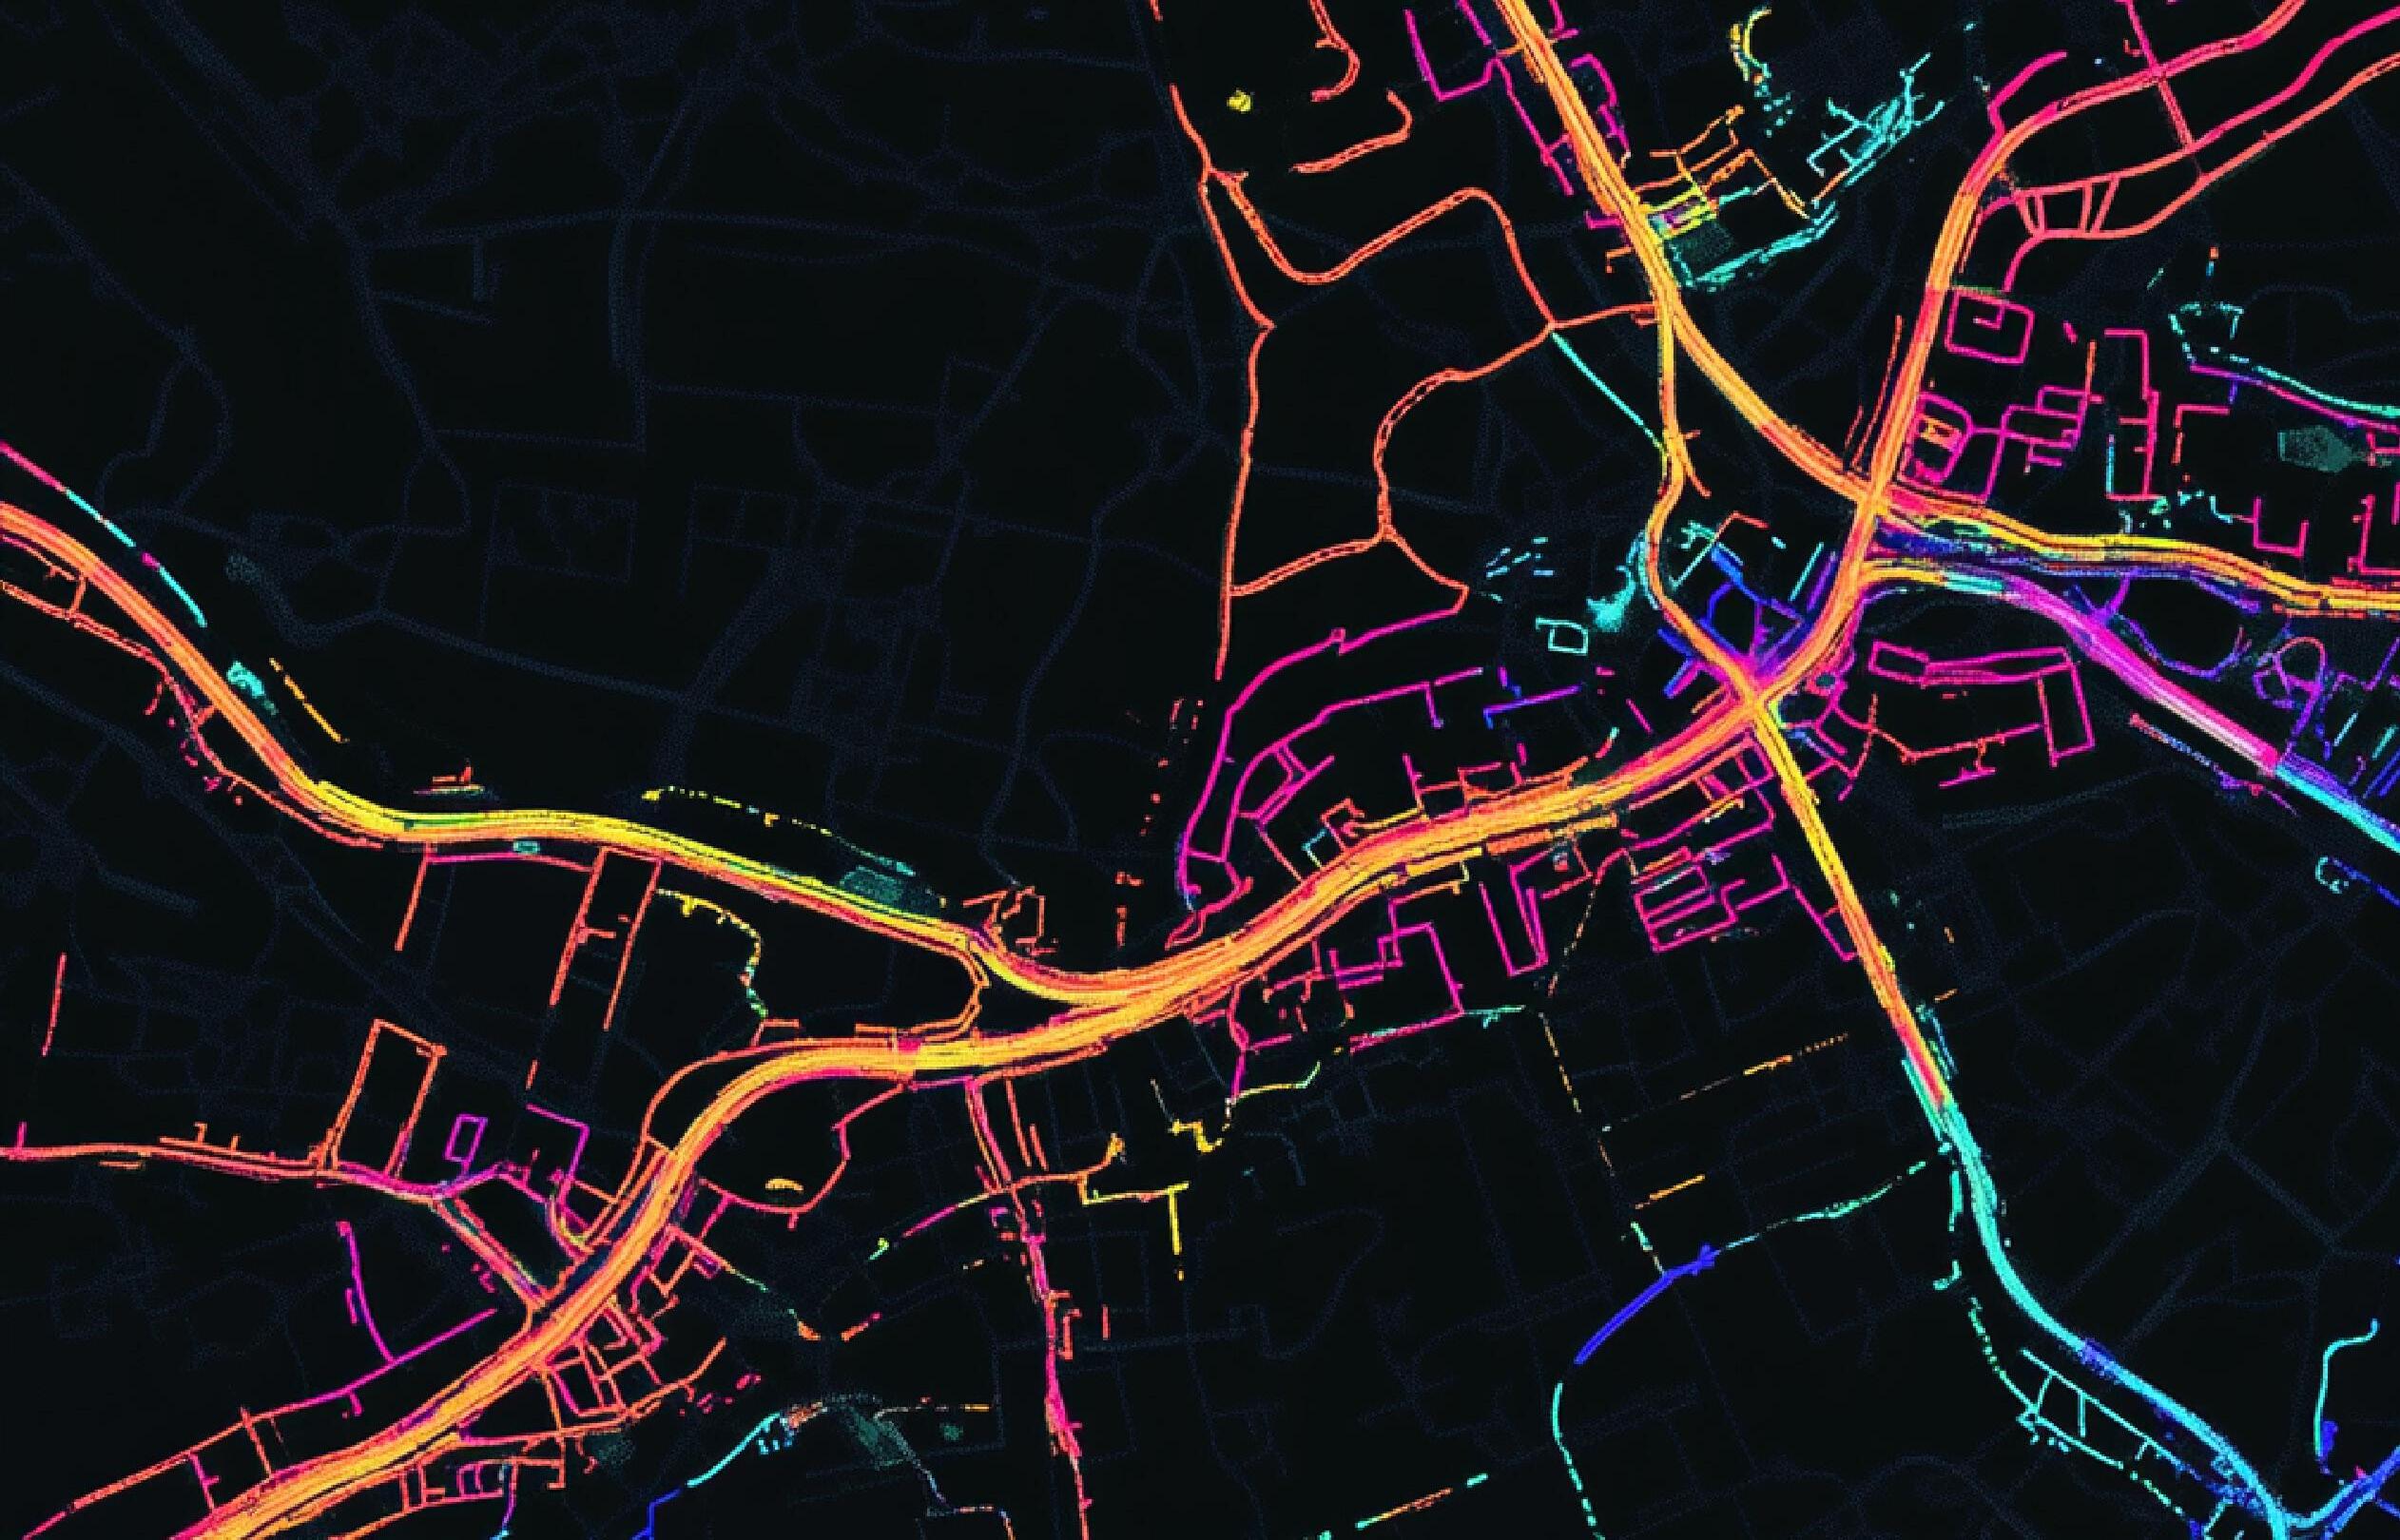
“As
obstacles are introduced, it begins to bend and fold, expressing how these obstacles shape what we can see3.”
Another simple and versatile method of mathematical spatial analysis is the isovist – an approximation the human field of vision3.
First conceived by Clifford Tandy in 1967 and refined by Michael Benedikt, isovists are made up of polygons whose shape is sculpted by building geometry. If there is no geometry within view, the isovist polygon is a perfect circle. As obstacles are introduced, it begins to bend and fold, expressing how these obstacles shape what we can see3.
Any spatial analysis conducted using a single isovist is only valid at the center point of that isovist. As such, single-isovist analysis represents space from the inside looking out.
This makes it useful if you’re trying to choreograph a key moment or iteratively design a framed view, but it falls short in any kind of comprehensive spatial analysis.

A pure isovist in a room with no obstacles.
A collection of multiple isovists in a space. When used as a data source, it can spatialize the isovist in two dimensions, allowing for the mapping of isovists properties.
Despite their analytical limitations, isovists are incredibly useful because they are polygons with mathematical and geometric properties.
These properties can be mixed, matched, and contorted to render valuable information about qualities of space based on what the isovist can “see.” There is a wealth of research on isovist properties, how to calculate them, and what they can tell us4. The long and short of it is that isovist properties allow us to assemble “scores,” which in turn can be translated into qualitative spatial assessments. By spatializing and visualizing this data, we can move towards a comprehensive spatial analysis that infers qualitative phenomena from quantitative analysis, combining the intent of early space syntax theory with modern analysis needs.
Different isovist properties tell us different things about the psychological qualities of a space4.
However, since they are all scored between 0 and 1, once you are familiar with how to read one property, the others start to make a bit more sense. For example, a graph of the occlusivity property
can tell us where the most dramatic moments of visual change in space may occur. A high occlusivity score denotes a dramatic visual change, while a low occlusivity score denotes small amounts of visual change4. By analyzing a visibility graph for areas with high occlusivity, we can delineate where in a room visual thresholds may occur.

Overlapping isovists. Each one has different isovist property scores, since the individual isovists “see” different things. By averaging the property scores of each isovist, we can move towards an isovist field and a map-based visualization.
Visibility Graph:
A map-style representation of the properties of a gridded isovist field.
Isovists can generate useful data to help us analyze and improve the perceptual aspects of a space.
However, due to the mathematical limitations of a single polygon, it’s hard to collect or synthesize data for more than one point in a room at a time. However, there’s a simple solution to this problem. By populating a room with a grid of isovists, we can create an approximate map of how an isovist property changes at various positions. This kind of map is called a visibility graph. These graphs can also map the connectivity of isovists, folding in the base elements of space syntax theory4.
The heatmap-style of visualization that visibility graphs employ allows users to read changes in the mapped isovist property, creating opportunities for the delineation of property-based regions. For instance, drift magnitude can be used to determine which areas of a room inhabitants may feel most attracted to5
Once you have some practice reading these visibility graphs, it’s not difficult to begin thinking about applications.
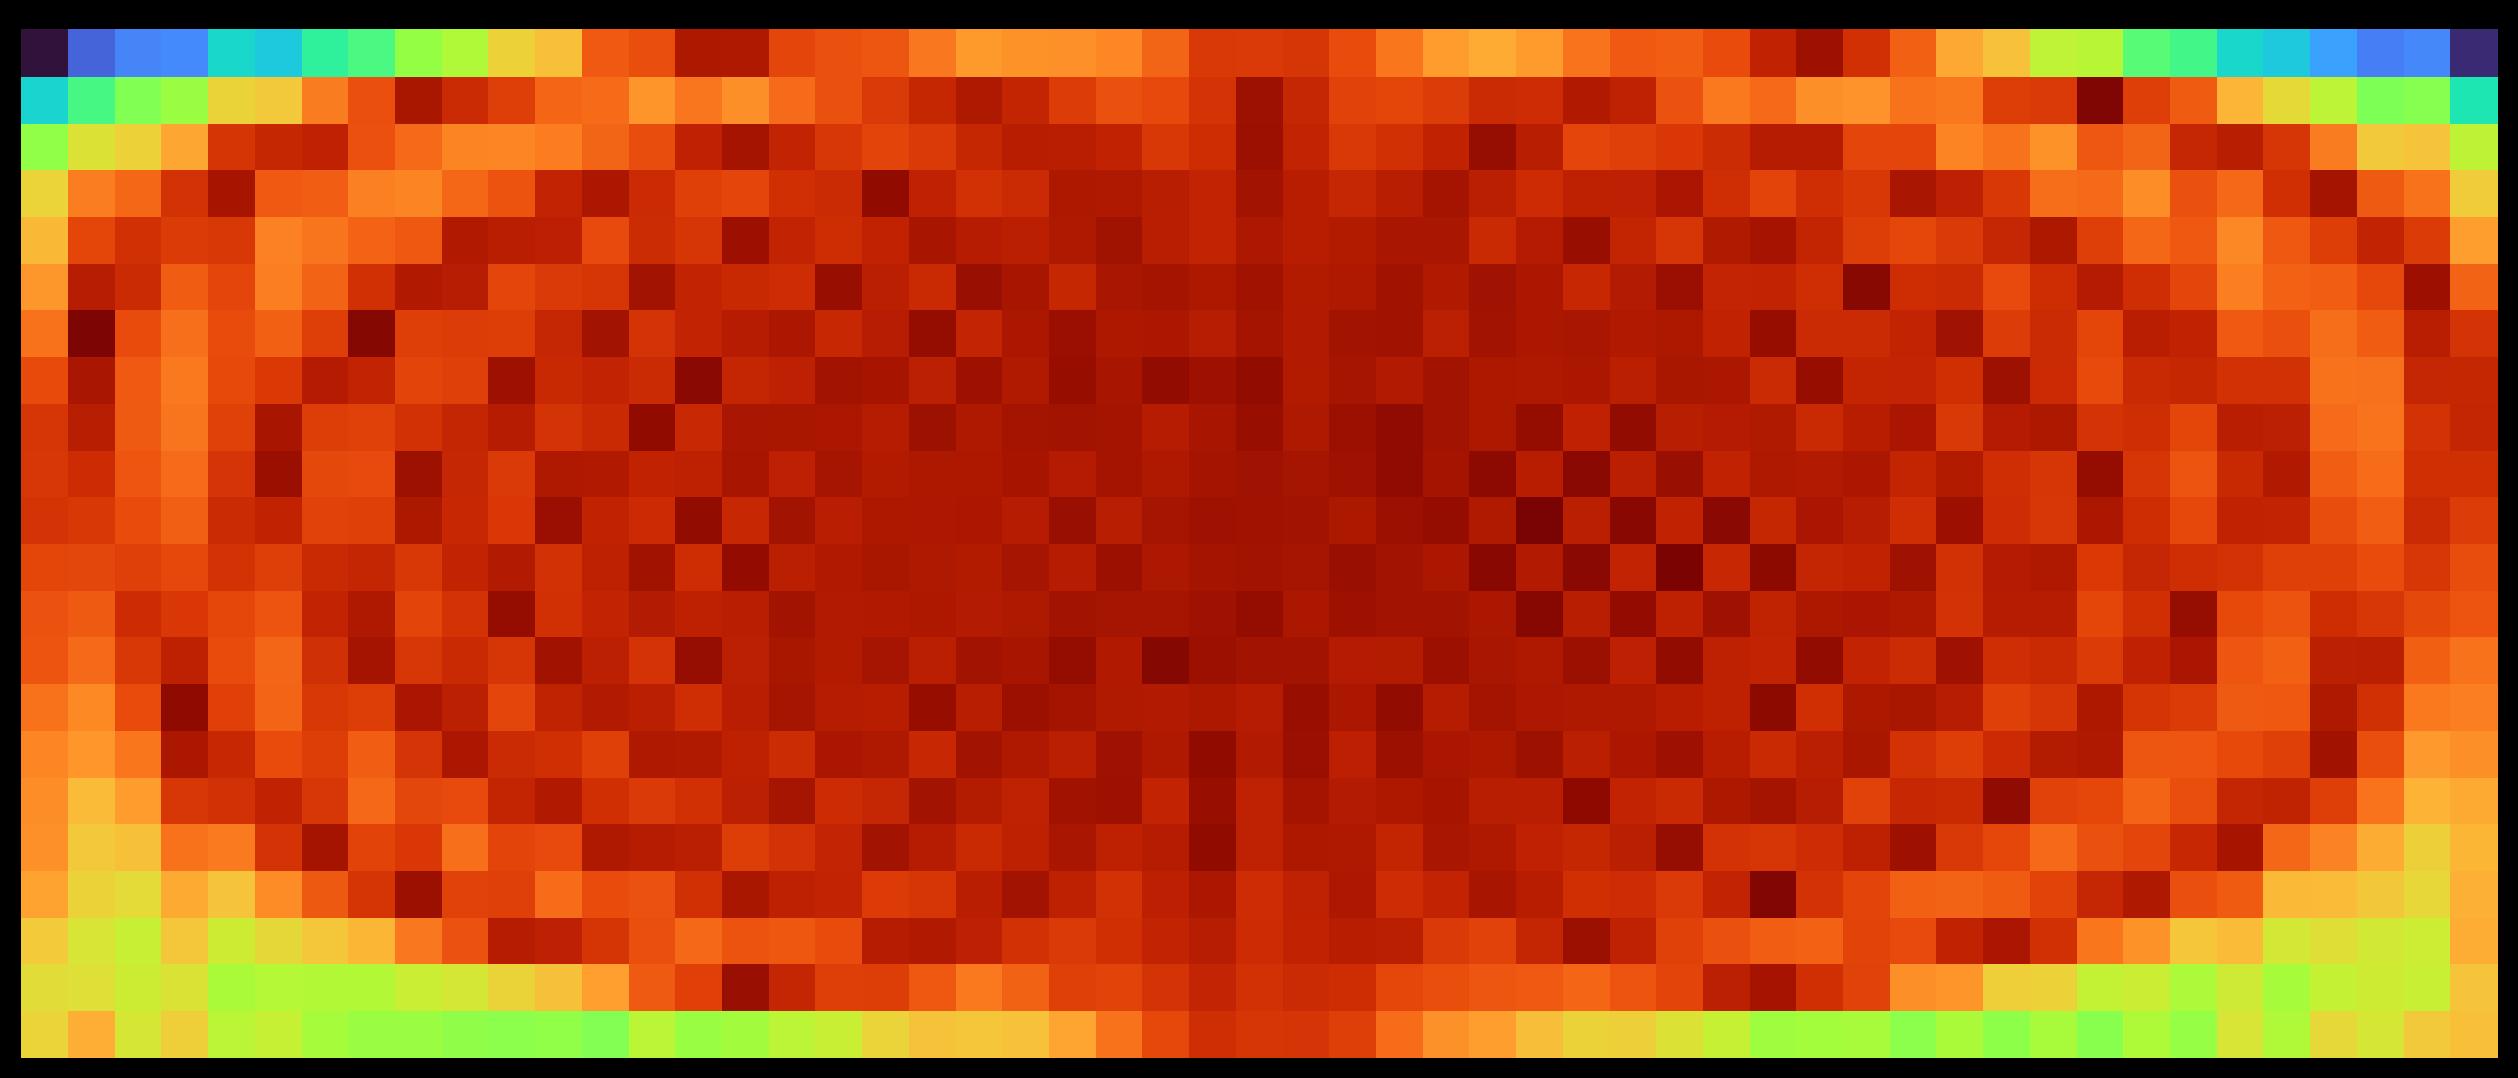
A pure isovist field map of visibility in a room with no obstacles. This style of mapping is also known as a visibility graph.
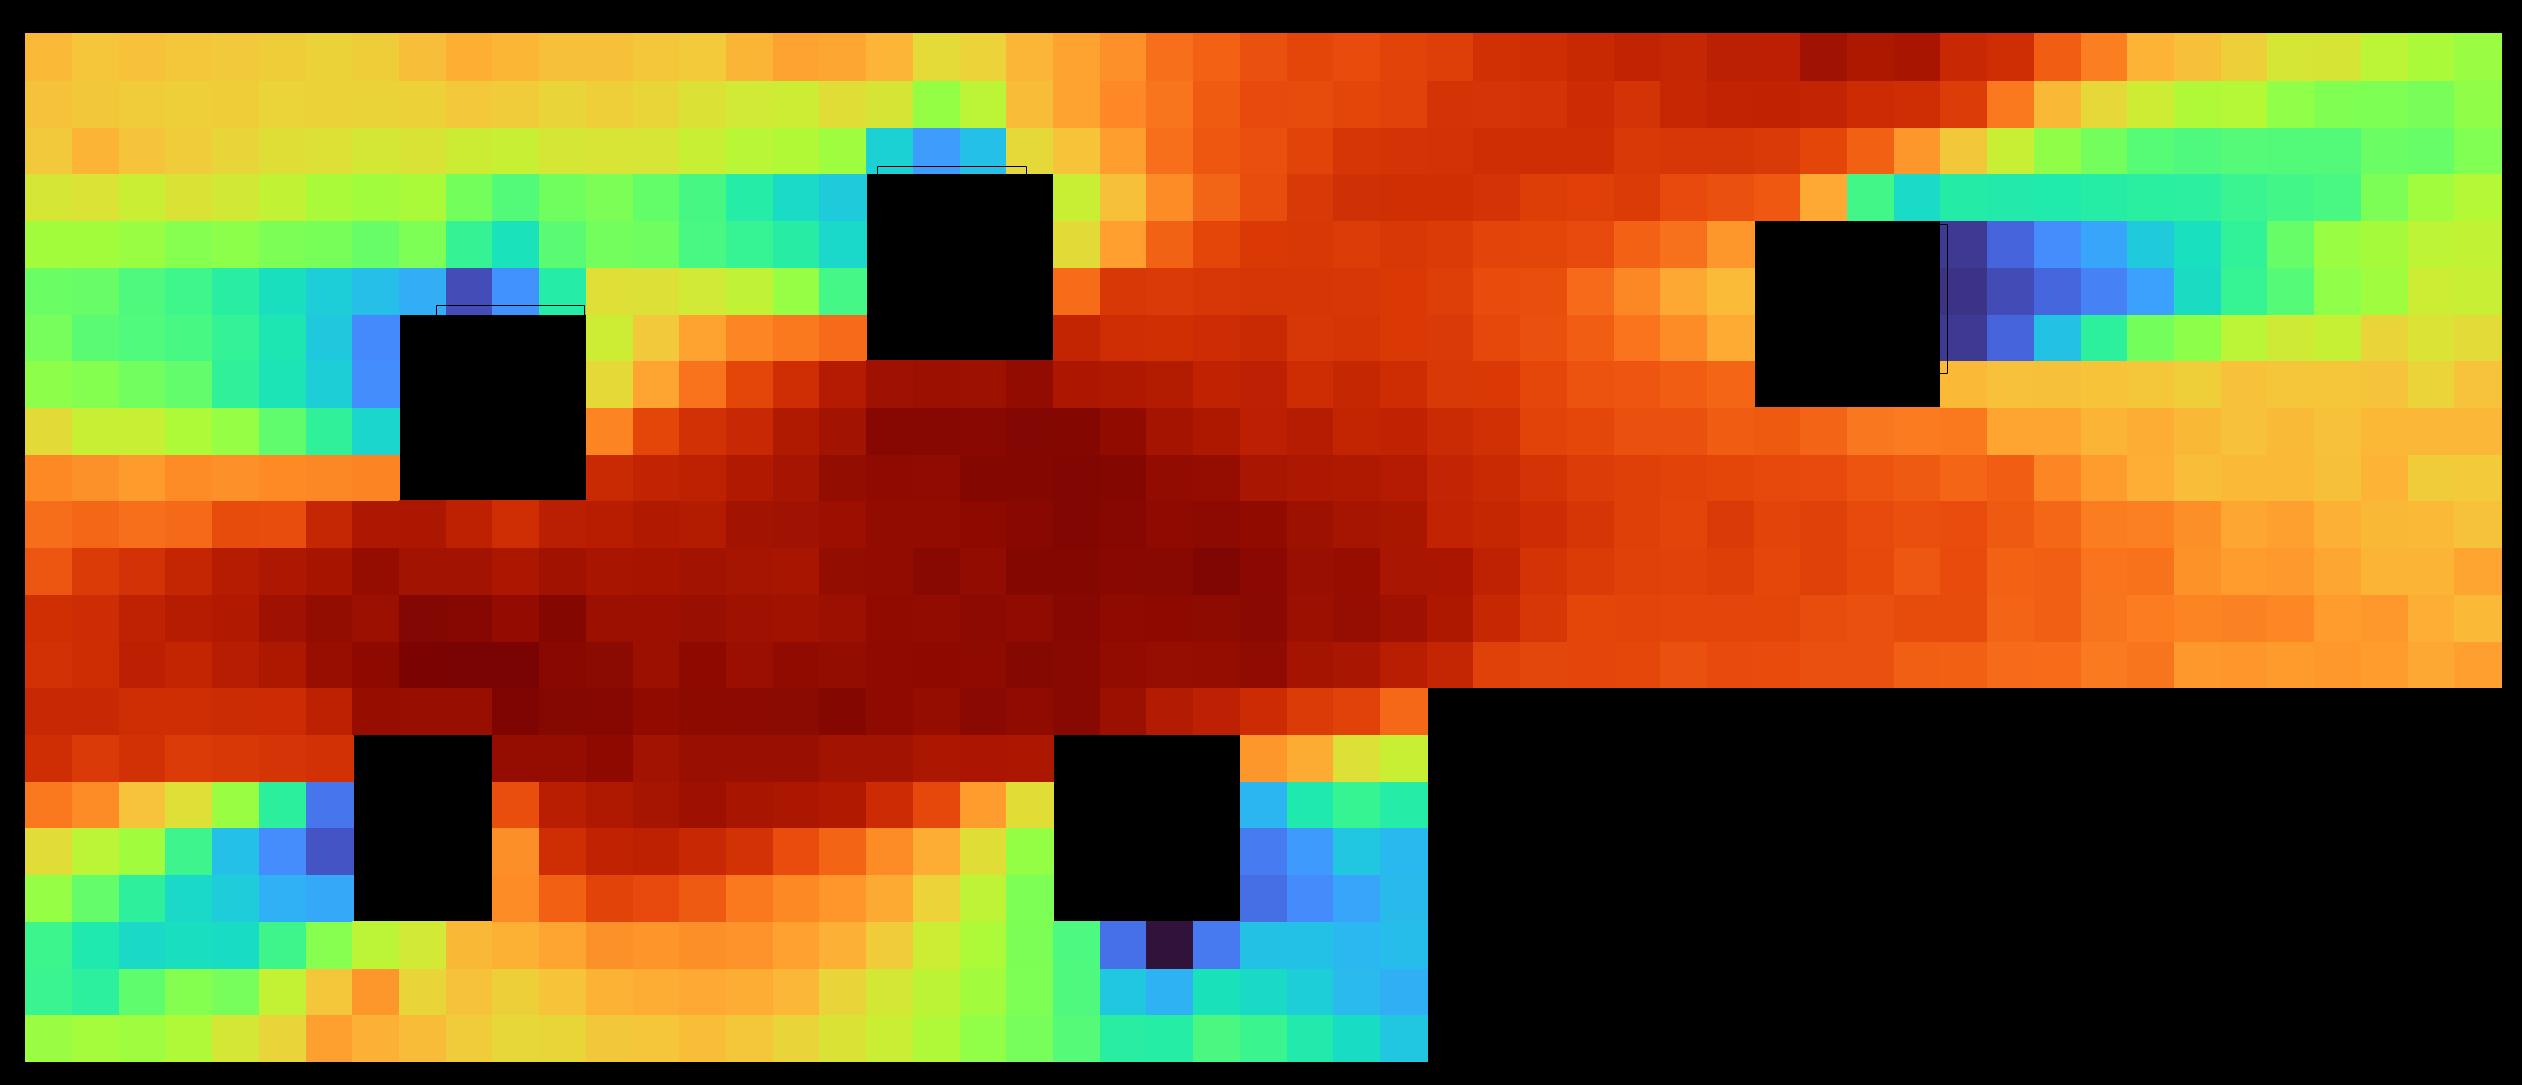
An isovist field map of visibility in a room with columns. Areas of high and low visibility begin to form.
A collection of 3D points that can be treated as the representation of a single object. These clouds are often used as a medium for spatial data like surface properties, especially in cartographic contexts.
Computing isovists in 3D allows us to store and visualize data for a whole project at the same time.
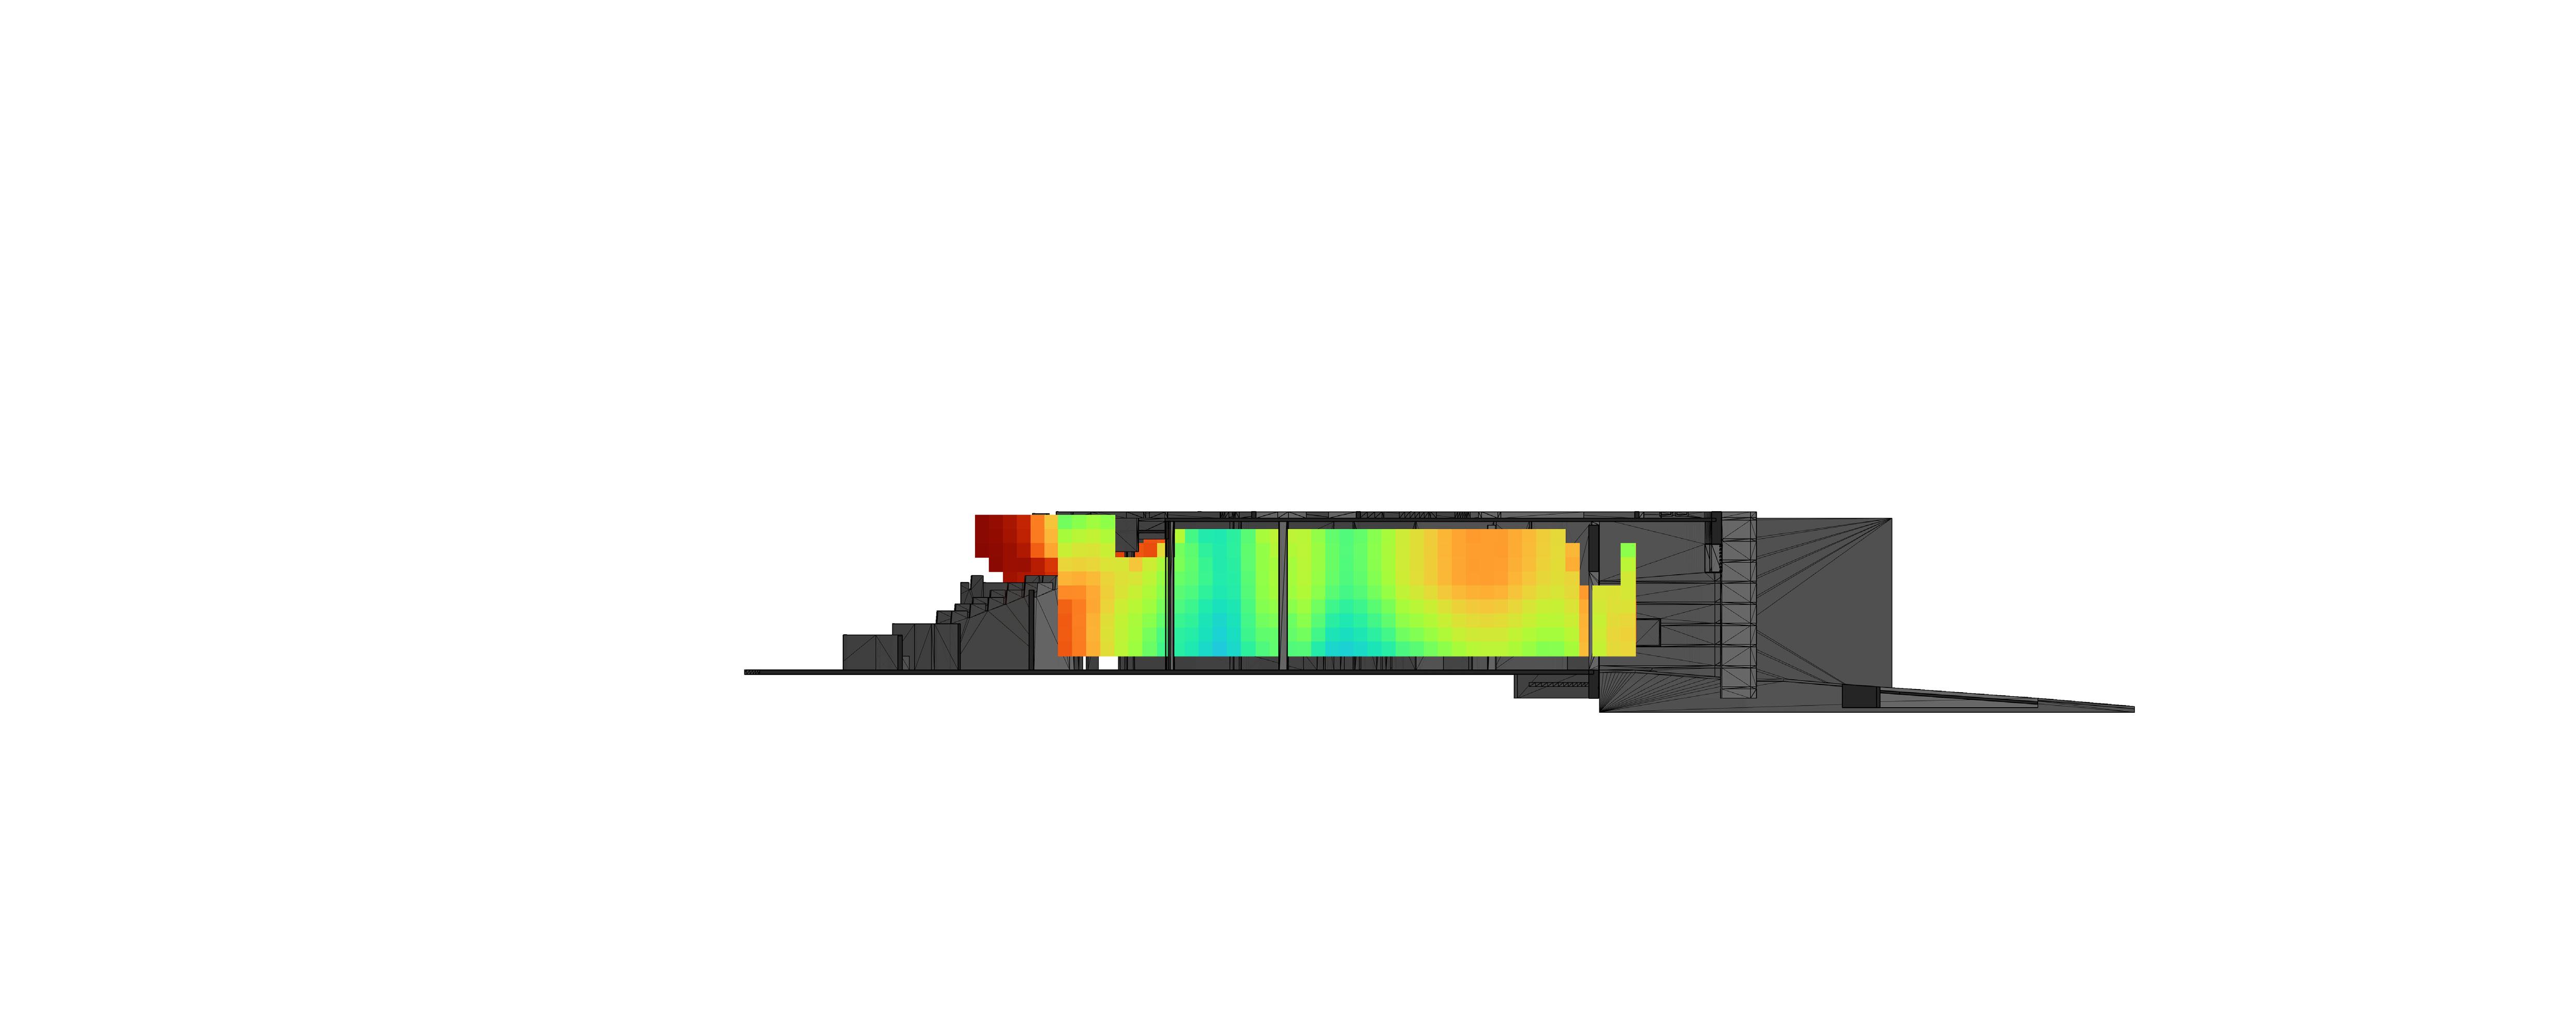
The graph-based representational language of space syntax and isovist theory is highly conducive to traditional map-like visualization. In traditional graph analyses, this visualization is done in plan view. However, 3D computation makes reading and interpreting this data significantly more complex. Rather than being expressed as a plan, syntax data is expressed as a point cloud. In this raw state, syntax data is stored as a point for every “empty” area – that is, every area free from building geometry. This is a very useful way to store data, allowing users to query syntax data for virtually any point in a model6, but it is representationally weak. Rather than working with a programmatically generated graph, users must implement complicated systems of clipping planes and section boxes to zero in on the data they want to visualize. This highlights an oft-overlooked limitation of 3D spatial analysis approaches – they are so data-rich that they can be overwhelming and unnavigable.
To address these issues, the custom analysis tools I developed allow users to visualize single horizontal slices through a 3D graph visualization, effectively working as an adaptive 2D graph generator. Additionally, basic numerical filtering operations can allow users to view only the sections of space that meet certain spatial conditions.
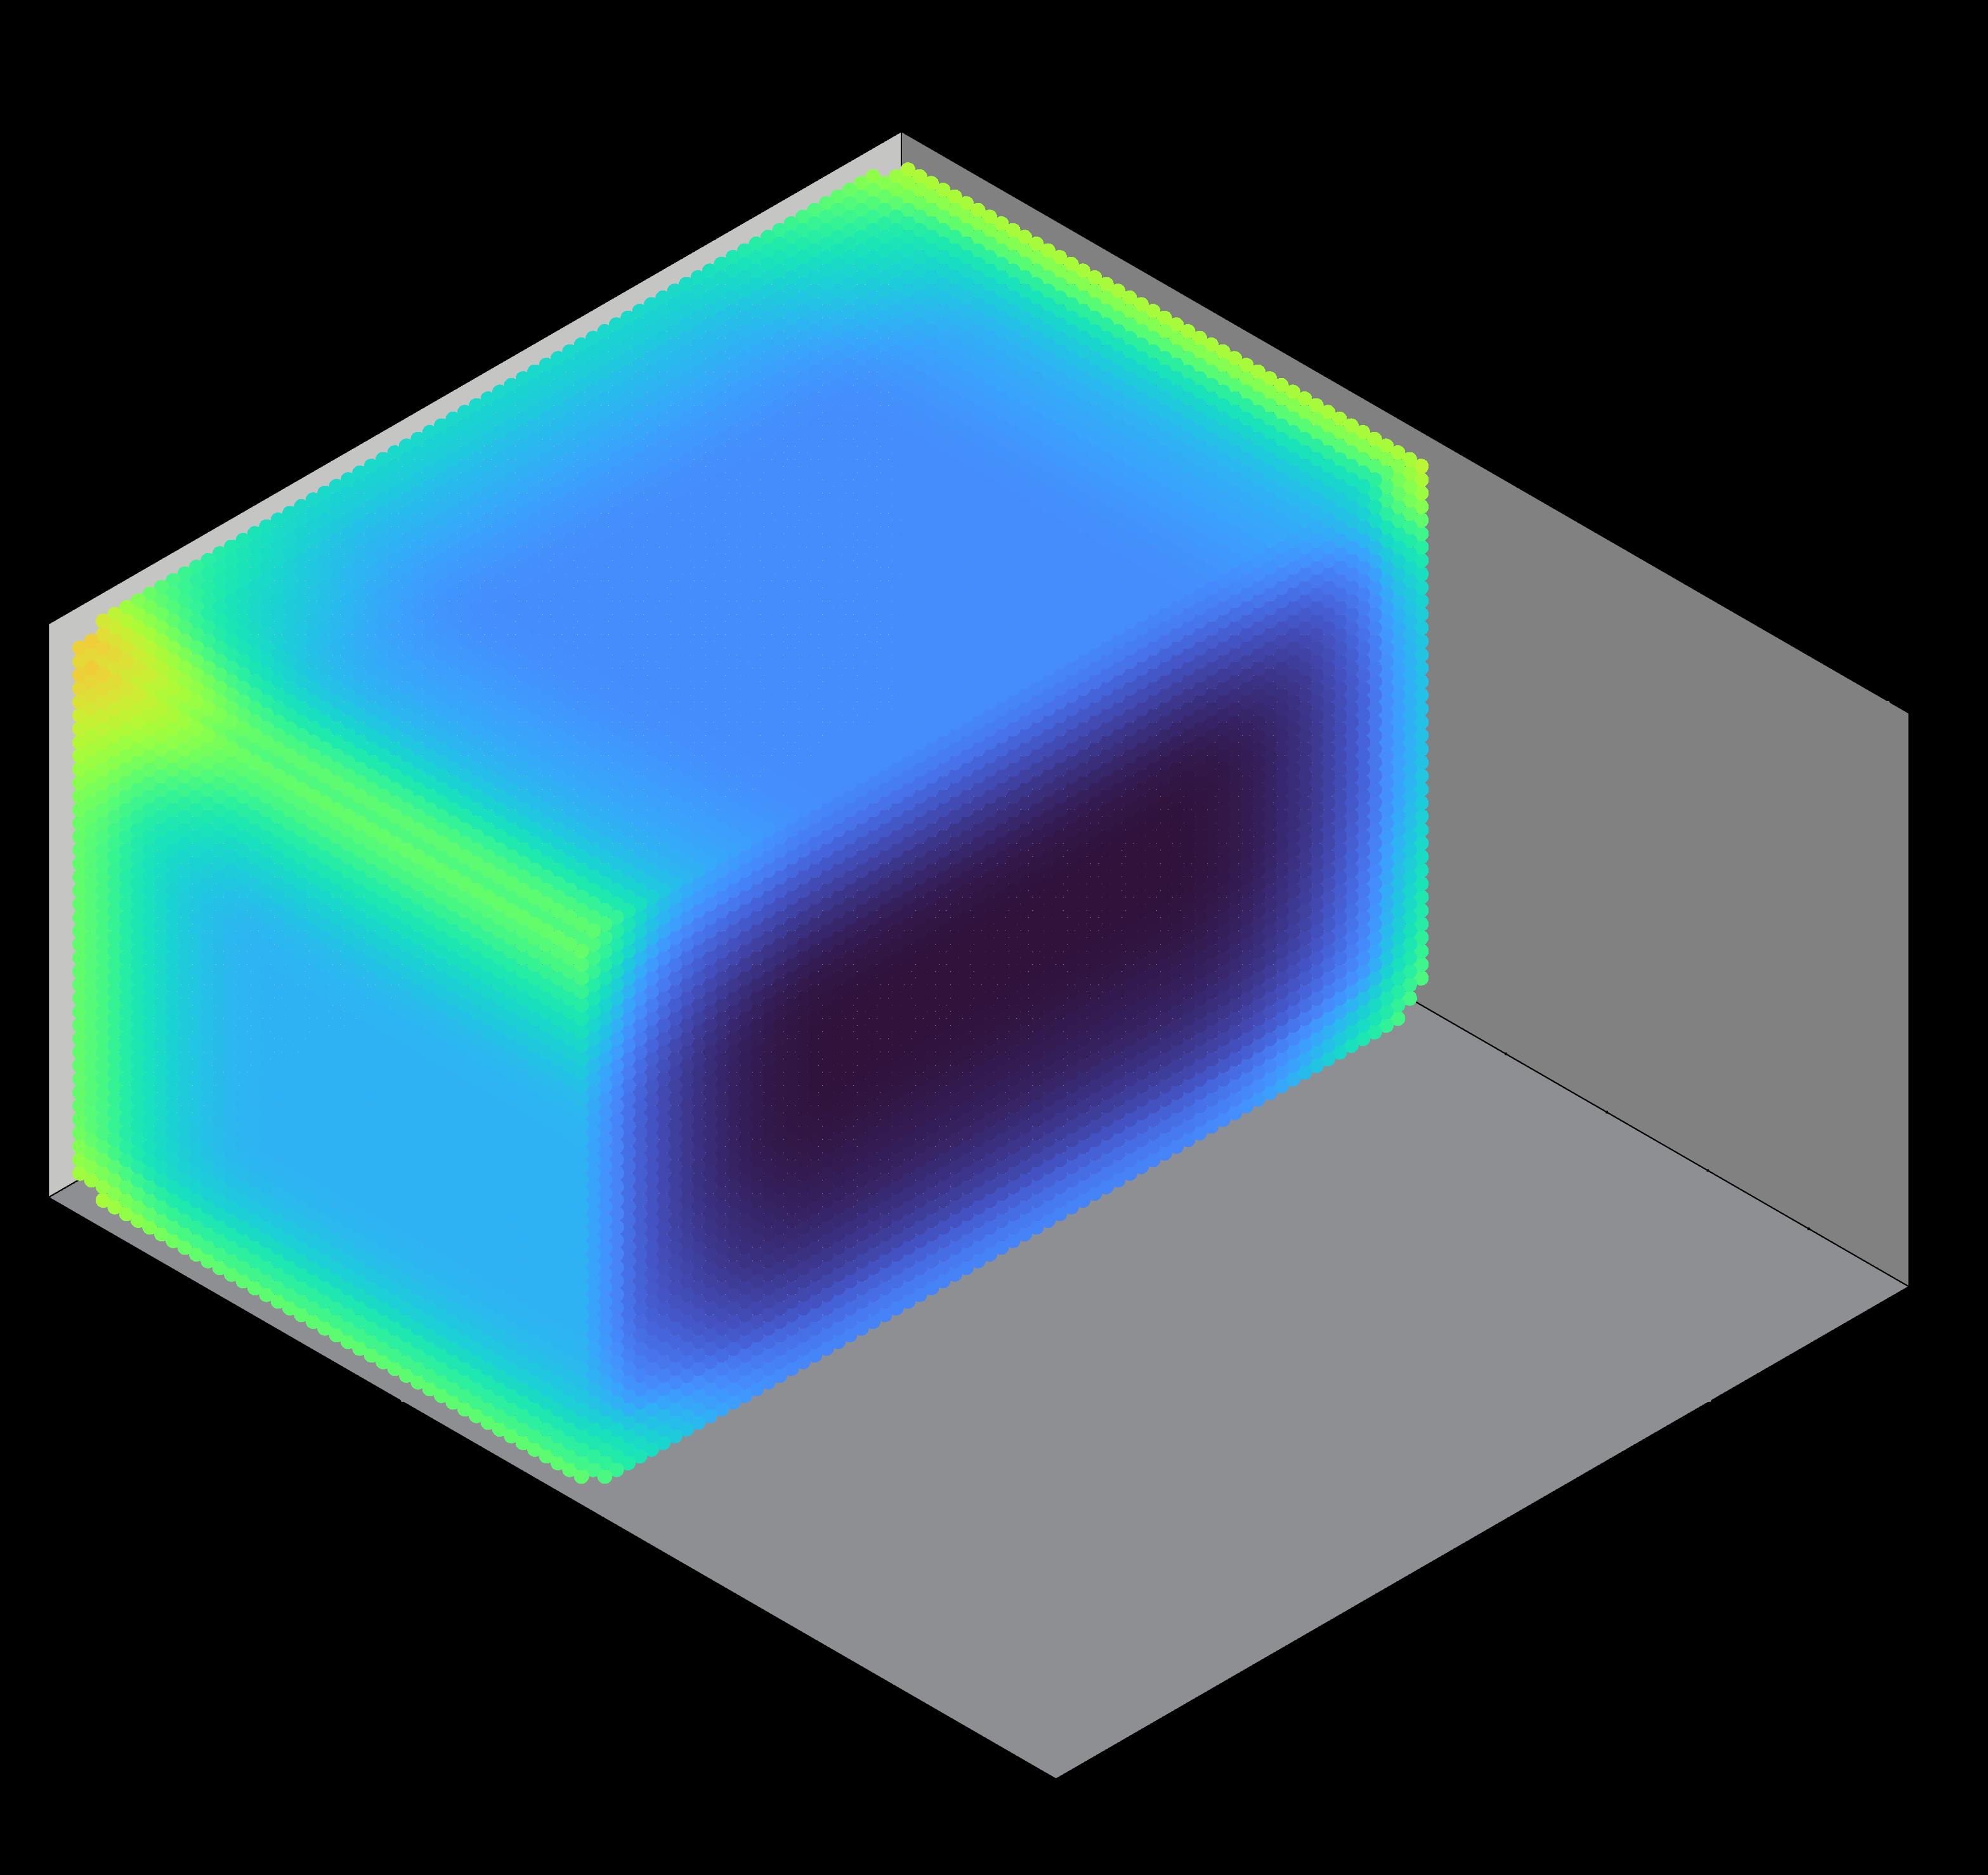
A cross-section of a 3D isovist field. Each point within the colored region represents an isovist property score for the nearest point in a space. These 3D fields are great for storing data, but can be difficult to read.
1. Tancik, Matthew, Ethan Weber, Evonne Ng, Ruilong Li, Brent Yi, Justin Kerr, Terrance Wang, et al. “Nerfstudio: A Modular Framework for Neural Radiance Field Development.” ArXiv (Cornell University), July 23, 2023. https://doi.org/10.1145/3588432.3591516.
2. Mohamed, Abdelbaseer A., and Claudia van der Laag Yamu. “Space Syntax Has Come of Age: A Bibliometric Review from 1976 to 2023.” Journal of Planning Literature 39, no. 2 (October 19, 2023): 203–17. https://doi.org/10.1177/08854122231208018
3. Davis, Larry S., and Michael L. Benedikt. “Computational Models of Space: Isovists and Isovist Fields.” Computer Graphics and Image Processing 11, no. 1 (September 1979): 49–72. https://doi.org/10.1016/0146-664x(79)90076-5.
4. Isovists.org. “4.2 Isovist Measure Definitions – Isovists.org,” 2024. https://isovists.org/ user-guide-category/4-2-isovist-measure-definitions/
5. Dalton, Ruth, and Nick Dalton. “OmniVista:an Application for Isovist Field and Path Analysis.” Proceedings of 3rd International Space Syntax Symposium Atlanta, May 1, 2001.
6. Vogler, Verena, Eleftherios Kourkopoulos, Jens Joschinski, and Kay Eckelt. “Developing Volumetric Data Models for ML Training Datasets Using Grasshopper .” JoDLA – Journal of Digital Landscape Architecture, no. 10 (October 2025). https://doi. org/10.14627/537754010.
1. Brooks, Joseph, Carlos Roman, Brendan Harmon, Annicia Streete, and Nicholas Serrano. “Visualizing Spatial Audio in Digital Landscapes.” Journal of Digital Landscape Architecture 10 (July 2025): 552.
2. UCL Space Syntax. Space Syntax Integration Pattern of Greater London. 2025. Spacesyntax.online. https://www.spacesyntax.online/overview-2/#group-1.
Designed Identity:
A fabricated reading of a place, created through the design process. This reading is often a sum of the sensory elements we perceive on a in a space.
Second only to sight, sound is a key component of how we sense space. Our brain dedicates 20% of its bandwidth to the processing of sonic events, and as a result, sound often becomes an important factor in a place’s identity1.
What is a beach without the sound of waves crashing upon its shores? Would the mountains of western North Carolina feel the same if the birdsong disappeared from their woods?
In places with a designed identity, like an arena, park, or hospital, the presence and behavior of sound can be the difference between success and failure2.
The intense, grinding sound of construction transforms a public park from a green oasis to a cell under siege. And who wants to go to a sporting event in a stadium that muffles cheers? These crises of identity can be avoided by considering the role acoustics play early in the design process.
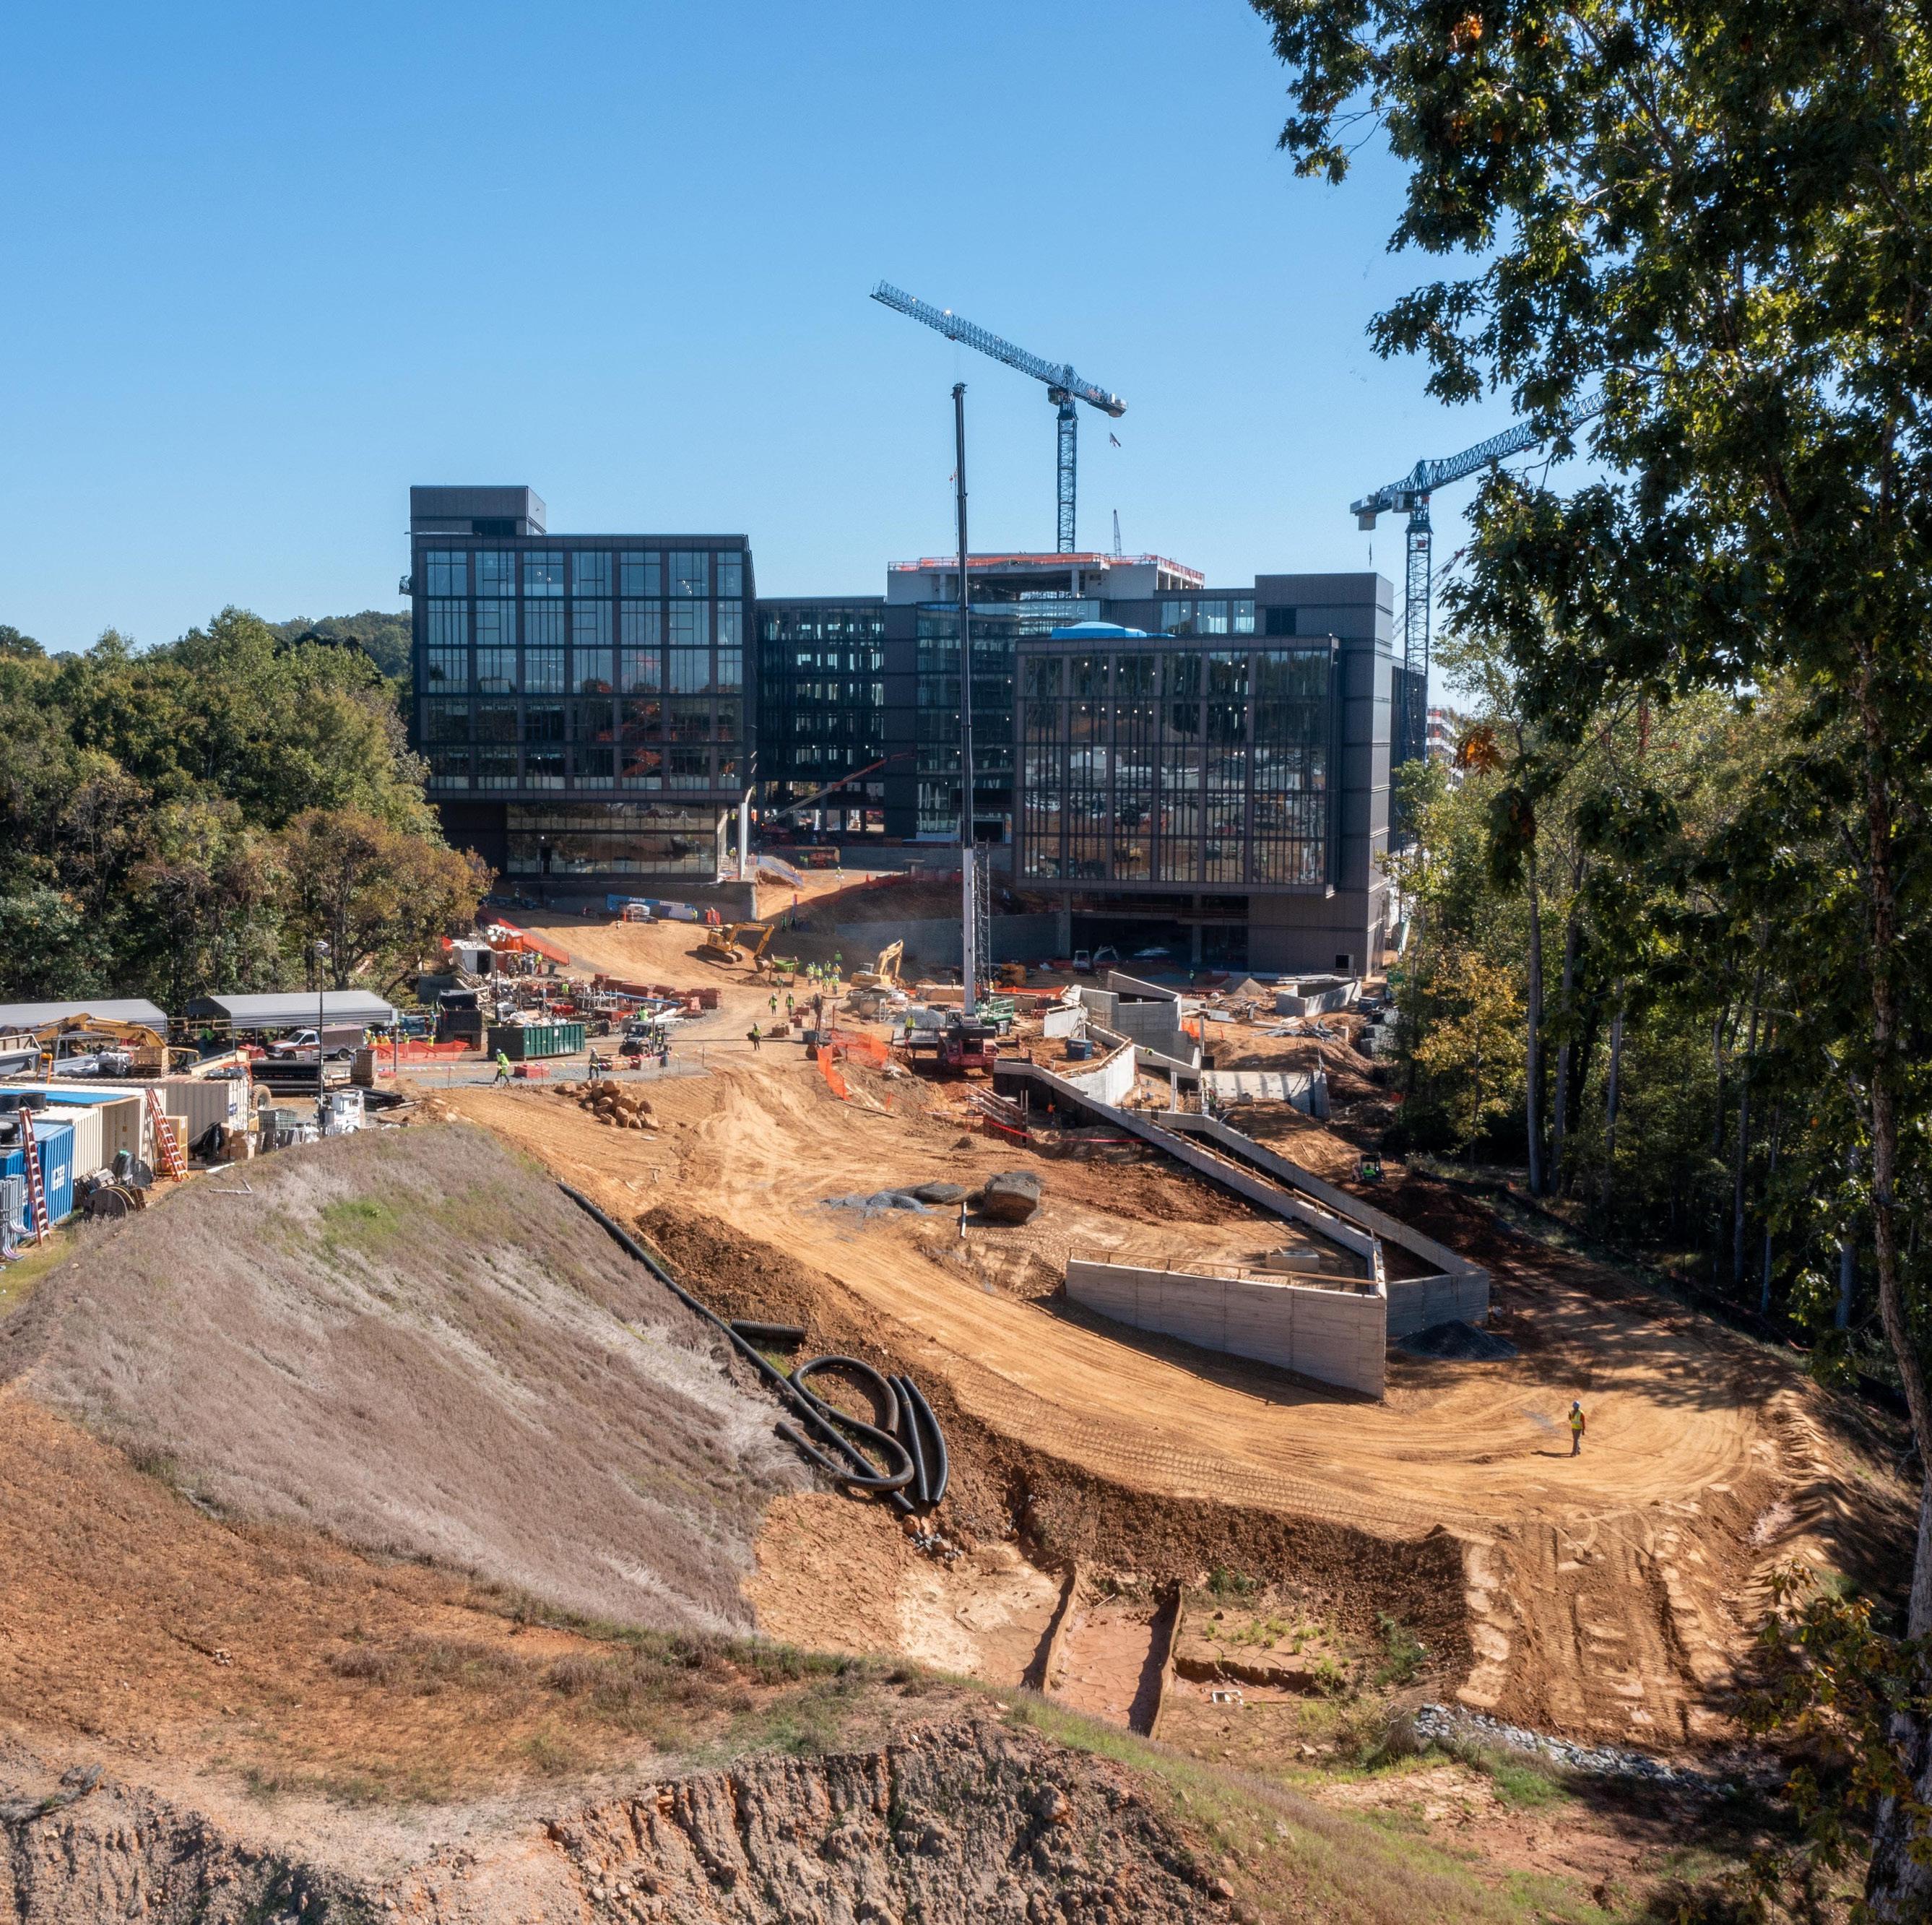
An example of potentially loud construction. How might inhabitants of nearby buildings respond psychologically? Courtesy of LandDesign.


The detailed analysis and design of sound in an architectural design can also reveal behaviors that have major programmatic implications.
Noise pollution is a growing public health concern. Aside from hearing loss, sustained exposure to loud sounds can cause neurological conditions like hyperacusis3. Noisy restaurants, streetscapes, and roads expose the majority of the US population to damaging volumes3. In a site-specific context, poor or unplanned acoustics can create discomfort that is implicitly associated with a place’s program. The buildup of bass in arenas and concert venues can cause a sensation of vibration in users’ eardrums and dramatically alter their emotional state4. Sounds can even be used to intentionally elicit physical stress. Infrasound waves — sounds at frequencies that are audible, but too low or high for our brains to comprehend5 — have been used in horror movies for decades to create physical tension in viewers.
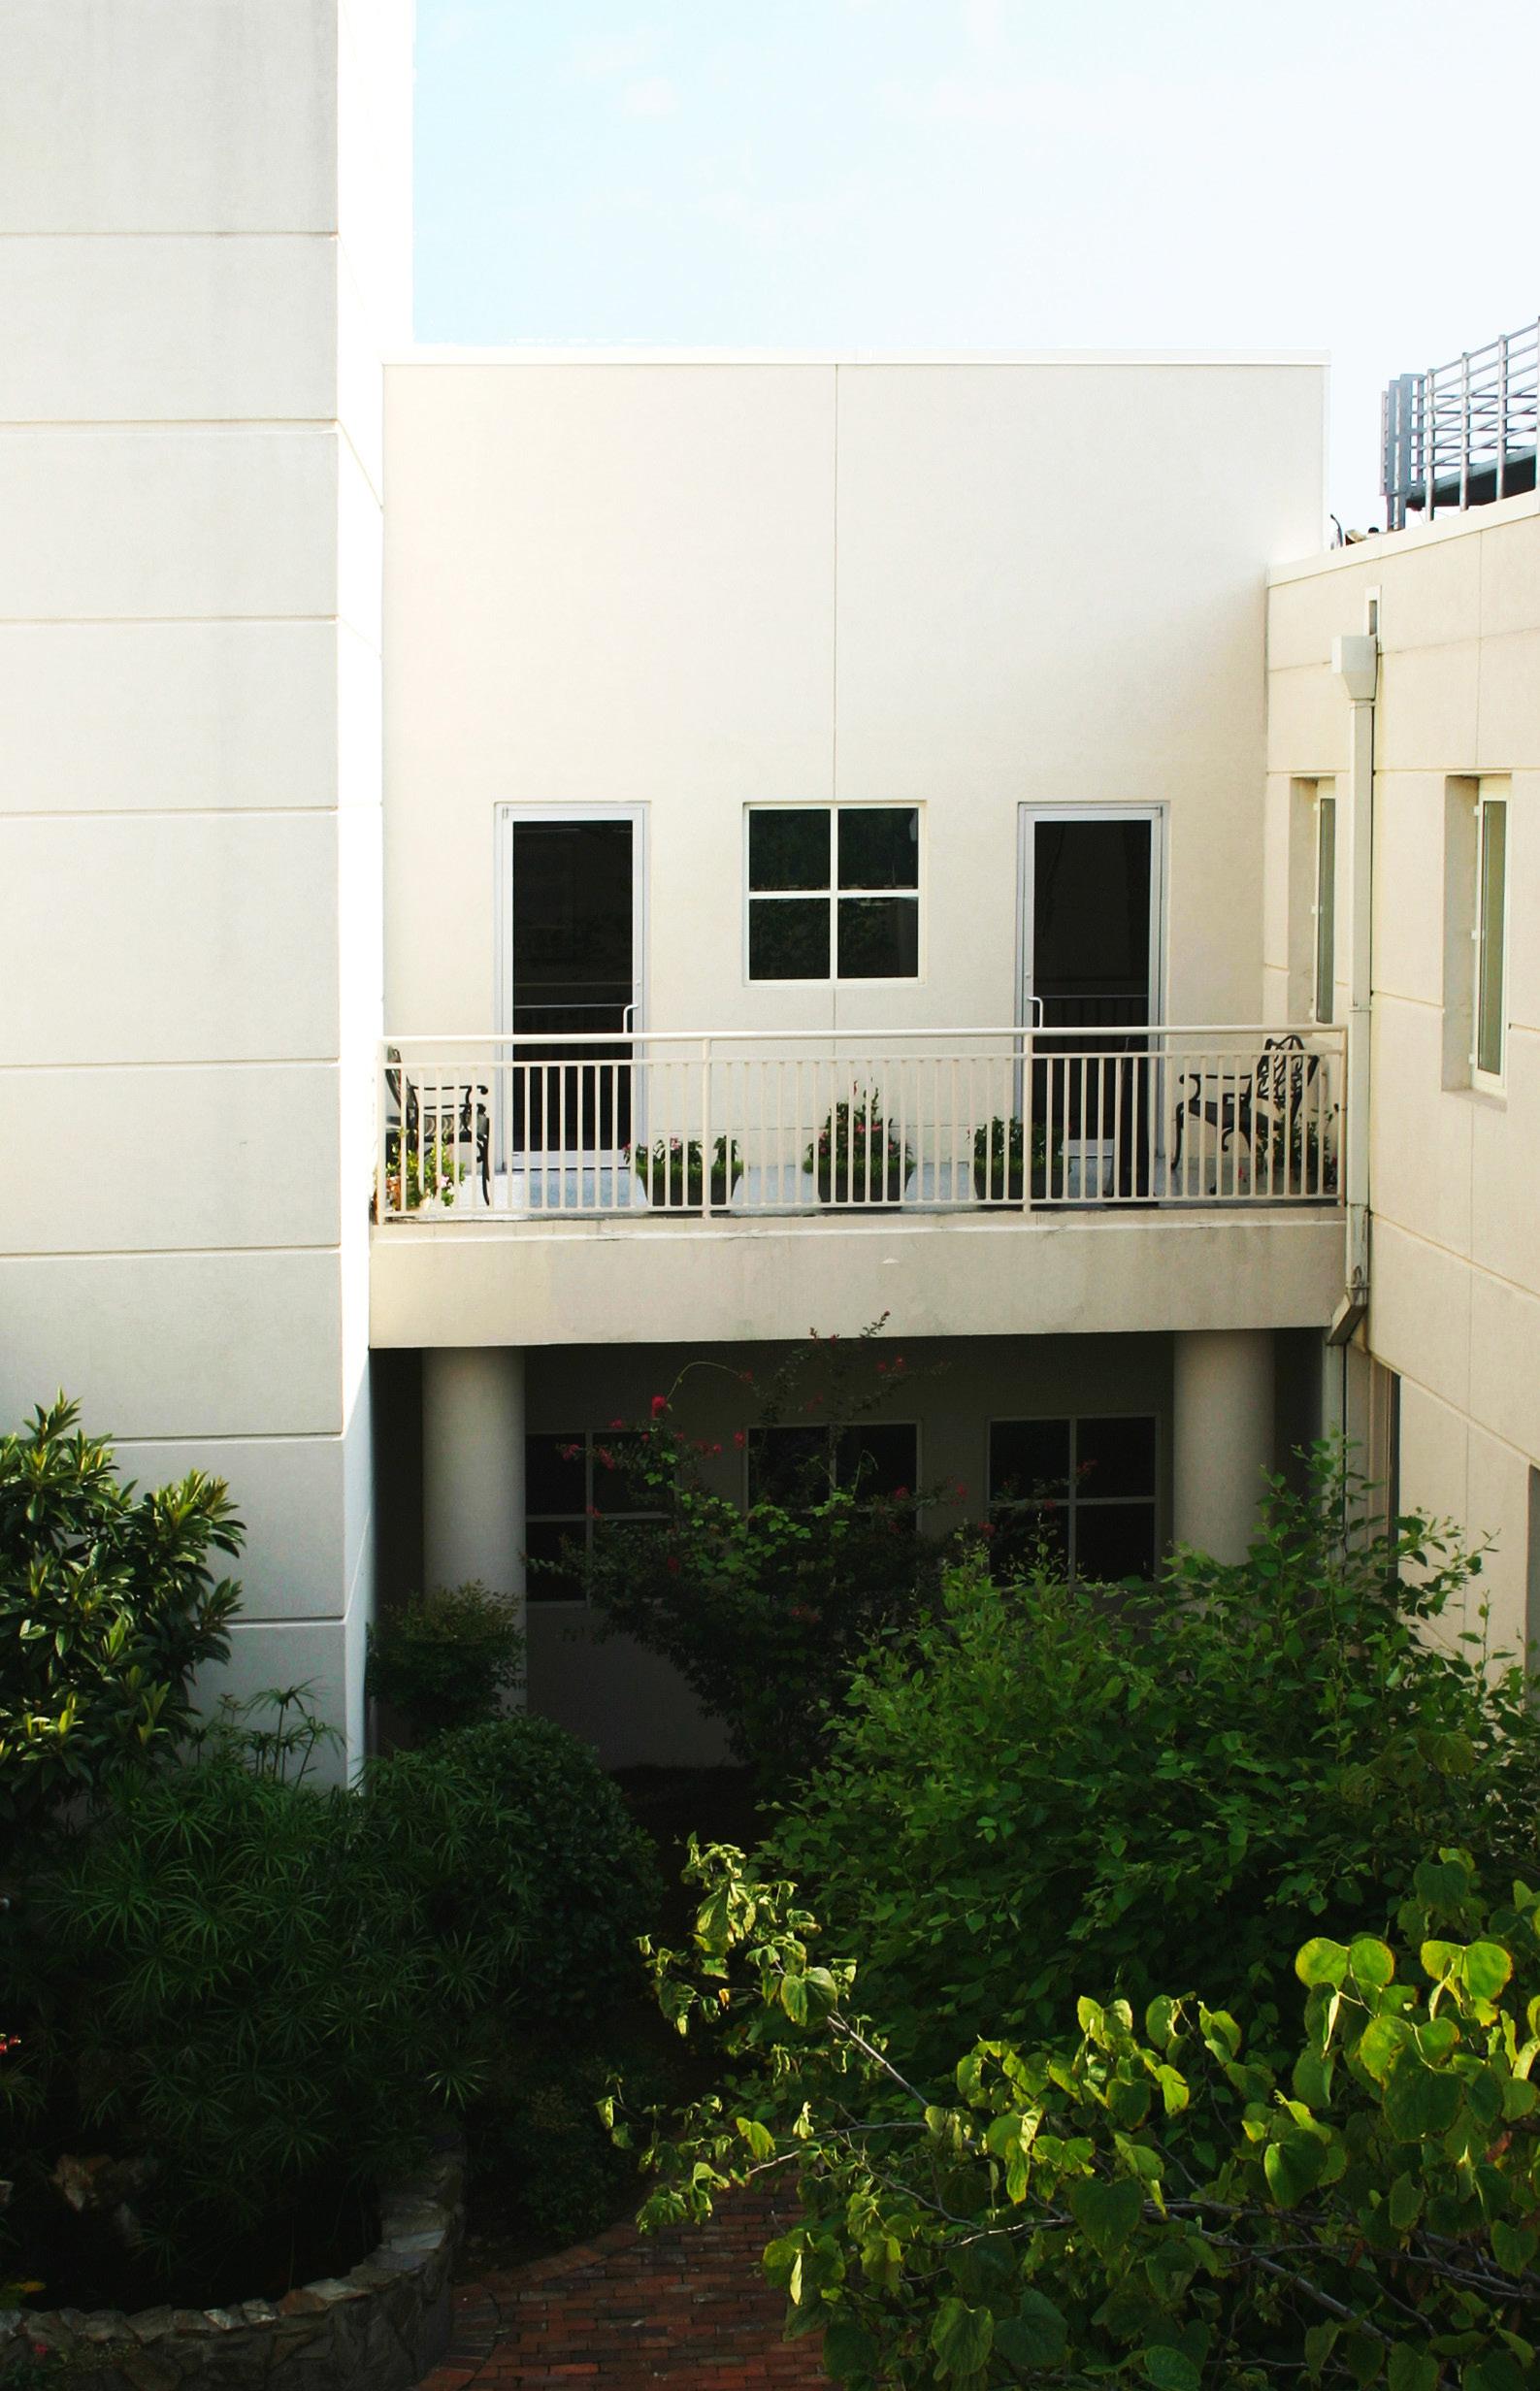
Medicinal garden, prioritizing soft materials and quiet.

Arena, prioritizing loudness through geometrical form.

It is true that excessive noise can be harmful. That doesn’t mean we should immediately approach sound as a phenomenon to be mitigated.
In fact, the introduction of sound into designed environments can have highly beneficial effects. Healthcare settings are a perfect example of this. The well-documented correlation between access to nature imagery and recovery speed in hospitals extends to the sonic realm. As early as 2010, studies have shown a positive correlation between exposure to natural soundscapes and medical recovery speed6. This correlation is particularly pronounced in cases of psychological stress. Designed loudness can also enhance the cultural subtext of a place. This is the case at the Lenovo Center in Raleigh, NC, which has been crowned as the “loudest house in the NHL”7. The loudness of the arena is a point of pride.
How can designers create spaces that strike a balance between presence and control of sound? Any approach to this question requires designers to understand the basics of sound, human hearing, and which aspects of the existing design process can be leveraged to sculpt a soundscape. In the following section, I will pose an approach to weave acoustic design into the overall narrative of space. This includes an iterative approach that allows designers to assess existing acoustic conditions and listen to how they might change using digital modeling techniques, as well as a summary of basic terms, materials, and scientific concepts.
The speed at which a sound wave travels. Spatial geometries can ampllify or dampen certain frequencies, leading to a prominence in different components of an overall sound. This can be observed in the form of bass buildup in large open spaces like arenas.
As with other sensory elements, a space sounds “good” when it fits into a user’s existing idea of a place2. An arena might sound loud, boomy, and enveloping, a concert hall might sound warm and full, while a hospital room would be silent. But there is a major drawback to these definitions - they are subjective. For this reason, it’s important to consider the cultural components of a place when working in an acoustic context, especially if a popular definition or identity has been formed around how a space sounds. You wouldn’t want to renovate the Lenovo Center and make it quieter.
Fortunately, human hearing is imperfect. By understanding how we hear, designers can prioritize the loudness of specific frequencies while mitigating unwanted ones.
Those adjectives I used in my acoustic definitions weren’t made up — each one has a frequency range associated with it. There are easy ways to leverage these ranges as design tools, optimizing spaces to fit a broader narrative.

“Microphones don’t hear the way a human does. How do you bridge this gap to better understand the sonic behavior of an arena?”
Imagine that you’re renovating the bowl of an arena. You’ve been asked to make it “feel loud,” while reducing the volume to safe levels. How would you do it?
One approach would be to optimize the level of different frequencies in the arena. You would start by recording a loud, important moment - like the crowd cheering - on a smartphone. This recording is useful because it allows you to take the sound of that moment back to your studio, making it possible for you to design an architectural response to it. But there’s a problem - the microphone in your smartphone doesn’t hear or feel sound the way a human does. How do you bridge that gap to better understand the sonic behavior of the arena during a moment of uproar?
You can start by visualizing the sound in a spectrum plot. This allows you to see the volume of frequencies in a recording. You can further separate this plot into bass, mid, and high sections.
From this plot, we know that bass buildup is a problem in the arena. This could lead to auditory discomfort in inhabitants and potential ear damage.
An analytical approach like this is extremely useful when conducting a broad pass at site analysis.
It’s not particularly spatial, but it allows a designer to better understand the sonic context of their work, providing constraints and inspiration for grounded acoustic interventions.
Iterative Simulation:
Simulation of nonvisual factors as a component of the design process. Daylighting and energy modeling can also fall into this category, depending on how they’re conducted.
Acoustic design can be approached in a variety of ways, but to make a compelling case for it, approaches that quantify benefits and return metrics are highly valuable.
Being able to project changes in sonic behavior is a powerful way to communicate the potential impact of a project. Simulationintegrated approaches to acoustic design are still uncommon, but they’re not unheard of8. Many firms, particularly those with a robust experiential or entertainment design sector, have used acoustic simulation to design and test bold interventions that reinforce spatial identity. One example is Populous, who employed acoustic particle simulations for rapid iteration in their design of New Tottenham Hotspur stadium in London, England9.
Fan experience ties into a broader sense of community, and teams function as tribes. As such, volume is an important part of stadium design.
In fact, Populous was specifically asked to make the Tottenham Hotspurs’ new home louder than their previous stadium. To achieve this, the firm tapped into two aspects of football culture - rowdy general admission sections and megaphones9.


Rather than spreading general admission seating throughout the stadium, Populous concentrated it behind the two goals, reinforcing the fierce tribalism of English football through spatial design. They also reinforced this tribalism through accompanying acoustic design. The South Stand of the stadium is elongated, creating a geometry that mimics the proportions of a megaphone. The cheers of fans in the stands are reflected by this geometry and resonated by the round form of the stadium’s bowl. The resulting noise is thunderous, creating a unique physical and auditory experience. In addition to massing-level decisions, Populous also included an acoustic paneling system to further ensure that its “megaphone” would function as intended9.
The acoustic complexity of such a large space cannot be understated.
As soundwaves bounce from building geometry and each other, they warp and distort. In fact, if they cross each other correctly, they can even cancel out and disappear. Acoustic simulation allows us to check for anomalies like these and determine potential causes.
In New Tottenham Hotspur Stadium, Populous used particle simulation to visualize the motion of soundwaves in the stadium, as well as how they might exit through its canopy9.
Particle-based acoustics simulations are very hard for most computers to run and aren’t as robust as image-source or timedomain simulations. However, in architectural contexts they are powerful tools for visualization and rapid iteration. By simulating how sound bounces off geometry and crosses itself, designers can more intelligently prototype the form of a space to prioritize acoustic performance.
This approach traces back to a fundamental fact of architectural acoustics — that changes to building geometry is usually more impactful than material treatments10.
In projects like New Tottenham Hotspur Stadium, where there are no existing building conditions to respond to, particle simulation is a surefire way to optimize massing and overall space planning. Integration with genetic solvers and generative optimization techniques can push this data-driven design approach even further.
On projects where you don’t have the luxury of starting from scratch, a more technical approach is required. Once you zoom in past a massing-level scope, materials begin to play an important role in the acoustic performance of a space. To keep analytical models lightweight and flexible, simulations that factor in materials can be conducted in a smaller study area. Resulting data visualizations can then be inserted around the model as generalized inferences. This approach can be used to conduct all sorts of tests.
By spot-simulating the sonic difference between empty and full seats in an arena, we can extrapolate how different attendance levels might sound and design accordingly.

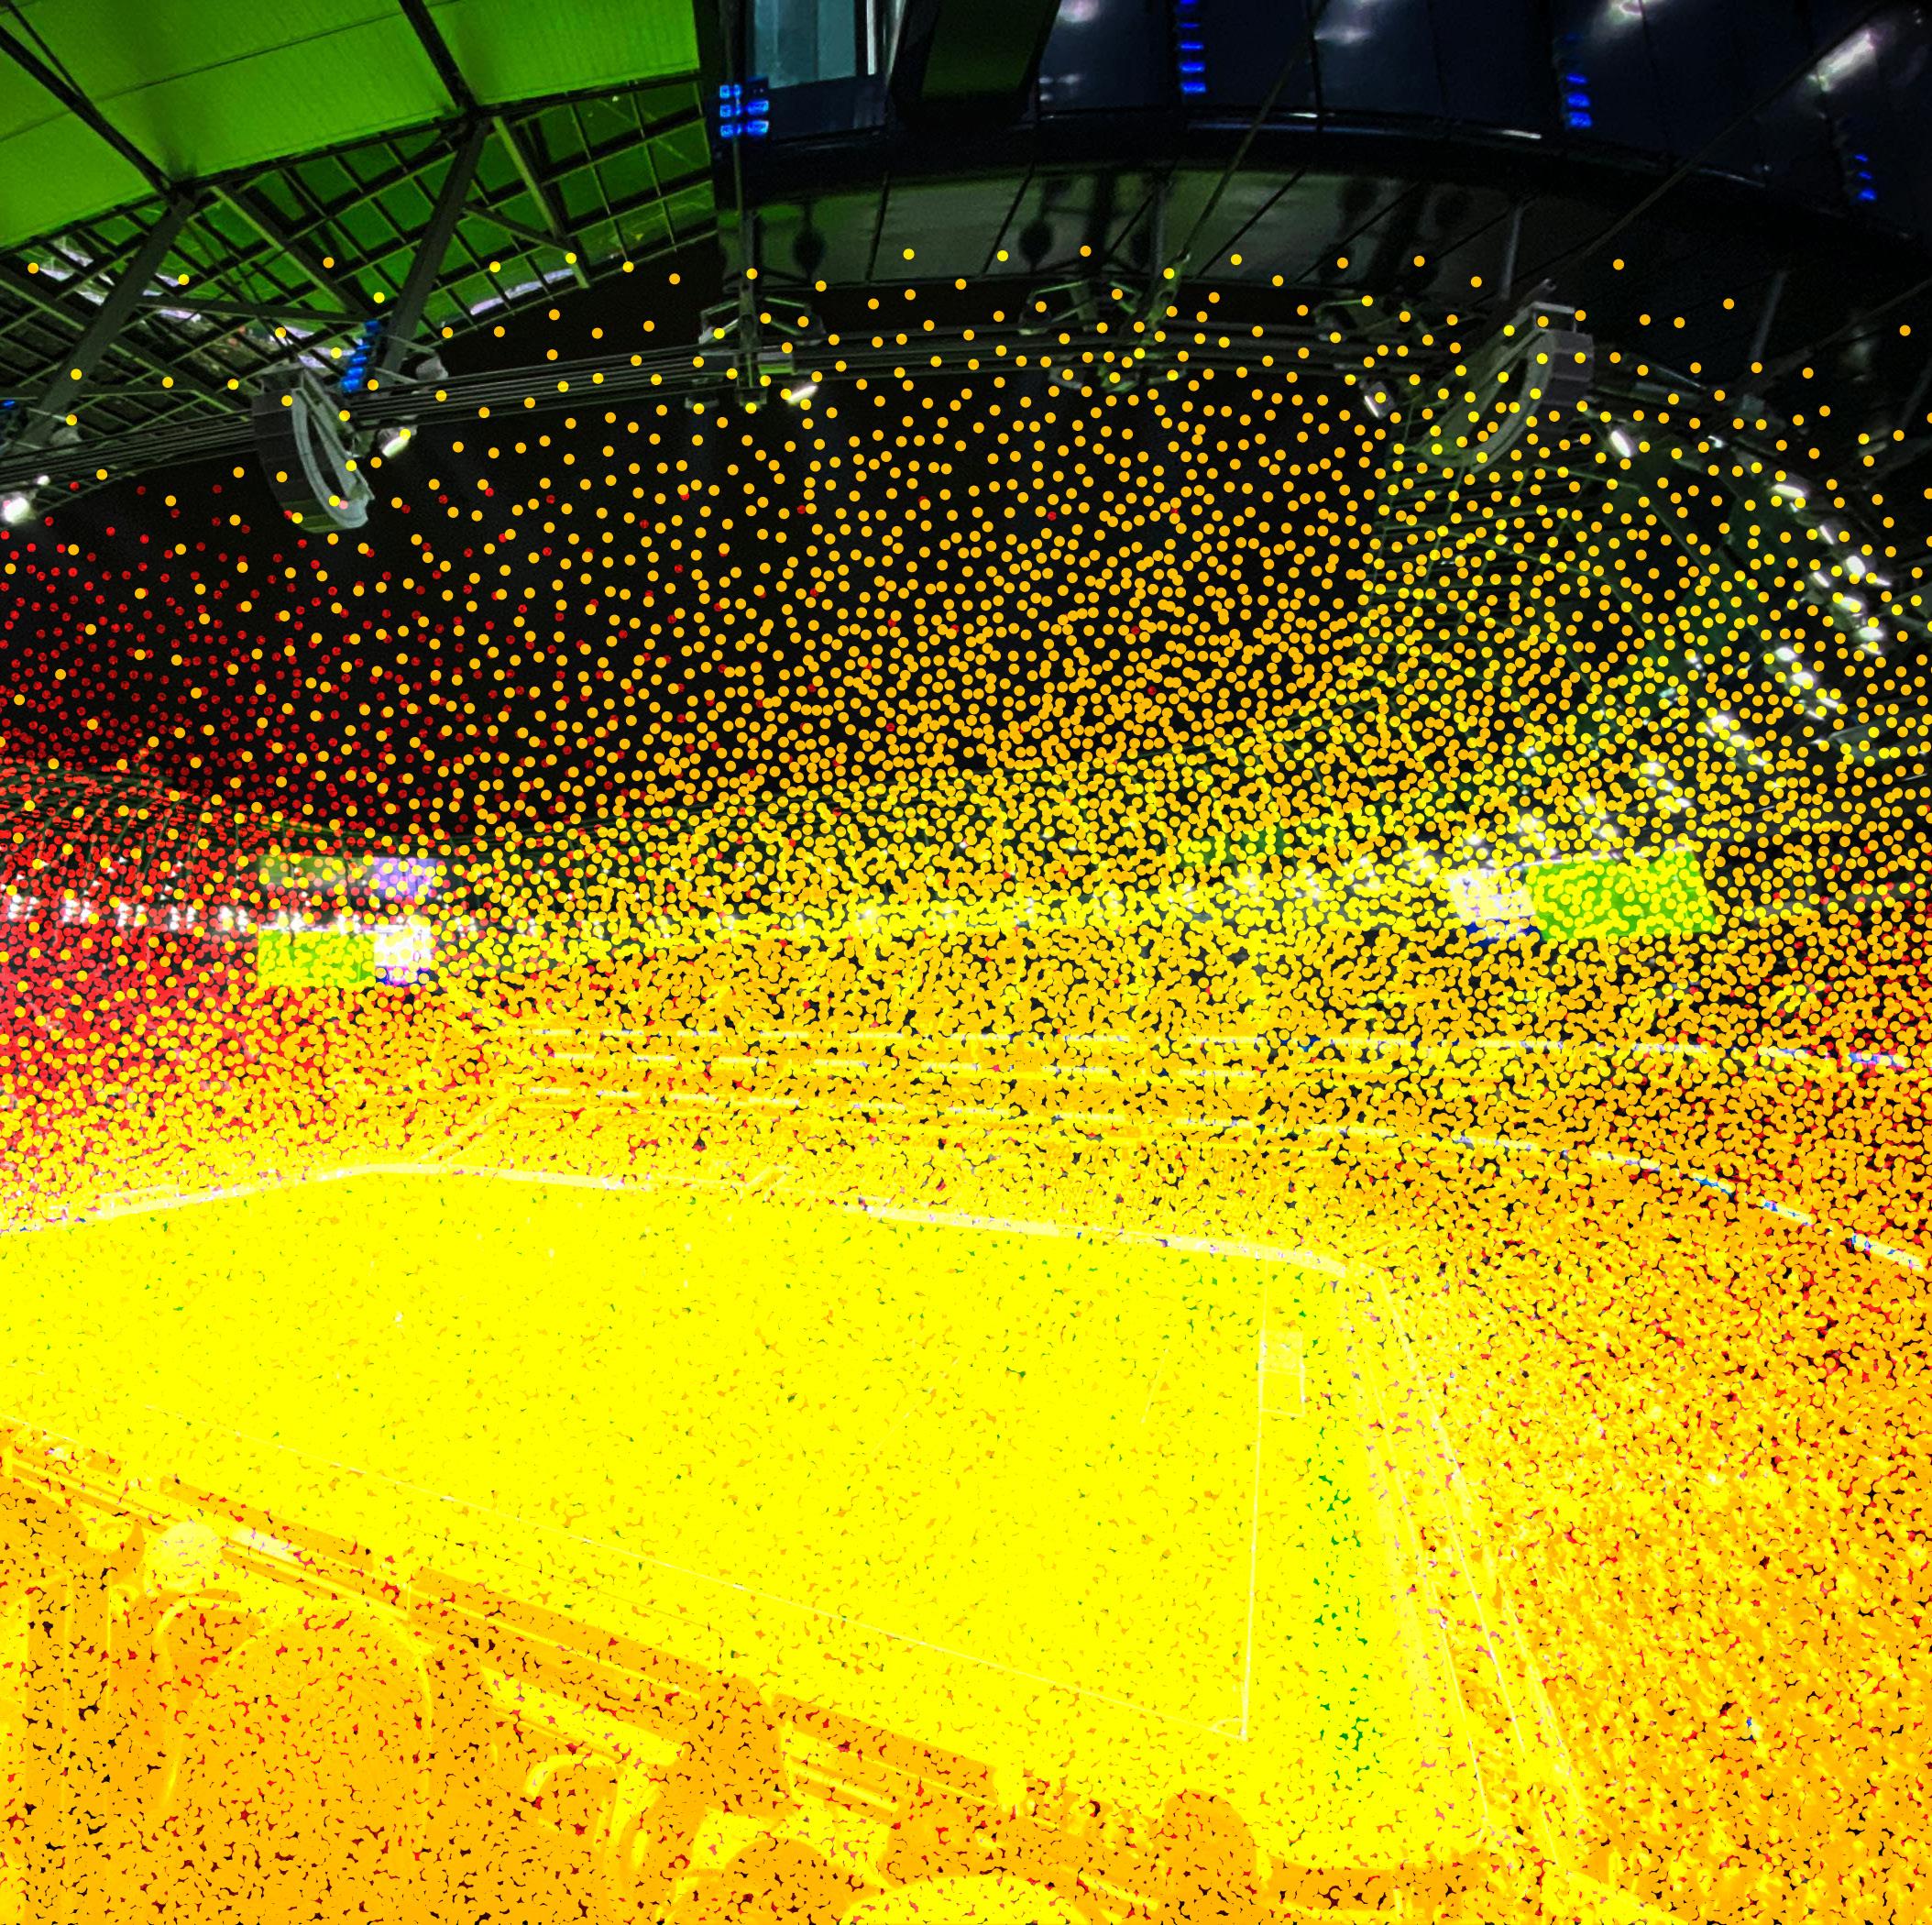
1. Heilig, Morton Leonard. “EL Cine Del Futuro: The Cinema of the Future.” Presence: Teleoperators and Virtual Environments 1, no. 3 (January 1992): 279–94. https:// doi.org/10.1162/pres.1992.1.3.279.
2. Spence, Charles. “Senses of Place: Architectural Design for the Multisensory Mind.” Cognitive Research: Principles and Implications 5, no. 1 (September 18, 2020): 3. https://doi.org/10.1186/s41235-020-00243-4.
3. Owen, David. “Is Noise Pollution the next Big Public-Health Crisis?” The New Yorker, 2019. https://www.newyorker.com/magazine/2019/05/13/ is-noise-pollution-the-next-big-public-health-crisis.
4. Epain, Nicolas, Samuel Moulin, Camille Mingam, Mérové Wallerich, Etienne Corteel, and Luc H. Arnal. “Bass Amplification Impacts Emotional, Neural and Physiological Responses to Music.” Applied Acoustics 241 (August 19, 2025): 110993. https://doi.org/10.1016/j.apacoust.2025.110993.
5. Møller, Henrik. “Physiological and Psychological Effects of Infrasound on Humans.” Journal of Low Frequency Noise, Vibration and Active Control 3, no. 1 (March 1984): 1–17. https://doi.org/10.1177/026309238400300101.
6. Calcaterra, Valeria, Selene Ostuni, Irene Bonomelli, Simonetta Mencherini, Marco Brunero, Elisa Zambaiti, Savina Mannarino, et al. “Music Benefits on Postoperative Distress and Pain in Pediatric Day Care Surgery.” Pediatric Reports 6, no. 3 (September 29, 2014). https://doi.org/10.4081/pr.2014.5534.
7. Eanes, Zachery. “How Loud Is It Really in the ‘Loudest House’ in the NHL? Enough to Give Canes an Advantage.” Raleigh News & Observer. Raleigh News & Observer, May 14, 2019. https://www.newsobserver.com/news/local/article230374759. html.
8. Jeong, Cheol-Ho. “Design, Simulation, and Virtual Prototyping of Room Acoustics : Challenges and Opportunities.” Research Portal Denmark, January 1, 2022.
9. Populous. “Make It Loud: Designing for Atmosphere at New Tottenham Hotspur Stadium | Populous,” 2019. https://populous.com/article/ make-it-loud-designing-for-atmosphere-at-new-tottenham-hotspur-stadium.
10. Bem, Milena Jonas, and Jonas Braasch. “Optimizing Museum Acoustics: How Absorption Magnitude and Surface Location of Finishing Materials Influence Acoustic Performance.” Acoustics 7, no. 3 (July 11, 2025): 43. https://doi. org/10.3390/acoustics7030043.
1. maps.dot.gov. “National Transportation Noise Map.” United States Department of Transportation, 2020. https://maps.dot.gov/BTS/ NationalTransportationNoiseMap/.
“Isovist measures like visibility can approximate where the attention of users may be directed in a space, allowing us to capture and divert users’ focus through design. This type of intervention applies not only to architectural contexts, but to interior and urban scales as well.”
Qualitative and quantitative approaches to the design of spatial experience can be applied throughout the design process.
At the proposal stage, quantitative approaches can be used to determine which spatial interventions should be prioritized to maximize design impact. Isovist measures like visibility can approximate where the attention of users may be directed in a space, allowing us to capture and divert users’ focus through design. This type of intervention applies not only to architectural contexts, but to interior and urban scales as well.
How do we determine where material changes in a room may have the most impact? How do we quantify and commodify retail visibility as a funding structure for urban design projects?
Quantitative approaches allow us to design places and spaces that accomplish these goals. And once we know what we’re trying to accomplish through quantification, we can deploy creative research methods to further refine our approaches through qualitative ground-truthing. Ultimately, creating these data-driven design possibilities helps clients make wise decisions about where and how to invest for maximum impact.
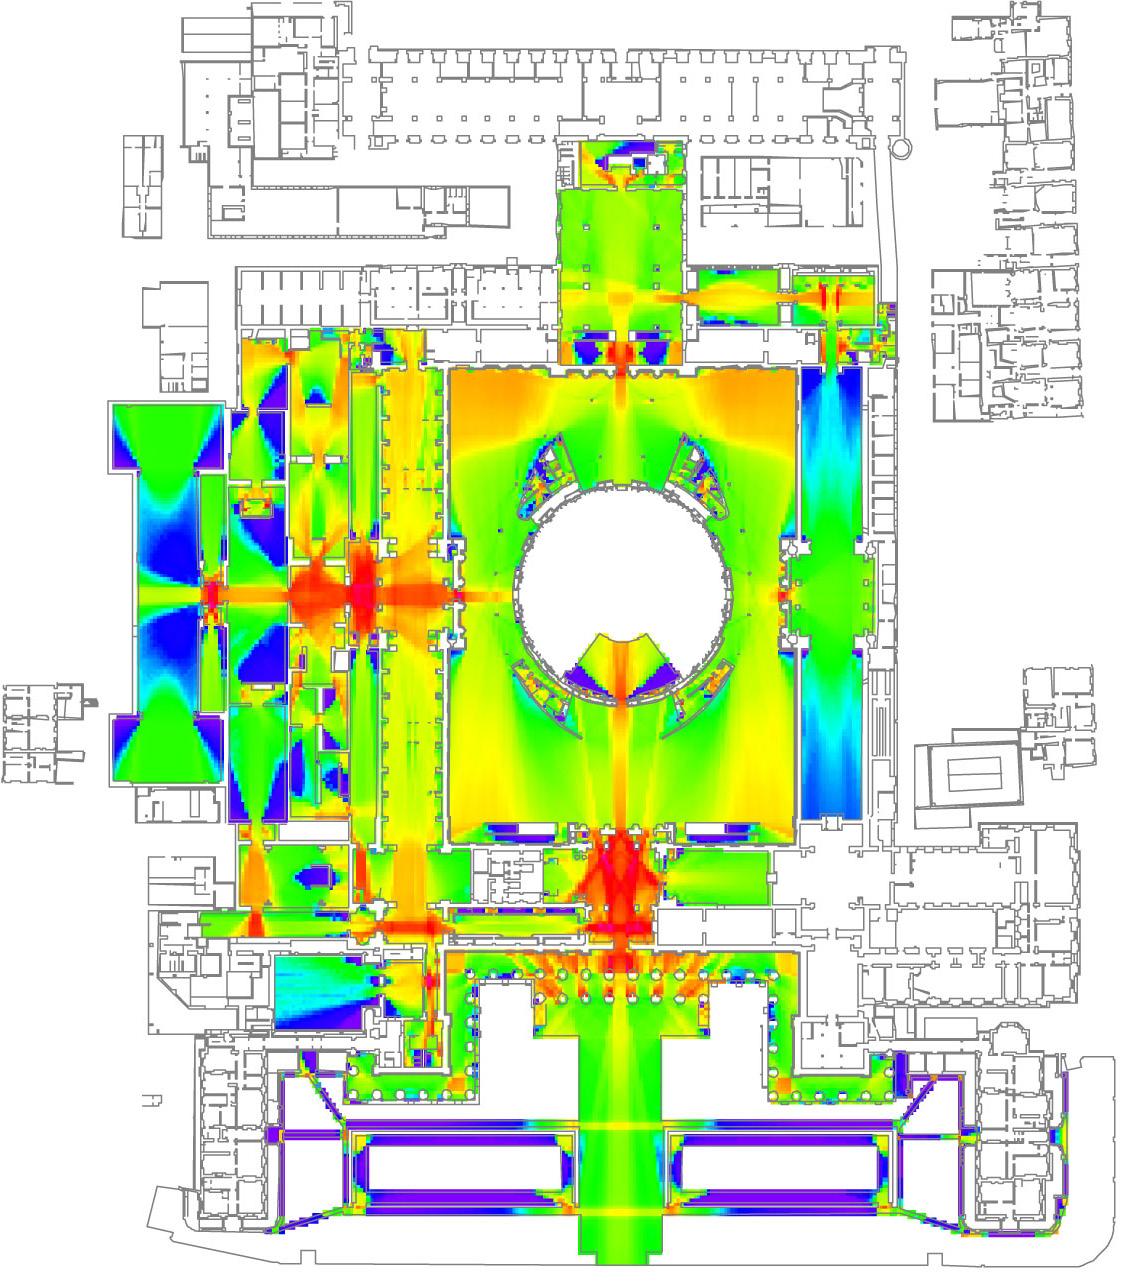
Visibility analysis conducted to optimize pathways in the British Museum1
Decision Support:
The practice of advocating for design decisions using data and analytics.
Although they were initially conceived for the purpose of space planning, the space syntax and isovist property measures used throughout this report can be implemented in many other contexts.
The ability to numerically map and explain experiential qualities of a space could make it easier to communicate why we’re prioritizing certain interventions, and how we’re coming to these decisions.
No matter the context, the quantitative nature of this approach to spatial analysis makes it a powerful tool for decision support in design proposals. We know most of what this quantitative analysis tells us intuitively. However, clients do not have the same design intuition that we do.
By breaking down our decisions visually and numerically, we can build trust through a transparent design process.
The included table proposes some potential implementations by LS3P practice area, use case, and relevant isovist or space syntax measure.
Education
Identify spaces for student gathering areas and study nooks Convex Deficiency
Healthcare
Hospitality
Interiors
Urban Environments
Optimize wall material changes in health facilities
Reinforce implicit corridors around the outside of a lobby
Maximum Radial Distance
Drift Magnitude
Identify areas of gathering in open spaces Circularity
Identify implicit gateways and thresholds in a mixed-use development
Minimum Radial Distance
“The ability to quantify the psychological effects of architecture through isovists and space syntax allows us to tailor our designs to the human experience in countless ways. However, these psychospatial metrics were first developed decades ago, and represent a small sliver of the sensory readings our brain makes when we perceive space.”
Although this research was deep and broad, it left me with a slew of new questions. These questions could become areas of interest for future research projects.
The ability to quantify the psychological effects of architecture through isovists and space syntax allows us to tailor our designs to the human experience in countless ways. However, these psychospatial metrics were first developed decades ago, and represent a small sliver of the sensory readings our brain makes when we perceive space.
• How can we build upon the rich mathematical foundation laid by space syntax pioneers to reach more comprehensive assessment of the human experience within a space?
• Are there ways to refine existing measures and propose new ones that speak to contemporary cultural attitudes and practices in planned spaces?
A design team can only implement new tools and theories on their projects if they have time.
• How can we more clearly map multisensory design data?
• How can we leverage the emerging power of AI to dynamically translate complex numerical data like space syntax properties into plain English?
Although quantitative methods of analyzing spatial sensation are incredibly valuable, they are still somewhat slow and confusing to calculate in 3D.
• How can we leverage every aspect of modern computing power to refine the quick, accurate calculation of spatial data?
• Do isovist property equations have to change when applied to a 3D scene?
• How can we further integrate this analytical process into the BIM tools architects are familiar with?
Answers to these questions will allow us to further integrate this kind of quantitative analysis into our design process and thinking, bringing human sensation to the forefront of architects’ minds as they tell spatial stories.
1. UCL Space Syntax. Strategic Visibility Analysis of the Ground Floor Gallery. 2025. https://www.spacesyntax.online/applying-space-syntax/building-methods/ application/#group-1.
The spatial connectivity of a point within a visibility graph. This property represents how “connected” any point in a space is1.
This measure describes the overall length of an isovist perimeter at any vantage point in a space2. High perimeter scores typically correlate with pathway junctions.
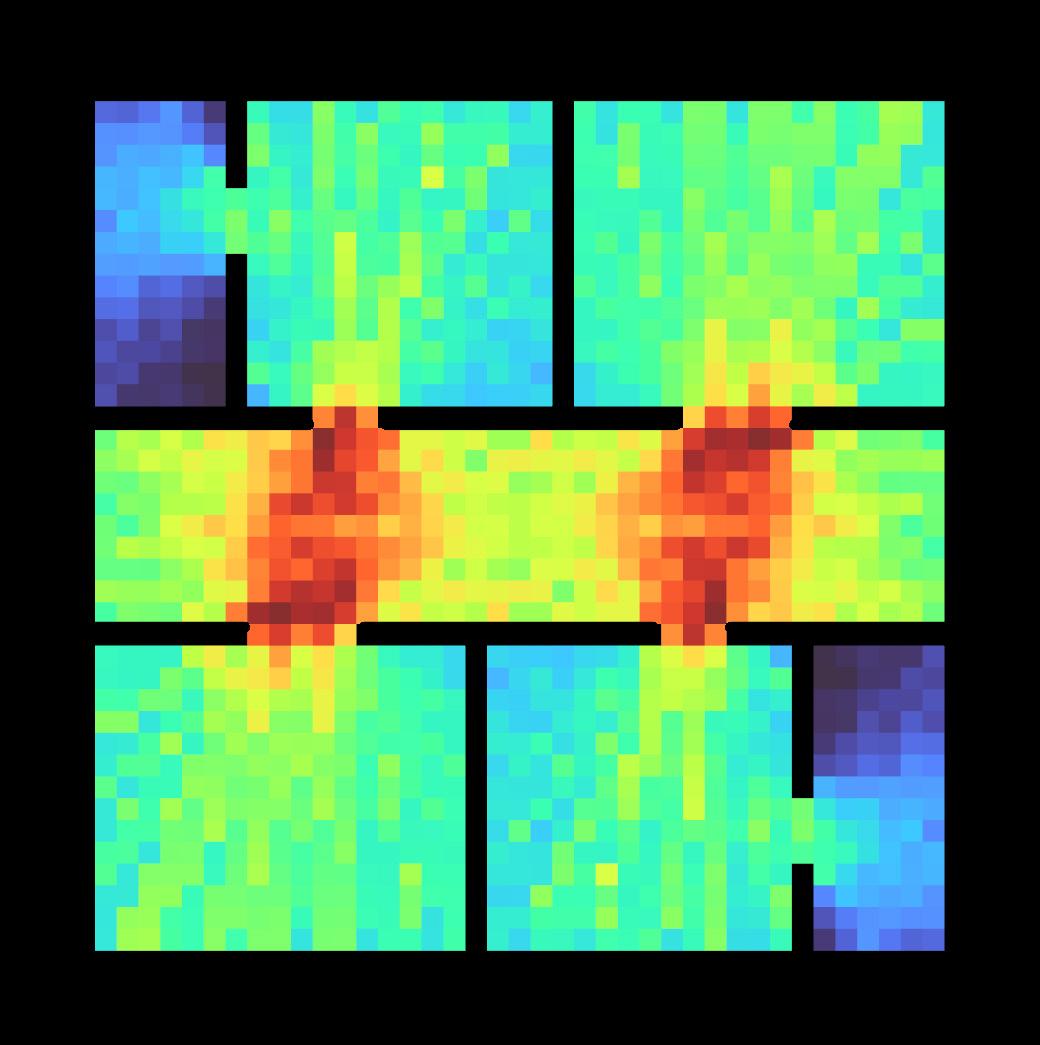
Regions of visual consistency in a plan3. High compaction scores suggest that an area requires a direct lane of travel to it to be visible, and that users must know about it beforehand.

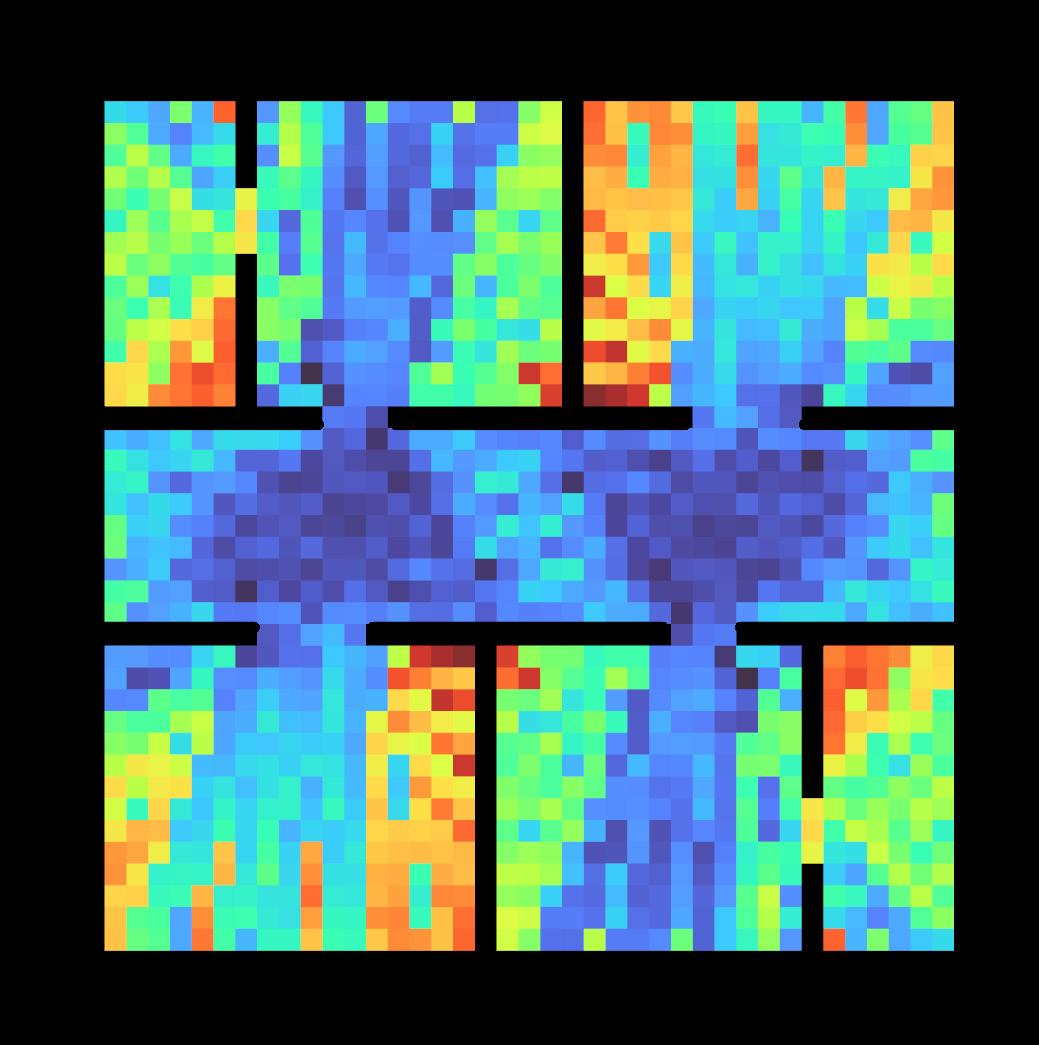
A measure of zones of visible geometric complexity across an entire plan. Circularity scores tend to be higher in spaces from which an inhabitant can see lots of doorways or corridors4.
Describes the number of “dents” in a space visible from a vantage point. Areas of high convex deficiency correlate with impressions of enclosure5.

The number of edges of an isovist that are not defined by a physical boundary. High occlusivity scores typically correlate with hallways or rooms with a high number of architectural columns5.
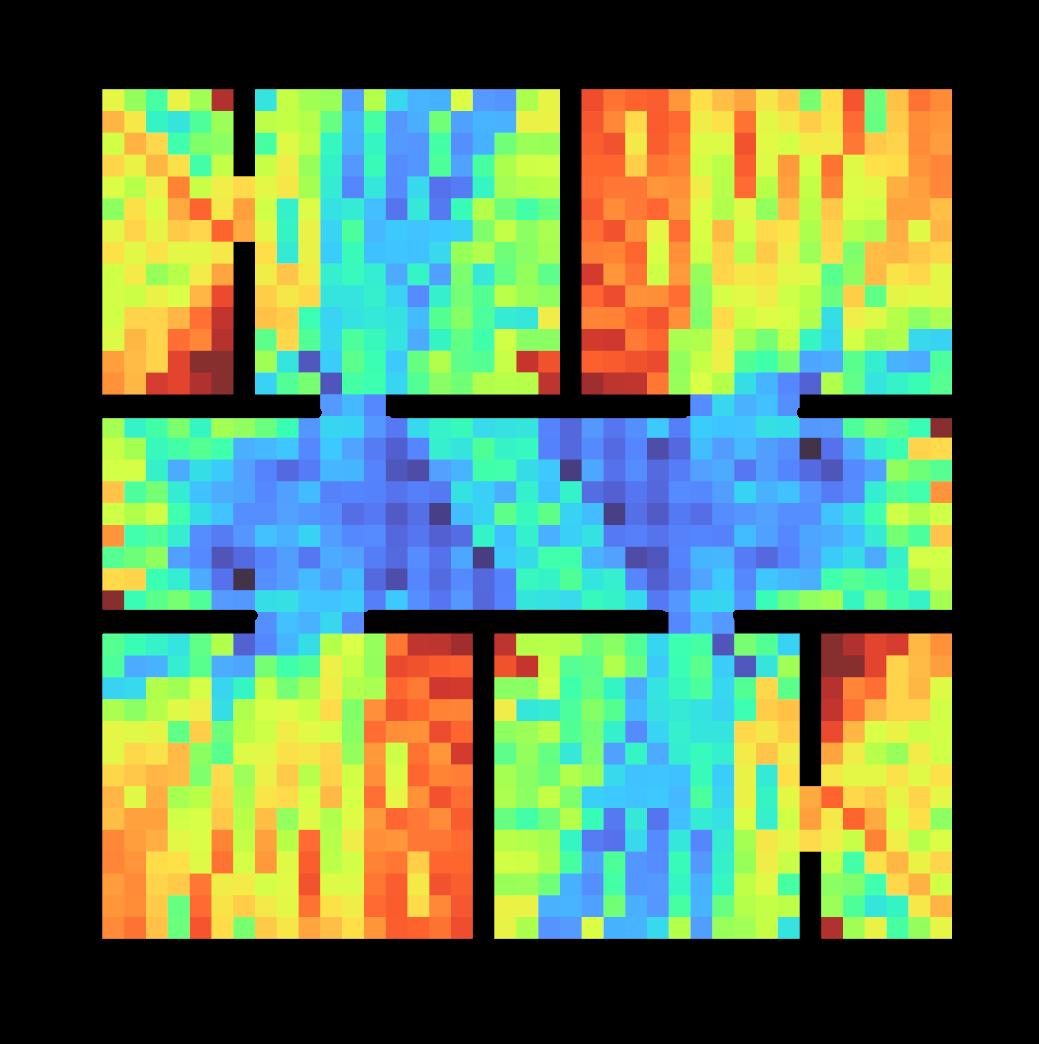

The minimum distance between any one vantage point and an obstacle. High values suggest that a space could be perceived as spacious, while low values could feel cramped5.
Maximum Radial Distance
The maximum distance between any one vantage point and an obstacles. High values suggest that a space might feel more spacious5.
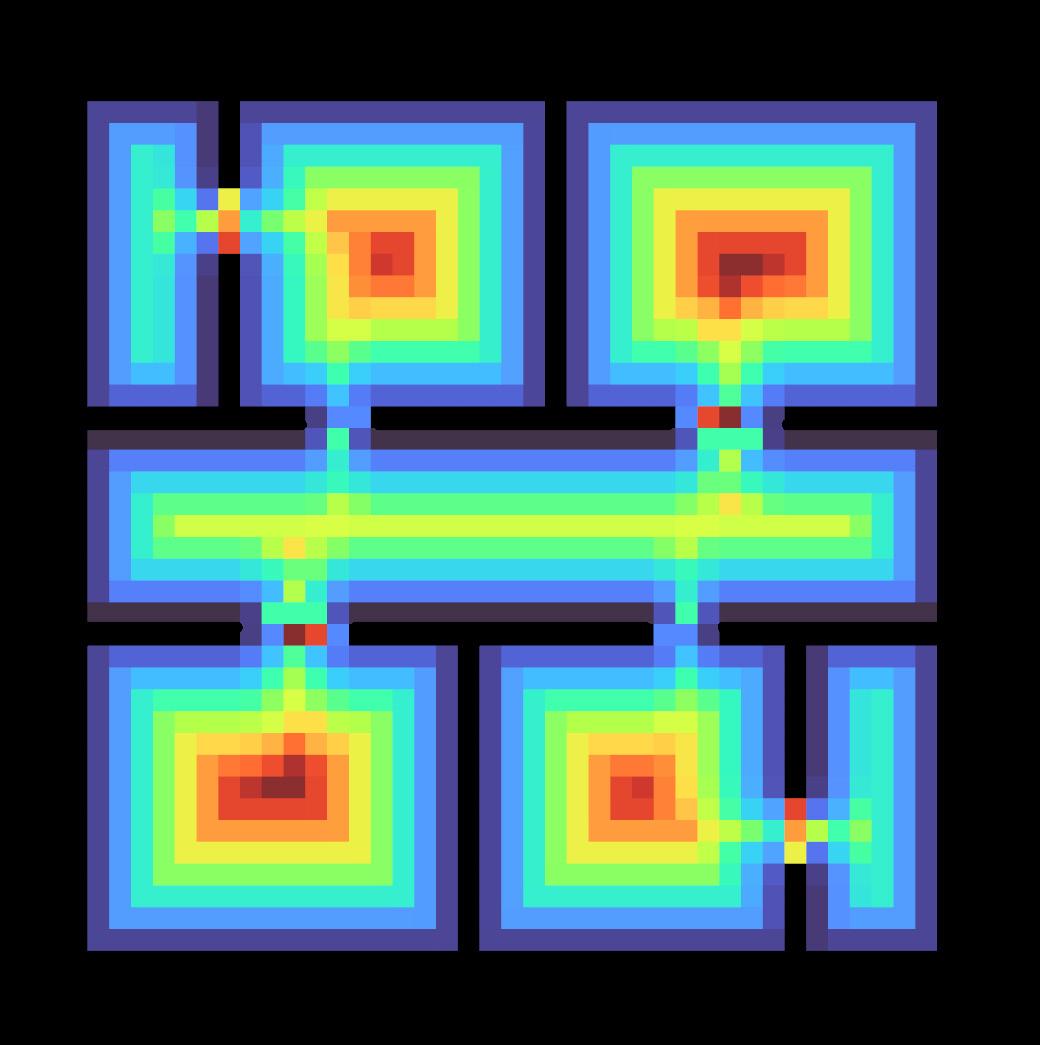
Mean Radial Distance
An average of all distances from each vantage point to the nearest obstacle. This property measures how much a user can see from any one vantage point6.
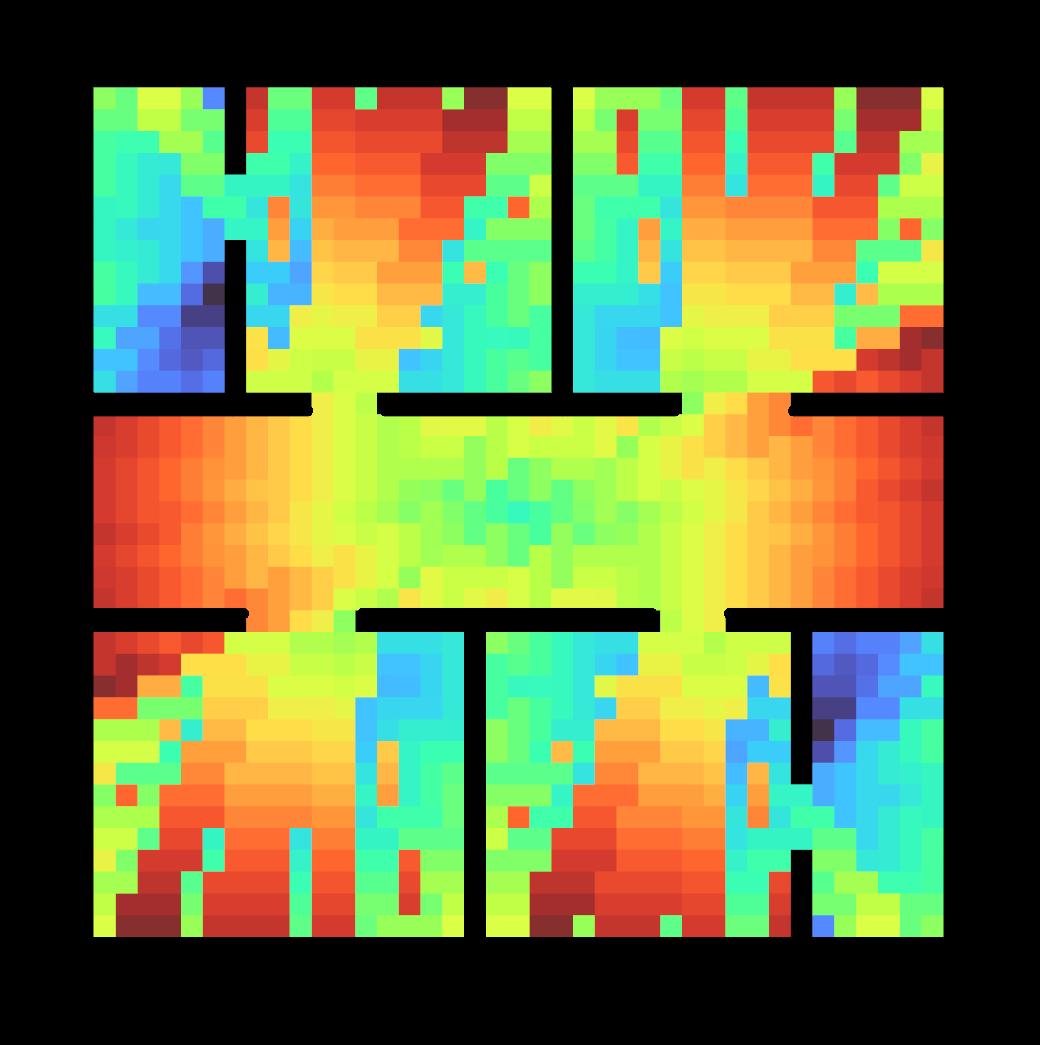
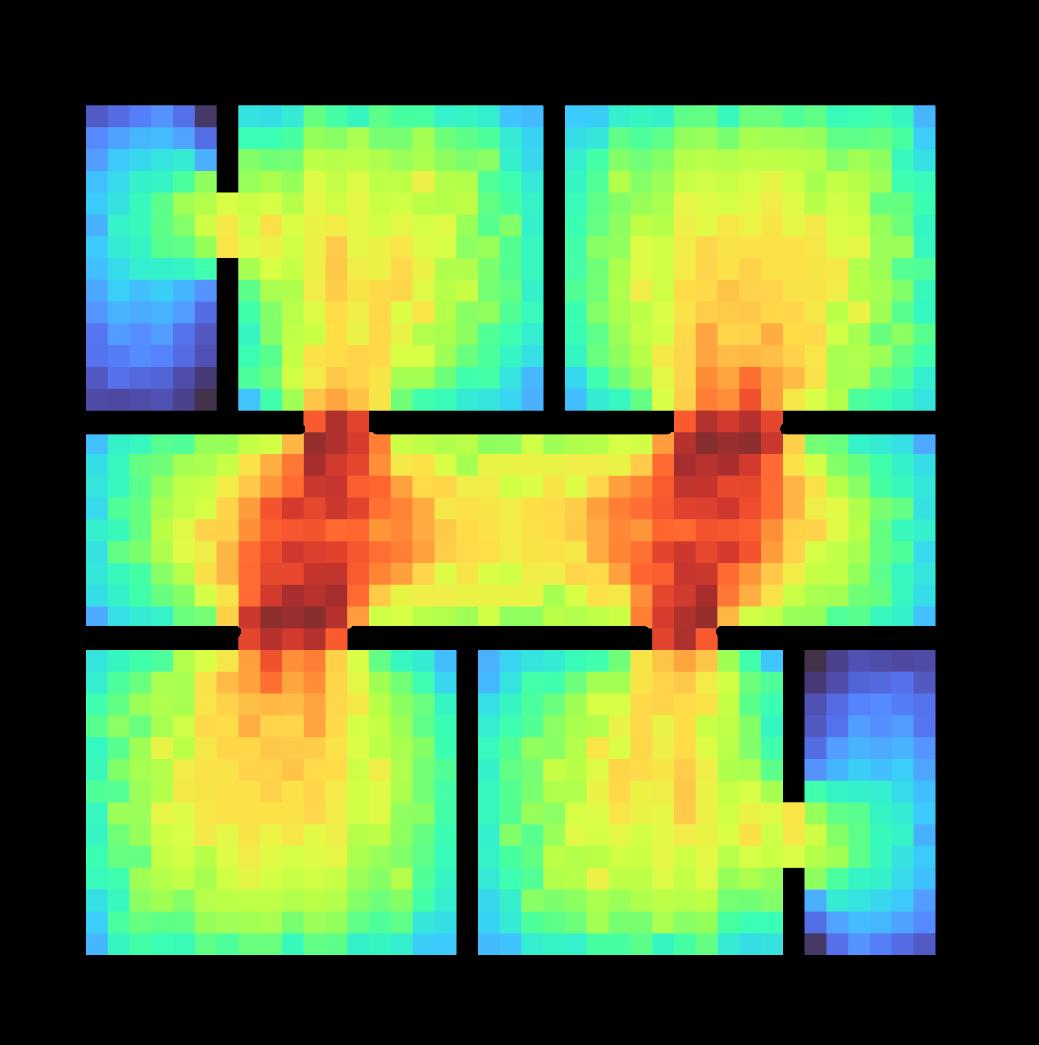
Standard Deviation
A measure of visible spatial variation. Vantage points in the center of a room have the lowest standard deviation, while edges and corridors have much higher scores5.
Variance
Describes the closeness of a vantage point to a wall, as well as the range of its view. Somewhat correllated to standard deviation4.
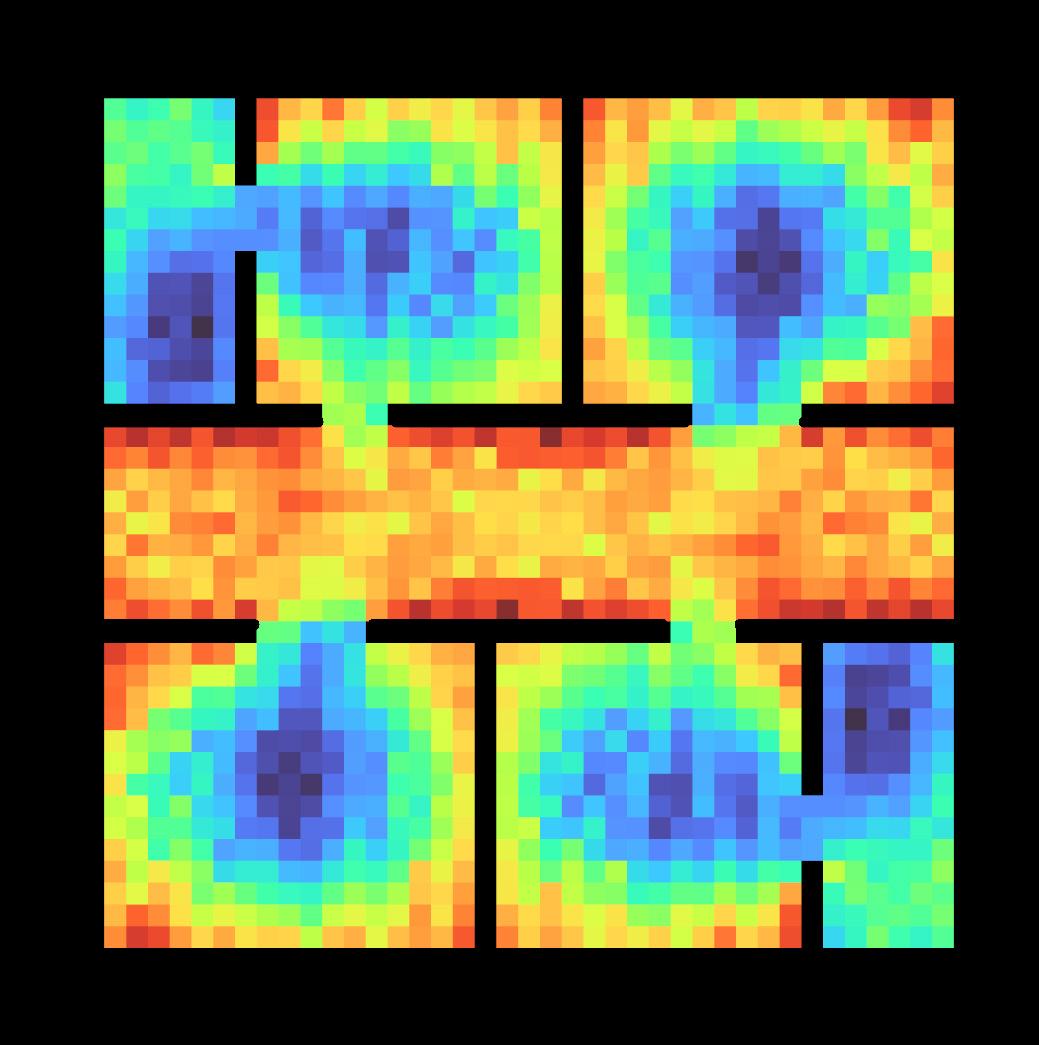
Skewness
A measure of the density of radial lengths in different directions. Areas of high skewness represent perceived corners and edges of space5.
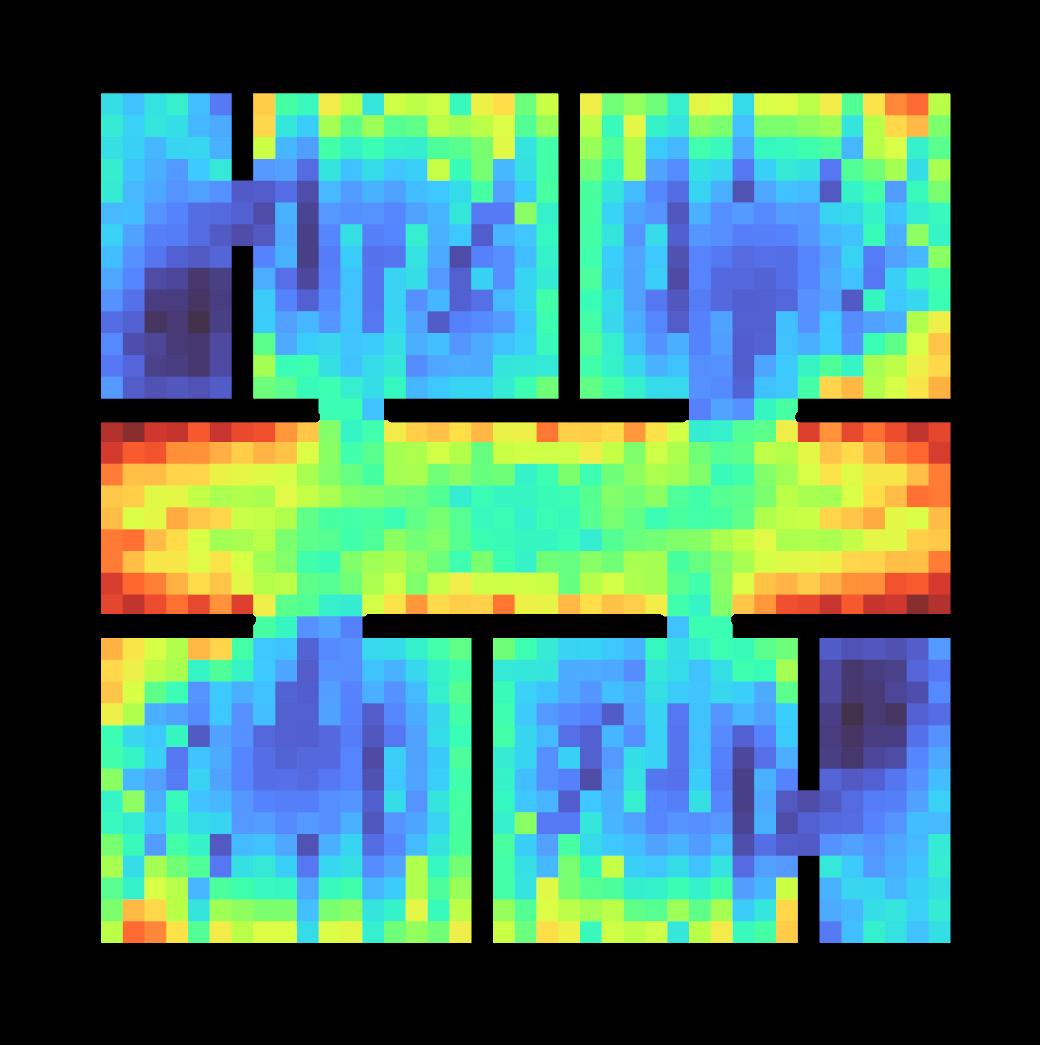

Dispersion describes how far a user can see from a given vantage point. Open spaces with few obstructions have high dispersion values7.
This measure describes the longness and thinness of a space. Areas with high elongation scores could be perceived as longer and thinner than areas with low scores5.
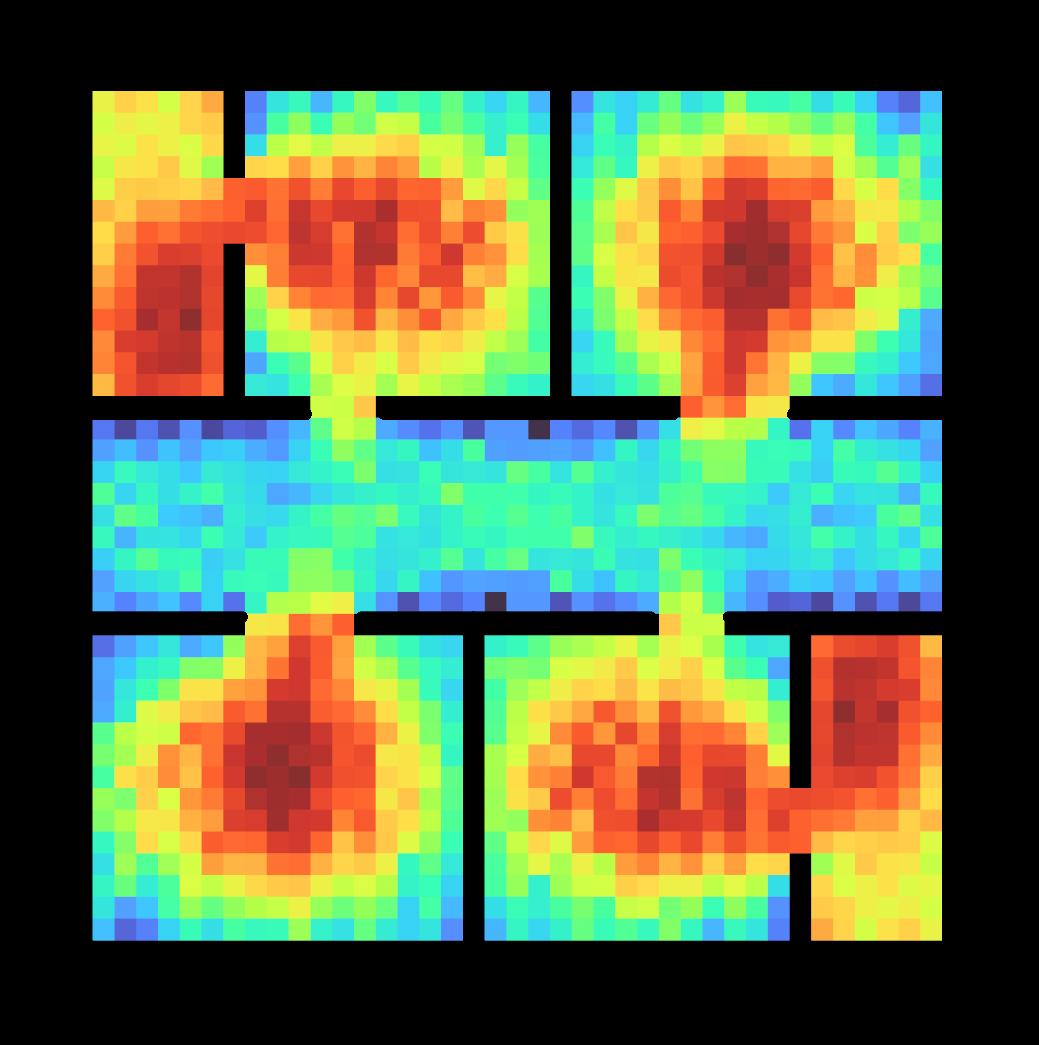
Drift Magnitude
The strength of a point in space’s psychological pull. Drift magnitude is typically higher at the edges of rooms and in literal and implicit corridors7.
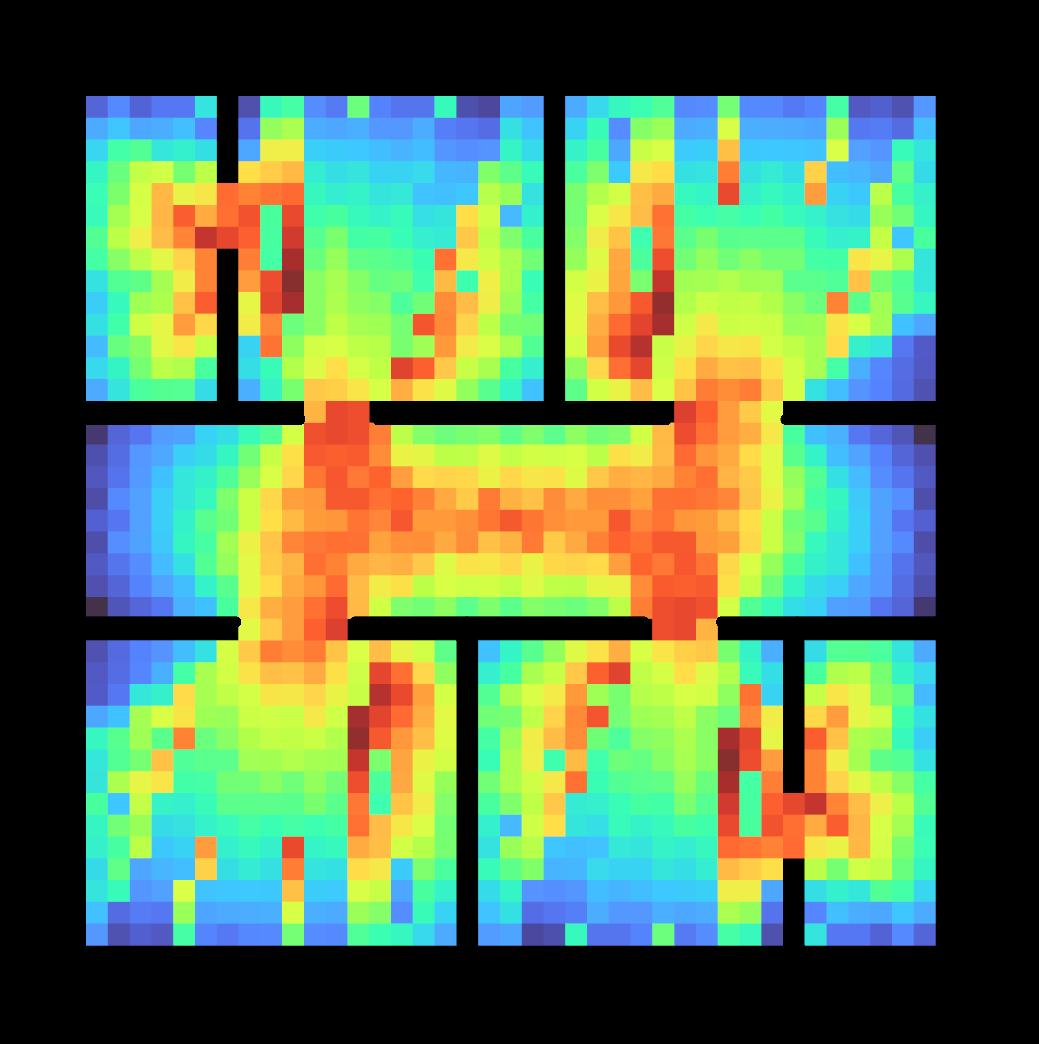
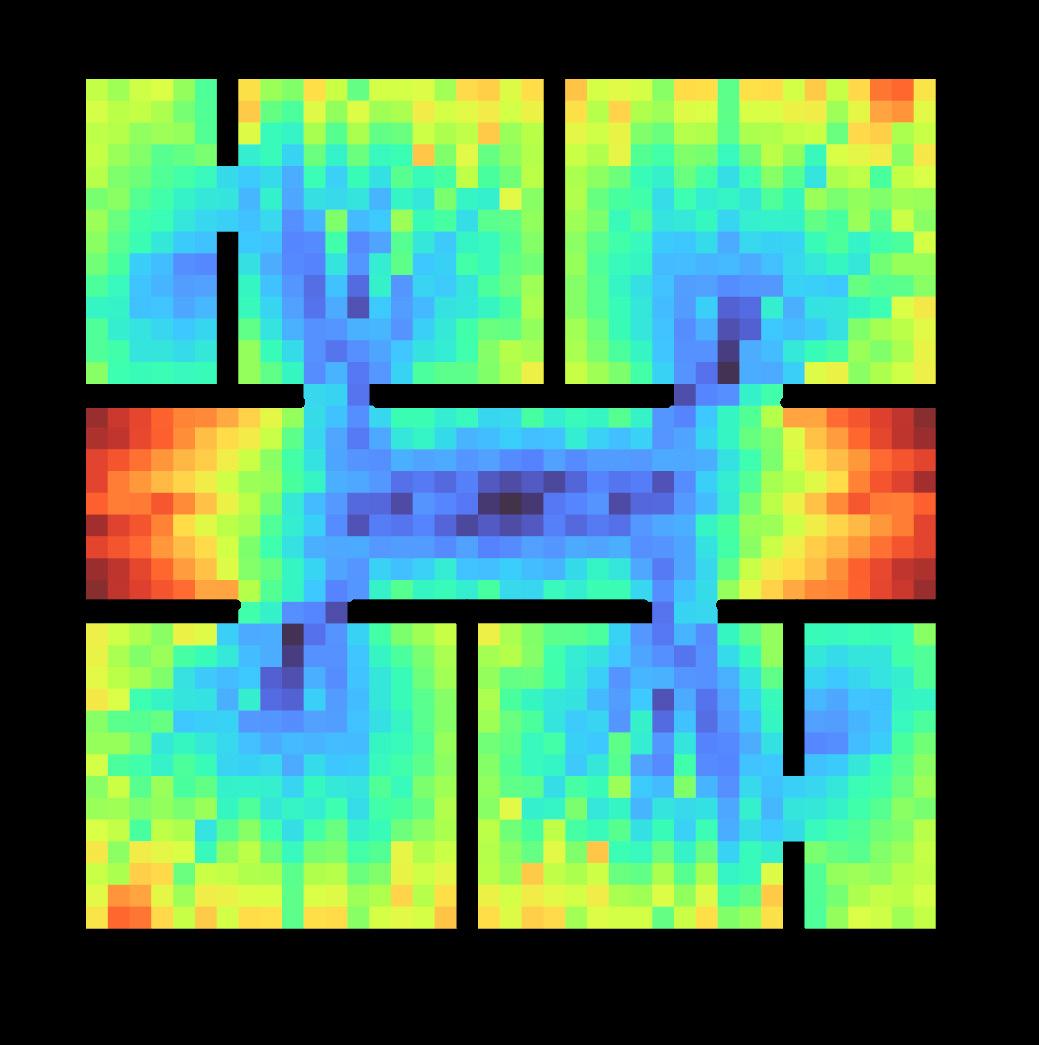
1. Isovists.org. “4.2.1 Area – Isovists.org,” 2024. https://isovists.org/user-guide/42-1-area/.
2. Isovists.org. “4.2.2 Perimeter & Closed Perimeter – Isovists.org,” 2024. https:// isovists.org/user-guide/4-2-2-perimeter-closed-perimeter/.
3. Isovists.org. “4.2.3 Compactness – Isovists.org,” 2024. https://isovists.org/ user-guide/4-2-3-compactness/.
4. Batty, Michael. “Exploring Isovist Fields: Space and Shape in Architectural and Urban Morphology.” Environment and Planning B: Planning and Design 28, no. 1 (February 2001): 123–50. https://doi.org/10.1068/b2725.
5. Stamps, Arthur E. “Isovists, Enclosure, and Permeability Theory.” Environment and Planning B: Planning and Design 32, no. 5 (October 2005): 735–62. https:// doi.org/10.1068/b31138.
6. Isovists.org. “4.2.6 Average Radial – Isovists.org,” 2024. https://isovists.org/ user-guide/4-2-6-average-radial/.
7. Dalton, Ruth, and Nick Dalton. “OmniVista:an Application for Isovist Field and Path Analysis,” May 1, 2001.
“4.2 Isovist Measure Definitions – Isovists.org.” 2024. Isovists. org. 2024. https://isovists.org/userguide-category/4-2-isovist-measuredefinitions/.
“4.2.1 Area – Isovists.org.” 2024. Isovists.org. 2024. https://isovists.org/ user-guide/4-2-1-area/.
“4.2.2 Perimeter & Closed Perimeter –Isovists.org.” 2024. Isovists.org. 2024. https://isovists.org/user-guide/4-2-2perimeter-closed-perimeter/.
“4.2.3 Compactness – Isovists. org.” 2024. Isovists.org. 2024. https://isovists.org/ user-guide/4-2-3-compactness/.
“4.2.6 Average Radial – Isovists.org.” 2024. Isovists.org. 2024. https:// isovists.org/user-guide/4-2-6-averageradial/.
Abbas, Sarah, Nathalie Okdeh, Rabih Roufayel, Hervé Kovacic, Jean-Marc Sabatier, Ziad Fajloun, and Ziad Abi Khattar. 2024. “Neuroarchitecture: How the Perception of Our Surroundings Impacts the Brain.” Biology (Basel) 13 (220): 4. https://doi.org/10.3390/ biology13040220.
American Institute of Architects. n.d. “AIA Framework for Design Excellence.” Www.aia.org. https:// www.aia.org/design-excellence/ aia-framework-design-excellence.
Atherton, Ethan. 2025. “Empowering Innovation with Computational Design.” LS3P. July 7, 2025. https://issuu.com/ ls3p/docs/empowering_innovation_ with_computational_design.
Babisch, Wolfgang. 2011. “Cardiovascular Effects of Noise.” Noise and Health 13 (52): 201. https://doi. org/10.4103/1463-1741.80148.
Batty, Michael. 2001. “Exploring Isovist Fields: Space and Shape in Architectural and Urban Morphology.” Environment and Planning B: Planning and Design 28 (1): 123–50. https://doi.org/10.1068/ b2725.
Bem, Milena Jonas, and Jonas Braasch. 2025. “Optimizing Museum Acoustics: How Absorption Magnitude and Surface Location of Finishing Materials Influence Acoustic Performance.” Acoustics 7 (3): 43. https://doi. org/10.3390/acoustics7030043.
Blesser, Barry, and Linda-Ruth Salter. 2009. Spaces Speak, Are You Listening? : Experiencing Aural Architecture. Cambridge (Massachusetts) ; London: The Mit Press.
Calcaterra, Valeria, Selene Ostuni, Irene Bonomelli, Simonetta Mencherini, Marco Brunero, Elisa Zambaiti, Savina Mannarino, et al. 2014. “Music Benefits on Postoperative Distress and Pain in Pediatric Day Care Surgery.” Pediatric Reports 6 (3). https://doi.org/10.4081/ pr.2014.5534.
Chopra, Ayush, Shashank Kumar, Nurullah Giray-Kuru, Ramesh Raskar, and Arnau Quera-Bofarull. 2024. “On the Limits of Agency in Agent-Based Models.” ArXiv (Cornell University), September. https://doi.org/10.48550/ arxiv.2409.10568.
Dalton, Ruth, and Nick Dalton. 2001. “OmniVista:an Application for Isovist Field and Path Analysis.” Proceedings of 3rd International Space Syntax Symposium Atlanta, May.
Davis, Larry S., and Michael L. Benedikt. 1979. “Computational Models of Space: Isovists and Isovist Fields.” Computer Graphics and Image Processing 11 (1): 49–72. https://doi. org/10.1016/0146-664x(79)90076-5.
Eanes, Zachery. 2019. “How Loud Is It Really in the ‘Loudest House’ in the NHL? Enough to Give Canes an Advantage.” Raleigh News & Observer. Raleigh News & Observer. May 14, 2019. https://www.newsobserver.com/news/ local/article230374759.html.
Epain, Nicolas, Samuel Moulin, Camille Mingam, Mérové Wallerich, Etienne Corteel, and Luc H. Arnal. 2025. “Bass Amplification Impacts Emotional, Neural and Physiological Responses to
Music.” Applied Acoustics 241 (August): 110993. https://doi.org/10.1016/j. apacoust.2025.110993.
Esposito, Dario, Stefania Santoro, and Domenico Camarda. 2020. “AgentBased Analysis of Urban Spaces Using Space Syntax and Spatial Cognition Approaches: A Case Study in Bari, Italy.” Sustainability 12 (11): 4–5. https://doi. org/10.3390/su12114625.
“Exploring Multi-Sensory Design in Architecture: Insights from Betsy Nolan’s Presentation.” 2023. Anfarch. org. Academy of Neuroscience for Architecture. 2023. https://anfarch.org/ research-topics/sensory-perceptionand-the-built-environment/page/ exploring-multi-sensory-design-inarchitecture-insights-from-betsy-nolanspresentation.
Felleman, D. J., and D. C. Van Essen. 1991. “Distributed Hierarchical Processing in the Primate Cerebral Cortex.” Cerebral Cortex 1 (1): 1–47. https://doi.org/10.1093/cercor/1.1.1.
Goel, Vinod. 1995. “Sketches of Thought.” https://doi.org/10.7551/ mitpress/6270.001.0001.
Gordoa, Luis. 2024. “Center for the Blind and Visually Impaired, Mauricio Rocha.” Eartharchitecture.org. November 5, 2024. https://eartharchitecture. org/?p=1870.
Guo, Jingwen, Xin Zhang, Yi Fang, and Renhao Qu. 2022. “An ExtremelyThin Acoustic Metasurface for LowFrequency Sound Attenuation with a Tunable Absorption Bandwidth.”
International Journal of Mechanical Sciences 213 (January): 106872–72. https://doi.org/10.1016/j. ijmecsci.2021.106872.
Harten, Arthur van der. 2013. “Pachyderm Acoustical Simulation: Towards Open-Source Sound Analysis.” Architectural Design 83 (2): 138–39. https://doi.org/10.1002/ad.1570. Heilig, Morton Leonard. 1992. “EL Cine Del Futuro: The Cinema of the Future.” Presence: Teleoperators and Virtual Environments 1 (3): 279–94. https://doi. org/10.1162/pres.1992.1.3.279.
Henshaw, Victoria, Kate McLean, Dominic Medway, Chris Perkins, and Gary Warnaby. 2017. Designing with Smell. Routledge.
Hillier, B. 1999. “The Hidden Geometry of Deformed Grids: Or, Why Space Syntax Works, When It Looks as Though It Shouldn’t.” Environment and Planning B: Planning and Design 26 (2): 169–91. https://doi.org/10.1068/b4125.
Holl, Steven, Juhani Pallasmaa, and Alberto Pérez Gómez. 2008. Questions of Perception : Phenomenology of Architecture. San Francisco: William Stout ; Tokyo.
Huber, Elizabeth, Kelly Chang, Ivan Alvarez, Aaron Hundle, Holly Bridge, and Ione Fine. 2019. “Early Blindness Shapes Cortical Representations of Auditory Frequency within Auditory Cortex.” Journal of Neuroscience 39 (26): 5143–52. https://doi.org/10.1523/ JNEUROSCI.2896-18.2019.
Jeong, Cheol-Ho. 2022. “Design, Simulation, and Virtual Prototyping of Room Acoustics : Challenges and Opportunities.” Research Portal Denmark, January.
Komatsu, Hidehiko, and Naokazu Goda. 2018. “Neural Mechanisms of Material Perception: Quest on Shitsukan.” Neuroscience 392 (November): 329–47. https://doi.org/10.1016/j. neuroscience.2018.09.001.
“Make It Loud: Designing for Atmosphere at New Tottenham Hotspur Stadium | Populous.” 2019. Populous. 2019. https://populous.com/article/ make-it-loud-designing-for-atmosphereat-new-tottenham-hotspur-stadium.
McLean, Kate. 2020. “Smellfie Kit.”
Sensory Maps. https://sensorymaps. com/wp-content/uploads/2024/07/ Smellfie_Kit_2020_compressed.pdf.
Mohamed, Abdelbaseer A., and Claudia van der Laag Yamu. 2023. “Space Syntax Has Come of Age: A Bibliometric Review from 1976 to 2023.” Journal of Planning Literature 39 (2): 203–17. https://doi. org/10.1177/08854122231208018.
Møller, Henrik. 1984. “Physiological and Psychological Effects of Infrasound on Humans.” Journal of Low Frequency Noise, Vibration and Active Control 3 (1): 1–17. https://doi. org/10.1177/026309238400300101.
Owen, David. 2019. “Is Noise Pollution the next Big Public-Health Crisis?”
The New Yorker. 2019. https://www. newyorker.com/magazine/2019/05/13/ is-noise-pollution-the-next-big-publichealth-crisis.
Perkins, Chris, and Kate McLean. 2020. “Smell Walking and Mapping.” Manchester University Press EBooks, April. https://doi.org/10.7765/9781526 152732.00017.
S Boucherit, Djihed Berkouk, Tallal Abdel, M Masullo, and L Maffei. 2022. “A Review of Inclusive Design and Multisensory Interactions Studies and Applications in Public Spaces.” IOP Conference Series 1113 (1): 012017–17. https://doi.org/10.1088/17551315/1113/1/012017.
Samuel Zwerger. 2022. “Notation as Design. Iannis Xenakis’s Philips Pavilion.” GAM. August 5, 2022. https:// gam.tugraz.at/2022/08/05/13-12zwergen-samuel-notation-as-design/.
Spence, Charles. 2020. “Senses of Place: Architectural Design for the Multisensory Mind.” Cognitive Research: Principles and Implications 5 (1): 3. https://doi.org/10.1186/ s41235-020-00243-4.
Stamps, Arthur E. 2005. “Isovists, Enclosure, and Permeability Theory.”
Environment and Planning B: Planning and Design 32 (5): 735–62. https://doi. org/10.1068/b31138.
Tancik, Matthew, Ethan Weber, Evonne Ng, Ruilong Li, Brent Yi, Justin Kerr, Terrance Wang, et al. 2023. “Nerfstudio: A Modular Framework for Neural Radiance Field Development.” ArXiv (Cornell University), July. https://doi. org/10.1145/3588432.3591516.
Vogler, Verena, Eleftherios
Kourkopoulos, Jens Joschinski, and Kay Eckelt. 2025. “Developing Volumetric Data Models for ML Training Datasets Using Grasshopper .” JoDLA – Journal of Digital Landscape Architecture, no. 10 (October). https://doi. org/10.14627/537754010.
Zimmermann, M. 1989. “The Nervous System in the Context of Information Theory.” Human Physiology, 166–73. https://doi. org/10.1007/978-3-642-73831-9_7.
Brooks, Joseph, Carlos Roman, Brendan Harmon, Annicia Streete, and Nicholas Serrano. “Visualizing Spatial Audio in Digital Landscapes.” Journal of Digital Landscape Architecture 10 (July 2025): 547.
Brooks, Joseph, Carlos Roman, Brendan Harmon, Annicia Streete, and Nicholas Serrano. “Visualizing Spatial Audio in Digital Landscapes.” Journal of Digital Landscape Architecture 10 (July 2025): 552.
Carsten Nicolai’s Artwork on Olympic Park Fence. 2012. Photograph. https:// www.migso-pcubed.com/case-studies/ london-olympics-case-study/.
Chou, Richard. “Space Syntax: Urban Network & Spatial Relations.” Data Mining the City, March 22, 2022. https://medium.com/data-mining-thecity-2022/space-syntax-urban-networkspatial-relations-7679de91beb.
Echelman, Janet. Pulse. 2018. Photograph. https://www.echelman. com/project/pulse.
Gordoa, Luis. Center for the Blind and Visually Impaired, Mauricio Rocha. November 5, 2024. Photograph. Earth Architecture. https://eartharchitecture. org/?p=1870.
Hadden, Mark. The Hive at Kew Gardens. n.d. Photograph. https://www. wolfgangbuttress.com/the-hive-at-kew.
Heilig, Morton Leonard. EL Cine Del Futuro: The Cinema of the Future. January 1992. Print. Presence: Teleoperators and Virtual Environments. Vol. 1. https://doi.org/10.1162/ pres.1992.1.3.279.
LS3P. “Adaptive Repositioning.” Issuu, March 24, 2025. https://issuu.com/ ls3p/docs/adaptive_repositioning.
maps.dot.gov. “National Transportation Noise Map.” United States Department of Transportation, 2020. https://maps.dot.gov/BTS/ NationalTransportationNoiseMap/. McLean, Kate. “Smellwalk Intro Kit,” May 2020. 2. https://sensorymaps.com/wpcontent/uploads/2020/05/Smellwalk_ Intro_Kit_%C2%A9KateMcLean_2015_ compressed.pdf.
McLean, Kate. Smellwalking Guide. 2020. Photograph. Smellfie Kit 2020. https://sensorymaps.com/wp-content/ uploads/2024/07/Smellfie_Kit_2020_ compressed.pdf.
McLean, Kate. Spring Scents & Smells of the City of Amsterdam. 2014. Print. https://sensorymaps. com/?projects=smellmap-amsterdam.
McLean, Kate. What Smells like “Home” to You? December 8, 2017. Atlas Obscura. https://www.atlasobscura. com/articles/art-mapping-smellsmellscapes-kate-mclean.
Populous. “Make It Loud: Designing for Atmosphere at New Tottenham Hotspur Stadium | Populous,” 2019. https://populous.com/article/make-itloud-designing-for-atmosphere-at-newtottenham-hotspur-stadium.
Populous. “The New Tottenham Hotspur Stadium | Designed by Populous.” Populous, 2024. https:// populous.com/showcases/ tottenham-hotspur-football-club.
UCL Space Syntax. Space Syntax Integration Pattern of Greater London. 2025. Spacesyntax.online. https://www.spacesyntax.online/ overview-2/#group-1.
UCL Space Syntax. Strategic Visibility Analysis of the Ground Floor Gallery. 2025. https://www.spacesyntax. online/applying-space-syntax/ building-methods/application/#group-1.
Willis, Jane, and Rebecka FleetwoodSmith. Sensing Spaces of Healthcare. 2024. https://hospitalsenses.co.uk/ wp-content/uploads/2024/02/sensingspaces-of-healthcare_creative-study_ evaluation-report_final_14.02.24.pdf.
Yamu, Claudia, and Akkelies van Nes. Introduction to Space Syntax in Urban Studies. S.L.: Springer Nature, 2021.