Q3-2025


Q3-2025
The Fairfield County real estate market continued to show strength in the third quarter of 2025, driven by rising prices, resilient buyer demand, and shifting inventory dynamics. While overall home sales were mixed across the region, with some towns posting gains and others experiencing declines, the broader trend points to a market recalibrating after several years of rapid growth.
Home sales across the county remained relatively steady, though not uniformly. While a few areas saw a slight uptick in transaction volume, others reported moderate to sharp declines. This uneven activity reflects both constrained inventory and a more selective buyer pool, particularly in mid- to lower-priced markets. Despite fewer homes changing hands in some towns, competitive bidding remained common, signaling that demand continues to outpace supply in many segments.
Home prices continued their upward trajectory, with nearly every market in Fairfield County recording year-over-year gains in both average and median sale prices. The luxury sector saw the most dramatic increases, but even mid-range and more affordable markets experienced solid appreciation. Price per square foot climbed across the board, further emphasizing the premium buyers are willing to pay for desirable properties in well-located towns.
Buyer demand remains strong and most towns saw homes selling close to or above asking price. Days on market generally fell or held steady, indicating that well-priced properties continue to move quickly.
Looking ahead, the market appears poised to remain competitive into the final quarter of the year. However, affordability pressures and limited inventory may begin to temper the pace of activity. Still, with pricing resilience and consistent buyer interest, Fairfield County remains one of the most in-demand real estate markets in the region.
With Warm Regards,
Liz Nunan President and CEO
THIRD QUARTER 2025
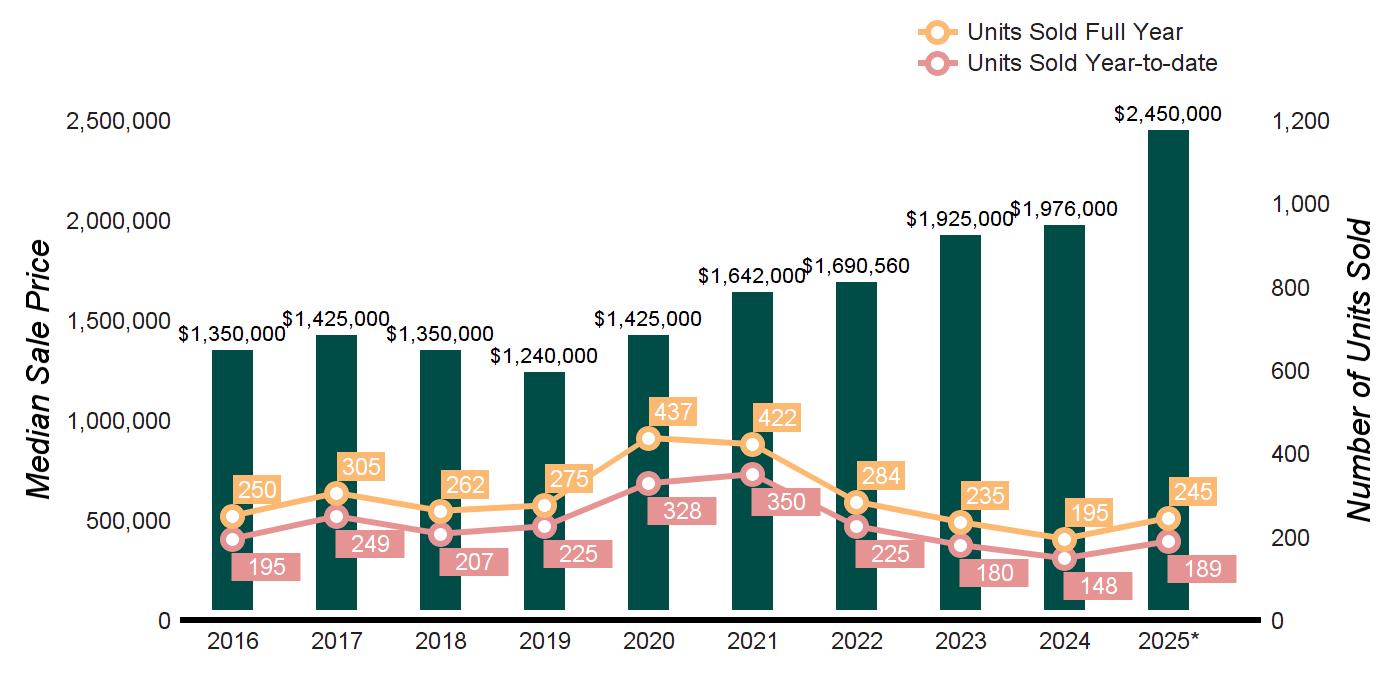
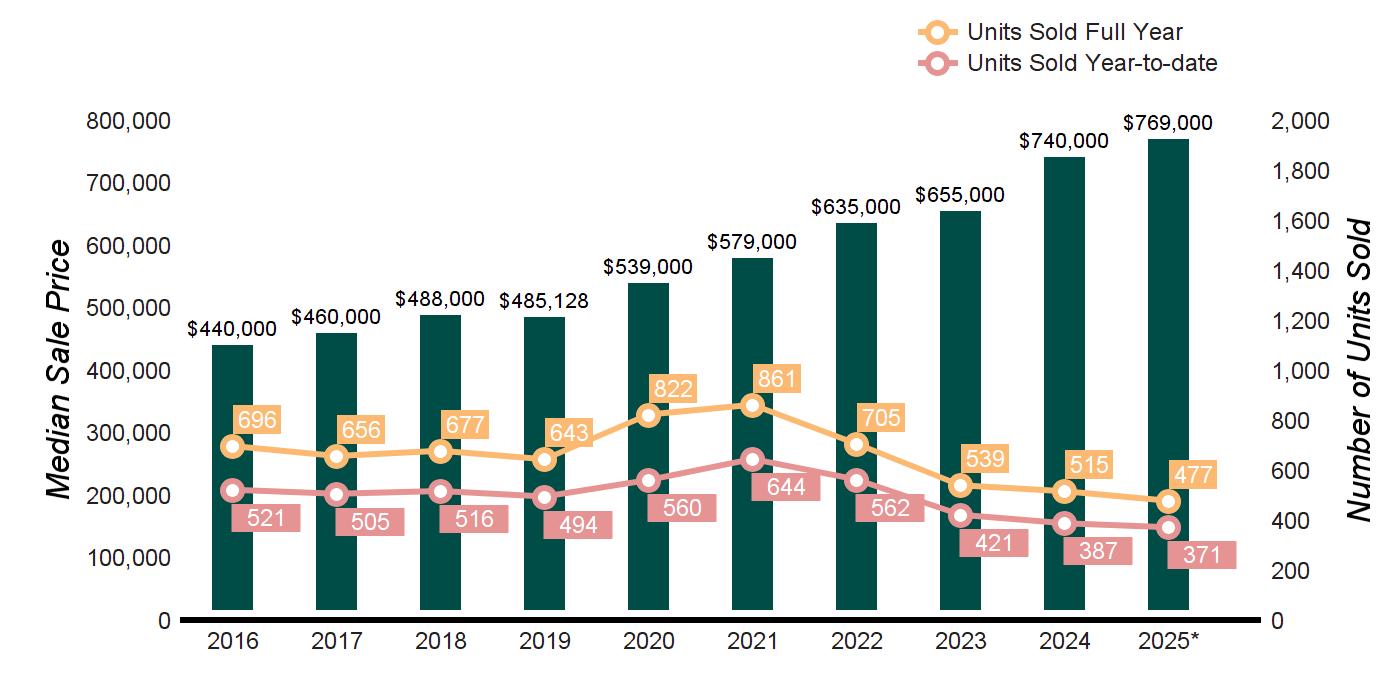
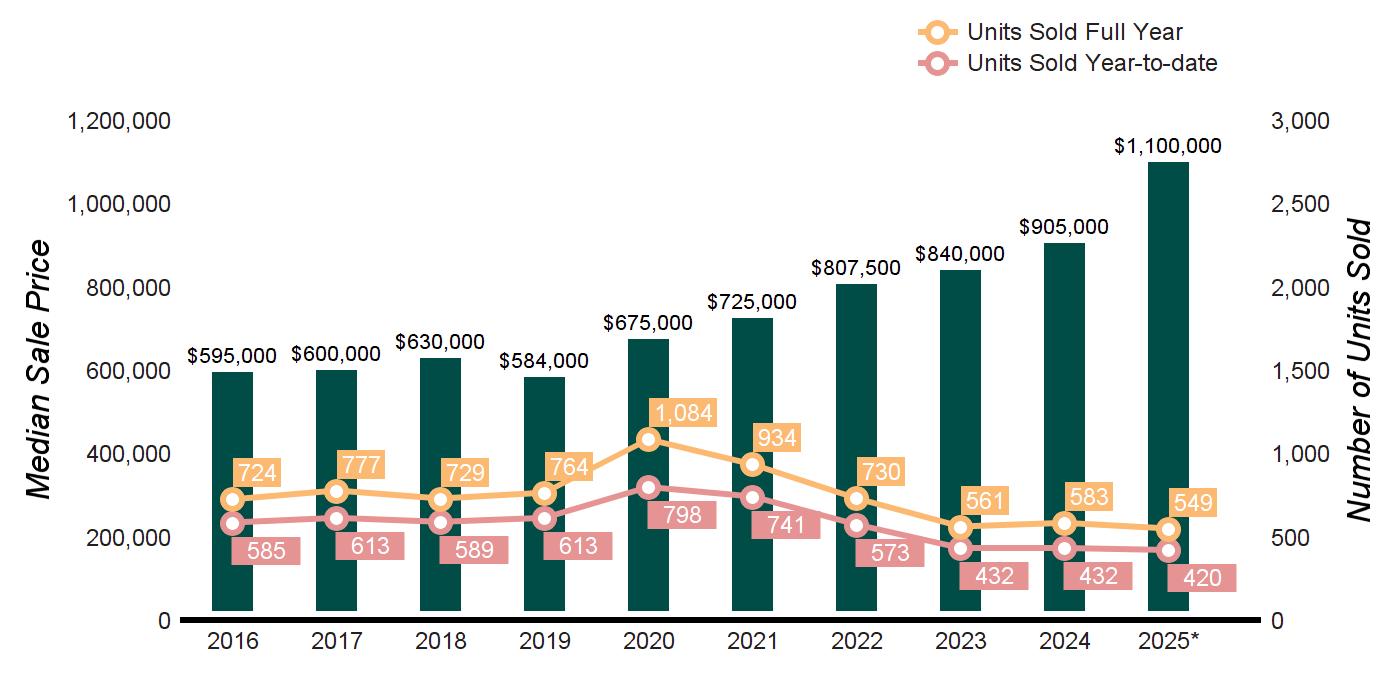
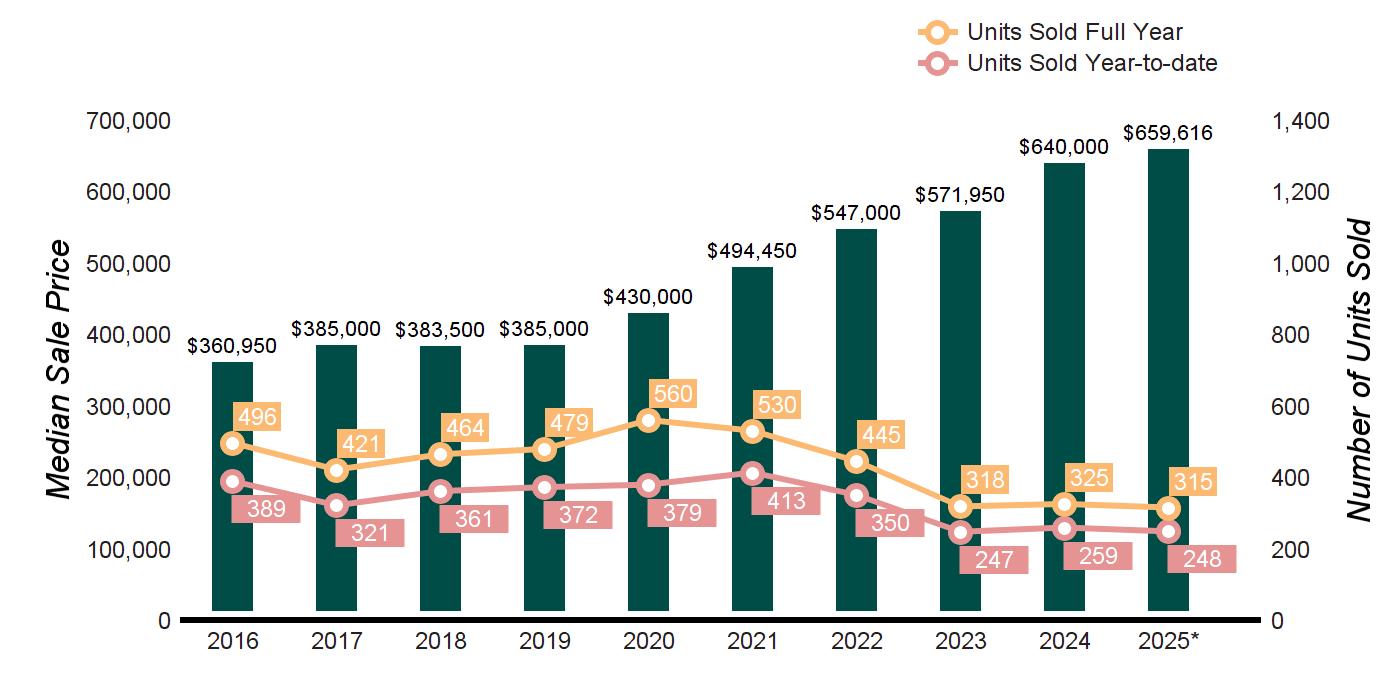
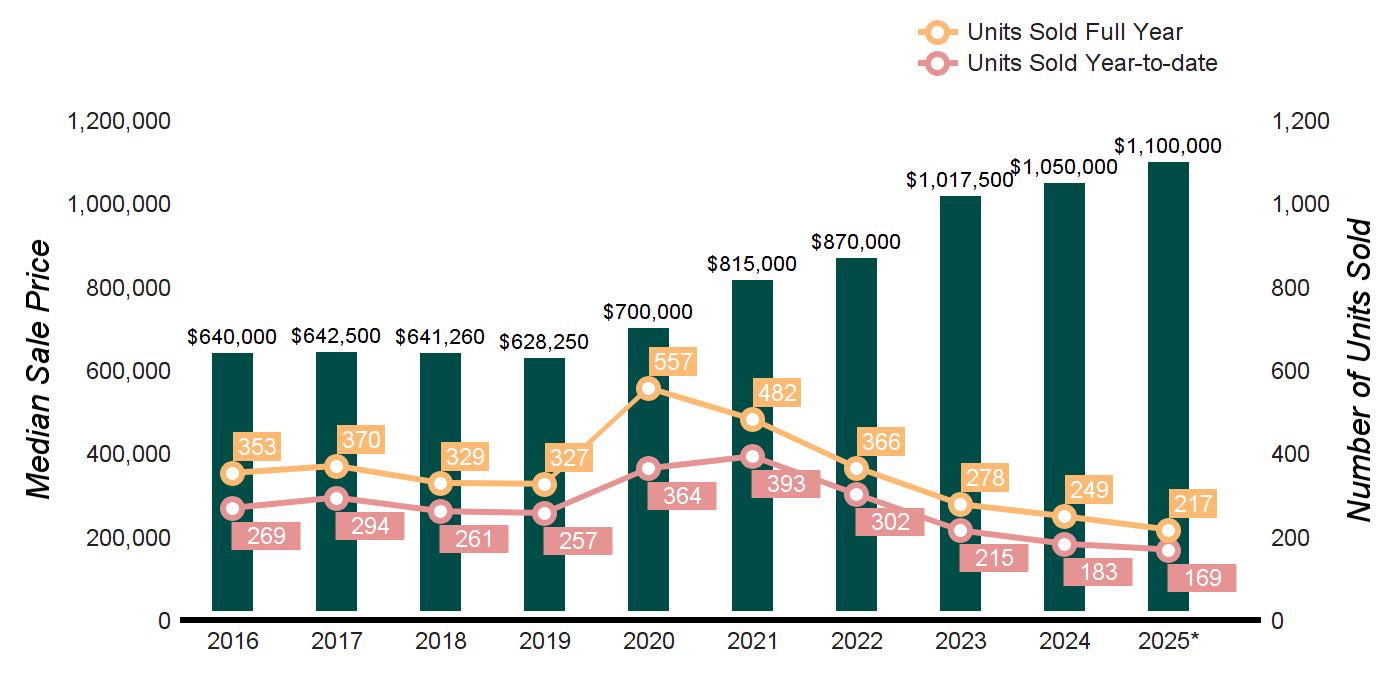
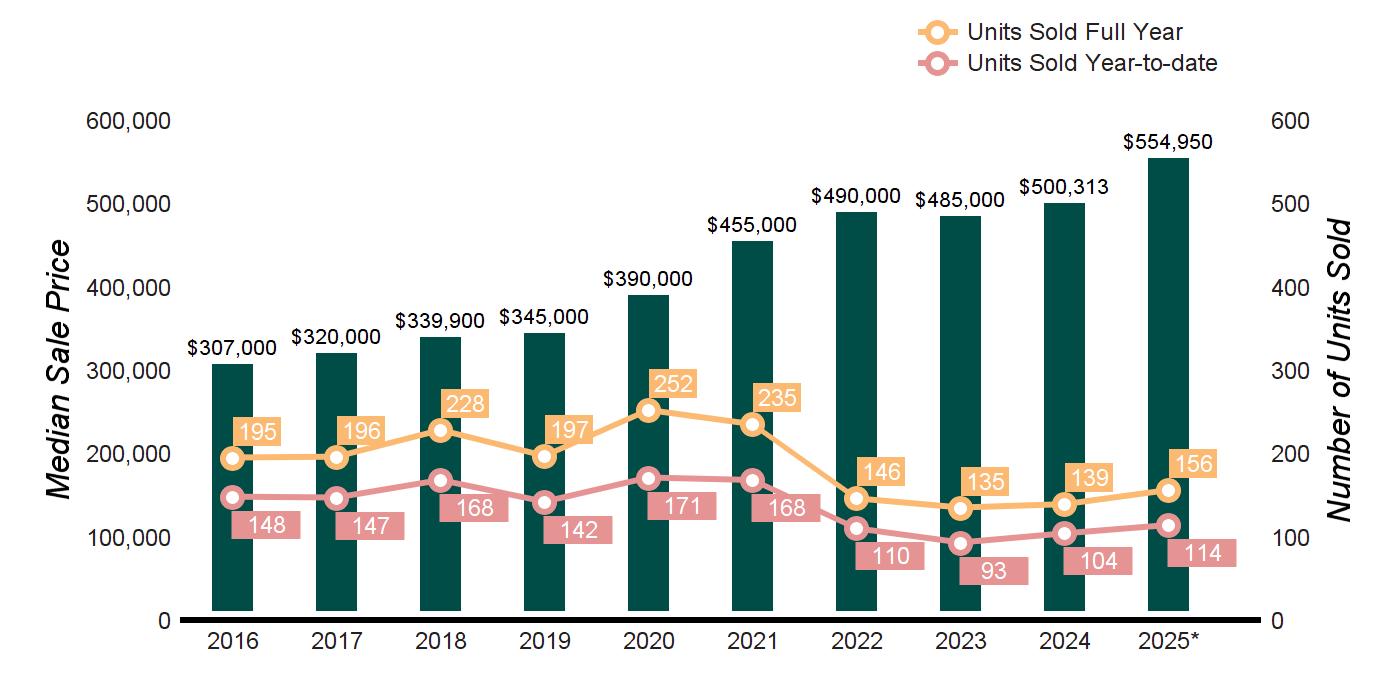
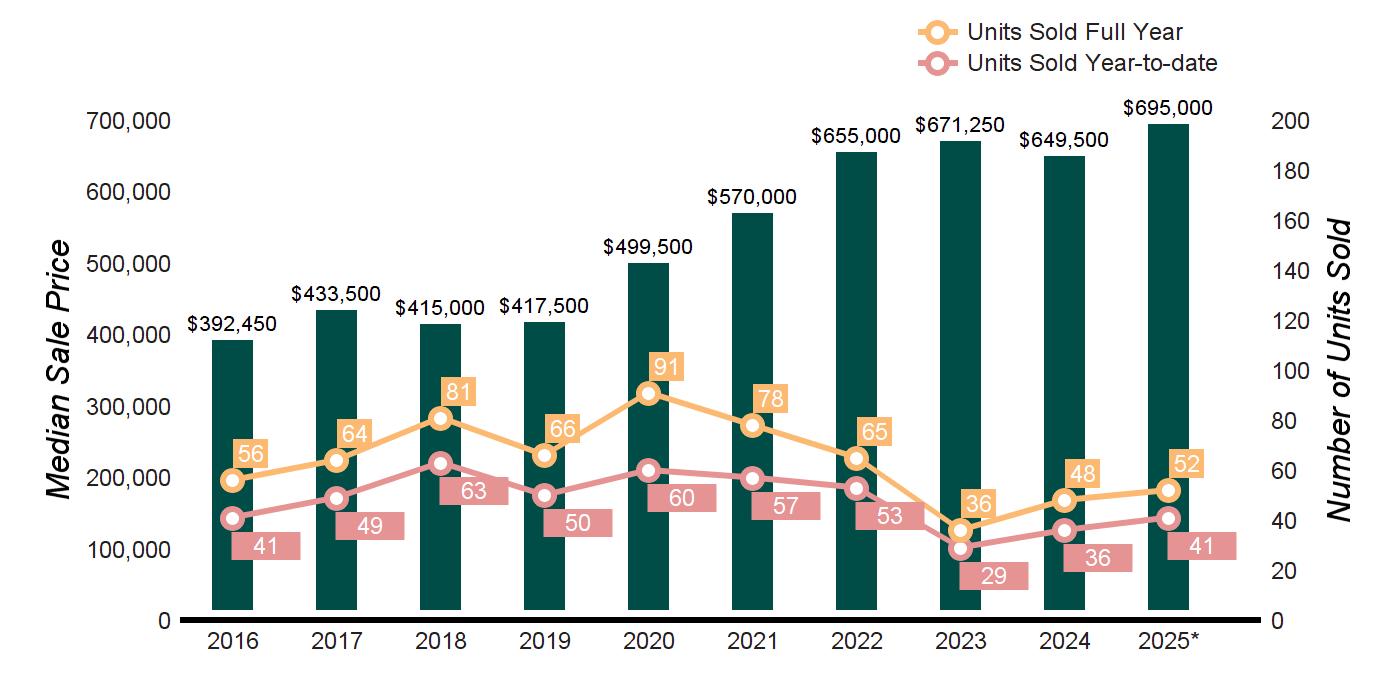
TEN-YEAR MARKET HISTORY
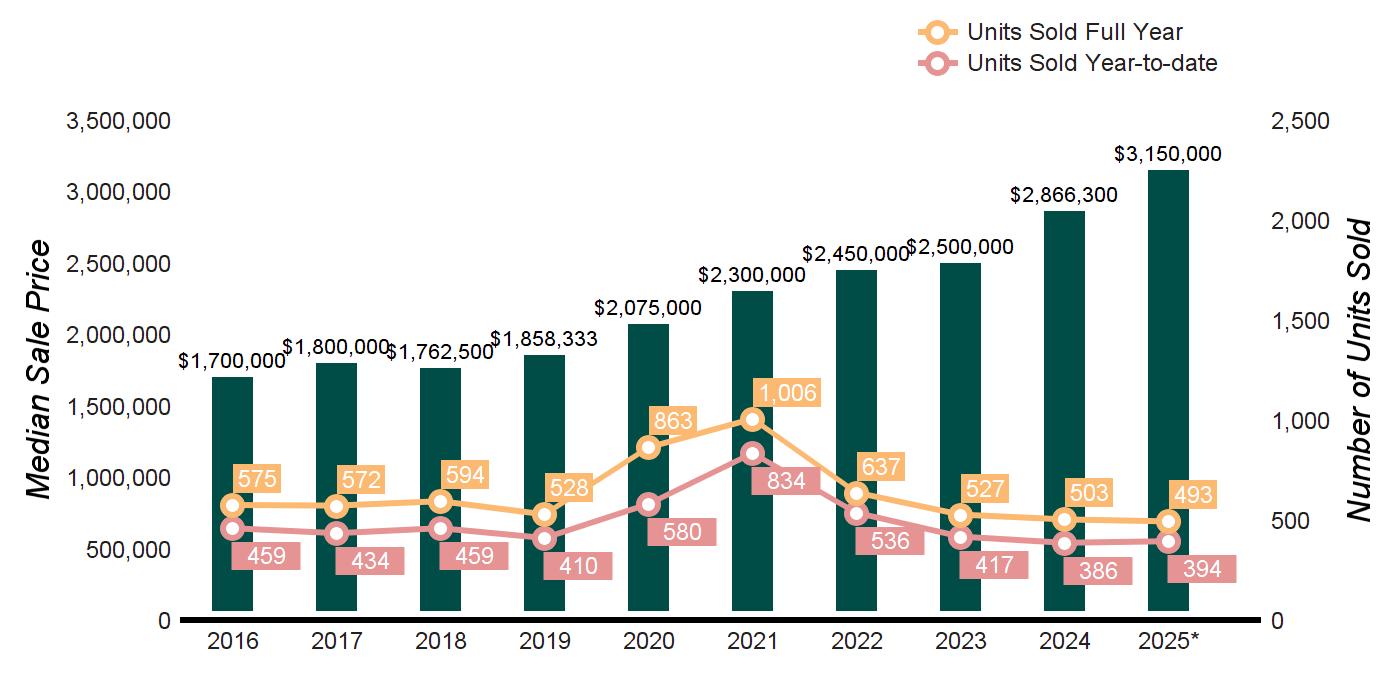
Source : Greenwich MLS, Residential / Single Family Homes * Homes sold for 2025 are annualized based on actual sales year-to-date
$5,000,000
Source : Greenwich MLS, Residential / Single Family Homes
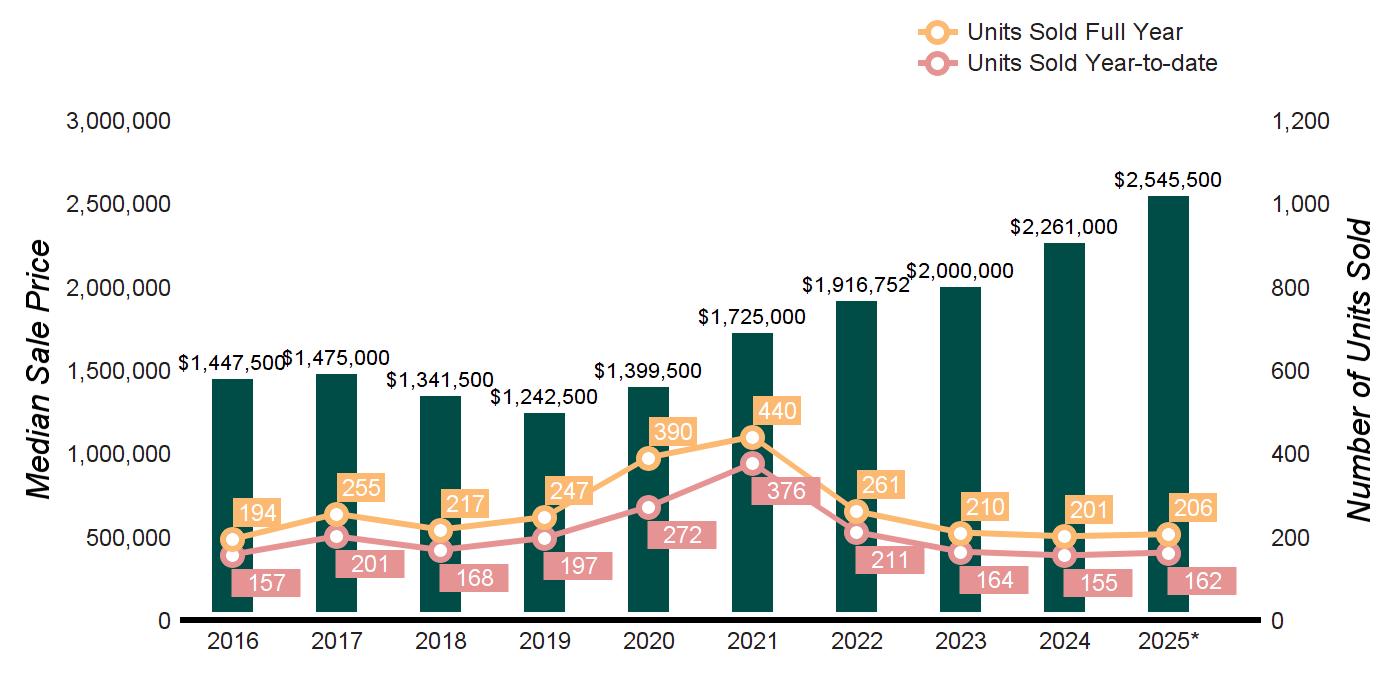
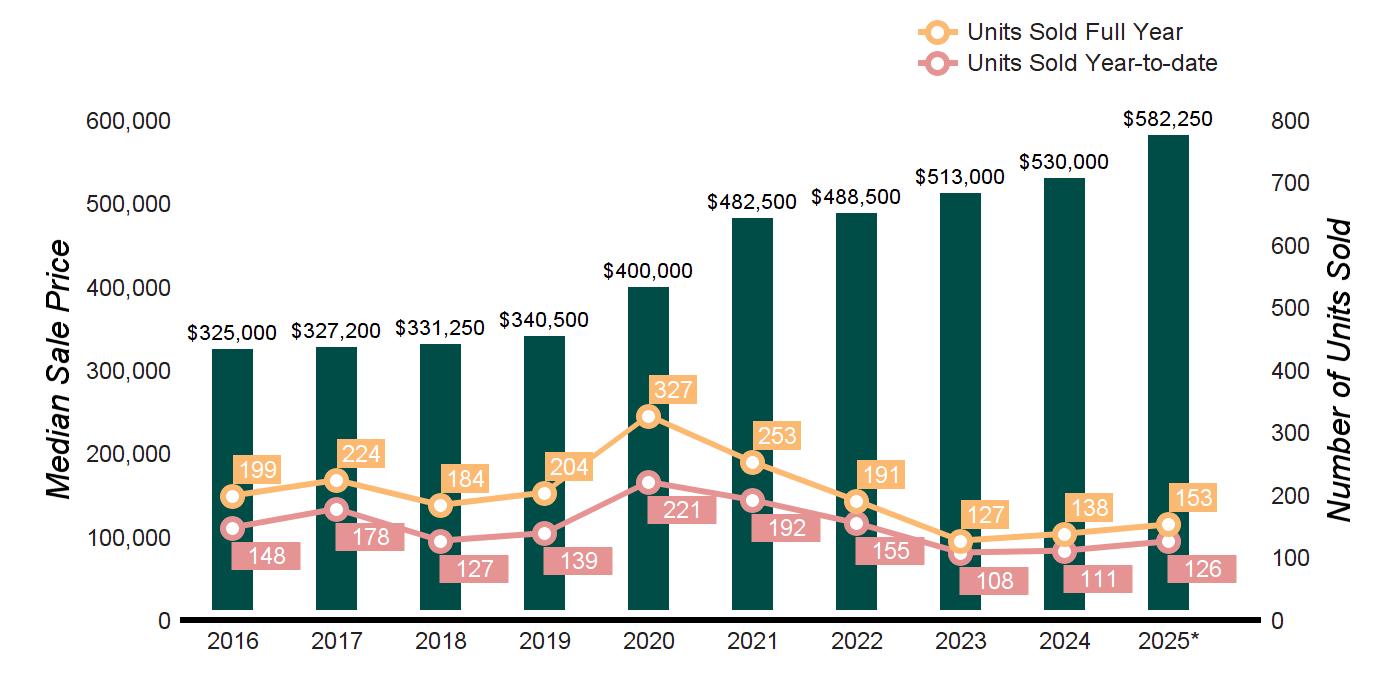
TEN-YEAR MARKET HISTORY
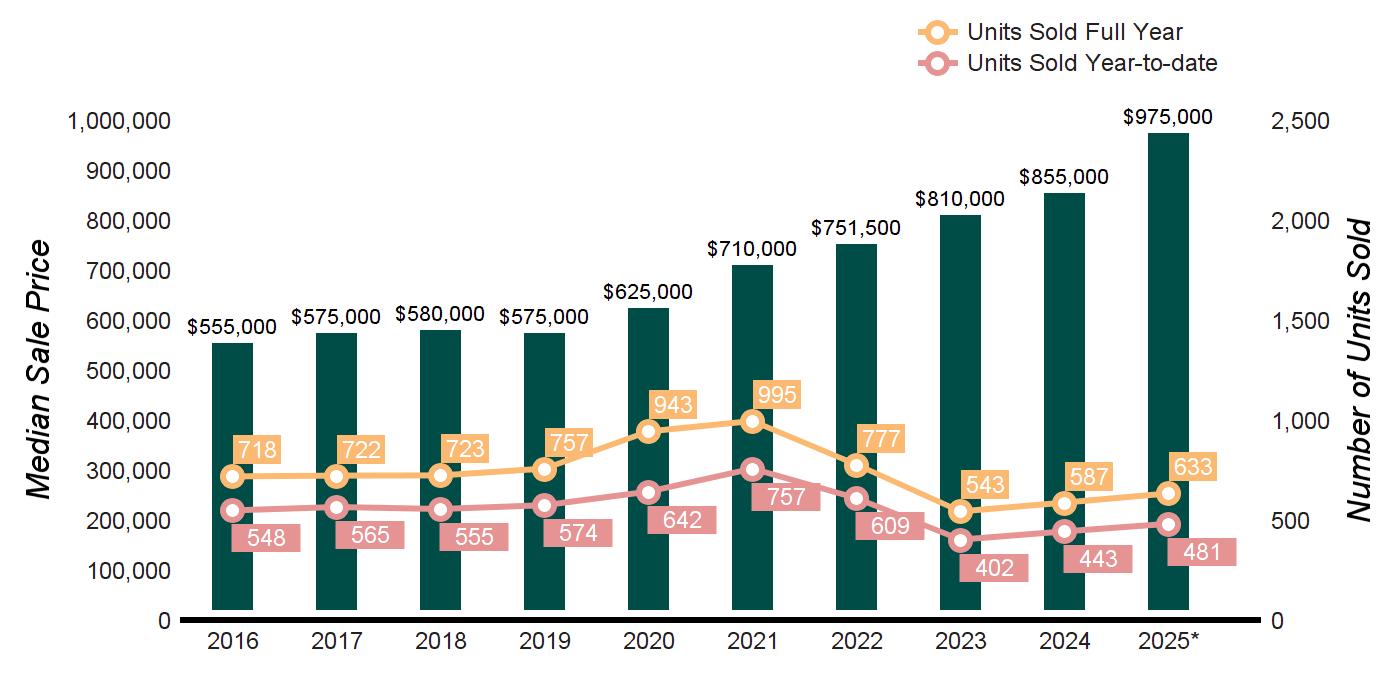
Source : Smart MLS, Single Family Homes * Homes sold for 2025are annualized based on the actual sales year-to-date
$5,000,000 and up
Source : Smart MLS, Single Family Homes
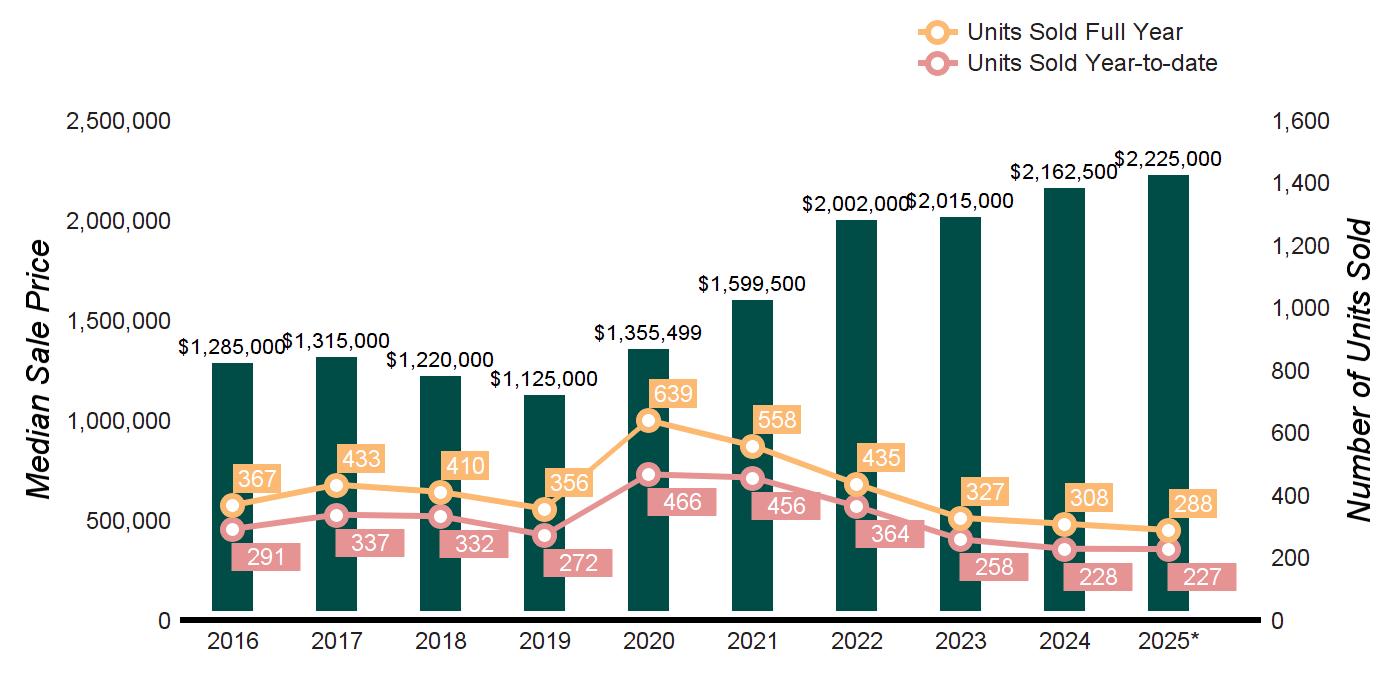
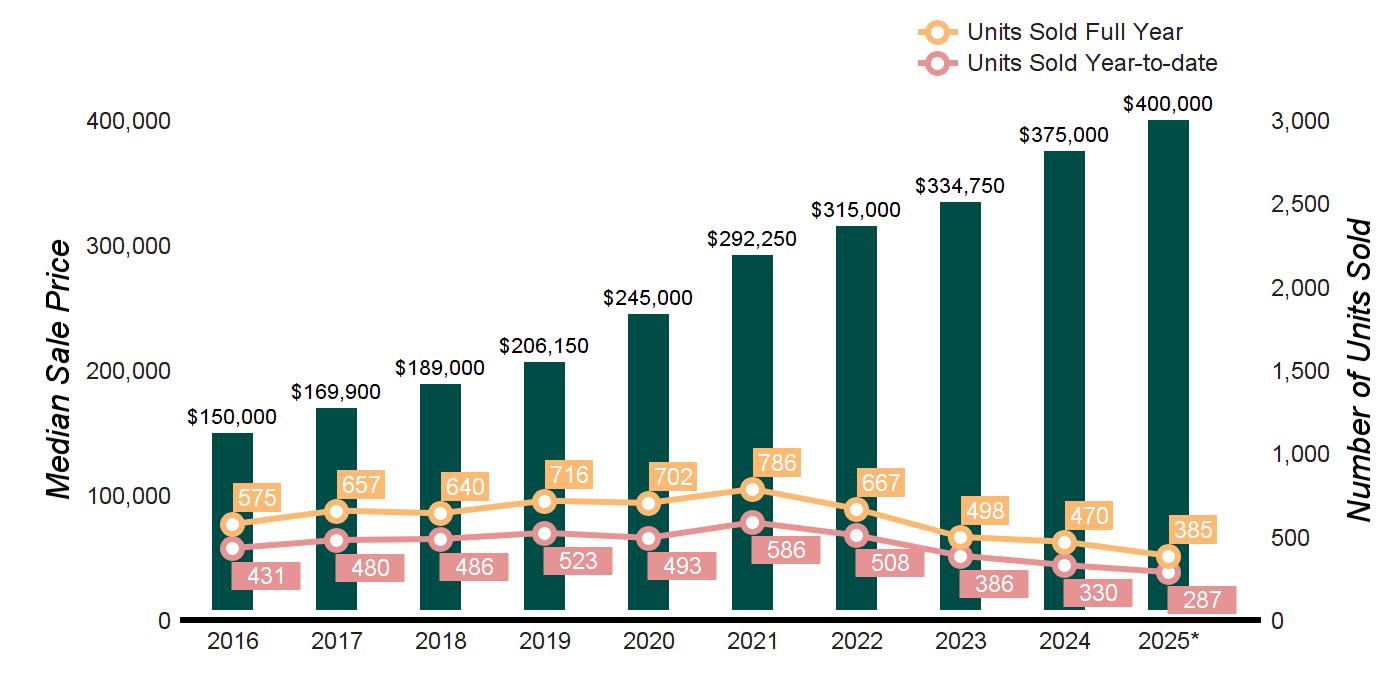
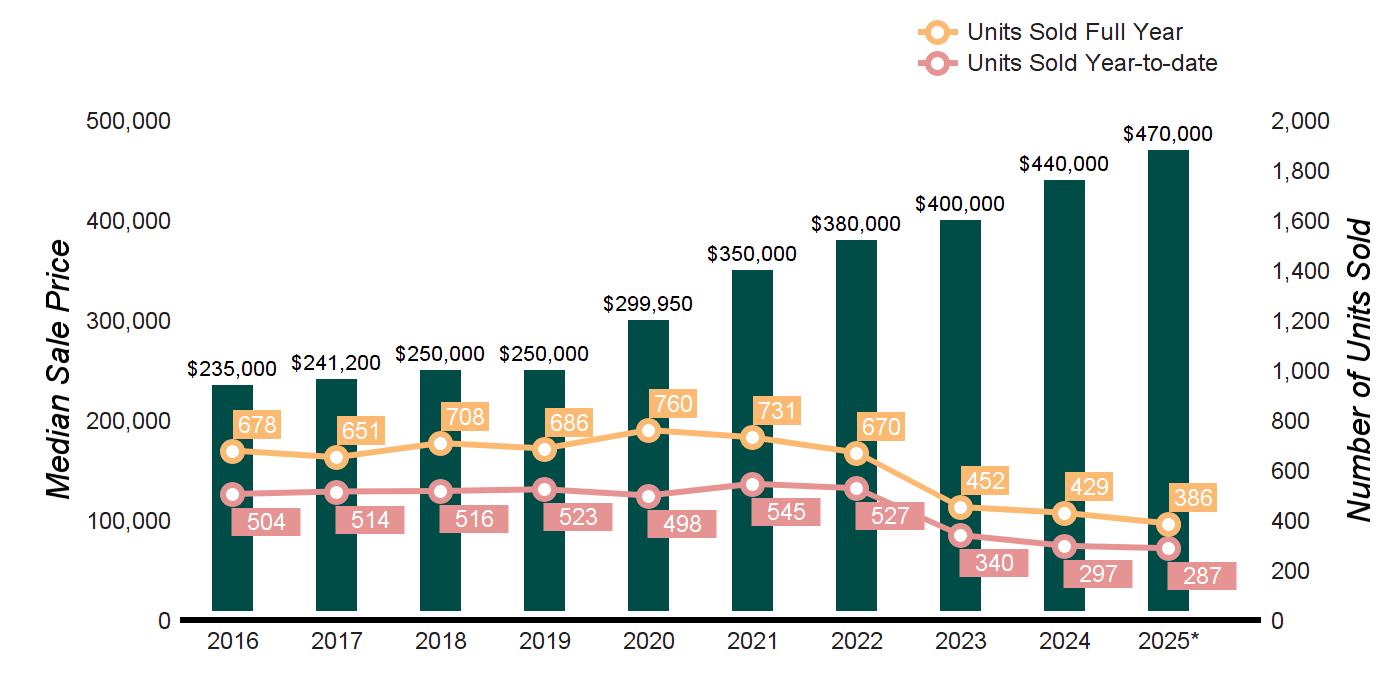
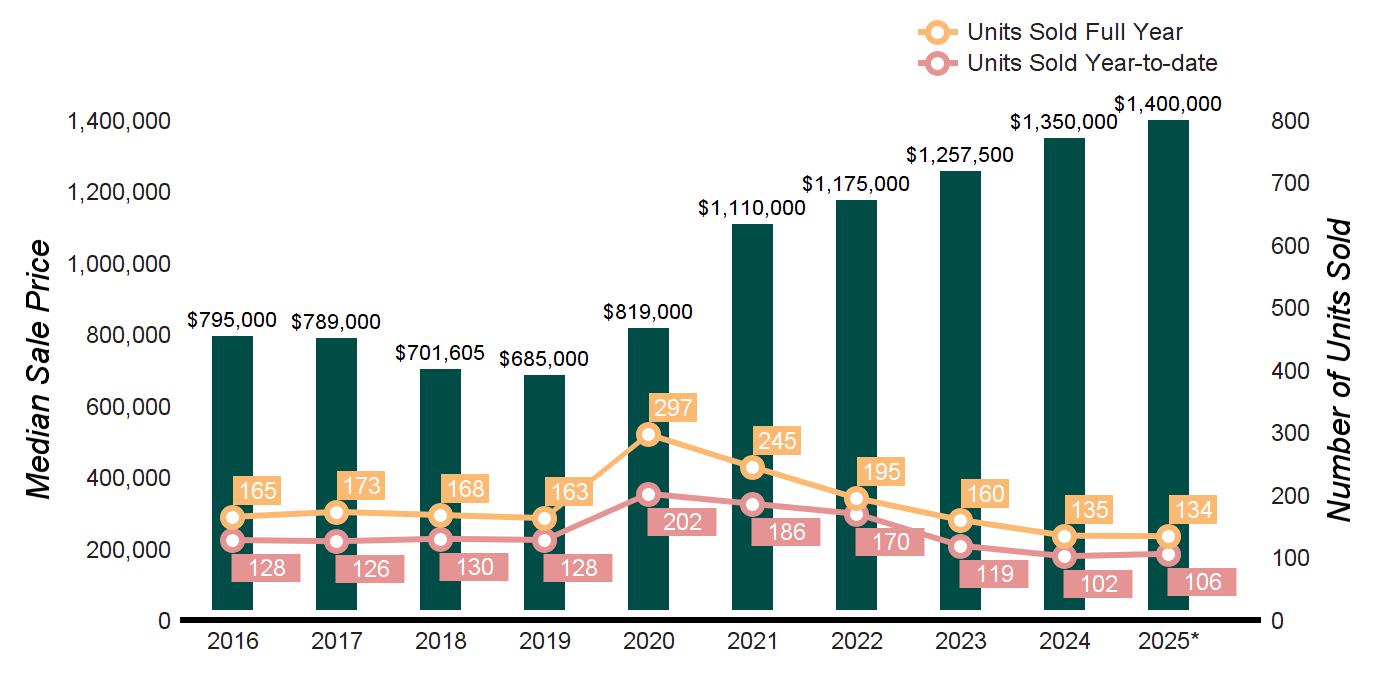
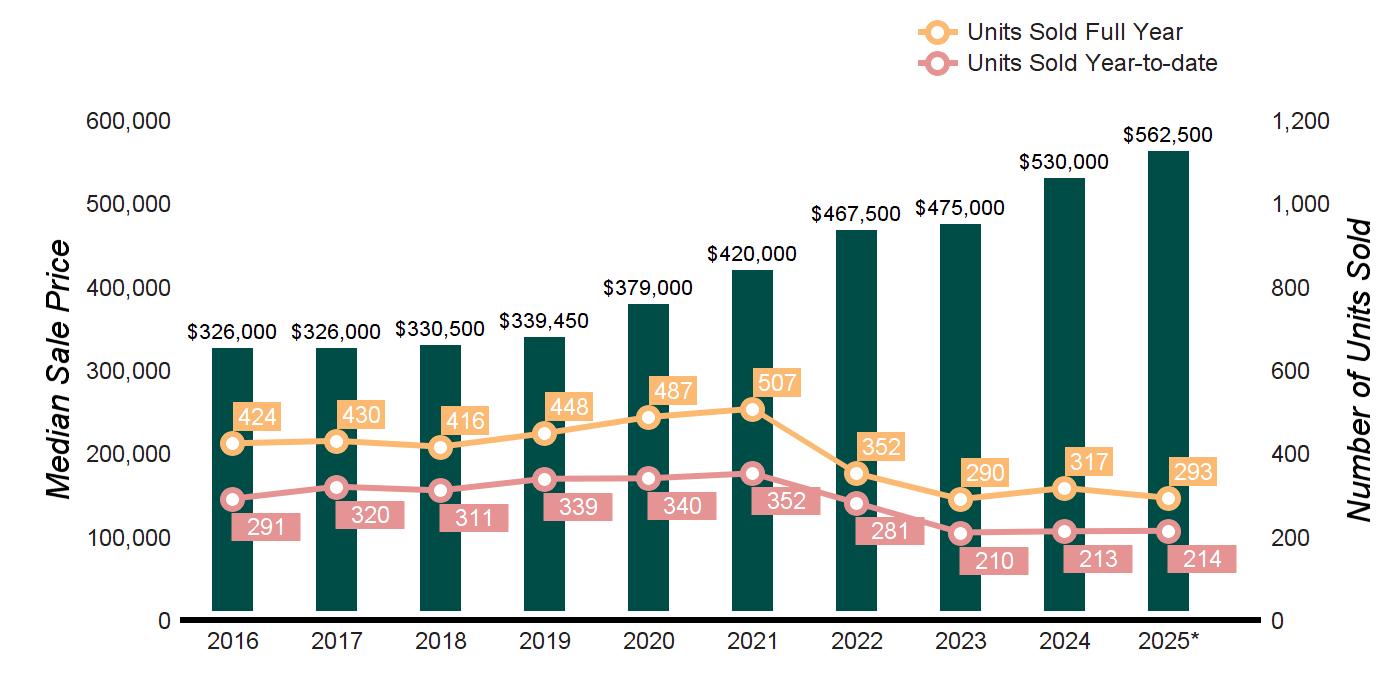
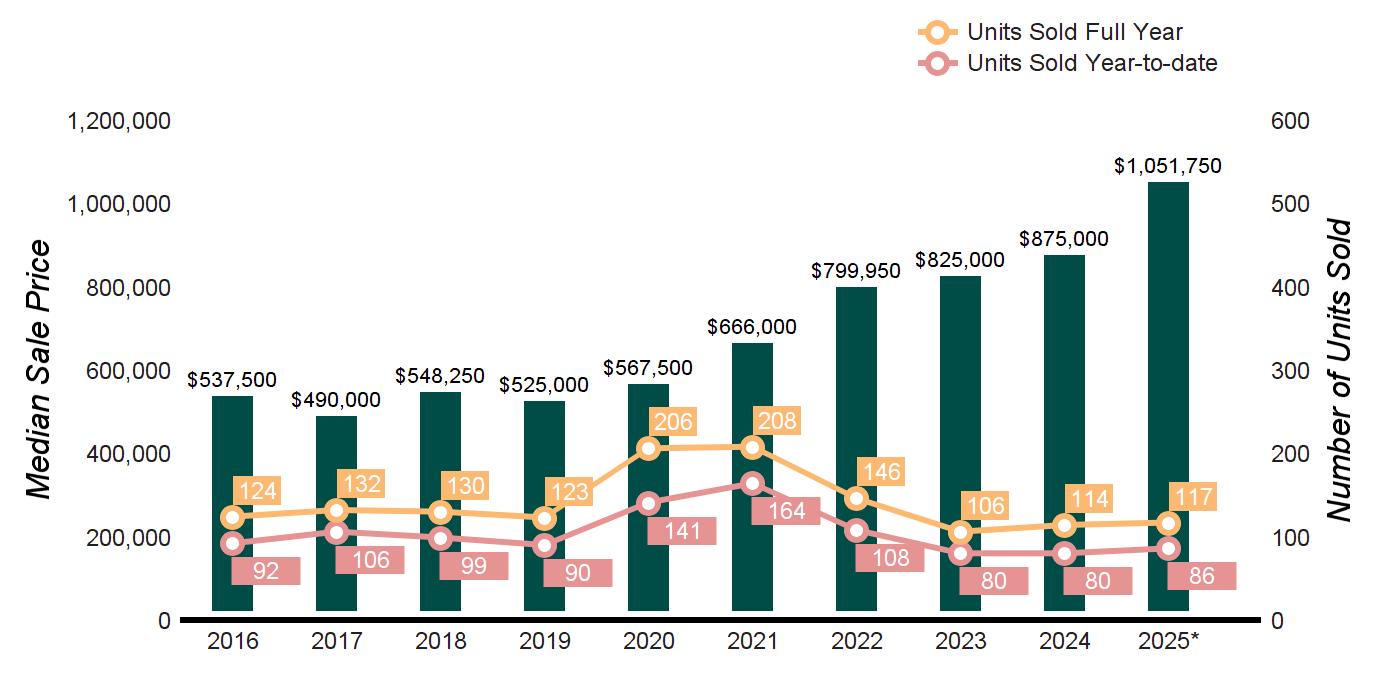
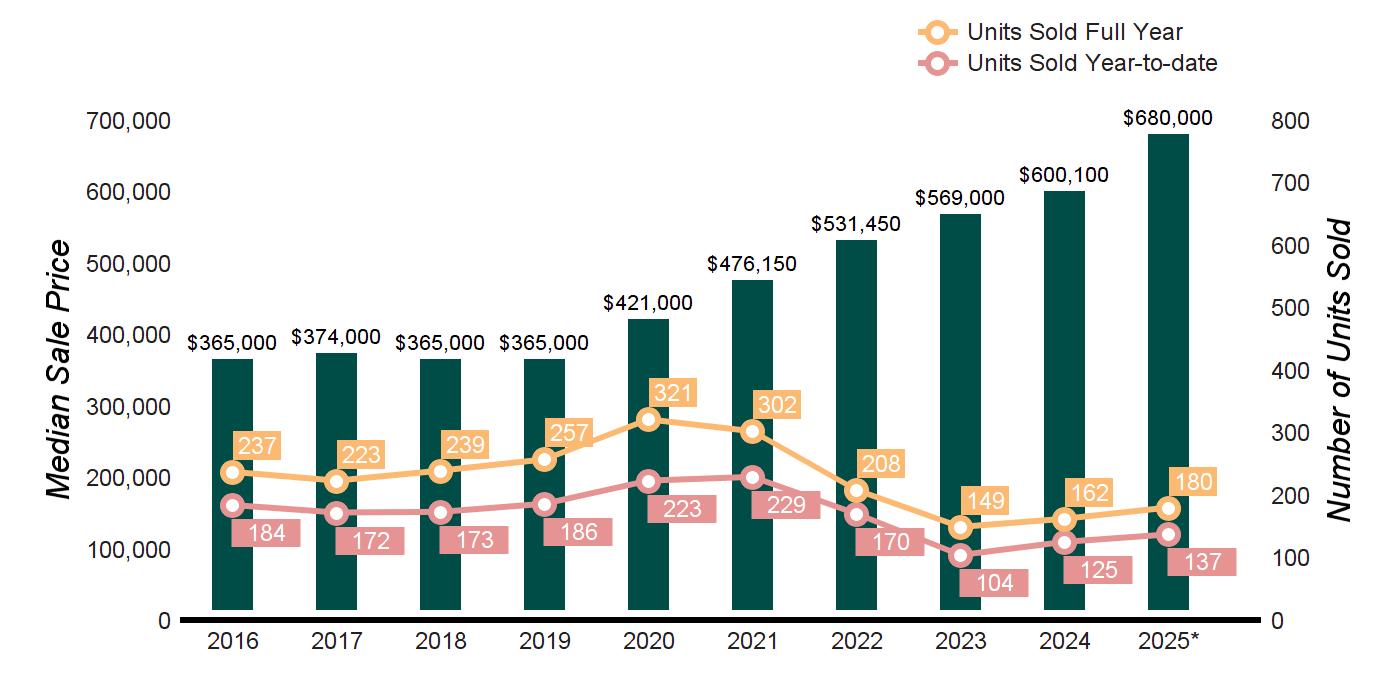
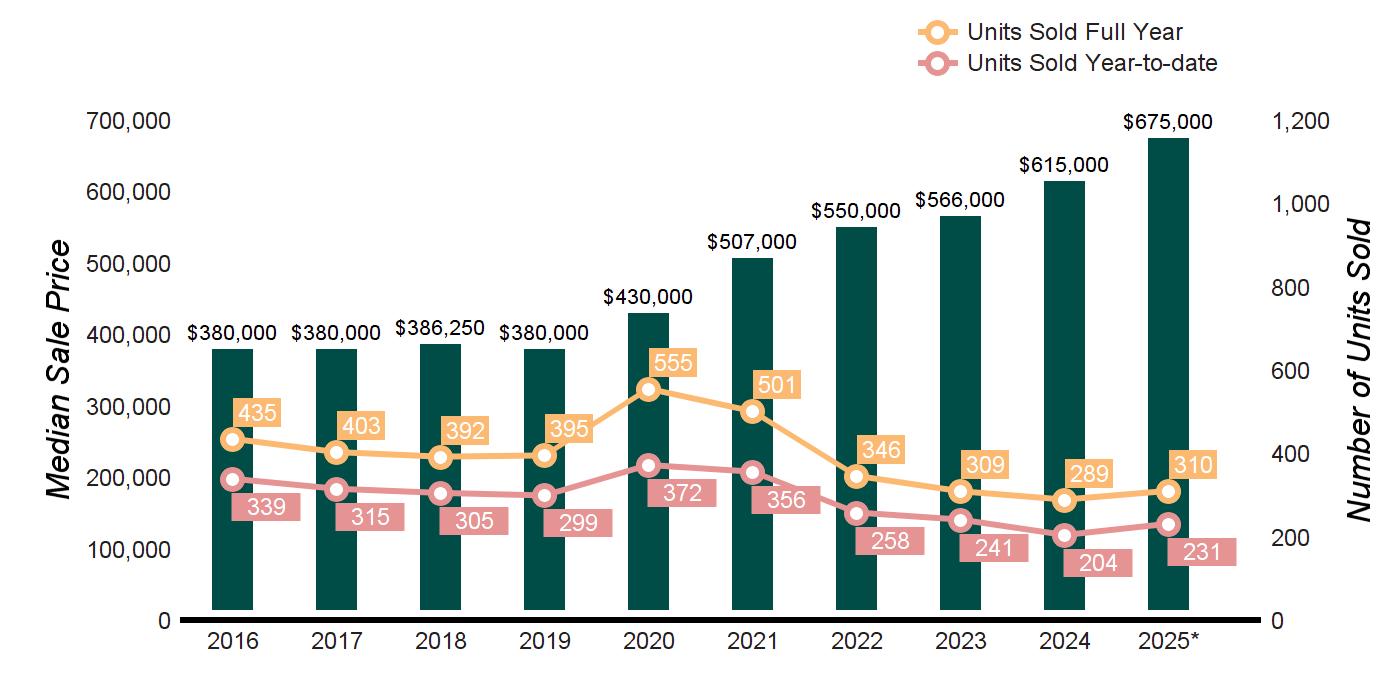
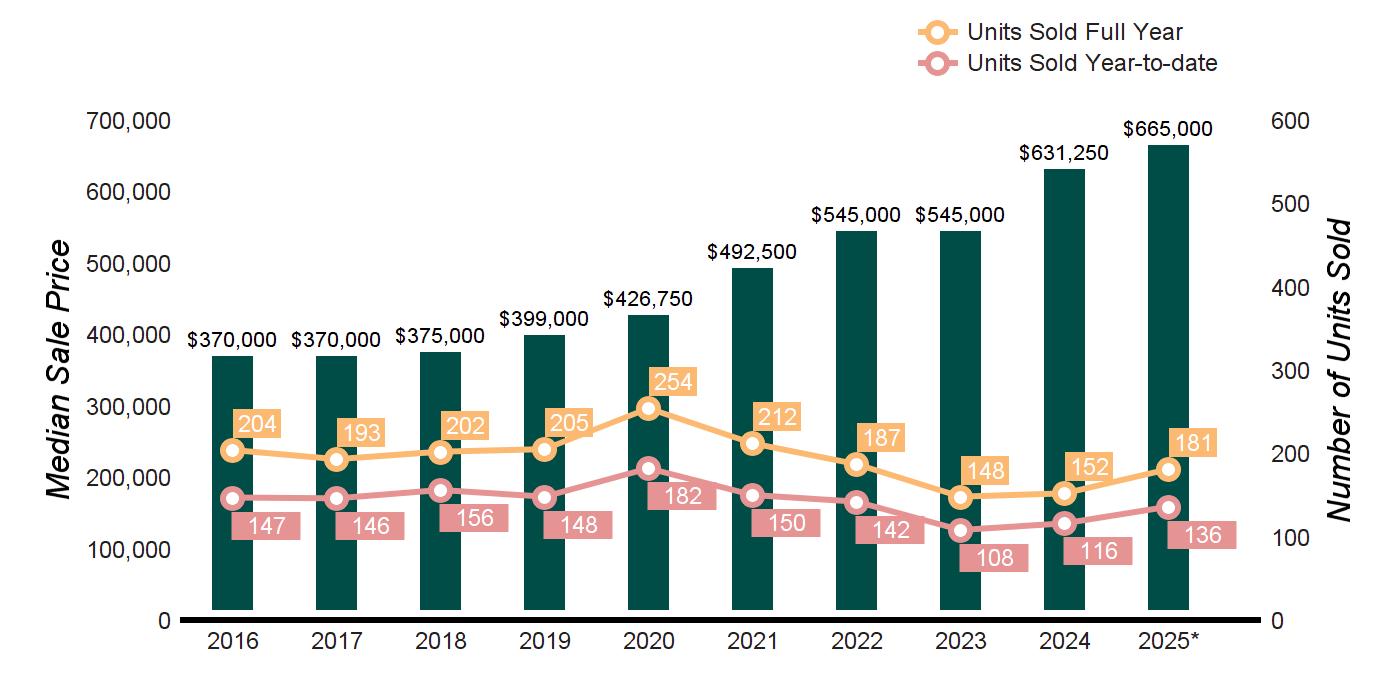
TEN-YEAR MARKET HISTORY
Source : Smart MLS, Single Family Homes * Homes sold for 2025are annualized based on the actual sales year-to-date
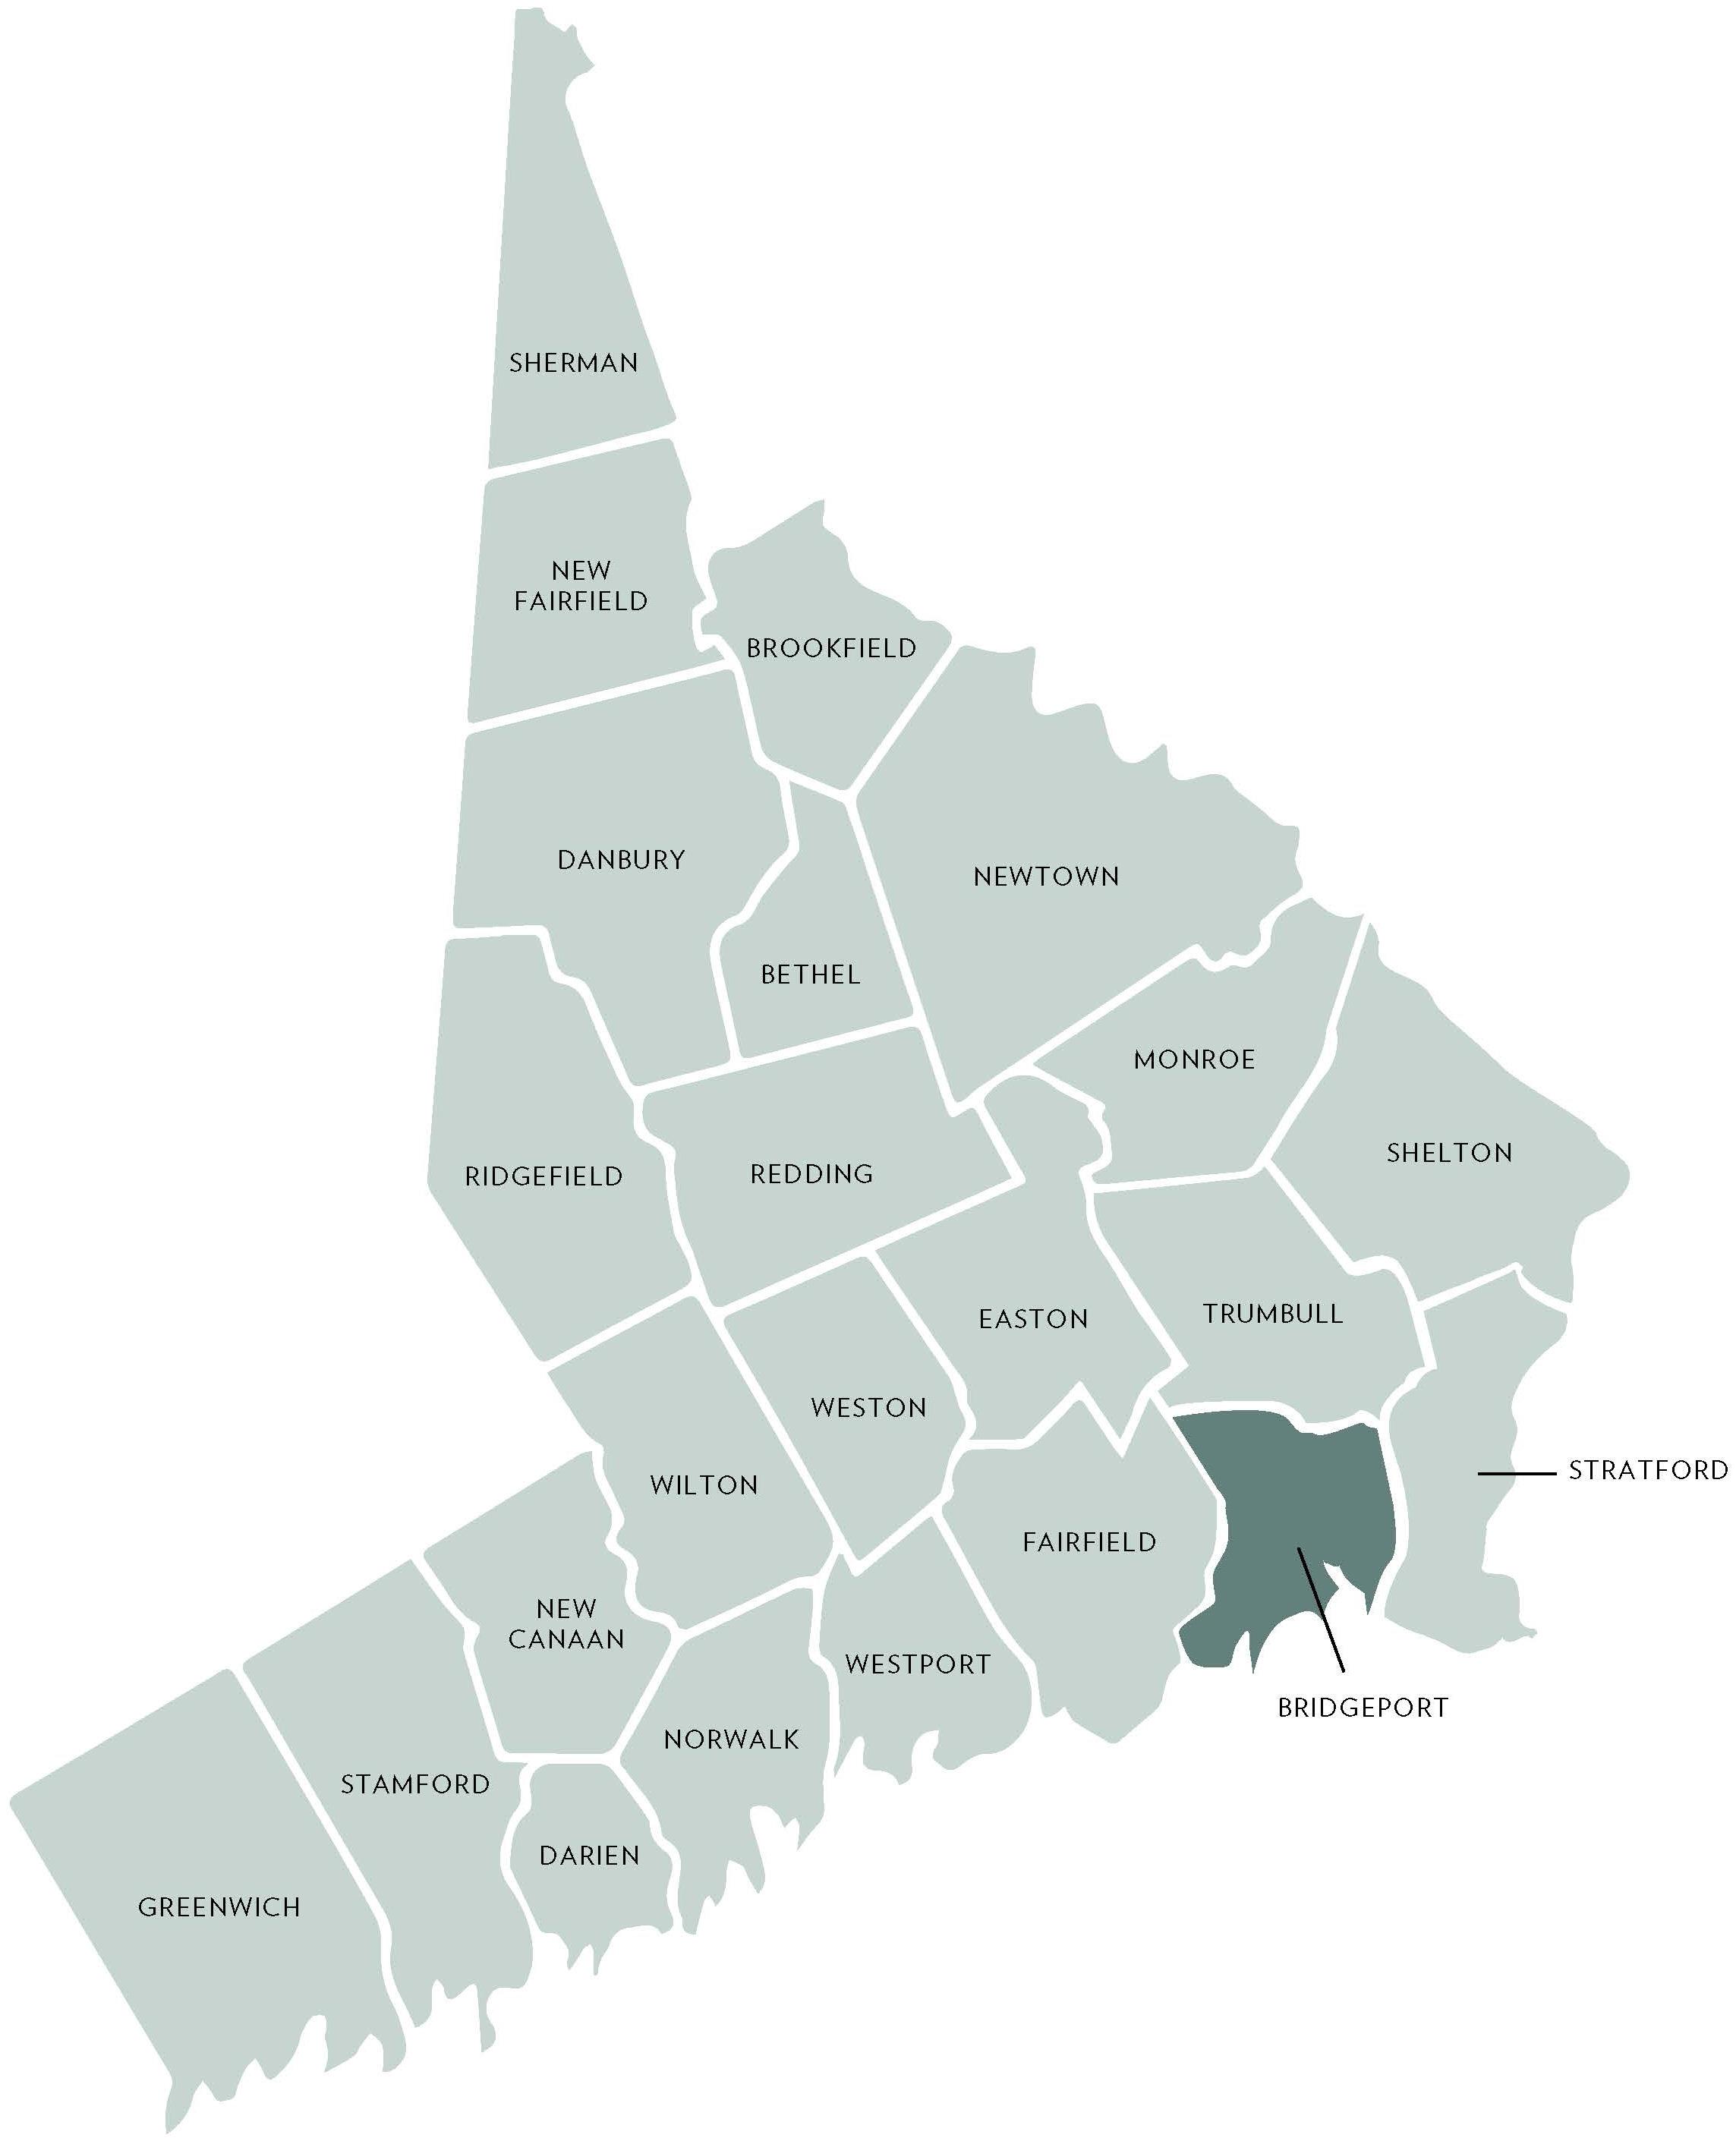
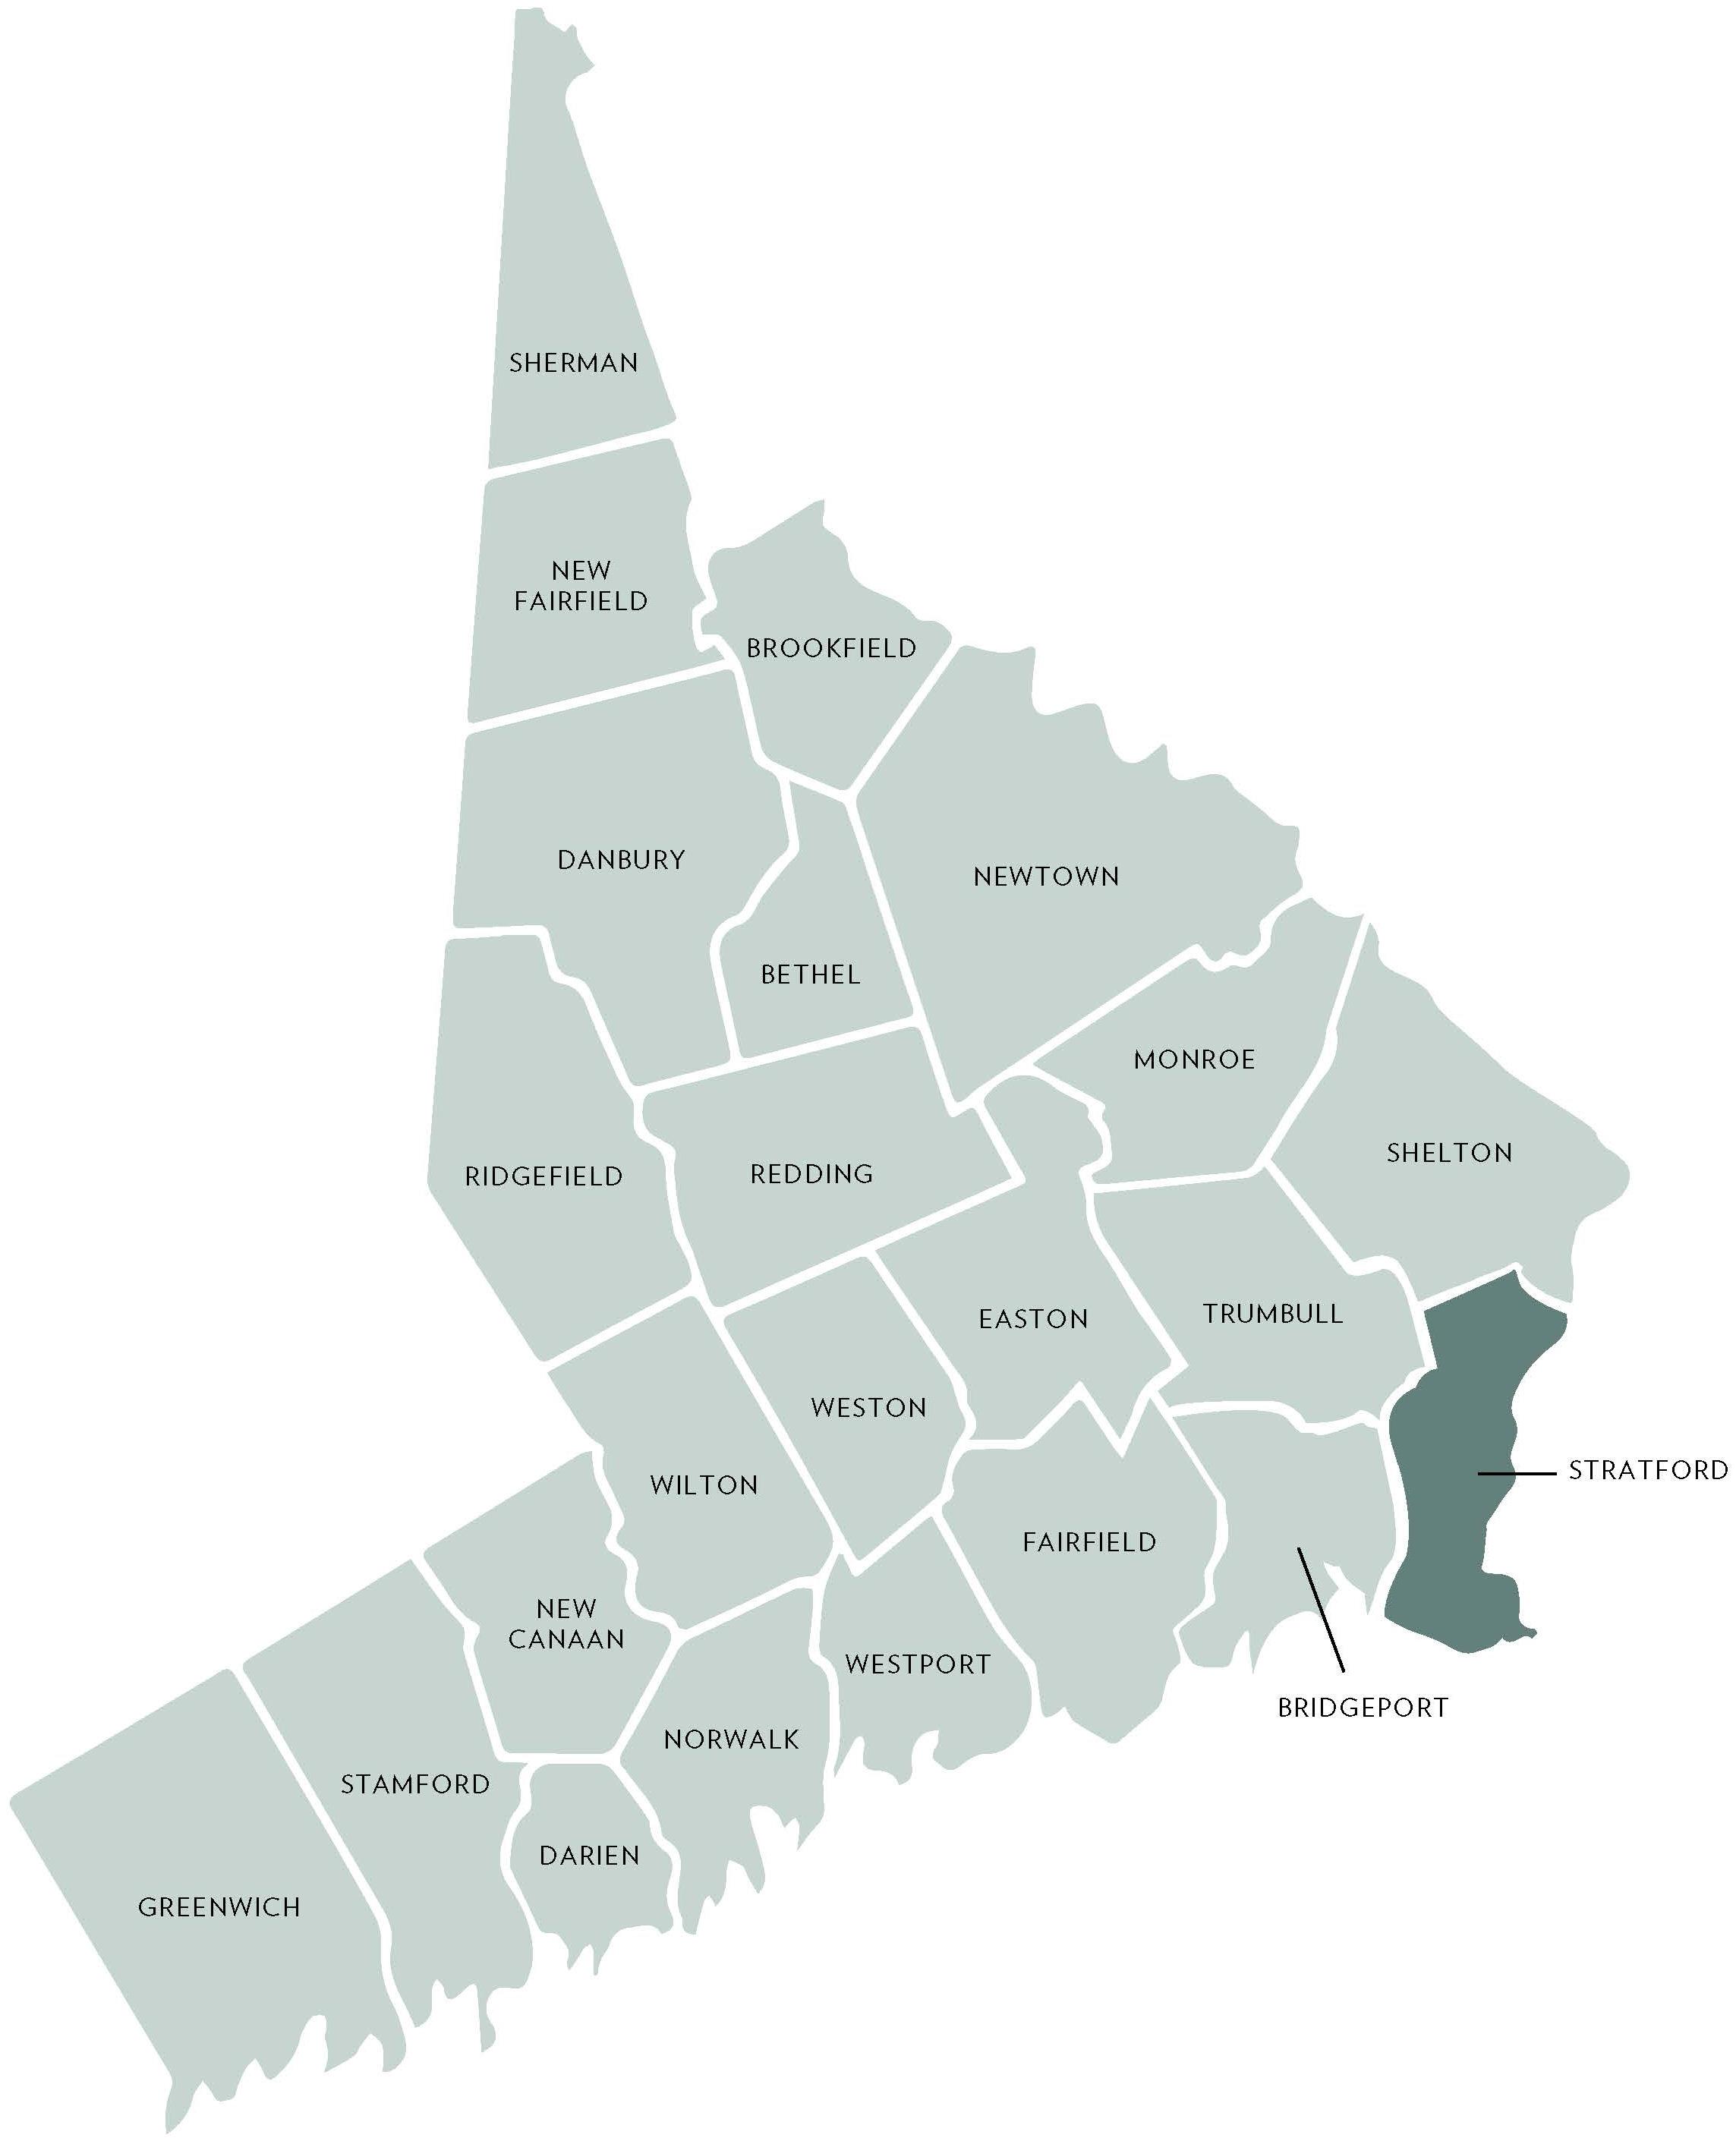
OF SEPTEMBER 30, 2025
Source : Smart MLS, Single Family Homes
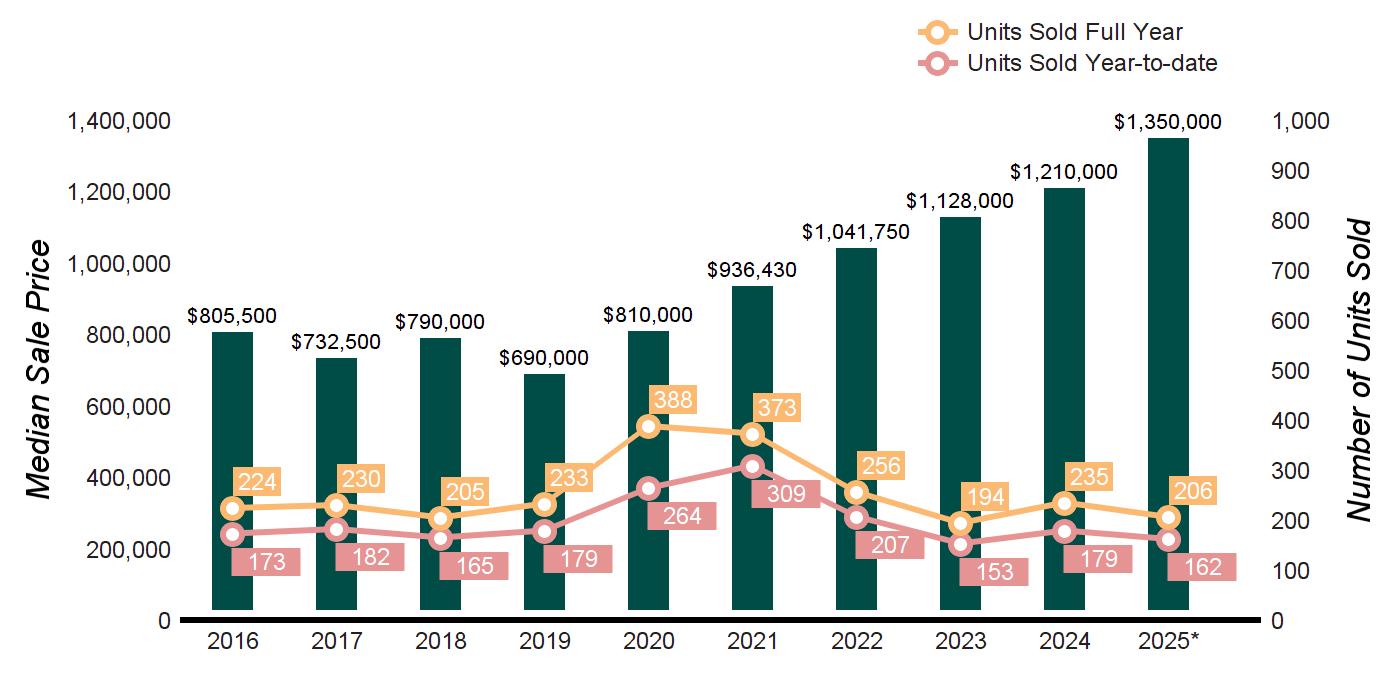
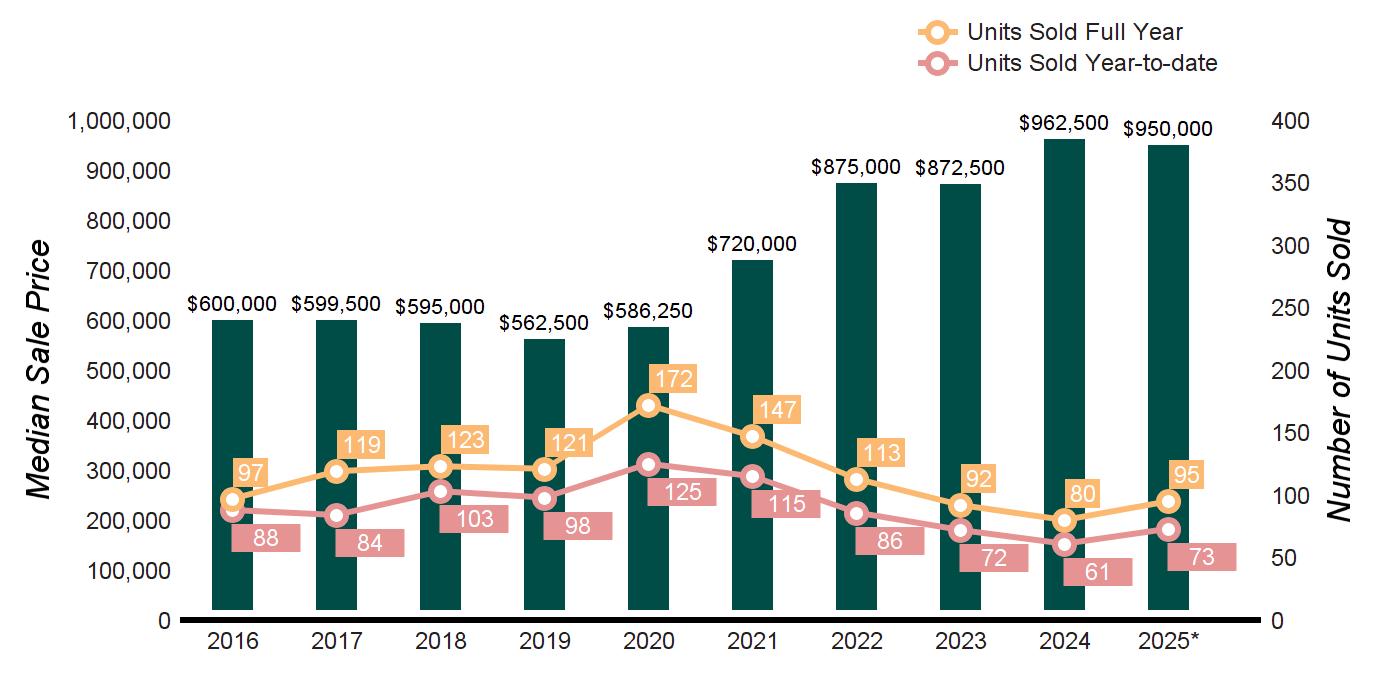
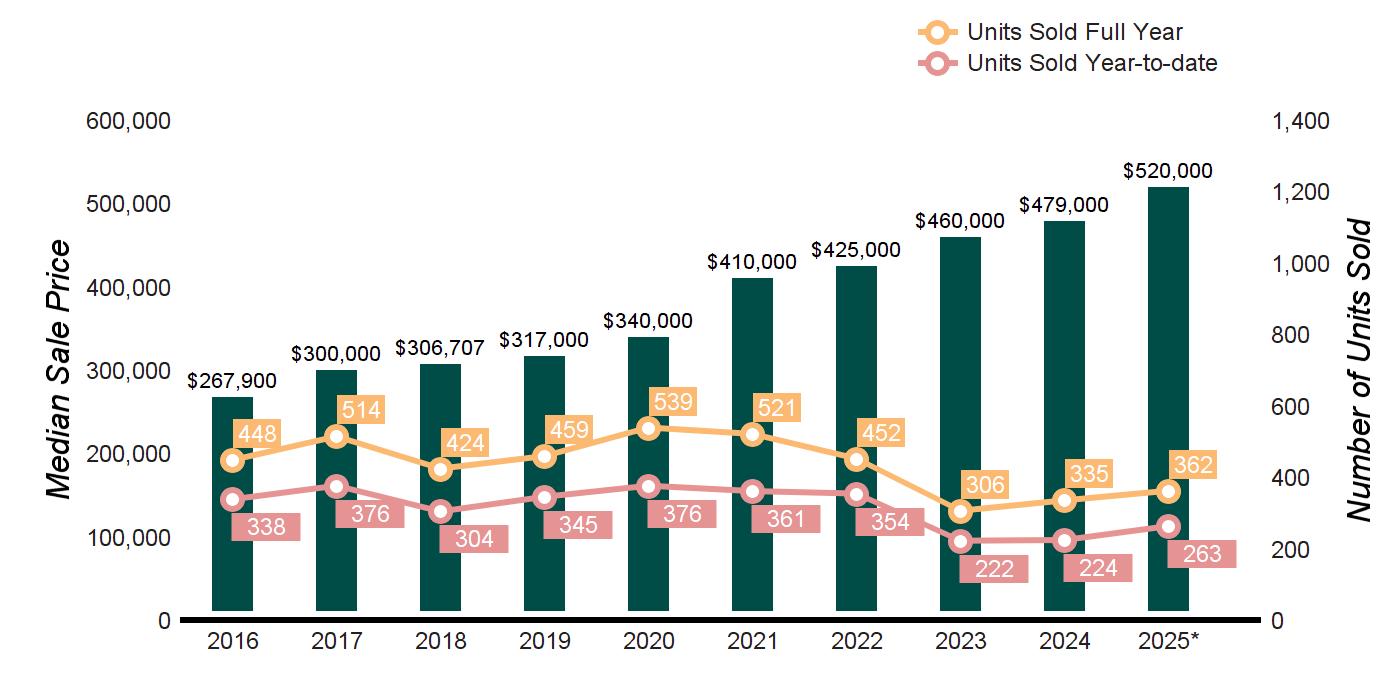
TEN-YEAR MARKET HISTORY
Source : Smart MLS, Single Family Homes * Homes sold for 2025are annualized based on the actual sales year-to-date
Source : Smart MLS, Single Family Homes
TEN-YEAR MARKET HISTORY
Source : Smart MLS, Single Family Homes
TEN-YEAR MARKET HISTORY
Source : Smart MLS, Single Family Homes * Homes sold for 2025are annualized based on the actual sales year-to-date
Source : Smart MLS, Single Family Homes
TEN-YEAR MARKET HISTORY
Source : Smart MLS, Single Family Homes * Homes sold for 2025are annualized based on the actual sales year-to-date
Source : Smart MLS, Single Family Homes
TEN-YEAR MARKET HISTORY
Source : Smart MLS, Single Family Homes
TEN-YEAR MARKET HISTORY
Source : Smart MLS, Single Family Homes
TEN-YEAR MARKET HISTORY
Source : Smart MLS, Single Family Homes * Homes sold for 2025are annualized based on the actual sales year-to-date
OF SEPTEMBER 30, 2025
$5,000,000 and up
Source : Smart MLS, Single Family Homes
OF SEPTEMBER 30, 2024
TEN-YEAR MARKET HISTORY
Source : Smart MLS, Single Family Homes * Homes sold for 2025are annualized based on the actual sales year-to-date
OF SEPTEMBER 30, 2025
$5,000,000 and up
Source : Smart MLS, Single Family Homes
TEN-YEAR MARKET HISTORY
OF SEPTEMBER 30, 2025
Source : Smart MLS, Single Family Homes
TEN-YEAR MARKET HISTORY
$2,000,000
Source : Smart MLS, Single Family Homes
TEN-YEAR MARKET HISTORY
Source : Smart MLS, Single Family Homes
TEN-YEAR MARKET HISTORY
Source : Smart MLS, Single Family Homes
Homes sold for 2025are annualized based on the actual sales year-to-date
$5,000,000 and up
Source : Smart MLS, Single Family Homes
TEN-YEAR MARKET HISTORY
Source : Smart MLS, Single Family Homes
OF SEPTEMBER 30, 2025
$5,000,000 and up
Source : Smart MLS, Single Family Homes
OF SEPTEMBER 30, 2024
TEN-YEAR MARKET HISTORY
Source : Smart MLS, Single Family Homes
TEN-YEAR MARKET HISTORY
Source : Smart MLS, Single Family Homes
TEN-YEAR MARKET HISTORY
Source : Smart MLS, Single Family Homes
TEN-YEAR MARKET HISTORY
Source : Smart MLS, Single Family Homes
TEN-YEAR MARKET HISTORY
Source : Smart MLS, Single Family Homes
TEN-YEAR MARKET HISTORY
OF SEPTEMBER 30, 2025
Source : Smart MLS, Single Family Homes
TEN-YEAR MARKET HISTORY
OF SEPTEMBER 30, 2025
$5,000,000 and up
Source : Smart MLS, Single Family Homes