University College Ghent
Specialization in Environmental and Sustainability Management
Quy Nhơn University
University College Ghent
Specialization in Environmental and Sustainability Management
Quy Nhơn University
“How can a support base for reducing SUPs at Quy Nhon University be established by raising awareness and by offering reusable alternatives?”
GIL HEYMAN and INDY LAPLASSE
Bachelor thesis submitted with an eye on obtaining a bachelor’s degree in business management, specialization in Environmental and Sustainability Management
Mentor: Vo Van Chi
Supervisor: Sara Lieveld
2024-2025
Dear reader
We are conducting this thesis for two primary reasons: (1) to obtain our degree in Environment and Sustainability Management at HOGENT, and (2) to explore and highlight potential strategies for reducing single-use plastics (SUPs) and raising awareness of waste problems at Quy Nhon University (QNU).
We chose this topic because sustainable change is something we are deeply passionate about. Moreover, Vietnam still developing in terms of environmental awareness and sustainability offers both significant challenges and exciting opportunities.
Through this research, that was carried out from the end of March until the end of May 2025, we hope to provide valuable insights for future students involved in the SP7 subproject. This subproject is part of VLIR-UOS, a leading funding organization that supports scholarships and academic partnerships between institutions in Flanders and Asia, with a strong focus on global sustainable development.
We would like to sincerely thank the entire SP7 team (Tuong Vi, Tran Thi Thu Hien, Chi Vo Van, Dang Thi To Nu, Lieu, Tam Truong, Trang, Trang Phan) for their warm welcome, continuous support, and for always being there when we needed them. And also, the Belgian side of the team (Els Van Mechelen, Linde Raport, Yves Ronsse).
A very special thanks goes to Mister Chi, for organizing everything and making this internship possible; to Miss Vi, for her guidance and support throughout the entire stay; and to Miss Hien, for helping us roll out our survey with care and dedication.
We also want to thank Xander Bell and Jasper Ooghe for their valuable insights on our topic and their active involvement in several internship-related tasks. Alongside them, we gratefully acknowledge the visiting lecturers Miss. Gert Hooft, Miss. Ann Messens, and Miss. Nena Baeyens for their engagement and support during their visit.
And last but certainly not least, we would like to thank Miss. Sara Lieveld, who has been our most important support throughout this bachelor’s thesis. Her guidance, openness to questions, and thoughtful, constructive feedback were incredibly helpful and motivating every step of the way.
A special thanks to all students and staff at QNU who welcomed us in Vietnam, especially the members of the Green Club, who became friends as our internship progressed.
We hope you enjoy reading our thesis and that it may offer new insights or inspiration.
Kind regards
Indy Laplasse & Gil Heyman
May 23, 2025
This thesis explores the issue of single-use plastics (SUPs) at the Quy Nhon University (QNU) in Vietnam. While there is a growing interest in sustainability among students and staff, both awareness and sustainable alternatives for SUPs are still limited The widespread use of SUP items on campus contributes significantly to environmental problems and reflects a broader challenge in Vietnam’s waste management practices.
Our main research question is:
“How can a support base for reducing SUPs at Quy Nhon University be established by raising awareness and by offering reusable alternatives?”
To answer this question, we used different kinds of methods. First, we conducted a literature study to better understand the environmental and behavioural dimensions of plastic use, as well as current policies and practices in Vietnam. In annex you can find a report that provides further insights into the environmental and sustainability context in Vietnam.
We then carried out a large-scale survey with 605 respondents to know what the existing knowledge and attitudes towards SUPs within the university were This was followed by an on-campus experiment in which reusable bottles and cups were distributed to a selected group of students and staff. Their usage patterns were monitored over time, with short surveys to assess behavioural change.
Throughout the project, we worked closely with QNU’s Green Club to organize awareness-raising activities such as guest lectures, poster campaigns, and a beach clean-up
Next, the methodology section details the research design, explaining how both quantitative and qualitative methods including surveys were employed to gather insights. The results chapter then presents the key findings from this fieldwork, supported by data analysis and observations.
Our results show that while knowledge on SUPs varies widely between faculties, there is a clear willingness among students and staff to adopt reusable alternatives when properly informed and engaged. However, knowledge about single-use plastics (SUPs) and broader environmental issues is still limited among students. Therefore, continued efforts in awareness-raising and environmental education remain essential.
The results of the experiment have shown us that people use less SUPs when they received a reusable cup/bottle. Nevertheless, we think a solution with reusable cups and bottle will be more effective when working with a deposit system in the canteen at QNU.
Finally, the thesis ends with recommendations. These are primarily focused on improving waste management by the installation of color-coded bins, providing educational lessons, and creating awareness posters.
2.1.1
2.1.2
2.1.3
3.2
3.2.2
3.2.3
3.2.4
3.2.5
3.2.7
3.2.8
3.2.9
3.2.10
Abbreviation
EoL End-of-life
Meaning
EPR Extended Producer Responsibility
GWP Global Warming Potential
HU Heavy users (of disposable plastic cups)
ISW Industrial solid waste
LCA Life Cycle Assessment
MC Multiple Choice
MPs Microplastics
MSW Municipal solid waste
OU Occasional users (of disposable plastic cups)
OVAM Openbare Vlaamse Afvalstoffen Maatschappij
PE Polyethylene
PET Polyethylene Terephthalate
PP Polypropylene
PS Polystyrene
QNU Quy Nhon University
SUP Single-use plastics
UNEP United Nations Environment Programme
USD United States dollar
WtE Waste-to-Energy
WWF World Wide Fund for Nature
List of Figures
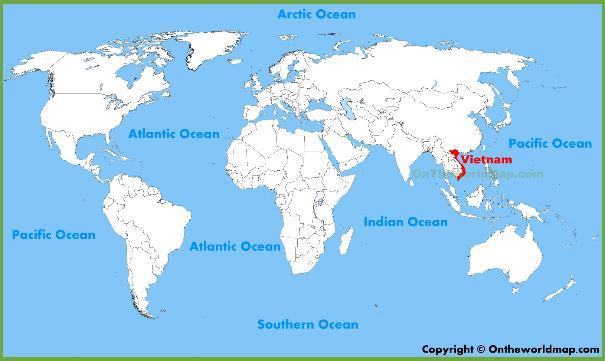
Figure 1: Vietnam, On World Map (2015). 13
Figure 2: Ha Long Bay, Wall Paper Cave (2011)....................................................................13
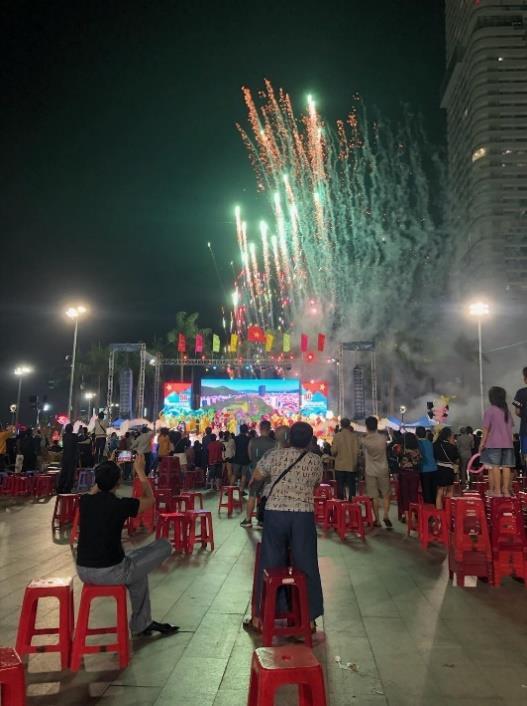
Figure 3: Local Festival for the celebration of the liberation of the Bin Dinh province - Quy Nhon. Photo by the author, March 2025. 14
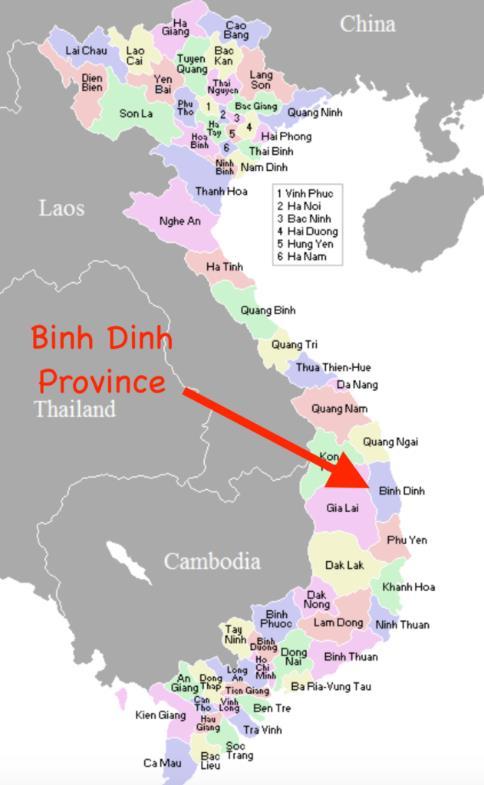
Figure 4: Binh Dinh Province, Motormaps, (2022) .................................................................15
Figure 5: TMS Tower Quy Nhon, C. Trang, (2024). 16
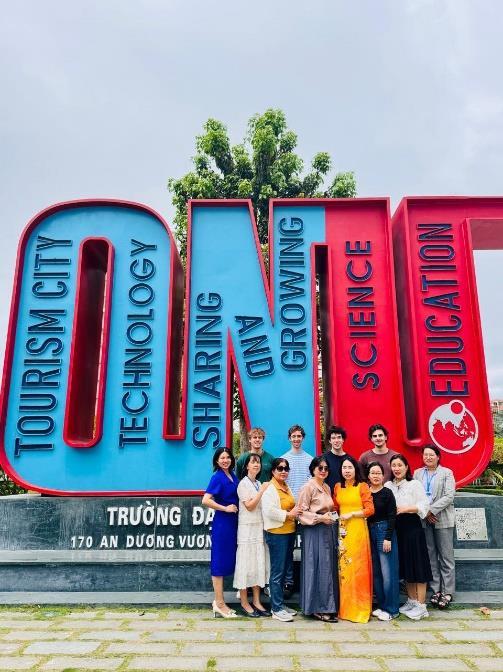
Figure 6: Vietnamese delegation of the SP7 project and us. Photo by T. V. Nguyen, personal communication, April 2, 2025. Used with permission. 17
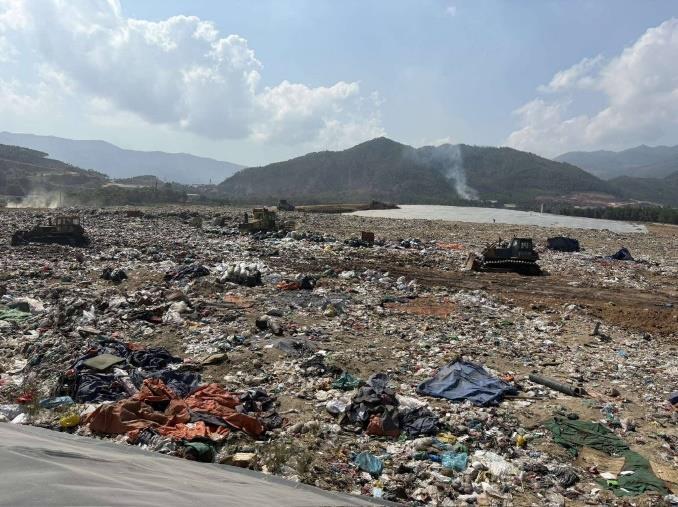
Figure 7: Landfill Quy Nhon. Photo by the author, April 2025. 18
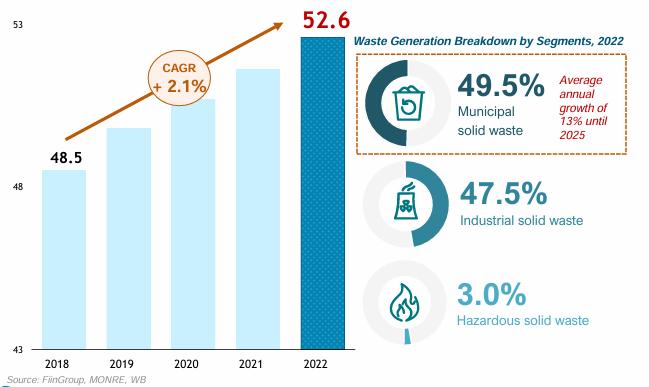
Figure 8: Solid Waste in Vietnam, FIIGroup (2024)...............................................................18
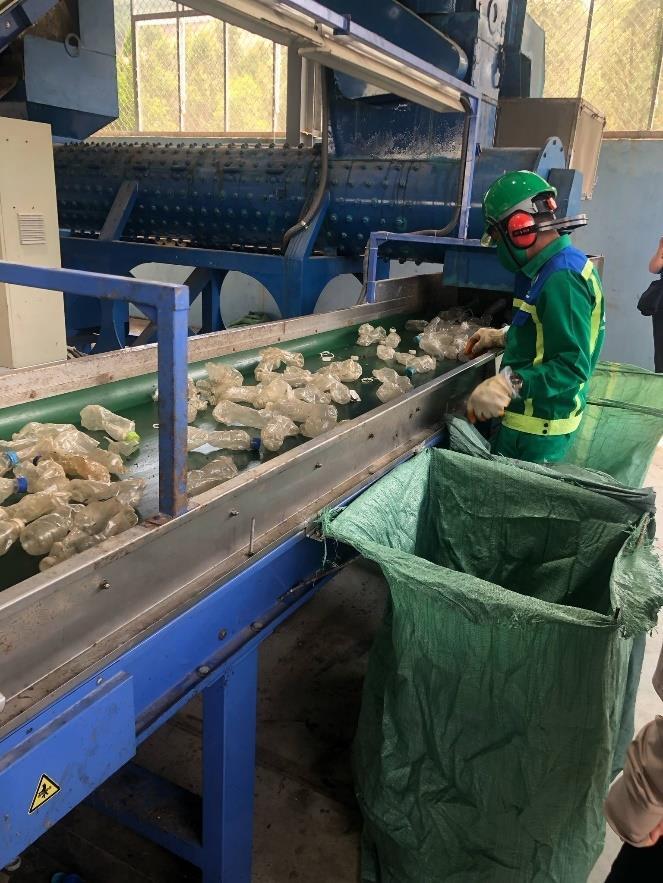
Figure 9: PET recycling line Quy Nhon. Photo by the author, April 2025. 19
Figure 10: The Value Chain of Waste in Vietnam, FIIGroup (2024)......................................20
Figure 11: Waste Management Actors, FIIGroup (2025). 21
Figure 12: Ladder of Lansink, Nv E (n.d.). 22
Figure 13: Waste Management in the Future, FIIGroup (2024). .............................................23
Figure 14 : Global Plastic Cycles in 2022, adapted from Houssini, Li, & Tan, 2025. 24
Figure 15 : Global plastic production with projections (Business-as-usual scenario), adapted from Our World in Data, 2023.
Figure 16 : Plastic leakage into the Ocean (BAU), adapted from Pew Charitable Trusts (2020).
Figure 17 : Map of encounters between plastic pollutants and marine life, originates from Litterbase, adapted from Wold Wide Fund for Nature (2020).................................................
Figure 18 : Aquatic species affected by marine litter (Alfred Wegener InstituteLITTERBASE, n.d.).................................................................................................................
24
25
26
27
Figure 19: Different types of litter affecting aquatic life (Alfred Wegener InstituteLITTERBASE, n.d.) 27
Figure 20: Types of plastic encounters with marine animals (Alfred Wegener InstituteLITTERBASE, n.d.).
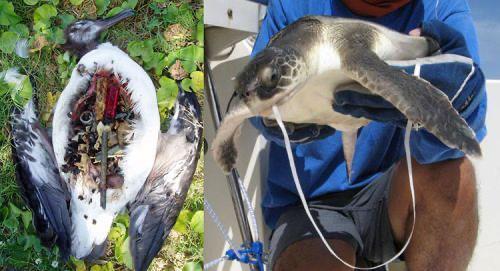
Figure 21 : Image credits: Bird’ stomach with marine debris image – NOAA; Sea turtle balloon ingestion image – Blair Witherington, Florida Fish and Wildlife Conservation Commission.
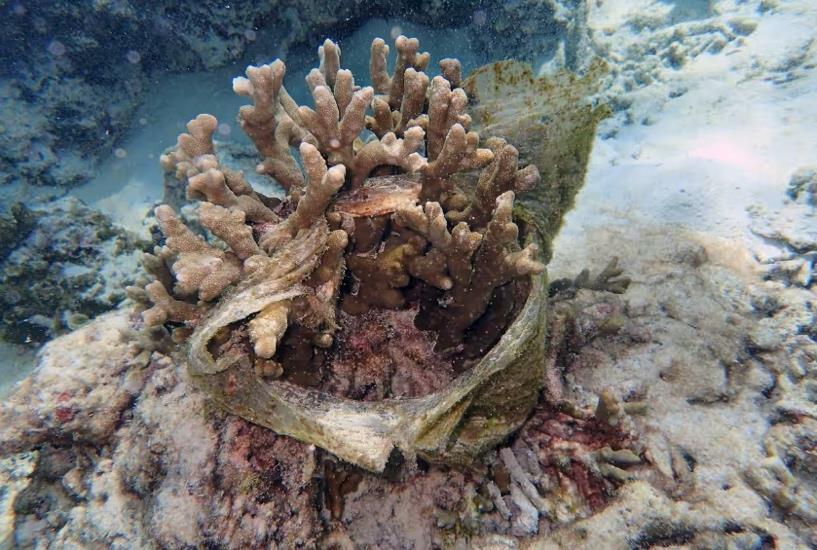
Figure 22: Plastic debris entangled in a coral reef. Photograph by Lalita Putchim, originally published in Science, reproduced via The Guardian (2018).
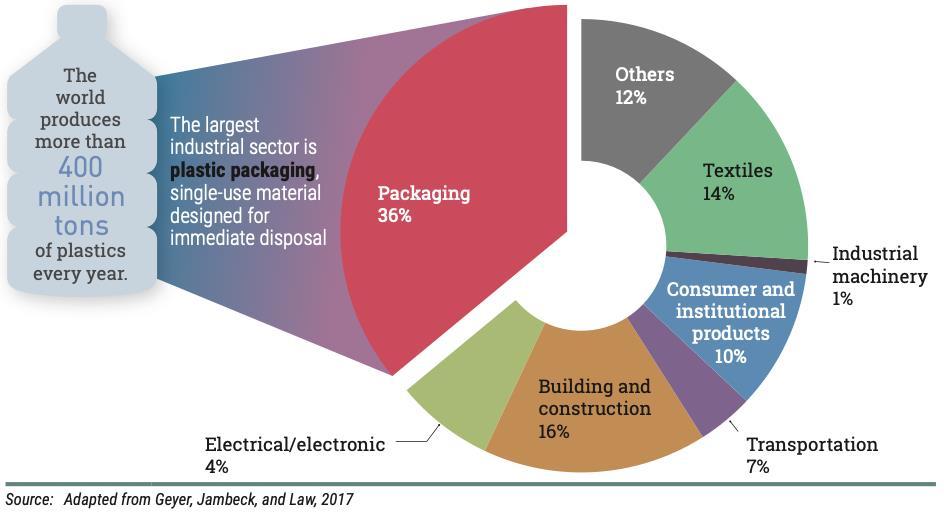
Figure 23: Global plastic production by industry in 2015, adapted from United Nations Environment Programme (2018).
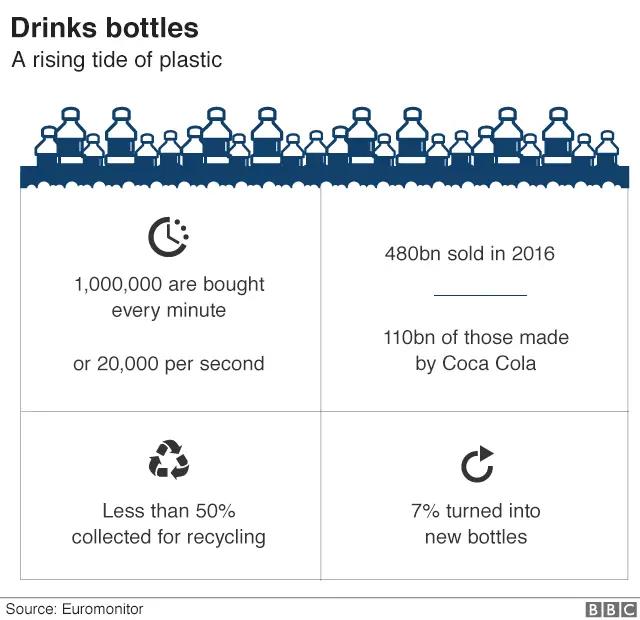
Figure 24: Information about single-use plastic bottles. Data from Euromonitor International (2017), adapted from BBC News (2017). ................................................................................
28
28
29
30
31
Figure 25: Scenario analysis for GWP per Functional Unit (one use of a container) with EoL: (R) Recycling, (I) Incineration, Yadav et al. (2024)................................................................
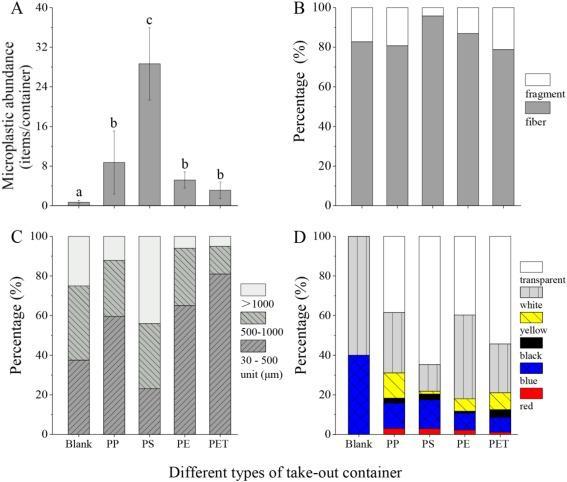
Figure 26: Microplastics in take-out food containers, Du et al. (2020). ..................................
Figure 27: Analysis of reusable cups against paper cups, Anand et al. (2024)
Figure 28: An edible coffee cup. Image credit: Cupffee (2023), adapted from FoodNavigator (2023).
Figure 29: Blue Dopper water bottle. Image from HOGENT Shop (n.d.)...............................
Figure 30: Billie XXL reusable coffee cup. Image from Billie Cup (n.d.)..............................
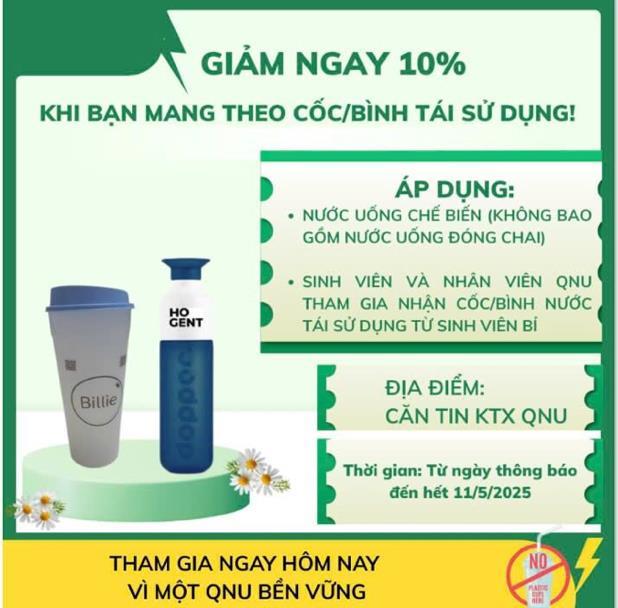
Figure 31: Incentive Coupon for 10% reduction week 4. Created by T. V. Nguyen, using ChatGPT and Canva, personal communication, May 5, 2025. Used with permission............
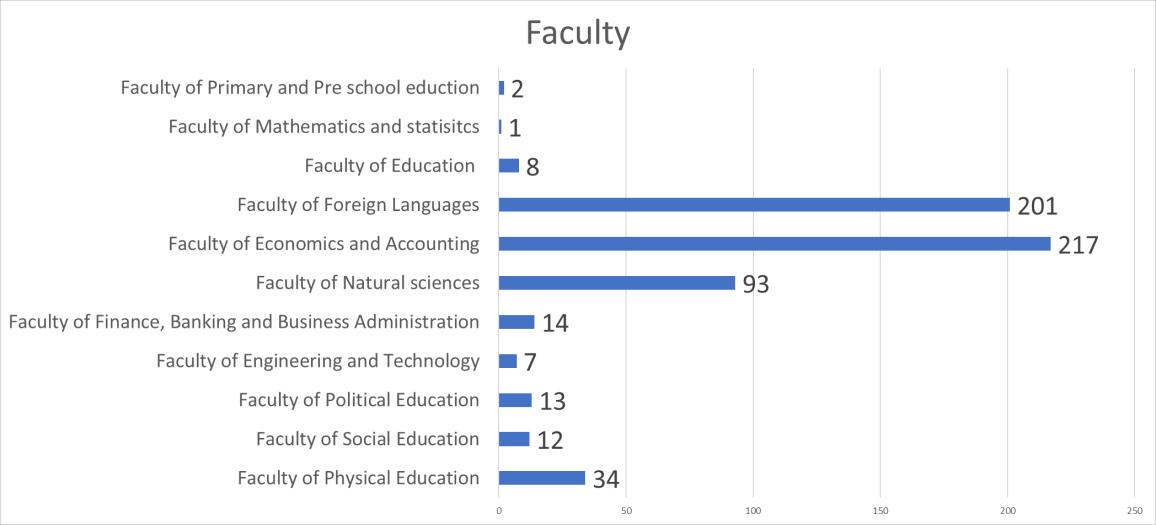
Figure 32: Faculty distribution. Source: own results.
32
33
34
34
38
38
40
42
Figure 33: Compilation of six images illustrating single-use and reusable products used in the survey. Images sourced from Shutterstock, CNN, product websites, and stock photo providers (see figure references). Compilation created by the author, March 2025. Copyright remains with the original image owners................................................................................................
Figure 34: Current usage of reusable bottles. Source: own results.
Figure 35: Current usage of straws. Source: own results.
43
49
50
Figure 36: Potential use of sustainable straws. Source: own results........................................51
Figure 37: Current usage of reusable bags. Source: own results.
51
Figure 38: Potential use of reusable bags. Source: own results. ..............................................52
Figure 39: Current usage of reusable cutlery. Source: own results.
Figure 40: Potential use of reusable cutlery. Source: own results.
Figure 41: Current usage of disposable cups. Source: own results..........................................
Figure 42: Potential use of reusable cups. Source: own results.
Figure 43: Potential ease of bringing reusable cup to QNU. Source: own results...................
Figure 44: Best reusable cup system. Source: own results.
Figure 45: Plastic bottle usage after 3 weeks in our project. Source: own results.
Figure 46: Plastic cup usage after 3 weeks in our project. Source: own results. .....................
53
53
54
55
56
56
59
62
Figure 47: Billie cup and HOGENT bottle in the canteen. Photo by T. T. V. Dinh, personal communication, May 5, 2025. Used with permission. 63
Figure 48: Billie cup in the canteen. Photo by T. V. Nguyen, personal communication, May 5, 2025. Used with permission 63
Figure 49: HOGENT bottle on the University. Photo by H. Hoang, personal communication, May 6, 2025. Used with permission.........................................................................................63
Figure 50: Plastic bottle usage, week 4 into our project. Source: own results. 65
Figure 51: Plastic bottle usage, week 4 into our project, taking the incentive into account. Source: own results. 66
Figure 52: Preferability of a deposit system for bottles, week 4 into our project. Source: own results. ......................................................................................................................................66
Figure 53: Plastic cup usage, week 4 into our project. Source: own results. 69
Figure 54: Plastic cup usage, week 4 into our project, taking the incentive into account. Source: own results. 70
Figure 55: Preferability of a deposit system for cups, week 4 into our project. Source: own results. ......................................................................................................................................70
Figure 56: Evolution in the use of reusable bottles through 4 weeks. Source: own results. 71
Figure 57: Evolution in the use of reusable cups (OU and HU) through 4 weeks. Source: own results…………………………………………………………………………………………72
Figure 58: Evolution in the use of reusable cups (HU) through 4 weeks. Source: own results. ..................................................................................................................................................73
Figure 59: Evolution in the use of reusable cups (OU) through 4 weeks. Source: own results.
..................................................................................................................................................74
Table 1: Wrongly identified SUPs. Source: own results.
44
Table 2: Correlation between the question where they had to select the SUP items (3.2.1) and the question about the best incentive to use their reusable cup (Table 19). Source: own results.
44
..................................................................................................................................................
Table 3: Correlation between the question where they had to select the SUP items (3.2.1) and the question about the ease to bring a reusable cup to QNU (Figure 43). Source: own results.
45
..................................................................................................................................................
Table 4: Question about post-treatment of SUPs. Source: own results.
45
Table 5: Correlation between the question where they had to select the SUP items (3.2.1), the question about the post-treatment of SUPs (3.2.4), and the question about the best incentive to use their reusable cup (Table 19). Source: own results.
46
Table 6: Correlation between the question where they had to select the SUP items (3.2.1), the question about the post-treatment of SUPs (3.2.4), and the question about the ease to bring a reusable cup to QNU (Figure 43). Source: own results. ..........................................................
Table 7: Most effective way to learn about SUPs. Source: own results. .................................
Table 8: Reasons to use a reusable bottle. Source: own results.
Table 9: Reasons not to use a reusable bottle. Source: own results.........................................
Table 10: Potential use of a reusable bottle. Source: own results.
Table 11: Reasons to use disposable straws. Source: own results.
Table 12: Reasons to use more sustainable straws. Source: own results.................................
Table 13: Reasons to use reusable bags. Source: own results.
Table 14: Reasons to use plastic bags. Source: own results.
46
48
49
49
49
50
51
52
52
Table 15: Reasons to use reusable cutlery. Source: own results..............................................53
Table 16: Reasons to use plastic cutlery. Source: own results. 54
Table 17: Reasons to use a reusable cup. Source: own results.................................................55
Table 18: Reasons to use plastic cups. Source: own results. 55
Table 19: Incentives to use reusable cups. Source: own results...............................................56
Table 20: Reasons, in general, to use reusable products. Source: own results. .......................57
Table 21: Places where they used the reusable bottle, results from week 1, 2 and 3. Source: own results................................................................................................................................57
Table 22: Four forces model applied on bottle users, results week 1,2 and 3. Source: own results. 58
Table 23: How to encourage the use of reusable bottles, results week 1, 2 and 3. Source: own results. 59
Table 24: Places where OU used the reusable cup, results from week 1, 2 and 3. Source: own results. 59
Table 25: Places where HU used the reusable cup, results from week 1, 2 and 3. Source: own results. ......................................................................................................................................59
Table 26: Four forces model applied on OU, results week 1, 2 and 3. Source: own results. 60
Table 27: Four forces model applied on HU, results week 1, 2 and 3. Source: own results....60
Table 28: How to encourage the use of reusable cups, results week 1, 2 and 3. Source: own results. 62
Table 29: Places where they used the reusable bottle, week 4. Source: own results...............64
Table 30: Four-forces model applied on reusable bottle users, results week 4. Source: own results. ......................................................................................................................................64
Table 31: How to encourage students to use the reusable bottle, results week 4. Source: own results. 65
Table 32: Places where OU used the reusable cup, results week 4. Source: own results........67
Table 33: Places where HU used the reusable cup, results week 4. Source: own results. 67
Table 34: Four-forces model applied on OU, results week 4. Source: own results.................67
Table 35: Four-forces applied on HU, results week 4. Source: own results............................68
Table 36: How to encourage students to use the reusable cup, results week 4. Source: own results. ......................................................................................................................................69
Table 37: Usage numbers of the reusable bottle, results week 1,2 and 3. Source: own results. ..................................................................................................................................................71
Table 38: Usage numbers of the reusable bottle, results week 4. Source: own results............71
Table 39: Usage numbers of the reusable cup (OU and HU), results week 1,2 and 3. Source: own results................................................................................................................................72
Table 40: Usage numbers of the reusable cup (OU and HU), results week 4. Source: own results. 72
Table 41: Usage numbers of the reusable cup (HU), results week 1,2 and 3. Source: own results. 73
Table 42: Usage numbers of the reusable cup (HU), results week 4. Source: own results......73
Table 43: Usage numbers of the reusable cup (OU), results week 1,2 and 3. Source: own results. 74
Table 44: Usage numbers of the reusable cup (OU), results week 4. Source: own results......74
Plastic pollution is one of the most urgent environmental challenges of our time. We do not only see plastic pollution in Belgium but also in Vietnam it is continuously present.
Each day, as we walk along the beach on our way to the Quy Nhon University, we are confronted with that sad reality. The entire shoreline of the beach is scattered with waste (Plastic bags; straws; food waste, plastic packaging and many more). Even when we go for a swim in the evening, it often feels like your swimming trough a sea of plastic These experiences make it painfully clear that urgent action is needed.
This bachelor thesis is only a small part of a bigger project with a collaboration of Quy Nhon University and several Flemish educational institutions: the VLIR-UOS project. This multi-year project is aiming to solve local problems by means of education and research.
This bachelor's thesis is part of Subproject 7 (SP7), which aims to develop a more effective waste management system at Quy Nhon University. Through the successful implementation of this system, the university hopes to serve as a model and inspire surrounding communities to adopt sustainable waste practices. Subproject 7 began in September 2022 and is planned to continue over a period of ten years.
Three students of HOGENT were sent to QNU in 2023 and provided an inventory of the waste streams present at QNU. One of their conclusions was that single-use plastics were the second biggest waste stream. In 2024 four students of the HOGENT were sent to QNU, where they further looked into the different types of SUPs that could be found on campus, and formulated possible solutions. For this reason, the goal of our thesis is to try to see if there is a support base for reducing SUPs and if there is awareness about the problems of SUPs.
In our thesis we tried to find an answer to the following research question: “How can a support base for reducing SUPs at Quy Nhon University be established by raising awareness and by offering reusable alternatives?”
This research is valuable for several reasons. First, it contributes to the global search for solutions to a reduce plastic. Secondly, it supports Quy Nhon University in making informed decisions about how best to invest in awareness campaigns and sustainable alternatives.
And finally, we hope that our efforts from guest lectures to the introduction of reusable bottles and cups have encouraged interest, inspired change, and planted the seeds for a more sustainable future at QNU.
2.1.1 Vietnam
Vietnam, located in Southeast Asia, has a rich history shaped by its resilience and long struggle for independence. From ancient kingdoms to French colonization and the Vietnam War, the country has experienced significant transformation (Koops, 2023). Today, it is a socialist republic with a rapidly growing economy, though its political leadership remains firmly committed to a communist direction (Hickey et al., 2025).
The country is also known for its diverse landscapes, including Ha Long Bay, recognized as one of the seven natural wonders of the world by UNESCO (UNESCO World Heritage Centre, n.d.).
Economically, Vietnam has emerged as one of Asia’s fastest-growing economies in recent years. The rapid growth in sectors like textiles and electronics has strengthened its position as a key player in the global market (BNNVARA, 2021).
Looking towards 2030, Vietnam aims for a 7% gross domestic product growth, a $7,500 per capita gross domestic product, and a reduction in its agricultural workforce, while emphasizing industrialization and modernization (Nguyen, 2024). The country seeks to shift from processing to innovation and research, focusing on digital transformation and high-tech industries, with the goal of becoming one of the top three Asian nations in industrial competitiveness, with over 40% of its gross domestic product derived from industry. Policies will foster investment in technology, human resources, and infrastructure (Tuan, 2022).

In Vietnam, particularly in smaller towns and rural areas, life tends to unfold at a much slower pace compared to the fast-paced environments common in many Western countries. Here, meals are enjoyed with the whole family, conversations are held everywhere, daily routines often follow the natural rhythms of the environment (Mrowiński, 2023).
This slower pace of life is not just a reflection of tradition but also serves as a means for individuals to nurture strong family and community bonds, placing relationships at the forefront rather than the pressures of modern life (Cao, 2021). It shows a sense of calm and deep connection to the land, offering a contrast to the fast and hard line of urban living (Mrowiński, 2023).
However, in larger cities such as Hanoi and Ho Chi Minh City, society is different. The streets are often filled with people in a rush, and the pace of life feels much faster, mirroring the demands of a rapidly growing economy This illustrates the tension between rural life and urban hustle and the tensions between tradition and modernity that are playing out across the country (Nguyen et al., 2020).
Despite Vietnam’s economic growth and increasing urbanization, traditional cultural practices remain an integral part of daily life. Practices like ancestor worship, tea ceremonies, and the celebration of various cultural festivals continue to hold great significance (Festivals Are Vital to Cultural Development, n.d.). These traditions not only shape the values of the Vietnamese people but also act as a counterbalance to the rapid changes driven by industrialization (Nguyen et al., 2020). They represent a means of preserving cultural identity and reinforcing community connections amidst the challenges and transformations of modern life (Claire & Beel, 2022).
Binh Dinh is a province located in central Vietnam. The province is known for its rich history and beautiful coastal landscapes. The capital of the province is Quy Nhon, where we are going to do our internship (Portal, 2022). Binh Dinh was an important centre of the Champa Kingdom, which was an ancient Indochinese kingdom lasting from the 2nd to the 17th century CE and extended over the central and southern coastal region of Vietnam. The influence of this kingdom is still visible in Vietnam and in Bin Dinh province, through, for example, the temples scattered across the country, but also through the influence that civilization now has on the country of Vietnam (The Editors of Encyclopaedia Britannica, 1998). The province is also famous for its traditional craft industries, including weaving and pottery (Portal, 2022).
The province also experienced a significant economic growth in recent years. The economy in the province is diverse, but the main sector is agriculture, especially rice, fruit and spice farming. Because of the coastal beauty and the historical sites in the province, tourism is also rapidly growing (Vietnam Investment Review, 2025).
Quy Nhon, is a coastal city in central Vietnam, located in the province of the Binh Dinh in Central Vietnam. Quy Nhon offers a mix of traditional Vietnamese culture and modern development. It has a growing role in the Vietnam’s tourism industry, as well as a very important economic role. This is because of the strategic position as a hub for trade and culture (Encyclopaedia Britannica, 2019).
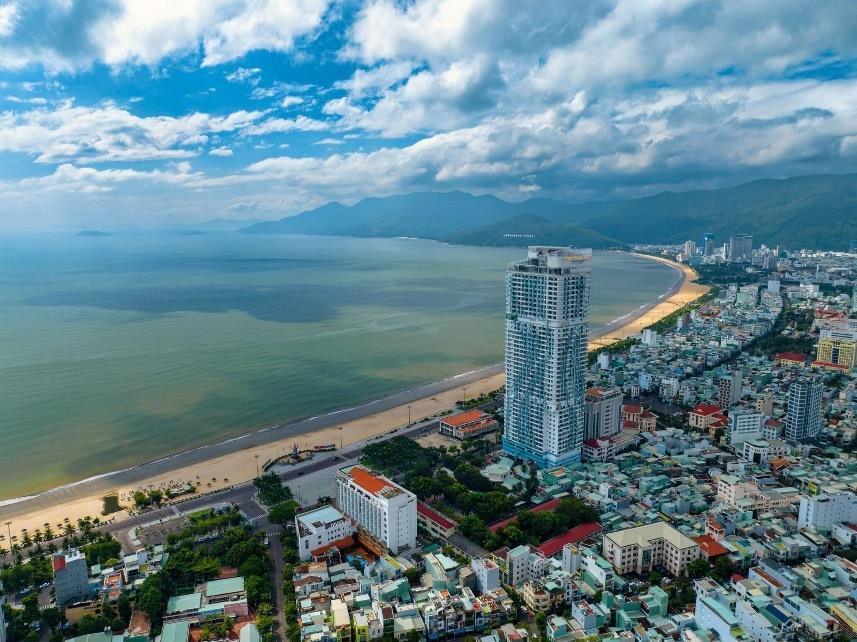
The city has a lot of potential to grow into one of the biggest tourist destinations in Vietnam, but for now it lacks the supply of luxury properties and activities that can support tourists in the future (Cổng Ty Cổ, 2022).
Quy Nhon University (QNU) is the university where the internship and bachelor thesis will be executed QNU is located in the coastal city of Quy Nhon and is a prominent educational institution in the wide region but ranked lower as the universities in the big cities like Hanoi and Ho Chi Minh. The university was founded in 1977 and plays a key role in higher education, research, and community development in Vietnam. As it continues to grow, the university remains committed to producing skilled graduates who contribute to the advancement of Vietnamese society (Quy Nhon University Ranking & Overview 2024, n.d.).
The university also fosters international cooperation, through partnerships with universities around the world, enhancing its academic and cultural exchanges, an example is the collaboration with the KU Leuven, UAntwerpen and HOGENT (A Message From The Rector Of Quy Nhon University, n.d.).
For a deeper insight into Vietnam’s environmental and sustainability initiatives, as well as the broader context of current policies, section 9.1Sustainabilityandtheenvironment in Vietnam is definitely worth reading. It provides a comprehensive overview of the strategies, legislation, and efforts being made by the government and other stakeholders to create a more sustainable Vietnam.
2.1.7.1 The Current Waste Situation in Vietnam
Vietnam is facing increasing pressure on its waste management system. In 2022 alone, Vietnam produced 26.1 million tons of solid waste, of which 49.5% was municipal waste (MSW), 47.5% industrial waste (ISW), and 3% hazardous waste (HSW) (FiinGroup, 2024). SUPs in Vietnam count as solid waste (VietnamPlus, 2024).
As of 2024, the country generates approximately 65,000 tons of solid waste daily, of which urban areas and industrial zones remain the major contributors. This growing waste volume is largely driven by rapid urbanization, industrial expansion, and rising consumption patterns (FiinGroup, 2024; Pham, 2024; Ngan, 2018).
As a response to this problem, Vietnam has made several commitments to design smart solutions for preserving the environment (Cho et al., 2018). Since 2007, the Vietnamese government has made several attempts to implement waste separation at source. However, it was not until 2020 that these efforts were formally codified into legislation (WasteSortingAtSourceRemainsUnimplementedinManyAreas, z.d.). The law officially came into effect on December 31, 2024, with the aim of reducing the volume of waste sent to landfills and promoting recycling (Waste Sorting At Source Remains UnimplementedinManyAreas, n.d.).
Despite various policy efforts, landfilling remains the dominant disposal method, accounting for more than 85% in 2022 and still over 70% in 2024. This also applies to single-use plastics, as they are considered a significant component of solid waste due to their widespread use and limited recyclability (FiinGroup 2024; Pham, 2024).
Recycling and reuse are still limited, with only 15% of solid waste being recycled, largely through informal networks. This limited capacity, combined with insufficient sorting at the source, reduces recycling efficiency and adds to environmental strain. Vietnam is also among the top five contributors to ocean plastic pollution, releasing an estimated 280,000 to 730,000 tons of plastic into the ocean annually (Reuters, 2024; Expert Market Research, 2024).
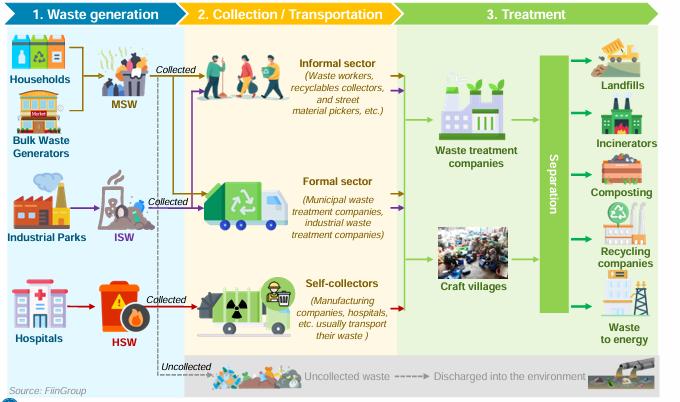
Vietnam’s waste management system follows a structured value chain that includes three key stages: waste generation, collection and transportation, and treatment. Each stage involves a range of actors and processes that reflect the country’s blend of formal and informal management practices (FiinGroup, 2024)
The process begins with waste generation from several main sources. Households and bulk generators such as restaurants and markets contribute to municipal solid waste (MSW). Industrial parks are responsible for industrial solid waste (ISW), while hospitals generate hazardous solid waste (HSW) (Pham, 2024) However, not all waste is properly collected. Some remains uncollected or is discharged directly into the environment, adding to pollution concerns (FiinGroup, 2024).
Once generated, waste moves into the collection and transportation phase. Here, three key groups are involved The first one is the informal sector, including waste pickers and street collectors (Harafadli et al, 2024).
The first sector plays a vital role in collecting recyclables from households and public spaces. The second, the formal sector comprising municipal and industrial waste management companies handles organized waste collection and transportation services. Lastly, there are the self-collectors, such as manufacturing companies and hospitals, which often manage their own waste transport, particularly when dealing with hazardous materials (FiinGroup, 2024).
Waste separation at the source remains minimal, and in most cases, all types of waste are mixed together. While pilot programs in large cities aim to improve household sorting, these are still in early stages and not yet widely implemented (FiiGroup, 2024).
In the treatment stage, waste is delivered to different facilities where it is sorted and processed. Waste treatment companies and craft villages - many of which operate informally - carry out the separation of materials. Depending on the type of waste and treatment method, the waste is sent to landfills, incinerators, composting sites, recycling companies sometimes it is also converted into energy through Waste-to-Energy (WtE) technology (ESCAP, 2015). A side note to this is that the majority of all the waste gets dumped in a landfill (Fiingroup, 2024).
Many landfill sites such as Nam Son in Hanoi are nearly full, with utilization rates of up to 99.9% (FiinGroup, Pham, 2024). Incineration is primarily used for hazardous and medical waste, although energy is not typically recovered. Composting remains limited to rural areas, and recycling is largely informal and inefficient. As a response, Vietnam has begun investing more heavily in Waste-to-Energy (WtE) solutions, which offer both environmental and energy benefits (Ngan, 2018).
The lack of modern treatment infrastructure, combined with low government spendingonly 0.23% of GDP in 2023 compared to a global average of 0.5% further (World Bank, 2023) - complicates the country’s ability to handle rising waste volumes effectively (FiinGroup, 2024).
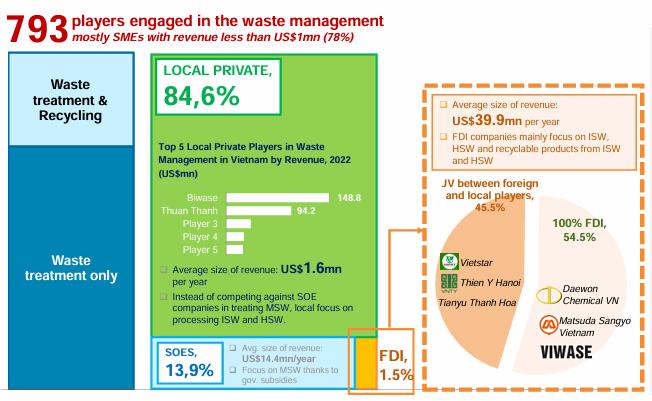
To address Vietnam’s growing waste challenge, improved coordination and targeted investment are required at every stage of the complex yet essential collaboration between the formal waste management systems and the informal labor sector. Every stem in the value chain holds the potential to support a more sustainable waste management future (FiiGroup, 2024).
Vietnam’s government has recognized these challenges and is actively shaping a more sustainable future through policy reforms, investments, and international commitments. The country has set clear targets: by 2030, at least 50% of municipal waste should be treated through Waste-to-Energy technologies, and by 2050, 100% of waste should be treated without landfilling. (Vietnamese Government, 2023; FiinGroup, 2024).
To support this transition, the government has introduced a number of strategic policies. To make WtE plants more financially viable the Vietnamese government took Decision 31/QD-TTg it offers tax incentives, low-interestloans, andimport duty exemptions forWtE projects. Circular 32/TT-BCT sets standards for electricity pricing to make them higher (Vietnamese Government, 2023). Additionally, the Extended Producer Responsibility (EPR) policy requires manufacturers to manage the waste created by their packaging and products, encouraging more sustainable production and better waste recovery systems (FiinGroup, 2024).
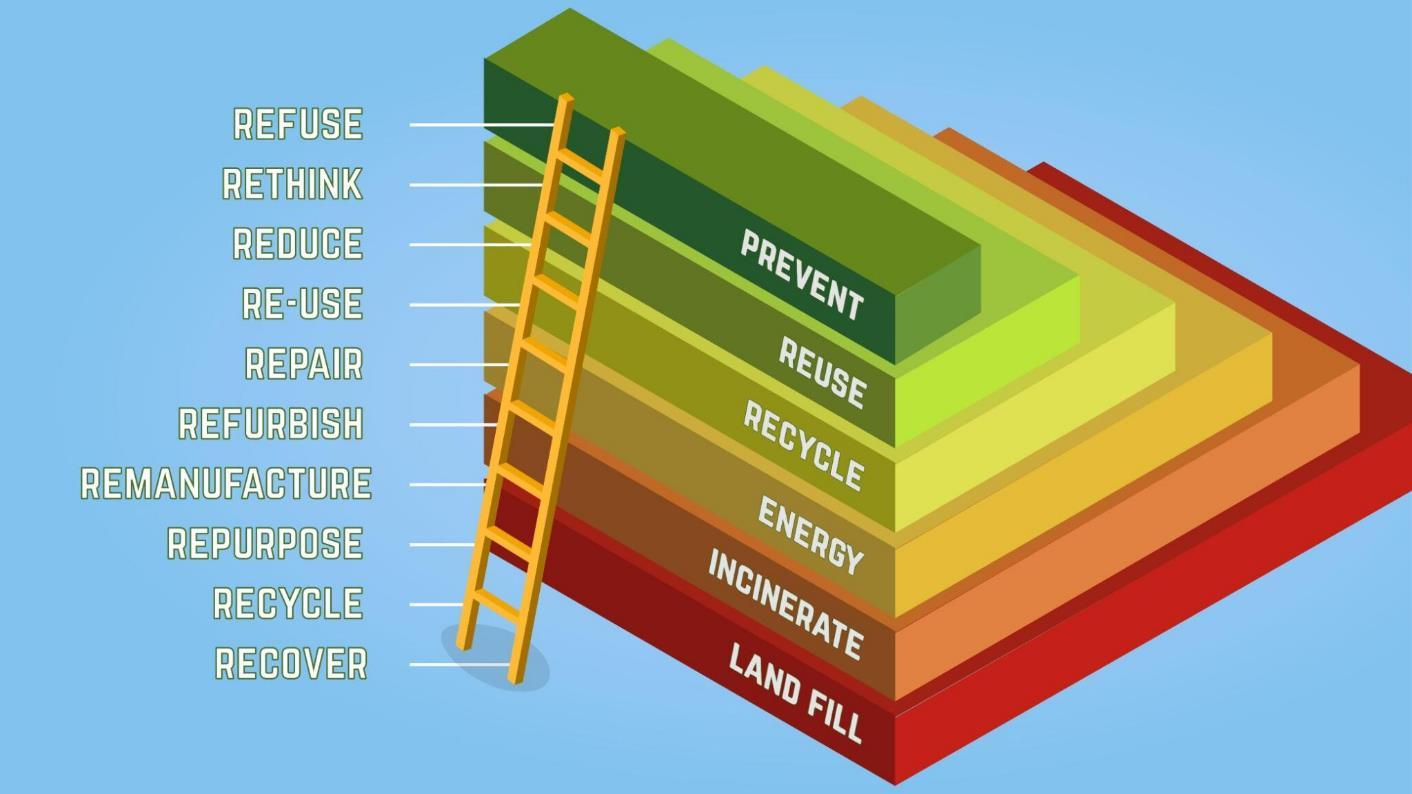
However, these targets must be assessed with a critical eye. When you look at Lansink's ladder you see that getting energy from waste is at the bottom of the ladder. The Vietnamese government actually needs to do a better job on refuse, rethink and all the other levels on the ladder of Lansink (FiinGroup, 2024).
Alongside policy, market potential is also growing. The Vietnamese waste management market is expected to grow from approximately USD 6.42 billion in 2024 to over USD 11.4 billion by 2034, with an annual growth rate of 6.6% (Expert Market Research, 2024). This opens major opportunities for both local and foreign investors in infrastructure, technology, and recycling services (Ngan, 2018).
Vietnam’s efforts also align with its commitment to net-zero carbon emissions by 2050, as announced at the COP27 summit. Modern waste treatment, especially WtE, will play a crucial role in achieving this goal (FiinGroup, 2024).
Vietnam is moving away from landfilling towards modern waste treatment, like composting and anaerobic digestion. These methods reduce environmental impact and generate renewable energy from organic waste (B-Company, 2024)
With rising urbanization, the government is investing in better infrastructure, promoting waste separation at source, and improving recycling practices. Combined with stronger regulations and public education, these steps aim to build a more circular economy focused on sustainability and resource recovery (Ngan, 2018)
Plastic is one of the most widely used materials globally, with an annual production of approximately 400 million tons (United Nations Environment Programme [UNEP], 2018), a number also supported by a recent study published in the Nature journal Communications Earth & Environment. The study also highlights that in 2022, 98% of global plastic production was derived from fossil fuels, which contribute to higher greenhouse gas concentrations, thereby driving global warming (Liu & Liu, 2023). The full plastic lifecycle, including production, trade, and waste, is illustrated in Figure 14 (Houssini et al., 2025).
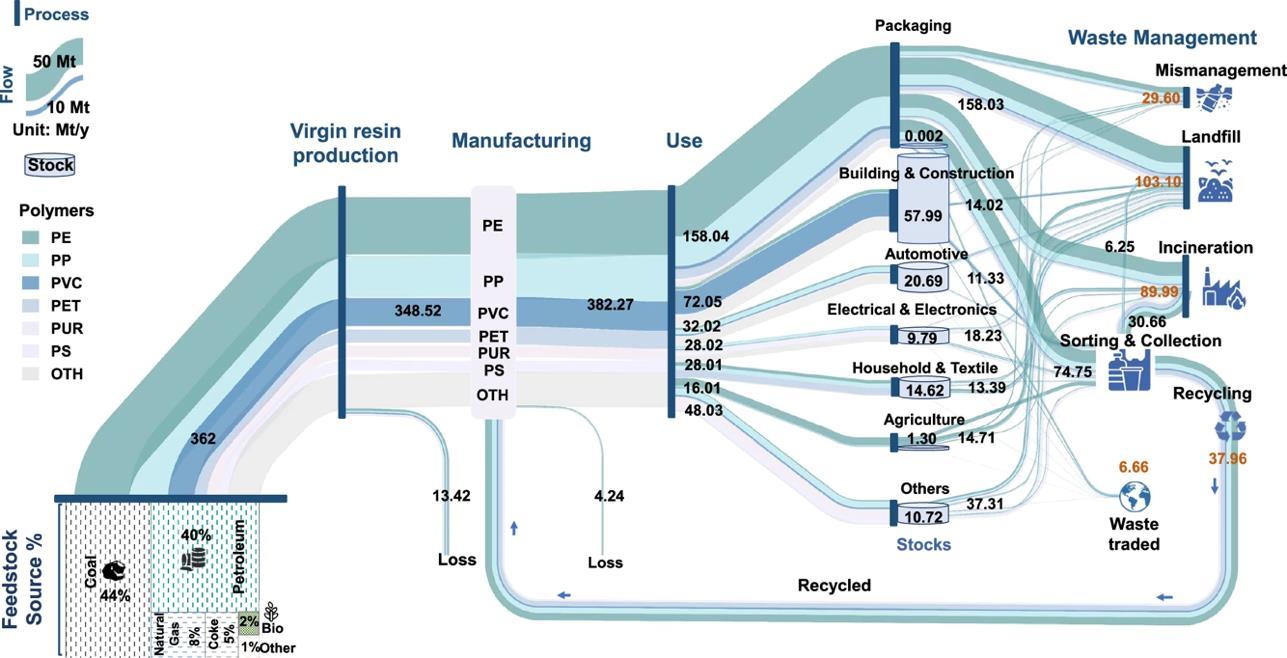
As shown in Figure 15, plastic production has consistently risen over the years. If current trends continue, it is projected to increase even further (Our World in Data, 2023).
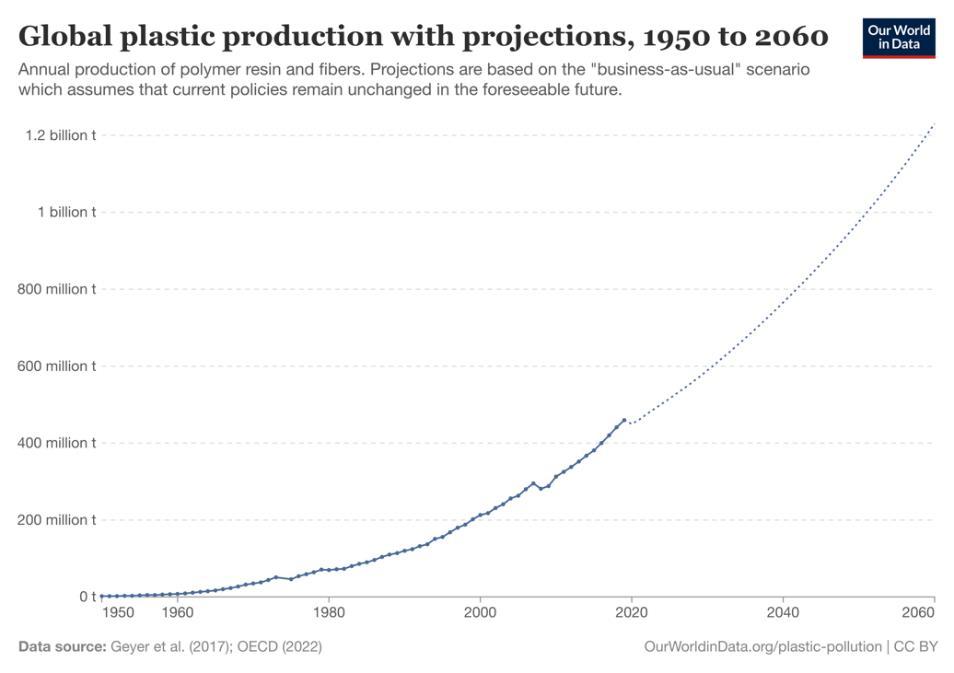
15 :Global plastic production with projections (Business-as-usual scenario), adapted from Our World in Data, 2023.
Each year, an estimated 11 million metric tons of plastic enter the ocean, with projections ranging from 9 to 14 million metric tons annually in 2016, increasing to 29 million metric tons by 2040 (Pew Charitable Trusts & Systemiq, 2020).
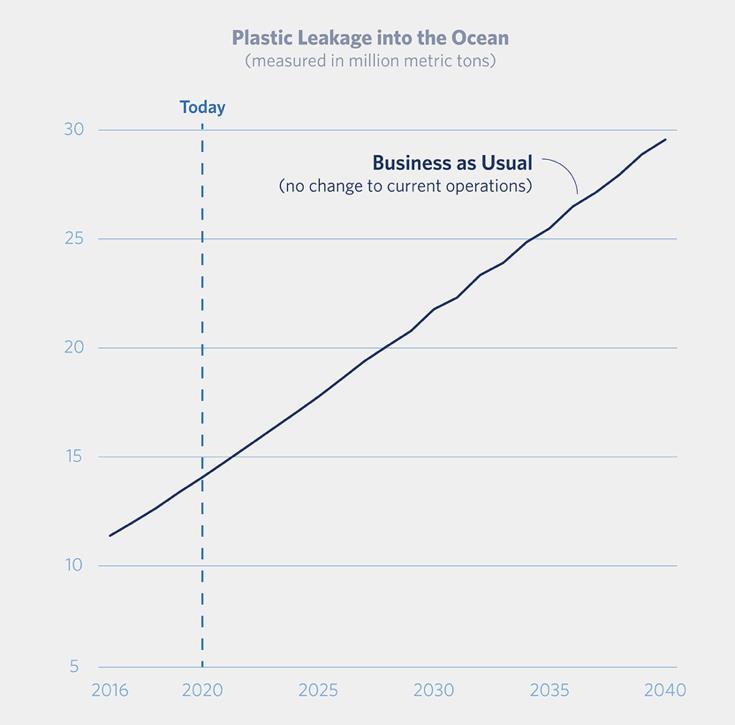
16: Plastic leakage into the Ocean (BAU), adapted from Pew Charitable Trusts (2020).
These are small pieces of plastic (ranging from 5mm to 500 µm) that can originate from various plastic items like bags, cups, and bottles (Allemann et al., 2024). In 2021, Isobe et al. estimated that there were approximately 24.4 trillion (10¹²) pieces of microplastics (MPs) in the upper layer of the world’s oceans, equivalent to around 30 billion 500milliliter plastic water bottles.
Microplastics typically form through the fragmentation of plastic due to abrasion or UV degradation caused by sunlight (Allemann et al., 2024) and often contain polymers and additives, which, when released, can cause toxicity. Thus, they are inherently toxic and act as carriers for numerous pollutants, especially heavy metals, enabling them to enter the organs of organisms (Li et al., 2023).
MPs can enter the human body in several ways. One major route is through the air, where MPs - mainly from traffic and tire wear - can be inhaled. Another pathway is through skin contact. Microplastics can settle on the skin through the use of facial products like creams, and even handling items such as phone cases can lead to the absorption of harmful chemicals attached to these particles. The third route is through food and drinks. MPs have been found in common items like drinking water, seafood, salt, sugar, tea, milk, and take-out food containers. They can even enter the water transport systems of plants, moving into roots, stems, leaves, and fruits (Li et al., 2023). According to Cox et al. (2019), adult men are estimated to consume around 52,000 MPs particles per year, while women consume approximately 46,000 MPs per year.
Humans are increasingly exposed to microplastics on a daily basis. According to a study by Nihart et al. (2024), the proportion of microplastics found in the brains of deceased individuals increased by approximately 50% in 2024 compared to 2016. This trend underscores the rising concentrations of both microplastics and nano plastics in various parts of the human body, with the brain showing levels 7 to 30 times higher than those found in the liver or kidneys. (As a side note, the study also included nano plastics in its analysis, alongside microplastics). The researchers stress the need for further studies to reach definitive conclusions, as it remains unclear whether this level of exposure has negative health effects. Determining such impacts requires epidemiological data, which is currently lacking (Danopoulos et al., 2023). These concerns are echoed in other scientific studies, including Bao et al. (2024).
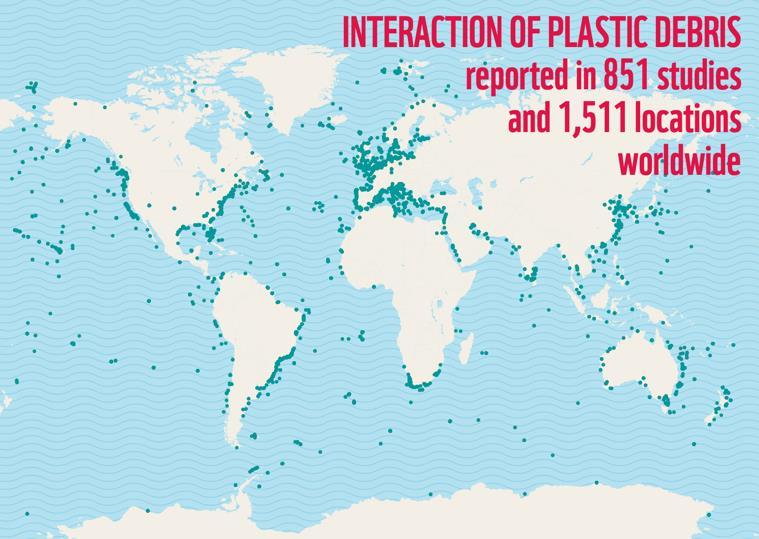
A total of 2,141 marine species have been identified as affected by plastic pollution in their natural habitats. Figure 17 provides an overview of the locations where interactions between aquatic life and marine litter occur. This figure is based on a 2022 WWF report that utilized ‘Litterbase’, an online portal for marine litter. The report indicated that there were 1,511 locations with interactions with marine litter, based on 851 studies (Tekman et al., 2022). As of today, three years later, the number has risen to 4,076 marine species, documented in 1,956 scientific studies (Alfred Wegener Institute, n.d.).
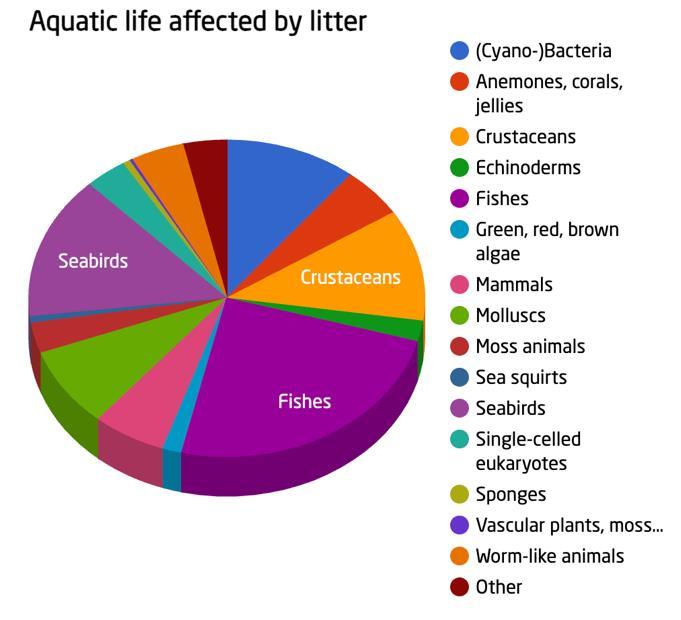
Of the 4,076 species known to be affected by marine litter, 23.74% are fishes, 14.3% are seabirds, 11.16% are crustaceans, 10.53% are (cyano-)bacteria, 7.99% are molluscs, 5.85% are mammals, and 5,04% are coral reefs, among others, with numerous other groups making up the remainder (Figure 18) (Alfred Wegener InstituteLITTERBASE, n.d.).
Using a risk model based on multiple studies, Wilcox, Van Sebille, and Hardesty (2015) predicted that by 2050, 99% of all seabird species will have ingested plastic. While evidence of ingestion and/or entanglement has been documented in all species of marine turtles (Tekman et al., 2022).
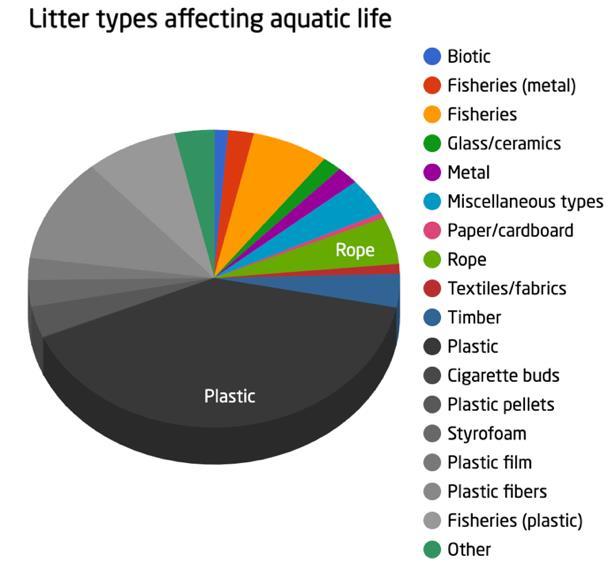
Most of the litter impacting aquatic life is plastic, accounting for 68.24% of all litter types. In addition, other materials also contribute to the problem: fishing-related waste (non-plastic) makes up 6.68%, rope 5.13%, timber 3.63% of all litter types, along with various other types of debris (Figure 19) (Alfred Wegener Institute-LITTERBASE, n.d.).
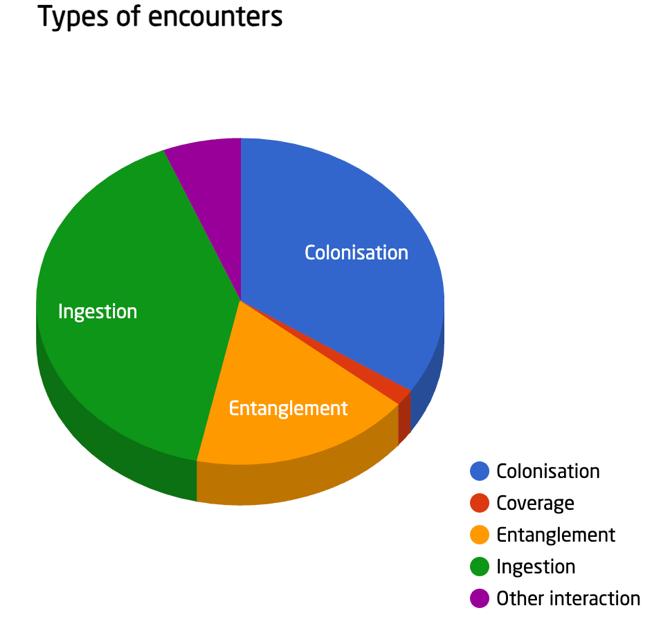
The primary types of plastic encounters are ingestion, which accounts for 40.42%, followed by colonization at 34.29%, and entanglement at 17.44%. The remaining small percentage is attributed to coverage and other interactions, as shown in Figure 20 (Alfred Wegener Institute-LITTERBASE, n.d.)
All marine species ingest plastic, leading to several harmful effects. These include a false sense of fullness, which reduces food intake and negatively impacts growth. Additionally, plastic can cause blockages in the digestive system or severe internal injuries. It also affects immune response, fertility, and reproduction (Tekman et al., 2022). Also, microplastics are ingested by animals, leading to bioaccumulation within food chains and amplifying their impact on the entire food web (Li et al., 2023).
Colonization is the process by which marine organisms - such as bryozoans, barnacles, and other small species - attach themselves to plastic waste and use it as a means of transport. Unlike ships, which move quickly, plastic debris drifts slowly and remains in the ocean for extended periods. This prolonged exposure increases the chances of survival and spread for these colonizing species. As a result, colonization via plastic waste has become one of the most significant threats to global biodiversity (Barnes, 2002). A more recent study conducted along the Indian coastline highlights similar concerns. This region receives significant amounts of plastic waste, partly due to international shipping activity from Southeast Asian countries such as Vietnam. The study emphasizes the threat posed by plastic debris as a transport medium, enabling invasive species to spread to new habitats. These invasions can disrupt ecosystem functions and diminish the valuable services those habitats provide (Kannan et al., 2023).
Abandoned, lost, or discarded fishing gear - such as ropes, nets, monofilament lines, and many others - can entangle marine animals, leading to strangulation, injury, restricted movement, and even death (Tekman et al., 2022).
In 2018, Lamb et al. conducted a large study across 159 coral reefs in the Asia-Pacific region, revealing that approximately 11.1 billion plastic items were entangled on these reefs. They projected a 40% increase by 2025, although current data to confirm this is unavailable. The study also found that plastic significantly raises the risk of coral diseases - by a factor of 20 - due to stress, such as light deprivation, tissue damage, release of toxic chemicals, and lack of oxygen, allowing pathogens to invade. Over time, this increased susceptibility could contribute to the death of coral reefs.
Given their ecological and economic importance, the vulnerability of coral reefs to plastic entanglement is especially concerning. Coral reef ecosystems support at least 25% of all marine species and are estimated to contribute approximately 2.7 trillion USD per year in ecosystem service value. However, global data show that between 2009 and 2018, the world lost around 14% of its coral, highlighting a significant decline in these vital ecosystems (Souter et al., 2021).
When it comes to terrestrial animals, less has been documented compared to marine species. However, Thrift et al. (2023), through a study utilizing data from rescue centers and population modeling, have identified the impact of plastic entanglement on the hedgehog population in Great Britain. Their model estimates that between 4,000 and 7,000 hedgehogs die each year as a result of plastic entanglement
2.1.8.3 Single-use-plastics (SUPs) & their negative impact
With approximately 144 million tons of plastic produced annually as single-use plastics (SUPs), they represent the largest share of plastic production, as shown in Figure 23. SUPs are designed to be used once and then discarded. These include, among other items, cups, food packaging, bags, bottles and straws (United Nations Environment Programme [UNEP], 2018). This section explores the main types of single-use plastics
and their environmental, health, and social impacts. The effects on animals and ecosystems, which were discussed in the previous section, will therefore not be addressed in detail here.
2.1.8.3.1
Plastic bags are widely used because they are lightweight, strong, inexpensive, and convenient for transporting goods. They require less energy and water to produce than alternatives like paper bags and occupy less space in landfills. However, the same traits that make them appealing - such as durability and low cost - also contribute to environmental problems when they're mismanaged. Their resistance to breakdown and difficulty to recycle means plastic bags can persist in the environment for decades (up to 1000 years), posing threats to ecosystems and contributing to long-term pollution (see 2.1.7.2Harmtowildlife). Due to their lightweight nature, plastic bags are easily carried by the wind, often ending up in the ocean or scattered across the land (United Nations Environment Programme [UNEP], 2018).
2.1.8.3.2
Foamed plastics, often referred to as ‘Styrofoam’, are widely used in food packaging due to their rigidity, light weight, and insulating properties that help keep food warm. They also make food easier to transport. However, a major concern with this material is that it contains toxic and potentially carcinogenic chemicals, such as benzene and styrene, which are known to harm the respiratory, nervous, and reproductive systems. These substances can leach into food during use. Moreover, when foamed plastics are burned, these toxic compounds are released in greater quantities, increasing both health and environmental risks (United Nations Environment Programme [UNEP], 2018). Styrofoam is frequently found on beaches and along shorelines, where it makes up a significant portion of marine litter. Wildlife is particularly affected, as Styrofoam breaks down into small particles that can obstruct airways, cause digestive issues, and even lead to cancer. These particles also contaminate the animals’ food and water sources, further threatening their survival (Miller et al., n.d.).
2.1.8.3.3
Disposable cups are commonly used in various settings, including offices, take-away restaurants and shops, parties, and schools. They are convenient because they’re inexpensive, require no maintenance, and are easy to use (van der Harst & Potting, 2013).
On a global scale, around 500 billion single-use beverage cups are consumed annually. These cups are among the most frequently littered items found on beaches worldwide. Like other mismanaged plastic waste, they play a major role in marine pollution, harming marine ecosystems and disrupting economic activities that depend on healthy oceans (United Nations Environment Programme [UNEP], 2021).
2.1.8.3.4
Every minute, one million plastic bottles are sold worldwide; as a result, they are among the most commonly found single-use plastic items on beaches (United Nations Environment Programme, 2020). The following figure shows information related to the consumption, sale, and recycling of plastic bottles.
2.1.8.3.5
An estimated 4 billion pieces of plastic cutlery are used annually in England alone. Of these, only 10% are recycled (Department for Environment, Food and Rural Affairs, 2023). Global usage data has yet to be reported.
2.1.8.4
There are many alternatives to the use of SUPs. For instance, recycled paper, bamboo, and corn-based plastics -which are biodegradable materials when composted- are available for food packaging. Additionally, reusable packaging options offer a practical and sustainable solution (Miller et al., n.d.).
Yadav et al. (2024) conducted a cradle-to-grave life cycle assessment focusing on reusable packaging, made of polypropylene (PP). Their study found that after just six uses, with recycling included, reusable packaging has a lower global warming potential (GWP) than disposable alternatives. This also means that if reusable packaging is only used once, its global warming potential (GWP) would be 315% higher than that of singleuse packaging in the recycling scenario, and 363% higher in the incineration scenario.
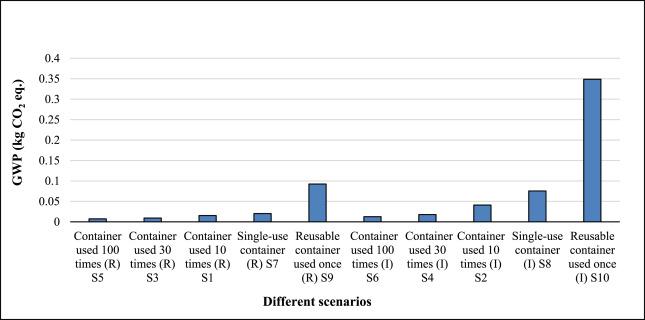
As seen in Figure 25, the results from the end-of-life (EoL) incineration option showed a different environmental impact compared to recycling. The analysis indicated that, in all scenarios, a reusable container used once had a higher global warming potential (GWP) than the single-use container. However, as the number of uses of the reusable container increased, the GWP decreased significantly. After 10 uses, the GWP of the reusable container was 46% lower than that of the single-use container. With 30 uses, the GWP decreased by an additional 56%, and with 100 uses, the GWP was 83% lower compared to a single-use container in the EoL incineration scenario (Yadav et al., 2024).
The study highlights that several factors, such as user behaviour, transportation method, and travel distance, can significantly influence the environmental outcomes. The authors emphasize the importance of promoting reusable food packaging systems and recommend establishing pick-up and return stations within walking distance to maximize sustainability benefits (Yadav et al., 2024).
Although PP has a lower GWP when used multiple times, it does not necessarily release fewer microplastics. A study by Du et al. (2020) analysed the abundance of microplastics in food containers made from polystyrene (PS), PP, polyethylene (PE), and polyethylene terephthalate (PET). The results (Figure 26) showed that PS released the most microplastics, followed by PP, then PE, and PET with the least.
Although less research is available on reusable cups, Garrido and Alvarez del Castillo (2007) conducted a comparable study during a large-scale event in Barcelona, evaluating both reusable and single-use cups made of polypropylene (PP), though differing in design and weight. Their findings showed that reusable cups need to be used more than 10 times to achieve a lower environmental impact than single-use alternatives. The majority of the environmental burden was attributed to the production of PP. It should be taken into account that the study by Garrido and Alvarez del Castillo (2007) is 18 years old, while the study by Yadav et al. (2024) is more recent and focuses on a different type of product. However, both studies examine reusable products made of PP, which makes the comparison still relevant despite the differences in time and application.
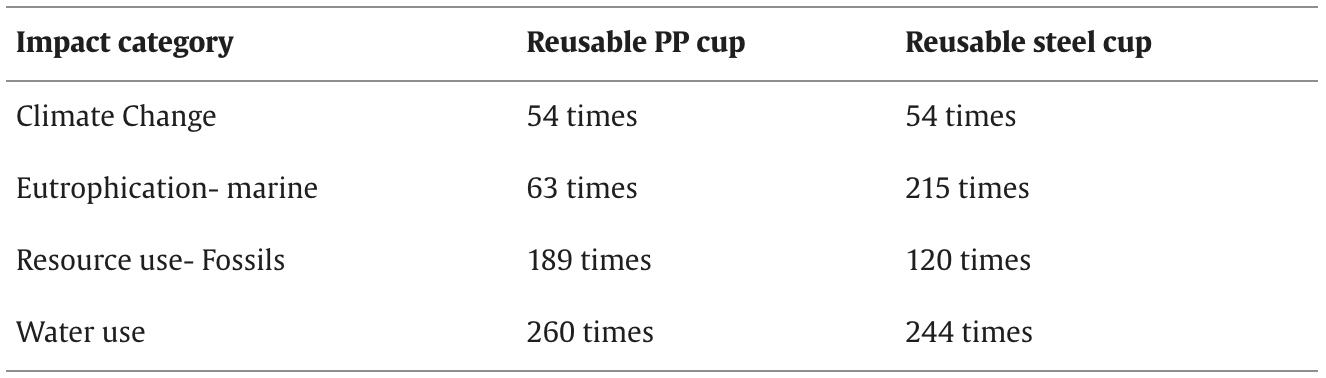
A more recent study by Anand et al. (2024) examined different reusable cup options in comparison to single-use paper cups. The authors found that a PP cup must be used at least 54 times to match or reduce the climate change impact of paper cups. In terms of water consumption, the PP cup would need to be used at least 260 times to have an equivalent or lower impact. An overview of these findings is presented in Figure 27.
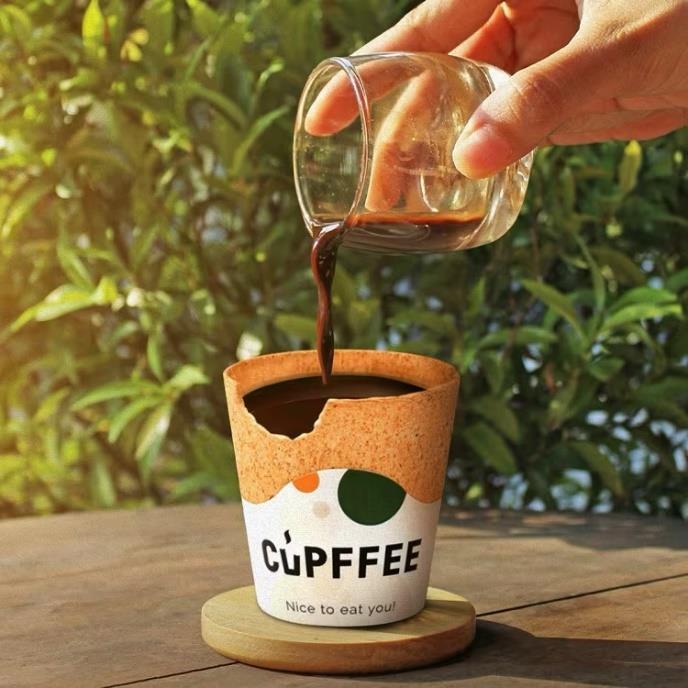
The study also conducted a life cycle assessment (LCA) of edible coffee cups (Figure 28). These cups were found to have production impacts that are 10 times greater than those of paper cups, primarily due to land use changes associated with the cocoa beans used for flavouring. However, it was noted that if the edible cups replace other edible products, such as cookies, their environmental impact would be minimal. Additionally, it was highlighted that edible cups could help reduce plastic litter, which could be particularly beneficial at festivals or outdoor cafes. The study concludes that further research is needed, and that in most cases, reusable cups remain the more sustainable option (Anand et al., 2024).
Biodegradation can also apply to plastic cutlery alternatives. For example, cutlery made from water hyacinth, reinforced with cellulose-rich materials such as banana fibre, sugarcane leaf, and waste paper, offers an environmentally friendly and functional option. These materials improve strength and moisture resistance. The cutlery demonstrated rapid biodegradation, with most samples disintegrating completely or losing 90% of their weight within 20 days (Harikrishnan et al., 2023).
Vietnam has recently introduced several legislative measures to tackle plastic waste pollution, particularly in the marine environment. In October 2018, the Vietnamese government passed Resolution No. 36-NQ/TW, which outlines the country’s strategy for sustainable marine development and includes objectives like reducing ocean plastic pollution. This resolution laid the groundwork for the development of the Law on Environmental Protection (2020) and the National Action Plan on Marine Litter (Van Daelen, 2024).
The Law on Environmental Protection, implemented in 2020, marked a significant step by introducing an Extended Producer Responsibility (EPR) system, requiring producers to manage the lifecycle of their products, including packaging and plastic waste. It also mandates the classification of household waste and sets a target for a 22% recycling rate for rigid PET packaging in its first three years (Van Daelen, 2024).
Further, Decree No. 08/2022/ND-CP, an elaboration of the Environmental Protection Law, establishes a roadmap for reducing and eventually banning non-biodegradable plastic bags and single-use plastics by 2031. The government is also focusing on educating the public, particularly students, about waste reduction through campaigns and information initiatives (Van Daelen, 2024).
The World Bank’s "Toward a National Single-Use Plastics Roadmap in Vietnam" report outlines a comprehensive strategy to reduce plastic pollution through a three-pillar approach: reducing plastic waste, improving waste collection, and creating value from waste reuse. These efforts are complemented by Vietnam’s National Action Plan for Marine Litter, which aims to significantly reduce marine plastic litter by 2030 (Van Daelen, 2024).
2.1.10.1 Four-forces model
To switch from disposable cups to reusable cups, behaviour will have to change. During a workshop organized by OVAM (Openbare Vlaamse Afvalstoffen Maatschappij), information was given about how to encourage the necessary societal transition regarding packaging. There are four forces that will play a role in the change towards a more sustainable alternative.
The first force is the gains you get from using the more sustainable product. The second force involves what the frustrations (pains) are with the reusable product. The third force relates to what causes you to stay with the current product (comforts). The final, fourth force is the anxieties/ barriers at the sustainable alternative (J. Craeghs, personal communication, 25 February 2025; De Bruyne, n.d.-b).
A good method can be “chunking”. This is a method for getting people to successfully change behavior. It tells you in very small steps how to get to the end, where the first step is so easy that you are much more likely to start the action. A trigger is hit in the brain that makes people want to finish what they started after the first step. This is one way that can help shift to more sustainable behaviors (J. Craeghs, personal communication, 25 February 2025; Groenewegen, n.d.).
According to Sun and He (2023), several factors influence people's intention to purchase SUPs. One of the most significant is normative social influence, which involves the pressure to meet others’ expectations in order to be accepted by a group. This means that if some individuals choose to stop buying SUPs, others may do the same to avoid feeling left out.
The study also highlights the role of informational social influence, where people rely on the opinions and advice of others to guide their choices. Friends and family, in particular, can have a strong impact on decisions about sustainable behaviour, like avoiding SUPs. If someone close recommends buying a product, the likelihood of purchase increases. Conversely, if they advise against buying SUPs, the individual’s intention to purchase them tends to decrease (Sun & He, 2023).
Third, positive anticipated emotions also influence consumer behaviour. When consumers recognize the environmental harm caused by purchasing SUPs, they may feel hesitant to buy them. Although these emotions may not lead to immediate behavioural change, they can gradually deepen as consumers reflect on the broader impact on society. Nevertheless, the research shows that informational social influence has a more significant and lasting effect. The behaviours and opinions of important others, such as friends and family, often outweigh environmental concerns. As a result, individuals may still choose to buy SUPs if those around them do, even when they are aware of the negative environmental impact (Sun & He, 2023)
2.1.10.3
A study conducted in the United States on the willingness to use reusable cups under financial incentives found that individuals with higher environmental involvement - for example, awareness of the resources used to produce disposable cups - were less influenced by financial incentives. In contrast, individuals with lower environmental involvement were more likely to be motivated by such incentives (Nicolau et al., 2022).
Another study by Sheppard et al. (2025) found that probabilistic rewards, such as a 10% chance to win a free coffee or a 5% chance to win a $5 gift card, can encourage greater use of reusable cups. However, it is worth noting that the study only collected data from cafés offering the rewards, not from those that did not.
Promoting social awareness is essential to changing consumer behaviour. Sustainable habits must become an integral part of daily life, supported by a variety of activities that raise awareness and educate individuals. Isolated campaigns or minimal changes in cultural attitudes toward environmental issues are insufficient to address the scale of the problem. Education plays a critical role in this process. Children, in particular, should be introduced to environmental topics from an early age and taught about them in an objective and engaging manner (United Nations Environment Programme [UNEP], 2018)
This research project aims to explore the potential for introducing reusable alternatives to single-use plastics (SUPs) at Quy Nhon University. The primary objective is to assess whether there can be a support base among students and staff for reducing SUPs by replacing them with reusable products, which aligns with the second level of Lansink’s ladder: reuse. Additionally, the study investigates the general level of awareness and knowledge regarding SUPs what they are, how they are used, and what happens to them after disposal.
To address the central research question “How can a support base for reducing SUPs at Quy Nhon University be established by raising awareness and offering reusable alternatives?”, we employed a mixed-method approach. The study combines quantitative data collection through surveys with qualitative insights obtained via informal discussions, guest lectures and green club activities. This approach allows us to measure certain behaviours and attitudes, as well as gain deeper understanding of the motivations, challenges, and perceptions related to plastic use and sustainability on campus.
2.1.1 Subquestion: What do participants already know about SUPs, and how do they perceive reusable alternatives?
As previously mentioned in order to better understand the attitudes, behaviours and challenges related to the use of reusable bottles and cups, a survey was conducted among the students and lecturers of QNU. 36 questions were initially prepared in English (Attachment 9.2.1 General survey in English). The survey questions varied and were divided into three sections: one focusing on personal information, another on general knowledge about SUPs, and a third assessing both awareness of and willingness to use reusable products. After that the survey was then translated into Vietnamese by “Vertaalbureau Perfect” (Attachment9.2.2GeneralsurveyinVietnamese).
After receiving the translation, the text was fine-tuned and clarified in collaboration with the Vietnamese team. The finalized survey was put into a Google form and was sent out to all students and staff at Quy Nhon University. A total of 605 responses of both students and staff members, such as lecturers were received.
The primary aim of this survey was to gather data on current practices concerning plastic consumption, as well as to assess the willingness of the university community to adopt more sustainable alternatives. This so that we could answer the research question “How can a support base for reducing SUPs at Quy Nhon University be established by raising awareness and offering reusable alternatives?”. Furthermore, the survey results were analysed using Excel to identify a target group to distribute reusable bottles and cups to
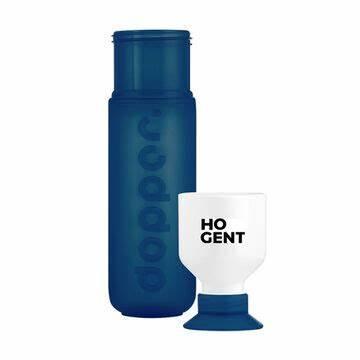
For the reusable bottles, Dopper bottles with the HOGENT logo were chosen. They are suitable for both hot and cold drinks. Additionally, they have a special feature that allows them to also be used as cups (Figure 29).
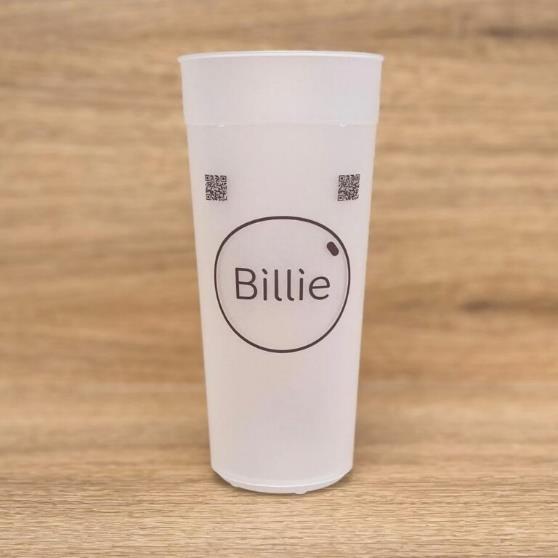
For the cups, the XXL Billie cups were chosen. These cups have a capacity of 650 ml and come with a lid. They are easy to clean and can be used for both hot and cold drinks. The decision to go with these cups was also influenced by the practice in Vietnam of adding a lot of ice to drinks, making a larger cup size necessary (Figure 30).
For the bottles: 30 participants who indicated that they did not currently own a reusable bottle but would be willing to use one if they had it, were selected.
For the cups: The distinction between occasional users (OU), who use a cup up to 5 times per week, and heavy users (HU), who use a cup at least 5 times per week was made. From these groups, 15 OU and 15 HU participants were selected. Their comfort using a reusable cup was also taken into consideration.
For both target groups, the aim was to select participants with diverse backgrounds in terms of gender, faculty, age, and role (student or staff member, such as lecturer, etc.). However, this turned out to be more challenging than expected. Despite several attempts to reach out, very few responses were received from the student population. As a result, many of our participants ended up coming from the Faculty of Natural Sciences, as the teachers supporting our project were familiar with these students and could contact them more easily. Given that around 79% of respondents of the survey were women, our target audience is mainly female. For the bottles group, the male-to-female ratio is 2:3. For the cups group, the ratio is 4:15.
In the bottles group, approximately 13% of participants are staff members, compared to around 17% in the cups group.
Our target audience was contacted and added to a Zalo group (a messaging platform). Two pickup times for the cups/bottles were then scheduled.
After the first three weeks, an initial survey for bottles (Attachment9.2.3Surveybottles: week1,2and3) and another one for cups (Attachment9.2.4Surveycups:week1,2and 3) was sent to gather feedback from participants on their experience. The survey aimed to identify potential barriers and success factors After the fourth week, a final survey was sent for bottles (Attachment9.2.5Surveybottles:week4) and cups (Attachment9.2.6 Surveycups:week4).
2.1.2 Subquestion: How do participants perceive reusable cups and bottles in terms of their positive and negative aspects, comforts, and anxieties?
To determine this, the four-forces model was used. Each week, the four factors were identified by distributing a short survey after the first three weeks and again after the fourth week, which included questions about pains, gains, comforts, and anxieties.
2.1.3 Subquestion: How effective is a 10% discount to increase the use of reusable cups/bottles?
In the fourth week, an incentive was introduced in partnership with QNU's canteen employees. Participants received a 10% discount when ordering a drink with their reusable cup or bottle.
The use of the discount was monitored by QNU canteen employees. Additionally, a short survey was distributed after the incentive week to gain insight into participants' behaviour toward reusable products, and whether the incentive had influenced that behaviour. This enabled a cross-check of the data, using two independent sources
2.1.4 Subquestion: How can broader environmental awareness be promoted among students and staff at QNU?
Over several days, posters about the problem of SUPs were created in cooperation with the Green Club. In addition, several guest lectures on waste management and the SUPs issue were given to students. A beach clean-up involving students and teachers was also organized on May 17, covering an area approximately 500 meters long.
The results presented in this chapter provide valuable insights into the existing awareness, habits, and potential barriers related to the use of reusable materials at the university. These findings serve as the basis for further analysis and recommendations on how to effectively promote more environmentally friendly behaviour within QNU.
The first three questions of the questionnaire collected personal contact information, such as the respondent’s name and phone number. This information was gathered solely for the purpose of contacting participants in case they were selected for further involvement in the project. These personal details were not included in the data analysis
and have been treated with strict confidentiality. The actual analysis of the results is therefore based only on the substantive questions that followed.
When examining the gender distribution of the 605 respondents, it becomes clear that a large majority, accounting for 78,85%, were female, while 20.99% were men. 1 student selected “other” when asked about their gender.
When examining the work distribution of the 605respondents, we see that23participants were lecturers, 1 person was laboratory staff, 2 were cleaning staff, 4 were office staff, and 575 were students
Among the participating 572 students (3 students did not answered), 44.58% are firstyear students, while 24.30% are fourth-year students (final-year students). Additionally, 16.96% of the respondents are third-year students, and the remaining 14.16% are second-year students.
The survey responses were collected from students and staff across various faculties. 605 people answered this question. The distribution of participants is as follows: the Faculty of Economics and Accounting had the highest number of respondents, with 217 respondents completing the survey. This was followed by the Faculty of Foreign Languages with 201 participants, and the Faculty of Natural Sciences with 93 participants. Other faculties had fewer respondents: the Faculty of Social Education (12), Faculty of Political Education (13), Faculty of Finance, Banking and Business Administration (14), Faculty of Physical Education (34), Faculty of Education (8), Faculty of Engineering and Technology (7), Faculty of Primary and Pre-School Education (2), and the Faculty of Mathematics and Statistics, which had only 1 respondent. The other 3 respondents chose ‘Other’ because they were office and cleaning staff, so they are not assigned to a specific faculty.
Important note: by 'multiple choice' (MC), we mean that several answer options were provided, and respondents were allowed to select more than one.
3.2.1
In this question, respondents were asked to indicate which materials they believed to be SUPs. They were allowed to select as many options as they considered appropriate. This approach allowed for a broader understanding of their knowledge and perceptions regarding different materials associated with SUPs. The multiple-choice format provided valuable insights into how well respondents could distinguish between various types of materials commonly linked to single-use plastics.


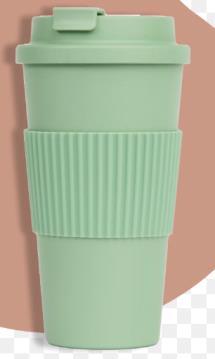

Figure 33: Compilation of six images illustrating single-use and reusable products used in the survey. Images sourced from Shutterstock, CNN, product websites, and stock photo providers (see figure references). Compilation created by the author, March 2025. Copyright remains with the original image owners.
The image above presents several options that participants were asked to evaluate. The correct answers were A, B, and D. Option A was correct because it showed disposable plastic cutlery. Option B was correct as it showed a disposable plastic plate. Option D was also correct, illustrating plastic straws.
Options C, E, and F were not correct. Option C displayed reusable coffee cups, option E showed reusable containers, and option F showed a reusable bottle. As these items are
designed for repeated use and do not fall under the category of single-use plastics, they were not considered the correct choices.
Out of 605 respondents, 438 respondents were able to correctly identify all the SUP items. 167 responded incorrectly. The most common mistake was selecting option (A, B, C, D), which occurred 55 times. In addition, various other types of errors were made in different ways.
The following table represents the percentage of respondents who incorrectly selected certain items when asked to identify all SUPs. These respondents chose at least one incorrect item, meaning they did not correctly identify the SUP items.
Table 1: Wrongly identified SUPs. Source: own results.
Wrongly identified SUP’s (Multiple choice) Responses in % (167 responses)
C (reusable cup)
E (reusable food container)
F (reusable bottle) 21%
The results show that the most selected incorrect item was the reusable cup with 56%.
Correlation between participants’ understanding of SUPs and their incentive-driven behaviour
Table 2: Correlation between the question where they had to select the SUP items (3.2.1) and the question about the best incentive to use their reusable cup (Table 19) Source: own results.
Multiple choice question Knows what SUPs are (438 participants) Doesn’t know what SUPs are (167 participants)
Reusable cup is already an incentive
when using reusable cup
drink when using the reusable cup
There appears to be a difference between participants who correctlyidentified what SUPs are and those who did not. Those with correct knowledge are more likely to view the reusable cup itself as an incentive and show less need for additional reductions. In contrast, participants who answered incorrectly tend to be more motivated by an immediate price reduction but are less influenced by other rewards such as receiving a free drink after ten uses.
3.2.3 Correlation between participants’ understanding of SUPs and perceived ease of bringing a reusable cup to QNU
Table 3: Correlation between the question where they had to select the SUP items (3.2.1) and the question about the ease to bring a reusable cup to QNU (Figure 43) Source: own results.
No multiple choice questions Knows what SUPs are (438 participants) Doesn’t know what SUPs are (167 participants)
Yes, easy to bring reusable cup to QNU
No, not easy to bring reusable cup to QNU
When asked about the ease of bringing a reusable cup to QNU, only a slight difference was observed between participants who correctly identified what SUPs are and those who did not.
3.2.4 What do the respondents think that happens with SUPs in Vietnam?
Respondents were given three possible answer options: A = The SUPs are collected and then recycled; B = They are collected and burned; C = They are collected and then dumped in a landfill. Additionally, respondents had the option to provide their own answer. Respondents were allowed to choose more than one option.
In the open-ended responses, 6.77% of the students who answered indicated that they had no idea at all, while 54.71% answered that they were certain the SUPs were simply dumped on a landfill 605 people answered the question.
A (Collected and Recycled), B (Collected and Burned) and C (Collected and Dumped on a landfill) are all right answers.
Table 4: Question about post-treatment of SUPs Source: own results.
Answer possibilities (Multiple Choice) Responses in % (605 respondents)
A (Collected and Recycled) 48,01%
B (Collected and Burned) 30,58%
C (Collected and Dumped on a landfill) 54,71%
Open Response 6,77%
A, B, C (Right Answer) 11%
3.2.5 Correlation between participants’ understanding of SUPs and their post-use handling and their incentive-driven behaviour
Table 5: Correlation between the question where they had to select the SUP items (3.2.1), the question about the posttreatment of SUPs (3.2.4), and the question about the best incentive to use their reusable cup (Table 19) Source: own results.
Multiple choice question
Knows what SUPs are, AND correctly knows what happens with SUPs in Vietnam (53 participants)
Doesn’t know what SUPs are, AND doesn’t know correctly what happens with SUPs in Vietnam (152 participants)
cup is already an
free drink when using the reusable cup 10 times
The total amount of participants (53 + 152) does not add up to 605 because some respondents were aware of what SUPs are but did not select all the correct options regarding their handling in Vietnam (A, B, C), and others selected those options without knowing what SUPs are.
Here, there is also a distinction between individuals with greater knowledge about SUPs and their post-use handling. Those who are more informed are more likely to view the reusable cup as a sufficient incentive. However, they still show a similar, or even greater, interest in additional rewards, such as a reduction or a free drink after 10 uses.
3.2.6 Correlation between participants’ understanding of SUPs and their post-use handling and perceived ease of bringing a reusable cup to QNU
Table 6: Correlation between the question where they had to select the SUP items (3.2.1), the question about the posttreatment of SUPs (3.2.4), and the question about the ease to bring a reusable cup to QNU (Figure 43) Source: own results.
No multiple choice questions
Knows what SUPs are, AND correctly knows what happens with SUPs in Vietnam (53 participants)
Doesn’t know what SUPs are, AND doesn’t know correctly what happens with SUPs in Vietnam (152 participants)
Yes, easy to bring reusable cup to QNU
No, not easy to bring reusable cup to QNU
There is also a slight difference between participants who understand what SUPs are and are aware of their post-use handling. These individuals find it easierto bring their reusable cup to QNU.
3.2.7 What do the respondents think Vietnam does to reduce SUPs?
The respondents primarily answered "yes" to the question “Do you think Vietnam tries the reduce the SUPs usage, give an example?”, either simply stating "yes" or providing an example. The examples given were diverse. This question had 605 respondents, 5.45% responded "yes" without providing any examples, 4.79% believed that nothing is happening, 4.22% did not know, and 1.48% did not answer at all.
A significant majority of 84.3% said "yes" with an example, indicating that they believe or are aware that Vietnam is taking action to reduce SUPs. However, many struggled to give concrete examples, which made it difficult to quantify their awareness accurately, especially given the open-ended nature of the question.
Among the examples provided, some participants mentioned recycling as a measure being taken. Others noted that the government appears to be promoting the use of reusable or eco-friendly alternatives, such as paper straws and reusable shopping bags.
3.2.8 What do the respondents think is the biggest negative effect of single-use plastics?
For this question there were 605 respondents
On a scale from 1 to 5, with 5 indicating the most severe negative impact, respondents rated the environmental impact of single-use plastics at an average of 4.16.
The impact on human health was rated at 3.99, showing that this is also seen as a major concern among the respondents.
The impact on animals was also considered significant, receiving an average score of 3.94.
Lastly when asked about the effect on their own ecological footprint, participants gave an average rating of 3.70.
3.2.9 What do the respondents do to reduce their use of SUPs?
Out of a total of 605 respondents, 80.5% answered "yes" to the question “Do you have alternatives to reduce your consumption of single used plastics? Can you give an example?” and provided an example. They often referred to actions such as recycling, using reusable bags, or other environmentally friendly practices. These examples, while diverse, reflect a general awareness that the respondents are taking steps to reduce their SUPs usage.
4.3% simply answered "yes" without offering any examples, making it difficult to assess their actual level of awareness. Meanwhile, 6.9% take no action, and 5.0% said they did not know what to do.
Additionally, 2.0% gave unclear or a nonsense answers (such as random letters), and 1.3% did not respond to the question at all.
3.2.10 Would the respondents like to make a poster with us?
83% of 605 people expressed interest in creating a poster with us, while the remaining participants would choose not to take part in this activity.
3.2.11 What is the best way for the respondents to learn about singleuse plastics?
The respondents were asked, "How would you prefer to learn more about SUPs?" They were given four possible options and could choose more than one. Option A was through interactive lessons, option B through videos, option C by creating posters, and option D by taking part in a quiz.
Table 7: Most effective way to learn about SUPs Source: own results.
Best way to learn about SUPs (Multiple Choice)
A (Interactive Lessons)
B (Videos)
C (Creating Posters)
D (Doing a Quiz)
Number of responses (%) (605 responses)
%
%
For this question there were 605 respondents. The most preferred method was watching videos, chosen with 63.6% answers. This was followed by interactive lessons (53.39%) and creating posters (41.62%). The least preferred method was doing a quiz, selected with just 25.26% of the answers.
For bottles, we asked if they already used a reusable bottle. The results are shown below (605 responses).
Figure 34: Current usage of reusable bottles. Source: own results.
After that, we asked the reasons to use a reusable bottle in a multiple-choice (MC) question (450 responses).
Table 8: Reasons to use a reusable bottle Source: own results.
And reasons not to use a reusable bottle, also MC (210 responses).
Table 9: Reasons not to use a reusable bottle Source: own results.
I don’t like them
I don’t trust the quality of the water refillstations
I don’t know where the water refill-stations are
The potential use of the reusable bottle was part of the previous question (reasons not to use a reusable bottle), also MC (210 responses).
Table 10: Potential use of a reusable bottle Source: own results. Doesn’t have a reusable bottle, but would use it if they had one
Doesn’t have a reusable bottle, and wouldn’t use it if they had one 21%
Some responses were provided that were not included in the multiple-choice options, but these were so few that they were excluded from the analysis.
In the case of straws, unlike with bottles, we began by asking about the use of disposable ones. The following are the results from the survey (605 responses).
Straw with every drink Straw with most of their drinks
Straw with some of their drinks No straw
The reason for the use of disposable straws, MC (605 responses).
Table 11: Reasons to use disposable straws Source: own results.
After that, we asked if they would use more sustainable straws (605 responses).
Would you use more sustainable straws (e.g. bamboo,…)?
Yes No Sometimes I don't use straws
Figure 36: Potential use of sustainable straws. Source: own results.
The reason for the use of more sustainable straws, MC (551 responses).
Table 12: Reasons to use more sustainable straws Source: own results.
For bags, we asked them if they use reusable bags and if they would use them if QNU would offer them. These are the results from the survey (both questions have 605 responses).
37: Current usage of reusable bags. Source: own results.
If QNU had reusable bags, would you use them?
Figure 38: Potential use of reusable bags. Source: own results.
Reasons to use reusable bags, MC (585 responses).
Table 13: Reasons to use reusable bags Source: own results.
environmental impact
(they last longer)
(saves money in the long run)
(often more spacious)
Reasons to use plastic bags, MC (148 responses).
Table 14: Reasons to use plastic bags Source: own results.
For cutlery, we asked them if they already used reusable cutlery, and if they would use it if QNU would offer it. These are the results from the survey (both questions have 605 responses).
Figure 39: Current usage of reusable cutlery. Source: own results.
If QNU had reusable cutlery, would you use it?
Yes No, I prefer plastic cutlery
Figure 40: Potential use of reusable cutlery. Source: own results.
Reasons to use reusable cutlery, MC (558 responses).
Table 15: Reasons to use reusable cutlery Source: own results.
Reasons to use plastic cutlery, MC (171 responses).
Table 16: Reasons to use plastic cutlery Source: own results.
Convenience (lightweight, disposable…) 65%
Cost-effective (often free or very cheap) 17%
Hygiene (discarded after use, so less risk of contamination because of improper cleaning) 20%
Lack of alternatives (reusable cutlery is not everywhere available) 31%
Some responses were provided that were not included in the multiple-choice options, but these were so few that they were excluded from the analysis.
For cups, we asked them how many times they use disposable cups in QNU and if they would use reusable cups if QNU would offer them. These are the results from the survey (both questions have 605 responses).
If QNU had reusable cups, would you use them?
Figure 42: Potential use of reusable cups. Source: own results.
Reasons to use a reusable cup, MC (564 responses).
Table 17: Reasons to use a reusable cup Source: own results.
To reduce environmental impact
Because it will be obligatory in the future
way it looks
Because I don’t like single-use plastic cups
Reasons to use plastic cups, MC (155 responses).
Table 18: Reasons to use plastic cups Source: own results.
Some responses were provided that were not included in the multiple-choice options, but these were so few that they were excluded from the analysis.
In this question we asked the ease to bring a reusable cup to QNU and what they think the best system would be (both questions have 605 responses).
Is it easy for you to always bring your reusable cup (if you had one) to QNU?
43: Potential ease of bringing reusable cup to QNU. Source: own results.
44: Best reusable cup system. Source: own results.
Incentives to use a reusable cup, MC (605 responses).
Table 19: Incentives to use reusable cups Source: own results.
Some responses were provided that were not included in the multiple-choice options, but these were so few that they were excluded from the analysis.
After asking separately about the reasons for using or avoiding each SUP item, we also asked participants what they see as the general benefits of using reusable products. MC, (605 responses)
Table 20: Reasons, in general, to use reusable products Source: own results.
To reduce environmental impact
To reduce negative impact on animals
To improve air quality
Decreases global warming
Some responses were provided that were not included in the multiple-choice options, but these were so few that they were excluded from the analysis.
We will focus specifically on bottles and cups, as these are central to our project. However, we also gained insights into the use of straws, bags, and cutlery among students, including the reasons behind their choices. This information may prove useful for future students.
By applying the four-forces model described in Section 2.1.10 Behaviour, we identified the following insights, based on the results of the smaller surveys distributed to our target audience.
For the bottles, we received 24 (out of 30) responses for all questions. We asked them where they used the bottle, MC.
Table 21: Places where they used the reusable bottle, results from week 1, 2 and 3 Source: own results.
Only at the University
at home
At home and on the University
On the beach
In a (coffee) bar
All the above 8%
I did not use the bottle
Four forces model applied on bottle users, MC.
Table 22: Four forces model applied on bottle users, results week 1,2 and 3
Source: own results.
Gains
- I save money because you no longer need to buy plastic bottles: 33%
- I contribute to reducing plastic waste: 75%
- I can always refill water – convenient and healthy: 63%
- I feel more conscious and environmentally friendly: 67%
- I find reusable bottles more stylish and personal compared to disposable ones: 42%
Comforts (for disposable plastic cups)
- Plastic bottles are available everywhere: 54%
- I do not have to worry about cleaning them: 17%
- I can throw them away after use: 33%
- It is standard, everyone uses a plastic bottle: 42%
- I have to remember to bring it with me everywhere I go: 75%
- It takes time and an effort to clean the bottles: 29%
- I find the reusable bottle too big and heavy: 0%
- I find it difficult to find a place to refill my bottle: 8%
- I am not motivated to use the reusable bottle: 4%
- Other: not convenient for beverages that are already in bottles (Coca-Cola): 4%
Anxieties
- I don’t trust the water quality in Vietnam: 8%
- If I forget my bottle, I can’t have any water: 71%
- People are going to look at me differently because I don’t use a plastic bottle (social pressure): 8%
- A reusable bottle is not hygienic enough: 29%
We asked them if they used, in general, less plastic bottles now they have a reusable bottle. The answer is shown below.
Did you use less plastic bottles?
Figure 45: Plastic bottle usage after 3 weeks in our project. Source: own results.
We asked them how they think we can encourage students to use the reusable bottle, MC
Table 23: How to encourage the use of reusable bottles, results week 1, 2 and 3 Source: own results.
guest lectures
For the cups, we received 22 (out of 30) responses for all questions, of which 11 OU (occasional users) and 11 HU (heavy users). MC
Where did OU use the cup? MC
Table 24: Places where OU used the reusable cup, results from week 1, 2 and 3 Source: own results.
I did not use the cup
Where did HU use the cup? MC
Table 25: Places where HU used the reusable cup, results from week 1, 2 and 3 Source: own results.
In a (coffee) bar 0%
All the above
I did not use the cup
Four-forces model applied on OU, MC
Table 26: Four forces model applied on OU, results week 1, 2 and 3 Source: own results.
Gains
- I save money because you no longer need to buy plastic cups: 73%
- I contribute to reducing plastic waste: 73%
- I feel more conscious and environmentally friendly: 82%
- I find reusable cups more stylish and personal compared to disposable ones: 64%
Comforts
- Plastic cups are available everywhere: 64%
- I don’t have to worry about cleaning the plastic cup: 55%
- I can throw the cup away after use: 36%
- It is normal to use a plastic cup, everybody does it: 18%
Four-forces model applied on HU, MC
Pains
- I have to remember to bring it with me everywhere I go: 55%
- It takes time and an effort to clean the cup: 18%
- I find the reusable cup too big: 27%
- I am not motivated to use the reusable cup: 0%
- Other: cup does not close completely: 18%
Anxieties
- If I forget my cup, I can’t have any coffee/drinks: 73%
- People are going to look at me differently because I don’t use a plastic cup (social pressure): 18%
- A reusable cup is not hygienic enough: 9%
Table 27: Four forces model applied on HU, results week 1, 2 and 3 Source: own results.
Gains
- I save money because you no longer need to buy plastic cups: 45%
- I contribute to reducing plastic waste: 36%
- I feel more conscious and environmentally friendly: 82%
- I find reusable cups more stylish and personal compared to disposable ones: 36%
Pains
- I have to remember to bring it with me everywhere I go: 55%
- It takes time and an effort to clean the cup: 0%
- I find the reusable cup too big: 9%
- I am not motivated to use the reusable cup: 0%
- Other: cup does not close completely: 27%
Comforts
- Plastic cups are available everywhere: 64%
- I don’t have to worry about cleaning the plastic cup: 27%
- I can throw the cup away after use: 9%
- It is normal to use a plastic cup, everybody does it: 45%
Anxieties
- If I forget my cup, I can’t have any coffee/drinks: 45%
- People are going to look at me differently because I don’t use a plastic cup (social pressure): 36%
- A reusable cup is not hygienic enough: 18%
- Other: harmful for health when used with hot beverages: 9%
Overall, OU participants see more benefits in using the reusable cup compared to HU participants.
For both groups, about half mention that forgetting to bring the cup is a common difficulty. Cleaning the cup poses no issue at all for HU, while OU report some minor inconvenience. Just under one-third of OU consider the cup too big. The fact that the cup cannot be fully closed is seen as a minor issue by both groups.
Both groups appreciate the convenience of plastic cups being available everywhere. Additionally, OU find it easier than HU that disposable cups can be thrown away immediately without needing to be cleaned. For HU, about half feel comforted by the normalization of disposable cup use, whereas for OU this applies to less than a quarter.
When it comes to concerns, the main one for both groups is forgetting the reusable cup. HU experience twice as much social pressure when using a reusable cup compared to OU. We asked them if they used, in general, less plastic cups now they have a reusable cup. The answer is shown below (HO and OU together).
Figure 46: Plastic cup usage after 3 weeks in our project. Source: own results.
The responses were also roughly split 50-50 between OU and HU.
We asked them (OU and HU) how they think we can encourage students to use the reusable cup. MC
Table 28: How to encourage the use of reusable cups, results week 1, 2 and 3 Source: own results.
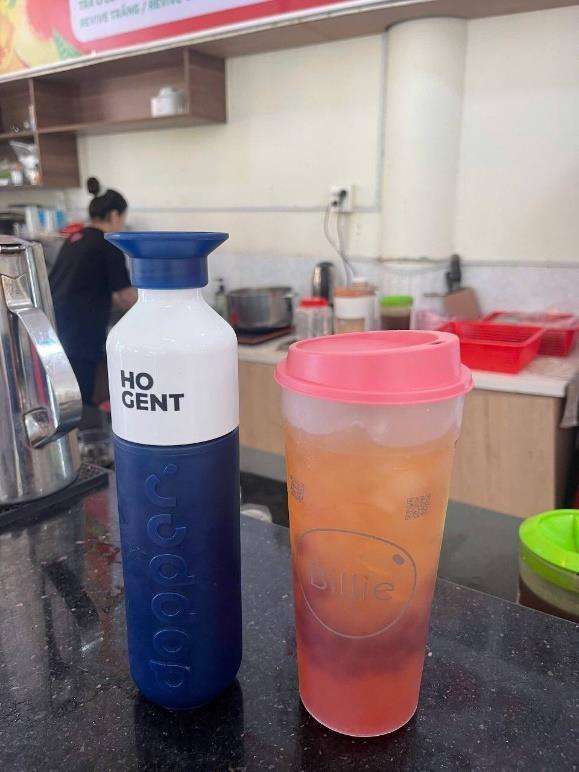
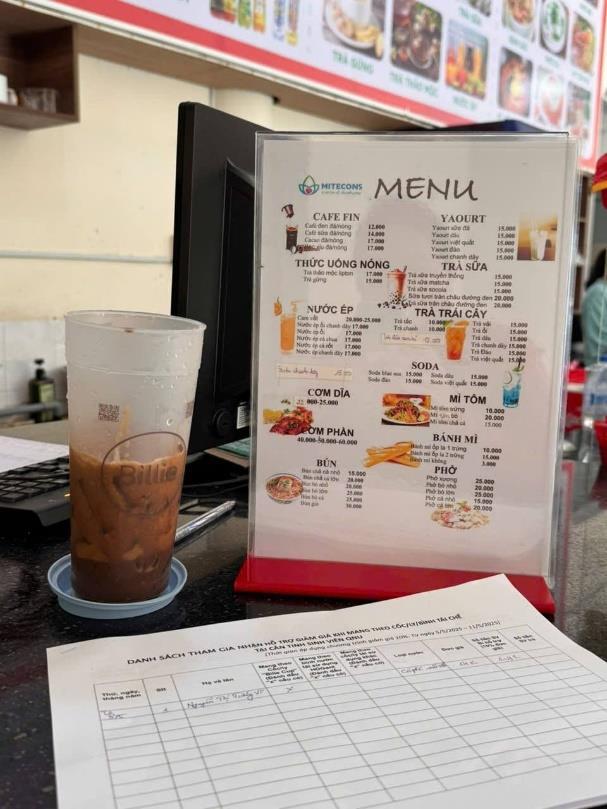
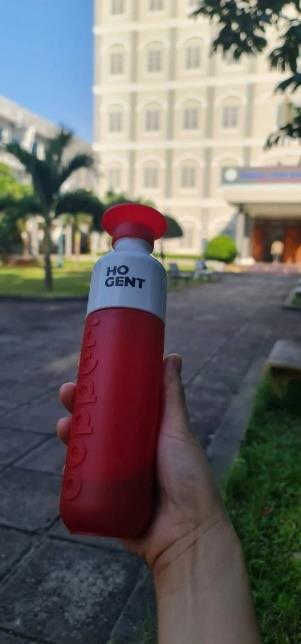
By applying the four-forces model described in Section 2.1.10 Behaviour, we identified the following insights, based on the results of the smaller surveys distributed to our target audience.
For the bottles, we received 22 (out of 30) responses for all questions. We asked them where they used the bottle. MC
Table 29: Places where they used the reusable bottle, week 4. Source: own results.
Only at the University
at home
home and on the University
In a (coffee) bar
I did not use the bottle
Four forces model applied on bottle users, MC.
Table 30: Four-forces model applied on reusable bottle users, results week 4. Source: own results.
Gains
- I save money because you no longer need to buy plastic bottles: 64%
- I contribute to reducing plastic waste: 82%
- I can always refill water – convenient and healthy: 0%
- I feel more conscious and environmentally friendly: 73%
- I find reusable bottles more stylish and personal compared to disposable ones: 36%
Comforts (for disposable plastic bottles)
- Plastic bottles are available everywhere: 36%
- I do not have to worry about cleaning them: 5%
- I can throw them away after use: 32%
Pains
- I have to remember to bring it with me everywhere I go: 64%
- It takes time and an effort to clean the bottles: 32%
- I find the reusable bottle too big and heavy: 5%
- I find it difficult to find a place to refill my bottle: 0%
- I am not motivated to use the reusable bottle: 0%
Anxieties
- I don’t trust the water quality in Vietnam: 0%
- If I forget my bottle, I can’t have any water: 77%
- It is standard, everyone uses a plastic bottle: 23%
- People are going to look at me differently because I don’t use a plastic bottle (social pressure): 5%
- A reusable bottle is not hygienic enough: 9%
We asked them if they used, in general, less plastic bottles now they have a reusable bottle. The answer is shown below.
Did you use less plastic bottles?
Yes No
Figure 50: Plastic bottle usage, week 4 into our project. Source: own results.
We asked them how they think we can encourage students to use the reusable bottle, MC Table 31: How to encourage students to use the reusable bottle, results week 4. Source: own results.
guest lectures
videos about the bottle
posts on social media
posters in QNU
We asked them if they used the bottle more often this week, because there was a discount in the canteen
Did you use the reusable bottle more often because of the 10% discount?
Yes No
51: Plastic bottle usage, week 4 into our project, taking the incentive into account. Source: own results.
Throughout the week, the canteen staff recorded 3 individuals (14%) who took advantage of the discount by using their reusable bottle.
We asked them if a deposit system would be better instead of a personal bottle:
Would you prefer a deposit system in the canteen for the bottles?
Yes No
Figure 52: Preferability of a deposit system for bottles, week 4 into our project. Source: own results.
For both questions - whether they would recommend the reusable bottle to friends and family, and whether they intended to keep using it in the future - 100% of respondents answered 'yes'.
For the cups, we received 14 (out of 30) responses for all questions, of which 10 OU and 4 HU. MC
Where did OU use the cup?
Table 32: Places where OU used the reusable cup, results week 4. Source: own results. Only at the University
Where did HU use the cup?
Table 33: Places where HU used the reusable cup, results week 4. Source: own results.
Only at the University
Only at home
home and on the University
I did not use the cup
Four-forces model applied on OU, MC
Table 34: Four-forces model applied on OU, results week 4. Source: own results.
Gains
- I save money because you no longer need to buy plastic cups: 70%
- I contribute to reducing plastic waste: 60% - I feel more conscious and environmentally friendly: 60%
- I find reusable cups more stylish and personal compared to disposable ones: 30%
Pains
- I have to remember to bring it with me everywhere I go: 50% - It takes time and an effort to clean the cup: 50% - I find the reusable cup too big: 30 %
- I am not motivated to use the reusable cup: 10%
Comforts
- Plastic cups are available everywhere: 30%
- I don’t have to worry about cleaning the plastic cup: 20%
- I can throw the cup away after use: 40%
- It is normal to use a plastic cup, everybody does it: 10%
Four-forces model applied on HU, MC
Anxieties
- If I forget my cup, I can’t have any coffee/drinks: 70%
- People are going to look at me differently because I don’t use a plastic cup (social pressure): 10%
- A reusable cup is not hygienic enough: 20%
Table 35: Four-forces applied on HU, results week 4. Source: own results.
Gains
- I save money because you no longer need to buy plastic cups: 50%
- I contribute to reducing plastic waste: 50%
- I feel more conscious and environmentally friendly: 75%
- I find reusable cups more stylish and personal compared to disposable ones: 25%
Comforts
- Plastic cups are available everywhere: 50%
- I don’t have to worry about cleaning the plastic cup: 25%
- I can throw the cup away after use: 25%
- It is normal to use a plastic cup, everybody does it: 0%
- I have to remember to bring it with me everywhere I go: 100%
- It takes time and an effort to clean the cup: 100%
- I find the reusable cup too big: 25 %
- I am not motivated to use the reusable cup: 50%
Anxieties
- If I forget my cup, I can’t have any coffee/drinks: 100%
- People are going to look at me differently because I don’t use a plastic cup (social pressure): 25%
- A reusable cup is not hygienic enough: 0%
In general, OU participants tend to perceive more benefits in using the reusable cup than HU participants
For both groups, forgetting and cleaning the reusable cup plays a significant role, particularly for the HU group.
The convenience of disposable plastic cups still contributes to their overall comfort. The fear of forgetting their reusable cup is the most prominent source of anxiety for both groups.
We asked them if they used, in general, less plastic cups now they have a reusable cup. The answer is shown below (HO and OU together).
Did you use less plastic cups? Yes No
Figure 53: Plastic cup usage, week 4 into our project. Source: own results.
We asked them (OU and HU) how they think we can encourage students to use the reusable cup. MC
Table 36: How to encourage students to use the reusable cup, results week 4. Source: own results.
We asked them if they used the cup more often this week because of the discount in the canteen.
Did you use the reusable cup more often because of the 10% discount?
Yes No
Figure 54: Plastic cup usage, week 4 into our project, taking the incentive into account. Source: own results.
Throughout the week, the canteen staff recorded 3 individuals (21%) who took advantage of the discount by using their reusable cup.
We asked them if a deposit system would be better instead of a personal cup:
Would you prefer a deposit system for the cups in the canteen?
Yes No
Figure 55: Preferability of a deposit system for cups, week 4 into our project. Source: own results.
For the question if they (OU and HU) would recommend the reusable cup to friends or family, 93% answered ‘yes’ and 7% answered ‘no’.
For the question if they (OU and HU) will keep using the reusable cup in the future, 100% answered ‘yes’.
Table 37: Usage numbers of the reusable bottle, results week 1,2 and 3. Source: own results.
Reusable bottle used how many times?
of people (24 responses)
Week 1, 2 and 3 (no incentive)
Table 38: Usage numbers of the reusable bottle, results week 4. Source: own results.
Reusable bottle used how many times?
4 (incentive)
of people (22 responses)
Evolution in reusable bottle usage
Figure 56: Evolution in the use of reusable bottles through 4 weeks. Source: own results.
Table 39: Usage numbers of the reusable cup (OU and HU), results week 1,2 and 3. Source: own results.
Reusable cup used how many times?
of people (22 responses)
Week 1, 2 and 3 (no incentive)
Table 40: Usage numbers of the reusable cup (OU and HU), results week 4. Source: own results.
Reusable cup used how many times?
of people (14 responses)
Figure 57: Evolution in the use of reusable cups (OU and HU) through 4 weeks. Source: own results.
Table 41: Usage numbers of the reusable cup (HU), results week 1,2 and 3. Source: own results.
Reusable cup used how many times? % of people (11 responses)
Week 1, 2 and 3 (no incentive)
to 3 times
Table 42: Usage numbers of the reusable cup (HU), results week 4. Source: own results.
Reusable cup used how many times? % of people (4 responses) Week 4 (incentive)
Evolution in reusable cup usage: HU
58: Evolution in the use of reusable cups (HU) through 4 weeks. Source: own results.
Table 43: Usage numbers of the reusable cup (OU), results week 1,2 and 3. Source: own results.
Reusable cup used how many times?
of people (11 responses)
Week 1, 2 and 3 (no incentive)
to 3 times
Table 44: Usage numbers of the reusable cup (OU), results week 4. Source: own results.
Reusable cup used how many times?
of people (10 responses)
59: Evolution in the use of reusable cups (OU) through 4 weeks. Source: own results.
3 posters were created, see attachment9.3.1WasteClassificationPoster, attachment 9.3.2 Awareness Poster in English and attachment 9.3.3 Awareness Poster in Vietnamese
A total of 35.1 kg of trash was collected during the beach clean-up, with plastic bags making up the largest portion, weighing 13.3 kg.
Firstly, we would like to note that the results were based on a survey we distributed, and there is a possibility that some participants may not have answered honestly. Additionally, during our cross-checking in the fourth week, we observed that socially desirable responses were frequently given, which could have influenced the results. This may also have been the case with the other surveys. Our target group consisted of 30 participants for the cups and 30 for the bottles. However, not all of them consistently responded to the surveys. Combined with the already limited size of the target group, this may have affected the representativeness of our results. Lastly, our project spanned only four weeks, which may not have been sufficient to draw precise conclusions.
Billie Cup cups likely contain a higher abundance of microplastics (2.1.7.4Alternativesto SUPs) because they are made from polypropylene. While it has not yet been proven that microplastics are harmful to human health, if such evidence is found, these cups may not be ideal. However, in terms of reducing SUPs, they still serve their purpose.
The findings of the survey reveal a strong willingness among students and staff to adopt more sustainable behavior, particularly regarding to reducing their consumption of SUPs. More than 80% of the respondents already incorporate sustainable habits in their daily lives, such as using reusable bags and bottles A similar proportion indicated interest in participating in awareness-raising activities, such as making educational posters, highlighting the need towards an active environmental engagement with the respondents
The primary motivation driving students and staff to choose sustainable alternatives to SUPs is their concern for the environment, which received an average rating of 4.16 out of 5. This was followed by considerations related to personal health and convenience, which were rated 3.99 out of 5. These figures underline the significance of both ecological awareness and practical benefits in shaping student and staff behavior.
While respondents generally demonstrate a fair level of understanding regarding what SUPs are, there are some misconceptions. 167 students could not identify SUPs correctly. In addition, several practical barriers obstruct sustainable choices. These include a big reliance on disposable plastics, insufficient access to reliable information about waste-related issues, and a limited availability of reusable alternatives.
Educational interventions are therefore essential and should be repeated over time to reinforce understanding and promote long-term behavioral change. Students indicated a preference for learning through videos and interactive lessons. This preference was also observed during guest lectures, where many students showed enthusiasm and eagerness to learn. However, the sessions also revealed a number of gaps in knowledge, particularly concerning basic environmental facts that are generally considered common knowledge in Europe.
Furthermore, the majority of participants believe that the Vietnamese government is actively addressing the problem of SUPs, despite demonstrating little to no concrete knowledge of specific laws or actions being implemented. This shows that people trust the government, but better communication and openness from the government could help people understand and trust them even more.
Overall, the report shows how important it is to give clear, interesting education and easy long-lasting reusable alternatives. These are essential to empower students and staff to make environmentally responsible choices.
Regarding bottles, weconclude thatsupportwithin QNU is more likely if a depositsystem is introduced rather than relying on personal bottles. In week 4, we asked our target group whether they preferred a deposit system, and 91% of the 22 respondents said “yes.” The main inconvenience was having to remember to bring them everywhere. With a deposit system, this becomes less of a concern.
Over the four-week period, there was a positive trend in the use of reusable bottles. Participants highlighted the biggest ‘gains’ as reducing plastic waste and feeling more environmentally conscious. However, the 10% discount for using a reusable bottle had minimal impact.
-For the cups, there was a different trend between HU and OU over the four-week period. For HU, a negative trend was observed only when usage was more than 10 times a week For OU, a negative trend appeared when usage was between 6 to 10 times a week. Overall, most cup usage fell within the 1 to 3 times a week range. For usage levels of 4 to 6 times and more than 10 times a week, there is little to no noticeable difference. The only consistent negative trend occurs with 6 to 10 times a week usage.
For the cups, we conclude that over the four-week period, OU participants generally perceived more benefits in using the reusable cup than HU participants. However, both groups faced similar barriers.
In weeks 1 to 3, cleaning the reusable cup was seen as a minor inconvenience by OU participants, while HU participants reported no issue with it. By week 4, cleaning became more relevant for both groups, particularly for HU. The convenience and availability of disposable plastic cups remained an important factor contributing to comfort for both groups. OU participants especially appreciated the ease of being able to discard the cup without needing to clean it. A notable concern for both groups was the fear of forgetting the reusable cup, which consistently contributed to anxiety. HU participants experienced twice as much social pressure when using a reusable cup compared to OU participants. Despite these concerns, attitudes remained relatively stable: OU participants continued to see more value in the reusable cup overall.
We recommend implementing a deposit system for cups in the canteen. In addition, standardizing reusable cups could help prevent users from feeling observed or judged by others, especially if accompanied by a ban on disposable cups.
People with greater awareness considered reusable cups sufficient on their own, though they indicated they would still appreciate a financial incentive (see sections 3.2.2 and 3.2.5). However, when such an incentive was introduced, it was barely used, suggesting that the actual need for it may be lower than expected.
As a general conclusion for all reusable products, we found that a 10% discount for using a reusable cup or bottle was not an effective incentive. Therefore, we recommend:
1. Focusing on raising awareness about the environmental impact of SUPs and what happens to them after disposal. While there is a strong willingness to use reusable bottles and cups, various practical barriers can hinder consistent use.
2. Introducing a deposit system, which could help overcome these barriers, build broader support within QNU, and potentially lead to a reduction in SUPs usage. For disposable cups, this system could potentially be supported by a ban on their use at QNU.
To improve the current waste management system at Quy Nhon University, the following actions are proposed. The task can be performed by both university staff and future HOGENT students. These recommendations aim to support the transition towards more sustainable waste practices and reduce the environmental footprint of the campus. Divided into short-, medium-, and long-term priorities. Each point contributes to a better waste management and environment at the QNU.
6.1 Recommendations on short term
- Hang educational posters above all trash bins to raise awareness about proper waste sorting.
- Buy the new color-coded bins and distribute them over the whole university, according to the detailed plan we have written during our internship. In this plan, we have mapped all existing waste bins on campus, drawn key conclusions, and proposed practical solutions. We also identified the optimal locations for the new color-coded bins and determined how many are needed. It is crucial that these new bins are installed as soon as possible to ensure the successful implementation and smooth progress of the waste management project. This plan is named as ‘Bin Tour QNU’ and can be found on Teams >HWT_Bachelor Milieu en duurzaamheidsmanagement > Bestanden > Stage QNU – HOGENT > 2024-2025 > Gil & Indy
- Distribute a digital guide with the updated sorting rules to all students via email or online platform.
6.2 Recommendations on medium term
- Organize lectures where you can teach students how to correctly sort their waste.
- Ensure and check that all bins are placed in strategic and visible locations to encourage correct usage.
- Incorporate lessons on environmental issues into the student curriculum to raise general awareness.
- Host regular beach clean-up events to engage students and foster environmental responsibility.
- Consistently develop new awareness posters and actively involve students in the creation process for greater impact and engagement.
- See if a global deposit system with reusable cups/bottles is possible, and in which form.
- Seek potential buyers or recycling partners for materials like styrofoam and other waste streams that currently accumulate on campus for long periods.
- Do research on the potential use of other reusable alternatives in QNU.
- Periodically assess the placement of waste bins to ensure they remain in the most effective locations.
- Conduct regular waste bin audits to monitor sorting behaviour and identify areas for improvement.
Koops, E. (2023, November 27). Vietnamoorlog(1955–1975)-Oorzaken,samenvatting& gevolgen. Historiek. Retrieved from https://historiek.net/vietnamoorlog-oorzakensamenvatting-gevolgen/76855/
Hickey, C. G., Buttinger, J., Osborne, E. M., Duiker, J. W., Turley, S. W., Jamieson, L. N. (2025, April 29). Vietnam | History, Population, Map, Flag, Government, & Facts. Encyclopedia Britannica. Retrieved from https://www.britannica.com/place/Vietnam/Vietnam-under-Chinese-rule
UNESCO World Heritage Centre. (n.d.). HaLongBay-CatBaarchipelago. Retrieved from https://whc.unesco.org/en/list/672
Vietnam: buigzaam als bamboe - Joop - BNNVARA. (n.d.). Joop. Retrieved from https://www.bnnvara.nl/joop/artikelen/vietnam-buigzaam-als-bamboe
Nguyen, N. (2024, July 24). VietnamaimsforUS$7,500inGDPpercapitaby2030. The Saigon Times. Retrieved from https://english.thesaigontimes.vn/vietnam-aims-forus7500-in-gdp-per-capita-by-2030/
Tuan, V. (2022, November 28). Vietnamresetsmodernizationpushwithneweconomic restructuring targets. VnExpress International. Retrieved from https://e.vnexpress.net/news/news/vietnam-resets-modernization-push-with-neweconomic-restructuring-targets-4541602.html
Mrowiński, R. (2023). Vietnamese cultural characteristics: A regional comparative analysis. International Journal of Advanced Multidisciplinary Research and Studies. Retrieved April 7, 2025, from https://www.researchgate.net/publication/376950644_Vietnamese_cultural_characteri stics_A_regional_comparative_analysis
Cao, T. S. (2021). Rural lifestyle in Vietnam – Values and drawbacks. Journal of Philosophy, Culture and Religion, 56, 9–14. https://www.iiste.org/Journals/index.php/JPCR/article/view/56194/58033
Huyen Thi Thanh Nguyen, C. V., & Nguyen, C. V. (2020). TheEffectofEconomicGrowth andUrbanizationonPovertyReductioninVietnam. Journal of Asian Finance, Economics and Business. https://doi.org/10.13106/jafeb.2020.vol7.no7.229
Festivals are vital to cultural development. (n.d.). vietnamnews.vn. Retrieved from https://vietnamnews.vn/life-style/1166466/festivals-are-vital-to-culturaldevelopment.html
Portal B. D. (2022, January 15). OverviewofBinhDinh. binhdinh.gov.vn. Retrieved from https://binhdinh.gov.vn/en/home/overview-of-binh-dinh
The Editors of Encyclopaedia Britannica. (1998b, July 20). Champa|Indochina,Map,& History. Encyclopedia Britannica. Retrieved from https://www.britannica.com/place/Champa-ancient-kingdom-Indochina
Vietnam Investment Review. (2025, February 5). Binh Dinh province ready to rise up. Vietnam Investment Review. Retrieved from https://vir.com.vn/binh-dinh-provinceready-to-rise-up-122339.html
The Editors of Encyclopaedia Britannica. (1998, July 20). QuiNhon|Coastalcity,central Vietnam, beaches. Encyclopedia Britannica. Retrieved from https://www.britannica.com/place/Qui-Nhon
ĐỘNG
PHÁT ĐẠT. (2022, February 6). A shortage of world-class hospitality properties in Quy Nhon City. Retrieved from https://www.phatdat.com.vn/en/news/a-shortage-of-world-class-hospitalityproperties-in-quy-nhon-city/
Ngan, T. (2018). WastemanagementinVietnam [Bachelor thesis, Metropolia University of Applied Sciences]. Theseus. Retrieved from https://www.theseus.fi/bitstream/handle/10024/147214/Truong_Ngan.pdf?sequence= 1
Wallace, C., & Beel, D. (2021). How Cultural Heritage can Contribute to Community Development and Wellbeing. Bristol University. https://doi.org/10.51952/9781529206159.ch007
Waste sorting at source remains unimplemented in many areas. (n.d.). vietnamnews.vn. Retrieved from https://vietnamnews.vn/environment/1691903/waste-sorting-at-sourceremains-unimplemented-in-many-areas.html
FiinGroup. (2024). Vietnam waste management: Toward sustainable development. https://fiingroup.vn/upload/docs/Vietnam-Waste-Management-Toward-SustainableDevelopment.pdf
Harafadli, M. M., Ramadan, B. S., Rachman, I., & Matsumoto, T. (2024). "Challenges and characteristics of the informal waste sector in developing countries: An overview." Journal of Material Cycles and Waste Management, 26(3), 929–948. https://doi.org/10.1007/s10163-024-01929-3
Nv, E. (n.d.). DeladdervanLansink:eenduurzamegidsvooreffectiefafvalmanagement. Eurowaste Nv. Retrieved from https://www.eurowaste.be/kennisbank/de-ladder-vanlansink-een-duurzame-gids-voor-effectief-afvalmanagement/
United Nations Economic and Social Commission for Asia and the Pacific (ESCAP). (2015). NAMA Waste-to-Resources in Cities in Viet Nam. Retrieved from https://www.unescap.org/sites/default/files/ESCAP%20NAMA%20Waste-toResources-in-Cities-in-Viet-Nam.pdfESC
Pham, H. H. L. (2024). Vietnam-Waste-Management-Toward-Sustainability. FiinGroup Retrieved April 11, 2025, from https://fiingroup.vn/NewsInsights/Detail/11077558
Expert Market Research. (2024). Vietnam waste management market: Size, share, growth, forecast 2024–2034. Retrieved from https://www.expertmarketresearch.com/reports/vietnam-waste-management-market
Vietnamese Government. (2015). Decision 31/QD-TTg & Circular 32/TT-BCT. Retrieved from https://vepg.vn/wp-content/uploads/2019/03/Circular-32-2015-TT-BCT-on-PDand-SPPA-for-SW_EN-1.pdf
Reuters. (2024, November 26). TopimporterVietnamstrugglestorecycleplasticwaste. Retrieved from https://www.reuters.com/sustainability/top-importer-vietnamstruggles-recycle-plastic-waste-2024-11-26
Cho, Renee, Nguyen, Thi Hoa, & Le, Minh Tu. (2018). Environmental governance and sustainability in Vietnam: Challenges and opportunities. Environmental Policy and Governance, 28(2), 124–134. https://doi.org/10.1002/eet.1792
World Bank. (2023). Vietnamurbandevelopmentandwastemanagementdata. Retrieved from https://www.worldbank.org
Quy Nhon University. (n.d.). AmessagefromtheRectorofQuyNhonUniversity. Retrieved from https://qnu.edu.vn/vi/about/a-message-from-the-rector-of-quy-nhon-university
Quy Nhon University. (n.d.). Ranking & Overview 2024. Retrieved from https://www.4icu.org/reviews/12235.htm
B-Company. (2024, December 2). SolidWasteTreatmentinVietnam:CurrentSituation and Potential. Retrieved from https://b-company.jp/solid-waste-treatment-in-vietnamcurrent-situation-and-potential/
VietnamPlus. (2024, January 5). SUPs in Vietnam count as solid waste. VietnamPlus. https://en.vietnamplus.vn/sups-in-vietnam-count-as-solid-waste/277085.vnp
Van Daelen, W. (2023). ResearchonsingleuseplasticsatQuyNhonUniversityandhow toreducetheseitems. HOGENT.
United Nations Environment Programme (UNEP). (2018). Single-useplastics:Aroadmap forsustainability https://www.unep.org/resources/report/single-use-plastics-roadmapsustainability
Liu, C., & Liu, T. (2023). Fossil fuel, greenhouse gas, and global warming. GlobalJournal of Science Frontier Research, 23(4), 21–32. https://doi.org/10.34257/GJSFRHVOL23IS4PG21
Houssini, K., Li, J. & Tan, Q. Complexities of the global plastics supply chain revealed in a trade-linked material flow analysis. Commun Earth Environ 6, 257 (2025). https://doi.org/10.1038/s43247-025-02169-5
Our World in Data. (2023). Globalplasticproductionwithprojections [Figure]. Retrieved April 7, 2025, from https://ourworldindata.org/grapher/global-plastic-production-projections
Pew Charitable Trusts & Systemiq. (2020). Breakingtheplasticwave:Acomprehensive assessmentofpathwaystowardsstoppingoceanplasticpollution. The Pew Charitable Trusts. Retrieved April 10, 2025, from https://www.pewtrusts.org//media/assets/2020/07/breakingtheplasticwave_report.pdf
Miller, A., Mohazzebi, S., Pasewark, S., & Fagan, J. M. (n.d.). Alternatives to Styrofoam: A Comparative Analysis (Rutgers University Report No. 38329). Rutgers University. https://rucore.libraries.rutgers.edu/rutgers-lib/38329/PDF/1/play/
Tekman, M. B., Walther, B. A., Peter, C., Gutow, L., & Bergmann, M. (2022). Impactsof plasticpollutionintheoceansonmarinespecies,biodiversityandecosystems. World Wildlife Fund. Retrieved April 11, 2025, from https://wwfint.awsassets.panda.org/downloads/wwf_impacts_of_plastic_pollution_on _biodiversity.pdf
Alfred Wegener Institute. (n.d.). LITTERBASE - interactions between marine organisms and litter. https://litterbase.awi.de/interaction
AWI-LITTERBASE. (n.d.). LITTERBASE:Onlineportalformarinelitter. Alfred Wegener Institute. Retrieved April 12, 2025, from https://litterbase.awi.de/interaction_graph
Wilcox, C., Van Sebille, E., & Hardesty, B. D. (2015). Threat of plastic pollution to seabirds is global, pervasive, and increasing. ProceedingsoftheNationalAcademyofSciencesoftheUnited StatesofAmerica,112(38), 11899–11904. https://doi.org/10.1073/pnas.1502108112
Thrift, E., Nouvellet, P., & Mathews, F. (2023). Plasticentanglementposesapotentialhazardto European hedgehogs (Erinaceus europaeus) in Great Britain. Retrieved from https://www.researchgate.net/publication/372733237_Plastic_Entanglement_Poses_a _Potential_Hazard_to_European_Hedgehogs_Erinaceus_europaeus_in_Great_Britain
Allemann, M. N., Tessman, M., Reindel, J., Scofield, G. B., Evans, P., Pomeroy, R. S., Burkart, M. D., Mayfield, S. P., & Simkovsky, R. (2024). Rapid biodegradation of microplastics generated from bio-based thermoplastic polyurethane. ScientificReports, 14, Article 6036. https://doi.org/10.1038/s41598-024-56492-6
Isobe, A., et al. (2021, October 27). Twenty-fourtrillionpiecesofmicroplasticsintheoceanand counting. Kyushu University. https://www.kyushu-u.ac.jp/en/researches/view/221/
Isobe, A., Azuma, T., Cordova, M. R., Cózar, A., Galgani, F., Hagita, R., Kanhai, L. D., Imai, K., Iwasaki, S., Kako, S., Kozlovskii, N., Lusher, A. L., Mason, S. A., Michida, Y., Mituhasi,
T., Morii, Y., Mukai, T., Popova, A., Shimizu, K., Tokai, T., Uchida, K., Yagi, M., & Zhang, W. (2021). A multilevel dataset of microplastic abundance in the world’s upper ocean and the Laurentian Great Lakes. Microplastics and Nanoplastics, 1(16). https://doi.org/10.1186/s43591-021-00013-z
Danopoulos, E., Twiddy, M., West, R., & Rotchell, J. M. (2022). A rapid review and metaregression analyses of the toxicological impacts of microplastic exposure in human cells. Journal of Hazardous Materials, 427 (2022), 127861. https://www.sciencedirect.com/science/article/pii/S0304389421028302#ab0020
Bao, L.-J., Mai, L., Liu, L.-Y., Sun, X.-F., & Zeng, E. Y. (2024). Microplastics on the planet: Current knowledge and challenges. EnvironmentalScience&TechnologyLetters, 11(12), 1262–1271. https://doi.org/10.1021/acs.estlett.4c00603
Nihart, A.J., Garcia, M.A., El Hayek, E. et al. Bioaccumulation of microplastics in decedent human brains. NatMed (2025). https://doi.org/10.1038/s41591-024-03453-1
Li, Y., Tao, L., Wang, Q., Wang, F., Li, G., & Song, M. (2023). Potential health impact of microplastics: A review ofenvironmental distribution, human exposure, andtoxic effects. EnvironmentalHealth, 42(1), 1–15. https://doi.org/10.1021/envhealth.3c00052
Cox, K. D., Covernton, G. A., Davies, H. L., Dower, J. F., Juanes, F., & Dudas, S. E. (2019). Human consumption of microplastics. Environmental Science & Technology, 53(12), 7068–7074. https://doi.org/10.1021/acs.est.9b01517
National Oceanic and Atmospheric Administration (NOAA). (n.d.). How marine debris is impacting marine animals. NOAA Office of Response and Restoration. Retrieved April 16, 2025, from https://response.restoration.noaa.gov/about/media/how-marine-debrisimpacting-marine-animals.html
Lamb, J. B., Willis, B. L., Fiorenza, E. A., Couch, C. S., Howard, R., Rader, D. N., ... & Harvell, C. D. (2018). Plastic waste associated with disease on coral reefs. Science, 359(6374), 460–462. https://doi.org/10.1126/science.aar3320
Souter, D., Planes, S., Wicquart, J., Logan, M., Obura, D., & Staub, F. (Eds.). (2021). Status ofcoralreefsoftheworld:2020report. Global Coral Reef Monitoring Network (GCRMN) and International Coral Reef Initiative (ICRI). https://doi.org/10.59387/WOTJ9184
Carrington, D. (2018, January 25). Billionsofpiecesofplasticoncoralreefssenddiseasesoaring, research reveals. The Guardian. https://www.theguardian.com/environment/2018/jan/25/billions-of-pieces-of-plasticon-coral-reefs-send-disease-soaring-research-reveals
Yadav, P., Silvenius, F., Katajajuuri, J.-M., & Leinonen, I. (2024). Life cycle assessment of reusable plastic food packaging. Journal of Cleaner Production, 448, 141529. https://doi.org/10.1016/j.jclepro.2024.141529
Garrido, N., Alvarez del Castillo, M.D. Environmental evaluation of single-use and reusable cups. Int J Life Cycle Assess 12, 252–256 (2007). https://doi.org/10.1065/lca2007.05.334
Anand, K., Martinez Arce, A., Bishop, G., Styles, D., & Fitzpatrick, C. (2024). A tasty solution to packaging waste? Life cycle assessment of edible coffee cups. Resources, Conservation and Recycling, 201(February), 107320. https://doi.org/10.1016/j.resconrec.2023.107320
FoodNavigator. (2023, May 31). Cupffee:Ediblecoffeecupdevelopedfromoatbranandwheatflour. https://www.foodnavigator.com/Article/2023/05/31/cupffee-edible-coffee-cupdeveloped-from-oat-brand-and-wheat-flour/
van der Harst, E., & Potting, J. (2013). A critical comparison of ten disposable cup LCAs. Environmental Impact Assessment Review, 43, 86–96. https://doi.org/10.1016/j.eiar.2013.06.006
United Nations Environment Programme. (2021). Single-use beverage cups and their alternatives: Recommendations from life cycle assessments. Life Cycle Initiative. https://www.lifecycleinitiative.org/wp-content/uploads/2021/03/UNEP-D002-BeverageCups-Report_lowres.pdf
United Nations Environnent Programme. (2020). Plasticbottles:Ananalysisoftheglobalmarket and policy responses. United Nations Environment Programme. https://www.lifecycleinitiative.org/wp-content/uploads/2020/07/UNEP_PLASTICBOTTLES-REPORT_29-JUNE-2020_final-low-res.pdf
BBC News. (2017, December 10). Seven charts that explain the plastic pollution problem. https://www.bbc.com/news/science-environment-42264788
Barnes, D. K. A. (2002). Biodiversity: Invasions by marine life on plastic debris. Nature, 416(6883), 808–809. https://doi.org/10.1038/416808a
Kannan, G., Mghili, B., Di Martino, E., Sanchez-Vidal, A., & Figuerola, B. (2023). Increasing risk of invasions by organisms on marine debris in the Southeast coast of India. Marine PollutionBulletin,195, 115469. https://doi.org/10.1016/j.marpolbul.2023.115469
Department for Environment, Food & Rural Affairs. (2023, January 14). Plansunveiledtoban single-use plastics. GOV.UK. https://www.gov.uk/government/news/plans-unveiled-toban-single-use-plastics
Harikrishnan, M. P., Raghunathan, R., Warrier, A. S., Basil, M., Sahoo, S. K., Pandiselvam, R., Venkatesh, T., Pillai, S., Kundu, P., & Kothakota, A. (2023). Reinforced water hyacinth based biodegradable cutlery: Green alternative to single-use plastics. FoodPackagingand ShelfLife,40, 101211. https://doi.org/10.1016/j.fpsl.2023.101211
Nicolau, J. L., Stadlthanner, K. A., Andreu, L., & Font, X. (2022). Explainingthewillingnessof consumerstobringtheirownreusablecoffeecupsundertheconditionofmonetaryincentives Journalof
Retailing and Consumer Services, 66, 102908. https://doi.org/10.1016/j.jretconser.2022.102908
Sheppard, S. B., Argentopoulos, S., Ware, J., Swearingen, A., Winfield, J., Radke, J., & Zhao, J. (2025). Probabilisticrewardsincreasetheuseofreusablecups. Resources,Conservationand Recycling,212, 108001. https://doi.org/10.1016/j.resconrec.2024.108001
Sun, Y., & He, H. (2023). Understanding consumers’ purchase intentions of single-use plastic products. Frontiers in Psychology, 14, 1105959. https://doi.org/10.3389/fpsyg.2023.1105959
Du, F., Cai, H., Zhang, Q., Chen, Q., & Shi, H. (2020). Microplastics in take-out food containers. Journal of Hazardous Materials, 399, 122969. https://doi.org/10.1016/j.jhazmat.2020.122969
De Bruyne, T. (n.d.-b). TheSUEInfluenceFramework©explained – SUE|BehaviouralDesignAcademy. https://suebehaviouraldesign.com/influence-framework-explained/
Groenewegen, A. (n.d.). Toegepaste Behavioural Economics pt. 1 – Chunking – SUE | Behavioural Design Academy. https://suebehaviouraldesign.com/nl/applied-behavioural-economicschunking/
OpenAI. (2025). ChatGPT (GPT-4, used between March and May 2025) [Large language model]. https://chat.openai.com/
Figure 1 - Worldmap. (2015). Vietnam on the world map [Map]. Retrieved on 5 May, 2025 from https://ontheworldmap.com/world-political-map.jpg
Figure 2 - Wallpaper Abyss. (2011). Ha Long Bay [Photograph]. Retrieved on 5 May, 2025 from https://wall.alphacoders.com/big.php?i=753645
Figure 4 - Tigit Motorbikes. (2019). Bin Dinh Province [Photograph]. Retrieved on 5 May, 2025 from https://www.tigitmotorbikes.com/binh-dinh-scenery-food-and-culture/
Figure 5 - Tam C. (2024). Quy Nhon City [Photograph]. Retrieved on 16 May, 2025 from https://tinyurl.com/tms-quy-nhon
Figure 8 - FIIGroup. (2024). Solid waste in Vietnam [Infographic]. Retrieved on 25 April, 2025 from https://fiingroup.vn/upload/docs/Vietnam-Waste-Management-TowardSustainable-Development.pdf
Figure 10 - FIIGroup. (2024). The value chain of waste in Vietnam [Diagram]. Retrieved on 25 April, 2025 from https://fiingroup.vn/upload/docs/Vietnam-Waste-ManagementToward-Sustainable-Development.pdf
Figure 11 - FIIGroup. (2024). Waste management actors [Diagram]. Retrieved on 25 April, 2025 from https://fiingroup.vn/upload/docs/Vietnam-Waste-Management-TowardSustainable-Development.pdf
Figure 12 - Nv E. (n.d.). The ladder of Lansink [Diagram]. GreenMatter. Retrieved on 25 April, 2025 from https://th.bing.com/th/id/OIP.Y7HG4CHChAAPDJKIDkOvAAHaEK?cb=iwp2&rs=1&pid=I mgDetMain
Figure 13 - FIIGroup. (2024). Waste management future [Infographic]. Retrieved on 25 April, 2025 from https://fiingroup.vn/upload/docs/Vietnam-Waste-ManagementToward-Sustainable-Development.pdf
Figure 14 - Houssini, K., Li, J., & Tan, Q. (2025). Global plastic supply chain flows [Illustration]. Communications Earth & Environment, 6, 257. https://doi.org/10.1038/s43247-025-02169-5
Figure 15 - Our World in Data. (2023). Global plastic production with projections [Graph]. Retrieved April 7, 2025, from https://ourworldindata.org/grapher/global-plasticproduction-projections
Figure 16 - Pew Charitable Trusts. (2020, July 23). Breakingtheplasticwave:Topfindings [Graph]. Retrieved April 7, 2025, from https://www.pewtrusts.org/en/research-andanalysis/articles/2020/07/23/breaking-the-plastic-wave-top-findings
Figure 17 - World Wildlife Fund (WWF). (2025). Impacts of plastic pollution on biodiversity [Figure]. Retrieved April 7, 2025, from https://wwfint.awsassets.panda.org/downloads/wwf_impacts_of_plastic_pollution_on _biodiversity.pdf
Figure 18 - Litterbase. (2025). Interaction graph [Chart]. Retrieved April 7, 2025, from https://litterbase.awi.de/interaction_graph
Figure 19 - Litterbase. (2025). Interaction graph [Chart]. Retrieved April 7, 2025, from https://litterbase.awi.de/interaction_graph
Figure 20 - Litterbase. (2025). Interaction graph [Chart]. Retrieved April 7, 2025, from https://litterbase.awi.de/interaction_graph
Figure 21 - NOAA Office of Response and Restoration & Witherington, B. (n.d.). Bird’s stomachwithmarinedebrisimageandseaturtleballooningestionimage [Photographs]. Retrieved April 7, 2025, from https://response.restoration.noaa.gov/about/media/how-marinedebris-impacting-marine-animals.html
Figure 22 - Putchim, L. (n.d.). Spawning coral wrapped in plastic [Photograph]. Science. Retrieved April 7, 2025, from https://www.theguardian.com/environment/2018/jan/25/billions-of-pieces-of-plasticon-coral-reefs-send-disease-soaring-research-reveals
Figure 23 - United Nations Environment Programme. (2018). Figure 1.2: Global plastic productionbyindustrialsector,2015 [Illustration]. In Single-UsePlastics:ARoadmapforSustainability (p. 4). United Nations Environment Programme. Retrieved April 7, 2025, from https://www.unep.org/resources/report/single-use-plastics-roadmap-sustainability
Figure 24 - BBC News. (2017, December 10). Seven charts that explain the plastic pollution problem [Figure]. Data source: Euromonitor International. Retrieved May 15, 2025, from https://www.bbc.com/news/science-environment-42264788
Figure 25 - Yadav, P., Silvenius, F., Katajajuuri, J.-M., & Leinonen, I. (2024). Life cycle assessmentofreusableplasticfoodpackaging [Figure]. JournalofCleanerProduction, 448, 141529. https://doi.org/10.1016/j.jclepro.2024.141529
Figure 26 - Du, F., Cai, H., Zhang, Q., Chen, Q., & Shi, H. (2020). Microplasticsintake-outfood containers [Figure]. Journal of Hazardous Materials, 399, 122969. https://doi.org/10.1016/j.jhazmat.2020.122969
Figure 27 - Anand, K., Martinez Arce, A., Bishop, G., Styles, D., & Fitzpatrick, C. (2024). A tasty solution to packaging waste? Life cycle assessment of edible coffee cups [Figure]. Resources, Conservation and Recycling, 201(February), 107320. https://doi.org/10.1016/j.resconrec.2023.107320
Figure 28 - Cupffee. (2023, May 31). Cupffee:Ediblecoffeecupdevelopedfromoatbranandwheat flour [Photograph]. FoodNavigator. Retrieved May 15, 2025, from https://www.foodnavigator.com/Article/2023/05/31/cupffee-edible-coffee-cupdeveloped-from-oat-brand-and-wheat-flour/
Figure 29 - HOGENT Shop. (n.d.). BlueDopperwaterbottle [Image]. Retrieved May 28, 2025, from https://hogent-shop.be/uploads/files/Producten/_513xAUTO_crop_centercenter_none_ns/Dopper_blauw1.jpg
Figure 30 - Billie Cup. (n.d.). Billie60reusablecoffeecup [Image]. Retrieved May 28, 2025, from https://billiecup.com/nl/billie60/
Figure 33A - Shutterstock. (n.d.). Single-useplasticproductsandcutleryonbrightblue background [Stock photo]. https://www.shutterstock.com/nl/image-photo/singleuseplastic-products-cutlery-on-bright-1355737793
Figure 33B - CNN. (2022, December 14). Single-use plastic ban in the UK [Photograph]. https://media.cnn.com/api/v1/images/stellar/prod/221214130635-single-use-plasticban-uk.jpg?c=original
Figure 33C - For Earth By Us. (n.d.). Reusable coffee cup, sage green [Product image]. https://forearthbyus.com/products/reusable-coffee-cup-sagegreen?variant=41549031964719
Figure 33D - Westminster City Council. (n.d.). Street litter clean-up [Photograph]. https://cleanstreets.westminster.gov.uk/hubfs/Imported_Blog_Media/shutterstock_10 07548057-1.jpg
Figure 33E - Tupperware. (n.d.). Impressions classic bowl set [Product image]. https://www.tupperware.com/cdn/shop/files/impressions-classic-bowl-set-240113018.jpg?v=1724688178
Figure 33F - S-Bol. (n.d.). Camelbak Eddy+ water bottle [Product image]. https://media.sbol.com/my3njjnBjjgE/322x840.jpg
9.1 Sustainability and the environment in Vietnam

University College Ghent
Specialization in Environmental and Sustainability Management
General framework research on sustainability and the environment in Vietnam in support of the bachelor thesis ‘Experimental study in the reduction of SUPs by raising awareness and offering reusable alternatives’
Quy Nhơn University GIL
This information was originally gathered as part of the literature study. It provides a deeper understanding of Vietnam's context in terms of sustainability, biodiversity, and environmental issues. The document can serve as an additional source of valuable information and contributes toforming a more comprehensive picture of Vietnamand our bachelor thesis.
By offering insights into the country’s environmental policies, challenges, and progress, it helps contextualize the themes addressed in our research. Furthermore, this background not only enriches the academic foundation of the study but also highlights the ecological and sustainability efforts of Vietnam, making it an important reference point for understanding the country's current and future strategy in environmental development.
We hope that while reading our bachelor’s thesis, you also take a moment to look through this document. It is our aim to inform readers not only about the serious challenges Vietnam faces, but also about the potential solutions and positive developments that should not be overlooked.
Kind Regards
Gil Heyman & Indy Laplasse
Figure 1: Poor Vietnamese Boy, Borgenproject, (2019).........................................................96
Figure 2: Drinking Water in a Vietnamese School, World Org, (2019). 97
Figure 3: Dam Nai Windmills, Ecohz, (n.d)...........................................................................98
Figure 4: Vietnam Electricity, Our World In Data, (n.d)........................................................99
Figure 5: Energy Potential Vietnam, McKinney & Company, n.d.). 99
Figure 6: The countries polluting the oceans the most, The Wall Street Journal, (2022).....101
Figure 7: The drainage canal system is filled with garbage, UCR News (2019).
102
Figure 8: Dead Fishes in a Lake in Hanoi, retrieved from the saigoneer, (2018). 102
Figure 9: Primary Tree Cover Loss, Vizzuality (2023).........................................................
104
Figure 10: Tree Cover Loss In Vietnam, Vizzuality, (2019). 104
Figure 11: “sling cloth monkey”. Picture taken by Trang, adapted from Hummingbird (2022). 106
Figure 12: Pangolin. Picture by Ansar Khan. (n.d.). Retrieved from Life Line for Nature Society
Figure 13: Saola in the forest. Unknown author. (n.d.). Retrieved from HowStuffWorks….107
Sustainability in Vietnam remains uneven. Rural areas particularly the Northern Midlands and Central Highlands, home to many ethnic minority groups still face high levels of poverty, limited access to education, clean water, and healthcare, and are disproportionately vulnerable to climate change (Oxfam Vietnam, 2023). These inequalities highlight the need for more inclusive policy implementation (Thanh Nhan Phan et al., 2024).
Vietnam's transition to a green economy is also constrained by several systemic challenges: unreliable data, poor local policy execution, and a lack of financial incentives for environmentally friendly production (GreenID Vietnam, 2023). Waste management systems, especially in poorer provinces, remain inefficient, while informal recycling remains unregulated. Nevertheless, renewable energy particularly solar and wind has seen encouraging growth, although it still accounts for only a small share of the country’s total energy output (Thanh Nhan Phan et al., 2024).
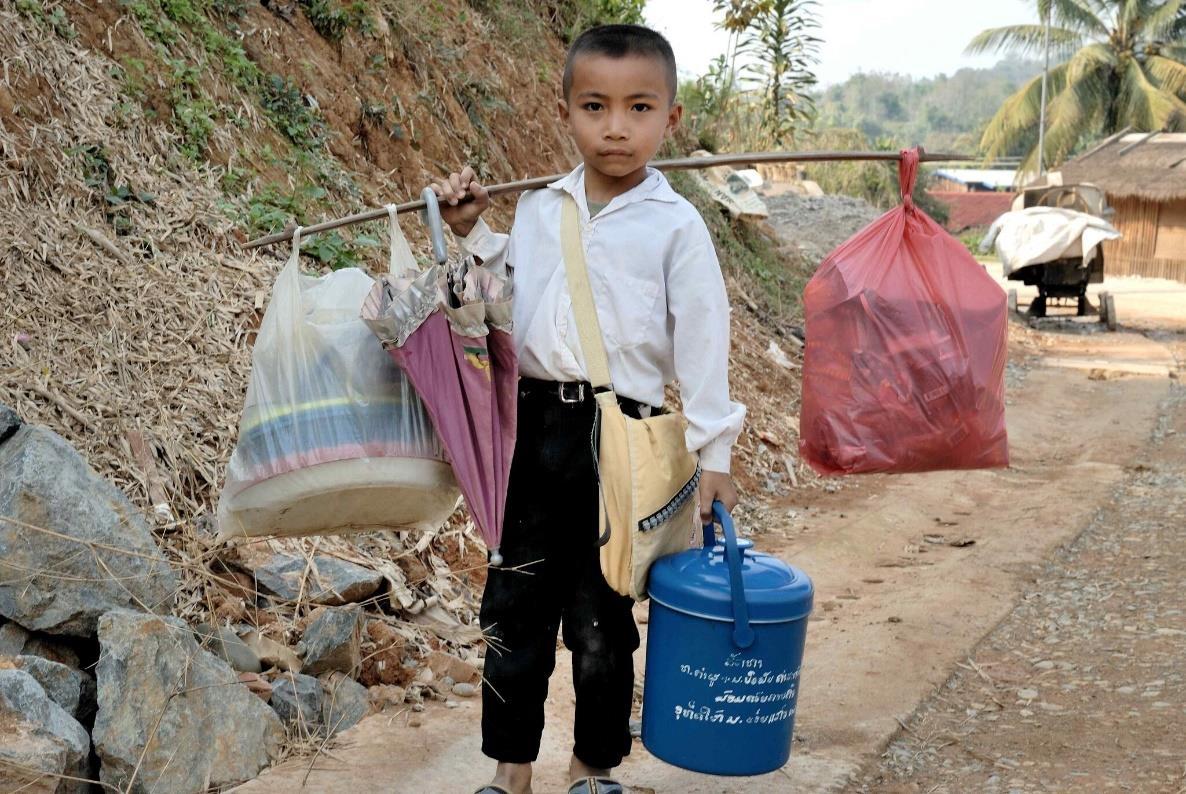
A persistent gap between national strategies and provincial-level implementation slows the progress. Stronger intergovernmental coordination, increased funding for vulnerable populations, and better integration of sustainable practices in agriculture, tourism, and urban planning are essential. Promising initiatives in community-based tourism, organic agriculture, and forest restoration show that local engagement can drive impactful change (Thanh Nhan Phan et al., 2024).
Over the past decade, Vietnam has emerged as a notable example of a developing country aligning its national development strategies with the United Nations Sustainable Development Goals (SDGs). Since 2015, the SDGs have been incorporated into key policy documents, such as the 2021 - 2025 Socio-Economic Development Plan. (United Nations Development Programme Vietnam, 2023). This integration has driven significant progress in poverty alleviation (SDG 1), clean water and sanitation (SDG 6), and infrastructure and innovation (SDG 9), reflecting Vietnam’s nationwide commitment to inclusive and sustainable development (Voluntary National Reviews Vietnam, (2023); High-Level Political Forum, n.d.)
Vietnam’s social achievements are the most important for the government. The past years they made some significant progress its reduction of poverty from 9.2% in 2016 to 3.6% in 2022 is a good example of that (General Statistics Office of Vietnam, 2022). Additionally, access to clean water has become nearly universal, with over 98% of households now connected to improved water sources said (World Bank Vietnam Development Report, 2023).
A side note is that not all the water is from high hygienic value like in most western countries. The cause of that is the upstream problem and problems with outdated pipelines (Phi et al. 2023). At the same time investments in infrastructure and innovation have contributed to the economic growth while also creating new job opportunities (Voluntary National Reviews 2023).
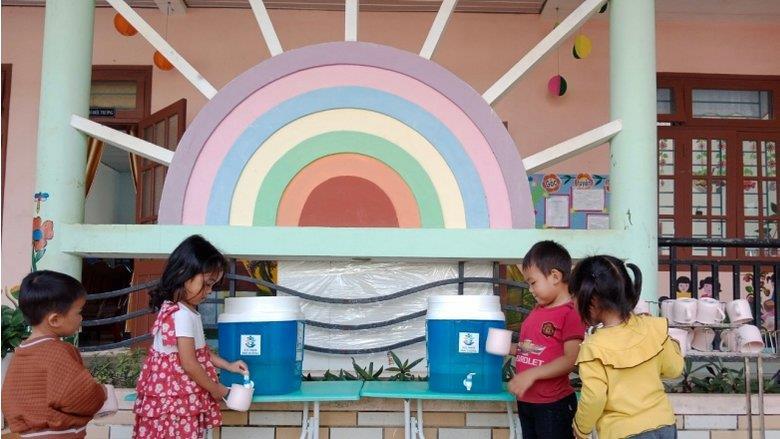
Despite these advancements, Vietnam faces critical environmental challenges. The country remains heavily dependent on fossil fuels, particularly coal, resulting in increased carbon emissions and urban air pollution. In ecologically sensitive regions like the Mekong Delta, deforestation, soil degradation, and biodiversity loss threaten the environment. Highlights a strong correlation between Vietnam’s economic growth and rising greenhouse gas emissions, though it also shows that innovation and reforestation efforts can significantly reduce environmental harm (Raihan et al., 2025; Nguyen & Le, 2023).
To reach its target of net-zero emissions by 2050, Vietnam must transit to a green economy (Ministry of Natural Resources and Environment Vietnam, 2022). This includes scaling up renewable energy, particularly solar and wind, introducing carbon pricing mechanisms, promoting sustainable agriculture, and supporting green technologies. Large-scale forest protection and reforestation are also vital for increasing carbon sequestration and preserving biodiversity across vulnerable ecosystems (International Renewable Energy Agency, 2024).
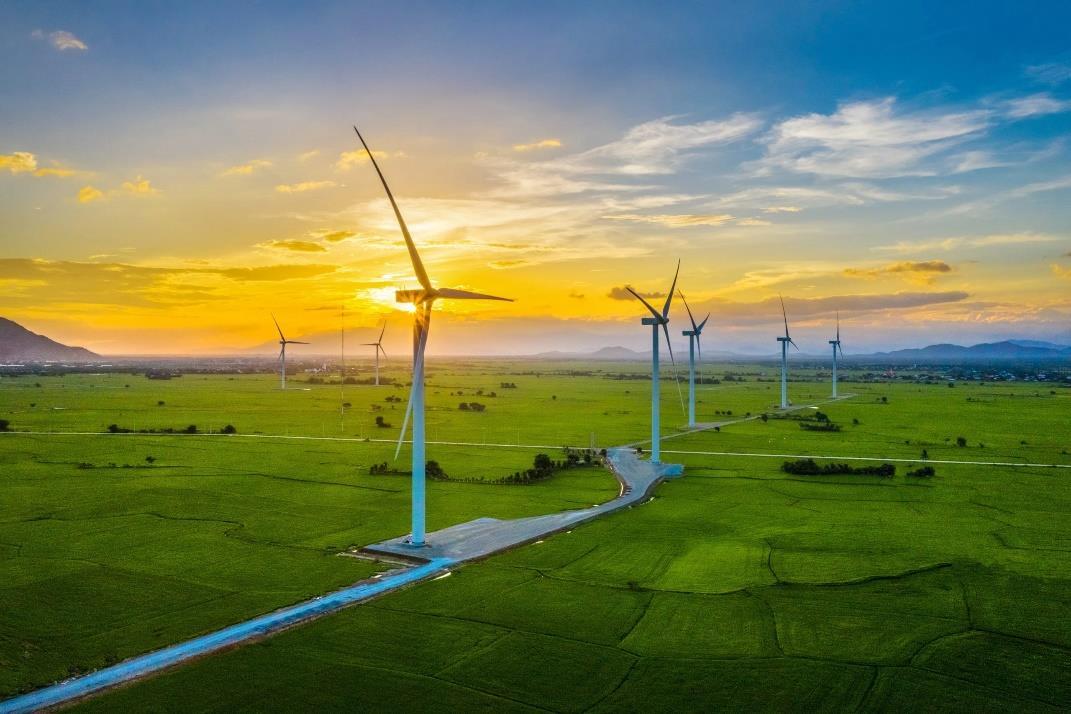
International cooperation will be key to achieving these climate goals. Through partnerships with global organizations and foreign investors, Vietnam aims to strengthen environmental regulation, scale up research and innovation, and implement climatesmart solutions across sectors (Asian Development Bank, 2024). These actions are not only essential to meeting SDG 13 (Climate Action) but also contribute to SDG 7 (Affordable and Clean Energy) and SDG 15 (Life on Land), underlining the interconnected nature of sustainable development (United Nations Economic and Social Commission for Asia and the Pacific, 2023).
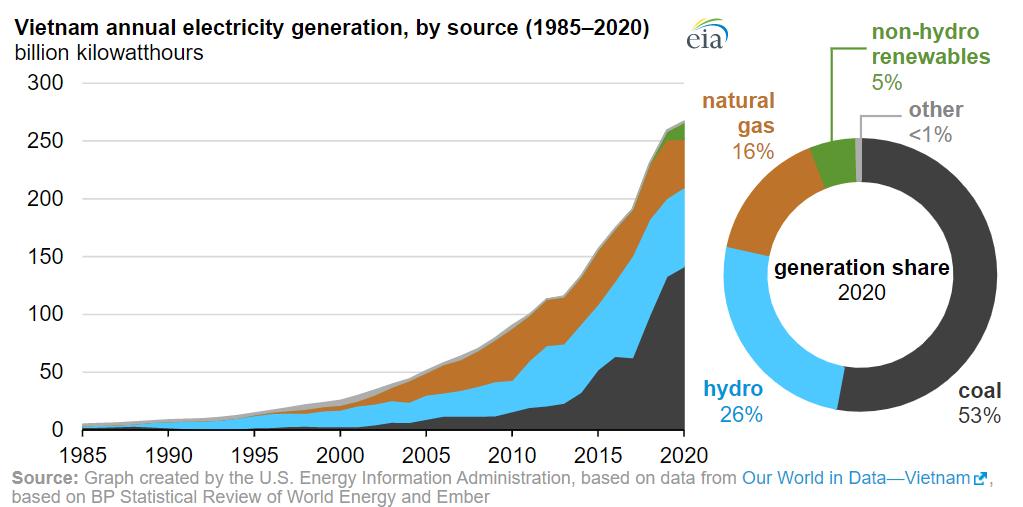
Figure 4 illustrates the evolution of Vietnam’s electricity generation by source between 1985 and 2020. Over the past two decades, electricity production has increased sharply in parallel with the country’s rapid economic growth and industrialization. In 2020, coal remained the dominant energy source, accounting for 53% of the total electricity generation, followed by hydropower at 26%, natural gas at 16%, and non-hydro renewables such as solar and wind making up only 5%. Other sources contributed less than 1% (U.S. Energy Information Administration, 2020; Our World in Data, 2021).
This data highlights Vietnam’s continued reliance on fossil fuels, particularly coal, despite its public commitments to climate action and sustainable energy transition. Accelerating the introduction and further development of solar and wind power will be essential if Vietnam wants to meet its net-zero emissions target by 2050 (Ministry of Natural Resources and Environment Vietnam, 2022; International Renewable Energy Agency, 2024).
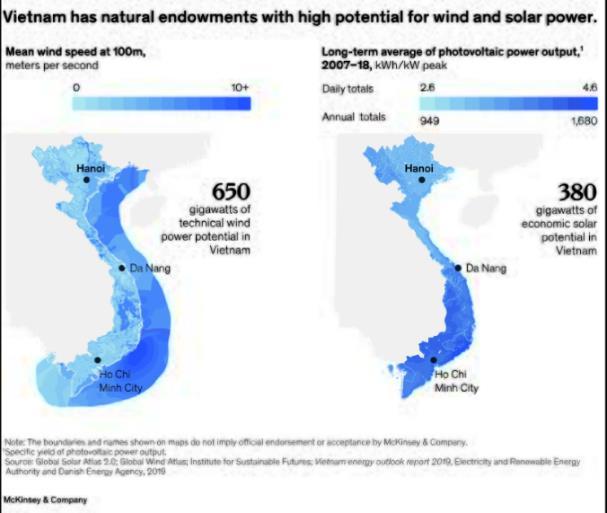
However, as you can see in figure 5, there is a lot of potential for wind and solar power in Vietnam. According to data from the Vietnam Energy Outlook Report made in 2019 by McKinsey & Company, Vietnam possesses approximately 650 gigawatts of technical wind power potential. Central and southern coastal region have a wind speed average of 100 meters with 6-10 meter per second. These areas near Da Nang and Ho Chi Minh have big potential.
So, Vietnam really has much potential to further develop their solar and wind energy production. But it requires enhanced policy frameworks, investment in grid infrastructure, and streamlined regulatory procedures to attract both domestic and foreign renewable energy investors (McKinsey & Company, 2019).
The country is facing an increasing array of environmental challenges driven by rapid urbanization, industrialization, and climate change. The challenges include air pollution, water contamination, deforestation and the effects of the rising sea levels (Chu, 2018).
One of the most pressing environmental issues in Vietnam is air pollution, especially in urban areas such as Hanoi and Ho Chi Minh City. According to a study by Nguyen et al. (2020), the main sources of air pollution in these cities include vehicular emissions, industrial activities, and construction dust. The increasing number of vehicles and industrial growth have significantly deteriorated air quality, leading to a rise in respiratory diseases and other health problems among the population (WHO, 2023).
5.2.1 Wastewater
Not only Vietnam, but many countries around the world are also facing big environmental issues. Water resources need to be protected and preserved in countries in Europe, America and especially in Asia, because the availability of drinking water is decreasing. Contaminated wastewater has many potential dangers, which not only change the quality of life of people but also participate in destroying the habitats of many species in the world (Nguyen, 2023; Tan Hoi, 2019).
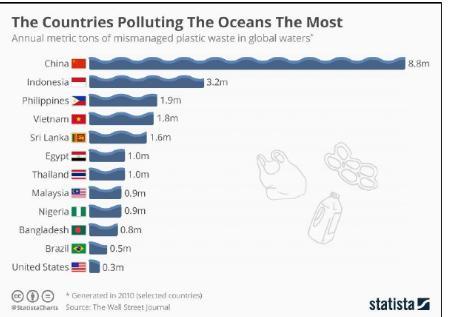
China, with its vast area and dense population, is a global leader in various sectors such as the economy, culture, and education. However, it is grappling with serious water pollution issues. Other developing nations, like Indonesia and the Philippines, face water scarcity issues, compounded by indiscriminate littering, which exacerbates pollution. In contrast, Japan, despite natural disasters, has effectively implemented waste and water treatment technologies. Similarly, Singapore, though a small island nation, places great emphasis on water conservation and efficient usage, considering it a vital resource. Singapore has developed an extensive system of 40 canals and 8,000 kilometres of sewer pipes, which has significantly reduced flooding and improved public health. Despite significant efforts to implement environmental protection policies, water pollution has become a growing concern in Vietnam. The country faces severe water contamination, especially in urban and industrial areas. Rivers and water sources, particularly in the middle anddownstream sections, are heavily polluted due to untreated industrial wastewater, domestic waste, and agricultural runoff (Huyen. H, 2020; Tan Hoi, 2019).
Urban centres like Hanoi and Ho Chi Minh City are experiencing alarming levels of water pollution. The rapid industrialization and urbanization have significantly contributed to the deterioration of water quality (Company, n.d.). Wastewater from factories and residential areas is often discharged directly into rivers and streams without proper treatment, causing substantial harm to aquatic ecosystems and human health (Tan Hoi, 2019). The discharge of polluted water significantly impacts human health by spreading infectious diseases, causing chemical poisoning, and damaging vital organs. Contaminants such as bacteria, heavy metals, and toxic chemicals in water can lead to diseases like cholera, typhoid, and cancer. Additionally, chronic exposure to contaminated water can cause long-term health issues, including liver damage and neurological problems. Proper wastewater management is crucial to prevent these health risks (The United Nations, 2022)
Additionally, the overuse of pesticides and fertilizers in agriculture has led to the contamination of rural water sources, with harmful chemicals seeping into groundwater. In rural areas, where infrastructure for waste management is often lacking, domestic and agricultural waste is improperly disposed of, further worsening the situation (Tan Hoi, 2019). Currently, nearly 76% of Vietnam’s population lives in rural areas, where infrastructure is backward and most untreated human and livestock waste seeps into the ground or is washed away, causing increased organic and microbial pollution in water sources (Company, n.d.)
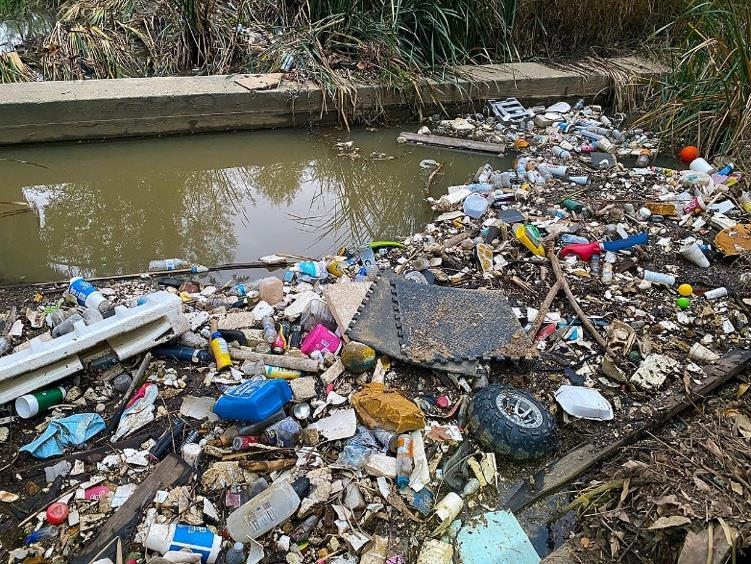
In urban areas, domestic waste clogs sewers, preventing proper drainage, leading to flooding during rainfall (Tan Hoi, 2019). Without more robust policies and better management, the quality of water in the country is at serious risk, threatening public health and the environment. Rural areas, for example, face challenges with backward facilities, where untreated domestic and animal waste contaminates groundwater which increases the risk of waterborne diseases (Vu Hieu, 2019)
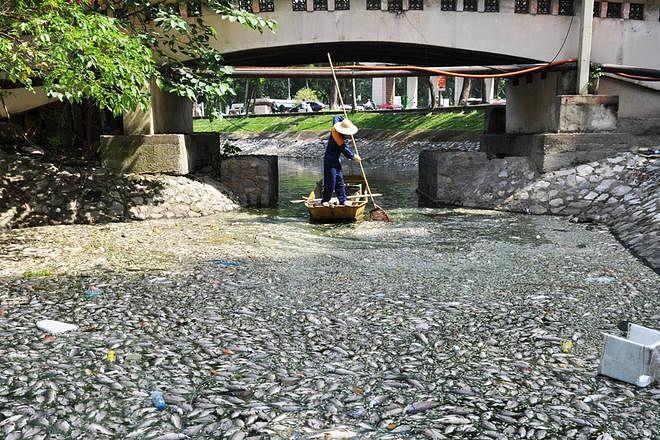
Statistics show that around 9.000 people die annually from water pollution-related causes, and 200,000 new cancer cases are reported each year due to contaminated water in Vietnam (World Bank Open Data, z.d.). Water-related diseases, including diarrhoea, dermatitis, and eye infections, are also on the rise, posing a significant public health threat (Tan Hoi, 2019).
5.2.3 Solution
To tackle water pollution in Vietnam, it is crucial to strengthen environmental protection laws, enhance local authorities' capacity, and ensure proper personnel training. Key actions include improving waste management systems, requiring industries to treat wastewater before discharge, and increasing environmental inspections to identify highrisk areas. Therefore, it is important that the Vietnamese government starts to invest in new technologies to clean wastewater (Ministry for Foreign Affairs of Finland, 2023).
Public education on the importance of protecting water sources and reducing plastic use is essential, along with the promotion of sustainable practices such as using organic products. Reducing water consumption and especially reducing polluted water remains most important, although this is sometimes forgotten by the government. Additionally, water filtration systems should be used in areas with unsafe water to protect public health from contaminants and prevent the spread of waterborne diseases (Tan Hoi, 2019).
5.3.1 Deforestation in Vietnam
Vietnam, a country rich in tropical forest ecosystems, faces ongoing challenges related to deforestation and forest degradation, despite efforts to reverse these trends. Although Vietnam transitioned from net deforestation to net reforestation in the 1990s, forest loss and degradation continue to be serious issues, particularly in areas such as the Central Highlands, Northeast, Northwest, and North Central regions (Van Quock & Quan Trang, 2018). According to Butler (2022), there is a tree cover loss of as much as 25% in Binh Dinh province where the city of Quy Nhon is located. From 2002 to 2023, Vietnam lost 756 kha of humid primary forest, making up 22% of its total tree cover loss in the same time
period. The total area of humid primary forest in Vietnam decreased by 11% during this period (Vizzuality, n.d.)
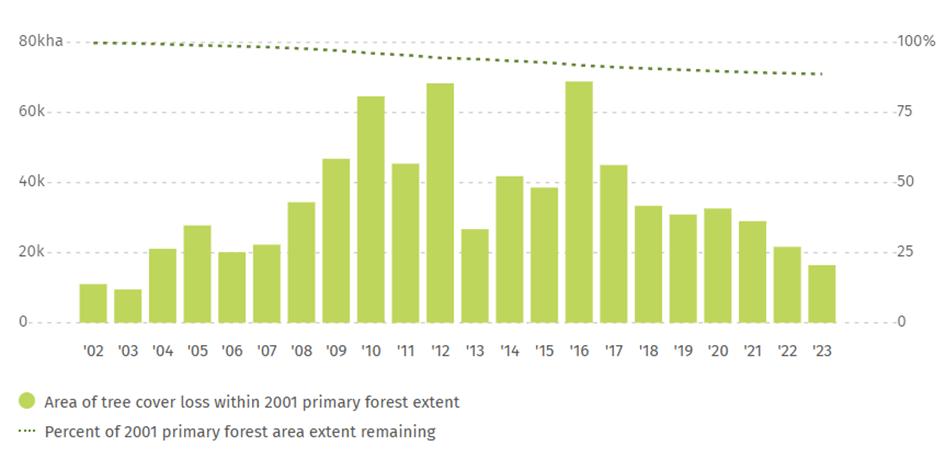
5.3.2 Actions of the Vietnamese Government Against Forest Degradation
From 2001 to 2023, Vietnam lost 3.56 Mha of tree cover, equivalent to a 22% decrease in tree cover since 2000, comparable to 2.52 Gt of CO₂e emissions (Vizzuality, n.d.).
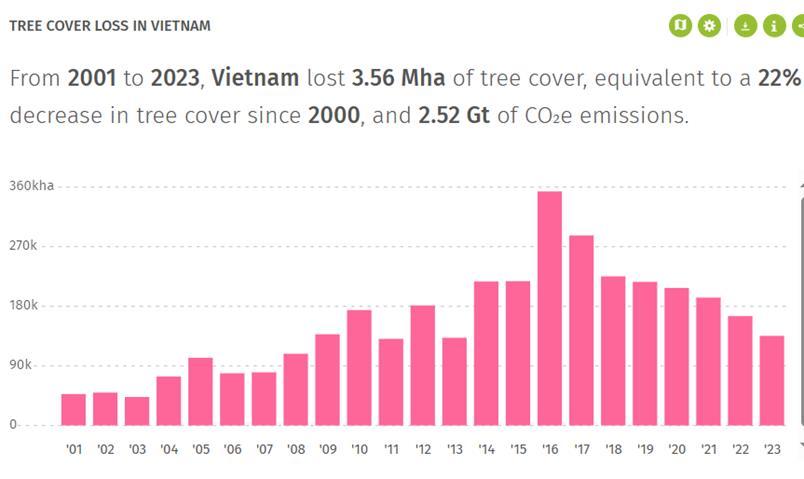
5.3.3 Adoption of REDD+ Strategy
To address this, Vietnam has adopted REDD+ (Reducing Emissions from Deforestation and Forest Degradation), a comprehensive strategy aimed at mitigating climate change through conservation, sustainable forest management, and the enhancement of forest carbon stocks (TT et al., 2019). While current national policies provide a supportive foundation for REDD+, their effectiveness is limited by a lack of reliable, large-scale data on the extent and causes of deforestation and degradation (Van Quock & Quan Trang, 2018).
The study of Van Quock & Quan Trang bridges that gap by employing geographic information systems (GIS), structural equation modelling, and regression tree analysis on cross-provincial data collected between 2000 and 2010. The results reveal that approximately 1.77 million hectares of forests were lost, and 0.65 million hectares degraded during that period (Le, n.d.). Key drivers include initial forest cover, per capita income, agricultural expansion, population growth, poverty, food demand, and weak governance (Van Quock & Quan Trang, 2018).
Vietnam has made significant progress in combating deforestation by expanding its planted forest areas from 3.23 million hectares in 2011 to 4.65 million hectares in 2022 raising forest cover to 42%. These reforestation efforts, if focused on native species, can improve biodiversity and soil quality, and offer large carbon storage potential (Phan et al., 2024).
The government also supports organic and sustainable farming through policies like the National Organic Development Program (2020–2030), reducing pressure on forests from agricultural expansion (Ministry of Nature, Energy and Tourism, 2022). Additionally, motivating local communities to manage forests promotes long-term conservation based on local knowledge (Phan et al., 2024).
5.4.1
Vietnam is internationally recognized as one of the most biologically diverse countries in the world, home to around 16% of all known species including approximately 20,000 plants, 10,500 terrestrial animals, 2,000 invertebrates and freshwater fish, and over 11,000 marine species (Ministry of Toerism Vietnam, z.d.). However, like many other countries, Vietnam is experiencing increasing biodiversity degradation. Despite efforts to address biodiversity loss through policies, national strategies and various projects, it remains a major challenge that requires the whole-of-society efforts, including the ones of the public sector, civil society organizations, and notably, the economic sector (Thuaire et al., 2021).
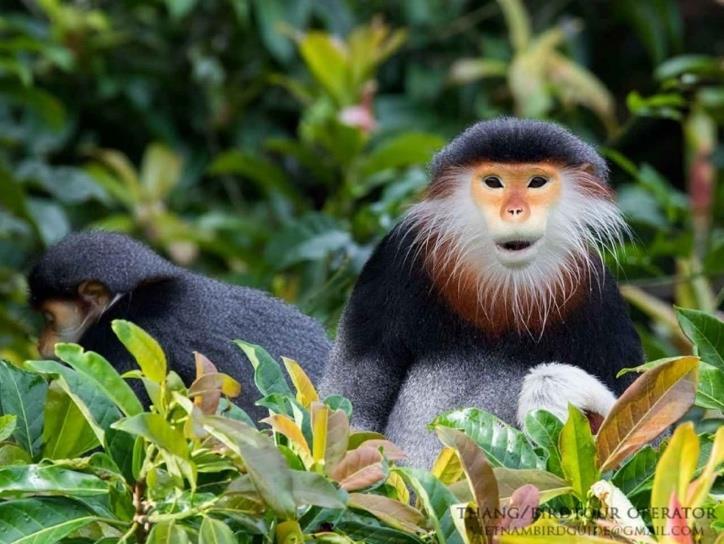
There are numerous causes, direct and indirect, for biodiversity loss in Vietnam, such as overexploitation of natural resources, illegal logging, illegal wildlife trade, infrastructure development, intensive farming expansion, along with other economic production activities catering for ever-growing human needs (Thuaire et al., 2021).
Between 2000 and 2018, over 10,500 square kilometres of forested land were converted to plantations or other land uses, causing fragmentation and degradation of critical habitats (VnExpress, 2021). Illegal logging, particularly in remote regions, continues to diminish forest cover, even as the country attempts reforestation efforts (Viet Nam, n.d.).
5.4.2 Biodiversity issues in Vietnam
Vietnam is also a major hotspot in the global illegal wildlife trade. It serves as both a source and transit country for endangered species such as pangolins, tigers, and rhinos. The demand for exotic animals and traditional medicine ingredients fuels this trade, posing a severe threat to native wildlife. Organizations such as Education for Nature Vietnam (ENV) have been essential in raising awareness and pressuring authorities to enforce anti-trafficking laws more effectively (Duwe et al., 2020).
Beyond illegal trade, overexploitation of natural resources also endangers wildlife. Unsustainable fishing practices andoverharvesting of plants and animals are diminishing populations across ecosystems. Additionally, invasive species have disrupted native ecological balances, and climate change has begun to affect habitats and species that are highly sensitive to shifts in temperature and precipitation (Wildlife Trade Report From TRAFFIC, n.d.; Duwe et al., 2020).
Several iconic species in Vietnam are critically endangered. The Saola, also known as the "Asian unicorn", is one of the world’s rarest mammals and may be on the edge of extinction. The Javan rhinoceros was declared extinctin Vietnam in 2010due to poaching. Pangolins remain one of the most trafficked animals globally, and Vietnam is a key market. The black-shanked douc, a striking primate species, is under increasing threat from deforestation and hunting (Duwe et al., 2020).
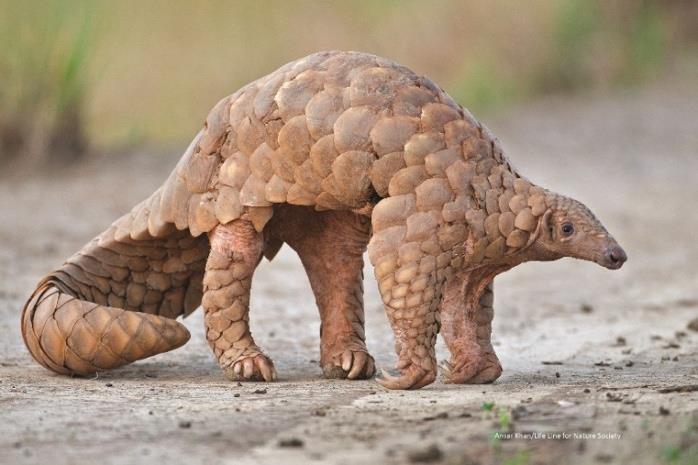

5.4.3
In response to these threats, Vietnam has established a network of 126 conservation areas, including 30 national parks, to protect its biodiversity (Markowski et al., 2019). The country has also enacted legal frameworks to restrict wildlife trafficking and promote forest protection, although enforcement is often hindered by lack of funding and institutional weaknesses. Conservation NGOs, including WWF and ENV, play a key role in monitoring, education, and capacity building (Duwe et al., 2020).
Despite these efforts, Vietnams’ biodiversity crisis requires more robust action. Strengthening law enforcement, improving land-use planning, engaging local communities, and enhancing cooperation with international partners are essential to preserving the country’s natural heritage. Vietnams’ biodiversity is not only vital for ecological health but also for cultural identity and long-term sustainable development (Wildlife Trade Report From TRAFFIC, n.d.).
Vietnam is at an important point in its journey towards sustainability. The country has already made strong progress in reducing poverty, improving access to clean water, and aligning its policies with the UN’s Sustainable Development Goals. But at the same time, it still faces serious environmental challenges like air and water pollution, deforestation, and biodiversity loss.
That said, there are also many reasons to be optimistic. The Vietnamese government and various organizations are actively working on solutions, such as investing in renewable energy, protecting forests, and trying to take action against illegal wildlife trade. Vietnam has a lot of potential, especially when it comes to solar and wind energy, but more needs to be done. Stronger laws, better cooperation with international partners, and more public awareness are all key to real, lasting change.
This report shows that while the challenges are big, the solutions are within reach. With the right choices, Vietnam can build a greener future and become one of the leaders in sustainability in the region.
Agusa, T., Pham, T. K. T., Mai, V. L., Do, D. H. A., Tanabe, S., Pham, P. H. V., & Berg, M. (2013). Human exposure to arsenic from drinking water in Vietnam. Science of the Total Environment, 488–489, 562–569. https://doi.org/10.1016/j.scitotenv.2013.10.039
Asian Development Bank. (2024). Vietnam country partnership strategy 2024–2028. https://www.adb.org
B&Company. (2024, August 21). From trash to treasure: Vietnam’s waste-to-energy revolution. https://b-company.jp/from-trash-to-treasure-vietnams-waste-to-energy-revolution/
BIOFIN. (n.d.). Viet Nam. https://www.biofin.org/viet-nam
Cho, M.-R. (2018). Environmental sustainability in Asia – Vietnam (single)_2. Green Policy Platform. https://www.greenpolicyplatform.org/sites/default/files/downloads/resource/Environmental% 20Sustainability%20in%20Asia%20-%20Vietnam%20(single)_2.pdf
Chu, H. (2018). Environmental pollution in Vietnam: Challenges in management and protection. Journal of Vietnamese Environment, 9(1), 1–3. http://dx.doi.org/10.13141/jve.vol9.no1.pp1-3
Duwe, K., Van Vu, L., & Von Ritle, T. (2020). Contributions to the biodiversity of Vietnam –Results of VIETBIO inventory work and field training in Cuc Phuong National Park. Biodiversity Data Journal, 10, e77025. https://doi.org/10.3897/BDJ.10.e77025
ECLIM Vietnam Environment Joint Stock Company. (n.d.). Water pollution in Vietnam. https://eclim.vn/en/water-pollution-in-vietnam.html
General Statistics Office of Vietnam. (2022). Vietnam sustainable development statistical indicators 2022. https://www.gso.gov.vn
GreenID Vietnam. (2023). Vietnam energy transition outlook report. https://www.greenidvietnam.org.vn
Heinrich Böll Stiftung Southeast Asia. (2023). Sustainable development in Vietnam: Local innovation and climate solutions. https://www.vn.boell.org
Huynh, T. H. (2020). Current situation of water pollution in Vietnam and some recommendations. IOP Conference Series: Earth and Environmental Science, 442, 012014. https://doi.org/10.1088/1755-1315/442/1/012014
International Renewable Energy Agency. (2024a). Renewable energy roadmap: Vietnam 2024 update. https://www.irena.org
International Renewable Energy Agency. (2024b). Vietnam energy profile. https://www.irena.org
Markowski, J., An, L. T., & Bartos, M. (2019). The comparative analyses of selected aspects of conservation and management of Vietnam’s national parks. Nature Conservation, 25, 115–130. https://doi.org/10.3897/natureconservation.25.19973
McKinsey & Company. (2019). Charting a low-carbon path for Vietnam: The power of renewables. https://www.mckinsey.com
Ministerie van Landbouw, Natuur en Voedselkwaliteit. (2023, May 18). Fertilizers and agrochemicals use in Viet Nam. Agroberichten Buitenland. https://www.agroberichtenbuitenland.nl/actueel/nieuws/2021/09/07/fertilizers-and-agrochemicals-use-in-viet-nam
Ministry for Foreign Affairs of Finland. (2023). Vietnam water and wastewater management – An opportunity for sustainable solutions. https://um.fi/edustustojen-raportit//asset_publisher/W41AhLdTjdag/content/vietnam-water-and-wastewater-management-anopportunity-for-sustainable-solutions/384951
Ministry of Natural Resources and Environment Vietnam. (2022). Vietnam’s climate change strategy to 2050. https://www.monre.gov.vn
Nguyen, T. K., Nguyen, H., Truong, C., Huang, Y., & Zhou, J. (2019). Chemical and microbiological risk assessment of urban river water quality in Vietnam. Environmental Geochemistry and Health, 41, 1593–1608. https://doi.org/10.1007/s10653-019-00302-w
Nguyen, T., et al. (2020). Air quality and its impact on public health in Vietnam’s urban areas. Science of the Total Environment, 733, Article 139272. https://doi.org/10.1016/j.scitotenv.2020.139272
Nowakowski, P., & Wala, M. (2020). Challenges and innovations of transportation and collection of waste. In Urban Ecology (pp. 423–441). Elsevier. https://doi.org/10.1016/B9780-12-820730-7.00023-9
Our World in Data. (2021). Vietnam: Energy mix. https://ourworldindata.org/energy
Oxfam Vietnam. (2023). Leaving no one behind: Inequality and development in rural Vietnam. https://vietnam.oxfam.org
Phan, T. T. N., Plank, Z., & Hufnagel, L. (2024). A scientific review on the issues of sustainability in Vietnam during the period from 2011 to 2021. International Journal of Sustainable Development and Planning, 19(4), 365–378. https://doi.org/10.18280/ijsdp.190404
Phan, T. T., Hoang, T. L., Nguyen, D. T., Do, T. L. C., Nguyen, H. C., & Pham, V. H. (2019). The context of REDD+ in Vietnam: Drivers, agents and institutions (2nd ed.). https://doi.org/10.17528/cifor/007402
Raihan, A., Mohammad, M., & Sakar, T. (2025, January). The influence of different environmental factors toward Vietnam’s net-zero emissions goal. International Journal of Green Development, 5(1), 1–10. https://doi.org/10.1016/j.igd.2025.100229
Tan Hoi, H. (2019). Current situation of water pollution in Vietnam and some recommendations. https://doi.org/10.1088/1755-1315/442/1/012014
Thuaire, B., Allanic, Y., Hoang Viet, A., Le Khac, Q., Luu Hong, T., Nguyen The, C., & Nguyen Thi, T. (2021). Assessing the biodiversity in Viet Nam – Analysis of the impacts from the economic sectors. WWF-Viet Nam. https://vietnam.panda.org/?370898/Report-onViet-Nam-biodiversity-outlook-analyzing-impacts-from-economic-sectors-to-addressbiodiversitydegradation#:~:text=Agriculture%2C%20forestry%2C%20and%20aquaculture%20are%20a mong%20the%20biggest,and%20the%20Nature%20and%20Biodiversity%20Conservation% 20Agency%20%28BCA%29.
TRAFFIC. (n.d.). New research shows alarming levels of online illegal wildlife trade in Vietnam. https://www.traffic.org/publications/reports/new-research-shows-alarming-levelsof-online-illegal-wildlife-trade-in-vietnam/
U.S. Energy Information Administration. (2020). Vietnam electricity generation data. https://www.eia.gov
UNDP Vietnam. (2023). SDG progress report: Vietnam 2023. https://www.vn.undp.org
United Nations Economic and Social Commission for Asia and the Pacific. (2023). AsiaPacific SDG progress report 2023. https://www.unescap.org
United Nations Environment Programme. (2021). The state of the environment: Water pollution and human health. https://www.unep.org/resources/report/state-environment-waterpollution-and-human-health
Van Quock, Q., & Quan Trang, B. (2018). Drivers of deforestation and forest degradation in Vietnam: An exploratory analysis at the national level. Forest Policy and Economics, 90, 128–135. https://doi.org/10.1016/j.forpol.2018.02.004
VietnamPlus. (2024, November 29). Changing consumption habits around plastics to protect the sea. https://en.vietnamplus.vn/changing-consumption-habits-around-plastics-to-protectthe-sea-post244605.vnp
Vizzuality. (n.d.). Vietnam interactive forest map & tree cover change data. Global Forest Watch. https://www.globalforestwatch.org/map/country/VNM
Voluntary National Reviews. (2023). Vietnam voluntary national review 2023. High-Level Political Forum. https://hlpf.un.org/countries/vietnam/voluntary-national-reviews-2023
Vu, N. H. (2019). Animal waste treatment in Vietnam – Current situation and solutions. https://www.researchgate.net/publication/342887310_Animal_waste_treatment_in_Vietnam_ -_Current_situation_and_solutions
World Bank. (n.d.). World Bank open data. https://data.worldbank.org/indicator/SH.STA.WASH.P5
Figure 1 - The Borgen Project. (2019). Poor Vietnamese boy [Photograph]. Retrieved May 16, 2025, from https://borgenproject.org/helping-children-in-vietnam/
Figure 2 - World Bank. (2019). Drinking water in a Vietnamese school [Photograph]. Retrieved May 16, 2025, from https://projects.worldbank.org/en/results/2023/12/20/privatecapital-brings-clean-drinking-water-to-schools-and-communities-in-vietnam
Figure 3 - Ecohz. (n.d.). Dam Nai Windmills [Photograph]. Retrieved May 16, 2025, from https://www.ecohz.com/dam-nai-wind-power-vietnam
Figure 4 - Our World in Data. (n.d.). Vietnam electricity [Chart]. Retrieved May 16, 2025, from https://ourworldindata.org/energy/country/vietnam
Figure 5 - McKinsey & Company. (n.d.). Energy potential in Vietnam [Infographic]. Retrieved May 16, 2025, from https://www.mckinsey.com/industries/electric-power-andnatural-gas/our-insights/putting-renewable-energy-within-reach-vietnams-high-stakes-pivot
Figure 6 - Statista. (2018). The countries polluting the oceans the most [Infographic]. Retrieved May 16, 2025, from https://www.statista.com/chart/12211/the-countries-pollutingthe-oceans-the-most/statista.com
Figure 7 – News UCR. (n.d). The drainage canal system is filled with garbage [Photograph]. Retrieved May 16, 2025. https://news.ucr.edu/sites/default/files/2023-01/IMG-72011280[57]%20copy.jpg
Figure 8 - Saigoneer. (2018). Dead fishes near West Lake Hanoi [Photograph]. Retrieved May 16, 2025, from https://saigoneer.com/vietnam-news/2729-photos-thousands-of-dead-fishchoke-hanoi-lake
Figure 9 - Global Forest Watch. (2023). Tree cover loss [Map]. Retrieved May 16, 2025, from https://www.globalforestwatch.org/map/
Figure 10 - Global Forest Watch. (2023). Primary tree cover loss [Map]. Retrieved May 16, 2025, from https://www.globalforestwatch.org/map/
Figure 11 - Thang. (2023, August). Vietnam monkeys: Photograph of monkeys found in Vietnam [Photograph]. HummingbirdsPlus. Retrieved May 15, 2025, from https://www.hummingbirdsplus.org/nature-blog-network/wp-content/uploads/2023/08/typesof-monkeys-found-in-vietnam-4-1024x768.jpg
Figure 12 - Khan, A. (n.d.). Pangolin [Photograph]. Retrieved May 15, 2025, from https://th.bing.com/th/id/OIP.r7FRMCCNuNnG38GNkhfOMgAAAA?rs=1&pid=ImgDetMai n
Figure 13 - HowStuffWorks. (n.d.). Saola in the forest [Photograph]. Retrieved May 5, 2025, from https://animals.howstuffworks.com/endangered-species/saola.htm
9.2.1General survey in English
Questionnaire before the use of the Billie cup
Dear Students and staff members of QNU,
We are Indy and Gil from Belgium, currently completing our internship here in this beautiful city. As part of our bachelor thesis, we are conducting research on Single-Use Plastics and the potential benefits of reusable cups. In order to collect relevant data, we have designed a survey to assess general knowledge and attitudes towards these topics.
We kindly ask you to fill out the survey as thoroughly and honest as possible. Your input will greatly contribute to our research, and we sincerely appreciate your participation. Please note:
• The survey is completely anonymous. Your name will not be associated with any of the responses in our research or thesis.
• While we do request some personal information, this is solely for the purpose of contacting you if you are selected for our project and to send you a free reusable cup as a token of appreciation for your participation.
If you have any questions or would like further information, please do not hesitate to approach us. We may also cross paths in the hallways of the university, and we would be happy to discuss the survey or any other inquiries you may have.
Thank you very much for your cooperation. We look forward to your participation!
Kind regards, Indy & Gil
If you have questions, please do not hesitate to contact us: Gil Heyman: +32468277887 (Whatsapp) – gil.heyman@student.hogent.be Indy Laplasse: +32497555062 (Whatsapp) – indy.laplasse@student.hogent.be Miss. Vi: +84984105088 (Zalo) - nguyenthituongvi@qnu.edu.vn
Personal information
1) What is your name?
2) What is your e-mail address?
3) What is your age?
4) What is your telephone number?
5) What is your gender?
a) Male
b) Female
c) X
6) Which faculty are you in?
a) Faculty of Education
b) Faculty of Foreign Languages
c) Faculty of Mathematics and Statistics
d) Faculty of economics and accounting
e) Faculty of Natural sciences
f) Other: …
General information about Single-use plastics
7) Do you know what single-use plastics are? Select the single-use plastics. Multiple answers are possible.

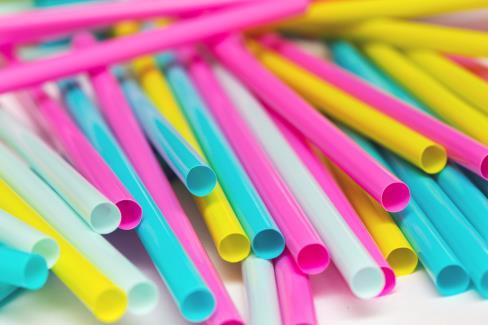

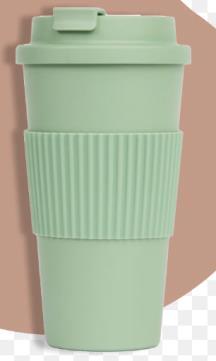
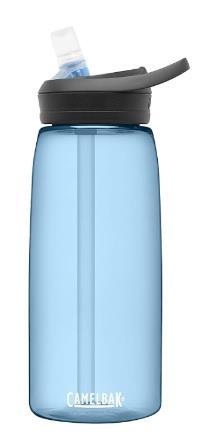
8) What do you think that happens with single used plastic now in Vietnam? (Multiple answers are possible)
a) They get collected and after that recycled
b) They get collected and burned
c) They get collected and then dumped in a landfill
d) Other: …
9) Did you know that Vietnam tries to reduce their single used plastic consumption? Can you give some examples how they try to do that?
10)What is, according to you, the most negative effect of single-use plastics? Rank them from 1 to 5, where 1 is small impact and 5 is very negative impact.
a) Environmental pollution
b) Harm to wildlife (Animals)
c) Not biodegradable
d) Increases your own carbon footprint
e) Harm to humans
11) Do you have alternatives to reduce your consumption of single used plastics? Can you give an example.
12) Would you like to make a poster about the dangers of single-use plastics in collaboration with us?
a) Yes
b) No
13) What is the best way for you to learn about Single-Use-Plastics? (Multiple answers are possible)
a) Interactive lessons
b) By using video’s
c) By making posters
d) Via a quiz
e) Other: …
14) Do you use a reusable bottle to fill water in QNU?
a) Yes
b) No
c) Sometimes
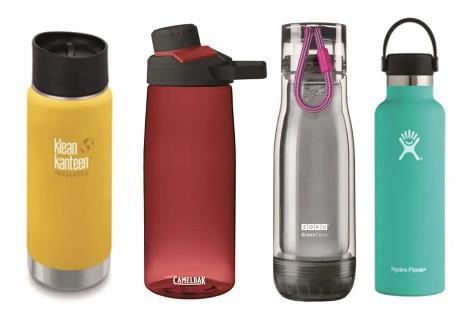
15) If you answered ‘yes’ in question 13, what is the reason? (Multiple answers are possible)
a) I want to reduce my environmental impact
b) It is cost effective to use a bottle (On the long term you save money)
c) Healthier choice because reusable bottles are made of less toxic plastic
d) Convenience, reusable bottles are portable, easier to use.
e) Customization, you can design and personalize your bottle the way you want it.
16) If you answered ‘no’ in question 13, what is the reason? (Multiple answers are possible)
a) I don’t like reusable bottles
b) I don’t have a reusable bottle, and I don’t want one
c) I don’t have a reusable bottle, but if I had one, I would use it.
d) I don’t trust the quality of the water at the water refill stations
e) I don’t know where the water-refill stations are
f) Other:…
17)Do you use straws when drinking?
a) Yes, with every drink
b) Yes, with most of my drinks
c) Yes, with some drinks
d) No
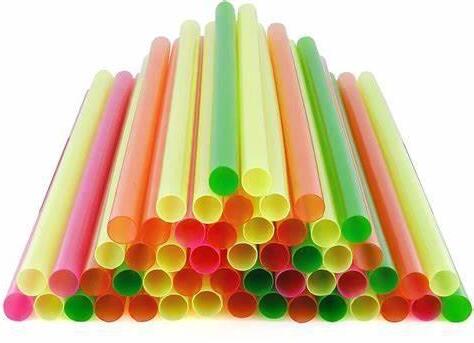
18)If you answered yes in question 16, what is the reason you use straws? (Multiple answers are possible)
a) Convenience – Straws make it easier to drink, especially with larger or deeper cups.
b) Prevention of Spillage – Straws help to reduce mess.
c) Hygiene – A straw prevents direct contact with the rim of a glass or can, which can be useful in public or less clean environments.
d) Drinking on the Go – While driving or walking, a straw makes it easier to drink without the risk of spilling.
e) Better Drinking Experience – Some people find that straws provide a more enjoyable drinking experience, such as by offering a better distribution of liquid in the mouth.
f) Prevention of Stains – For drinks like coffee, tea, or red wine, a straw can help minimize stains on the teeth.
g) Other:…
19) Would you use more sustainable straws, like plants: straw, metal or bamboo straws?
a. Yes
b. No
c. Sometimes
d. I don’t use straws
20)If you answered ‘Yes’ in question 18, what is the reason you would use more sustainable straws? (Multiple answers are possible)
a. To reduce my impact on the environment
b. Because of their durability, they last much longer than normal straws
c. Healthier option, the durable straws contain fewer toxic chemicals
d. Cost-effective, when you use durable straws, it saves money on the long term.
21) Do you use reusable bags?
a) Never
b) Less than 1 time a week
c) 1 or 2 times a week
d) 3 to 5 times a week
e) 5 to 10 times a week
f) More than 10 times a week
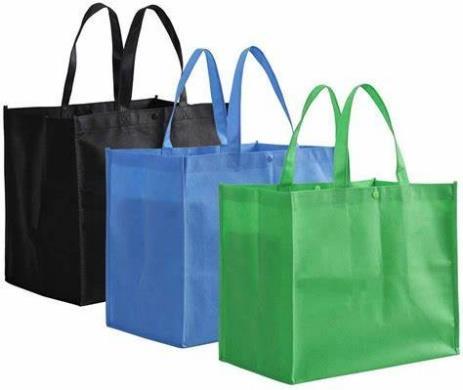
22)If QNU had reusable bags, would you use them
a) Yes
b) No, I prefer plastic bags
23) If you answered ‘Yes’ in question 21, why would you use reusable bags? (Multiple answers are possible)
a. Environmental Impact (Reduces plastic waste and helps protect the planet.)
b. Durability (Reusable bags are stronger and last longer than plastic bags.)
c. Cost-Effective (Saves money in the long run by avoiding repeated purchases of plastic bags.)
d. Convenience (Easy to carry and often more spacious for shopping.)
e. Other:….
24) If you answered ‘No’ in question 21, why do you prefer plastic bags? (Multiple answers are possible)
a. Convenience (Plastic bags are lightweight, easy to use, and widely available.)
b. Cost-Effective (Plastic bags are often free or very cheap, making them an affordable option.)
c. Single-Use (Ideal for one-time use, especially for items that are only needed briefly or temporarily.)
d. Space-Saving (Plastic bags are compact and easy to store in small spaces.)
25) Do you use reusable cutlery (fork, knife, spoon)?
a) Never
b) Less than 1 time a week
c) 1 or 2 times a week
d) 3 to 5 times a week
e) 5 to 10 times a week
f) More than 10 times a week
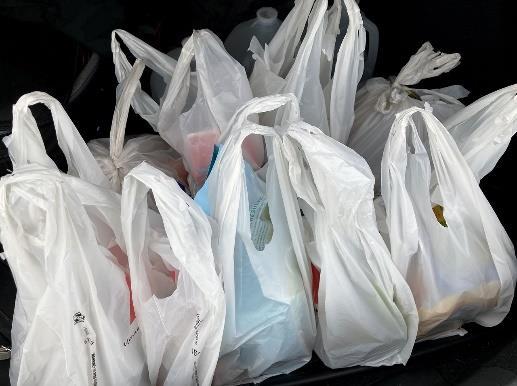
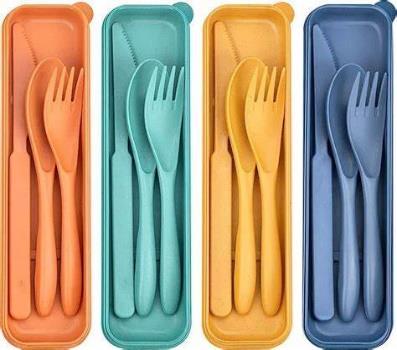
26)If QNU had reusable cutlery, would you use them?
a) Yes
b) No, I prefer plastic cutlery
27) If you answered ‘Yes’ in question 25, why would you use reusable cutlery? (Multiple answers possible)
a) Sustainability (Reduction of waste)
b) Cost saving on a long term
c) Health (No single used plastics/ or other toxic materials)
d) Aesthetics and style
e) Other:…
28) If you answered ‘No’ in question 25, why do you prefer plastic cutlery? (Multiple answers possible)
a. Convenience (Plastic cutlery is light weight, disposable and easy to use)
b. Affordability (Plastic cutlery is cheaper)
c. Hygiene (Less risk of contamination)
d. Lack of alternatives (Reusable cutlery is not everywhere available)
e. Other:…
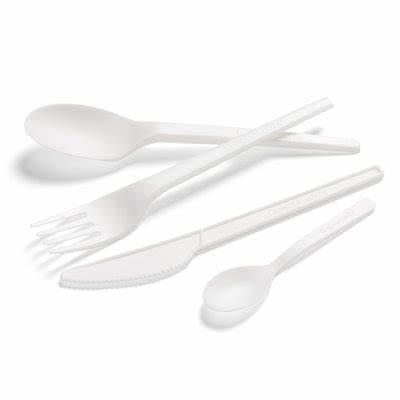
29) How often in the week do you use a disposable cup (for coffee, soda,…) in the canteen at the university?
a) Less than 1 time a week
b) 1 or 2 times a week
c) 3 to 5 times a week
d) 5 to 10 times a week
e) More than 10 times a week
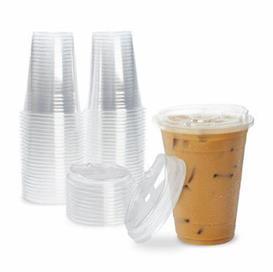
30) If QNU had reusable cups, would you use them?
a) Yes
b) No
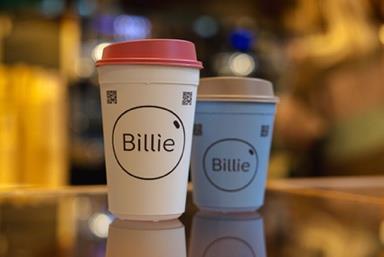
31) If you answered ‘Yes’ in question 29, why would you use reusable cups? (Multiple answers possible)
a) To reduce my impact on the environment
b) Because It will be obligatory in the future
c) Because I like the look of a reusable cup
d) Because I don’t like single use plastic cups
e) Because animals die due to single use plastic
f) Because single use plastics are bad for my health
g) Others: …
32) If you answered ‘No’ in question 29, why do you prefer plastic cups instead of reusable cups? (Multiple answers possible)
a) It is cheaper
b) You don’t need to wash it every time after use
c) You don’t have to take it everywhere
d) They are not big and bombastic
e) They are available everywhere
f) Other:
33) What do you think are benefits of using reusable cups, bags,… (Multiple answers are possible)
a) Reduces environmental pollution
b) Reduces negative impact on animals
c) Improves air quality
d) Contributes to energy conservation
e) Decreases global warming
f) Other:
34) You think it is easy for you to always bring your reusable cup (if you had one) to QNU?
a) Yes
b) No
35) What is easier for you?
a) Personal cup that you can bring home and wash yourself
b) A reusable cup, for which you pay a bit more, and get money back if you deposit the cup at the canteen.
c) Both are fine for me.
36) What do you think can motivate you the most to use reusable cup? (Multiple answers are possible)
a) Receive a reduction when you buy drinks while using a reusable cup
b) Receive a free drink when you use the cup 10 times in the canteen
c) For me, the free cup is already an incentive
d) Other: …
Questionnaire before the use of the Billie cup
Các bạn sinh viên QNU thân mến,
Chúng tôi là Indy và Gil đến từ Bỉ, hiện đang hoàn thành kỳ thực tập tại thành phố xinh
đẹp này. Trong luận văn tốt nghiệp, chúng tôi đang tiến hành nghiên cứu về Single-Use
Plastics và những lợi ích tiềm năng của cốc tái sử dụng. Để thu thập dữ liệu liên quan, chúng tôi đã thiết kế một bảng khảo sát nhằm đánh giá kiến thức và thái độ chung về những đề tài này.
Chúng tôi rất mong bạn hoàn thành bảng khảo sát một cách đầy đủ và honest nhất có thể. Ý kiến đóng góp của bạn sẽ góp phần rất lớn vào nghiên cứu của chúng tôi, và chúng tôi chân thành cảm ơn sự tham gia của bạn.
Xin lưu ý:
• Bảng khảo sát này hoàn toàn ẩn danh. Tên của bạn sẽ không được liên kết với bất kỳ phản hồi nào trong nghiên cứu hoặc luận văn của chúng tôi.
• Mặc dù chúng tôi có đề nghị cung cấp một số thông tin cá nhân, điều này chỉ nhằm mục đích liên lạc với bạn nếu bạn được chọn cho dự án và để gửi tặng bạn một chiếc cốc tái sử dụng miễn phí như một lời cảm ơn vì đã tham gia.
Nếu bạn có bất kỳ thắc mắc nào hoặc muốn biết thêm thông tin, xin đừng ngần ngại liên hệ với chúng tôi. Chúng ta cũng có thể tình cờ gặp nhau ở các hành lang của trường, và
chúng tôi rất vui được trao đổi về bảng khảo sát hoặc bất kỳ câu hỏi nào khác mà bạn có.
Chân thành cảm ơn sự hợp tác của bạn. Chúng tôi rất mong bạn tham gia!
Trân trọng, Indy & Gil
Personal information
37) Xin cho biết tên của bạn?
38) Địa chỉ email của bạn là gì?
39) Bạn bao nhiêu tuổi?
40) Giới tính của bạn là gì?
d) Nam e) Nữ
f) X
41) Bạn thuộc khoa nào?
g) Khoa Sư phạm
h) Khoa Ngoại ngữ
i) Khoa Toán và Thống kê
j) Khoa Kinh tế và Quản trị Kinh doanh
k) Khác: …
General information about Single-use plastics
42)Bạn có biết nhựa dùng một lần là gì không? Hãy chọn các loại nhựa dùng một lần. Có thể chọn nhiều đáp án.
43)Theo bạn, điều gì đang xảy ra với nhựa dùng một lần hiện nay ở Việt Nam? (Có thể chọn nhiều đáp án)
e) Chúng được thu gom và sau đó được tái chế
f) Chúng được thu gom và đốt
g) Chúng được thu gom rồi đổ bỏ
h) Khác: …
44)Bạn có biết Việt Nam đang cố gắng giảm việc tiêu thụ nhựa dùng một lần không?
Bạn có thể nêu một vài ví dụ về cách mọi người ở đây đang nỗ lực làm điều đó không?
45)Theo bạn, tác động tiêu cực nhất của nhựa dùng một lần là gì? Hãy xếp hạng chúng từ 1 đến 5, trong đó 1 là tác động nhỏ và 5 là tác động rất tiêu cực.
f) Ô nhiễm môi trường
g) Gây hại cho động vật hoang dã (Động vật)
h) Không thể phân hủy sinh học
i) Tăng dấu chân carbon của bạn
j) Gây hại cho con người
46) Bạn có biện pháp thay thế nào để giảm việc sử dụng nhựa dùng một lần không? Bạn
có thể đưa ra một ví dụ không?
47) Bạn có muốn cùng chúng tôi làm một áp phích về mối nguy hại của nhựa dùng một
lần không?
c) Có
d) Không
48) Cách tốt nhất để bạn tìm hiểu về Nhựa Dùng Một Lần là gì? (Có thể chọn nhiều đáp án)
f) Bài học có tính tương tác
g) Bằng cách sử dụng video
h) Bằng cách làm áp phích
i) Thông qua một bài kiểm tra
j) Khác: …
49) Bạn có dùng bình tái sử dụng để lấy nước ở QNU không?
d) Có
e) Không
f) Thỉnh thoảng
50) Nếu bạn trả lời ‘Có’ cho câu hỏi số 13, hãy cho biết lý do? (Có thể chọn nhiều đáp án)
f) Tôi muốn giảm tác động đến môi trường của mình
g) Sử dụng bình nước có hiệu quả về chi phí (bạn sẽ tiết kiệm được tiền về lâu dài)
h) Lựa chọn tốt hơn cho sức khỏe vì bình tái sử dụng được làm từ loại nhựa ít độc hại hơn
i) Tiện lợi, bình tái sử dụng dễ mang theo, dễ sử dụng.
j) Tùy chỉnh, bạn có thể thiết kế và cá nhân hóa bình nước của mình theo ý muốn.
51)Nếu bạn trả lời ‘không’ cho câu hỏi số 13, hãy cho biết lý do? (Có thể chọn nhiều đáp án)
g) Tôi không uống nước ở QNU
h) Tôi không thích bình tái sử dụng
i) Tôi không có bình tái sử dụng, và tôi cũng không muốn có
j) Tôi không có bình tái sử dụng, nhưng nếu có, tôi sẽ dùng.
k) Tôi không tin tưởng vào chất lượng nước
l) Tôi không biết trạm để lấy thêm nước ở đâu
m)Khác:…
52)Bạn có dùng ống hút khi uống không?
e) Có, với mọi loại đồ uống
f) Có, với hầu hết các loại đồ uống của tôi
g) Có, với một số loại đồ uống
h) Không
53)Nếu bạn đã trả lời có cho câu hỏi 16, hãy cho biết lý do bạn sử dụng ống hút? (Có thể chọn nhiều đáp án)
h) Tiện lợi – Ống hút giúp uống dễ dàng hơn, đặc biệt với cốc to hoặc sâu.
i) Chống tràn đổ – Ống hút giúp hạn chế đổ ra ngoài.
j) Vệ sinh – Ống hút giúp tránh việc tiếp xúc trực tiếp với miệng ly hoặc lon, hữu ích ở những nơi công cộng hoặc môi trường kém vệ sinh.
k) Uống khi đang di chuyển – Khi lái xe hoặc đi bộ, ống hút giúp uống dễ dàng hơn mà không lo đổ tràn.
l) Trải nghiệm uống tốt hơn – Một số người cho rằng ống hút mang lại trải nghiệm uống thú vị hơn, chẳng hạn như giúp phân tán đồ uống đều hơn trong miệng.
m) Giảm ố răng – Đối với đồ uống như cà phê, trà hoặc rượu vang đỏ, ống hút có thể giúp hạn chế những vết ố trên răng.
n) Khác:…
54) Bạn có muốn sử dụng ống hút bền vững hơn, chẳng hạn như ống hút, ống hút kim loại hoặc tre không?
a. Có
b. Không
c. Thỉnh thoảng
d. Tôi không dùng ống hút
55)Nếu bạn trả lời ‘Có’ cho câu hỏi 18, hãy cho biết lý do bạn dụng ống hút bền vững hơn?
(Có thể chọn nhiều đáp án)
a. Để giảm tác động của tôi đến môi trường
b. Vì chúng bền, dùng lâu hơn nhiều so với ống hút thông thường
c. Lựa chọn tốt hơn cho sức khỏe, ống hút bền chứa ít hóa chất độc hại hơn
d. Tiết kiệm chi phí, khi bạn dùng ống hút bền, bạn sẽ tiết kiệm tiền về lâu dài.
56) Bạn có sử dụng túi tái sử dụng không?
g) Không bao giờ
h) Dưới 1 lần/tuần
i) 1 hoặc 2 lần/tuần
j) 3 đến 5 lần/tuần
k) 5 đến 10 lần/tuần
l) Hơn 10 lần/tuần
57)Nếu QNU có túi tái sử dụng, bạn sẽ dùng chứ?
c) Có
d) Không, tôi thích túi nhựa hơn
58)Nếu bạn trả lời ‘Có’ cho câu hỏi 21, hãy cho biết lý do bạn dùng túi tái sử dụng? (Có thể chọn nhiều đáp án)
a. Tác động môi trường (Giảm rác thải nhựa và góp phần bảo vệ hành tinh.)
b. Độ bền (Túi tái sử dụng bền hơn và dùng được lâu hơn túi nhựa.)
c. Tiết kiệm chi phí (Giúp tiết kiệm tiền về lâu dài nhờ không phải mua nhiều túi nhựa.)
d. Tiện lợi (Dễ mang theo và thường rộng rãi hơn khi đi mua sắm.)
e. Khác:….
59)Nếu bạn trả lời ‘Không’ cho câu hỏi 22, hãy cho biết lý do bạn thích dùng túi nhựa hơn? (Có thể chọn nhiều đáp án)
a. Tiện lợi (Túi nhựa nhẹ, dễ sử dụng và có sẵn ở nhiều nơi.)
b. Tiết kiệm chi phí (Túi nhựa thường miễn phí hoặc rất rẻ, là lựa chọn dễ tiếp cận.)
c. Dùng một lần (Phù hợp cho nhu cầu sử dụng ngắn hạn hoặc tạm thời.)
d. Tiết kiệm không gian (Túi nhựa nhỏ gọn và dễ cất giữ ở không gian hẹp.)
60) Bạn có sử dụng dụng cụ ăn uống tái sử dụng (nĩa, dao, muỗng) không?
g) Không bao giờ
h) Dưới 1 lần/tuần
i) 1 hoặc 2 lần/tuần
j) 3 đến 5 lần/tuần
k) 5 đến 10 lần/tuần
l) Hơn 10 lần/tuần
61)Nếu QNU có dụng cụ ăn uống tái sử dụng, bạn sẽ dùng chứ?
c) Có
d) Không, tôi thích dụng cụ ăn uống bằng nhựa hơn
62)Nếu bạn trả lời ‘Có’ cho câu hỏi 25, hãy cho biết lý do bạn muốn dùng dụng cụ ăn
uống tái sử dụng? (Có thể chọn nhiều đáp án)
f) Tính bền vững (Giảm rác thải)
g) Tiết kiệm chi phí về lâu dài
h) Sức khỏe (Không dùng nhựa một lần/ hoặc các vật liệu độc hại khác)
i) Tính thẩm mỹ và phong cách
j) Khác:…
63)Nếu bạn trả lời ‘Không’ cho câu hỏi 25, hãy cho biết lý do bạn thích
dụng cụ ăn uống bằng nhựa hơn? (Có thể chọn nhiều đáp án)
a. Tiện lợi (Dụng cụ ăn uống bằng nhựa nhẹ, dùng một lần và dễ sử dụng)
b. Giá cả phải chăng (Dụng cụ ăn uống bằng nhựa rẻ hơn)
c. Vệ sinh (Ít nguy cơ nhiễm bẩn)
d. Thiếu lựa chọn thay thế (Dụng cụ ăn uống tái sử dụng không phải lúc nào cũng có sẵn)
e. Khác:…
64)Bạn sử dụng cốc dùng một lần (cho cà phê, nước ngọt,…) ở căn tin của trường đại
học bao nhiêu lần một tuần?
f) Ít hơn 1 lần/tuần
g) 1 hoặc 2 lần/tuần
h) 3 đến 5 lần/tuần
i) 5 đến 10 lần/tuần
j) Hơn 10 lần/tuần
65) If QNU had reusable cups, would you use them?
c) Có
d) Không
66) Nếu bạn trả lời ‘Có’ cho câu hỏi 29, hãy cho biết lý do bạn dùng cốc tái sử dụng? (Có
thể chọn nhiều đáp án)
h) Để giảm tác động của tôi đến môi trường
i) Vì đây là điều bắt buộc trong tương lai
j) Vì tôi thích vẻ ngoài của một chiếc cốc tái sử dụng
k) Vì tôi không thích cốc nhựa
l) Vì động vật chết do rác thải nhựa
m) Vì nhựa có hại cho sức khỏe của tôi
n) Khác: …
67) Nếu bạn trả lời ‘Không’ cho câu hỏi 29, hãy cho biết lý do bạn thích cốc nhựa hơn?
(Có thể chọn nhiều đáp án)
g) Nó đắt hơn
h) Bạn phải rửa nó sau mỗi lần sử dụng
i) Bạn phải mang nó đi khắp nơi
j) Chúng trông xấu xí
k) Chúng quá to và cồng kềnh
l) Chúng không phải lúc nào cũng có sẵn
m) Khác:
68)Theo bạn, những lợi ích của việc sử dụng cốc, túi tái sử dụng,… là gì? (Có thể chọn nhiều đáp án)
g) Giảm ô nhiễm môi trường
h) Giúp động vật hoang dã phát triển
i) Cải thiện chất lượng không khí
j) Góp phần tiết kiệm năng lượng
k) Giảm thiểu hiện tượng nóng lên toàn cầu
l) Khác:
69) Bạn có nghĩ rằng việc luôn mang theo cốc tái sử dụng (nếu bạn có) đến QNU là dễ
dàng không?
c) Có
d) Không
70) Điều gì dễ dàng hơn đối với bạn?
d) Mang cốc cá nhân về nhà và tự rửa
e) Một chiếc cốc tái sử dụng mà bạn trả thêm một ít chi phí và được hoàn lại tiền nếu bạn trả cốc lại ở căn tin.
f) Cả hai lựa chọn đều ổn với tôi.
71) Điều gì có thể thúc đẩy bạn nhất trong việc dùng cốc tái sử dụng? (Có thể chọn nhiều đáp án)
e) Được giảm giá khi mua đồ uống nếu dùng cốc tái sử dụng f) Nhận một đồ uống miễn phí khi bạn sử dụng cốc 10 lần ở căn tin
g) Đối với tôi, một chiếc cốc miễn phí đã là một điều khích lệ. h) Khác: …
Chúng tôi xin chân thành cảm ơn bạn đã hỗ trợ! Nếu bạn có thắc mắc, xin đừng ngần ngại liên hệ với chúng tôi:
Gil Heyman: +32468277887 – gil.heyman@student.hogent.be Indy Laplasse: +32497555062 – indy.laplasse@student.hogent.be
9.2.3 Survey bottles: week 1, 2 and 3
Dear students,
This small survey is intended for students who have received a ‘Reusable bottle’. In this small survey we want to check if you use the bottle but also if you experience any problems. Please be honest so that our results are true. We don’t mind if you didn’t use them this week, there is always the next week
Thanks in advance!
Gil Heyman and Indy Laplasse
1) What is your name?
2) What is your telephone number?
3) Did you use your reusable bottle this week? How many times?
a) Never
b) 1 to 3 times this week
c) 4 to 6 times this week
d) 6 to 10 times this week
e) More than 10 times these last weeks
4) Where did you use the reusable bottle? (Multiple answers are possible)
a) Only at the University
b) Only at home
c) At home and on the University
d) On the beach
e) In a (coffee) bar
f) All the above
g) I did not use the bottle
h) Other:………………………………….
5) What motivates you to use the reusable bottle? (Multiple answers are possible)
a) I save money because you no longer need to buy plastic bottles.
b) I contribute to reducing plastic waste.
c) I can always refill water – convenient and healthy.
d) I feel more conscious and environmentally friendly.
e) I find reusable bottles more stylish and personal compared to disposable ones.
f) Other:…………………..
6) What makes it difficult to use the reusable bottle? (Multiple answers are possible)
a) I have to remember to bring it with me everywhere I go
b) It takes time and an effort to clean the bottles
c) I find the reusable bottle too big and heavy
d) I find it difficult to find a place to refill my bottle
e) I am not motivated to use the reusable bottle
f) Other:……….
7) Why can it be more comfortable to use a plastic bottle for you? (Multiple answers are possible)
a) Plastic bottles are available everywhere
b) I do not have to worry about cleaning them
c) I can throw them away after use
d) It is standard, everyone uses a plastic bottle
e) Other:……………
8) What are you concerned about when using a reusable bottle? (Multiple answers are possible)
a) I don’t trust the water quality in Vietnam
b) If I forget my bottle, I can’t have any water
c) People are going to look at me differently because I don’t use a plastic bottle (social pressure)
d) A reusable bottle is not hygienic enough
e) Other:………………
9) In general, do you use less plastic bottles, now that you have the reusable bottle?
a) Yes
b) No
10) What do you think can help to get students to use the bottle? (Multiple answers are possible)
a) Giving guest lectures about the bottle and the positive impact you make when you use the bottle
b) Making videos about the use of the bottle
c) Making posts on social media about the bottle
d) Hanging posters and advertisements up around the University about using the bottle
e) Word of mouth advertising (When you use it, you tell your friends, and they also start to use it)
f) Other:……………………………………………………………..
9.2.4 Survey cups: week 1, 2 and 3
Dear students,
This small survey is intended for students who have received a ‘Billie Cup’. In this small survey we want to check if you use the cup, but also if you experience any problems. Please be honest so that our results are true. We don’t mind if you didn’t use them this week, there is always the next week
Thanks in advance!
Gil Heyman and Indy Laplasse
1) What is your name?
2) What is your phone number?
3) Did you use your Billie Cup this week? How many times?
f) Never
g) 1 to 3 times this week
h) 4 to 6 times this week
i) 6 to 10 times this week
j) More than 10 times these last weeks
4) Where do you use the ‘Billie Cup’? (Multiple answers are possible)
i) Only at the University
j) Only at home
k) At home and on the University
l) On the beach
m) In a (coffee) bar
n) All the above
o) I did not use the cup
p) Other:………………………………….
5) What motivates you to use the reusable cup? (Multiple answers are possible)
a) I save money because you no longer need to buy plastic cups.
b) I contribute to reducing plastic waste.
c) I feel more conscious and environmentally friendly.
d) I find reusable cups more stylish and personal compared to disposable ones.
e) Other:…………………..
6) What makes it difficult to use the reusable cup? (Multiple answers are possible)
a) I have to remember to bring it with me everywhere I go
b) It takes time and an effort to clean the cup
c) I find the reusable cup too big
d) I am not motivated to use the reusable cup
e) Other:……….
7) Why can it be more comfortable to use a plastic cup for you? (Multiple answers are possible)
a) Plastic cups are available everywhere
b) I don’t have to worry about cleaning the plastic cup
c) I can throw the cup away after use
d) It is normal to use a plastic cup, everybody does it
e) Other:………….
8) What are you concerned about when using a reusable cup? (Multiple answers are possible)
a) If I forget my cup, I can’t have any coffee/drinks
b) People are going to look at me differently because I don’t use a plastic cup (social pressure)
c) A reusable cup is not hygienic enough
d) Other:………………
9) What do you think can help to get students to use the cup? (Multiple answers are possible)
g) Giving guest lectures about the cup and the positive impact you make when you use the cup
h) Making videos about the cup
i) Making posts on social media over the cup
j) Hanging posters and advertisements up around the University about using the cup
k) Word of mouth advertising (When you use it, you tell your friends, and they also start to use it)
l) Other:……………………………………………………………..
9.2.5 Survey bottles: week 4
Dear students,
This small survey is intended for students who have received a ‘Reusable bottle’. In this small survey we want to check if you use the bottle but also if you experience any problems. Please be honest so that our results are true. We don’t mind if you didn’t use them this week, there is always the next week �� Thanks in advance!
This was the final week of our project, but we hope you'll keep using your reusable bottle in the future!
Even more, we’d love to see you become ambassadors for reusable products by encouraging your friends, family, and others to reduce plastic use and choose reusables instead.
Thank you so much for taking part and helping us move toward a cleaner planet. Your actions are making a real difference for the future!
Gil Heyman and Indy Laplasse
1) What is your name?
2) What is your telephone number?
3) Did you use your reusable bottle this week? How many times?
a) Never
b) 1 to 3 times this week
c) 4 to 6 times this week
d) 6 to 10 times this week
e) More than 10 times this week
4) Where did you use the reusable bottle? (Multiple answers are possible)
a) Only at the University
b) Only at home
c) At home and on the University
d) On the beach
e) In a (coffee) bar
f) All the above
g) I did not use the bottle
h) Other:………………………………….
5) What motivates you to use the reusable bottle? (Multiple answers are possible)
a) I save money because you no longer need to buy plastic bottles.
b) I contribute to reducing plastic waste.
c) I can always refill water – convenient and healthy.
d) I feel more conscious and environmentally friendly.
e) I find reusable bottles more stylish and personal compared to disposable ones.
f) Other:…………………..
6) What makes it difficult to use the reusable bottle? (Multiple answers are possible)
a) I have to remember to bring it with me everywhere I go
b) It takes time and an effort to clean the bottles
c) I find the reusable bottle too big and heavy
d) I find it difficult to find a place to refill my bottle
e) I am not motivated to use the reusable bottle
f) Other:……….
7) Why can it be more comfortable to use a plastic bottle for you? (Multiple answers are possible)
a) Plastic bottles are available everywhere
b) I do not have to worry about cleaning them
c) I can throw them away after use
d) It is standard, everyone uses a plastic bottle
e) Other:……………
8) What are you concerned about when using a reusable bottle? (Multiple answers are possible)
a) I don’t trust the water quality in Vietnam
b) If I forget my bottle, I can’t have any water
c) People are going to look at me differently because I don’t use a plastic bottle (social pressure)
d) A reusable bottle is not hygienic enough
e) Other:………………
9) In general, do you use less plastic bottles, now that you have the reusable bottle?
a) Yes
b) No
10) What do you think can help to get students to use the bottle? (Multiple answers are possible)
a) Giving guest lectures about the bottle and the positive impact you make when you use the bottle
b) Making videos about the use of the bottle
c) Making posts on social media about the bottle
d) Hanging posters and advertisements up around the University about using the bottle
e) Word of mouth advertising (When you use it, you tell your friends, and they also start to use it)
f) Other:……………………………………………………………..
11) Do you think you used the reusable bottle more often than in the last weeks, because there was a 10% reduction in the canteen of QNU this week?
a) Yes
b) No
12) Do you think it would have been better if there was a deposit system for the bottle in the canteen, instead of a personal bottle?
a) Yes
b) No
13) Would you recommend your family and friends to use the reusable bottle?
a) Yes
b) No
14) Do you think you will continue to use the bottle in the future?
a) Yes
b) No
15) Feel free to give us some feedback!
9.2.6 Survey Cups: week 4
Dear students,
This small survey is intended for students who have received a ‘Billie Cup’. In this small survey we want to check if you use the cup, but also if you experience any problems. Please be honest so that our results are true. We don’t mind if you didn’t use them this week, there is always the next week �� Thanks in advance!
This was also the final week of our project, but we hope you'll keep using your reusable cup in the future!
Even more, we’d love to see you become ambassadors for reusable products by encouraging your friends, family, and others to reduce plastic use and choose reusables instead.
Thank you so much for taking part and helping us move toward a cleaner planet. Your actions are making a real difference for the future!
Gil Heyman and Indy Laplasse
1) What is your name?
2) What is your phone number?
3) Did you use your Billie Cup this week? How many times?
a) Never
b) 1 to 3 times this week
c) 4 to 6 times this week
d) 6 to 10 times this week
e) More than 10 times this last week
4) Where do you use the ‘Billie Cup’? (Multiple answers are possible)
a) Only at the University
b) Only at home
c) At home and on the University
d) On the beach
e) In a (coffee) bar
f) All the above
g) I did not use the cup
h) Other:………………………………….
5) What motivates you to use the reusable cup? (Multiple answers are possible)
a) I save money because you no longer need to buy plastic cups.
b) I contribute to reducing plastic waste.
c) I feel more conscious and environmentally friendly.
d) I find reusable cups more stylish and personal compared to disposable ones.
e) Other:…………………..
6) What makes it difficult to use the reusable cup? (Multiple answers are possible)
a) I have to remember to bring it with me everywhere I go
b) It takes time and an effort to clean the cup
c) I find the reusable cup too big
d) I am not motivated to use the reusable cup
e) Other:……….
7) Why can it be more comfortable to use a plastic cup for you? (Multiple answers are possible)
a) Plastic cups are available everywhere
b) I don’t have to worry about cleaning the plastic cup
c) I can throw the cup away after use
d) It is normal to use a plastic cup, everybody does it
e) Other:………….
8) What are you concerned about when using a reusable cup? (Multiple answers are possible)
a) If I forget my cup, I can’t have any coffee/drinks
b) People are going to look at me differently because I don’t use a plastic cup (social pressure)
c) A reusable cup is not hygienic enough
d) Other:………………
9) In general, do you use less plastic cups, now that you have the reusable cup?
a) Yes
b) No
10) What do you think can help to get students to use the cup? (Multiple answers are possible)
a) Giving guest lectures about the cup and the positive impact you make when you use the cup
b) Making videos about the cup
c) Making posts on social media over the cup
d) Hanging posters and advertisements up around the University about using the cup
e) Word of mouth advertising (When you use it, you tell your friends, and they also start to use it)
f) Other:……………………………………………………………..
11) Do you think you used the reusable cup more often than in the last weeks, because there was a 10% reduction in the canteen of QNU this week?
a) Yes
b) No
12) Do you think it would have been better if there was a deposit system for the cup in the canteen, instead of a personal cup?
a) Yes
b) No
13) Would you recommend your family and friends to use the reusable cup?
a) Yes
b) No
14) Do you think you will continue to use the cup in the future?
a) Yes
b) No
15) Feel free to give us some feedback!
All 3 posters were created by the authors with the assistance of ChatGPT (OpenAI, 2025).
9.3.1 Waste Classification Poster
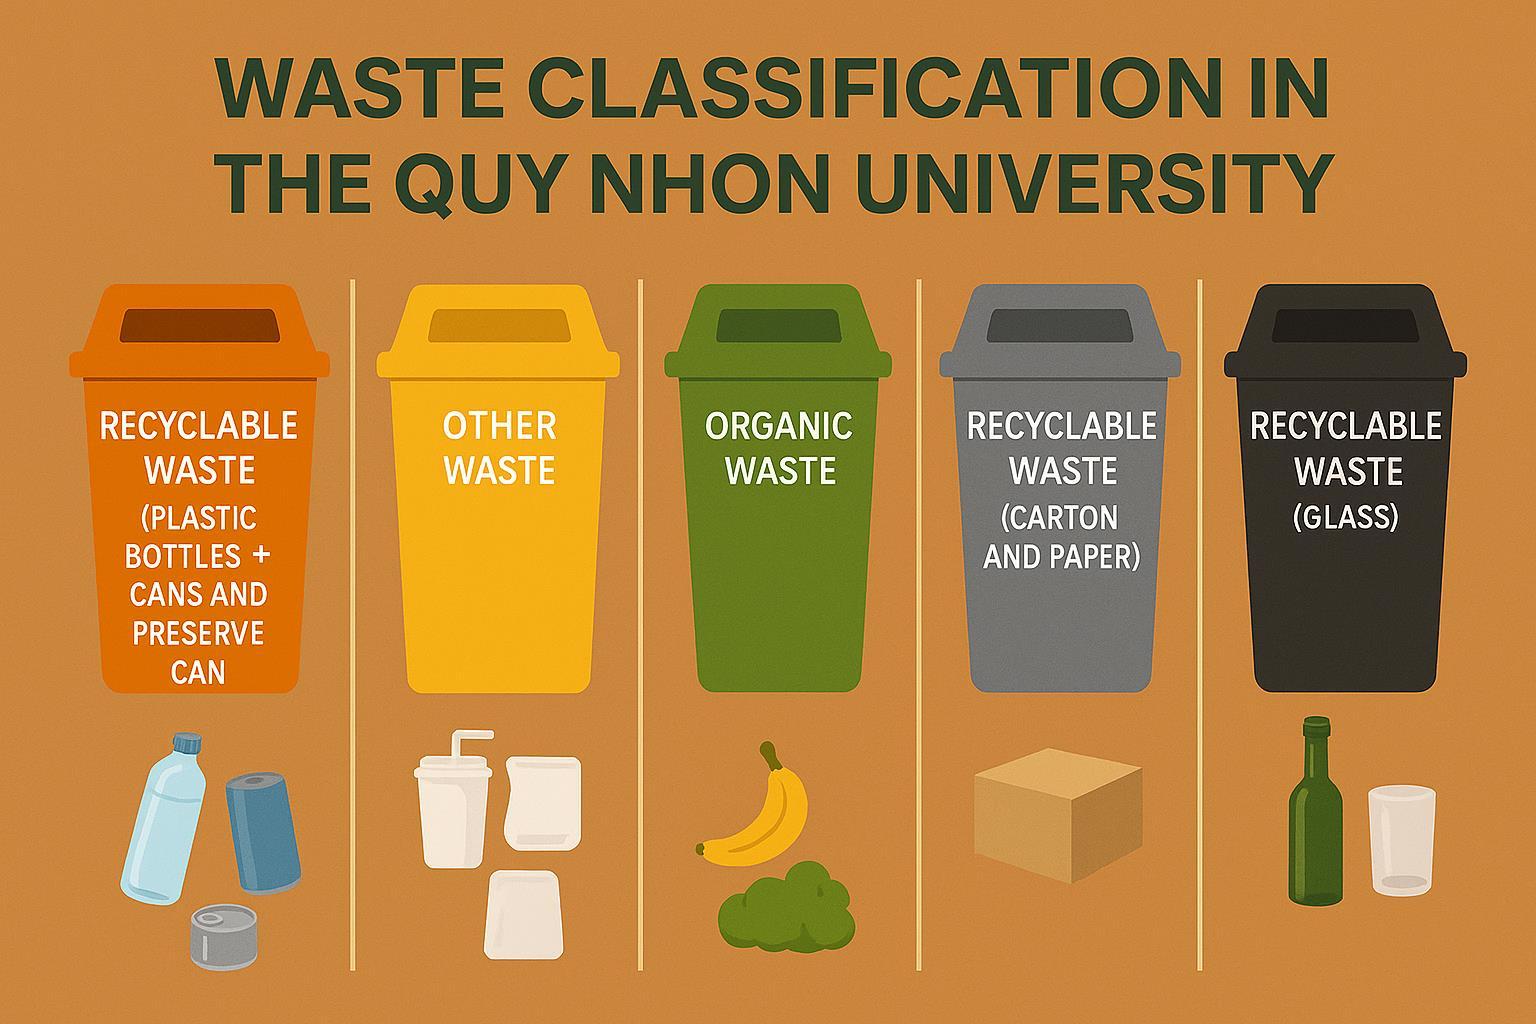
9.3.2 Awareness Poster in English
9.3.3 Awareness Poster in Vietnamese