


INTRODUCTION
This Community Health Needs Assessment (CHNA) represents a collaboration between Catholic Health, the Long Island Health Collaborative (LIHC), local community-based agencies, patients living in our community and the Suffolk County Department of Health. Catholic Health retained DataGen in the March of 2025 to provide a data analysis tool to facilitate this report, which defines the identified community health needs and barriers expressed by community members and the local community-based organizations that serve the region. This report’s primary data was collected by the Long Island Health Collaborative from January 2024 through December 2024. It includes input and comments from community members and community leaders. The secondary data used is from years 2019 – 2024. The results from multiple analyses will enable Catholic Health to deploy new and existing chronic disease prevention strategies, address relevant social determinant of health (SDOH) risk factors, and work to reduce the health disparities identified. St. Charles Hospital is one of six hospitals in the Catholic Health system. Located in Port Jefferson, New York, St. Charles Hospital offers Long Islanders the highest level of care. Known for physical therapy and rehabilitation, orthopedics, obstetrics and gynecology, sleep disorders, wound care, cardiology, pulmonary, epilepsy, stroke, diabetes, bariatrics and dental care, our doctors, nurses and supporting medical staff deliver clinical excellence and compassionate care in numerous specialties.
At Catholic Health, we are dedicated to addressing the significant health needs of the communities we serve. Catholic Health’s six hospitals continue to build community health services and education programs in five core areas: chronic disease management, providing mental health services, treating and reducing substance use disorder, preventing communicable diseases and addressing the social determinants of health, including food insecurity. In partnership with our community members and local nonprofits, churches, schools, and health departments, we are creating a healthier community, one patient at a time.
EXECUTIVE SUMMARY
St. Charles Hospital, along with Catholic Health’s other five hospitals, worked with the Long Island Health Collaborative (LIHC) and the Suffolk County Department of Health Services (SCDOHS), and dozens of community-based organizations, libraries, schools and universities, local municipalities, and other community stakeholders to produce this CHNA. SCDOHS representatives offered input and consultation, when appropriate, regarding the data analyses conducted by the LIHC, Catholic Health, and DataGen. Top, high-level findings include a continued prevalence of chronic disease incidence, particularly heart disease, diabetes, obesity and cancer. Further, increasing rates of electronic cigarette (e-cigarette) use were found particularly among youth and consistent rates of food insecurity. In 2024, members of the LIHC reviewed extensive data sets selected from both primary and secondary data sources to identify
and confirm New York State Prevention Agenda priorities for the 2025-2027 Community Health Needs Assessment cycle. Data analysis efforts were coordinated through the LIHC, which served as the centralized data return and analysis hub. As directed by the data results, community partners selected:
1. Healthcare Access and Quality Priority: Preventive Services for Chronic Disease Prevention and Control
2. Economic Stability Priority: Nutrition Security
3. Social and Community Context Priority: Tobacco/E-Cigarette Use
Primary data was obtained from a community health needs assessment survey sent to individuals and a similar survey to community-based organization leaders 1. Additionally, we looked at results from two qualitative studies to round out our primary data. 2 Secondary data was derived from publicly-available data sets curated by DataGen into its proprietary data analytics platform, CHNA Advantage ™, offering 200 plus metrics to determine health issues within Suffolk County 3 as well as other publically available data. As such, priorities selected for the 2025-2027 cycle remain unchanged from the 2022-2024 cycle selection, and the selected health disparities in which partners are focusing their efforts rests on the inequities experienced by those in historically underserved communities and communities of color. Additional Prevention Agenda priorities/disparities being addressed by St. Charles Hospital are outlined in the 2025-2027 work plan (see Appendix E).
St. Charles Hospital works with a broad range of partners to connect with the community, to assess their needs through distribution and promotion of data collection tools, and to provide interventions in collaborative settings, when appropriate. See page 12 for our extensive list of partners. We also rely on the LIHC and its role as neutral convener and regional leader, espousing the collective impact model and framework. 4 As such, the LIHC serves as a backbone organization, providing its diverse partners with data analytics and administrative support in the areas of community outreach and education, and media relations support. LIHC’s networking capabilities, its programs around walking and chronic disease awareness, and health messaging efforts reinforce and augment the interventions we provide in the chronic disease and mental health needs spaces so that we are continually in touch with the broader community. See Appendix F for list of LIHC partners.
1 Community Health Assessment Survey (CHAS) assessing responses from individuals, summary report and survey instrument (Appendix A) CBO Survey Analysis 2024, assessing responses from community-based organization leader, summary report and survey instrument (Appendix B)
2 Qualitative Analysis of Key informant Interviews Conducted among Community-Based Organization Leaders (Appendix C) Catholic Health Listening Session Summary Report (Appendix D)
3 Statewide Planning and Research Cooperative System (SPARCS), New York State Prevention Agenda dashboard, Behavioral Risk Factor, New York State Community Health Indicators by Race/Ethnicity Reports, Community Health Indicator Reports, Prevention Quality Indicators, CDC Places, and U.S. Census Bureau. The CHNA Advantage™ data analytics platform includes some of these and other state and national level indicators.
4 https://collectiveimpactforum.org/
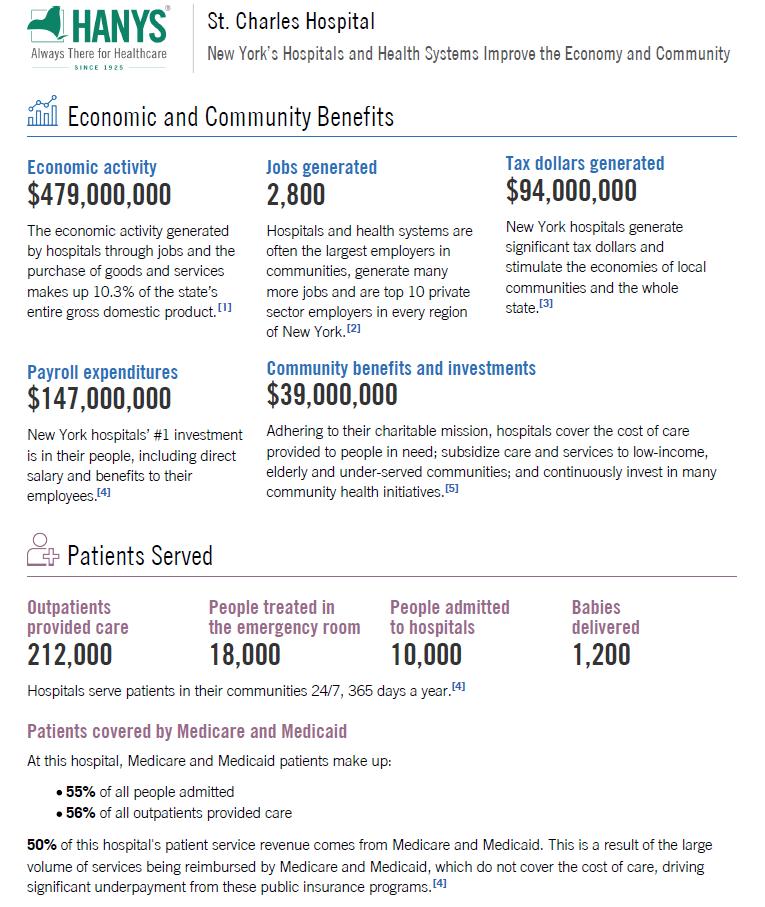
Source: Healthcare Association of New York State (2025 Community Benefit)
Description of the Community
Demographics
Suffolk County’s total population as of 2024 was 1,525,465. Approximately 18% of Suffolk County was over 65 years old and approximately 20% was under 18 years old in 2024. 5 The median age in Suffolk County in 2023 was 42.1 years. 6 In 2023, 50.4% if the population was female and 49.6% of the population was male in Suffolk County (2023 ACS, 1-year estimates). In 2024, 64.38% of the population was White, followed by 21.43% Hispanic, 7.89% Black, 4.79% Asian, 0.72% American Indian/Alaskan Native, and 0.12% Native Hawaiian/Pacific Islander. 7
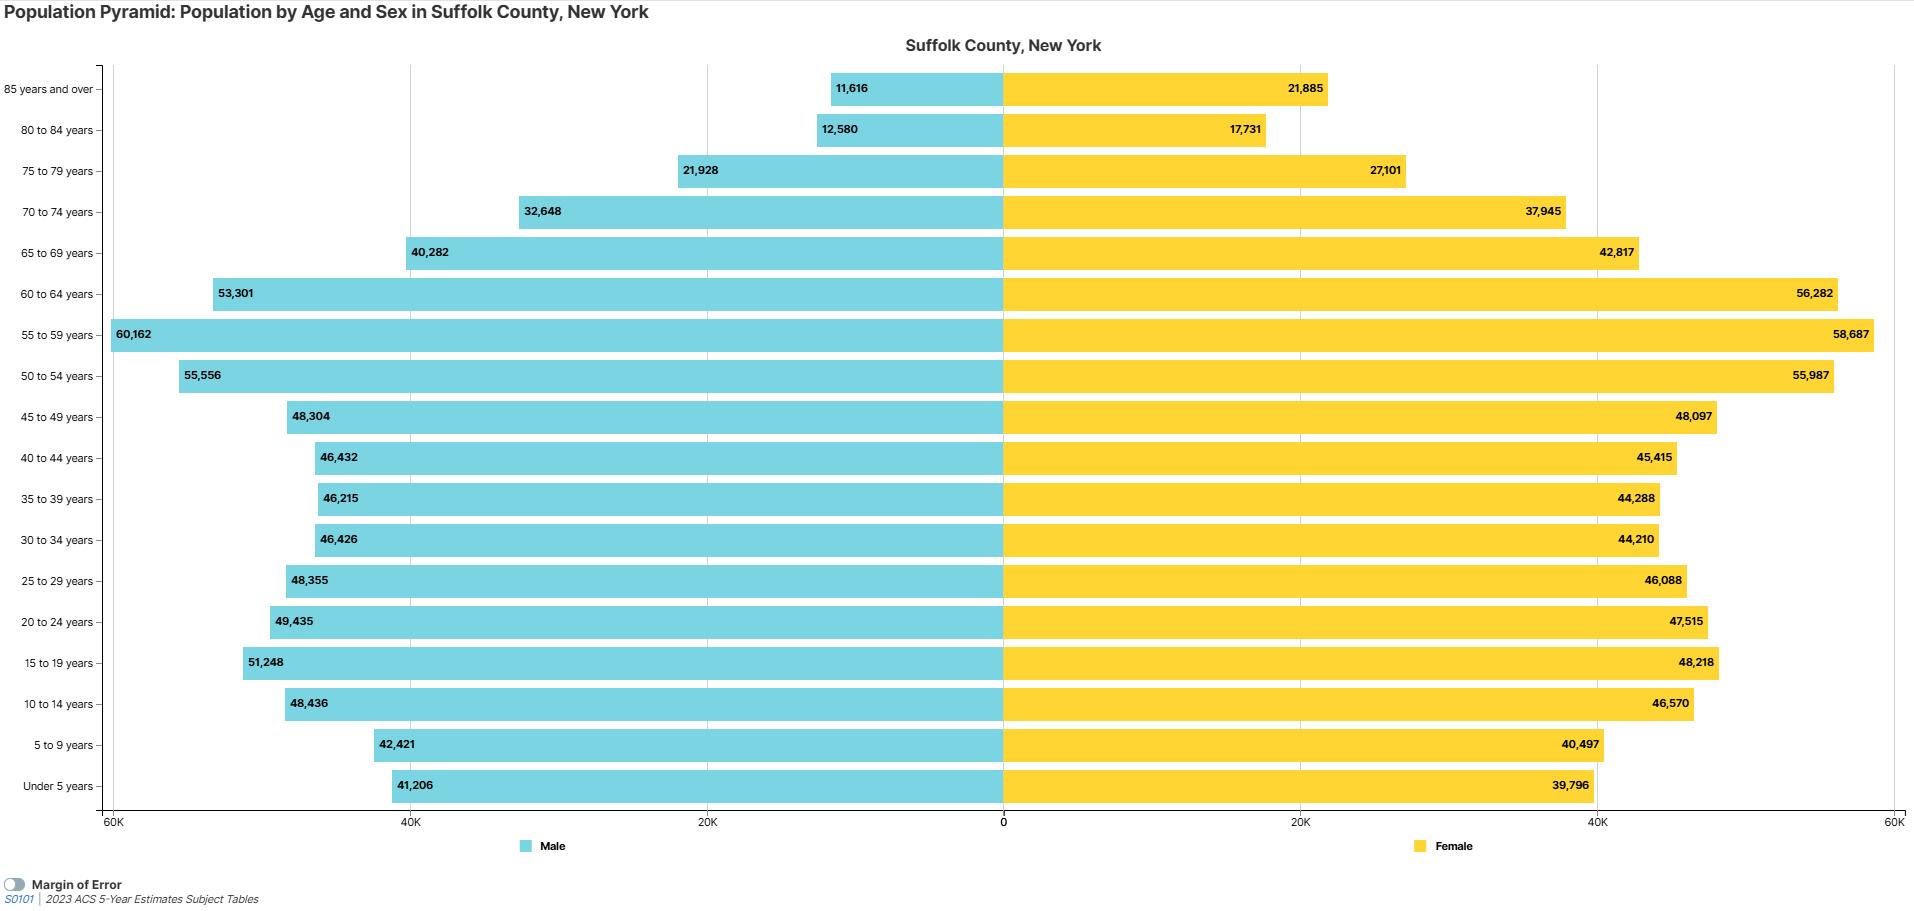
Source: https://data.census.gov/vizwidget?g=050XX00US36103&infoSection=Age+and+Sex
Geographic description
Suffolk County is 2,373 square miles and is the second largest county in New York. Catholic Health’s three hospitals in Suffolk County service this easternmost county in New Yok State.
The county is divided into 10 towns: Babylon, Brookhaven, East Hampton, Huntington, Islip, Riverhead, Shelter Island, Smithtown, Southampton, and Southold. Suffolk County is an area of growing diversity, cultures, and population characteristics.
Socioeconomic, educational and environmental factors
Income, a social determinant of health (SDOH), has been linked to poor health outcomes, greater risk for disease and shorter life spans. Income may preclude individuals from low-income communities from accessing preventive and/or medical care due to difficulty to afford co-payments/deductibles (if insured) or care at all if they are uninsured. Among insured populations, this concept in which insurance does not
5 County Health Rankings https://www.countyhealthrankings.org/health -data/new-york/suffolk?year=2024
6 U.S. Census Bureau, 2023 American Community Survey, One-Year Estimates
7 County Health Rankings https://www.countyhealthrankings.org/health -data/new-york/suffolk?year=2024
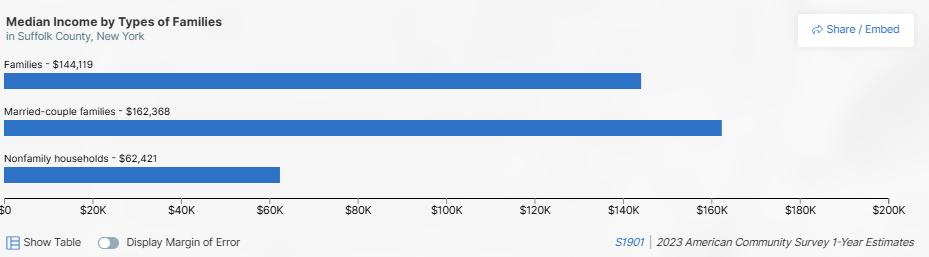
offer complete financial protection is known as underinsurance. The inability to afford co -pays and deductibles consistently rises to the top as a barrier to health care on LIHC’s Community Health Assessment Survey year and after year. In Suffolk County, the median household income was $124,045 in 2023 with 62.2% of the population 16 years and older employed In 2023, 25.2% of households made $200,000 or more. Followed by 19.8% made $100,000 to $149,999, 15.0% made $150,000 to $199,999, 10.6% made $50,000 to $74,999, 10.3% made $75,000 to $99,000, 6.2% made $35,000 to $49,000, 4.2% made $25,000 to $34,999, 3.9% made $15,000 to $24,999, 3.3% made less than $10,000, and 1.5% made $10,000 to $14,999. These estimates were inflation-adjusted. In 2023, among the population 16 years and older 62.2% were employed, 2.3% were unemployed, and 35.4% were not in the labor force 8 . In 2024, 3.12% of the population in Suffolk County was unemployed 9
Source: https://data.census.gov/profile/Suffolk...?g=050XX00US36103#populations-and-people
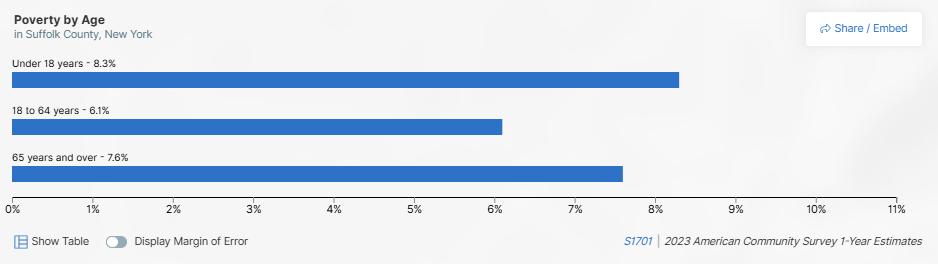
Suffolk County had a lower percent of the population in poverty at 6.8% compared to 14.2% in New York State in 2023. Individuals under 18 years old had the highest percent in poverty at 8.3% compared to 7.6% in those 65 years and older and 6.1% among those 18 to 64 years 10
Source: https://data.census.gov/profile/Suffolk...?g=050XX00US36103#populations-and-people
Among the population 18 to 24 years old, 40.6% had some college or an associate’s degree, 33.7% were a high school graduate or equivalent, 18.6% had a Bachelor’s degree or higher, and 7.1% were less than a high school graduate in 2023. Higher educational attainment was achieved among Asian populations who 54.9% had a Bachelor’s degree or higher compared to 45.1% among White, 30.9% among Black,
8 U.S. Census Bureau, 2023 American Community Survey, One-Year Estimates
9 County Health Rankings https://www.countyhealthrankings.org/health -data/new-york/suffolk?year=2024
10 U.S. Census Bureau, 2023 American Community Survey, One-Year Estimates
20.4% among American Indian or Alaskan Native, 17.5% among some other race, 30.7% among two or more races, and 20.5% among Hispanic or Latino populations. 11
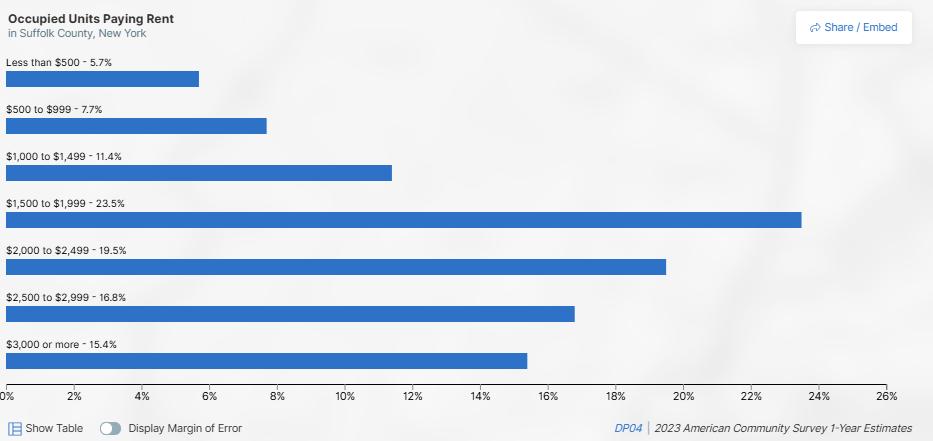
Housing is a primary issue in Suffolk County that has been described as reaching crisis proportion by the Suffolk County Department of Health. 12 In 2023, the median gross rent was $2,045 in Suffolk County compared to $1,561 in New York. Of the occupied units paying rent in 2023, 23.5% were $1,500 to $1,999. 13
Source: Suffolk County, New York - Census Bureau Profile
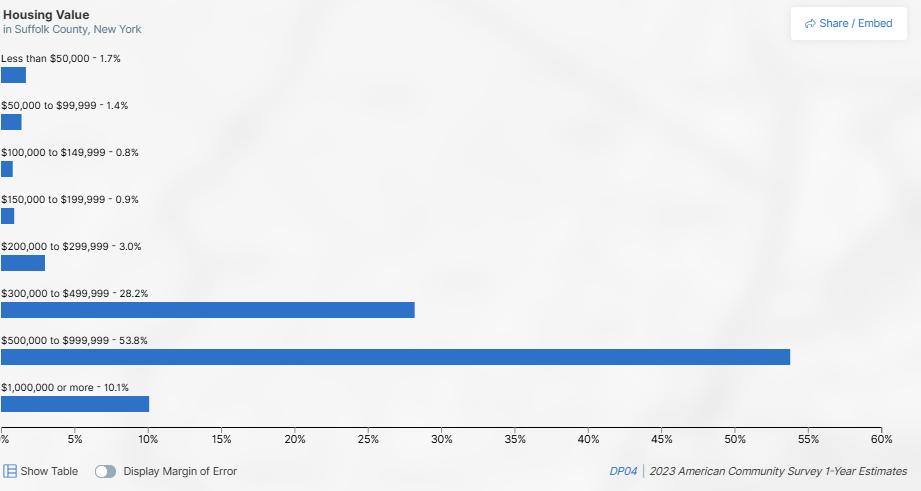
Suffolk County had a higher home ownership rate of 81.2% in 2023 compared to 54.1% in New York in 2023. The majority housing value comprised of more than $300,000 in 2023.
11 U.S. Census Bureau, 2023 American Community Survey, One-Year Estimates
12 https://suffolkcountyny.gov/Departments/Economic-Development-and-Planning/Real-Estate/Affordable-andWorkforce-Housing
13 U.S. Census Bureau, 2023 American Community Survey, One-Year Estimates
Source: Suffolk County, New York - Census Bureau Profile
Among occupied housing units in Suffolk County, the highest percent of householders moved into the unit from 2010-2017 (20.9%) followed by from 2000 to 2009 (19%), from 1989 or earlier (16%), from 2018 to 2020 (15.6%), from 2021 or later (15.3%), and from 1990 to 1999 (13.3%). Of those who moved recently (2021 or later), 11.1% were owner-occupied housing units and 33.7% were renter-occupied housing units in 2023. Of occupied unites paying rent in 2023, 42.5% had a gross rent as a percentage of household income being 35% or more. 14
In 2023, among the population 1 year and older 3.8% had moved within Suffolk County in the past year, 1.7% had moved from a different county within New York within the past year, 0.7% moved from a different state within the past year, and 0.5% had moved from abroad within the past year. Of the civilian noninstitutionalized population in Suffolk County, 95.4% were insured and 4.6% were uninsured in 2023 15
Of the non-institutionalized population in Suffolk County, 11.2% had a disability in 2023.The percent with a disability was slighter higher among females at 11.6% compared to 10.8% among males. Individuals 75 years and over had the highest percent with a disability at 41.3%, followed by 22.4% among those 65 to 74 years, 8.8% among those 35 to 64 years, 5% among those 5 to 17 years and 0.3% among those under 5 years Among disability types reported having an ambulatory difficulty was the highest being 5.9% of the percent with disability followed by having an independent living difficulty (5.2%), having a cognitive difficulty (4.4%), having a hearing difficulty (3.1%), having a self-care difficulty (2.4%), and having a vision difficulty (1.8%).
14 U.S. Census Bureau, 2023 American Community Survey, One-Year Estimates
15 U.S. Census Bureau, 2023 American Community Survey, One-Year Estimates
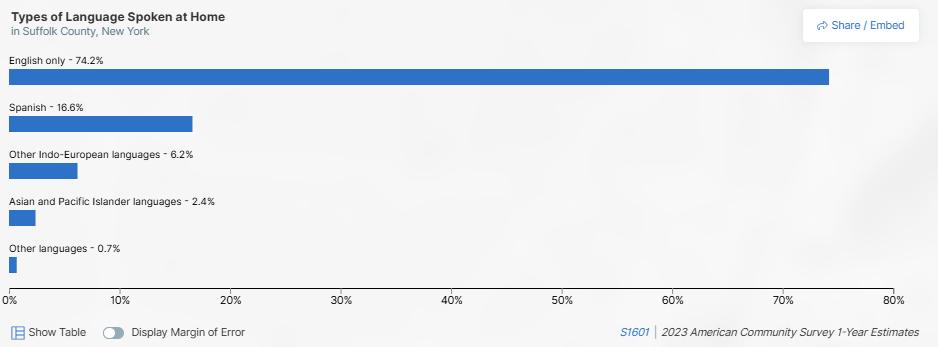
Suffolk County has a diverse population that speaks a variety of languages. In 2024, 3.80% of the population were non-English proficient. 16 In 2023, among populations 5 years and older 25.8% reported speaking a language other than English at home 17 English only was reported as the type of language spoken at home by 74.2% of the population 5 years and older followed by Spanish at 16.6%, other IndoEuropean languages at 6.2%, Asian and Pacific Islander languages at 2.4% and other languages at 0.7% in 2023.
Source: https://data.census.gov/profile/Suffolk...?g=050XX00US36103#populations-and-people
Approximately 17% of the population were foreign-born in Suffolk County in 2023 with 40.1% of foreignborn individuals were not a U.S. citizen and 59.9% were a naturalized U.S. citizen. The percent uninsured was highest among individuals 26 to 34 years old (8.9%), males (5.6%), some other race alone (13%), Hispanic or Latinos of any race (11.1%), foreign born (12.7%), individuals with less than a high school graduation (12.5%), individuals who are unemployed (18.8%), and individuals with a household income of less than $25,000 (9.1%). 18
In regards to access to care, Suffolk County is doing better than the U.S. According to CDC Places 2022 data, 5% of adults 18-64 years old are lacking health insurance in Suffolk County compared to 10.8% in the U.S. Among adults in Suffolk County, 78.3% had a routine checkup within the past year compared to 76.1% of adults in the U.S. Suffolk County also had a higher prevalence of visited a dentist or dental clinic in the past year (67.3%, 2022), cholesterol screening within the past 5 years among adults (90%, 2021), mammography use among women aged 50-74 years (78.9%, 2022), and colorectal cancer screening among adults aged 45-75 years (67.5%, 2022) compared to the U.S. (63.9%, 86.4%, 76.5%, and 66.3%, respectively). 19
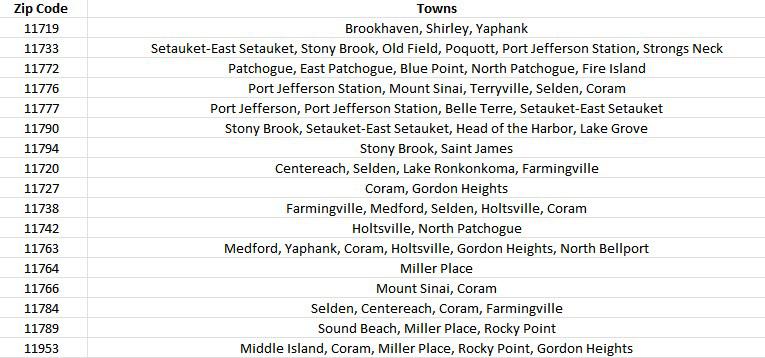
Municipalities in target community
St. Charles Hospital’s primary service area is Suffolk County. The chart below defines the zip codes and municipalities (towns) comprising the hospital’s service area.
16 County Health Rankings https://www.countyhealthrankings.org/health -data/new-york/suffolk?year=2024
17 U.S. Census Bureau, 2023 American Community Survey, One-Year Estimates
18 U.S. Census Bureau, 2023 American Community Survey, One-Year Estimates
19 County Compare Measure | PLACES DTM Open Data
Throughout Suffolk County, there are 11 identified communities in which a variety of factors lead to vast health disparities. These identified communities were determined using the Social Vulnerability Index (SVI). The Centers for Disease Control and Prevention and the Agency for Toxic Substances and Disease Registry created the SVI. The SVI is a place-based index that can be used to identify vulnerable communities. It was specifically created to be used to identify communities that would need the most support during a hazardous event including natural disasters. 20 The SVI has also been applied to identify vulnerable communities for other public health priorities. The SVI is an index comprised of 16 U.S. Census variables from the 5-year American Community Survey. These variables are grouped into four areas of social vulnerability (socioeconomic status, household characteristics, racial & ethnic minority status, and housing type & transportation) that are also combined to come to one single measure of vulnerability. We used the 2022 SVI which is publically available and provided information on Zip Code Tabulation Areas (ZCTAs) which are representations of zip codes during a period of time. High vulnerability ZCTAs were classified as being in the highest quartile of the index.
These communities identified are: Amityville, Bay Shore, Brentwood, Calverton, Central Islip, Copiague, Greenport, Mastic, Middle Island, Riverhead, and Wyandanch.
20 Social Vulnerability Index | Place and Health - Geospatial Research, Analysis, and Services Program (GRASP) | ATSDR
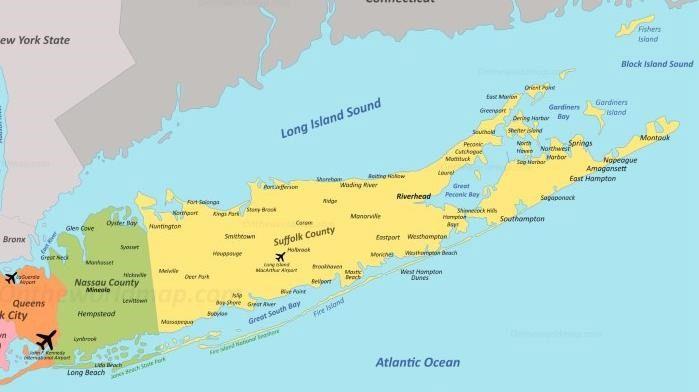
Source: https://ontheworldmap.com/usa/state/new-york/long-island/
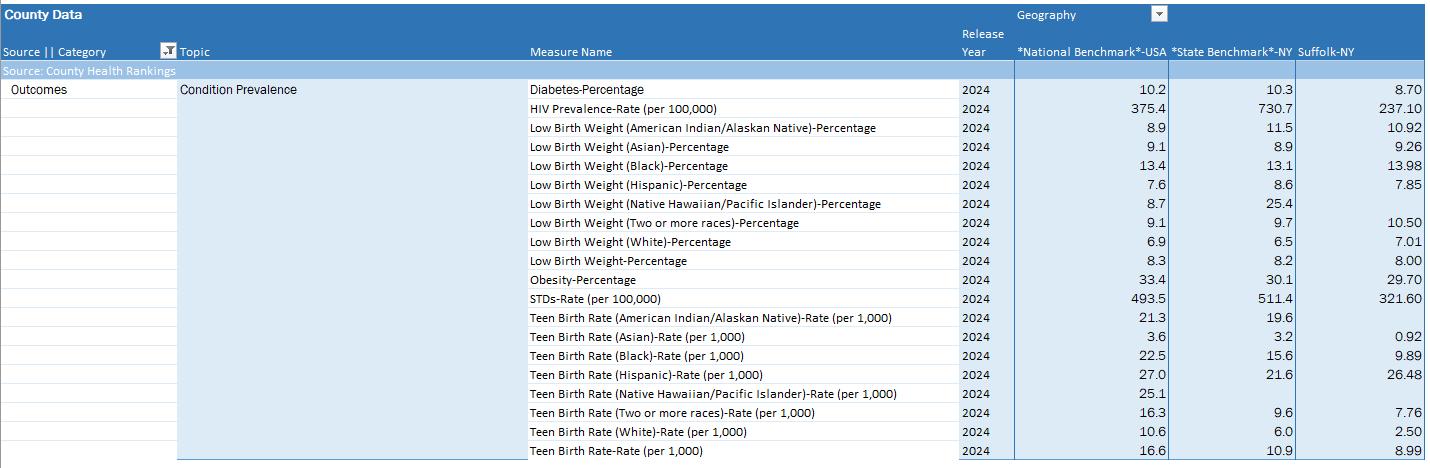
Health behaviors, outcomes, and SDOH indicators in the chart below compare St. Charles Hospital key outreach communities. Two of the communities (Brentwood and Wyandanch) are not included in the tables below as data are not available for the 2019-2023 ACS 5-year estimates due to a data collection error. 21 CHNA Advantage™ Analytics Platform
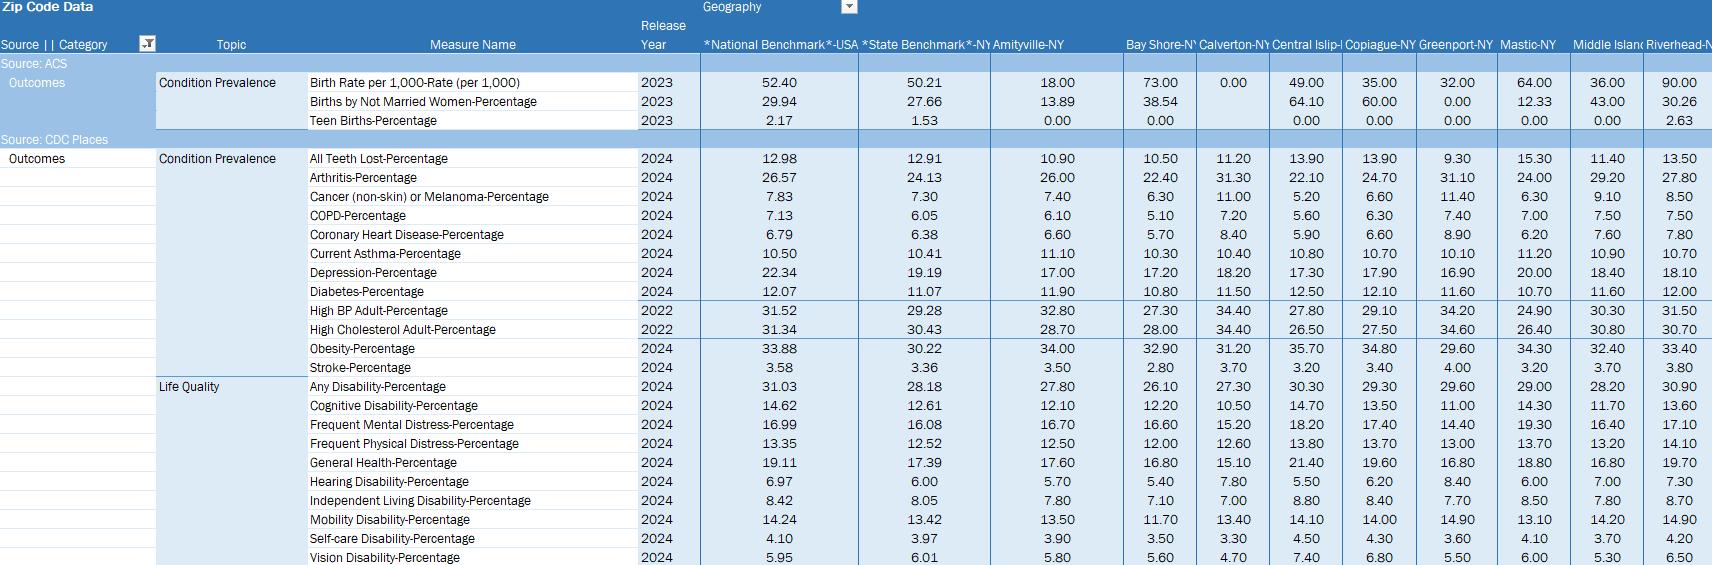
DataGen Analytics Platform. Health Outcomes for 9 Identified Communities Compared to New York State, and National Benchmark.
21 Data Collection Error in Wyandanch CDP, New York and Brentwood CDP, New York
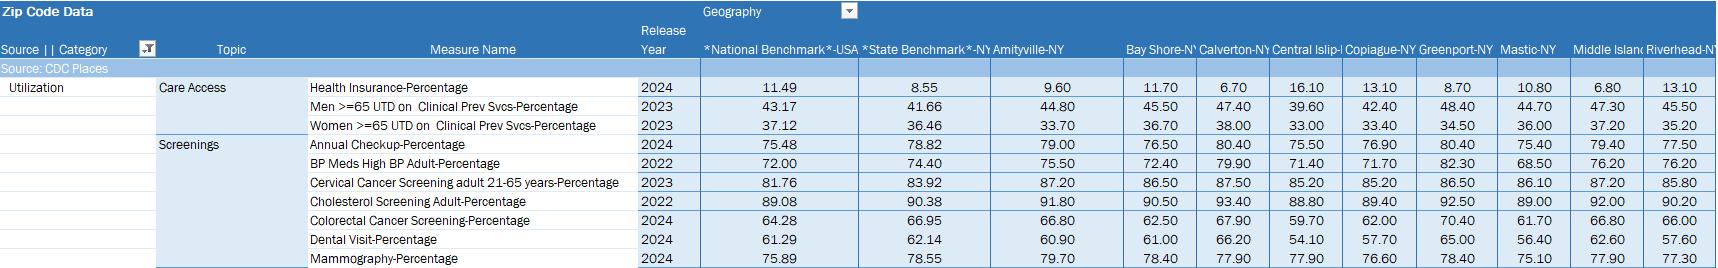
DataGen Analytics Platform. Healthcare Utilization for 9 Identified Communities Compared to New York State, and National Benchmark.
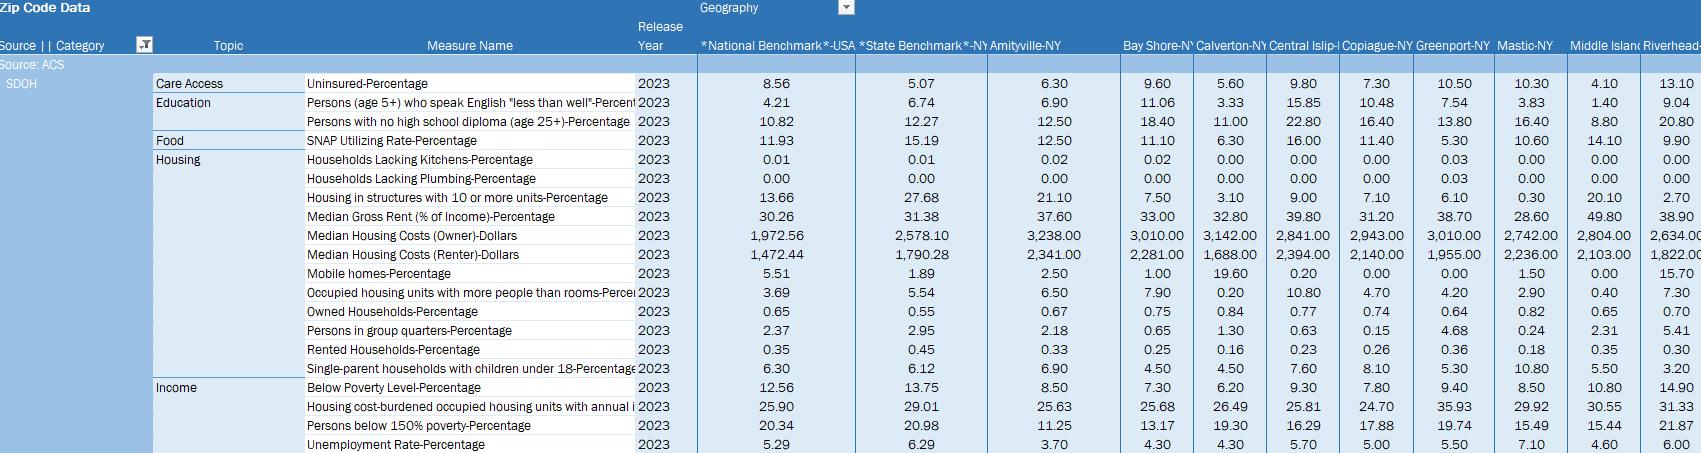
DataGen Analytics Platform. SDOH measures for 9 Identified Communities Compared to New York State, and National Benchmark.
Collaborating Partners: Health Care and Other Key Institutions
As part of our collective impact strategies to promote health and well-being for residents in our communities, St. Charles Hospital has strong relationships with local and regional communitybased organizations, libraries, schools, faith-based organizations, the Suffolk County health department, local fire departments and municipalities that support and partner with us to reduce chronic disease, mental health and substance misuse, and to promote health equity. Following is an extensive partner list of health care and other key institutions.
St. Charles Hospital also relies on the LIHC to disseminate information about the importance of proper nutrition and physical activity among the general public to assist Suffolk residents in better managing their chronic diseases and/or preventing the onset of chronic diseases. St. Charles Hospital also relies on the LIHC to disseminate information about mental health prevention and treatment services and programming, as well as relevant information about substance misuse. Dissemination of information is achieved through the bi-weekly Collaborative Communications e-newsletter, which is sent to 588 community-based organization leaders, and strategic use of social media platforms. These efforts are ongoing. The work plan (see Appendix E) outlines anticipated measures and activities for 2025 supported by the LIHC. Finally, the hospital participates in the LIHC’s quarterly stakeholder meetings and avails itself of LIHC’s extensive network. See Appendix F for a list of partners. A representative from the Suffolk County Department of Health also participated in the monthly 2025 CHNA Workgroup –November 2024 – December 2025. (See Appendix G for list of workgroup members.)
Allegria Skilled Nursing Facility
All American Assisted Living American Association for Respiratory Care
American Heart and Stroke Association
American Diabetes Association
American Lung Association
American Parkinson Disease Association
Association for Mental Health and Wellness
Atria Assisted Living
Bristol Assisted Living
Brightview Assisted Living
Cancer Services Program of Suffolk County
Catholic Charities
Catholic Faith Network
Catholic Health Home Care, Farmingdale
Centereach School District
Chelsea Assisted Living
Comsewogue School District
Coram EMS/ FD
Cornell Cooperative Extension of Suffolk County
Cornell Cooperative Extension/Eat Smart NY
Eastern Suffolk BOCES
Fidelis Care
Good Samaritan University Hospital, West Islip
Good Samaritan Nursing & Rehabilitation Care Center, Sayville
Good Shepherd Hospice, Farmingdale
Heritage Park Foundation, Mt. Sinai
Head Start of Suffolk County
Hope House Ministries
Infant Jesus Church
Jefferson’s Ferry Senior Living
LiveOnNY
Long Island Blood Services
Long Island Explorium
Long Island Health Collaborative (LIHC)
Longwood High School
Longwood Library
Luxor Mills Pond
Maryhaven Center of Hope, Port Jefferson
Mercy Hospital, Rockville Centre
Middle Country Central School District
Middle Country Library
NYIT College of Osteopathic Medicine, Old Westbury & Central Islip
Miller Place Fire Department
New York State Department of Parks and Recreation
NYCB – New York Cancer & Blood
Our Lady of Consolation Nursing & Rehabilitative Care Center
Peoples Arch - AHRC
Port Jefferson Chamber of Commerce
Port Jefferson EMS
Port Jefferson Library
Port Jefferson Rotary
Port Jefferson School District
Port Jefferson Village Center
Quantum & Surge Ridge EMS
Riverhead Library
Rocky Point EMS/ FD
Rocky Point School District
Ronkonkoma EMS/ FD
Rose Caracappa Senior Center, Mt. Sinai
RSVP- Retired Senior Volunteer Program of Suffolk
Sachem School District
Selden Library
Selden EMS/ FD
Setauket EMS/FD
South Country Library
Suffolk County Department of Health
Suffolk County Police Department
Suffolk Sheriff’s Office, Errol Toulon, Jr.
St. Catherine of Siena Nursing & Rehabilitation Care Center, Smithtown
St. Francis Hospital, Roslyn
St. Gerard Majella R.C. Church, Port Jefferson Station
St. James Rosary Alter Society, E. Setauket
St. Joseph Hospital, Bethpage
St. Joseph University
Suffolk County Community College
St. Frances Cabrini Church, Coram
St. John the Evangelist Church, Riverhead
St. Rosalie Church, Hampton Bays
Stony Brook Medicine/Creating Healthy Schools and Communities
Suffolk County Office for the Aging
Suffolk Independent Living Organization
Sunrise Assisted Living
Terryville EMS/ FD
Veteran’s Administration
Waters Edge
Western Suffolk BOCES/Creating Healthy Schools and Communities
Wisdom Gardens Convent, Sound Beach
Woodhaven Adult Home
Yaphank EMS/FD
Existing Health Disparities
Low-income communities of color, especially those in the identified 11 communities, bear a greater burden of chronic disease, which is exacerbated by SDOH factors.
Financially stressed individuals have difficulty affording nutritious foods, leaving them more vulnerable to poorer chronic disease management outcomes, since nutrition and diet play a pivotal role in every chronic disease. This is one of the reasons why Catholic Health has embarked on new food insecurity initiatives with community partners Long Island Cares, Catholic Charities, and the Health and Welfare Council of Long Island. Nutrition insecurity is a priority area for this CHNA cycle.
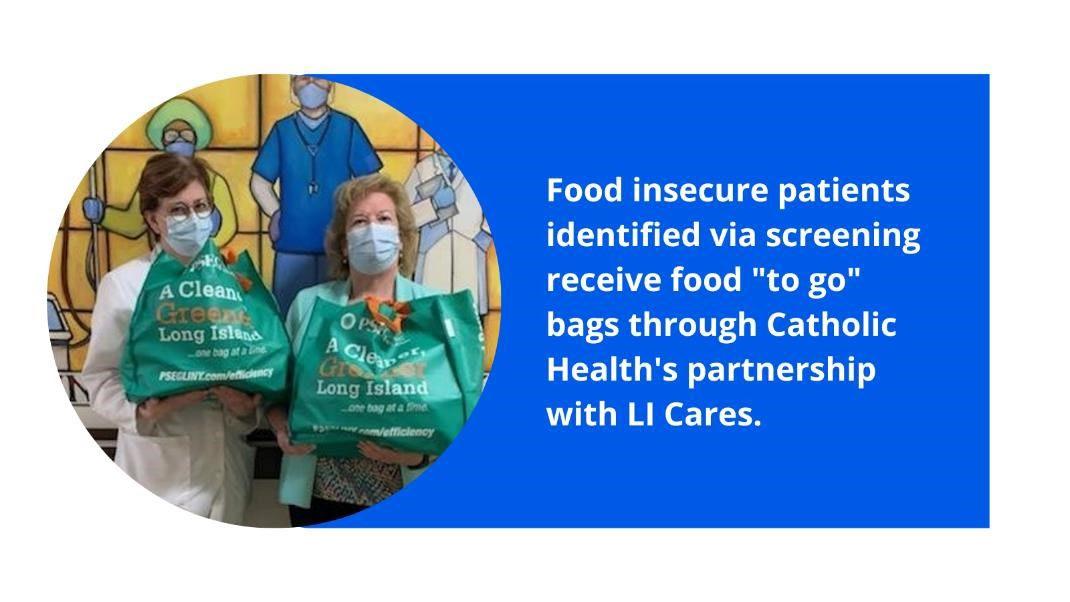
Catholic Health is also collaborating with Catholic Charities and Health and Welfare Council of Long Island to enroll individuals and families identified as food insecure in the Supplemental Nutrition Assistant Program (SNAP).
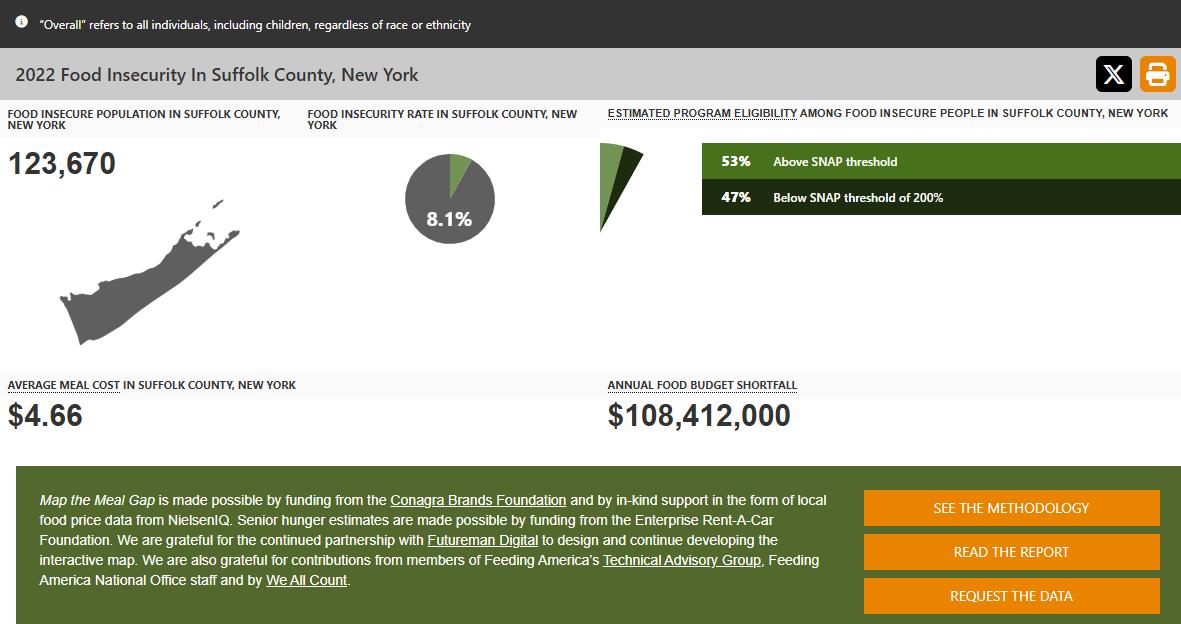
According to Feeding America, 8.1% of Suffolk County residents were food insecure in 2022, which represents 123,679 community members. A Feeding America study, Map the Meal Gap 2022, examined the cost of food and cost of living in zip codes across the United States. Suffolk County’s Annual Food Budget Shortfall represents $108,412,000. This is the amount of additional dollars food-insecure individuals need to cover the cost of their food needs. In Suffolk County in 2022, the average meal cost was $4.66 and 53% of food insecure individuals are living at or above the Supplemental Nutrition Assistance Program threshold (200% federal poverty level). 22
22 https://map.feedingamerica.org/county/2022/overall/new-york/county/suffolk
Overview of Health Status & Health Needs
Throughout the CHNA process, preventive services for chronic disease prevention and control, nutrition security, and tobacco/e-cigarette use have been identified as the top three priorities in our communities. Embedded within these priorities are areas of need which the primary and secondary research revealed.
Areas of Identified Need
Access to care, nutrition insecurity, tobacco/e-cigarette use, mental health, health literacy, education, economic security (poverty), obesity and weight loss, food access, clean air and water.
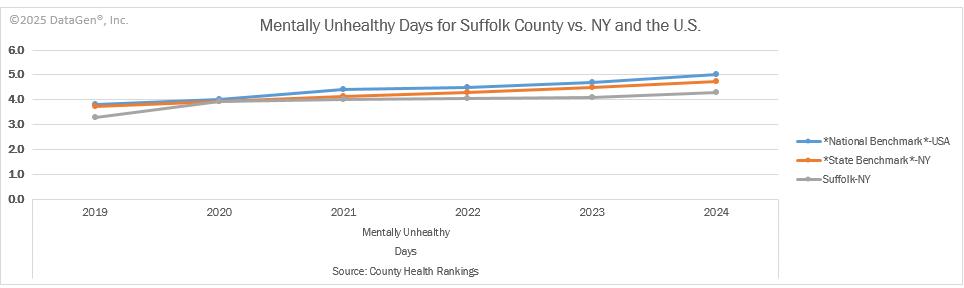
Primary data and secondary data demonstrate that residents living in Suffolk County are experiencing poor mental health status. The 2025 Robert Wood Johnson Foundation County Health Rankings provides measures of health for counties in the nation and ranks those counties within states. These rankings help to understand geographic differences in measures of health to better understand the health of a county compared to the nation. Examining Suffolk County Population Health and Wellbeing Quality of Life health measures, Suffolk County had an average of 5.1 poor mental health days per 30 days which was higher than New York states average of 4.9 poor mental health days in 2022. 23
23 https://www.countyhealthrankings.org/health-data/new-york/suffolk?year=2025
Mental health issues have increased in the past five years, in part, by the effects of the COVID-19 pandemic. Data from the U.S. Census Bureau’s COVID-19 Household Pulse Survey (August 20-Sept 15, 2024), demonstrates that having symptoms of anxiety disorder or depressive disorder is still prevalent with 21.4% of U.S. adults reporting symptoms of anxiety or depressive disorder. Younger individuals had higher rates of symptoms of anxiety or depression (36.5%) than older age groups. Females had higher rates of symptoms of anxiety or depression (23.8) compared to males (18.9%). Some racial and ethnic groups such as non-Hispanic, other races and multiples races and Hispanic or Latinos had higher rates of symptoms of anxiety or depression (28.6% and 24.1%, respectively) compared to non-Hispanic, Whites (21.3%). Individuals with lower education had higher rates of symptoms of anxiety or depression, 26.6% among individuals with less than a high school diploma compared to 16.1% among individuals with a Bachelor’s degree or higher. 24 According to the 2025 Robert Wood Johnson Foundation County Health Rankings there was one mental health provider per 300 people in Suffolk County in 2024 this was the same as the nation overall. However, there is still a shortage of mental health care workers. Therefore, access to mental health services remains a top priority for the region.
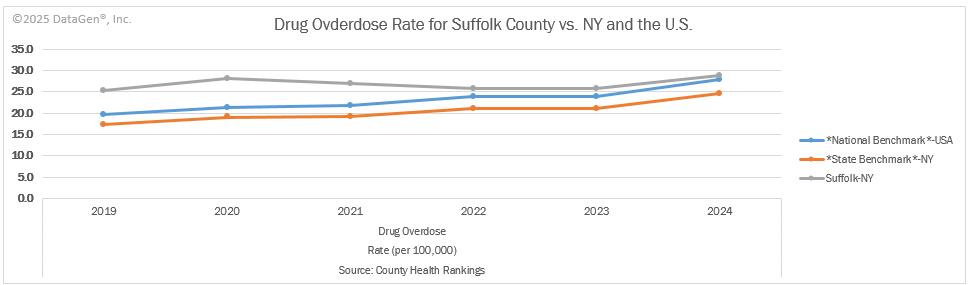
Substance use and opioid-related outcomes are also priority areas for the region. According to the 2025 Robert Wood Johnson Foundation County Health Rankings, Suffolk County had 33 drug overdose deaths per 100,000 people from 2020-2022 which was higher than the 29 per 100,000 in New York and 31 per 100,000 in the nation. 25
24 https://www.cdc.gov/nchs/covid19/pulse/mental-health.htm
25 https://www.countyhealthrankings.org/health-data/new-york/suffolk?year=2025
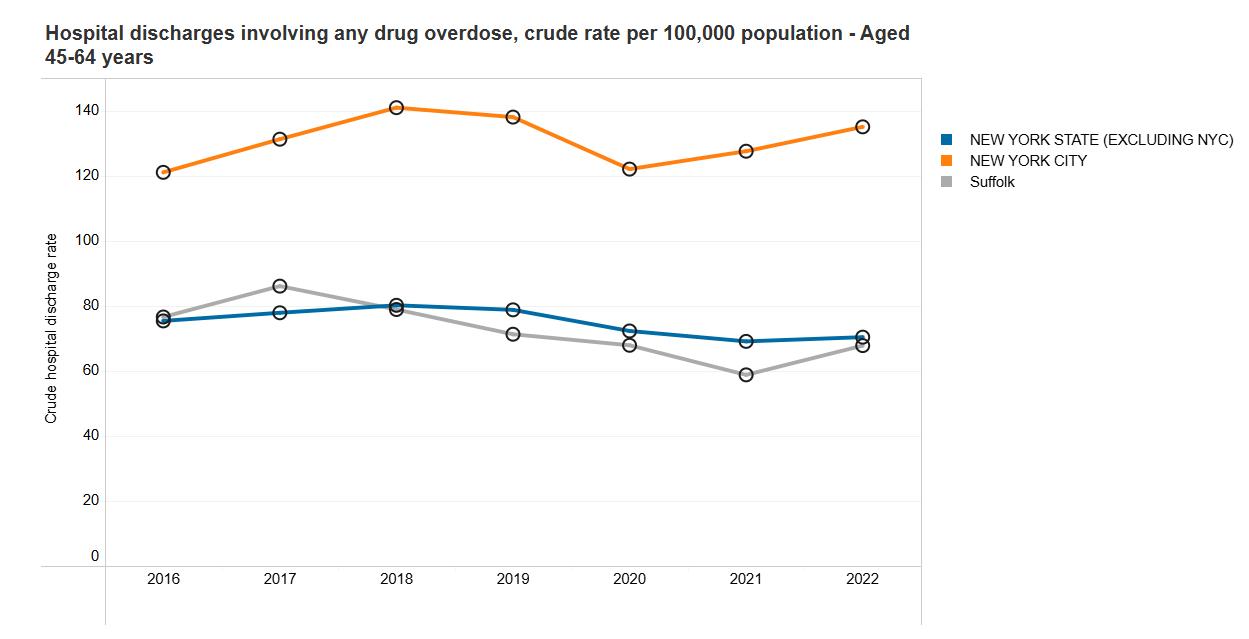
Part of the New York State Department of Health’s (NYSDOH) Opioid Overdose Prevention Program, which emphasizes drug overdose as a public health concerned, is the Opioid Data Dashboard which provides comprehensive data on opioid use and misuse in New York State including Suffolk County. The dashboard has 77 indicators and as of April 2025, 8 of these indicators have worsened in Suffolk County. This includes four indicators related to prescription monitoring, three indicators related to overdose deaths and one related to hospital discharges. Death rates have worsened among individuals’ ages 45 to 64 years old in Suffolk County. The death rate due to overdose deaths involving any drug among individuals age 45-64 significantly worsened from 2021 to 2022 with 45.5 deaths per 100,000 in 2021 to 55.7 per 100,000 deaths in 2022. Hospital discharges involving any drug overdose among individuals 45-64 years also increased from 58.5 per 100,000 in 2021 to 67.8 per 100,000 in 2022. 26
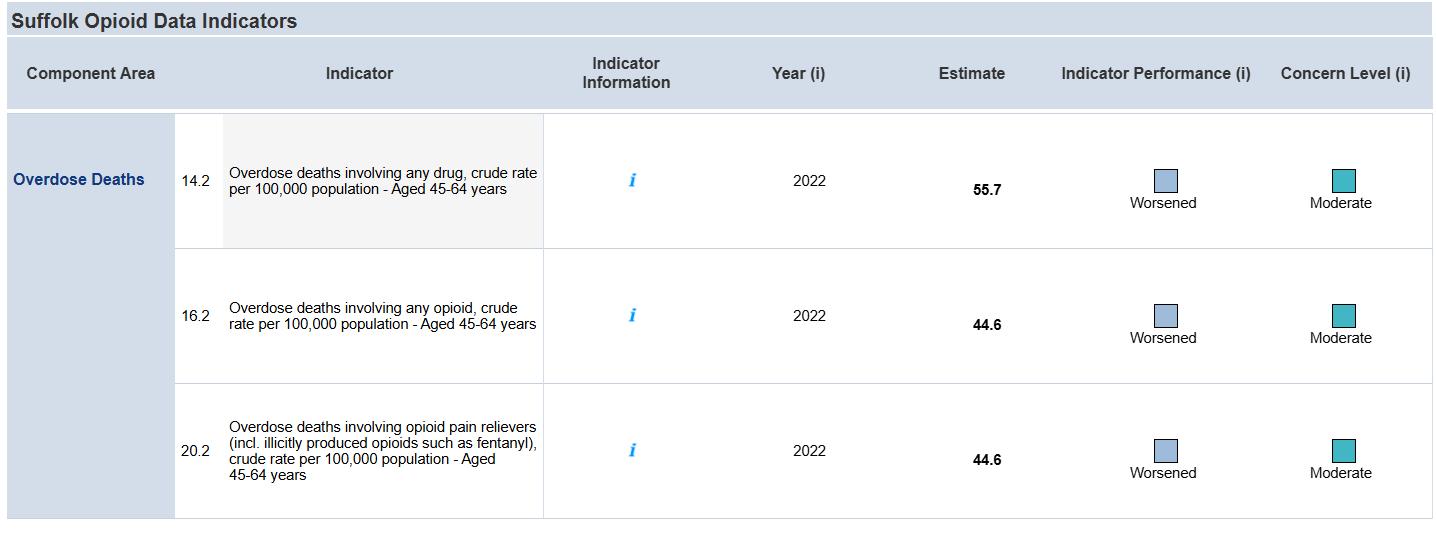
Graphic: New York Department of Health, Opioid Data State Dashboard, Suffolk County, Updated April 2025
https://apps.health.ny.gov/public/tabvis/PHIG_Public/opioid/reports/#county
Graphic: New York Department of Health, Opioid Data State Dashboard, County Trends
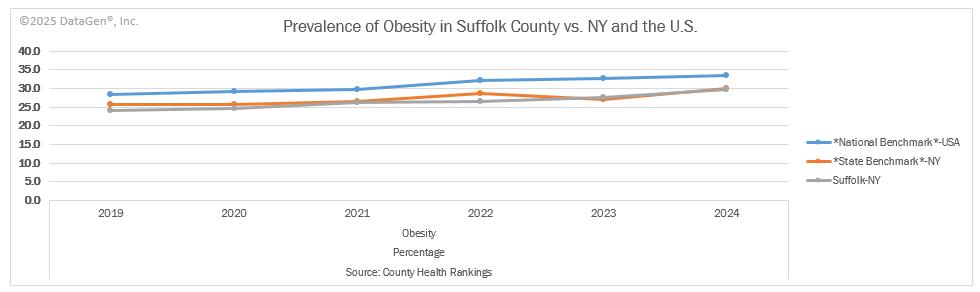
Another health disparity identified in primary and secondary research is adult obesity. According to the Robert Wood Johnson Foundation’s 2024 County Health Rankings for Suffolk County, the prevalence of obesity was 29.7% in Suffolk County. The prevalence increased from 27.60% in 2023.
In 2019, The New England Journal of Medicine studied projected adult obesity in the United States by 2030 based on today’s obese and overweight adult populations. 27 By 2030, the obesity epidemic is projected to impact nearly 1 in 2 adults.
27 https://www.nejm.org/doi/full/10.1056/NEJMsa1909301
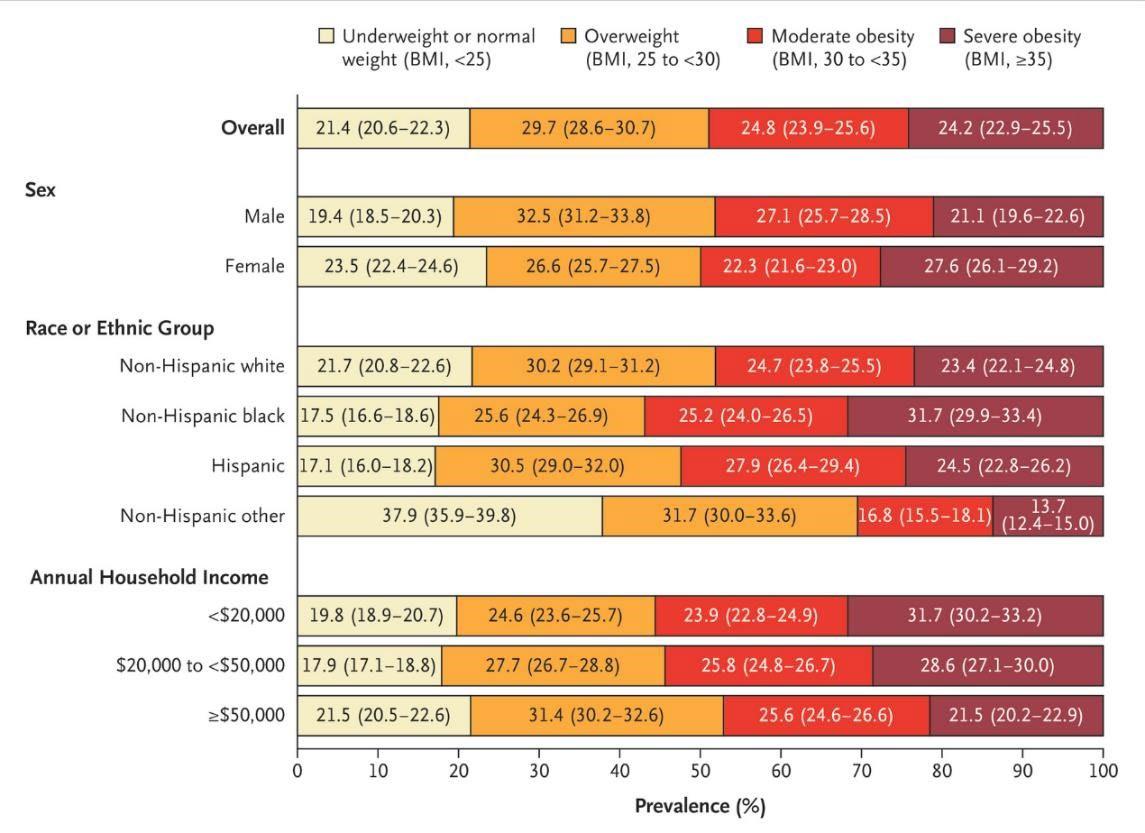
Source: The New England Journal of Medicine, Projected U.S. State Level Prevalence of Adult Obesity and Severe Obesity (2019).
According to the Suffolk County Department of Health, obesity is a condition in which an individual has too much body fat and increases the risk for many diseases including high blood pressure, heart disease, type 2 diabetes, stroke, and cancer. 28 The prevalence of obesity is persistent in Suffolk County and the United States. From 2017-March 2020, 41.9% of U.S. adults 20 years and older (more than 100 million people) were obese. Nationally, disparities in obesity prevalence exist with the highest prevalence of obesity being in non-Hispanic Black adults (49.9%), Hispanic (45.6%), non-Hispanic White (41.4%) and non-Hispanic Asian (16.1%) from 2017-March 2020. In the U.S. obesity is more prevalent in U.S. adults with a high school diploma or some college education (46.4%) and those with less than a high school diploma (40.1%) compared to those with a college degree or above (34.2%). Obesity is serious as it increases risk for chronic diseases. 29
Nationally, communities of color experience higher rates of chronic disease. Using diabetes as an example, the American Indian/Alaska Native population represents 13.6% percent of adults who are diagnosed with diabetes followed by Black, non-Hispanic at 12.1% and Hispanic overall at 11.7% in the
28 Obesity Prevention
29 Adult Obesity Facts | Obesity | CDC
United States. Asians and Whites experience the disease at 9.1% and 9.1% respectively. 30 Chronic diseases are preventable conditions sensitive to lifestyle (diet/physical activity) habits but hampered by the obstacles presented by SDOH - income/employment, race/ethnicity, food access, housing/neighborhood location, and level of education. The county and hospitals identified in this report through collaborative efforts and facility-specific programming acknowledge and address these determinants regularly.
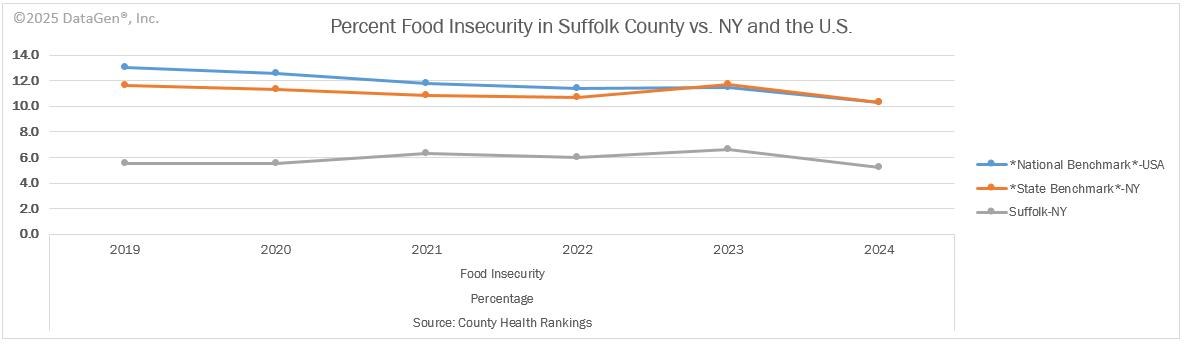
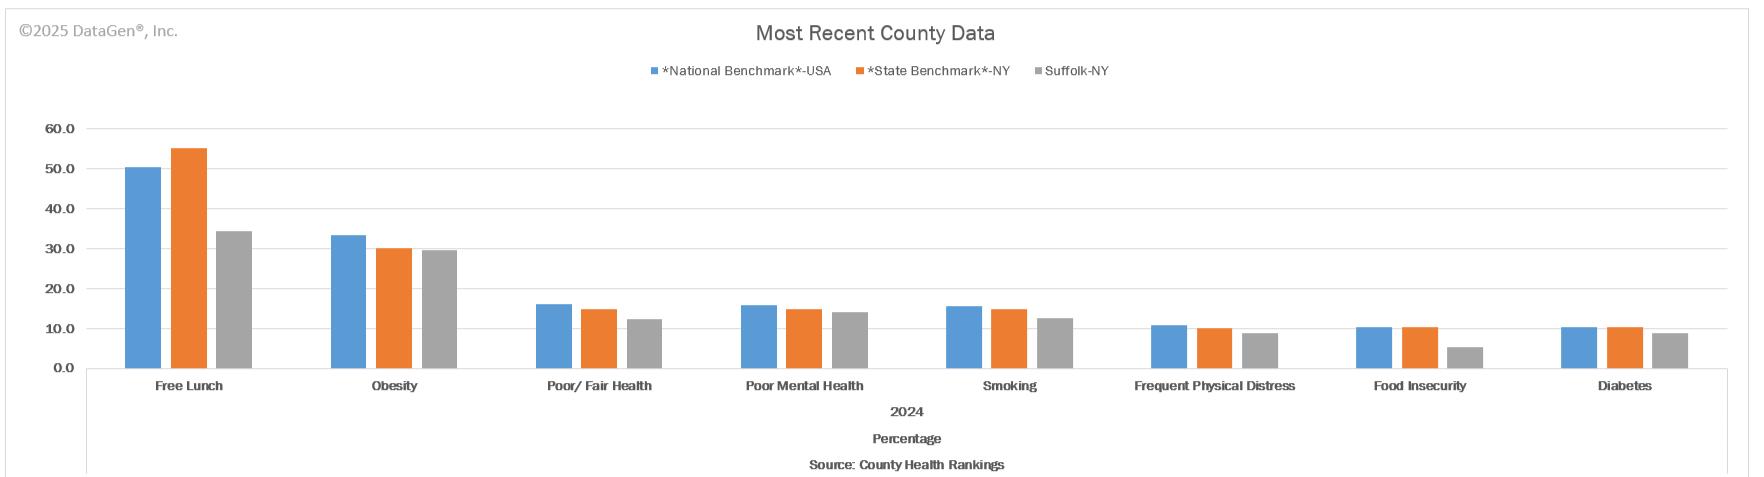
Nutrition security or food insecurity has also been identified as a priority area. The cost of food has been rising with food costs in the New York City Metropolitan area rising by 56.2% from 2012-2013 to 20222023. 31 Although the food share of income for the average household in the New York Metropolitan area as remained around the national average, lower-income households may be particularly impacted by the rise in food prices and are more likely to face food insecurity. In 2024, 5.20% of the population in Suffolk County was food in secure. This decreased from 6.60% in 2023. 2023. In 2024, 34.27% of children were on free or reduced lunch in school.
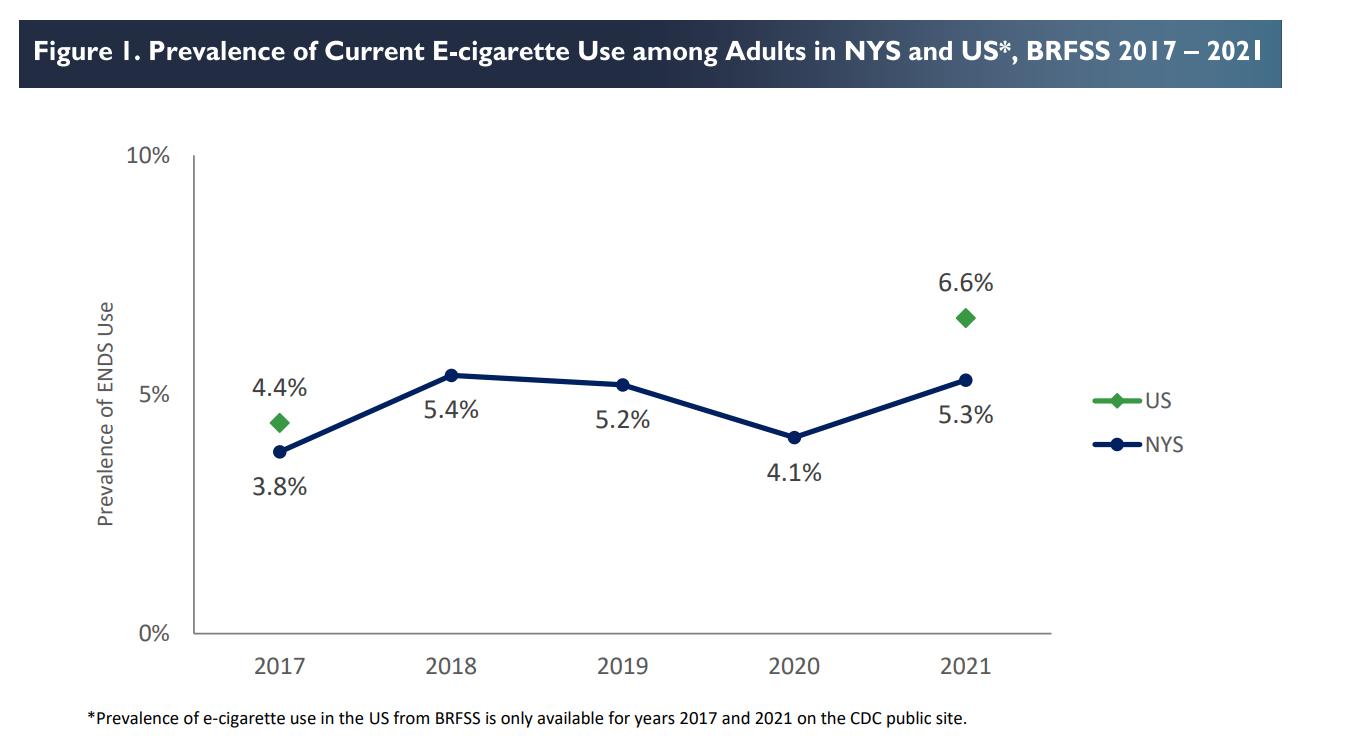
Tobacco and e-cigarette use have also been identified as a health need in the region. Tobacco use is a risk factor for several chronic diseases. Smoking causes cancer, cardiovascular disease and lung disease while the use of smokeless tobacco increasing the risk for cancers of the mouth, esophagus and
30 Diabetes in America: Prevalence, Statistics, and Economic Impact
31 report-2-2026.pdf
pancreas. Tobacco use is the leading cause of preventable disease and death in the U.S. with 49.2 million people reporting current tobacco product use in 2022. 32
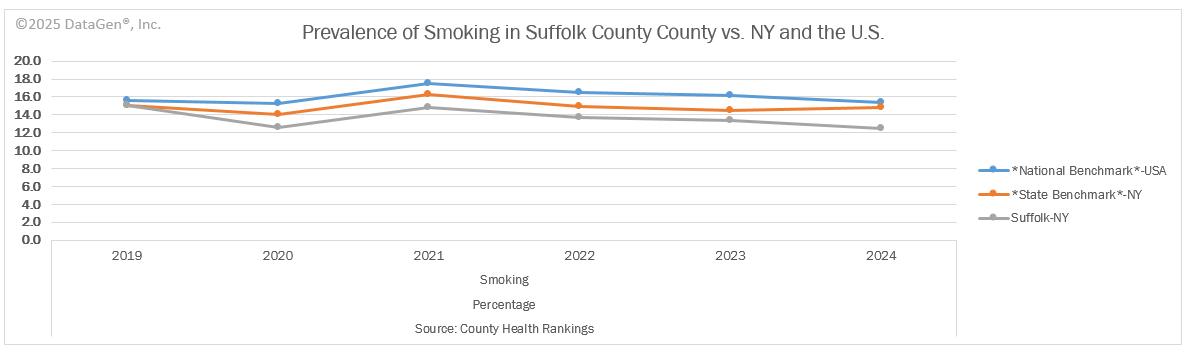
In New York State, 12.5% of adults were current smokers in 2022 (age adjusted). On Long Island, 8.7% of the adult population were smokers with a slightly higher percent of adults in Suffolk County compared to Nassau County. In 2022 7.5% of the adult population were smokers in Nassau County and 9.7% in Suffolk County. 33
According to the County Health Rankings, the percent of smokers in Suffolk County has decreased in 2024 to 12.50%.
Electronic cigarettes (e-cigarettes) are other vapor products are high addictive nicotine products and are not Food and Drug Administration (FDA) approved smoking cessation products. They are classified and regulated as a tobacco product. The long-term health risks of e-cigarettes are still unknown and are currently being studied. Exposure to nicotine is highly addictive and can harm brain development among adolescents into early adulthood. There has been dramatic increases in e-cigarette use among youths. In 2019, there was an outbreak of vaping product use-associated lung injury (EVALI). E-cigarettes are included in the Clear Indoor Air Act in New York State which means they are not allowed to be used in places where smoking tobacco is prohibited. With the rise of smoking and e-cigarette use particularly among younger populations, there is a need to focus on this as a priority area to reduce the prevalence of smoking/e-cigarette use and prevent e-cigarette use. 34
In 2021, 5.3% of the adult population in NYS used e-cigarettes this was lower than the national average of 6.6% of adults. In NYS, e-cigarette use was highest among individuals age 18-24 (15.1%), current smokers (14.1%), adults with frequent mental distress (11.4%), and adults with Medicaid (8.5%) in 2021. In Nassau County the prevalence of e-cigarette use among adults was 5.5% in 2021. In Nassau County the prevalence of e-cigarette use among adults was 6.0% in 2021.
32 Current Cigarette Smoking Among Adults in the United States | Smoking and Tobacco Use | CDC
33 https://apps.health.ny.gov/public/tabvis/PHIG_Public/chirs/reports/#state
34 https://www.health.ny.gov/statistics/brfss/reports/docs/2023-14_brfss_electronic_cigarette.pdf
These are the main health challenges and contributing causes affecting residents of the county, especially in low-income communities of color. That these social determinants of health are predictors of chronic disease is well documented. 35 36 37 Health care access issues are mostly tied to economics (quality of health insurance, employment, and cost of living). In the mental health/substance misuse space, access is further hampered by a dearth of providers. Fear, which includes immigration status, is also a detriment to health care access.
35 Cockerham WC, Hamby BW, Oates GR. The Social Determinants of Chronic Disease. Am J Prev Med. 2017 Jan;52(1S1):S5-S12. https://doi.org/10.1016%2Fj.amepre.2016.09.010 PMID: 27989293; PMCID: PMC5328595.
36 Pantell MS, Prather AA, Downing JM, Gordon NP, Adler NE. Association of Social and Behavioral Risk Factors With Earlier Onset of Adult Hypertension and Diabetes. JAMA Netw Open. 2019;2(5):e193933. Https://doi:10.1001/jamanetworkopen.2019.3933
37 Vennu, V., Abdulrahman, T.A., Alenazi, A.M. et al. Associations between social determinants and the presence of chronic diseases: data from the osteoarthritis Initiative. BMC Public Health 20, 1323 (2020) https://doi.org/10.1186/s12889-02009451-5
The engagement process we used to select the two priorities was purposeful and collaborative.
On April 14, 2025, at 3:50 p.m., the LIHC emailed results of all its data analyses. The members of the 2025 CHNA Workgroup were asked to review the results in advance of the priority selection meeting, which occurred on April 24, 2025, at 3 p.m. via Zoom. The data analyst walked participants through screenshots of the relevant findings. Participants also viewed the Prevention Agenda dashboard, diving deep into the goals, objectives, and recommended interventions for each priority. Present at the meeting were representatives from Long Island’s two health departments and representatives from Long Island’s hospitals/health systems, as well as staff of the LIHC. Attendees discussed primary and secondary data results and based the selection of priorities on the following criteria:
The overwhelming evidence presented by the data, especially the first two questions of the Community Health Assessment Survey
The activities/strategies/interventions currently in place throughout the region
The feasibility of achieving momentum and success with a chosen priority, taking into account the diversity of partners and community members served
Comments from community members and others regarding the previous CHNA
Broad Community Engagement
Engagement of the broader community, for assessment purposes, is achieved through the LIHC’s and its partners’ ongoing distribution of the Community Health Needs Assessment survey – the main primary research tool used to gauge community health needs, social support needs, and barriers to health care on an ongoing basis. This survey is offered online via a SurveyMonkey link and is available in paper format to residents at public events, workshops, educational programs, and interventions which are offered by St. Charles Hospital and other LIHC partners. A paper version is also distributed among physician offices, hospital waiting areas, libraries, schools, health clinics, insurance enrollment sites, and other public venues. The LIHC vigilantly promotes the survey through social media and asks LIHC participants to post the survey link on each of their websites. The LIHC provides a social media toolkit with an opportunity for co-branding to facilitate participation and St. Charles Hospital has availed itself of this service. St. Charles Hospital posts this survey and the SurveyMonkey link on its website and in electronic and print community newsletters. The survey can also be accessed via a QR code. Results from the Community Health Needs Assessment Survey are analyzed yearly. Findings are shared with all LIHC participants, with
the media, and posted on the LIHC website. A certified translation of the survey is available in the following languages: Spanish, Polish, and Haitian Creole. Large print copies are also available to those living with vision impairment.
Engagement of the broader community, for implementation purposes, is assisted by the LIHC’s encouragement of community members to participate in programs, workshops, support groups and educational programs offered by St. Charles Hospital and all LIHC partners. In addition, the LIHC offers limited programming itself, such as the Walk Safe with a Doc events and Talk with a Doc events (presented in collaboration with AARP-LI). All LIHC quarterly meetings are open to the public and recordings of the meetings are housed on its website. The LIHC, on behalf of all its participants and the community members each participant serves, supports the following evidence-based activities and programs:
Awareness Campaign (Live Better) about chronic disease via social media and traditional media platforms (this campaign captures any mentions about chronic diseases and relevant programs/education efforts)
Awareness Campaign about mental health prevention and treatment programs/education, as well as relevant treatment and prevention programming relative to substance misuse via social media and traditional media platforms (this campaign captures any mentions about mental health/substance misuse programs/events/workshops, etc.)
Walk Safe with a Doc are community walking events that combine pedestrian safety education with chronic disease education all while walking. The LIHC maintains an active Walk with a Doc chapter for the region.
When they first gathered in 2013, LIHC partners embraced walking as a simple, low-cost, easy activity that most anyone of any age can perform. Walking is an evidence-based intervention that offers proven benefits to one’s physical and mental health. The Walk with a Doc chapter is the activity through which LIHC, and its partners promote the health benefits of walking. See Research and Supporting Evidence in Appendix H. Collaborative participants rely upon LIHC’s use of social media and traditional media to cross-promote collaborative partners’ programs, interventions, events, workshops, etc., as well as general messaging about healthy lifestyle behaviors (physical activity and proper nutrition). Awareness campaigns use best practices for message conveyance. There is evidence as to the user engagement and sustainability effects of social media and mass media regarding health messaging. Investigation in this area is ongoing (See Research and Supporting Evidence in Appendix H). The Community Guide, a website that houses the official collection of all Community Preventive Services Task Force findings and the systemic reviews on which they are based, was also referenced. 38
38 https://www.thecommunityguide.org/
SPECIFIC METHODs FOR RESEARCH
Catholic Health obtained population level, zip code, and zip code tabulation area (ZCTA) data on social determinant of health drivers and health/risk factors dominant in Catholic Health’s service area and county from its data partner, DataGen. We also looked at hospital utilization data including emergency department data to discern top chief complaints. A survey completed by individual community members, a similar survey completed by community-based organization leaders, and key informant interviews with selected leaders were conducted and results were provided by LIHC Catholic Health conducted listening session with CBO partners. The CHNA approach used both quantitative and qualitative research methods designed to evaluate the perspectives and opinions of stakeholders and health care consumers. The methods used helped develop a broad, community-based list of needs in addition to prioritizing the needs and establishing a basis for continued community engagement.
Primary Research
Quantitative Methods and Research Tools (See appendix for full reports and tools)
Community Health Needs Assessment Survey (CHAS) – measured individual and community level perceptions of health needs and barriers. A total of 997 surveys were completed during the period of January 2024 – December 2024. A subsequent analysis particular to the zip codes in St. Charles Hospital service area was completed by analyzing 439 surveys collected during the period January 2022 – August 2022. The CHAS provides a snapshot in time of the main health challenges facing communities. It uses the SurveyMonkey platform. Convenience sampling method meaning that it may not be representative of the population on Long Island.
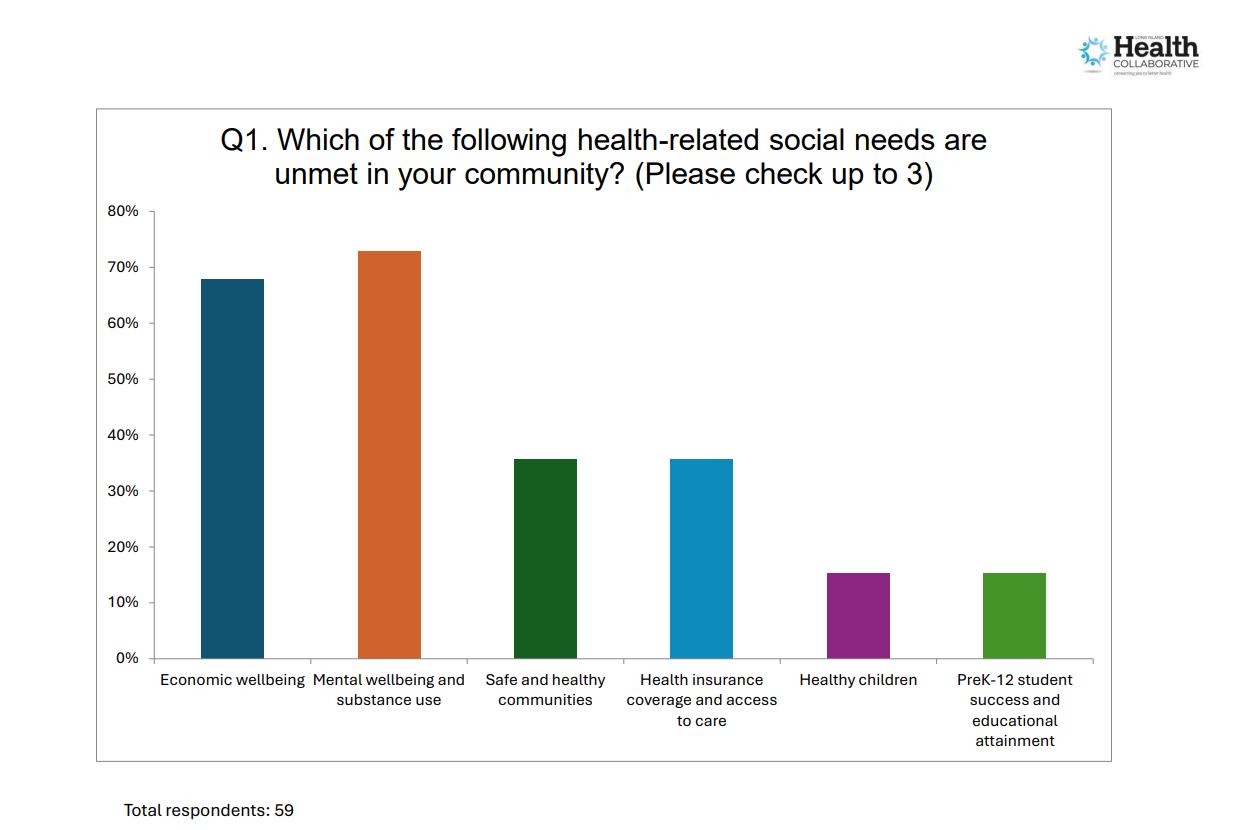
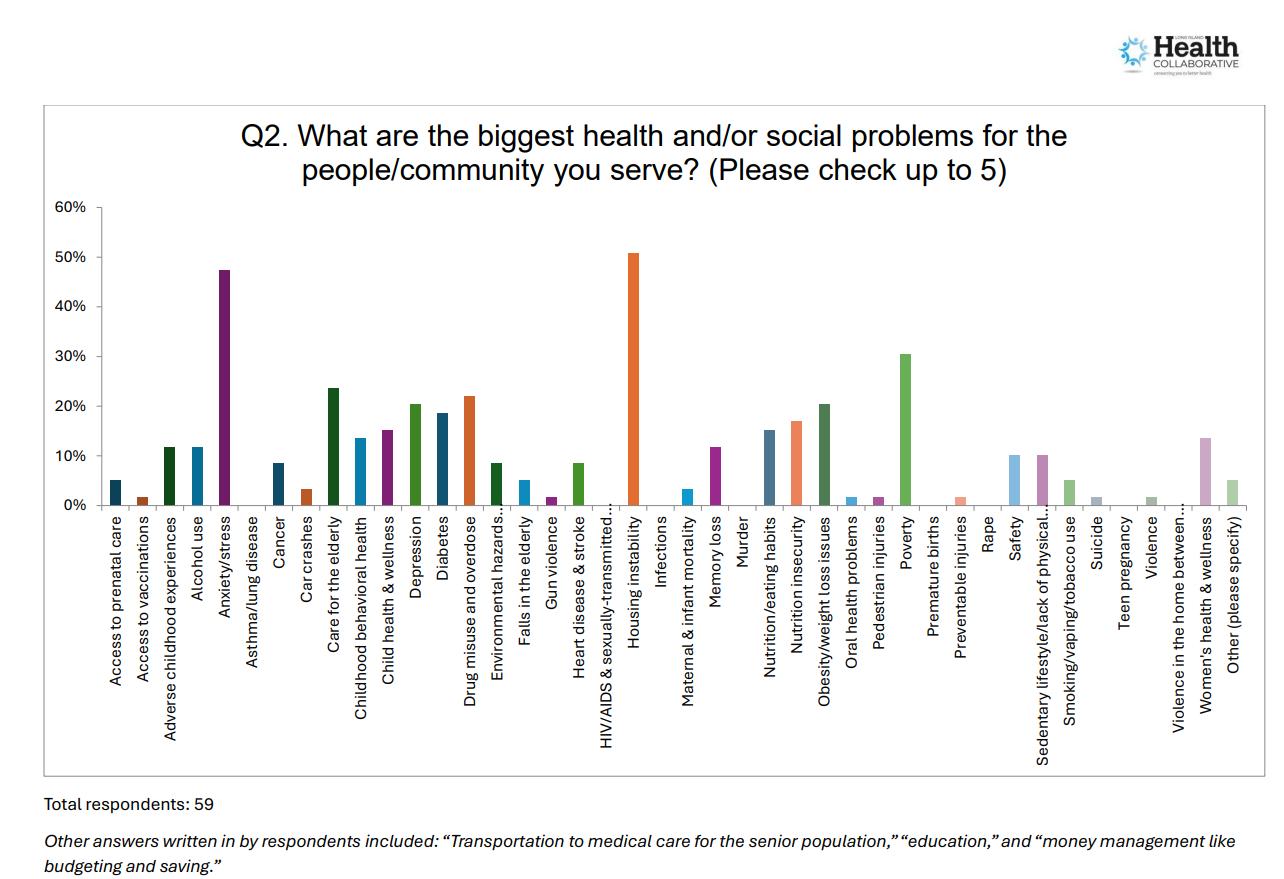
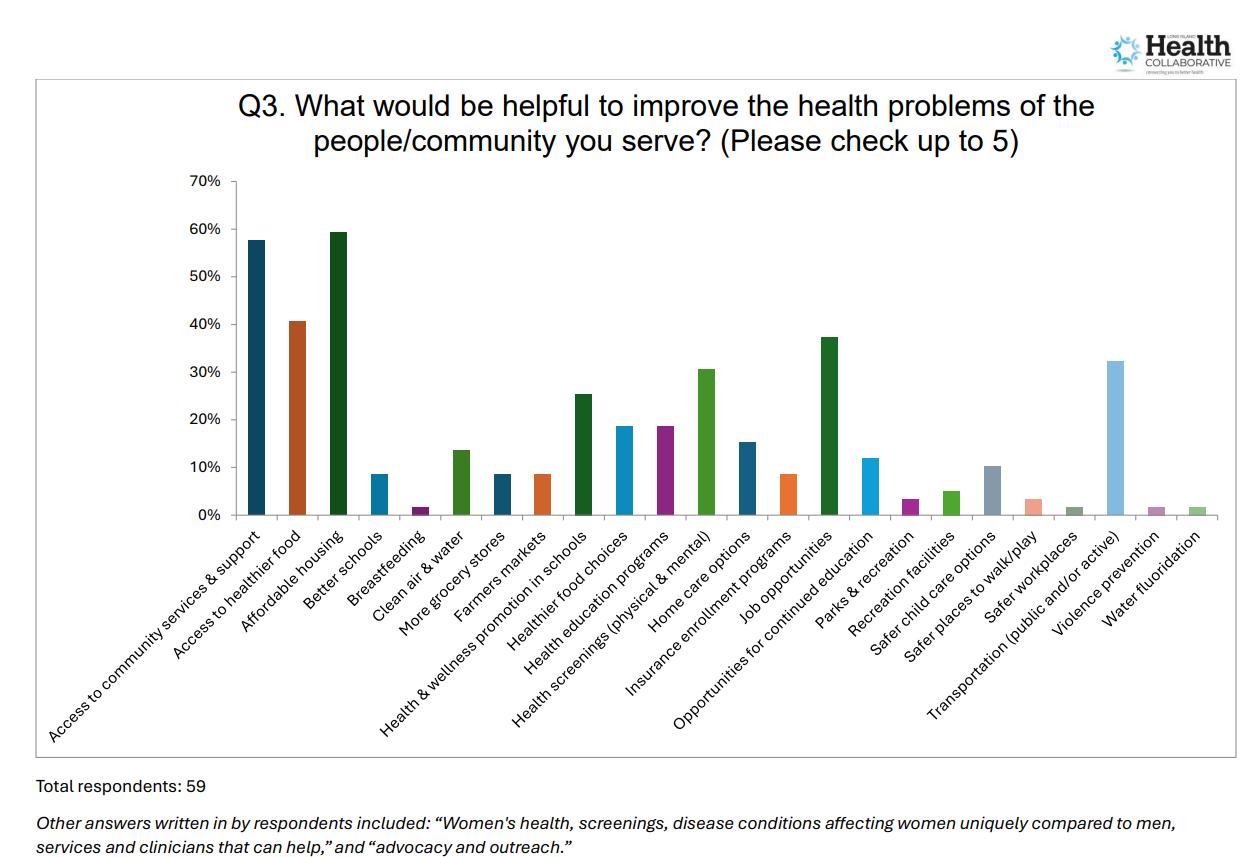
CBO Community Needs Assessment Survey – measured community-based organization leaders’ perceptions of health needs and barriers faced by their patients/clients/constituents. A total of 59 surveys were completed(18 from Nassau County, 24 from Suffolk County, 3 from both counties, and 3 from Queens or with no location specified ). The survey was distributed to 400 plus leaders during the time period November 15th – December 31, 2024. It uses the SurveyMonkey platform. Purposive sampling method.
Qualitative Methods and Research Tools (See appendix for full reports and tools)
CBO Key Informant Interviews – In partnership with the 2025 CHNA/CHA Work Group participants, the LIHC deployed a campaign to interview community-based organization representatives about the health/social problems and barriers to health/social services experienced by the populations they serve, as well as suggested interventions to address those problems and barriers.
Interview questions were agreed upon by consensus among LIHC representatives and the 2025 CHNA/CHA Work Group. Stakeholders were initially recruited through the CBO Community Needs Assessment Survey deployed by the LIHC in 2024. Of the 59 CBO leaders who completed the CBO Community Needs Assessment Survey, 27 survey respondents indicated they would be willing to
participate in a follow up interview. In addition to soliciting those survey respondents, LIHC representatives deployed two email blasts to their 400+ email contacts to secure additional willing interviewees. The LIHC also relied on its CHNA/CHA Work Group participants to recruit additional interviewees. From February 7, 2025 through April 8, 2025, the LIHC conducted 23 interviews with 28 individual informants from 23 different organizations.
Interviews were conducted via zoom and recorded. Transcripts were validated for accuracy and grammar by two coders prior to analysis. Transcripts were analyzed using ATLAS.ti qualitative analysis software. Coders used a predetermined set of codes defined by the 2025-2030 NYS Prevention Agenda priorities. Coders employed deductive thematic analysis by using a predetermined set of codes that directly correlate to the 24 priorities outlined by the NYS Prevention Agenda. Coders chose to employ this method instead of grounded theory given the analysis’ purpose to help hospitals and health departments choose regional priorities from the Prevention Agenda as a group by consensus. Coders assigned the pre-determined codes to relevant quotes.
Catholic Health Community Listening Sessions – Catholic Health leadership, as part of the Health Equity Leadership Council, created a list of external community stakeholders, curated a standard list of questions and a response recording template. The initial list was comprised of more than 365 leaders, but was later narrowed down to 134. The list was divided into those requiring one-to-one sessions with a member of the working group team and those that could be done in groups (Veterans, Housing, Youth, and Spanish Speaking Religious Leaders). From October 2023 to May 2024, Catholic Health contacted 134 organizations identified and interviewed more than 50 CBOs spanning Long Island to identify gaps in social and health care service delivery.
Secondary Research
The secondary data research included a thorough analysis of previously published publicly available materials/metrics that provide insight regarding the community and healthrelated measures.
Emergency Department Visits – analysis of St. Charles Hospital emergency department visits during the time period January 1st, to December 31st, 2024, to discern top diagnoses.
CHNA Advantage Platform more than 200 metrics drawn from a variety of publicly available national, state, and county datasets. Zip code and census track level data.
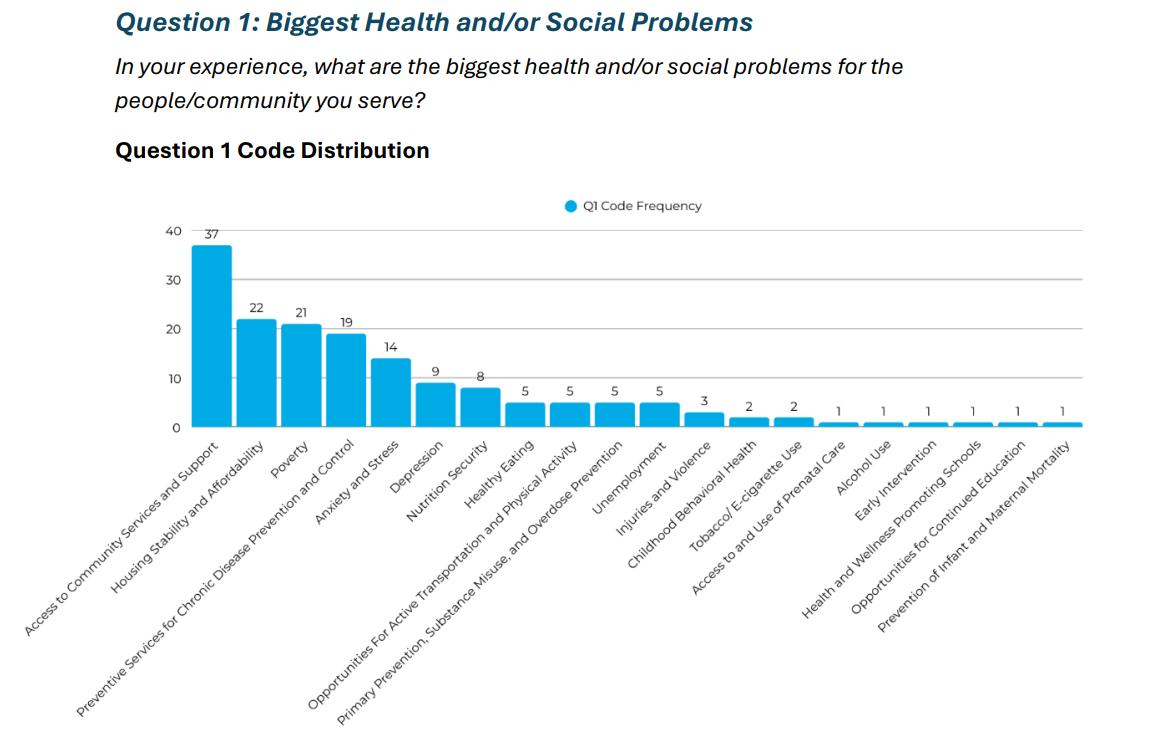
FINDINGS TO SUPPORT IDENTIFIED NEEDS
Data from both the primary and secondary research methods revealed the following key themes. Primary data survey results from hundreds of Suffolk County residents reveal cancer, mental health, and drug and alcohol usage, diabetes and obesity as some of the top concerns for 2024
1. When asked: What are the biggest ongoing health concerns in THE COMMUNITY WHERE YOU LIVE?
In the above table, survey respondents answered what their biggest health concerns affecting their community are from their individual perspective. For respondents in Suffolk County, the top health concerns were related to chronic disease such as cancer and diabetes, mental health, drugs and alcohol abuse, and obesity/weight loss.
2. When asked: What are the biggest ongoing health concerns for YOURSELF?
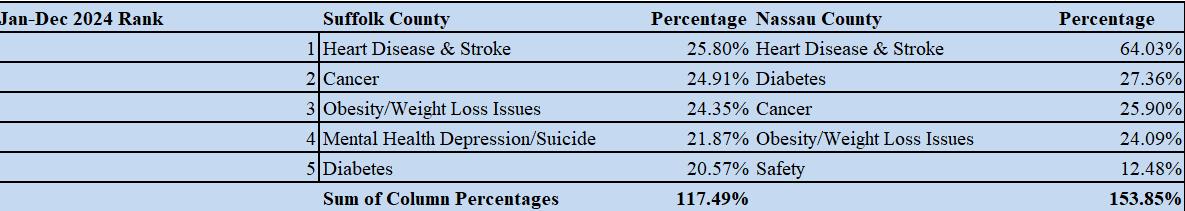
When answering questions about their individual health, survey takers in Suffolk County indicated chronic disease such heart disease, stroke, diabetes, cancer, mental health, and obesity/weight loss. That is illustrated in the table above.
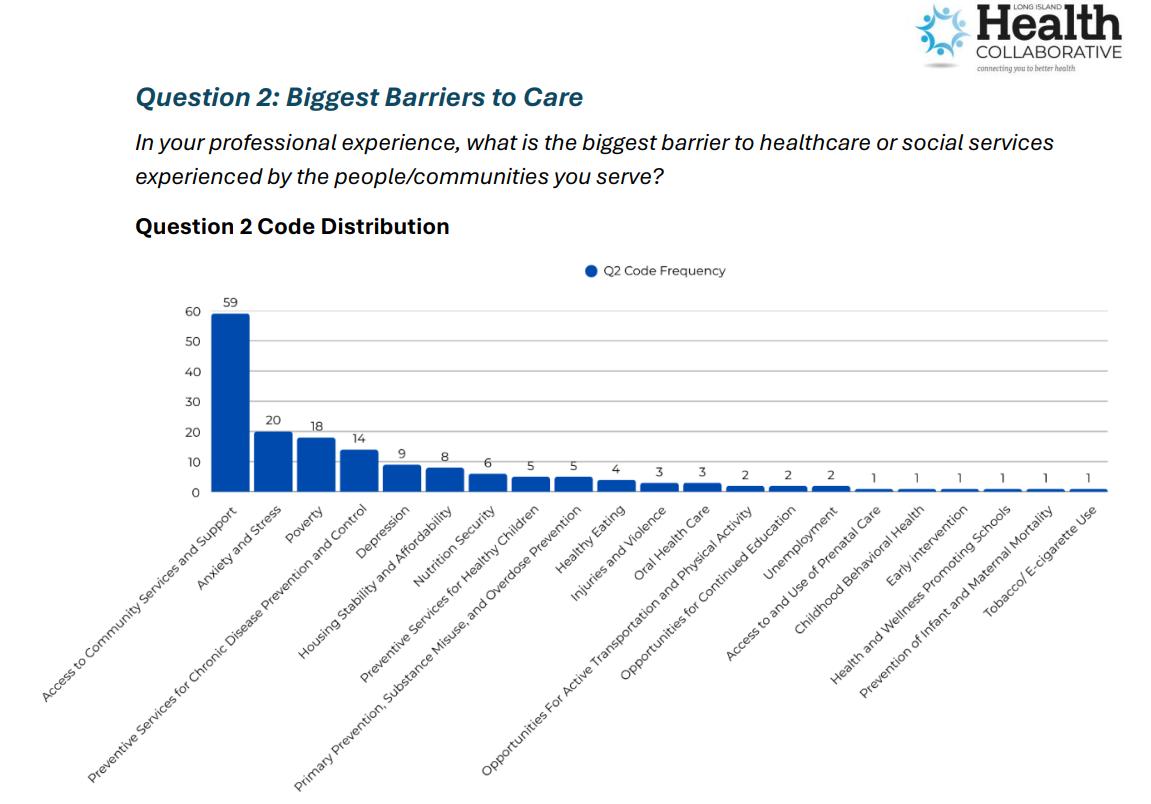
3. When asked: What prevents you and your family from getting medical
The responses above highlight perceived barriers to care, what prevents community members from accessing care. In Suffolk County, the top response was that there are no barriers. This may be due to sample bias in which the respondents were not representative of the population. Respondents also reported being unable to pay co-pays/deductibles, fear, no health insurance and a lack of availability of doctors.
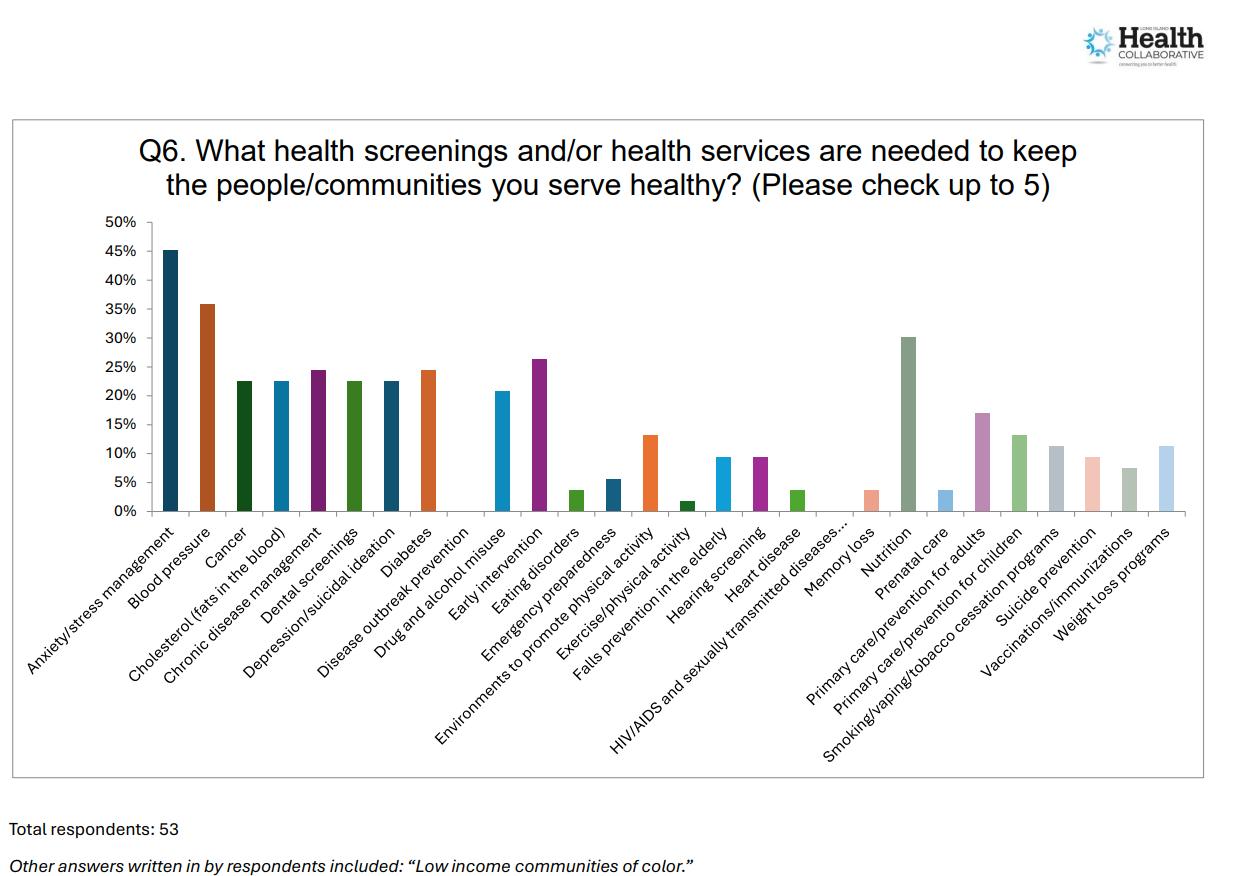
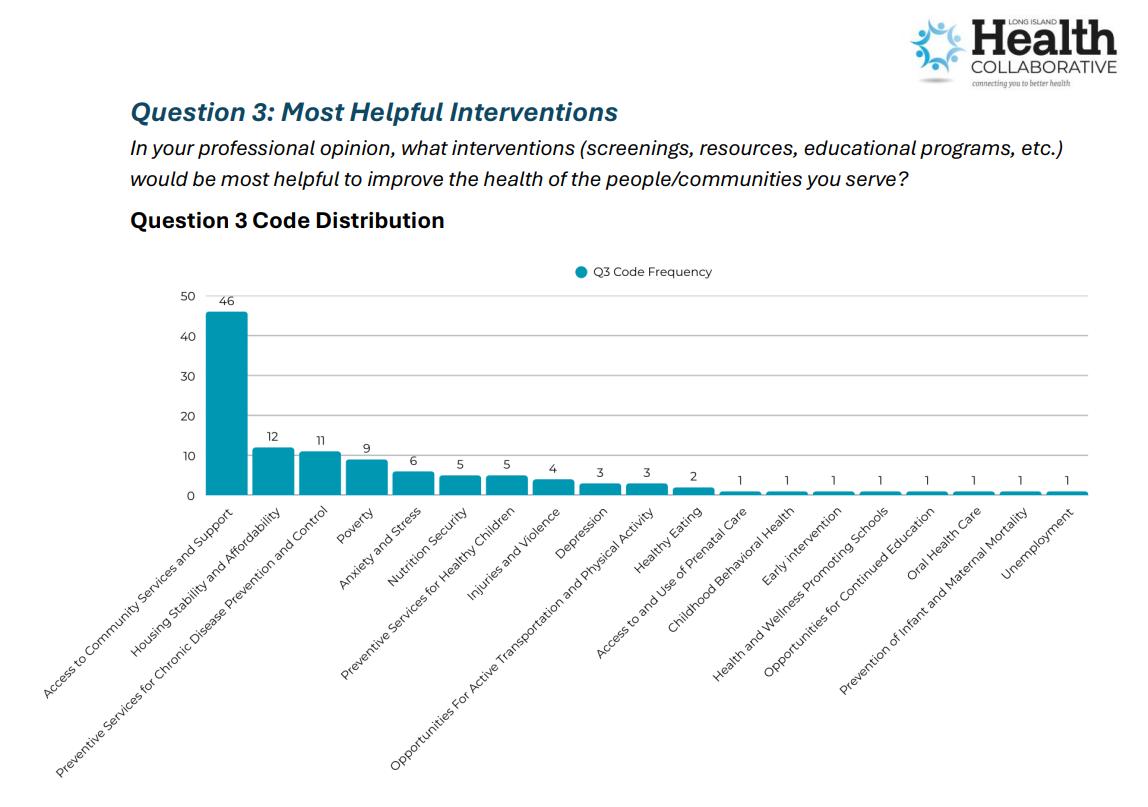
4. When asked: What health screenings or education/information services are needed in your community?
The above chart table highlights the needs of community members in important health education services. In Suffolk County, top needs include chronic disease (cancer and high cholesterol), mental health, nutrition, and drug and alcohol.
St. Charles Hospital 2021-2022
Emergency Department Data, Top Diagnoses
Examining St. Charles Hospital emergency department data also highlights the need for community health services.
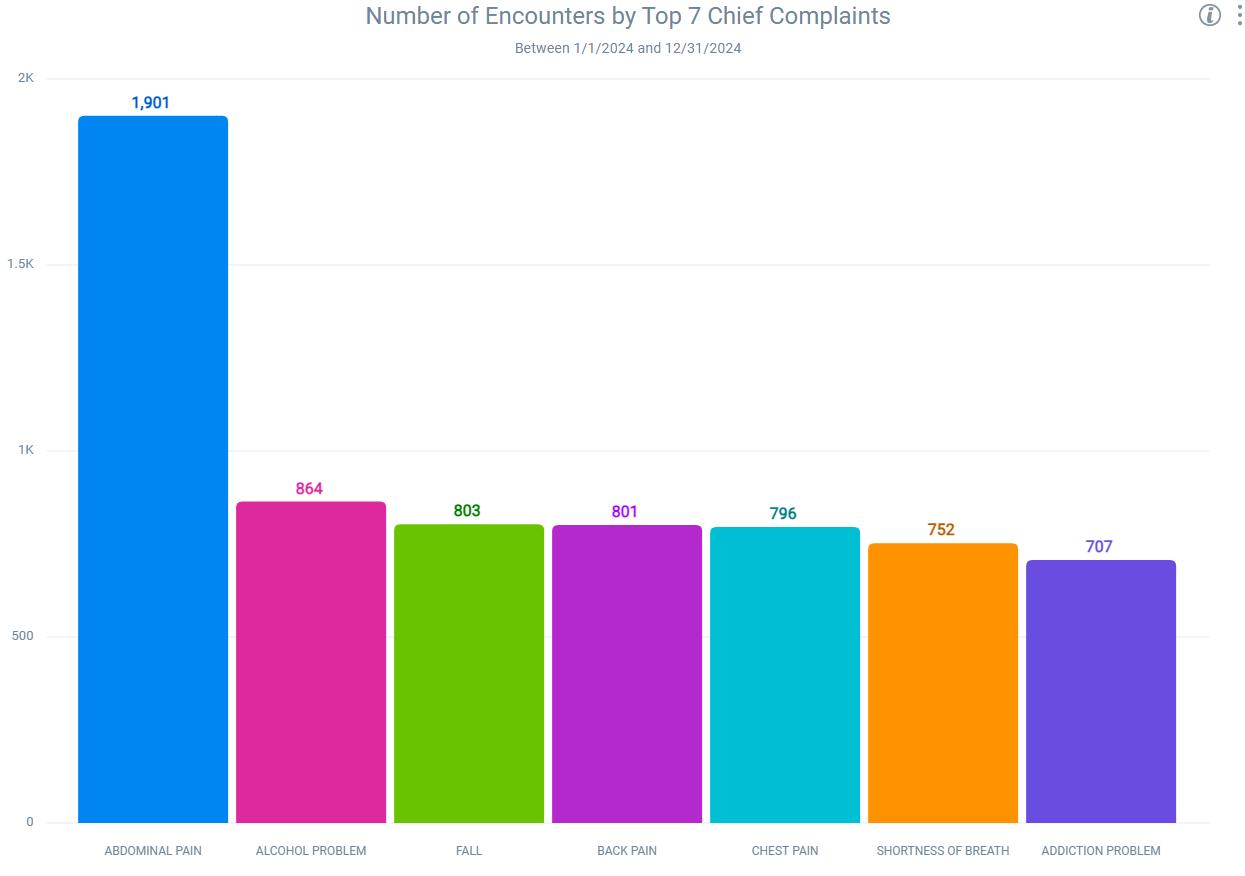
Emergency department data for St. Charles Hospital shows 18,861 visits from January to December 2024 Medicaid encounters account for 4,881 visits and self-pay accounts for 452 visits.