Periodico mensile registrato presso il Tribunale di Firenze al n. 6215 in data 10/03/2025
Iscrizione al ROC n. 42813
Spedizione in Abbonamento Postale Aut. n° CN-NE/00754/04.2025
Art Direction and layout Pilar Roca – pilarroca.com
Printer
Faenza Printing Via Vittime Civili di Guerra, 35 48018 Faenza (RA), Italy
All rights of reproduction and translation of the published articles are reserved. Any reproduction, even partial, is strictly prohibited without the publisher’s prior written authorization. All content is protected under copyright law. The editorial board assumes no responsibility for the opinions expressed by the authors of editorial and advertising texts.
Zootecnica ensures the confidentiality of personal data collected for subscriptions and purposes related to specialized publishing, in compliance with the General Data Protection Regulation (GDPR – EU Regulation 2016/679). Subscribers have the right to access, modify, or delete their personal data by submitting a written request to the publisher. Personal data will not be shared with third parties without explicit consent.
Scan to visit our website
EDITORIAL
➤ Marianna Caterino
Autumn 2025 is drawing to a close, leaving a situation that is anything but reassuring for global poultry health. Across Europe, the avian influenza virus is circulating intensely, with a marked concentration across northern and western Europe. Germany, France, the Netherlands and Spain continue to report new detections in both poultry and wild birds, alongside extraordinary measures such as mandatory housing orders and restrictions for farmers. Germany has recorded its highest case count in three years, with more than one million birds culled and an epidemic risk that, according to the FriedrichLoeffler-Institut, shows no sign of slowing. In the United Kingdom, the updated risk assessment and outbreaks on large commercial farms have led to further culling and strengthened protection zones.
Portugal is also seeing a rapid deterioration, with new outbreaks and a risk of transmission between wild birds and domestic poultry now classified as “very high”. In Italy, from late October to November, outbreaks of H5N1 and H5N8 were confirmed mainly in Lombardy and Veneto, triggering the immediate implementation of emergency measures.
Globally, the situation is no less challenging. Beyond Europe, avian influenza continues to affect wildlife, with dramatic events such as mass mortality among southern elephant seals in South Georgia, a stark sign of the ecological impact of a virus that extends well beyond the production sector and affects entire ecosystems.
This scenario reinforces the importance of strict biosecurity: housing birds in high-risk areas, controlling farm access, disinfecting vehicles and equipment thoroughly, daily monitoring and managing bird movements carefully. These measures remain essential to protect farms during a period of heightened epidemiological risk.
DECEMBER 2025
REPORTAGE
AVEC concludes 67th General Assembly in Copenhagen: EU poultry sector urges fair trade, simplification, and support for the next generation
DOSSIER
Thoughts on diet energy
MARKETING
The U.S. poultry industry under stress: a turbulent decade in retrospect. Part 1 – The egg industry
TECH COLUMN
Modern incubation techniques to improve chick quality and uniformity
NUTRITION
Sea urchin waste as an alternative source of calcium for laying hens
VETERINARY
Decoding cecal cores in chickens: from necropsy to diagnosis
AVIAGEN SWECHICK AND NORDIC POULTRY
PRODUCERS CELEBRATE 50 YEARS TOGETHER
Oct. 17, 2025 – Edinburgh, Scotland — September marked half a century of Aviagen® SweChick working hand in hand with poultry producers in Denmark, Finland, Sweden, Norway and Iceland as well as supplying chicks to the Baltics.
Honoring customers
To celebrate the occasion, SweChick welcomed more than 50 customers and sector representatives to a special anniversary event in mid-September. The gathering highlighted the strong collaboration between SweChick and its customers — a relationship that has shaped the company’s story over five decades.
Exploring recent advances
Knowledge exchange was at the heart of the program. Managing Director Magnus Swalander opened the sessions with an outlook on SweChick’s future direction. Espen Sørlie from Nortura Samvirkekylling offered a customer perspective on how production and farming systems have evolved over time. Jens Lesuisse, Global Product Director, outlined the process behind developing existing and new breeds, and Brendan Duggan, Director of R&D, explored what the future holds for the next generation of chickens. Swalander reflected, “We owe our 50 years in the region
to our customers, whose dedication has enabled them to breed successful flocks for a market that values chicken so highly. Our role is to stand beside them — offering trusted Ross® 308 as well as slower growing parent stock like the Rustic Gold®, investing locally to strengthen supply security, and supporting them in raising healthy, efficient birds. By providing choice, we help our customers meet a wide variety of market needs while advancing welfare and sustainability across our breed portfolio.”
Recognizing employees
The celebrations continued the following day with a dedicated event for SweChick employees and contract farm owners, recognizing their vital role as the people behind the birds. From caring for flocks to driving improvements in welfare, efficiency and performance — and to breeding success together with our customers — their commitment has been essential to the company’s journey. “They make it possible to deliver robust parent stock throughout the region, and we are proud of all they do,” added Swalander.
Source: Aviagen SweChick press release
FEFAC PUBLISHES 5TH FEED SUSTAINABILITY CHARTER 2030 PROGRESS REPORT
On 17 October 2025, FEFAC published the 5th edition of its Feed Sustainability Charter 2030 Progress Report, marking the halfway point of the Charter’s implementation timeline since its launch in 2020. The report provides an overview of progress made by the European feed industry in advancing the Charter’s five ambitions — climate neutrality, responsible sourcing, animal health and welfare, resource efficiency, and socio-economic resilience — while addressing the impact of a rapidly changing geopolitical and regulatory environment.
The 2025 report comes at a time when the European feed sector is operating in a rapidly evolving geopolitical and global trade and market landscape. The arrival of the new European Commission and Parliament, alongside sweeping geopolitical developments, is prompting a recalibration of “mid- to longterm strategies to address both challenges and opportunities for the industry”.
This year’s Progress Report edition has been updated with the adjustment from the previous EU Green Deal to the new EU Competitiveness Compass, as well as the new EU Vision on Agriculture and Food, published by the European Commission in January and February 2025, which places competitiveness, resilience, innovation, decarbonisation, and food security at the centre of EU objectives. The Progress Report shows how the feed industry contributes to these goals through a range of initiatives, spread out over the five Feed Sustainability Charter ambitions. Recent achievements include the endorsement of the EU Green Feed Labelling Guidelines, which establish harmonised tools for communicating the environmental performance of compound feed to livestock farmers, and the publication of the Circular Feed Platform Catalogue, calling for regulatory modernisation to unlock the use of safe, circular feed resources. Responsible sourcing remains a central ambition and concern, with the EU Deforestation Regulation impacting soy supply chains and the availability of compliant materials. At the same time, animal nutrition continues to support efforts to reduce antimicrobial use in livestock farming, while new initiatives at EU level are focusing on strengthening competitiveness and resilience through trade diversification while securing access to strategic, essential feed ingredients.
FEFAC President Pedro Cordero: “European feed manufacturers are navigating a period of uncertainty shaped by shifting global trade flows, geopolitical tensions and an evolving regulatory framework, while a new political cycle in Europe is opening opportunities to strengthen resilience and competitiveness along the whole Agri-Food chain. Despite these challenges, our sector continues to provide reliable solutions every day, working with farmers and value chain partners upstream and downstream to advance circularity in the feed and food chain, reduce environmental impacts and support
the transition towards a more sustainable livestock economy. I warmly invite all stakeholders to read our 5th Progress Report as a testimony of our members’ commitment to boost circularity and sustainability of EU livestock and aquaculture production systems in practice”.
For more information visit www.fefac.eu.
Source: FEFAC
AVEC CONCLUDES 67TH GENERAL ASSEMBLY IN
COPENHAGEN:
EU POULTRY SECTOR URGES FAIR
TRADE, SIMPLIFICATION, AND SUPPORT FOR
THE NEXT GENERATION
AVEC, the Association of Poultry Processors and Poultry Trade in the EU, concluded its 67th General Assembly on 7th September hosted by the Danish Agriculture and Food Council in Copenhagen. This year’s conference, themed “Competitiveness in a Changing World”, focused on Europe’s agri-food resilience and the role of the European poultry sector in achieving sustainable growth and securing food for the future.
“Our sector is one of Europe’s quiet success stories: efficient, sustainable, and truly circular. We deliver a highquality protein with the lowest carbon footprint among meats, using every part of the bird in food, pharmaceuticals, pet nutrition, fertilisers and energy” said AVEC’s President, Gert-Jan Oplaat. “That makes poultry indispensable to Europe’s food security.”
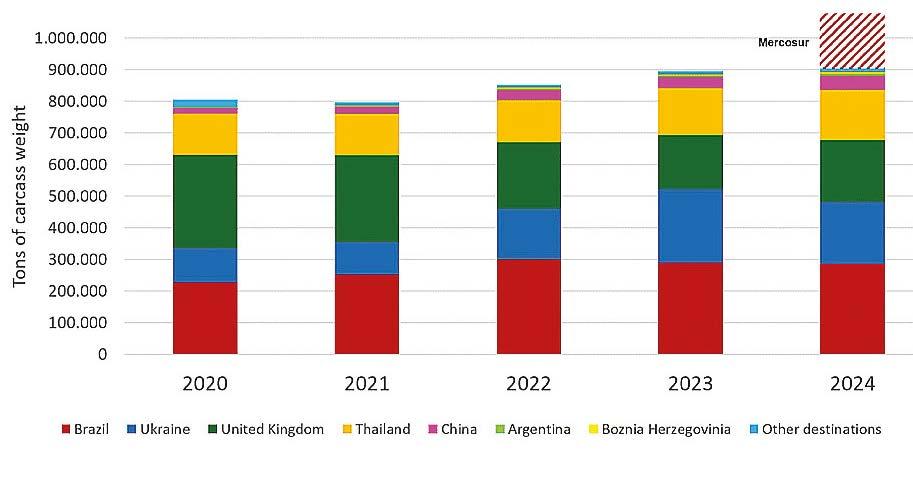
Despite these strengths, the sector faces growing pressure. Poultry imports from 3rd countries such as Brazil, China and Ukraine continue to rise, often produced under conditions that would never be authorised in the EU – “25% of poultry breast meat consumed in the EU now comes from third countries” states Oplaat.
▲ Figure 1 – Poultry meat imports in the EU Source: DG Agri.
It has emerged that farmers and processors are weighed down by increasingly complex laws, which widen the competitiveness gap, while European gold-plating creates new costs and distortions within the Single Market.
As if that were not enough, there is also a severe demographic gap: “Only 6.5% of EU farmers are under the age of 35, and just 11.9% under 40” said Sébastien Pérel of CEJA, adding that “without young farmers there is no future for agriculture at all.”
The MERCOSUR agreement was also discussed, seen as a threat since it continues to disregard the European sustainability model and risks creating unfair competition. “Our standards, our sustainability efforts, and the trust of EU consumers must not be traded away” Oplaat stressed. “The Council and the European Parliament should reject this proposal and defend European agriculture.”
Looking to the future
Looking to the future, for the EU’s new report Vision for Agriculture and Food competitiveness, food security and fair trade are the priorities. “We (referring to the EU poultry sector and the Commission) are much more aligned than we used to be”, confirmed Catherine Geslain-Lanéelle, Director at the European Commission’s DG AGRI. AVEC sees this as the foundation for stronger cooperation in the years ahead. “The more we engage in evidence-based dialogue and partnership, the better we can deliver sustainable competitiveness for Europe’s citizens, its farmers and its environment” said AVEC’s Secretary General, Birthe Steenberg.
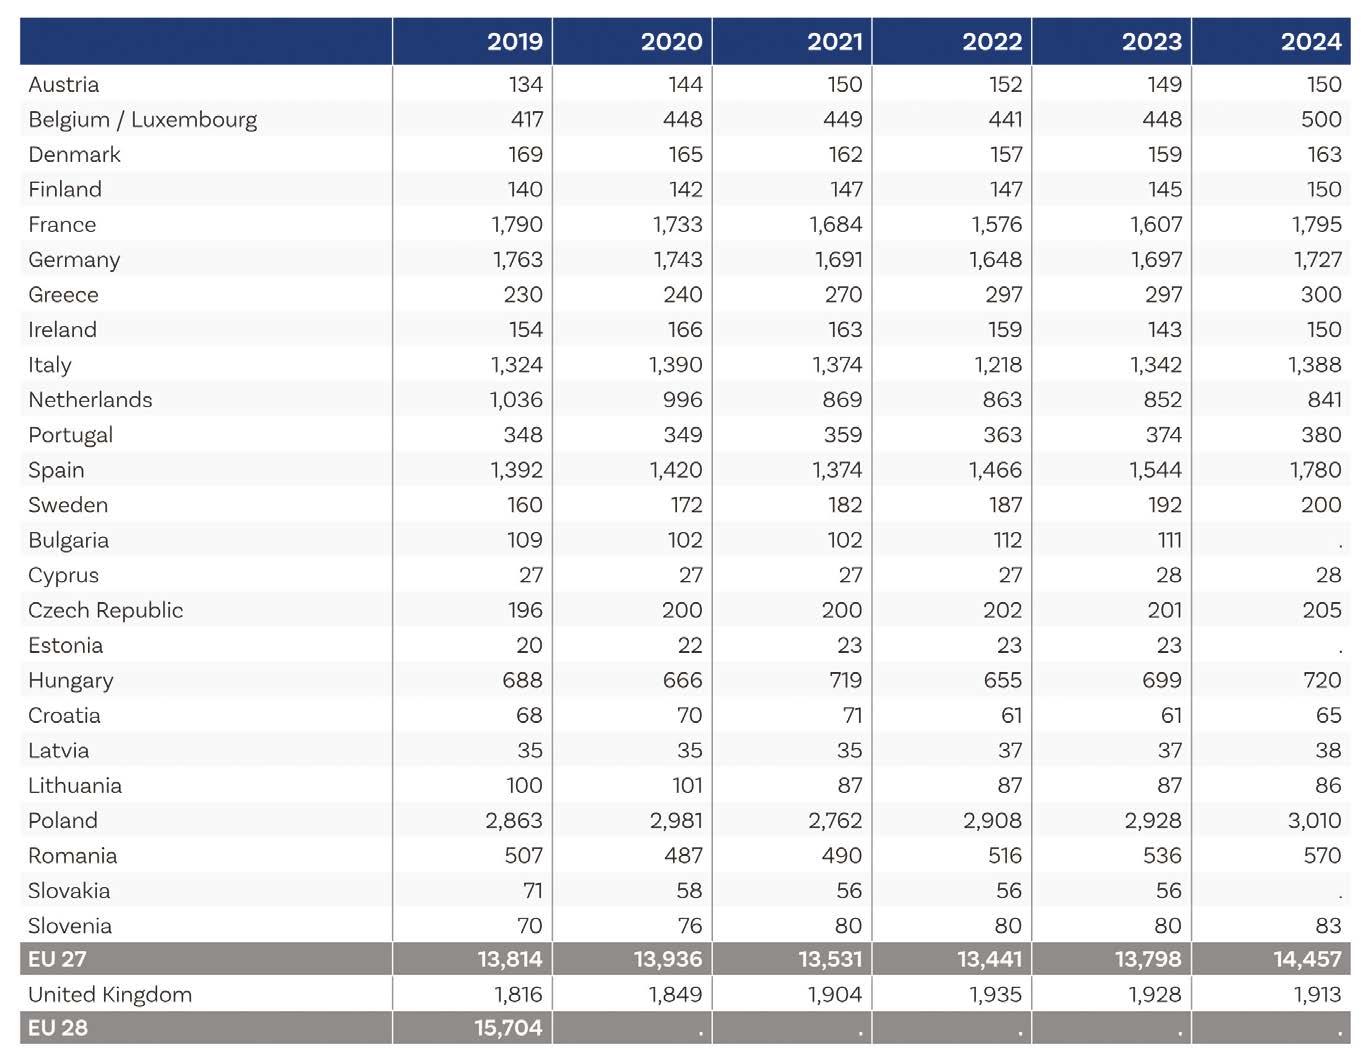
■ Table 1 – Gross domestic production of poultry meat in the EU and UK (’000 tonnes carcass weight)
Note: partial provisional or estimated. For EU countries some significant differences between national and EUROSTAT data. Rows partly revised, as Eurostat does not continue supply balances. Now, the data are based more on other sources and own calculations. Sources: MEG according to EU Commission, national data, FAO and EUROSTAT.
To underpin this new strategic direction towards competitiveness with facts, AVEC announced that it will release a new Competitiveness Study in early 2026. Building on 2024 cost data, it will quantify the impact of EU legislation, assess competitiveness against non-EU producers, and model trade policy scenarios. “The new study aims to provide the evidence policymakers need to ensure Europe’s high standards remain an asset, not a handicap” added Steenberg. From the General Assembly in Copenhagen, a clear and urgent message to policymakers emerged: rules and bureaucracy must be simplified, European producers must be protected from unfair competition, and support must be given to innovation and generational renewal. “We can and want to remain competitive” Oplaat concluded, “but we need Europe to stand with us. Without reciprocity in trade and a level playing field at home, Europe risks outsourcing its own food security.”
In conjunction with the General Assembly, AVEC released its
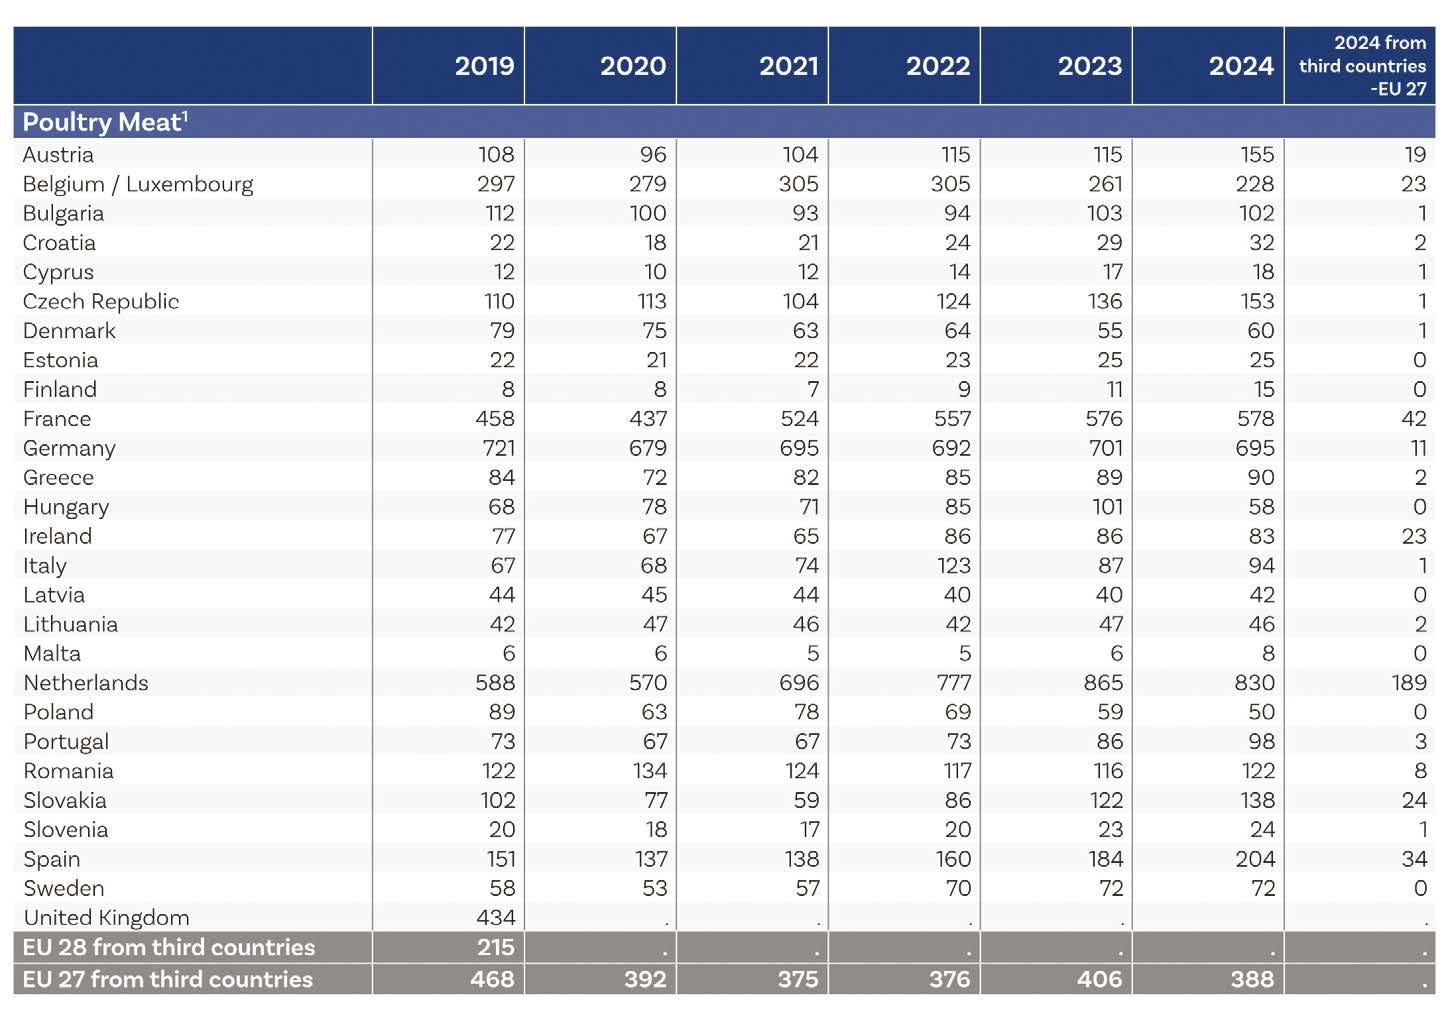
■ Table 3 –Import of EU countries of poultry meat (’000 tonnes carcass weight)
Note: 1) without preparations, livers, salted meat and live poultry.
- 2019 partly preliminary.
- Data in the EUROSTAT trade statistics and trade balance are partially different.
Sources: MEG to Eurostat and national statistics.
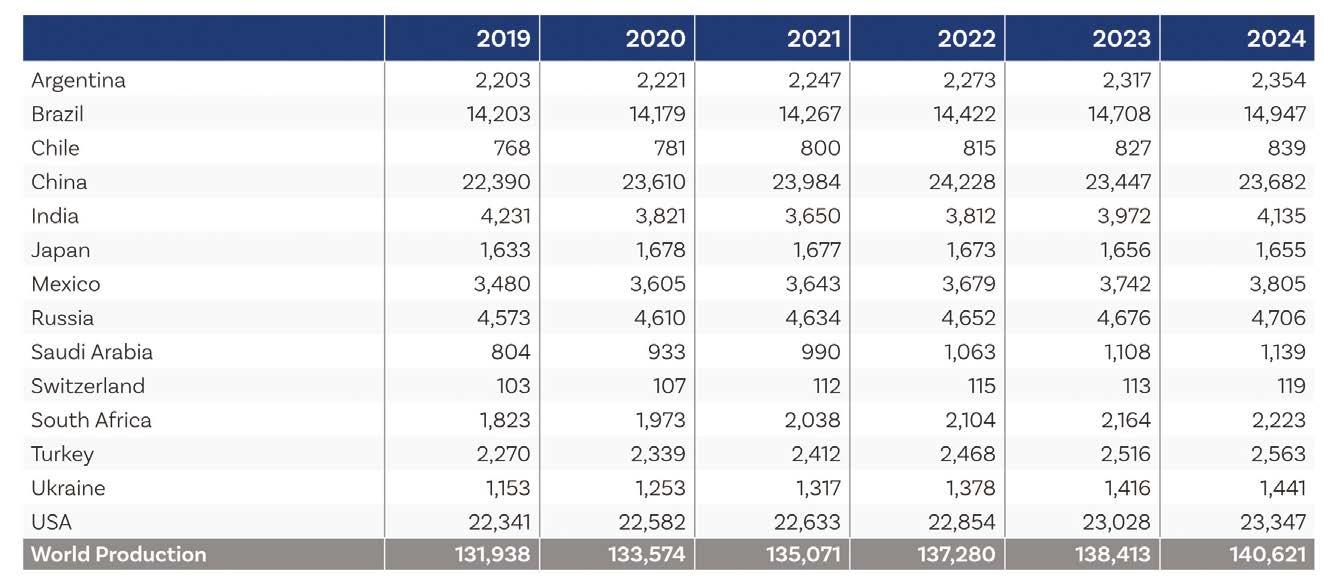
■ Table 2 – Poultry meat production in third countries (’000 tonnes carcass weight)
Note: partial provisional or estimated. Mostly gross domestic production. *) Only chicken and turkey meat.
Sources: MEG to USDA, FAO and national data.
2025 Annual Report, which provides comprehensive insights into the European poultry sector’s priorities, challenges, and achievements over the past year. The report also outlines the association’s strategic goals for the future.
2025 Annual Report
Let’s look at what the statistics from the 2025 annual report show.
First of all, in 2024 poultry production in the EU increased compared to previous years, reaching 13,925 thousand tonnes carcass weight, up from 13,393 in 2023. Consumption (12,281) and per capita consumption (25.1 kg/head) also increased compared to previous years. Self-sufficiency remained stable at 108%, while imports decreased by 4 points compared to the previous year.
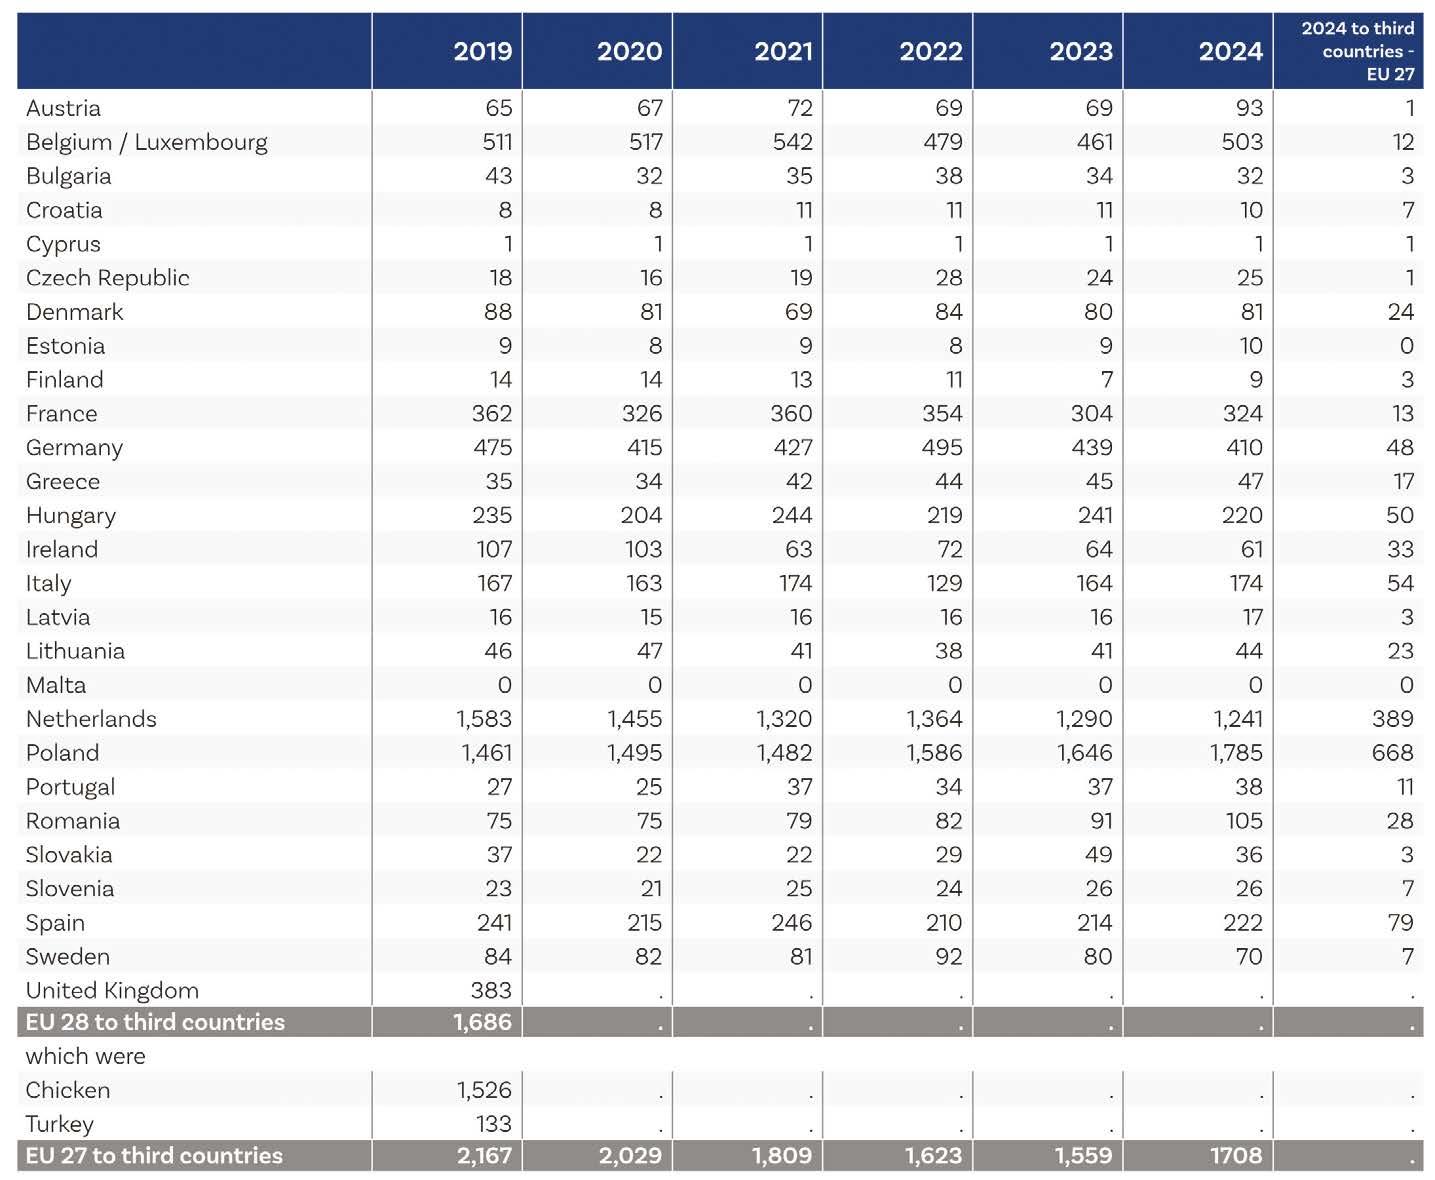
■ Table 4 –Export of EU countries of poultry meat (’000 tonnes carcass weight)
Note: 1) without preparations, livers and salted meat
* r.w.e. = retail weight equivalent. Coefficients to transform carcass weight into retail weight are 0.7 for beef and veal, 0.78 for pigmeat and 0.88 for both poultry meat and sheep and goat meat.
As in 2023, the top producers in 2024 were Poland, the UK, and France. While Poland and France saw increases compared to previous years, UK production experienced a slight decline compared to 2023 (Table 1).
Looking at poultry meat production in the rest of the world, which reached 140,621 thousand tonnes in 2024, up compared to 2023, China ranked first, followed by the USA and Brazil—all three showing growth compared to the previous year (Table 2).
Now let’s move on to imports and exports.
In the EU, the largest importers of poultry meat were the Netherlands and Germany, both down compared to the previous year, and France, which showed a slight increase (Table 3).
Regarding exports, Poland, the Netherlands, and Belgium/ Luxembourg remained the top exporters, just as in the previous year (Table 4).
The most imported products were salted/brined poultry meat, frozen chicken, and fresh chicken; the most exported products were frozen chicken, fresh chicken, and poultrybased preparations.
In the rest of the world, Japan, Saudi Arabia, and Iraq were the largest importers of broiler chickens, all three showing increases compared to the previous year, while the main exporters were Brazil, the USA, and Thailand.
As usual, the AVEC report also analyzes per capita consumption.
As in the previous year, the top three positions were held by Portugal, Ireland, and Poland.
Future outlook
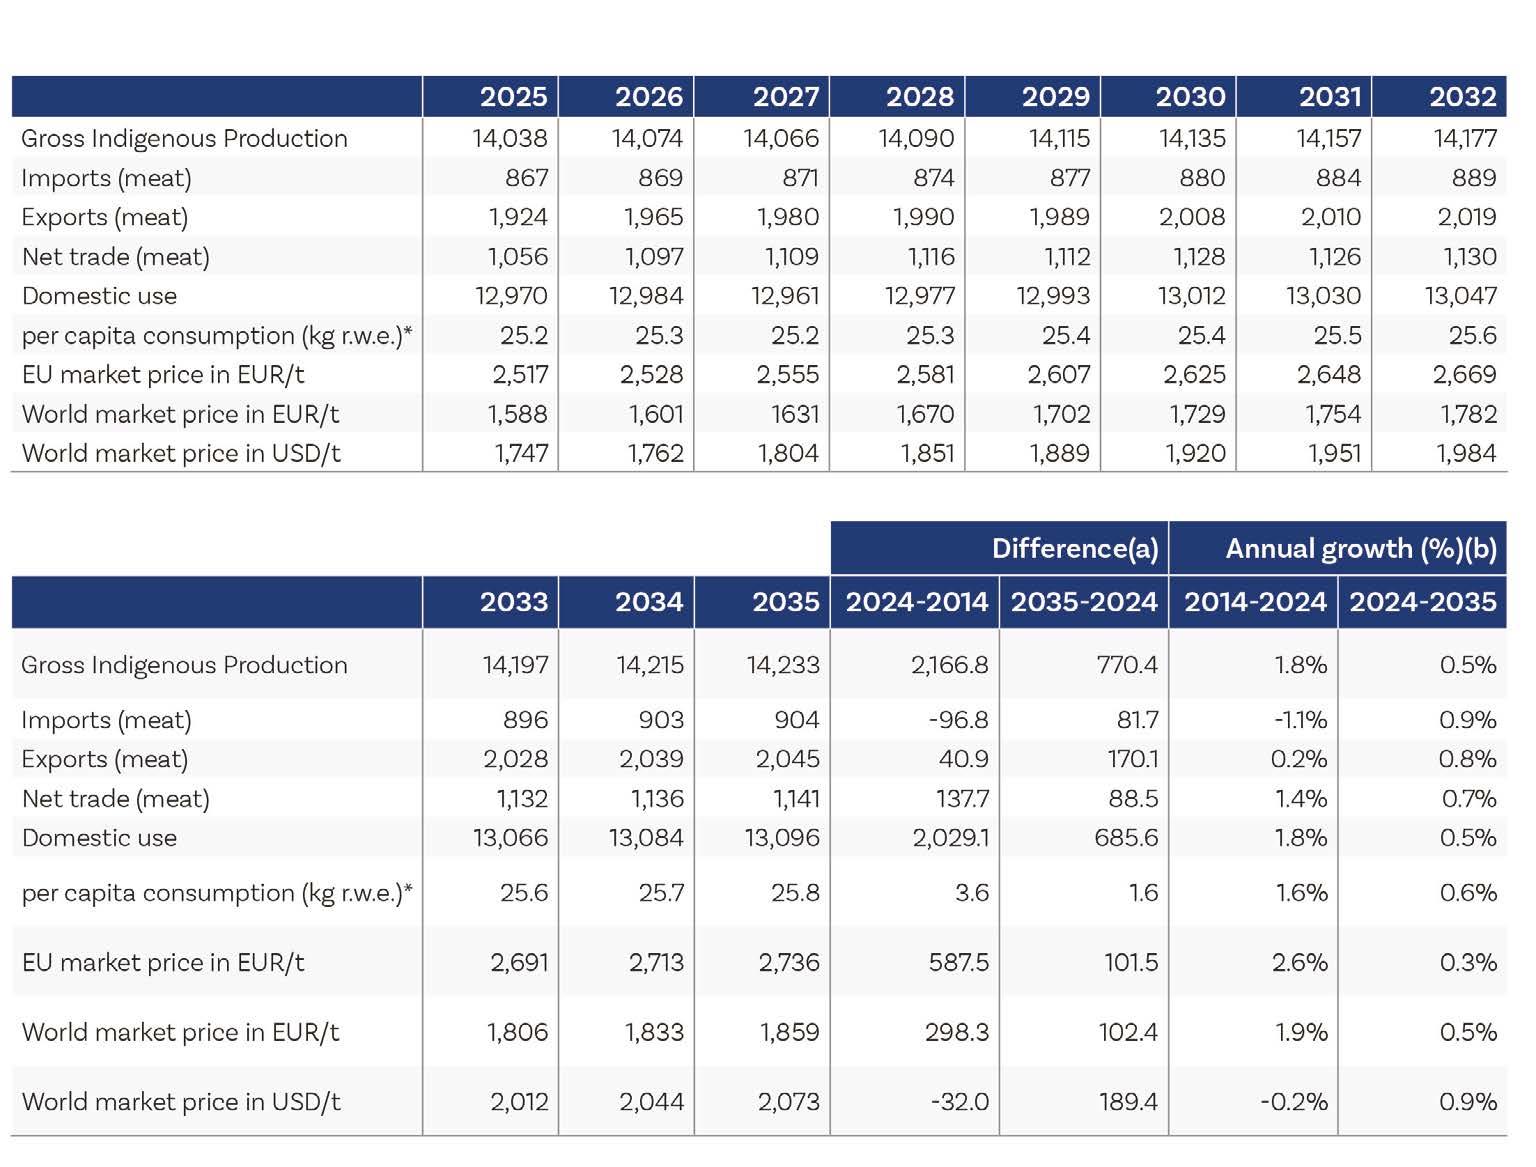
After a detailed analysis of the poultry market, the AVEC report also outlines future prospects up to 2035, forecasting that by that year nine indicators will show positive growth (Table 5). These are:
• Gross domestic production
• Imports
• Exports
• Net trade
• Domestic use
• Per capita consumption (kg r.w.e. – retail weight equivalent)
Since 1970, Thailand’s chicken industry has grown remarkably, evolving from backyard farms into one of the world’s most modern broiler production sectors. Today, Thailand ranks as the seventh largest chicken meat producer globally.
➤ Mainbayar Badarch Market analyst
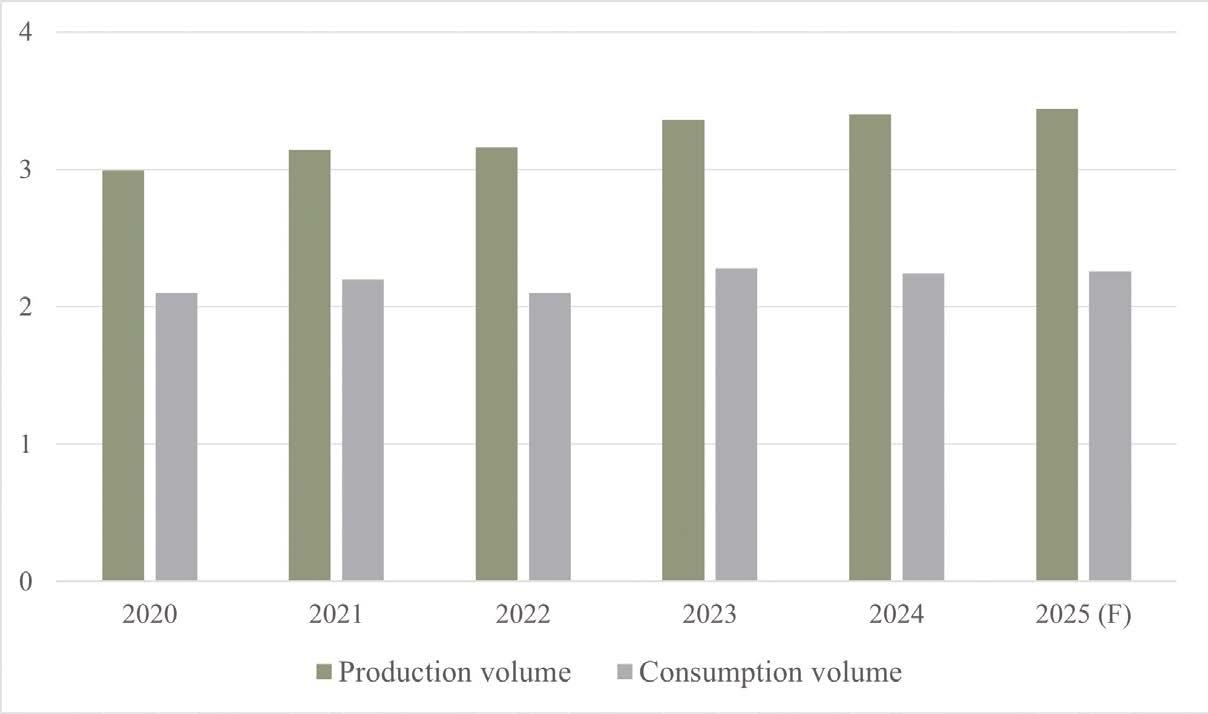
According to the Thai Office of Agricultural Economics, chicken meat production in Thailand is forecast to reach 3.44 million tons in 2025, a 1.3% increase from the previous year.
Over 65% of production is consumed domestically, while the remaining 35% is exported. In 2024, local broiler consumption reached 2.24 million tons.
Chicken meat is now Thailand’s third-largest agricultural export. Thai producers enjoy a competitive edge by offering tailor-made cuts and products.
Key strengths include a standardized production system, strong disease control, and advanced processing techniques.
▲ Figure 1 – Production and consumption of chicken in Thailand (million tons) Source: Office of Agricultural Economics, Thailand.
There are 1,252 legal enterprises in the chicken product manufacturing sector. Around 80% are small-scale operations, while 20% are medium and large enterprises. However, small-scale farmers contribute only about 10% of broiler production. The remaining 90% comes from large-scale operators that integrate upstream and downstream activities, running their own farms and engaging contract farmers. Major players include Charoen Pokphand Foods, Betagro, Thai Foods Group, GFPT, FM, and CFARM.
▲ Figure 2 – Value of Thai chicken exports (billion US$) 2020-2024 Source: Ministry of Commerce, Thailand and Kasikorn Research.
Export market
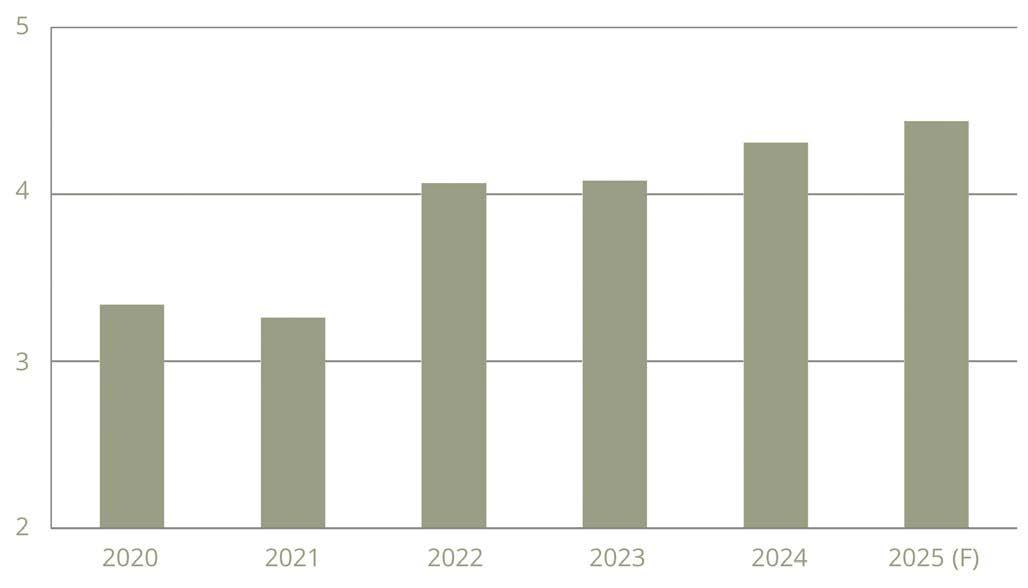
Thailand is the world’s fourth-largest chicken exporter, accounting for roughly 8% of global trade. According to the Ministry of Commerce and Kasikorn Research, the value of chicken product exports is expected to reach US$4.4 billion in 2025, a 3.0% year-on-year increase. Processed chicken accounts for about 70% of total exports, followed by fresh chicken (chilled or frozen).
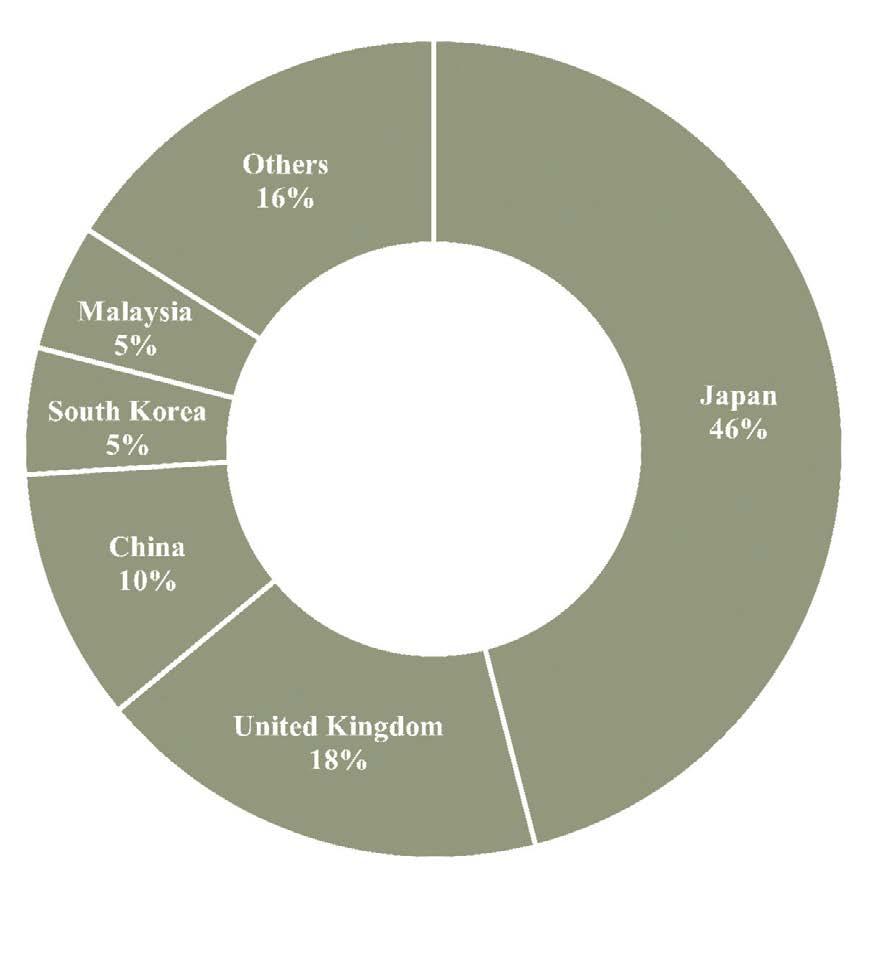
Japan and the United Kingdom are Thailand’s largest trading partners, together holding more than 64% of market share, followed by China, South Korea, and Malaysia. The country has secured Free Trade Agreements (FTAs) including ASEAN-Japan, ASEANChina, ASEAN-South Korea, Thailand-Japan, and Thailand-Australia, which have significantly boosted the poultry sector.
Negotiations are ongoing for further agreements, namely the Thailand-European Union FTA and Thailand-Turkey FTA. On 23 January 2025, Thailand and the European Free Trade Association (Iceland, Liechtenstein, Norway, and Switzerland) signed the EFTA-Thailand FTA in Davos, Switzerland. In 2024, Thailand exported broiler chicken worth more than US$1.26 billion to the EU and UK, making it the region’s largest supplier.
The United Arab Emirates, though still a relatively new market representing only 2–3% of Thailand’s exports, is seeing rapid growth due to rising demand for halal chicken. In the first five months of 2025, exports to the
▲ Figure 3 – Market share of Thai chicken exports in the first five months of 2025
Source: Ministry of Commerce, Thailand and Kasikorn Research.
UAE increased more than fivefold compared to the same period in 2024.
However, Thai exporters face fierce competition from low-cost producers such as Brazil, China, and the United States, which benefit from cheaper feed and large-scale production. Thailand, by contrast, imports over 60% of its feed ingredients, raising production costs and pushing export prices higher than those of competitors. Price competition with China is particularly tough: China’s average processed chicken export price to Japan is about 13% lower than Thailand’s. Adding to the challenge, Thai companies are relocating production bases to other Asian countries to gain competitive advantages. This trend could slow Thai chicken export growth in the future. Indeed, the compound annual growth rate of Thai chicken product exports has already declined from an average of 9.0% between 2015–2019 to 6.5% between 2020–2024. In response, some Thai broiler producers are diversifying their business portfolios.
Business portfolio shift
CFARM is restructuring its revenue streams by shifting focus from broilers to eggs, aiming for more stable and recurring income. The company has approved an investment of 119.7 million baht (US$3.7 million) to build a closed-cage egg farm in Buriram Province. The project
has a targeted payback period of about five years.
Construction is expected to finish in the fourth quarter of 2025, with operations starting in early 2026. The farm will initially house 200,000 chickens. CFARM has already secured market access through agreements with long-term partners who previously focused on broilers but are now expanding into egg production.
The company’s egg farm will follow the contract farming model used in its broiler operations. CFARM will purchase chicks and feed from production partners, manage the rearing process, and then supply the output back to partners. This approach reduces exposure to feed price volatility, as raw material costs are predetermined in contracts. According to Ms. Mathucha Chungthanasomboon, Deputy Managing Director of CFARM: “Our goal is to increase the share of recurring income from egg production to reduce exposure to market volatility. If demand grows, we are ready to expand capacity, as the necessary land is already available”.
CFARM’s original core business was broiler farming, with a capacity of 3.2 million birds per cycle, or about 15.8 million annually. Each cycle lasts around 2–2.5 months. While broilers remain its primary revenue source, the cyclical nature of production limits daily cash flow. Egg farming offers a complementary opportunity to stabilize income.
Chicken welfare improvement
Both broiler and layer farms are expected to face higher costs to comply with safety and epidemic control standards, which could narrow profit margins. Rising farm management and utility expenses are likely to reduce the average gross margin from the current 20–30% range. Compliance with stricter export requirements — covering food hygiene, residue levels, veterinary drug use, animal welfare, and ESG criteria — will further increase costs. Nevertheless, these investments are essential to maintain confidence among key trading partners, particularly in the EU and Japan, where standards are becoming more stringent. Although costly, the long-term benefits will be significant. Thailand is making progress step by step. A notable example is the work of World Animal Protection Thailand, which is promoting sustainable chicken farming by establishing Surin Province as a pilot area for highwelfare Korat chicken production.
Its Farm Champion project, now in its second year, is expanding from pilot level to a community-wide initiative. The program encourages a shift from closed housing to higher-welfare systems, with full implementation planned for 2025.
Results from the first year were tangible: chickens raised under the welfare-focused model were healthier, enjoyed access to sunlight and fresh air, and displayed natural behaviors. Survival rates rose from an average of 95% to 99%.
Participating farms eliminated antibiotics entirely, replacing them with traditional protein sources such as black soldier fly larvae, Azolla, water chestnut seeds, and local herbs. This reduced medication and chemical costs by thousands of baht per batch while generating higher income from premium high-welfare chickens.
The Korat chicken, a Thai-developed slow-growing breed, has been central to the program. In its second year, the project includes farmers raising between 500 and 1,200 birds. Experienced farmers now serve as mentors for newcomers, strengthening a “model farmer community network” and driving systemic change from within.
THOUGHTS
ON DIET ENERGY
DEFINITIONS, REQUIREMENTS AND ALTERNATIVES
Energy is by far our most expensive nutrient, yet surprisingly we never receive guarantees when we trade ingredients or manufacture diets. Energy level dictates feed intake and so knowledge of diet energy levels is a prerequisite to setting specifications of most other nutrients. We have gravitated to almost universal use of AMEn in describing requirements and for diet formulation, and so unfortunately have glossed over the potential of using DE for establishing the relative diet value of ingredients. The validity of using AMEn vs AME is discussed relative to current needs of poultry nutritionists. To date, we have not established real-time NE values for ingredients, rather trending to predictive assessments based on various estimates of energy yielding components and generalized estimates of digestibility or metabolizability. Almost 50% of diet energy is used for maintenance, so minimizing this component is an obvious direction to improving efficiency.
➤ Steve Leeson Professor Emeritus, University of Guelph sleeson@uoguelph.ca
INTRODUCTION
Energy is the most costly component of poultry diets, with global spending exceeding $100 billion. Unlike other nutrients, there is little assurance of the energy content in purchased ingredients or formulated diets, and current estimates rely on expensive and time-consuming bioassays with live birds. Alternative predictive methods, such as equations, in vitro assays, or rapid physical analyses, have had limited success.
Energy is also the main driver of feed intake: birds eat to meet their energy requirements. Therefore, setting diet energy levels directly affects the proportional levels of other nutrients, such as amino acids. White-egg layers adjust feed intake very accurately according to diet energy, while broilers can do so only under true ad libitum conditions, which are rare in commercial settings. Accurate knowledge of diet energy is therefore essential for proper nutrient formulation. The following discussion focuses on energy evaluation systems, energy requirements, and potential alternatives for meeting birds’ energy needs.
ENERGY EVALUATION
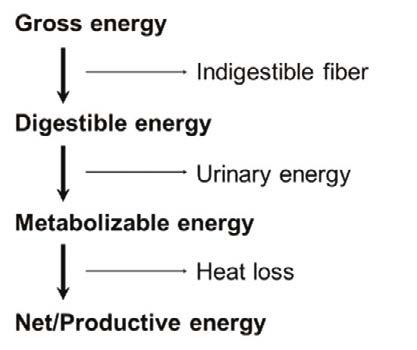
For the last 50 years or so we have used the schematic of energy definition to describe possible options for evaluation (Figure 1).
▲ Figure 1
– Schematic of energy definitions
We invariably dismiss GE since it represents total heat of combustion. However, for QC programs we need to identify “outliers” and so GE can give us a rapid indication that perhaps an ingredient is different from the norm, and so warrants further investigation. DE is likewise dismissed as being impractical to measure since the bird excretes urine and faeces combined, and so measurement needs either surgical modification of the bird or sampling from the distal intestine. On the other hand, we have embraced DAAs (Digestible Amino Acids)
Table 1 – AME and AMEn of maize and SBM (Lopez and Leeson, 2008)
as a standard in describing ingredients and diets that are now routinely used in formulation. It is somewhat surprising that we did not pursue DE in the same manner. DE has the major advantage over ME and NE of being totally unencumbered by bird status and general feeding status. DE is arguably the most appropriate system of evaluating and ranking individual ingredients. Metabolizable energy has become the system of choice in evaluating ingredients and diets and virtually all recommendations from commercial breeding companies are as ME. Although we talk about ME, in fact we are usually referring to AMEn. The ’A’ prefix refers to the “Apparent” status of these values, since there are always endogenous energy losses from a bird regardless of feed intake. The industry briefly looked at TMEn that accounts for endogenous losses. Such losses are quite minor, unless the bird is given very limited quantities of feed. With ad libitum intake, endogenous losses are in the order of 2-3%, which has a minor impact in the calculation of retained energy. Such endogenous losses are inevitable and must be “paid-for” at some stage in the calculation of energy retention, a situation that occurs with AMEn. To some extent endogenous losses will vary with ingredient and is usually higher for ingredients with higher levels of fibre (so contributing to their lower energy capture).
The suffix “n” in AMEn refers to nitrogen retention status and is perhaps of more significance. During a bioassay, birds will retain nitrogen to varying degrees and so this impacts urinary energy output. The greater the nitrogen retention, the higher the AME value. To reduce such variance, the common practice is to correct all assay calculations based on the assumption that no nitrogen is retained i.e. zero nitrogen retention. Each gram of N
retained, if it appeared in the urine would add 34.4 kJ to the excreta energy. This rather drastic measure has some rational basis in that all N/protein is eventually used as an energy source during protein turnover. Labelled N fed to the broiler at 7 days will not be found in the body at 42 days for example. However, during a 4-5 day bioassay, obviously, all N consumed will not be excreted in a healthy bird. The zero-retention basis also had a legitimate basis when introduced in the 1960s since nutritionists were formulating diets for multiple farm species that had inherently different rates of N retention. However, it seems somewhat illogical to derive energy values accepting the situation that the bird is N-free and has not grown, or that
■
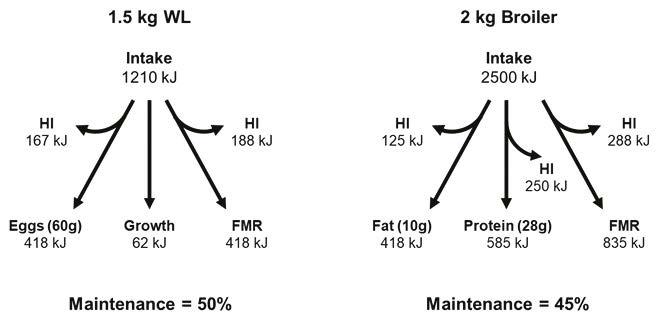
▲ Figure 2 – Energy partitioning of layers and broilers
the laying hen has not produced eggs. One advantage of using adult roosters in such ME bioassays is that they are usually close to zero-N balance and so the correction is a physiological norm. However, we know that age of bird impacts AME values (Lopez and Leeson, 2007). The n-correction will obviously penalise protein-rich ingredients more so than cereals. Since broiler nutritionists rarely need to formulate for multispecies that perhaps have variable N-retention, then perhaps the use of uncorrected values (AME) is more appropriate for today’s more focused poultry nutrition. Lopez and Leeson (2008) estimated both AME and AMEn for maize and soybean meal with different ages of broiler (Table 1).
■ Table 2 – Energy and feed intake of broilers (from Gopinger et al. 2017) and layers (from Ribeiro et al. 2014) when fed diets varying in AMEn
As suspected, the correction for N retention penalizes SBM by 7-14% compared to just 2-5% with maize. Abdollahi et al. (2021) showed comparable differences for SBM. In taking this concept of AME for broilers one step further, Lopez and Leeson (2008) showed that broilers grown on diets formulated to AME, rather than conventional AMEn, had slightly inferior growth rate (-20g) and inferior feed efficiency (+0.02) although the cost per kg of body weight gain was reduced by 5%. Formulating to AME does however pose some practical issues. Because N retention varies with age, then agerelated AME values are likely needed to fully capitalize on this system. The other major obstacle currently, is that all requirement values, whether commercial or independent, are based on AMEn. In essence AME is a step closer to NE, which is touted as being the ultimate system of energy evaluation. Measuring AME or AMEn necessarily involves a live bird bioassay during which the GE of feed eaten, and resultant excreta are measured. This bioassay is straightforward in assessing diets but becomes much more complicated in assessing individual ingredients. Ingredients are substituted for basal diets or for glucose and then the ingredient value calculated from regression analysis to 100% inclusion of the test ingredient. The greater the distance from actual inclusion (e.g. 20%) level to 100% the greater the standard error of prediction. High test inclusion levels are challenging with high-fiber or high-CP ingredients and especially so for fat where maximum inclusion rarely gets above 15% of any test diet. For ingredients used at exceptionally low
inclusion levels, such as amino acids, a bioassay becomes virtually impossible and so we rely on predictive estimates (van Milgen et al, 2020). Since energy comes from organic components there is potential for estimation via NIRA. Valdez and Leeson (1992a,b,c) clearly showed that NIRA has potential to predict AMEn of both diets and ingredients and was especially useful for assessing fats and oils. However, as in any NIRA measurement, prediction is reliant on robust calibration that includes calibration samples covering the entire range of anticipated AMEn. The final potential evaluation system to consider is Net Energy. When digested energy is utilized there will be varying degrees of inefficiency associated with “rearrangement” of components necessary for ultimate deposition as fat or protein in eggs or the body of meat birds. There will also be inefficiency from a production viewpoint in that energy will be used for non-productive purposes, generally termed maintenance; with adult broiler breeders for example, the overwhelming use of energy is for maintenance. Of most economic significance is the proportion of energy deposited as protein (Nep) or fat (Nef). It is exceptionally difficult to measure NE and to date there is virtually no published information on the direct assessment of NE of ingredients for poultry. A bioassay involves first measuring AMEn and subsequently either energy deposition as fat and protein measured by measuring egg and/or carcass (body) fat and protein. Alternatively, one can estimate maintenance energy from measurement of RQ in a respiration chamber to yield NE (but not Nep and Nef). Measuring NE of diets is complicated and measuring NE of individual ingredients is a very daunting challenge. Consequently, most research on NE involves using various regression or prediction equations based on “digestible” nutrient content etc., a concept that we know does not work very accurately for AMEn. A further thought is that the NE of an ingredient
or diet is as much influenced by the skill of the nutritionist during formulation, as it is the birds use of diet energy.
ENERGY REQUIREMENTS
Regardless of how energy requirements are calculated, the nutritionist must set specific energy levels during formulation. This situation is somewhat confounded with the bird’s ability to alter feed intake to regulate energy intake. Table 2 shows the ability of both layers and broilers to adjust feed intake in response to diet energy concentration.
Although broilers have voracious appetites, they are still able to alter feed intake in response to a vast range of diet energy (assuming they can eat ad libitum). The almost perfect adjustment of feed intake in caged white-egg layers can be used to advantage in monitoring diet energy concentration, assuming there is accurate measurement of daily feed intake. Energy concentration is therefore more of an economic decision rather than an attempt to meet specific goals of performance. Because energy concentration impacts feed intake, then this value dictates intake of all other nutrients. The concept of maintaining an energy: protein ratio still applies to modern birds, albeit more likely replaced by consideration of energy: dig lysine. For broilers, increasing energy concentration in diets adequate in AAs invariably results in improved feed efficiency. However, adding energy to broiler diets deficient in protein/AA (even if balanced) usually has the opposite effect (Aftab, 2019).
Although there are various equations used to predict energy requirements, they invariably fail due to adequately estimate underlying feed intake. In broilers, feed intake is affected by the complex interaction involving stocking density, environmental temperature, pellet quality/size and lighting program. The situation is perhaps less complicated for layers and especially broiler breeders (Teofilo et al., 2023) where we control feed intake. Table 3 shows expected energy intake of broilers, layers and breeders.
The broiler is now slightly more efficient than is the laying hen in terms of energy input per unit of “commercial” gain- for a 3 kg broiler at 42d, efficiency is around 18.8 kJ AMEn/g bodyweight gain, while for layers at peak egg mass around 44 weeks of age, a 59.5 g daily egg mass converts to around 20.5 kJ AMEn/g egg. This change has undoubtedly been caused by the propensity of modern broilers to deposit more muscle (at just over 4 MJ/kg) and less fat (at around 37 MJ/kg).
Energy requirements will obviously be impacted by environmental temperature. At temperatures much below 26 °C the bird will eat more feed to maintain body temperature. Conversely, they will eat less at higher temperatures, assuming that they are not panting which is a very energy demanding process. Measuring house ■ Table 3
temperature at first glance seems to be a straightforward task. Thermometers or temperature probes can be positioned at bird height and records collected daily. However, there is usually considerable fluctuation in temperature throughout the day. Without exact control on house temperature, how do we reconcile this temperature fluctuation in trying to calculate changes in maintenance energy and feed needs. A good example occurs with broiler breeders, since we control feed intake and so we can accommodate fluctuating environmental conditions as they occur. The traditional approach has been to simply take an average of all readings or the average of the high and low daily temperatures e.g. (26 °C+14 °C)/2 = 20 °C. However, breeders do not behave in a similar manner during the day compared with nighttime darkness. During the day most breeders are rarely in contact with other birds and so the air around them is at a temperature very similar to that recorded on the thermometer. When lights are switched off however, birds invariably sit down and are usually huddled close to their flock-mates. Sitting, rather than standing, will reduce heat loss of the bird, while huddling as a group has a great insulating effect. This behavioural change in the bird has the effect of lessening the impact of the cooler night temperatures. Simply averaging high and low temperatures, to calculate feed need, may therefore be inaccurate. Leeson and Summers (2005) proposed calculation of Effective Temperature for use in calculating energy requirements.
For the example detailed above, Effective Temperature becomes 24 °C rather than 20 °C. Table 4 uses this concept and (daytime high temperature x 2) + (nighttime low temperature) 3 Effective temperature =
■ Table 4 – Increase in energy allowance of adult breeders to accommodate lower environmental temperature (kJ AMEn/d)
describes increases in daily energy allowance needed for adult breeders maintained at various temperatures. This same concept can be used to balance energy requirements for any age or class of bird.
ENERGY ALTERNATIVES
There are obviously no alternatives to provision of diet AMEn from the vast array of ingredients now available to the industry. The use of exogenous enzymes helps to improve DE, and formulation is designed to optimize nitrogen utilization. We can however consider various options for improving energy utilization by reducing waste in terms of Heat Increment and/or overall maintenance energy use. Figure 2 is a schematic of energy use by layers and broilers with emphasis on FMR (Fasting Metabolic Rate) maintenance needs.
Regardless of high sustained output of our commercial strains today, we still have at least 45-50% of AMEn intake being used for “non-productive” purposes in terms of maintenance energy needs. Maintenance is comprised of the essential Fasting Metabolic Rate plus activity, plus inefficiency associated with nutrient utilization. Table 4 previously described the energetic inefficiency related to raising birds outside the thermal neutral zone, and long-term energy use will decline as globally most countries embrace
■ Table 5 – Number of pellets consumed to provide comparable daily feed intake for 30d broilers
controlled environment housing systems. Non-cage systems for layers (and now broilers?) obviously impose an inefficiency in energy utilization associated with variable loss in production and greater maintenance need for activity. Hendrix (2022) proposes an increase in energy requirement of at least 10% for free-range vs caged layers. For the Australian layer industry, which embraces free-range production of layers, this represents an additional $17.5 million AUD of feed energy, which seems incongruous with current interest and quantification re sustainability.
So called Heat Increment relates to the inefficiency associated with “rearrangement” of nutrients by the liver in converting from a profile provided by the feed to that required for production of muscle, adipose tissue and eggs. Rearrangement of proteins is most costly in energy need, with fats being the most efficiently utilized. In this regard, reducing crude protein, while sustaining DAA levels will always increase NE capture from the diet. However, this approach is not always economical as well as metabolically inefficient, often due to failure to balance DEB and the fact that large quantities of free synthetic amino acids may not be used with 100% efficiency, likely associated with quantity vs time of “imbalanced” supply arriving at the liver.
For broilers the reason for using pelleted diets is to reduce maintenance energy cost associated with feeding activity. The classic work of Leo Jensen at the University of Georgia showed that improvement in feed efficiency resulting from pelleting feed was not due to “improved” digestibility of heated starch, but rather an 18% reduction in the time spent feeding. Each 1% improvement in pellet quality (% of intact pellets in the feed) is equivalent to +13 kJ/kg of AMEn. Today, pelleted diets are most often used for broilers, although we often underestimate the ability of birds to consume large pellets at younger ages. Obviously the larger the pellet, the less time spent feeding. Table 5 shows the relative number of pellets consumed by broilers as pellet diameter and length are increased.
The same concept applies to layers and can be important where feed intake is compromised due to heat distress. In general, we need to limit the impact of maintenance to direct diet energy to productive purposes.
References are available on request.
From the proceedings of the Australian Poultry Science Symposium 2025, by courtesy of the Professor Steve Leeson.
THE U.S. POULTRY INDUSTRY UNDER STRESS: A TURBULENT DECADE IN RETROSPECT
PART 1 – THE EGG INDUSTRY
Between December 2014 and July 2025, the U.S. poultry industry has been hit by four devastating outbreaks of avian influenza (AI). In total, the highly pathogenic AI virus (HPAI) was diagnosed on 1,043 commercial poultry farms (1,932 total farms including backyard flocks). A total of 221.7 million poultry died due to virus infections or preventive culling. Of these, 178.8 million were laying hens, 25.7 million turkeys and 13.2 million broilers (Table 1). In this article, the temporal and spatial spread of the disease, its economic impact on egg production and the responses of the industry and the government are analysed.
➤ Hans-Wilhelm Windhorst Professor Emeritus at the University of Vechta, Germany
Sharp fluctuations in laying hen numbers
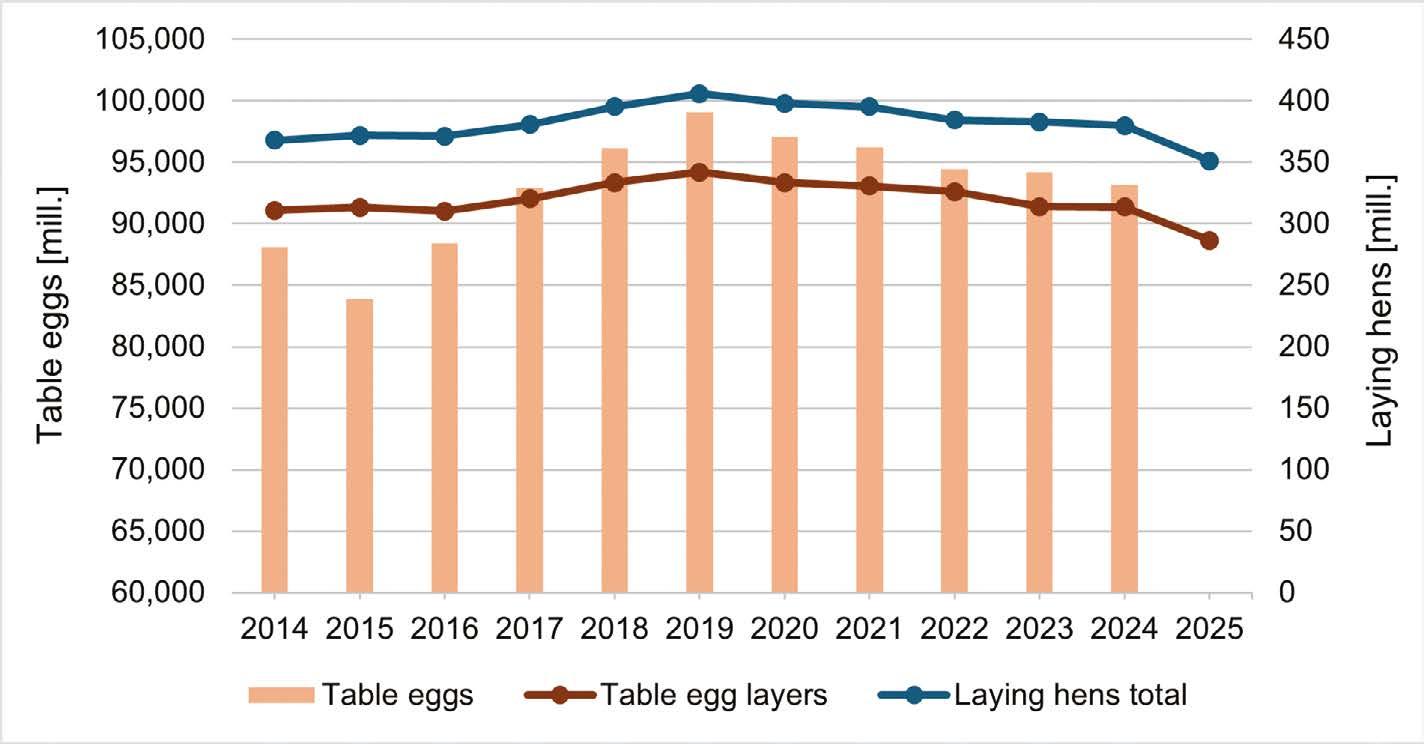
The highest number of laying hens in the analysed decade was reached in 2019 with 405.8 million, and the lowest in March 2025 with just 351.0 million. This fluctuation range was also evident among table egg layers. The highest value of 341.8 million was also recorded in 2019, the lowest value of 286.5 million in March 2025. Figure 1 shows the development of the laying hen inventory over the entire decade.
■ Table 1 – HPAI outbreaks and animal losses in the USA between April 2015 and July 2025; data in mill. birds
Source: APHIS.
The first major outbreak of AI in 2015 caught the poultry industry completely unprepared. It claimed the lives of 40.6
1 The figures include table egg layers and parent stock.
million laying hens, either through infection or preventative culling. As a result, between December 2014 and June 2015, the number of hens fell from 316 million to 275 million1. At the same time, the per capita egg consumption decreased from 263 to 256 pieces, a consequence of the sharp rise in prices due to the supply shortage. By 2019, inventories and table egg production had risen sharply. The Covid-19 pandemic led to a significant increase in the per capita consumption to 293 eggs, because many restaurants and canteens in schools and universities were closed and more meals were prepared in private households. With the end of the pandemic, demand and inventories decreased. With the second massive AI outbreak in 2022, the decline in the hen inventories continued. In total, over 40 million hens died from the disease or were killed as a preventive measure. In June 2022, a first low was reached with only 303 million table egg layers. Although a new wave of outbreaks in the following year was not as drastic as the previous two, it nevertheless resulted in a further decline in hen flocks, which continued into the middle of 2024 due to the reluctant repopulation of the barns. A joint letter from the poultry industry to the Secretary of Agriculture in July 2024 emphasized the critical economic situation in view of the high animal losses and a strategic plan to combat the highly pathogenic AI was called for2 .
▲ Figure 1 – The development of laying hen inventories and table egg production in the USA between 2014 and 2025 Design: A. S. Kauer based on data of the Egg Industry Center, Iowa State University.
The farms had barely recovered from the outbreaks when the fourth epidemic in a decade began in October 2024. It led to the highest losses ever with over 50 million laying hens. From March 2024 to March 2025, the number of table egg layers fell by 11 million to just 283.3 million, the lowest level in over a decade. Production declined by around 6 billion eggs since 2019. The resulting shortage in the food retail sector led to an unprecedented price increase and made egg imports necessary in order to secure the population’s supply. Per capita consumption fell to just 271 eggs in 2024 due to the high prices. The decline in table egg layers continued until mid-2025, in June only 271.3 million hens were counted, and egg prices in food retail remained on a high level. Protests among the population made it necessary for the government to intervene. This will be discussed in a later section.
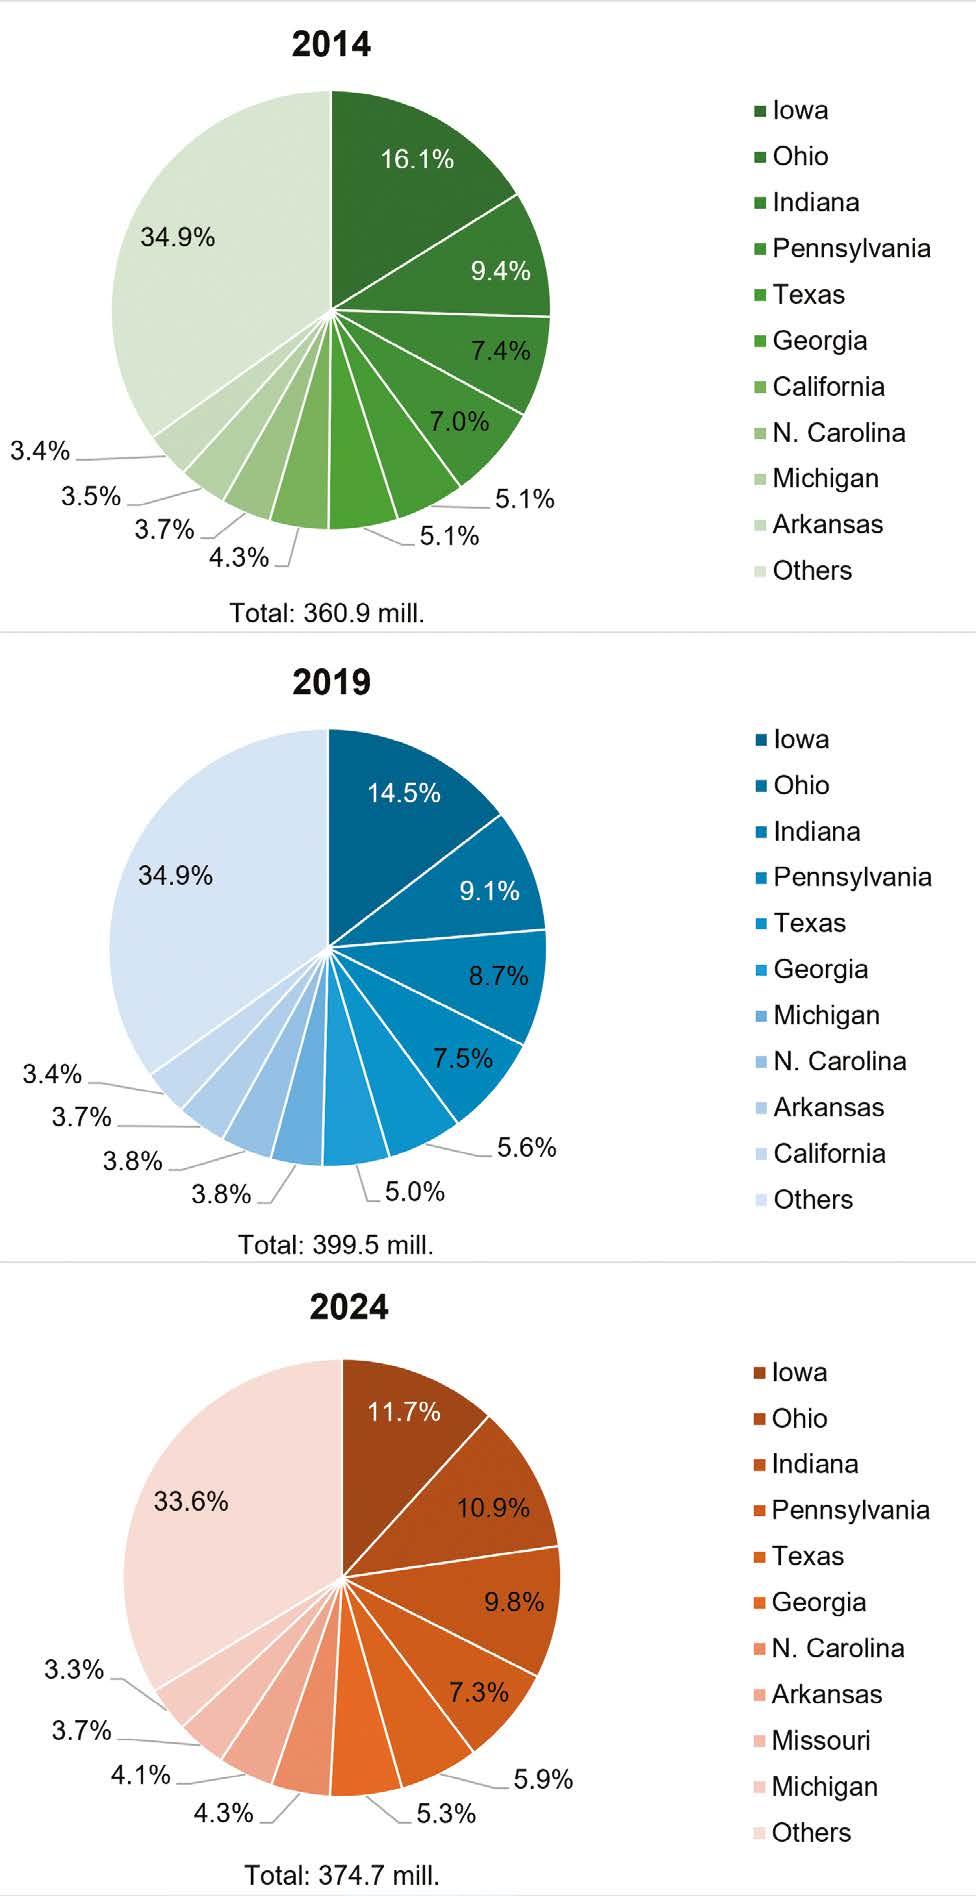
Changes in the spatial pattern
In the decade under review, the spatial pattern of laying hen husbandry has changed significantly. The reasons for the relocation of production are, on the one hand, the high animal losses caused by the four AI epidemics and, on the other hand, changes in the housing systems of laying hens. Some of the leading companies have reduced flocks kept in conventional cages and converted existing barns to cage-free facilities or built new farms in locations with a lower risk of an AI infection. For
example, Rose Acre Farms built two large farm complexes in Arizona in 2018 and 2024, each with more than 2 million hen places, far away from other laying hen farms. In 2022, Cal-Maine Foods converted a farm with 1.1 million places from conventional cages to floor management (large aviaries) and built another new farm for 2.2 million hens in Delta (Utah) (Windhorst 2018, 2023). The four AI epidemics differed as well in their timelines as in their spatial dissemination. Iowa was primarily affected in 2015; Iowa and Nebraska in 2022; Ohio, California and Iowa in 2023; and California, Ohio and Iowa again in 2024/25. The flyways favoured by the wild birds, which were infected with the AI virus, were decisive for the spatial and temporal dissemination of the epidemics 3
A comparison of the ten leading states in their laying hen inventories in 2014, 2019 and 2024 shows (Figure 2) that Iowa lost its dominant position. Between 2014 and 2024, the number of laying hens fell from 59.2 million to 43.8 million, or by 26.0%. The share in the total U.S. hen inventory fell from 16.4% to 11.7%. In contrast, the number of hens in Ohio rose from 29.1 million to 40.7 million, or by 39.2%, and the state’s share in the total inventory increased from 8.1% to 10.8%. Indiana showed a similar dynamic. The big loser was California, whose share in the U.S. table egg layer inventory declined from 2.7% to just 1.4% between April 2014 and April 2024. Like Ohio, California was particularly hard hit by the 2024/25 epidemic. Between April 2024 and April 2025, California lost 4.1 million table egg layers and is no longer one of the leading states. It will take several years to rebuild the flocks. Whether the previous status can be achieved again is an open question.
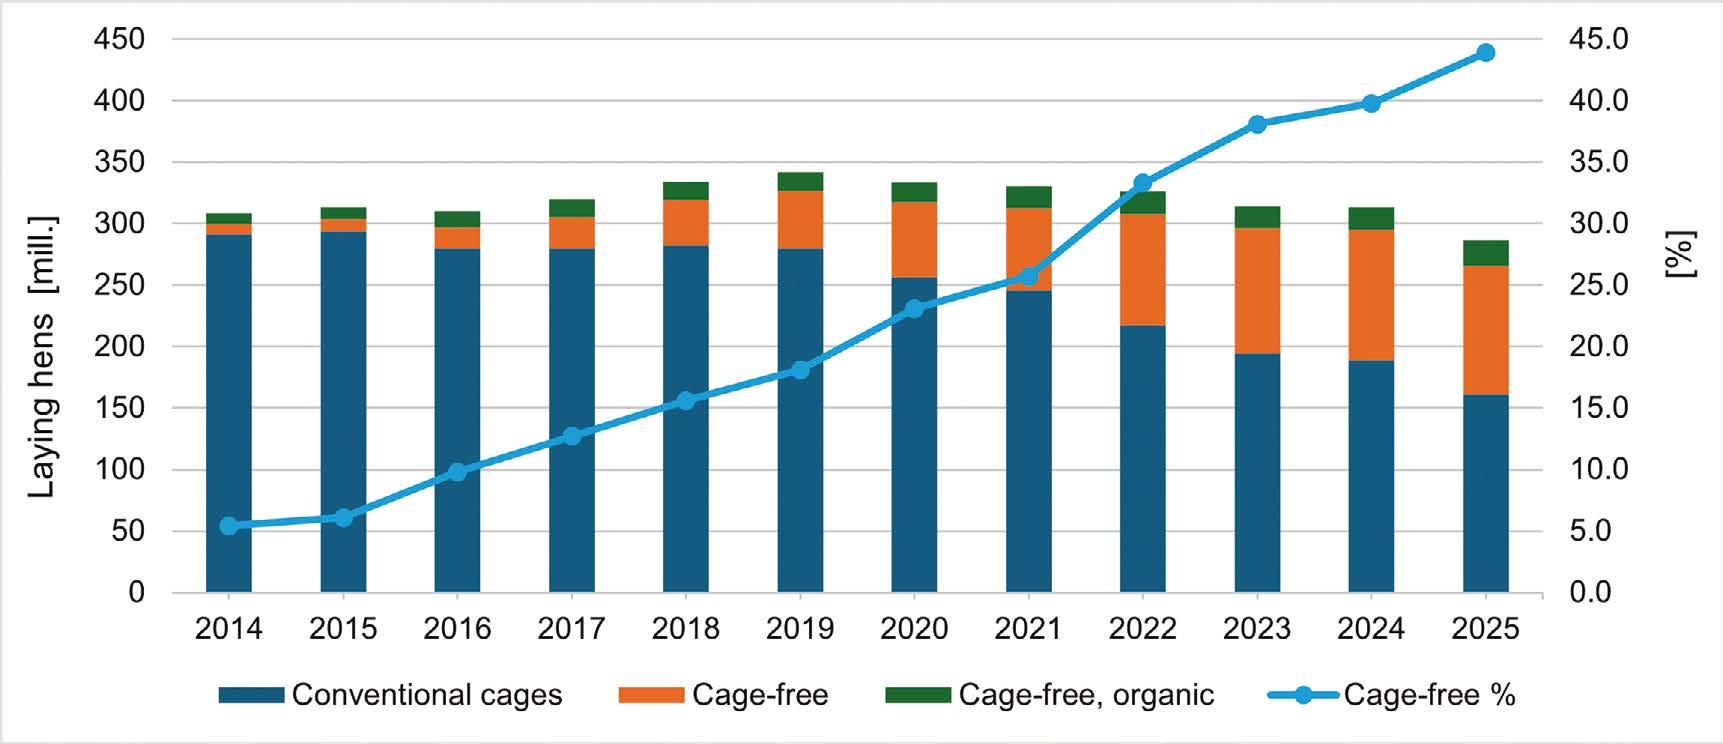
On the road to cage-free farming
The ongoing and initially very controversial debate about the ban on conventional cages for laying hens, which began in 2008 with Proposition 2 introduced by the Humane Society of the United States in California, will not be discussed in detail here (see Windhorst 2009). In the following years, further propositions were put to the vote and in 2012 Proposition 12 was approved in a referendum. Despite initial resistance and a very hesitant abandonment of conventional cages, the conversion to or construction of cage-free facilities gained momentum. The decisions of leading food retailers, hotel chains and egg processing companies to only sell or use cage-free eggs played an important role. In the wake of the Covid-19
▲ Figure 2 – The share of the ten leading states in the laying hen inventories of the USA in 2014, 2019 and 2024 Design: A. S. Kauer based on USDA, NASS data.
3 Windhorst 2015, 2022a, 2023, 2024, 2025.
▲ Figure 3 – Changes in the housing systems of table egg layers in the USA between March 2014 and March 2025
Design: A. S. Kauer, based on data of the Egg Industry Center, Iowa State University.
pandemic and the AI epidemics, the switch to cage-free production accelerated. While only 16.1 million or 5.4% of laying hens were kept in cage-free systems in 2014, this value has already reached around 126 million or 43.9% by mid-2025 (Figure 3). It can be assumed that two thirds of all laying hens will be housed in cage-free systems by 2030. The emerging legislation regarding financial compensation for farms following an AI outbreak and the associated animal losses may also play a decisive role here.
Egg shortage, rising prices and imports
Each of the four AI epidemics led to a sharp drop in egg production. As a result, the revenues of farms that were not affected by AI rose significantly. Prices did not stabilise until the farms were repopulated, but in most cases remained above the initial level for several months (Table 2).
In the urban agglomerations of the north-east and in California, retail prices were at times as high as $10 a dozen. This led to protests among the population and forced the government to react. The egg products industry in particular had problems delivering the quantities it had contracted for because it was unable to obtain the eggs it needed, or could only do so at a much higher price. Like some grocery chains, it pushed to import eggs in order to be able to continue producing at a cost-covering level. Because the AI outbreak in 2015 caught laying hen farmers unprepared, the supply deficit was particularly high. Between the end of 2015 and the beginning of 2016, over 1.1 billion eggs worth $124 million and 35,000 t of egg products worth $106 million
■ Table 2 – Development of egg values at farm gate and in warehouses after the AI outbreaks in 2023 and 2024/25 in the USA; data in $ per dozen
Source: Egg Industry Center, Iowa State University. *media del Midwest
were imported. Although imports were lower regarding the volume after the epidemics of 2022 and 2023/24, they reached a total value of $124.7 million (Table 3).
The government responds
In December 2024, APHIS published a new guideline that ties future compensation payments for animal losses as a result of an AI infection to certain conditions5. For example, it requires that a farm may only be repopulated after a depopulation if it has been proven that biosecurity has been improved. This will be verified by an APHIS audit. The new
legal regulation should lead to an improvement in biosecurity6.
On 18 February 2025, a group of 16 senators from both parties wrote to the Secretary of Agriculture calling for the development of a forward-looking strategy for the production of vaccines and their use in laying hen and turkey farming. In addition, negotiations should be entered into with trading partners to convince them of the need to vaccinate poultry flocks without the vaccination hindering or preventing trade7 . In response, the U.S. Department of Agriculture made $100 million available in April to enable scientists to develop new vaccines to protect poultry flocks and to research the spread of the AI virus in wild birds and its spread in flocks. This should, if not completely prevent recurring epidemics, at least limit their extent. In addition, $500 million for biosecurity measures and $400 million in financial relief for affected farmers were announced in a strategic plan8 .
In March 2025, a working group consisting of representatives from the poultry industry, trade organisations and state veterinarians was installed. Its task is to draw up a plan for the vaccination of poultry. It was published in July 2025 and sent to the USDA and the organisations of the poultry industry for comments9. So far, no results are available. Egg producers hope that the broiler and turkey industry will give up their resistance to vaccination, which they have been justifying since 2014 with fears that leading consumer countries would stop imports.
Summary and perspectives
Four epidemics of the highly pathogenic avian influenza have affected poultry farmers in the USA over the past decade. In total, the 1,043 outbreaks on commercial farms resulted in the loss of over 221 million birds due to infection or preventative culling, including 178.8 million laying
hens. The high economic losses suffered by farms and the processing industry as well as supply problems for the population forced the government to take action. In addition to providing research funding for the development of vaccines, a plan for preventative vaccination is to be drawn up and will hopefully be adopted in consultation with the poultry industry.
Data sources and additional literature
Congressional Research Service. (2025). The highly pathogenic avian influenza (HPAI) outbreak in poultry, 2022–present. Washington, DC: Congressional Research Service. https://www.congress.gov/crs_external_products/R/PDF/ R48518/R48518.1.pdf
United Egg Producers. (n.d.). Facts & stats. Retrieved from https://unitedegg.com/facts-stats
U.S. Department of Agriculture, Foreign Agricultural Service (USDA FAS). U.S. foreign agricultural trade. Retrieved from https://apps.fas.usda.gov/gats/default.aspx?publish=1
U.S. Department of Agriculture, National Agricultural Statistics Service (USDA NASS). (2024). Chicken and eggs annual summary 2024. https:// downloads.usda.library.cornell.edu/usda-esmis/ files/1v53jw96n/4b29d373g/4455b918n/ckegan25.pdf
U.S. Poultry & Egg Association. Economic data. Retrieved from https://www.uspoultry.org/economic-data
Windhorst, H.-W. (2009). Impacts of the California referendum on banning cages and perspectives for the U.S. egg industry. Zootecnica International, 31(2), 12–23.
Windhorst, H.-W. (2015). Avian influenza outbreaks in Iowa layer farms and their economic impacts. Zootecnica International, 37(12), 28–35.
Windhorst, H.-W. (2018). The USA on their way to cage-
8 Irritating in this context are statements by the Secretary of Agriculture, Rollins and the Secretary of Health and Human Services, Kennedy, who no longer favoured the development of vaccines and preventive vaccination to combat AI. Secretary Kennedy suggested that herds should not be culled preventively but be infected so that breeding lines could then be established with the surviving animals because they had apparently developed resistance. There was massive opposition to this from the poultry industry (The Highly Pathogenic Avian Influenza (HPAI) Outbreak in Poultry, 2022-Present, p. 10).
9 Personal information from Dr. Denise Heard, Vice President of Research, U.S. Poultry & Egg Association (July 7th, 2025).
■ Table 3 – The development of egg and egg products imports of the USA between 2014 and 2024
Source: USDA, FATUS GATS.
free egg production: The Lone Cactus egg farm in Bouse (Arizona). Zootecnica International, 40(2), 16–19.
Windhorst, H.-W. (2022). A new milestone in US egg production. Poultry World, 38(9), 26–28.
Windhorst, H.-W. (2022a). Verheerender Seuchenzug im Land: Eine räumliche und zeitliche Analyse der Aviären Influenza in den USA im Jahr 2022. Fleischwirtschaft, 102(9), 23–27.
Windhorst, H.-W. (2023). 2022 war Vieles anders: Eine Dokumentation und Analyse des AI-Seuchenzuges in den USA. Fleischwirtschaft, 103(4), 42–46. Windhorst, H.-W. (2024). Third avian influenza outbreak in the USA within 10 years: The 2023–2024 epidemic. Zootecnica International, 46(9), 28–33. Windhorst, H.-W. (2025). Fourth AI epidemic in the USA in the past decade: The epidemic in winter 2024/25. Zootecnica International, 46(7–8), 22–27.
MODERN INCUBATION TECHNIQUES TO IMPROVE CHICK QUALITY AND UNIFORMITY
THE IMPORTANCE OF CHICK QUALITY AND UNIFORMITY
The poultry industry has advanced rapidly over the past decades with hatchery management playing an important role in ensuring the successful production of good-quality broiler and layer chicks. While hatchability rates are important, the ultimate goal of incubation is not only to maximize the number of chicks hatched, but also to ensure that chicks are healthy, uniform and well-prepared for posthatch performance.
Modern incubation techniques are critical tools to achieve these goals. By integrating scientific knowledge, precision equipment and data-driven practices, hatcheries can deliver consistent chick quality, improving efficiency and profitability.
➤ Rasel Ahmed
Incubation specialist
Uniformity of day-old chicks is an important factor in modern poultry farming. Chicks that are uniform in size, weight and vitality perform better in the broiler house, need fewer management adjustments and reach market weight more consistently. On the other hand, uneven chick quality often results in variable growth, increased feed conversion ratio (FCR), higher mortality and reduced overall profitability. Chick quality is influenced not only by the genetic potential of breeder flocks but also by the incubation environment. Modern incubation techniques focus on controlling these environmental factors to minimize variation and ensure that each embryo develops under optimal conditions.
Technological improvements in incubation
Single-stage vs multi-stage incubation
Single stage incubators are now widely adopted. They set eggs of the same embryonic age together allowing precise control of temperature, humidity and ventilation tailored to the specific stage of embryonic development. This approach helps reduce variation and results in more uniform hatches. Multi-stage incubators, instead, usually mix eggs of different
developmental stages in one machine. Although they are cost-effective, they create challenges in maintaining hygiene, sanitation and uniform temperature and humidity.
Digital sensing and automation
Modern incubators are equipped with advanced sensors that continuously monitor temperature, humidity, carbon dioxide and airflow, which help to maintain incubation parameters properly according to the needs of the hatching egg. The automated turning system helps distribute heat and temperature uniformly to all eggs. Automation ensures that even small fluctuations are corrected immediately creating a stable environment for all eggs.
Data integration and smart hatcheries
Nowadays modern hatcheries are moving toward datadriven operations where every stage of the incubation process is monitored, analyzed and optimized in real time. This transformation is made possible by data integration. Data integration is the process of collecting information from multiple sources such as egg storage rooms, setters, hatchers, fresh air cabinets, chicks handling units and combining it into a centralized digital platform. Sensors installed in storage rooms, incubators and hatchers continuously track critical parameters such as temperature, humidity, ventilation rate, CO₂ and egg weight loss. Many companies provide
software platforms that support data integration, monitoring and smart hatchery management, for example, Eagle Trax™, by Petersime.
Temperature control for uniform development
Embryos are highly sensitive to temperature fluctuations. Excessively high temperature can accelerate embryonic development and cause premature hatching, while excessively low temperature can delay hatching or result in weak chicks.
Optimal range. For proper incubation the optimal temperature range inside the incubator is 37.537.8 °C.
Eggshell temperature monitoring. Eggshell temperature monitoring is an important tool for evaluating whether incubation conditions are appropriate. Hatcheries can use infrared thermometer or egg temperature sensor such as the OvoScan system instead of relying solely on ambient air measurements. This method ensures that embryos are developing at a uniform rate. Eggshell temperature standard is in the 37.6–38.3 °C range.
Airflow management. Uniform airflow management is crucial for ensuring proper heat distribution, preventing hot and cold spots and reducing variation between trays. By carefully managing temperature profiles throughout the incubation, hatchery managers can achieve more synchronized hatches and increase chick uniformity.
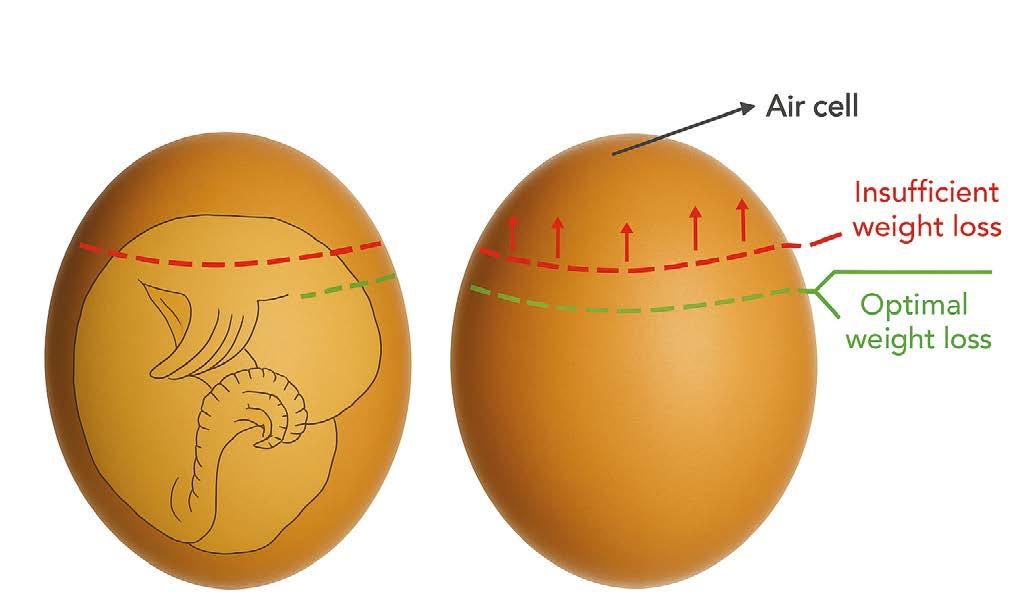
Humidity and egg weight loss
Humidity control in the incubator is very important because it directly affects egg weight loss, which is crucial for chick quality. Eggs usually need to lose 11–13% of their weight from laying to 18 days of incubation to achieve proper air cell development.
Low humidity. Low humidity leads to excessive water loss, which can result in dehydrated chicks and a reduced chick yield percentage.
High humidity. Excessively high humidity prevents adequate water loss, which can produce chicks with poor
yolk absorption, improper navel closure, underdeveloped respiratory systems and, ultimately, an increased chick yield percentage.
Modern techniques. Modern hatcheries now use automatic humidification and dehumidification systems, as well as ultra-humidification systems, that respond to real-time data, ensuring optimal egg weight loss throughout incubation.
The role of carbon dioxide (CO₂) and ventilation
Embryos need proper oxygen supply during incubation (minimum 21% oxygen) and they produce CO₂ as they develop so proper ventilation is essential. Adequate oxygen intake and the efficient removal of carbon dioxide via gas exchange through the porous eggshell are essential for normal development, hatching performance and chick quality. Insufficient oxygen supply can lead to metabolic imbalance and developmental abnormalities. High CO₂ level (1.2%) during early incubation accelerates embryo growth, but must be carefully balanced to avoid suffocation. Controlled ventilation systems in modern incubators regulate oxygen inflow and CO₂ outflow dynamically. Proper ventilation is therefore crucial for better hatch performance and good quality chick production.
Egg turning and positioning
Egg turning during incubation is very important to prevent embryos from sticking to the shell membrane and to ensure proper positioning before pipping. Incubators are programmed to turn eggs gently and consistently usually once per hour with a turning angle of 43–45°. Computerized systems help ensure that all eggs receive identical turning conditions, reducing malposition and increasing uniformity at hatch.
Hatch window and synchronization
The time span between the first and last chick hatching is called the hatch window and is a key measure for incubation
success. The ideal hatch window is 24–30 hours. If the hatch window is too wide, it results in weak, dehydrated early chicks and late chicks that struggle to survive.
Post-hatch handling and chick quality assessment
The incubation process doesn’t end at hatch. How chicks are handled post-hatch has a major impact on their uniformity. Prompt removal of chicks from the incubator is essential, as delays can lead to dehydration and increased variability. During the holding period before transport, chicks should be kept at a temperature of 25–28 °C with good ventilation to maintain optimal condition. In addition, most commercial hatcheries use the Pasgar scoring system to evaluate chick quality, assessing factors such as vitality, navel closure, alertness, leg strength, and overall uniformity before delivery.
The future of incubation: precision and sustainability
Incubation technology is continuously advancing, with current innovations focusing on sustainability and precision. Modern embryo-responsive incubation systems can adjust conditions based on real-time embryo signals; for example, Petersime uses the OvoScan and HatchScan systems. Hatchery automation is also expanding, covering egg handling, grading, transfer, and chick counting, which reduces human error and labor costs. Companies such as Viscon, Vencomatic Group, HatchTech, and Innovatech now provide comprehensive hatchery automation equipment. In addition, energy-efficient incubators are being developed to reduce operational costs while maintaining stable incubation conditions. These innovations are expected to further improve chick quality, reduce variability, and enable hatcheries to meet the growing global demand for poultry products.
Conclusion
Modern incubation techniques have revolutionized the process of chick production in commercial hatcheries. For commercial poultry operations, investing in modern incubation practices is no longer optional, it is essential. Uniform, healthy chicks not only perform better on the farm but also reduce production costs, improve welfare and maximize profitability.
In an industry where every percentage point matters, the adoption of modern incubation techniques is the surest path to consistent success.
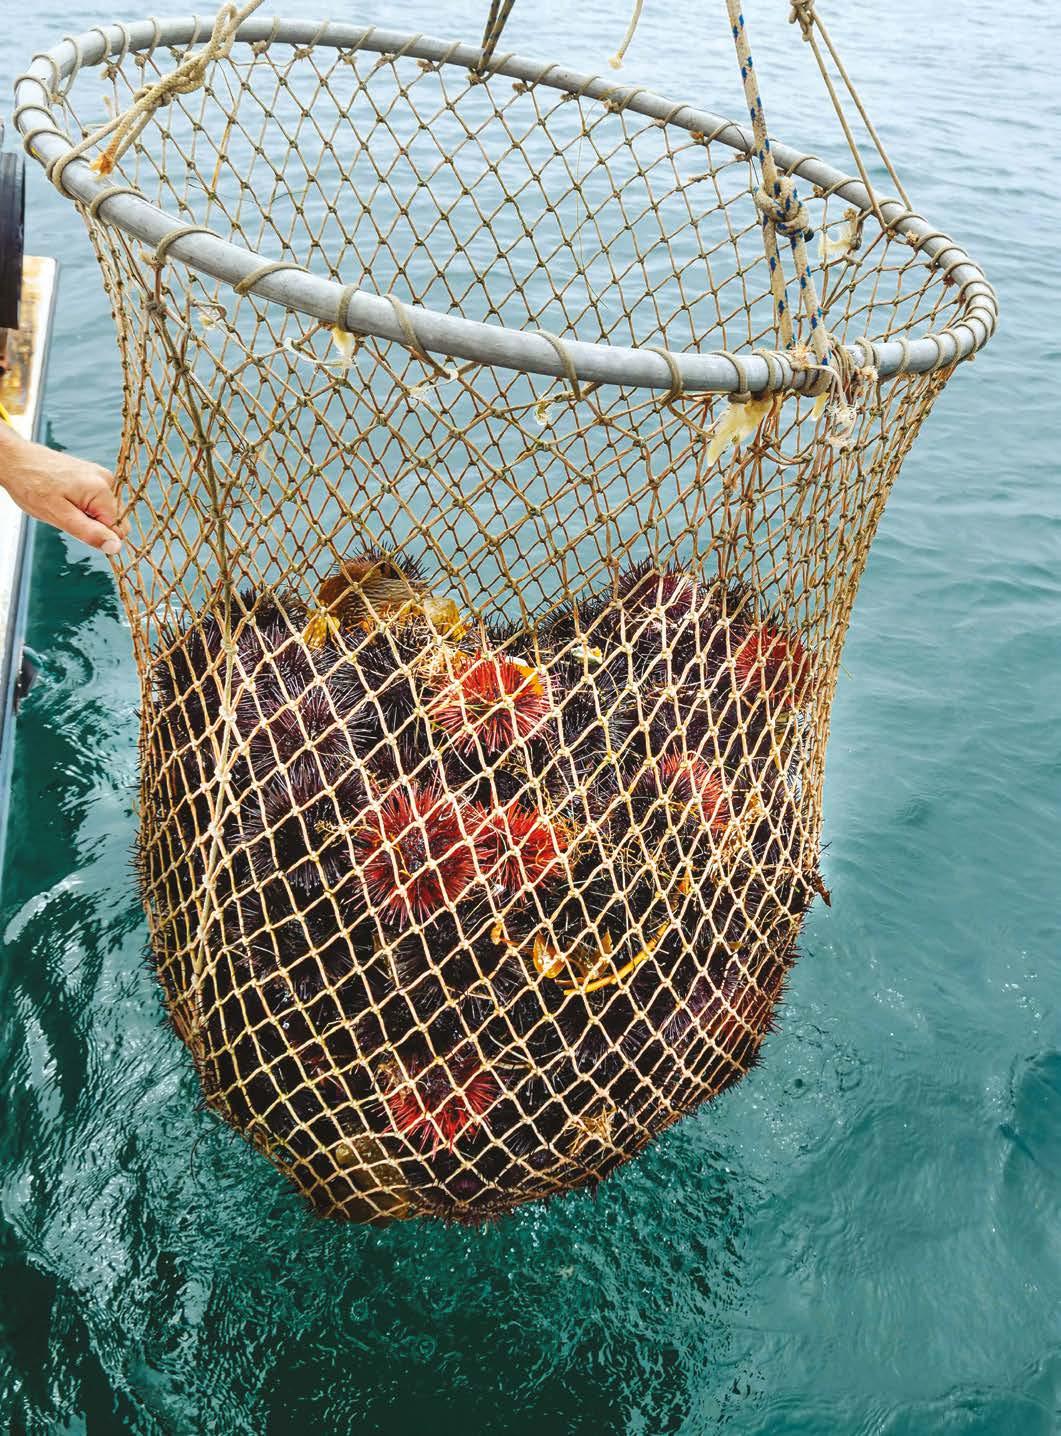
SEA URCHIN WASTE AS ALTERNATIVE SOURCE OF CALCIUM FOR LAYING HENS
In Italy, several tons of sea urchins are harvested annually, yet only the gonads are used for consumption; the rest, rich in calcium carbonate, is discarded. A study by the University of Milan explored the potential of these residues as an alternative calcium source for laying hens. The findings reveal that incorporating sea urchin-derived calcium does not compromise either egg production or egg quality while enhancing certain animal welfare indicators. This approach offers a promising step towards more sustainable and eco-friendly livestock farming.
➤ Francesca Leone
Degree in Animal Science
PhD student in Environmental Sciences
Introduction
Around 3,000-3,500 tons of Paracentrotus lividus sea urchins are harvested annually from the Mediterranean Sea for human consumption (FAO, 2017; Stefansson et al., 2017). Italy is the main consumer among European countries, with 30 million individuals collected each year (Guala et al., 2018). However, only 10–30% of the urchin’s weight — the gonads — is eaten, leaving the rest, mainly the skeleton (test and spines), as waste (Marzorati et al., 2021). As noted by several researchers, this type of waste is neither environmentally sustainable nor economically advantageous (Garau et al., 2012). Considering that sea urchin tests and spines contain high amounts of minerals, primarily calcium carbonate (calcite) with a significant percentage of magnesium carbonate (Varkoulis et al., 2020), they could serve as a valuable feed ingredient for laying hens, which need these minerals for egg production. Calcium is crucial in the diet of laying hens for their metabolism and bone development. Eggshell consists of 94–97% calcium carbonate in calcite crystals (Kristl et al., 2019). Magnesium, the second most abundant mineral in the eggshell in the form of magnesium carbonate, is essential for eggshell strength and thickness (Kim et al., 2013).
Traditionally, the main source of calcium in poultry feed is non-biogenic, coming from limestone, which varies in bioavailability and digestibility (Cufadar et al., 2011). By contrast, in recent years, biogenic minerals have proven to be more bioavailable and effective at lower doses, as they are more efficiently absorbed and retained by animals,
reducing mineral excretion into the environment (Webster et al., 2004).
■ Table 1 – Diet formulation of the two experimental groups
Experimental study
Following a circular economy model, where a waste becomes a resource, researchers at the University of Milan evaluated the use of sea urchin-derived calcium as a limestone-derived
calcium substitute in laying hens' diets. For the study, they collected 400 kg of waste from small processing companies and restaurants in Sardinia, Sicily and Apulia. After heattreating the material at 80 °C for 30 minutes and then grinding it, they incorporated it into pellets for the treated group of hens. A control group received an isonutritive commercial diet. The two formulations contained similar calcium content (≈ 3.9%), as reported in Tables 1 and 2.
The study involved 128 Hy-Line Brown hens, monitored from 19 to 52 weeks of age, with assessments of productive parameters, egg quality and animal welfare.
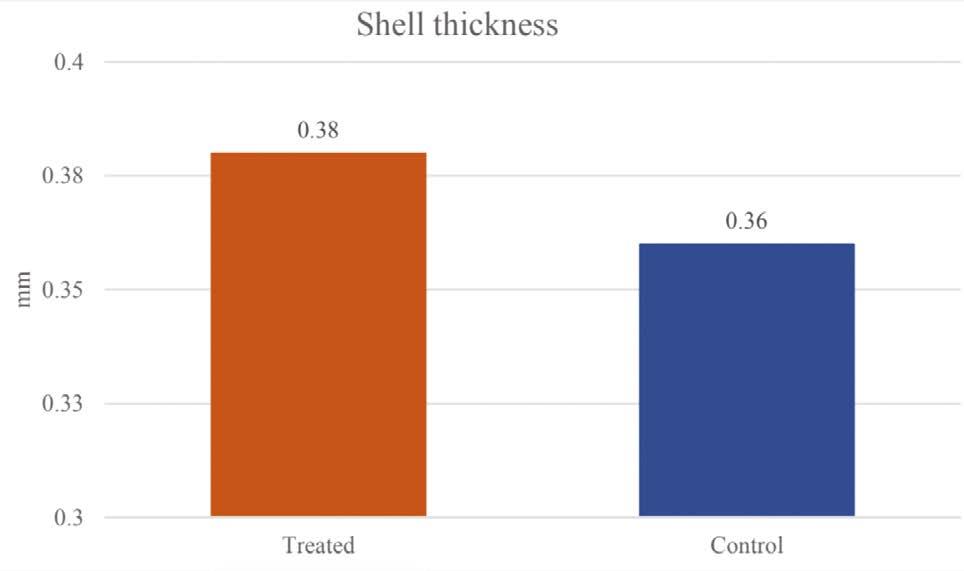
Egg production or egg size (category M) showed no significant differences between groups. However, hens receiving sea urchin-derived calcium recorded a lower percentage of discarded eggs (2.10% vs. 2.38%), suggesting a positive effect of sea urchin-derived calcium. Moreover, the eggs produced by the treated group had thicker eggshells (average: 0.38 mm vs. 0.36 mm), as shown in Figure 1
Despite the greater thickness, eggshell breaking strength and ultrastructure remained comparable. The absence of differences represents an excellent outcome for the purpose of the study, as it indicates the potential replacement of limestone-derived calcium with calcium obtained from sea urchin tests and spines.
Animal welfare was also assessed using the Welfare Quality® protocol, since a deficiency or imbalance of dietary minerals can lead to the spread of feather pecking, a multifactorial condition in which birds peck at the feathers of their conspecifics, occasionally escalating to cannibalism (Dixon, 2008). In this study, hens receiving the sea urchin–supplemented diet showed fewer lesions on the head, back and tail, especially at the end of the trial, along with healthier footpads.
To verify the correct utilization of calcium from the diet, and not from bone mobilization, researchers checked keel bone deviation according to Welfare Quality® guidelines and tibia breaking strength. The tibia, a bone rich in medullary bone tissue, supplies calcium for eggshell formation if dietary intake is deficient or unavailable (Bryden et al., 2021). No significant differences were
■ Table 2 – Analytical composition of the diets of the two experimental groups
▲ Figure 1 – Histogram of the eggshell thickness for the two experimental groups
found between the two experimental groups, indicating correct absorption and utilization of sea urchin calcium.
Conclusions
Repurposing sea urchin waste as a source of calcium for laying hens reflects a more forward-thinking, sustainable vision of Italian livestock farming. The study demonstrates that replacing limestone-derived calcium with sea urchinderived calcium preserves animal welfare, production and egg quality, while improving some indicators. The similarity between the two study groups supports the substitution’s viability, although further research is needed to test these results across varying farming conditions and to evaluate their long-term effectiveness over longer production cycles. Nevertheless, this research paves the way for the concrete possibility of developing a niche, more eco-conscious supply chain, turning fishery by-products into a valuable poultry feed resource.
References
Bryden, W. L., Li, X., Ruhnke, I., Zhang, D., & Shini, S. (2021). Nutrition, feeding and laying hen welfare. Animal Production Science, 61(10), 893–914. https://doi. org/10.1071/an20396
Cufadar, Y., Olgun, O., & Yildiz, A. Ö. (2011). The effect of dietary calcium concentration and particle size on performance, eggshell quality, bone mechanical properties, and tibia mineral contents in moulted laying hens. British Poultry Science, 52(6), 761–768. https://doi.org/10.1080/0 0071668.2011.641502
Dixon, L. (2008). Feather pecking behaviour and associated welfare issues in laying hens. Avian Biology Research, 1(2), 73–87. https://doi.org/10.3184/175815508X363251
Food and Agriculture Organization of the United Nations (FAO). (2017). Fisheries and aquaculture statistics 2015: Yearbook. Rome, Italy: FAO. https://www.fao.org/fishery/ static/Yearbook/YB2015_CD_Master/booklet/web_ I7989T.pdf
Garau, G., Castaldi, P., Deiana, S., Campus, P., Mazza, A., Deiana, P., et al. (2012). Assessment of the use potential of edible sea urchins (Paracentrotus lividus) processing waste within the agricultural system: Influence on soil chemical and biological properties and bean (Phaseolus vulgaris) and wheat (Triticum vulgare) growth in an amended acidic soil. Journal of Environmental Management, 109, 12–18. https:// doi.org/10.1016/j.jenvman.2012.05.001
Guala, I., Grech, D., Masala, M., Piazzi, L., Ceccherelli, G., Brundu, G., et al. (2018). Population monitoring of Paracentrotus lividus in the Tavolara Punta Coda Cavallo Marine Protected Area (Technical report). Torre Grande, Italy: Fondazione IMC–Centro Marino Internazionale ONLUS. Kim, C. H., Paik, I. K., & Kil, D. Y. (2013). Effects of increasing supplementation of magnesium in diets on productive performance and eggshell quality of aged laying hens. Biological Trace Element Research, 151(1), 38–42. https://doi.org/10.1007/s12011-012-9537-z
Kristl, M., Jurak, S., Brus, M., Sem, V., & Kristl, J. (2019). Evaluation of calcium carbonate in eggshells using thermal analysis. Journal of Thermal Analysis and Calorimetry, 138(4), 2751–2758. https://doi.org/10.1007/s10973-01908678-8
Marzorati, S., Martinelli, G., Sugni, M., & Verotta, L. (2021). Green extraction strategies for sea urchin waste valorization. Frontiers in Nutrition, 8, 730747. https://doi. org/10.3389/fnut.2021.730747
Stefansson, G., Kristinsson, H., Ziemer, N., Hannon, C., & James, P. (2017). Markets for sea urchins: A review of global supply and markets. Skýrsla Matís, 10–17. https:// doi.org/10.13140/RG.2.2.12657.99683
Varkoulis, A., Voulgaris, K., Zaoutsos, S., Stratakis, A., & Vafidis, D. (2020). Chemical composition and microstructural morphology of spines and tests of three common sea urchin species of the sublittoral zone of the Mediterranean Sea. Animals, 10(8), 1351. https://doi. org/10.3390/ani10081351Webster, A. B. (2004). Welfare implications of avian osteoporosis. Poultry Science, 83(2), 184–192. https://doi.org/10.1093/ps/83.2.184
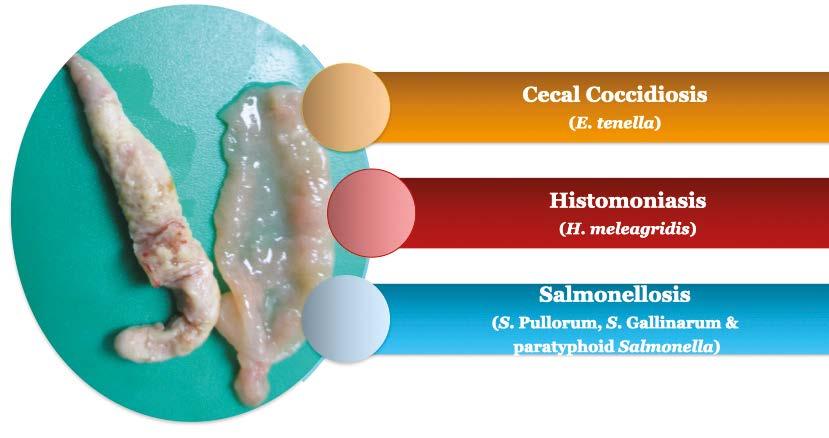
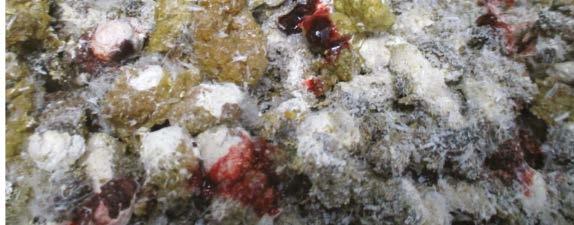
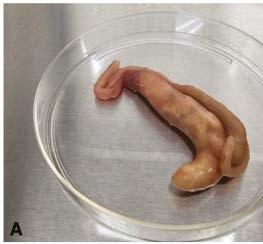
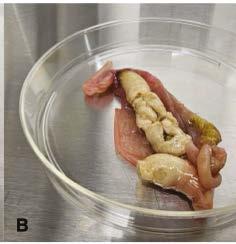
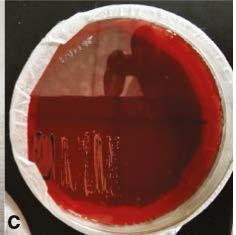
DECODING CECAL CORES IN CHICKENS: FROM NECROPSY TO DIAGNOSIS
Cecal cores are a classical pathological gross lesion seen in field necropsies. Even though a presumptive diagnosis is made based on the visualization of the cecal cores, confirmative tests are needed to establish the etiology of the disease.
Vijay Durairaj and Ryan Vander Veen Huvepharma, Inc., Lincoln, Nebraska, USA.
Corresponding author vijay.durairaj@huvepharma.us
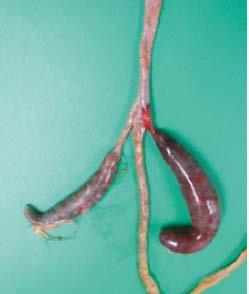
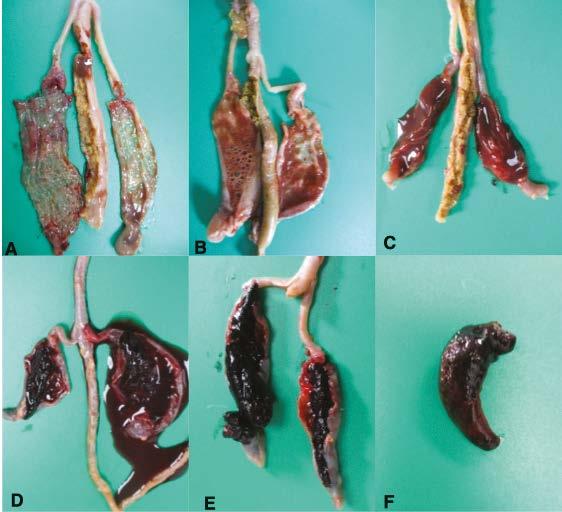
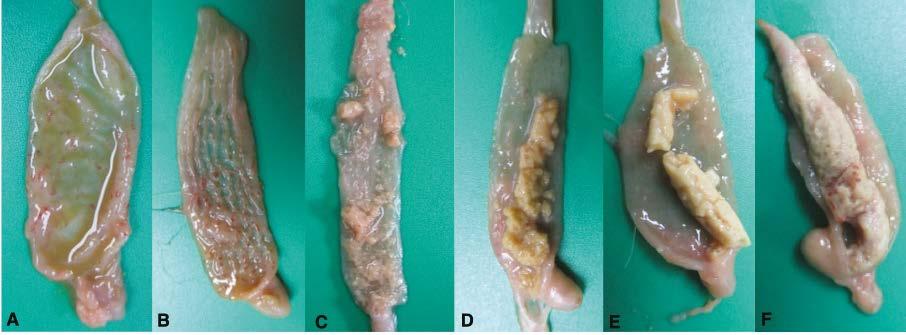
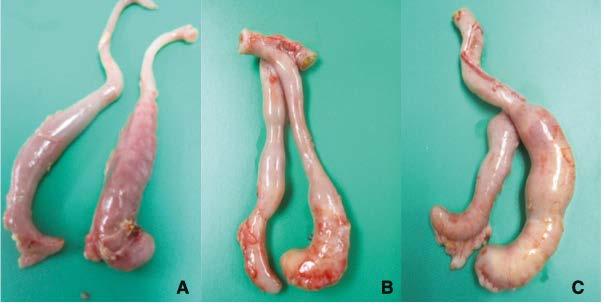
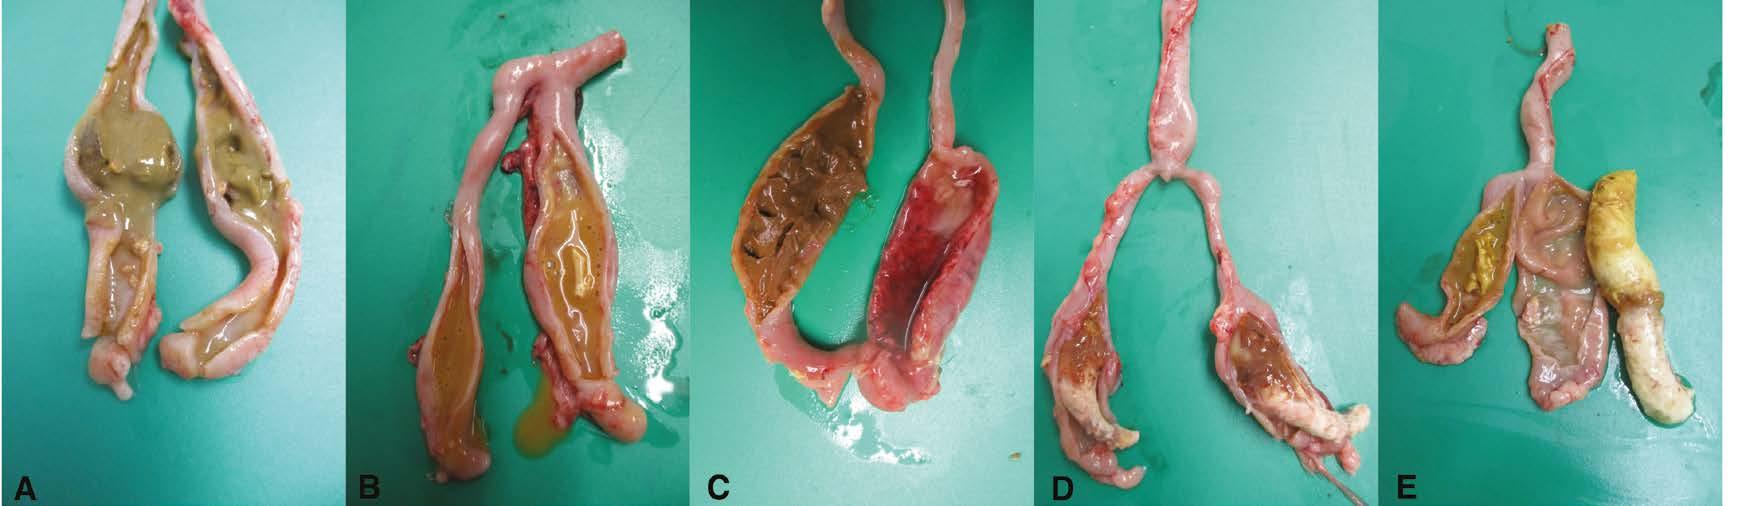
Cecal cores, a pathological manifestation in the ceca, are an easy diagnostic tool in chickens, but they are often misdiagnosed and deceptively interpreted in field cases. Understanding the diseases that cause cecal core formation helps in proper diagnosis. An infectious pathogen which targets the ceca can colonize the cecal mucosa and degrade its integrity and architecture, resulting in necrosis and sloughing of tissues. The denuded and sloughed necrotic tissues of the ceca, along with the cecal ingesta, form the cecal cores. In chickens, enlarged and distended ceca with cecal cores could be found in diseases such as coccidiosis, histomoniasis and salmonellosis (Figure 1).
Coccidiosis
Coccidiosis in chickens is caused by Eimeria species. Despite prophylactic and therapeutic measures to combat coccidiosis,
the eradication is difficult, as Eimeria species are ubiquitous in commercial poultry production facilities. There are several species of Eimeria targeting specific intestinal regions. E tenella is one of the most pathogenic and common Eimeria species in chickens. It causes hemorrhage, inflammation, edema and thickening of the ceca and induces cecal cores formation (1). E tenella is easily recognized because of its characteristic and spectacular lesions in the ceca. E. tenella is one of the pathogens that induces lesions in the ceca but is not the only one. Apart from Eimeria spp, H. meleagridis and Salmonella spp. can also induce lesions in the ceca.
E. tenella penetrates deeply into the cecal mucosa and causes extensive destruction of the ceca and damages blood capillaries, resulting in hemorrhage and bloody diarrhea (Figure 2). This compromises the integrity of the ceca, affecting their routine function. E. tenella is target specific and commonly induces lesions in the ceca only. In very rare circumstances, E tenella may invade adjacent intestinal sections (1). Unlike histomoniasis, E. tenella does not cause lesions in the liver. In severe cases, ceca engorged with bloody contents can be easily visualized on the serosa before dissecting them (Figure 3). E. tenella causes petechiae on the cecal mucosa with inflammation and congestion of the
▲ Figure 1 –
Edematous and thickened ceca with cecal core
ceca (Figure 4A), abnormal and watery brownish/reddish cecal contents (Figure 4B), inflamed and thickened cecal wall with bloody contents in the lumen (Figure 4C), mixture of raw and clotted blood (Figure 4D), jelly-like clotted blood (Figure 4E), and solid cecal cores with clotted blood (Figure 4F).
If the ceca have bloody/tarry contents or red jelly-like contents, the condition may be easily diagnosed as cecal coccidiosis. However, E. tenella is not the only pathogen that causes bleeding in the ceca, as H. meleagridis can cause similar lesions. Apart from bloody/tarry contents in the ceca, E. tenella may cause inflammation and induce formation of clots and chunks of caseous material and creamy-white caseous cores. The cecal lesions may range from petechiae on the mucosa (Figure 5A, 5B), to caseous clots (Figure 5C, 5D) and caseous cores (Figure 5E, 5F). These types of lesions may also be seen in histomoniasis and salmonellosis. H. meleagridis induces lesions in the ceca and in the liver, while E. tenella induces lesions only in the ceca. Salmonellosis may induce septicemic lesions in other visceral organs including the liver, while E. tenella does not induce any lesions in the liver.
Diagnosis of E. tenella is made based on gross pathology lesions in the ceca and identification of oocysts/schizonts/ gametocytes from microscopic observation of the mucosal scraping from the ceca. Even if an outbreak of E. tenella is confirmed in the field, it is a best practice to rule out the possibility of concurrent infections.
Histomoniasis
Histomoniasis (blackhead disease, histomonosis, enterohepatitis) is caused by H. meleagridis. Heterakis gallinarum, the common cecal worm of gallinaceous birds, acts as an intermediate host for H. meleagridis. Broiler breeder and broiler breeder pullet farms have a heavy load of Heterakis gallinarum (2,3). With the unavailability of commercial vaccines and lack of prophylactic/therapeutic measures, increased incidences of histomoniasis are documented (4), in
▲ Figure 3 – Ceca engorged and distended with bloody contents. Serosa is inflamed and has numerous coalescing petechiae
VETERINARY
▲ Figure 4 – Gross pathology of dissected ceca in chickens challenged with E. tenella. No normal contents were observed in the ceca
A. Presence of numerous coalescing petechiae on the mucosa, inflammation and congestion of the ceca.
B. Abnormal and watery brownish/reddish cecal contents.
C. No normal contents in the ceca. Inflamed and thickened cecal wall and lumen filled with blood.
D. One of the cecal pouches have clotted blood and the other cecal pouch has a mixture of raw and clotted blood. Cecal pouches have thickened cecal wall.
E. Cecal lumen is filled with jellylike clotted blood.
F. Hard cecal core formed with clotted blood, denuded cecal mucosa and cecal contents.
▲ Figure 5 – Gross pathology of chicken ceca challenged with E. tenella. No normal contents were observed in the ceca
A. Watery cecal contents. Thickened cecal wall with numerous petechiae.
B. Thickened cecal wall with numerous petechiae.
C. No normal contents in the ceca. Thickened cecal wall and presence of numerous caseous clots and clumps.
D. No normal contents in the ceca. Thickened cecal wall. Presence of coalescing caseous clots and clumps.
E. Thickened cecal wall with partially formed cecal core.
F. Thickened cecal wall with a solid cecal core.
A. The serosa of both ceca are inflamed and congested with numerous petechiae. Both cecal pouches are engorged with bloody contents and are visible through serosa.
B. Left cecal pouch appears normal, while the distal third of the right cecal pouch is inflamed and engorged with caseous material.
C. Left cecal pouch appears normal, while the right cecal pouch is inflamed and engorged with caseous material.
broiler breeder pullets (5) and free-range layers (6). In broiler breeder pullets, it causes high morbidity and the mortality ranges between 10-20% (7). H. meleagridis affects the ceca, inducing typhlitis and cecal cores formation and ultimately reaches the liver through systemic circulation (8). In the ceca, H. meleagridis affects the normal microbiota and induces severe lesions and formation of cecal cores. Sometimes, the presence of bloody contents in the ceca (Figure 6A) and presence of cecal cores (Figure 6B, 6C) can be easily visualized through the serosa before dissecting the ceca. The serosa may be hyperemic and inflamed (Figure 6A, 6B,6 C). The cecal wall may be thickened, hyperemic, inflamed, edematous and have abnormal contents (Figure 7A, 7B, 7C, 7D, and 7E). The ceca may have a mixture of normal cecal contents along with caseous clots (Figure 7A), watery contents and caseous clots (Figure 7B), bloody contents (Figure 7C), a mixture of normal contents and a cecal core (Figure 7D) and a solid cecal core (Figure 7E). The classic liver lesions induced by H. meleagridis aid in differentiating histomoniasis from coccidiosis. It may induce necrotic foci in the liver (Figure 8A) or pin-point white foci (Figure 8B). Sometimes, liver lesions in chickens may not be as severe and spectacular as in turkeys. H. meleagridis infection in chickens may cause severe cecal lesions without inducing any liver lesions. Severe liver degeneration and damage to the bile duct may result in yellow-colored droppings which result in yellow smear around the vent region (Figure 9). In some cases, H. meleagridis outbreaks may go unnoticed due to the lack of clinical signs or characteristic gross pathology lesions (9).
Lesions in the ceca and liver can be used as presumptive diagnostic tools for histomoniasis and confirmed by histopathology, isolation of H. meleagridis or by molecular techniques. Evaluating the cecal scrapping under the microscope rules out the chance of concurrent infection with E. tenella. Bacterial culture testing of the lesions will aid in ruling out salmonellosis. Ruling out any concurrent infection is very important in histomoniasis diagnosis.
Salmonellosis
Host-adapted Salmonella, such as S. Pullorum, S. Gallinarum, as well as paratyphoid Salmonella, infections caused by nonhost-adapted Salmonella, cause cecal lesions and may induce the formation of cecal cores (10). In acute cases, septicemia may lead to the development of gross lesions in the ceca, spleen, kidneys, lungs, heart and joints (10). Gross lesions may not be seen in peracute cases.
Young chickens are at high risk, and clinical signs are mostly observed in this age group. Clinical signs are nonspecific and may include watery diarrhea, white diarrhea with urate staining on the vent, dropped wings, stained feathers, anorexia, emaciation, depression, dehydration, weakness and chicks huddling under the heat source.
Salmonellosis can result in the formation of cecal cores in chickens ( Figure 10A, 10B ). In some cases, the cecal cores may be visualized through the serosa before dissecting it ( Figure 10A ). Due to the septicemic spread of Salmonella , gross lesions may be seen in other visceral
▲ Figure 6 – Gross pathology of chicken ceca infected with H. meleagridis. Visualization of cecal contents outside the serosa
▲ Figure 7 – Gross pathology of chicken ceca infected with H. meleagridis. Cecal wall is thickened, and ceca have abnormal contents
A. Proximal one half of the ceca has a mixture of normal contents with caseous clots, while the other half of the ceca has watery contents with clots and clumps of caseous clots.
B. Left cecal pouch has watery contents, while right cecal pouch has watery contents with clots and clumps of caseous clots.
C. Left cecal pouch has normal contents, while right cecal pouch has thickened and edematous wall with numerous petechiae, watery contents and extensive hemorrhage.
D. One third of both cecal pouches have a mixture of normal contents and caseous core, while two third of the ceca have a solid caseous core.
E. Left cecal pouch has watery contents with caseous material, while right cecal pouch has a solid core.
organs including liver. The gross lesions in the ceca and liver do not confirm Salmonella infections, as these lesions alone are not specific and distinctive enough to differentiate them from other diseases. Thus, isolation and identification of Salmonella is needed to confirm the etiologic agent of the disease ( Figure 10C ). As always, rule out the chances of any concurrent infections.
Summary
Cecal cores are a classical pathological gross lesion seen in field necropsies. Even though a presumptive diagnosis is made based on the visualization of the cecal core, confirmative tests are needed to confirm the etiology of the disease. In addition, rule out any concurrent infections in the flock that cause similar lesions in the ceca.
References
1. Cervantes, H. M., McDougald, L. R., & Jenkins, M. C. (2020). Coccidiosis. In D. Swayne, M. Boulianne, C. Logue, L. McDougald, V. Nair, D. Suarez,
S. de Wit, T. Grimes, D. Johnson, M. Kromm, et al. (Eds.), Diseases of poultry (14th ed., pp. 1193–1216). Ames, IA: Wiley-Blackwell.
2. Waters, C. V. I., Hall, L. D., Davidson, W. R., Rollor, E. A. I., & Lee, K. A. (1994). Status of commercial and noncommercial chickens as potential sources of histomoniasis among wild turkeys. Wildlife Society Bulletin, 22, 43–49.
▲ Figure 8 – Gross pathology of chicken liver challenged with H. meleagridis
A. Septicemia, perihepatitis, hepatomegaly and presence of numerous coalescing black necrotic foci on the liver.
B. Hepatomegaly, discoloration and scattered pinpoint white necrotic foci on the liver.
3. Jones, R. E., Rives, D. V., Fletcher, O. J., & Martin, M. P. (2020). Histomoniasis outbreaks in commercial turkeys in the southeastern United States: Proximity of broiler breeder farms as a potential risk factor in disease development. Journal of Applied Poultry Research, 29, 496–501
4. Liebhart, D., Ganas, P., Sulejmanovic, T., & Hess, M. (2017). Histomonosis in poultry: Previous and current strategies for prevention and therapy. Avian Pathology, 46(1), 1–18. https://doi.org/10.1080/03079457.2016.1229458
5. Durairaj, V., Drozd, M., Barber, E., Doss, B., & Vander Veen, R. (2024, July/August). Case report: Histomoniasis in broiler breeder pullets. Zootecnica International, 36–42.
6. Esquenet, C., De Herdt, P., De Bosschere, H., Ronsmans, S., Ducatelle, R., & Van Erum, J. (2003). An outbreak of histomoniasis in free-range layer hens. Avian Pathology, 32(3), 305–308. https://doi.org/10.1080/0307945031000097903
7. McDougald, L. R. (1998). Intestinal protozoa important to poultry. Poultry Science, 77(8), 1156–1158. https://doi. org/10.1093/ps/77.8.1156
8. Clarkson, M. J. (1961). The blood supply of the liver of the turkey and the anatomy of the biliary tract with reference to infection with Histomonas meleagridis. Research in Veterinary Science, 2, 259–264.
9. Chadwick, E., Malheiros, R., Oviedo, E., Cordova Noboa, H. A., Quintana Ospina, G. A., Alfaro Wisaquillo, M. C., Sigmon, C., & Beckstead, R. (2020). Early infection with Histomonas meleagridis has limited effects on broiler breeder hens’ growth and egg production and quality. Poultry Science, 99(9), 4242–4248. https://doi.org/10.1016/j. psj.2020.05.020
10. Gast, R. K., & Porter, R. E., Jr. (2020). Salmonella infections. In D. Swayne, M. Boulianne, C. Logue, L. McDougald, V. Nair, D. Suarez, S. de Wit, T. Grimes, D. Johnson, M. Kromm, et al. (Eds.), Diseases of poultry (14th ed., pp. 719–753). Ames, IA: Wiley-Blackwell.
▲ Figure 9 – Yellow feces smeared around the vent region
▲ Figure 10 – Gross pathology of chicken ceca infected with paratyphoid Salmonella serovar
A. One of the cecal pouches is engorged with cecal core. Serosa is transparent and the cecal core is visible without dissecting the ceca.
B. One of the cecal pouches has a solid cecal core and the other cecal pouch has normal fecal materials. C. Black colonies of Salmonella on XLD agar plate.
Hatcheries
Breeders
◗ Upcoming Events 2026
JANUARY, 25 to 26
IPC Annual Meeting 2026
International Poultry Council
Georgia World Congress Center
Andrew Young International
Atlanta, Georgia USA
Tel.: +353 874735976
Email: caroline@ internationalpoultrycouncil.org
Web: www.internationalpoultrycouncil. org
JANUARY, 27 to 29
IPPE
International Production & Processing Expo
Georgia World Congress Center
Atlanta, Georgia, USA
For information contact: Anne Sculthorpe, CEM, Senior Exhibit Manager
Email: asculthorpe@ippexpo.org
Kris Early, Media/Press/Sponsorship Coordinator
Tel.: +1 770 493 9401
Email: kearly@uspoultry.org
Email: info@ippexpo.org
Web: www.ippexpo.org
FEBRUARY, 4 to 7
FIERAGRICOLA
117th International Agricultural Technologies Show Veronafiere, Verona, Italy
Email: customercare@fieragricola.it
Tel.: +39 04511176091
Web: www.fieragricola.it
FEBRUARY, 9 to 11
37th Annual Australian Poultry Science Symposium
University of Sydney Business School – Belinda Hutchinson Building (H70)
Sidney, Australia
Web: www.apss.sydney.edu.au
MARCH, 10 to 12
18th Turkey Science and Production Conference
Carden Park Hotel and Golf Resort
Chesire, United Kingdom
Web: www.tspc-turkeys.com
MARCH, 10 to 12
Victam Asia 2026
BITEC Exhibition Center
Bangkok, Thailand
Email: expo@victam.com
Web: www.victamasia.com
MARCH, 16 to 18
WPDC
Western Poultry Disease Conference Hyatt Regency Mission Bay
Spa and Marina
San Diego, CA, USA
Web: www.wpdcfoundation.org
APRIL, 14 to 16
PEAK 2026
Minneapolis Convention Center
Minneapolis, MN, USA
Tel.: +1 763 284 6763
Email: info@midwestpoultry.com
Web: www.midwestpoultry.com
APRIL, 22 to 24
9th International Conference on Poultry Intestinal Health
Haliç Congress Center
Istanbul, Turkey
Tel.: +1 763 284 6763
Email: info@icpih.com
Web: www.icpih.com
APRIL, 28 to 30
NIPOLI EXPO 2026
Nigeria Poultry and Livestock Expo
NCRI
Ibadan City, Oyo State, Nigeria
Tel.: +234 80 3191 9662
Email: info@nipoliexpo.com
Web: https://nipoliexpo.com/
JUNE, 2 to 4
VIV EUROPE
Jaarbeurs Exhibition Centre
Jaarbeursplein 6
NL-3503 RM Utrecht
The Netherlands
Web: www.viveurope.nl
JUNE, 28 to 30
MEP 2026
Middle East Poultry Expo 2026
Riyadh International Convention and Exhibition Center
Vencomatic Group B.V. info@vencomaticgroup.com www.vencomaticgroup.com
Victoria victoria@victoria-srl.com www.incubatricivictoria.com
VIV Europe viv.europe@vnuexhibitions.com www.viveurope.nl
VIV worldwide www.www.viv.net
Publisher Administration and Editorial Office Zootecnica di Marianna Caterino Via del Forestello n. 8 50063 Figline Incisa Valdarno (FI) Italy VAT number IT 07439250486
Subscription Each copy 10,00 € (1 year / 11 issues): Print Subscription € 99,00 Digital Subscription € 49,00
Print + Digital € 109,00
To subscribe online by credit card, visit: zootecnicainternational.com/ subscription
If you prefer choosing other methods of payment please send an e-mail to: subscription@zootecnica.it
Stay connected with us and follow us on social media: