

2025
What role can Hobart play in contributing to national prosperity?
INTRODUCTION

The purpose of our State of the City 2025 Report is to share timely and accurate data about Hobart and outline how the city is turning this into valuable insights that help inform priorities for the year ahead in a transparent way, particularly around economic development.
This report is a chance to reflect on milestones achieved, articulate a clear sense of direction for the city, and is an opportunity to share Hobart’s story – a story shaped by the people who live and lead here.
This report also presents us with a chance to reflect on how Hobart has evolved over recent years, and where we are now. So that we can learn from these experiences as part of our planning for the future.

Cr Anna Reynolds LORD MAYOR

State of The City 2025 Lord Mayoral Address
WHERE WE’VE COME FROM AND WHERE WE ARE NOW
As a capital city, Hobart has a critical role to play in helping drive state and national prosperity.
As a collective, Australia’s capital cities – while occupying just .03 per cent of Australia’s landmass, generate 22.5 per cent of the country’s Gross Domestic Product and support over 3.2 million jobs.
Population
From a population perspective Hobart has experienced modest, but steady population growth, but nowhere near the sort of growth experienced by our counterparts on the mainland. The current estimated resident population is around 56,000 people. If we look back 20 years it was approximately 49,000. This growth has benefits in terms of managing change and infrastructure required to support higher population growth, but it also has its challenges in terms of the type of positive economic growth that relies on strong population growth.
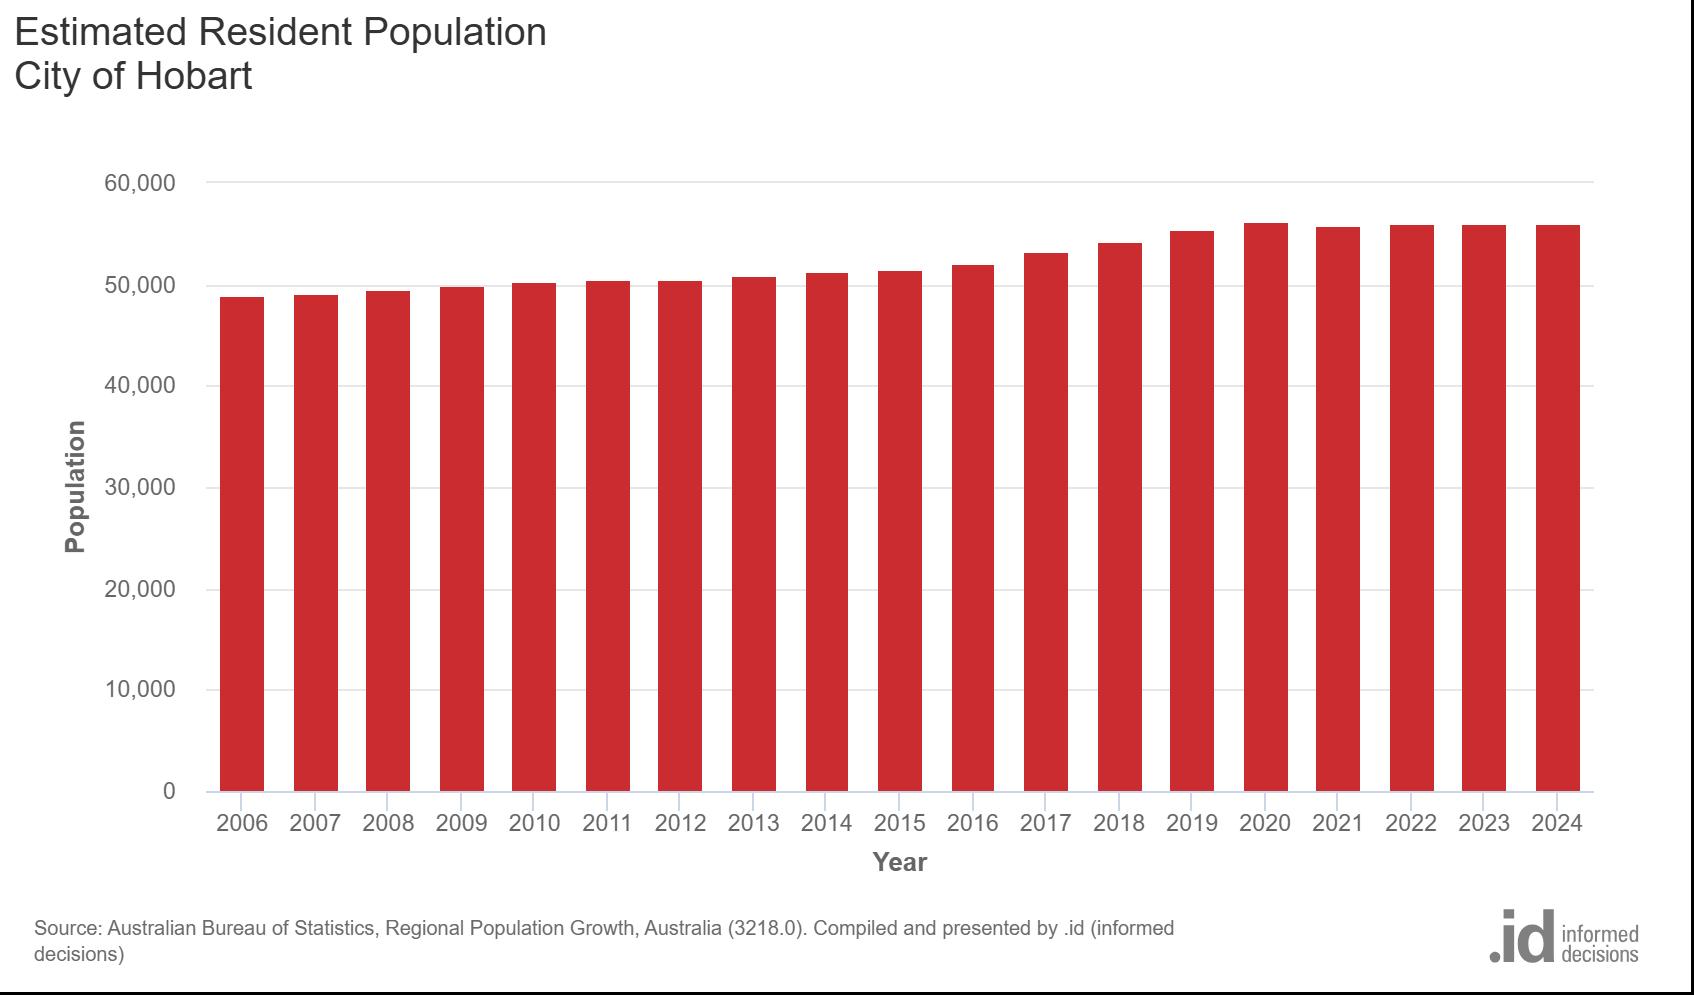
What do we know about Hobart’s population?
Population – Median Age and Age Category
• The City of Hobart’s residents are slightly younger than those in the areas we benchmark ourselves against - Hobart’s median age is 37, compared to Tasmania’s 42 and compared to Australia’s median age of 38.
• The most significant change to the population in the past 20 years in Hobart has been in the ‘young workforce’ category, with more than 50 per cent of population growth occurring in people aged 25 to 34. This is a positive change in terms of our ability to service the evolving needs of industry and the economy as a whole.
° The most recent Census data (2021) shows 19.5 per cent of the City of Hobart’s population is in the young workforce category (25 to 34)
° In comparison, the City of Adelaide has 24.3 per cent of its population in this category.
° City of Perth has 30 per cent.
° City of Darwin has 19.9 per cent.
Source: ABS, Census of Population and Housing, 2021
Median Weekly Household Income
Household income in the City of Hobart is higher than all the local benchmark areas. The median weekly household income in Hobart is $1850, compared to Greater Hobart at $1600, Tasmania at $1368, and Australia at $1740, per week.
Below is a comparison to other capital cities:
• City of Adelaide – median weekly household income $1471.
• City of Perth – median weekly household income $1867.
• City of Sydney – median weekly household income is $2310.
• City of Melbourne – median weekly household income $1626.
Source: ABS, Census of Population and Housing, 2021.
Local Government Area /
City of Hobart
City of Adelaide
City of Perth
City of Sydney
$1850
$1471
$1867
$2310
City of Melbourne $1626
Greater Hobart $1600
Tasmania
Source: ABS, Census of Population and Housing, 2021.
This data suggests the City of Hobart competes with the other capital cities when it comes to household income, but the benchmark areas in Tasmania - the state and the Greater Hobart area - are significantly lower.
Qualifications
In 2021, 49 per cent of people in the City of Hobart had a bachelor or higher degree qualification, compared to:
• Greater Hobart (29.2%).
• Tasmania (21.9%) and national (26.3%) averages.
• This is nearly double the figures from 2001 ( 26.5%).
This demonstrates a sizeable increase over 20 years in the percentage of people obtaining higher qualifications, translating into a local workforce that is more ready for the types of jobs being created in Hobart – higher paid, professional, knowledge economy jobs. This is a strength for the City of Hobart, but it is a challenge for the rest of Tasmania – where the City of Hobart lacks the qualified workforce it may mean it needs to be imported from interstate to meet the needs of an evolving economy. This indicator suggests more work is required to develop the local workforce aligned to the jobs of the future.

Value of the Hobart economy
• Gross Regional Product – 2023/24 $9.3 billion, compared to almost $5 billion in 2001.
In 2011 GRP was $7.1 billion. The change has been steady over the past 25 years. The change from 2002-06 was more than 4 per cent growth each year, with continued growth each year after, but slowing slightly. Importantly, Hobart’s economy has grown almost every year since 2001, the only year where there was a slight decline was in 2022, where it declined by 0.1 per cent, which is likely connected to the end of the COVID pandemic.
Hobart City - Gross Regional Product
Year ending June
Source: National Institute of Economic and Industry Research (NIEIR) ©2025 Compiled and presented in economy.id by .id (informed decisions)

Source: NIEIR – Modelled Service.
Value added contribution to the economy is another way to measure the size of the economy. It measures how different sectors contribute to overall economic growth and productivity.
° The overall structure of Hobart’s economy over the past 25 years has not changed significantly. The economy has grown, but the sectors driving that growth have largely stayed the same. The only change to the order of sectors and their contribution in terms of the major contributors is that Utilities was in the top five contributors 15 years ago, but in the most recent data it is ranked seventh, whereas Professional, Scientific and Technical Services in the most recent data has moved into the top five.
° In 2023/24 the sector contributing most to the economy was Heath Care and Social Assistance, valued at $1.8 billion.
° In 2011/12 Health Care and Social Assistance was still the major contributor to the economy, valued at $1.1 billion.
° In 2001/02 Health Care and Social Assistance was the major contributor to the economy, valued at $804 million.
• When compared to 2001/02 the sectors experiencing the most significant change in terms of their contribution to the local economy are:
° Health Care and Social Assistance has grown by over $1 billion, and has been the major driver of growth over the past 25 years. A lot of this growth can be attributed to investment in infrastructure and the changing needs of the population, e.g. Royal Hobart Hospital, and growth in the Social Assistance sector, e.g. aged care, welfare and disability assistance services.
° Manufacturing in Hobart has declined the most, going from a value of $123 million in 2001/02 to $73 million in 2023/24. This coincides with the evolution of the city, and the movement of manufacturing into other parts of Tasmania as well as a national trend where large scale manufacturing has moved offshore.
The above information indicates Hobart is an institutional and service based economy, which has been driven by public administration, tertiary education, healthcare, tourism and cultural services.
During this time, despite the decline of sectors like traditional manufacturing, other sectors have stepped up, including tourism, which has grown in value by over $200 million from $489 million to $695 million in 2023/24.
Source: National Institute of Economic and Industry Research (NIEIR), 2025. Compiled and presented in economy.id by .id (informed decisions).

Employment
There were 67 492 jobs in Hobart at the end of June 2024, compared to 44 721 in 2001.
In 2024, the most jobs were in the following sectors:
° 22% of jobs were in the Health Care and Social Assistance sector.
° 16% in Public Administration and Safety.
° 10.9% in Education and Training.
° 10.3% in Professional, Scientific and Technical Services.
In 2001, the job breakdown had some similarities, but also significant changes:
° 18% in Health Care and Social Assistance.
° 14.1% in Public Administration and Safety.
° 9.7% in Retail Trade, which has dropped to 6.7% in 2023/24.
The sectors that have experienced the most growth/decline in this timeframe are:
° 6824 additional jobs in Health Care and Social Assistance.
° 734 job decrease in Wholesale Trade.
Source: National Institute of Economic and Industry Research (NIEIR), 2025. Compiled and presented in economy.id by .id (informed decisions).
Employment (total) by industry 2023/24
Hobart City Tasmania Agriculture, Forestry and Fishing Mining Manufacturing
Rental, Hiring and Real Estate Services
Professional, Scientific and Technical Services Administrative and Support Services
Percentage of the employed (estimated)
Source: National Institute of Economic and Industry Research (NIEIR) ©2025 Compiled and presented in economy.id by .id (informed decisions).
Source: NIEIR.
Source: National Institute of Economic and Industry Research (NIEIR) ©2025 Compiled and
(informed decisions).
In other capital cities the comparison of job numbers for these sectors is interesting:
• City of Sydney
° Public Admin 8%.
° Health 6%.
• City of Melbourne
° Public Admin 11%.
° Health 9%.
This comparison is interesting because it demonstrates the reliance in Hobart on Public Administration and Health Care jobs when compared to Sydney and Melbourne, and the need to explore strategies to diversify the economy.
Health Care and Social Assistance as well as Public Administration and Safety will continue to be important contributors to the local economy, but as a local community that can’t rely on population growth as a driver of the local economy there is the need to identify those sectors that will help diversify and deepen the economy.
Most of the sectors that have contributed strongly to the local economy over the past 20 years are known as Household Services, or sectors that are largely population driven.
As mentioned earlier, this jobs data further indicates the City of Hobart is an institutional and service based economy, and has been driven by public administration, tertiary education, healthcare, tourism and cultural services.
The most recent evolution of Hobart began in the 1950s and 60s, driven by changes like the development of the university in Hobart, the construction of Australia’s first legal casino and the transformation of the city centre through the introduction of new retail and office buildings.
What hasn’t changed in this time is the passion of Hobart residents to protect and preserve what makes Hobart special. As the city grew there was pressure to knock down historic buildings to provide space for new buildings, however, guidelines were introduced to prevent this from happening.
In the 1970s Hobart had a large industrial capability, and a large part of the economy revolved around the industrial use of the port. The port is still a major economic driver for Hobart, but not in the same way it was 50 years ago. Now the port is a thriving hub for tourism, culture, science and research.

Economic snapshot – tourism
Tourism has long been an important contributor to Hobart’s economy. As a sector it experienced challenges during the COVID period, as did many sectors and economies all over the world, but it has bounced back quickly in the domestic market and continues to grow towards pre-COVID numbers in the international market.
• 10 791 people work either directly or indirectly in the tourism sector.
• An estimated 1.12 million domestic overnight visitors and 192 000 international visitors came to Hobart for the year to December 2024.
• 1.6 million people visit kunanyi/Mt Wellington every year, 28 per cent of all people who visit Tasmania go to kunanyi/Mt Wellington.
• From an output or sales perspective tourism contributes $1.2 billion towards the Hobart economy.
• Salamanca continues to be a major attraction for visitation to Hobart:
° In 2022/23 approximately 447 600 people visited Salamanca Market, a 78 per cent increase from the previous year and a 6 per cent increase above pre-pandemic levels in 2019 (423 450 visitors).
° In terms of market share, the 55+ age group constituted the largest share of visitation in 2023 (44 per cent).
° The average spend per visitor increased from $42 (2016) to $55 (2023).
° In 2023, visitors spent between $42 million and $45 million at Salamanca Market, and between $28 million and $30 million at retailers near the market.
National Economics (MIEIR) – Modelled Series
Economic snapshot – night-time economy
An important part of the tourism sector is the night-time economy. Based on a report prepared by Council of Capital City Lord Mayors annually since 2009, below is how the night-time economy has grown and contributes to the local economy.
• Core night-time economy business numbers from 2009 (453) have grown by 44.6 per cent to 655 in 2024.
• Employment in core night-time economy businesses has grown by 20.7 per cent in the same time frame from 5895 to 7115.
• Turnover in core night-time economy businesses has grown by 42.3 per cent, from $551m to $1.1 billion.
Other interesting night-time economy information:
• The report provides comparisons across 88 Local Government Areas. In terms of turnover Hobart ($1.1b) ranks 24th, but that compares Hobart to much larger Local Government Areas, e.g. Brisbane is ranked number 1 at $12.6b. The only other Tasmanian Local Government Area included in the comparison data is Launceston, which comes in at number 80, with turnover of $347.7 million.
• When turnover is considered per employee numbers (per 10 000 employees) Hobart is ranked second at $202.3 million per 10 000 employees, behind only Byron Shire at $352.9 million per 10 000 employees.

Development in Hobart – building approvals
Building approvals are considered a strong indicator of development activity in a region as a building approval is the last major approval before a development commences. Planning approvals are not always a great indicator of development as not all planning approvals translate to actual development on the ground.
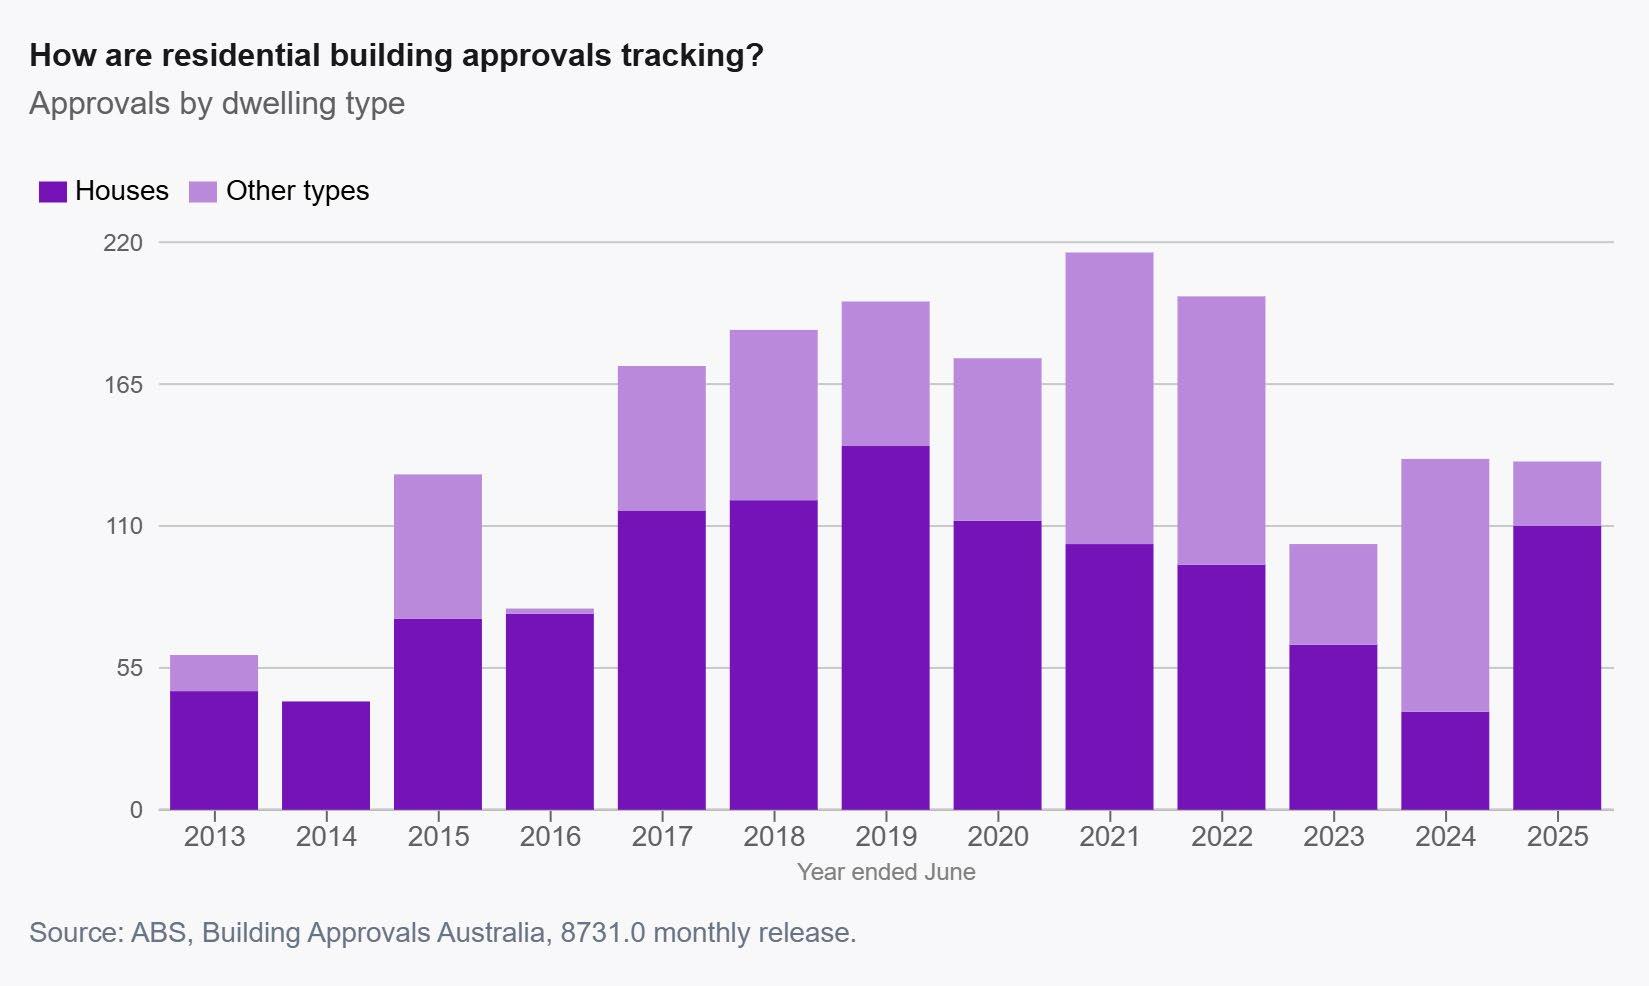

Over the past ten years or more building approvals in Hobart have had peaks and troughs. The largest peak for total approvals in recent times was in 2021, with 103 residential and 113 non-residential approvals. In 2023 Hobart had its lowest number of approvals in recent years, and in 2025 there was a significant increase in residential approvals (96), but not the same growth in non-residential approvals (25).
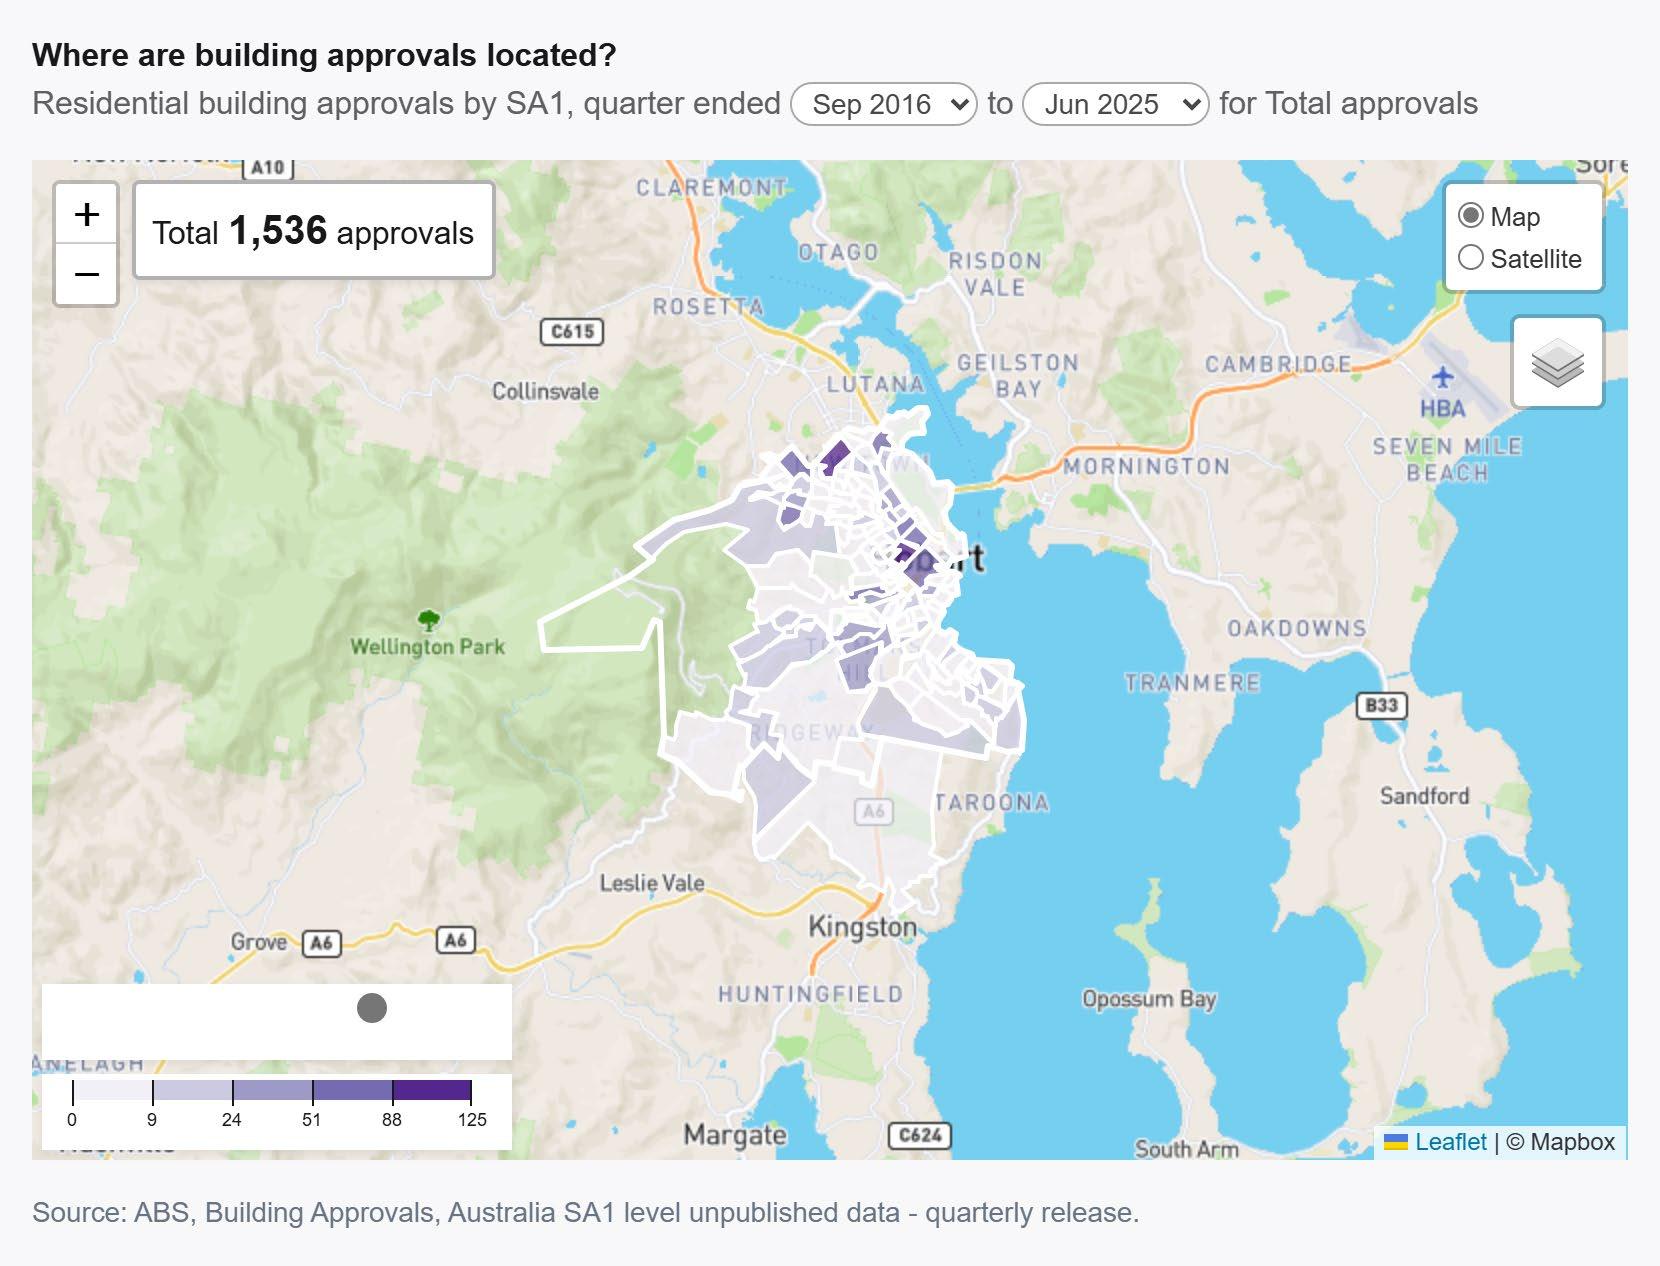
From 2016 to March 2025 there have been 1536 residential building approvals, with most concentrated around the city and northern suburbs of Hobart.
Where are we going?
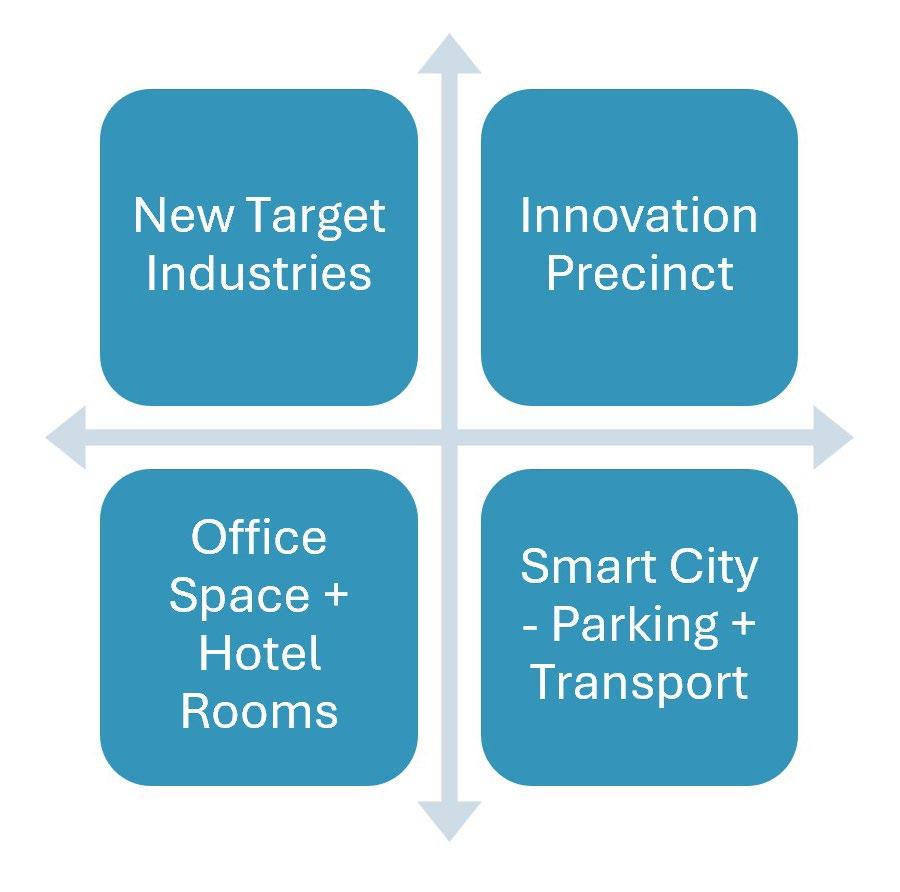
From an economic perspective there are four key areas the City of Hobart will focus on for the next 12 months and beyond to play its role in helping to facilitate growth in the local economy. The four priority areas are:
New target industries
Hobart’s economy has been built on institutional and service based sectors, including public administration, tertiary education, healthcare and tourism. These sectors will continue to be strong contributors to the local economy, but the identification of Hobart’s strategic growth industries is about identifying those sectors that can help diversify and deepen the local economy and take advantage of sectors that are growing nationally where Hobart has strengths and capabilities.
Hobart is well positioned for economic growth through its strengths as a research and education hub, cultural capital and Antarctic Gateway. As Tasmania’s institutional and service centre, Hobart plays a critical enabling role, coordinating the talent, infrastructure, research and innovation needed to grow emerging and high value industries.
A key finding from industry analysis is that Hobart’s economic future lies in research/ science, clean, creative and digital industries, but growth depends on boosting infrastructure, talent, innovation and commercialisation ecosystems.
Each of the target industries that have been identified is based on their alignment to national growth opportunities and local potential and capabilities. Local potential and capabilities vary from industry to industry, and each target industry has been categorised accordingly.
These sectors are well aligned with Hobart’s strengths and should be supported for growth:

The City of Hobart can’t be all things to all industries, so if we were to go through the process of picking winnings, we would focus on sectors that have strong alignment. But this doesn’t mean completely turning our attention away from others that can still benefit from our support.
What makes these sectors important to Hobart’s economic future?
Antarctica and Southern Ocean logistics, research and the broader Blue Economy
• Hobart is Australia’s designated Antarctic gateway, which gives Hobart’s capabilities in this sector a true competitive advantage.
• It is supported by Australian Government investment and international partnerships.
• Growing global demand for Antarctic/polar research and logistics.
• Aquaculture is expected to surpass wild fisheries globally by 2027.
• Growing investment in offshore aquaculture, seaweed farming and marine technology.
• The global seaweed market tripled in the past 20 years, hitting $17 billion in 2021.
• The global fisheries and living marine resources market was estimated by the UN Food and Agriculture Organisation at $400 billion in 2020, making seaweed a small but fast growing segment.
• Seaweed has important environmental value and is emerging as a feed supplement for livestock to reduce methane emissions.
What is the opportunity for Hobart?
• Expand beyond public research to include private logistics and cold climate technology.
• Develop Antarctic focused innovation and infrastructure to support the growth of the sector.
• Promote Hobart globally as a science and expedition base.
• Tell the world about the innovative and globally important activities that are being delivered out of Hobart/Tasmania.
• This is a strong competitive advantage for Hobart because of strengths like our deepwater port, university specialisations (IMAS) and our geographic location.
• Opportunity to position Hobart as the policy, R&D and innovation centre underpinning Tasmania’s marine and blue economy.
• Support city-based startups and research spinoffs focused on sustainable aquaculture, marine engineering and ocean biotech.
• Develop collaborative spaces near IMAS, CSIRO and the port to prototype and test marine technologies.
• Promote Hobart’s role in blue economy strategy development, climate adaptation and international marine science networks.
Renewable energy and green technology
• Investment in hydrogen globally is set to exceed $320 billion by 2030.
• Climate related finance flows surpassed $1 trillion in 2021.
• Nationally there is massive investment in green hydrogen, renewables and cleantech R&D.
• Tasmania is targeting 200 per cent renewable energy by 2040 to support export and industry growth.
What is the opportunity for Hobart?
• Opportunity to become the administrative and innovation hub for green renewables, even if we aren’t the centre for production.
• Foster cleantech R&D aligned with sustainability and environmental technology.
• Opportunity to attract global policy and business leaders in this sector to Hobart.
Creative and experience based tourism and events
• There is growing demand for immersive, experience-based tourism.
• Increasing global investment in cultural destinations and the creative economy.
• National and state growth in cultural and heritage-based visitor offerings.
• Upgrades planned to Hobart Airport open the region up to more markets.
What is the opportunity for Hobart?
• Development of new experiences aligned with global and national demand.
• Opportunity to support the growth of local experiences already contributing to this market.
• Increased promotion and exposure for these opportunities.
Digital startups and creatives:
• Digital services and screen content exports are booming globally.
• Creative technologies driving cross-sector innovation.
• Rapid growth in remote work, digital services and export share.
What is the opportunity for Hobart?
• Opportunity to attract/develop creative and digital entrepreneurs via lifestyle and affordability benefits.
• Support niche clusters in software, gaming and screen production.
• Capitalise on recognition generated by MONA, Dark Mofo, etc.
EdTech and Online Learning
• Surge in global demand for flexible, digital learning.
• Strong growth in specialist platforms and niche course providers.
• Post-COVID there has been growth in hybrid education, micro credentials and digital course exports.
What is the opportunity for Hobart?
• Position Hobart as a test bed for innovation in digital learning.
• Develop niche global offerings in environmental and Antarctic education.
• Support UTAS online education exports.
Health and Digital Care
• Ageing populations are driving innovation in community based and techsupported care globally.
• Growth in assistive technologies and AI for care monitoring and diagnostics.
• Rising demand for aged care, telehealth and digitally enabled support.
• The health sectors digitisation and ageing demographics is driving innovation needs.
What is the opportunity for Hobart?
• Pilot care technology models, leveraging UTAS research and local needs.
• Support innovation in digital aged care, disability services and community based models.
• Build workforce digital skills in health and care sectors.
What role can the City of Hobart play?
The common role for the City of Hobart across all these sectors is to bring together key stakeholders, linked to each of the opportunities, to explore the practical benefits and realistic opportunities for Hobart and work with these stakeholders to develop a solutions focused action plan for how we can progress.
The City of Hobart can lead a supply chain analysis piece of work to define the sector, identify who is already in Hobart and what they are doing. With these businesses we would then look at what is missing from the local supply chain that would add significant value to the sector and implement a business attraction plan to bring them to Hobart.
The City can also play an important role in telling good news stories about the businesses that are already here, the early adopters and the success stories. Nothing builds momentum around an opportunity like telling the world about it.
We can also bring key policy and decision makers to Hobart, helping to build a profile and setting the agenda for growing the sector locally.
Key Message
It is important to explore opportunities to diversify our local economy, we don’t want to be over reliant on specific sectors, because that results in those sectors, the associated jobs and the local economy, being susceptible to change. A more diverse economy with strengths across a variety of sectors is a more sustainable and resilient local economy.
The list of target industries has been developed based on a strategic data analysis process. The next step is to test this analysis through a series of industry directions designed to better understand the challenges and opportunities facing each of these sectors, and what role the City of Hobart and other levels of government can play in bringing these opportunities to fruition.
We held the first of these round tables on 7 August 2025 with a group of local innovation businesses who shared information about what makes Hobart the right place for their business and some of the challenges they face, which, if addressed, could help grow Hobart’s knowledge economy.
INNOVATION PRECINCT TASKFORCE
A City of Hobart priority action for 2025-26 is to develop an investment attraction strategy for the Hobart Innovation Precinct that supports the attraction of start-up businesses and innovative industries that provide employment options, particularly in the Innovation Precinct, identified in the Central Hobart Plan. The Central Hobart Plan recognises Central Hobart as the economic centre of Tasmania. The Innovation Precinct is recognised as an area of potential change adjoining the existing CBD and is noted as a desirable location for creative and innovative businesses.
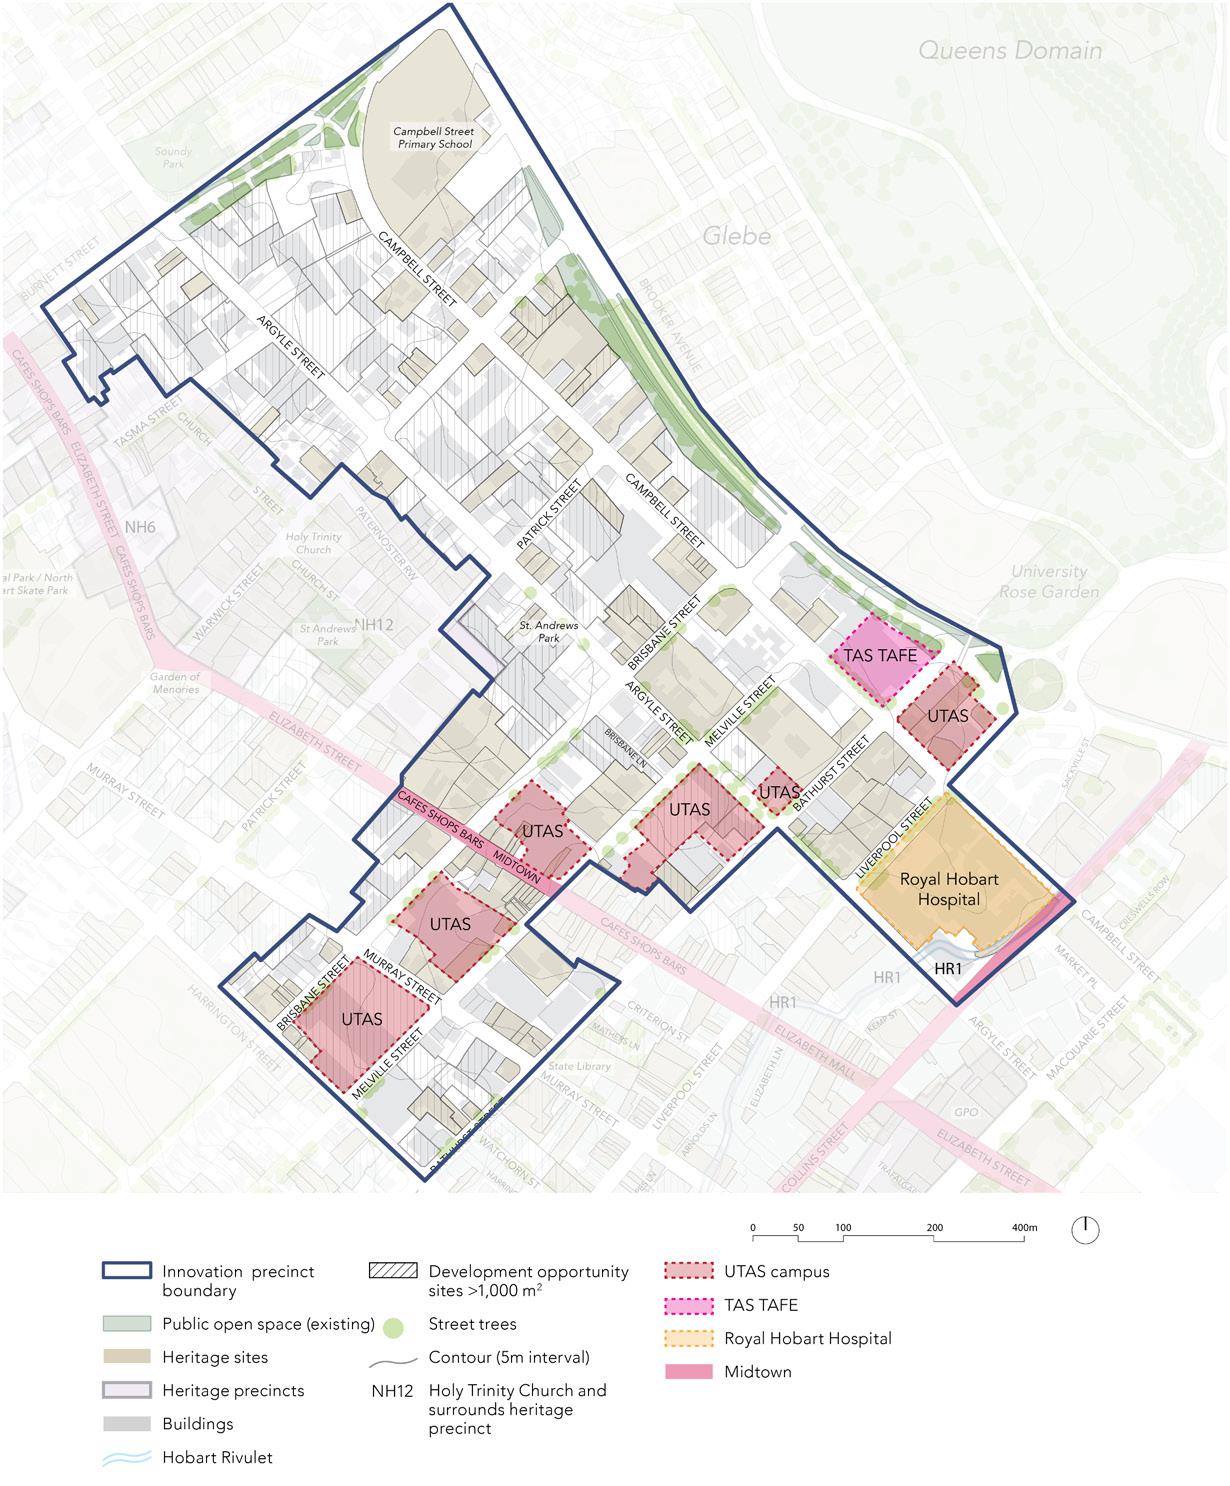
The Central Hobart Plan identifies five distinct precincts:
1. Central Precinct
2. Civic and Cultural Precinct
3. Innovation Precinct
4. Trinity Hill Precinct
5. Rivulet Precinct
The Innovation Precinct extends across Central Hobart from the Brooker Highway, includes some of Midtown and extends to the Royal Hobart Hospital. It is currently characterised by a mix of smaller two-storey buildings, larger lot sizes, bulk goods retail, warehouses and car dealerships.
Many of the sites are considered under utilised given the central city location, with opportunities to encourage redevelopment for a mix of innovation, research and development, education and creative industries.
The role of innovation precincts in growing local economies
Innovation precincts are geographic areas where leading edge anchor institutions and companies cluster and connect with start-ups, business incubators and accelerators. They also usually offer other land uses, such as mixed-use housing, office and retail. This model encourages the concept of ‘open innovation’.
People are choosing to live and work in locations where they have efficient access to collaboration spaces that are walkable and connected by transport and technology.
Innovation precincts have the ability to help a city move up the value chain of global competitiveness by growing the businesses, networks and industries that drive economic prosperity.
Gone are the days of isolated science parks, innovation precincts focused on creating a physical realm that encourages and strengthens proximity and knowledge spillover.
Innovation precincts have the potential to support economic growth, social equality and reduce sprawl and environmental degradation. They do this by providing a strong foundation for the commercialisation of ideas and the creation and expansion of businesses and jobs through proximity and collaboration.
Most innovation precincts follow one of three models:
• Anchor Plus – focused around university/higher education institutions.
• Re-imagined Urban Areas – where areas are undergoing a physical and economic transformation to establish a new path of innovative growth. E.g. 22@Barcelona
• Urbanised Science Park – found in suburban areas, it is based around the re-imagining of old, isolated science parks.
The most appropriate model aligned to the Central Hobart Innovation Precinct is the ‘Re-imagined Urban Areas’ model.
Key Message
The development of an Innovation Precinct in Hobart is closely aligned to the opportunities associated with the new targeted industries. In fact, in may cases a designated space supported by the right infrastructure is important to the long term success of these target industries.
The City of Hobart recognises we can’t achieve this on our own and that we need to work with landowners, investors, developers and businesses from the target industries to develop an action based vision document to bring the Innovation Precinct to life. Innovation Precincts don’t just happen, they are carefully designed and curated places.
The area designated as the Hobart Innovation Precinct has many of the essential ingredients to evolve into a competitive, globally connected precinct. Including major hospitals, research infrastructure, walkability, rideability and the potential for new projects to be identified, encouraged and put together to build a strong innovation ecosystem, but we need to work together to achieve our potential.
With this in mind the City of Hobart plans to establish an Innovation Precinct Taskforce to advise and guide the development of this vision document. We intend to prepare this vision document by mid-2026.
A Smart City approach with a focus on services such as parking and transport
Key Messages
New developments are changing the way core utilities within cities operate. Old technologies are being digitised and transformed at revolutionary speed into new networks, primarily around communications, energy and transport – where devices are increasingly connected.
Aging city infrastructure can be upgraded or replaced with contemporary solutions that talk to us, each other, anywhere in the world – through new data and information technologies.
The stories they share can help us improve city, urban and metropolitan life in truly transformational ways. We know that parking and how people move around the city is a hot topic for the community. Over 25 per cent of complaints from the community are
about parking. With this in mind the City is always looking at ways to improve customer service and business performance through technology.
The City of Hobart has endorsed new access hours for the city’s multi-storey car parks and started a technology improvement program in the car parks, making them more user friendly for the customer. The City of Hobart recently launched its ‘Park My Ride’ website to provide more current and accurate information on car parking availability across Hobart. These changes are relatively minor in comparison to the Future State of Car Parking work we have commenced, which is intended to transform the car parking customer experience in Hobart. The key message relating to this is we don’t want to do this on our own, as part of the review and continuous improvement program we plan to engage with the community to ensure the proposed changes meet community needs. More than 25 per cent of complaints the City of Hobart receives are about parking. This creates an excellent feedback base to start with, but we want to ensure our new approach is based around the philosophy of working with the community to develop an enterprise architecture that moves us to a future state where customer service and business performance is supported by technology improvements.
Did you know:
• The City of Hobart has three multi-storey car parks. The buildings are worth an estimated $86 million.
• There are 3943 public car parking spaces across the city.
• We have 2300 sensors in the ground.
• There are over 350 parking meters across the city.
Office space and accommodation
Hobart’s hotel occupancy has steadied at around 75 per cent after reaching a post-COVID peak of 77 per cent last year.
Occupancy is well above 80 per cent over the peak period, and approximately 60 per cent in the winter months.
Accommodation demand in Hobart has outperformed the national average since COVID, particularly in the key interstate market, with strong overnight stays.
International demand is recovering but remains below pre-COVID levels, especially for the higher yielding longer stays.
Forecasts suggest that an additional approximate 2000 rooms are required to meet Tasmania’s likely needs by 2030. This could vary by as much as an additional 700 plus rooms, depending on the scenario that eventuates.
There are a number of new developments in the pipeline, and even more with development approvals, that could supply in the vicinity of over 1000 additional rooms, which is still below the identified demand.
It is a similar story with office space. Hobart’s office space vacancy rate in the CBD fluctuates between two and ten per cent, with higher rates in lower-grade buildings. Hybrid work arrangements have definitely had an impact on demand for office space.
There is currently very little to no A grade office space available over 500m2 in Hobart.
The financial viability of developing new accommodation and office product is being impacted by rising construction costs and difficulties obtaining sufficient pre-commitments.
Other cities have seen the introduction of incentives to secure tenants. This is adding to the narrative that Hobart is more costly than other locations.
Hobart has many advantages that have been discussed throughout this report. Others not previously touched on include a lower operating cost environment and job tenure rates –people stay in jobs in Hobart longer than they do on the mainland. This helps create an environment where employees in the innovation sector are being retained, which in turn generates other business benefits.
Key Messages
Hobart doesn’t have enough office space and accommodation to respond to market demand, and as per previous examples, the City of Hobart wants to engage with key industry stakeholders, through roundtable engagement workshops, to develop a plan for how, collaboratively, we are going to deal with challenges such as construction costs and the overall financial viability of developments in Hobart. We know there is no magic ingredient, but we also know we don’t want to just wait for the cycle to turn. We want to work proactively with developers, land owners and investors to come up with innovative solutions to the current challenges, and in turn set Hobart up to continue to respond to the needs of the market.
DEVELOPING HOBART
The City of Hobart continues to demonstrate a strong commitment to fostering highquality development, as evidenced by its impressive planning approval rate. In the current financial year (2024-25), the approval rate has reached 99.4 per cent, up from an already high 99.0 per cent a decade ago in the 2014-15 financial year.
This upward trend highlights Hobart’s supportive approach to well-considered projects that contribute positively to the city’s growth and vibrancy.
Currently, there is $338.4 million worth of development either approved, underway, recently completed, or ‘shovel ready’ within the city – spanning commercial offices, visitor accommodation, social housing, educational facilities and major health infrastructure upgrades. The following section provides an overview of these key projects, which will shape Hobart’s future and reinforce our reputation as a city open for business and innovation.
Below is a summary of some key development projects that have been approved and that are either underway, recently completed or ‘shovel ready’.
83 Melville Street and 80 Brisbane Street, Hobart – Forestry Building: Partial Demolition, Alterations, Extension, Change of Use to Educational and Occasional Care.
259 Sandy Bay Road, Sandy Bay – Dan Murphy’s: Change of Use to Hotel Industry (Bottle Shop), Alterations, Carpark and Signage.
2 Collins Street, Hobart – Procreate Offices: Partial Demolition, Alterations and Extension for Office, and Associated Works.
28-30 Davey Street, Hobart: Visitor Accommodation and associated conference facilities, restaurant and retail.
$85 900 000
$27 000 000
Building work is well underway and the building is expected to be ready for the 2026 academic year.
Building work is well underway.
$12 000 000
$30 000 000
Building work is well underway.
This development is in the final stages of the detailed design work required by the planning permit.
5-7 Sandy Bay Road, Hobart: Demolition, Alterations, Extension and Change of Use to Food Services and Visitor Accommodation (75 Serviced Apartments), New Building for 12 Multiple Dwellings.
4 Franklin Wharf, Hobart – Elizabeth Street Pier: Partial Demolition, Alterations, Extension, Intensification of Visitor Accommodation Use, Partial Change of Use to Eating Establishment, and Signage.
1 Queens Walk, New Town: Partial Demolition, 150 Multiple Dwellings (85 Existing, 65 New), Carparking, Landscaping including Tree Removal and Associated Works – Social housing.
208 Argyle Street and 210-218 Argyle Street, North Hobart: Partial Demolition, Alterations and Communal Residence – Social Housing.
RHH Emergency Department redevelopment and RHH Emergency Department expansion project Liverpool Street works.
31-35 Campbell Street, Hobart - S.H.E Cancer Wellness Centre:
Partial Demolition, New Building and Extension, Change of Use to Office (Consulting Rooms) and Visitor Accommodation, and Adhesion.
65 Brisbane Street, Hobart: Demolition and new Building for General Retail and Hire, Business and Professional Services, and 8 Multiple Dwelling and Associated Works.
1 Knopwood Street, Battery Point – Montpelier House: Demolition and New Building for 24 Multiple Dwellings.
$25 000 000
$9 000 000
$20 000 000
Building work has commenced on site.
$15 000 000
Building work is well underway.
$78 000 000
Building works are completed, and the new residences are ready to occupy.
Building Permit issued.
This development is in the final stages of the detailed design work required by the planning permit.
Unknown Planning Approval Issued.
$10 000 000 Planning Approval Issued.
$25 000 000
This development is in the final stages of the detailed design work required by the planning permit.
Number of approved / refused development applications with approval rate:
FY24/25: Approved – 528 Refused – 3 Approval rate - 99.4%
FY14/15: Approved – 824 Refused – 8 Approval rate – 99.0%

