Acknowledgment
The participants of the Lancaster Studio would like to thank our client, the Lancaster City Department of Community Planning and Economic Development. We appreciate the time taken to speak with us during Studio Travel Week, and we are especially grateful to Betsy Logan, Lauren Finn, and Thomas Gilbertson for attending our Mid-Review. Your feedback and guidance on how to improve our project and presentation helped shape the product in our Final Review. We also appreciate their attendance, as well as Molly Kirchoff, and comments at our Final Review on December 12, 2025. We hope you find this report useful in your work.
We would also like to extend special thanks to the late David Schuyler, former professor at Franklin and Marshall and author of A City Transformed: Redevelopment, Race, and Suburbanization in Lancaster, Pennsylvania, 1940–1980.
Studio II Team


Annalise Abraham
Meixi Chai
Ziyue
Dennis
Tyler Maynard
Lingye Meng
Haoyu Zhu
Guangze Sun
Zihe Zhu
Tom Daniels Instructor
Introduction
Problem Statement
Problem Statement
National Trend
Across the United States, regional malls are struggling with declining demand for brickand-mortar retail, aging infrastructure, and the continued growth of online shopping. In the 1980s, there were an estimated 2,500 large shopping malls. Today, there are about 700. Many malls have closed, while others are evolving through the introduction of housing, new combinations of retail and services, entertainment, and urban design interventions to meet the shifting retail landscape in the postPandemic era.
City and suburban governments rely on malls for their substantial property and sales taxes, as well as the jobs and shopping convenience they provide for residents. This report proposes planning strategies and designs the City of Lancaster could adopt to enable the owners of the Park City Center to position the 100acre mall site for long-term economic, environmental, and social sustainability.
The City of Lancaster (the “City”) has recommended a Small Area Plan for the Park City Center (“Park City,” “Park City Mall,” the “Center,” or the “Mall”) site that emphasizes housing, economic development, and improved environmental performance. The recommendations of this studio aim to provide ideas for the City of Lancaster Department of Community Planning and Economic Development in the creation of that Small Area Plan.
What is a Small Area Plan?
A small area plan is a detailed planning document for a specific geographic area within a larger community. Lancaster City’s 2023 comprehensive plan, Our Future Lancaster, identified Park City as an area for change over the next 10 to 20 years. A small area plan typically includes a vision statement along with specific land use regulations and design guidelines to direct future growth and development of a distinct neighborhood.
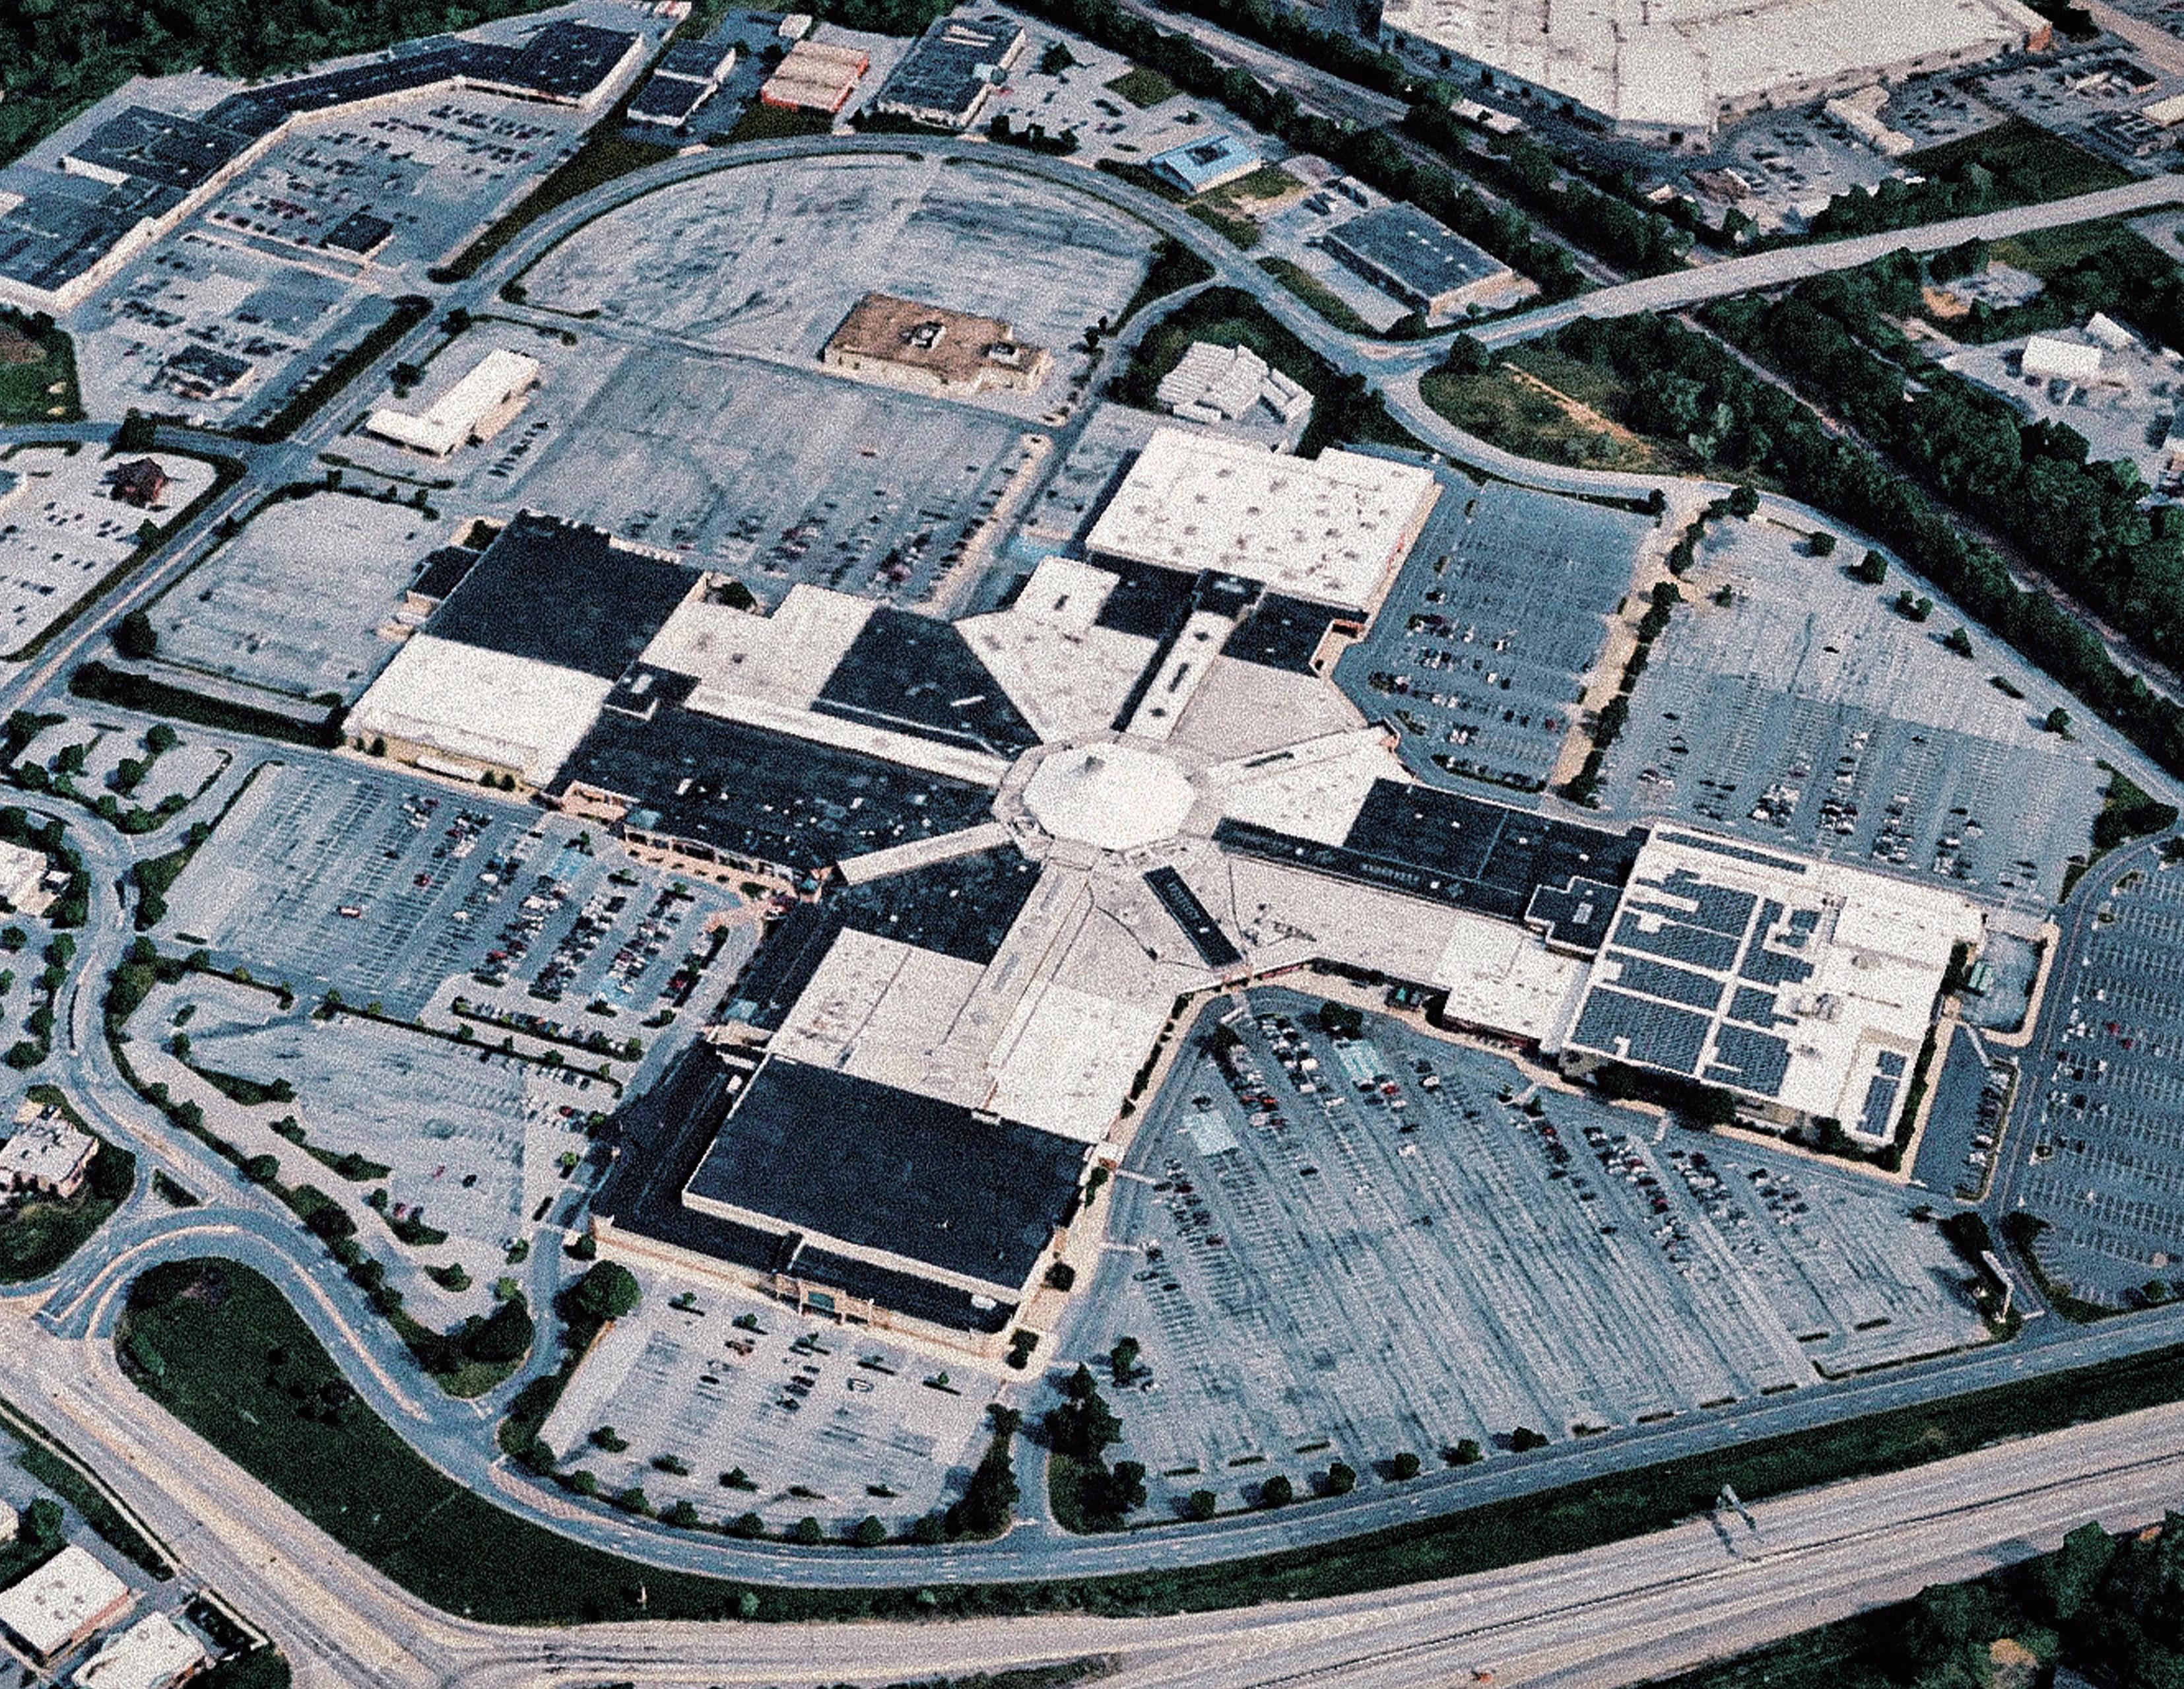
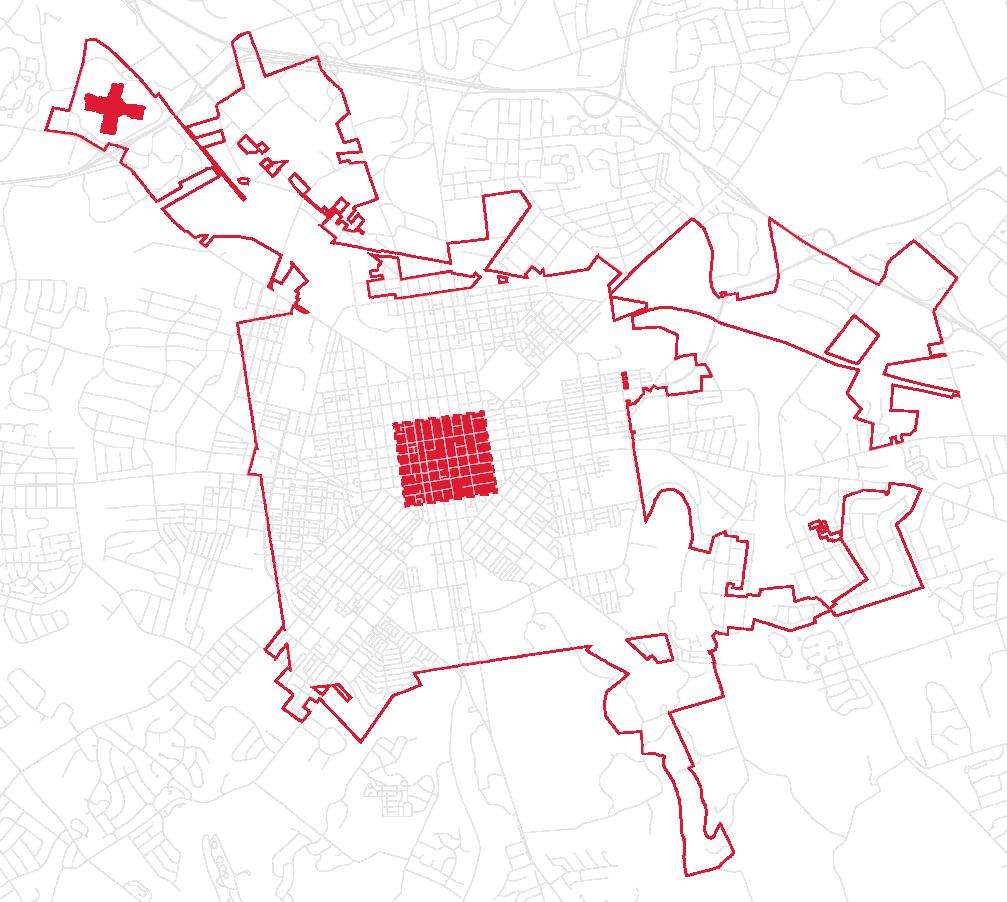
Figure 1: Park City Center as the future site of a Small Area Plan.
Park City Center
City of Lancaster
History & Context
History
Regional Mall Competition
The City of Lancaster
Current Layout
Nearby Green Assets
Regional Transportation
Comprehensive Plans
History
Urban Renewal in
Lancaster City & the Rise of Suburban Shopping
To understand the origins of the Park City Center, we first looked at Lancaster’s urban renewal period of the 1950s–70s, following the Housing Act of 1949, which officially created the federal Urban Renewal Program. Like many U.S. cities, Lancaster demolished a significant portion of its downtown under the promise of a more modern and revitalized city center. This was an attempt to increase tax revenue and resist population decline. Most of the buildings along the two blocks of West Orange and North Queen Streets were torn down and replaced with the Lancaster Square project. These modern concrete retail buildings failed to attract many customers and were soon razed. This further weakened the city’s traditional commercial core.
While selective demolitions and land clearing were underway in the downtown core, the City developed another strategy to compete with suburban shopping centers: develop one of its own. The Park City Center Mall mimicked the popular car-oriented retail centers, with ample parking and convenient retail that met the need of all residents. Located in the far northwest corner of Lancaster, Park City delivered over a million square feet of retail space and dozens of acres of free parking. Although the Mall generated
considerable property tax revenue for the City, this new, enclosed mall exacerbated downtown’s problems by drawing shoppers—and businesses —away from the historic core.
History of Park City Center
Park City Center (also known as the Park City Mall) first opened in 1971—the same year the soon-to-be-demolished Lancaster Square was completed. The City annexed the 100-acre site adjacent to the city’s northwestern edge separated by U.S. Route 30. Currently, Park City is the fourth largest mall in Pennsylvania, with over 130 stores. The Mall was developed as a modern, climate-controlled shopping destination, a novel concept at the time. Since opening, ownership shifted several times. Brookfield Properties, a private subsidiary of the publicly traded Brookfield Corporation has held the site since 2018. Park City Shopping Center Corporation, a joint venture of New York City’s Nassau Shopping Center Corporation and Lazard Frères & Company (an asset management and investment banking firm) were the developers of the initial project. The project covered 1.3 million square feet of retail space out of the site’s total 5.84 million square feet. The total project cost $48 million in 1971, equivalent to about $400 million in 2025.
At the opening ceremony on September 22, 1971, Pennsylvania Lieutenant Governor Ernest Kline praised Park City for creating jobs and solving the “land-lock” problem for the City of Lancaster. People at that time came from York, Reading, Harrisburg, and Northern Maryland to open charge accounts at the Mall. The local community, however, worried that shoppers traveling to and from Park City would create congestion along U.S. Route 30. Developers responded by spending $2 million to improve the off-ramp access from Route 30 into Park City.
Park City Center
Figure 2: Location of Park City Center in relation to Downtown Lancaster.
Downtown Lancaster
Regional Mall Competition
Today, Park City competes with several nearby retail centers. Newer malls like The Red Rose Commons, The Crossings, and The Shoppes at Belmont offer smaller footprints and more modern designs and amenities, compared to Park City. Notably, The Shoppes at Belmont and The Crossing integrate residential and mixeduse development components, which Park City currently lacks. Park City is no longer the only regional retail hub, as it is instead now part of a competitive regional retail market. From a planning perspective, the competition raises a fiscal concern for the City on how to keep Park City generating property and local income tax revenue, especially with fewer shopper visits in the post COVID-19 era.
What the Visit to the Mall Told Us About Current Conditions
During the Lancaster Studio site visit, we found that Park City has strong foot traffic and very few vacancies—the opposite of our expectations given national trends. Members of our studio enjoyed the shopping experience at the Mall due to an array of popular brands, fresh styles, and an overall atmosphere appealing to younger shoppers. However, there were also signs of vulnerability and areas needing improvement, such as excess surface parking, poor pedestrian
infrastructure, a lack of green space and trees resulting in poor stormwater management, and a windowless exterior for much of the mall building.
With this in mind, we examined how Park City can adapt to meet the economic, social, and environmental planning goals explored within the City and County Comprehensive Plans while remaining financially sustainable.
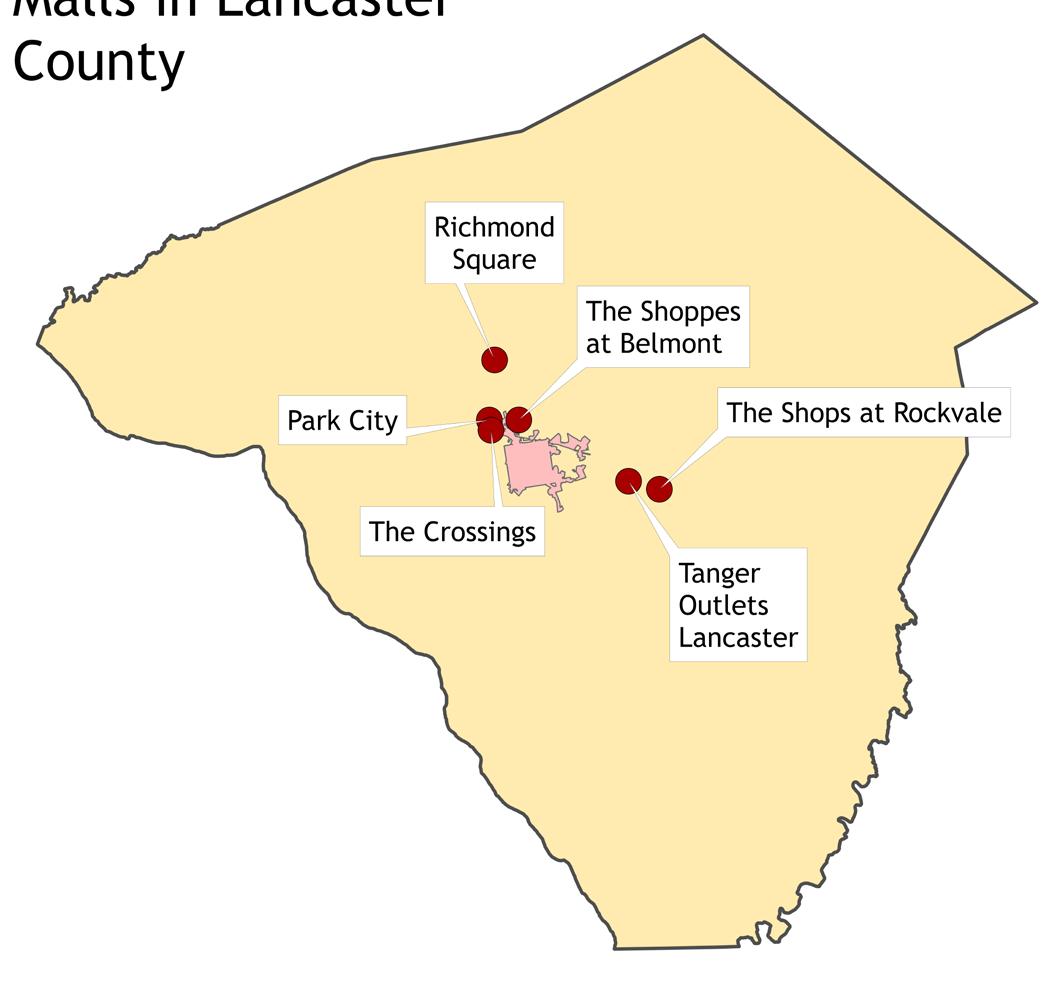
Table 1: Shopping centers in Greater Lancaster, 2025.
Figure 3: Map of malls and shopping centers in Central Lancaster County.
The City of Lancaster
Overview
Lancaster is a compact city of about 58,000 residents. Located in the center of Lancaster County, the city is the administrative heart of the county government. Due to the urban growth boundary, preserved farmland, and the inability to annex more land, Lancaster is almost built out, meaning there is limited vacant land for new development. This makes potential redevelopment sites like Park City especially valuable for future growth.
Demographics
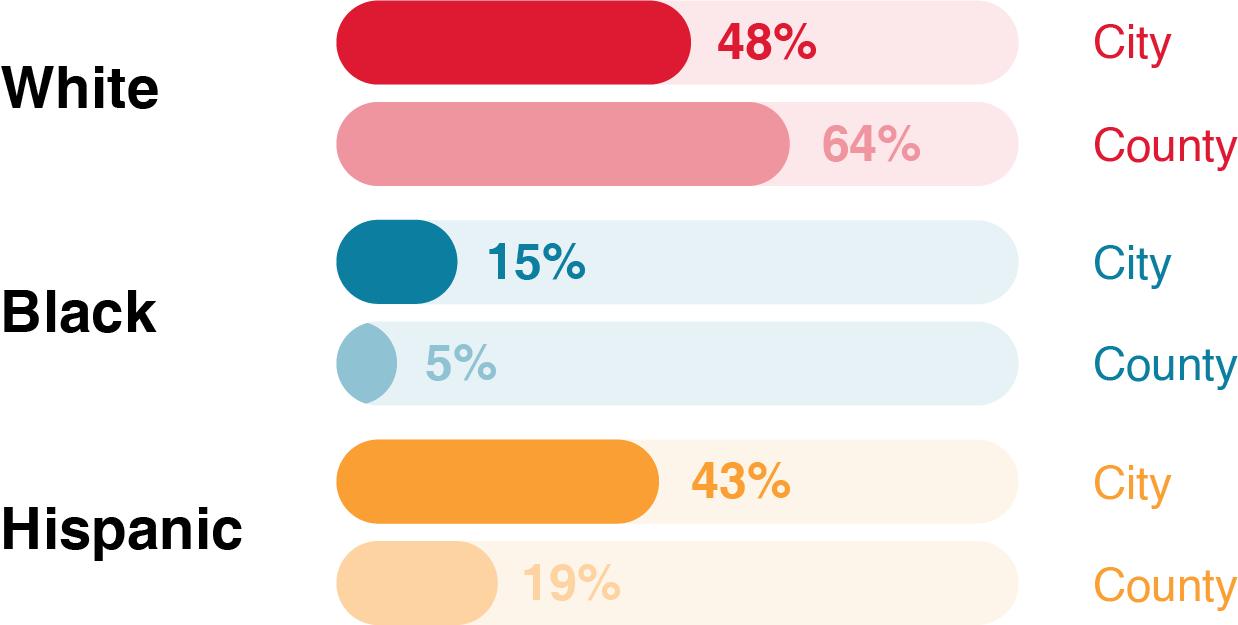
Compared to the county, Lancaster City is younger, more racially diverse, and less affluent. The median age is 32 versus 39 countywide and has smaller households on average. Lancaster also has a lower share of married families or families with children. Compared to the county, educational attainment and median household income are both lower and the unemployment rate is nearly three times higher. The county has a higher rate of car ownership: 62% of household have more than one vehicle compared to 40% in the city.
As the county’s population has grown slowly from 2013 to 2023, the city’s population has shrunk; though this trend appears to be reversing since 2020 in the city. The county’s population grew from about 523 thousand in 2013 to 555 thousand in 2023, a 6.1% increase, adding around 3,200 people per year. However, the city’s population dropped from about 59,300 to 57,700, a decrease
of 2.8%. Further analysis of census population data shows the population increase of the county was sustained by international immigration and natural births, with the county losing domestic population since 2010.
In 2023, 69.9% of the housing units in the county were owner-occupied, compared to 47.5% owner occupancy in the City of Lancaster. In the past decade, the raw number of renter-occupied units
has lowered from 12,464 to 11,155, a decrease of 10.5%. Similarly, the rental vacancy rate diminished from 5.1% to 2.7% over 10 years, but the median monthly rent increased from $987 to $1,177, an increase of 20%. Only about 2.3% of the total housing stock is newly constructed after 2010, compared to 8.9% for the entire county. This data shows the housing market in the city has tightened over the past 10 years.
Figure 4: Demographics of the City of Lancaster compared to Lancaster County.
Current Layout
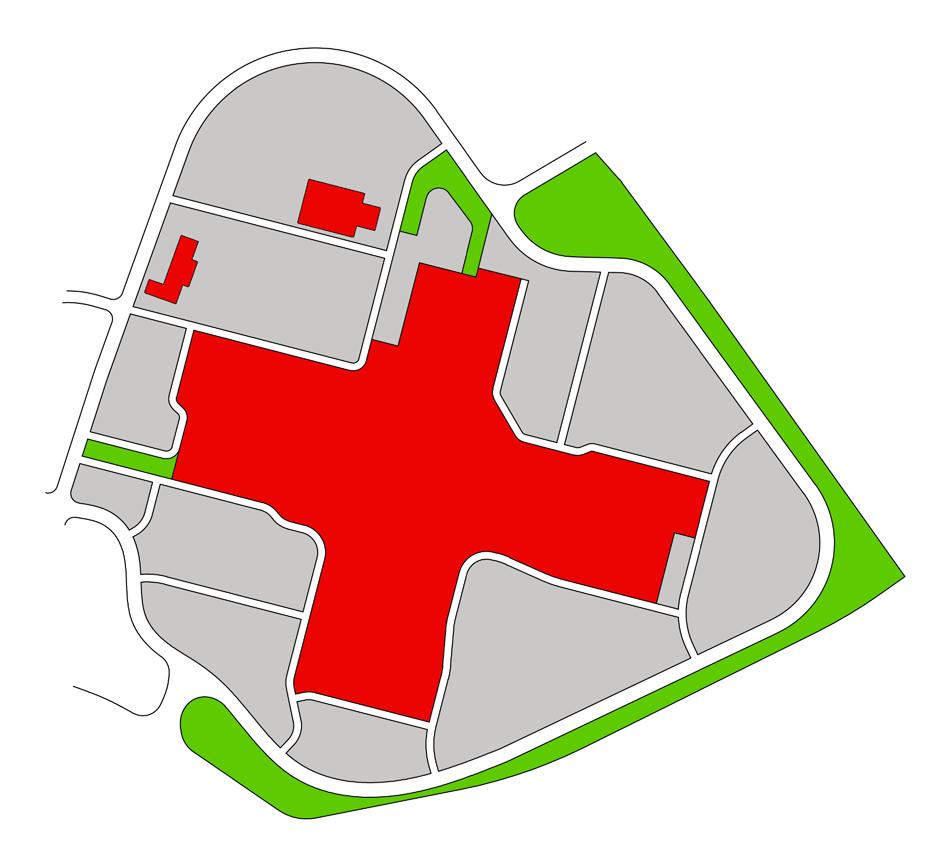
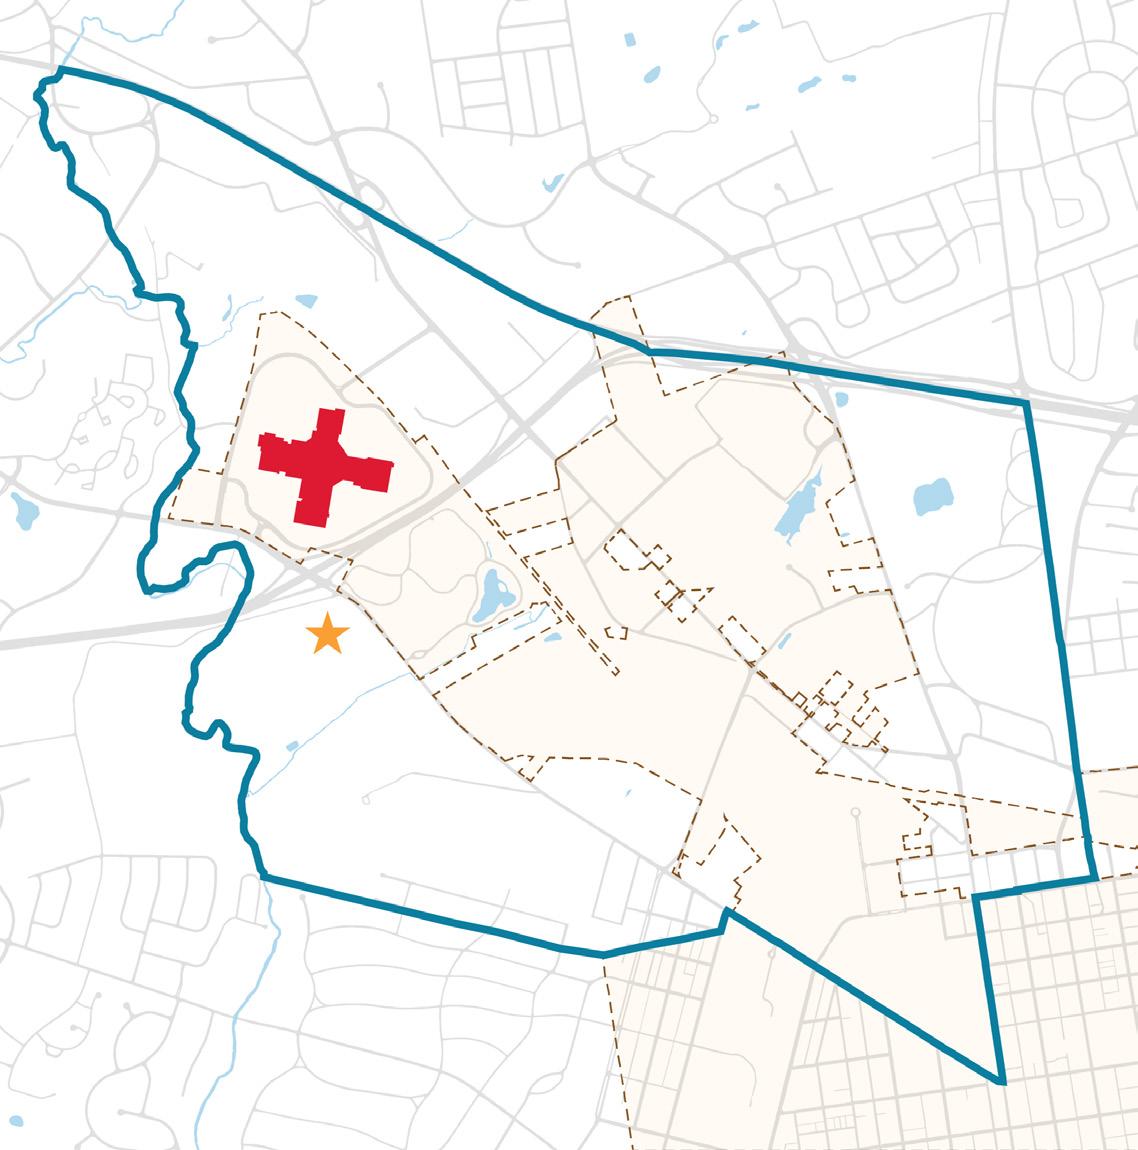
The current layout for Park City Center features a classic suburban mall design—a large building footprint surrounded by expansive parking lots. Park City is adjacent to Long’s Park and close to the planned Blue Green Connector trail system along the Little Conestoga Creek. There is an existing pedestrian underpass connecting Park City and Long’s Park, but walkability is still limited and very hard to find with the limited signage. To the west, across Plaza Boulevard, Park City’s ring road, are Parkview Plaza and several restaurants and the Blue Green Connector—indicating opportunities for pedestrian crosswalks to provide better connectivity.
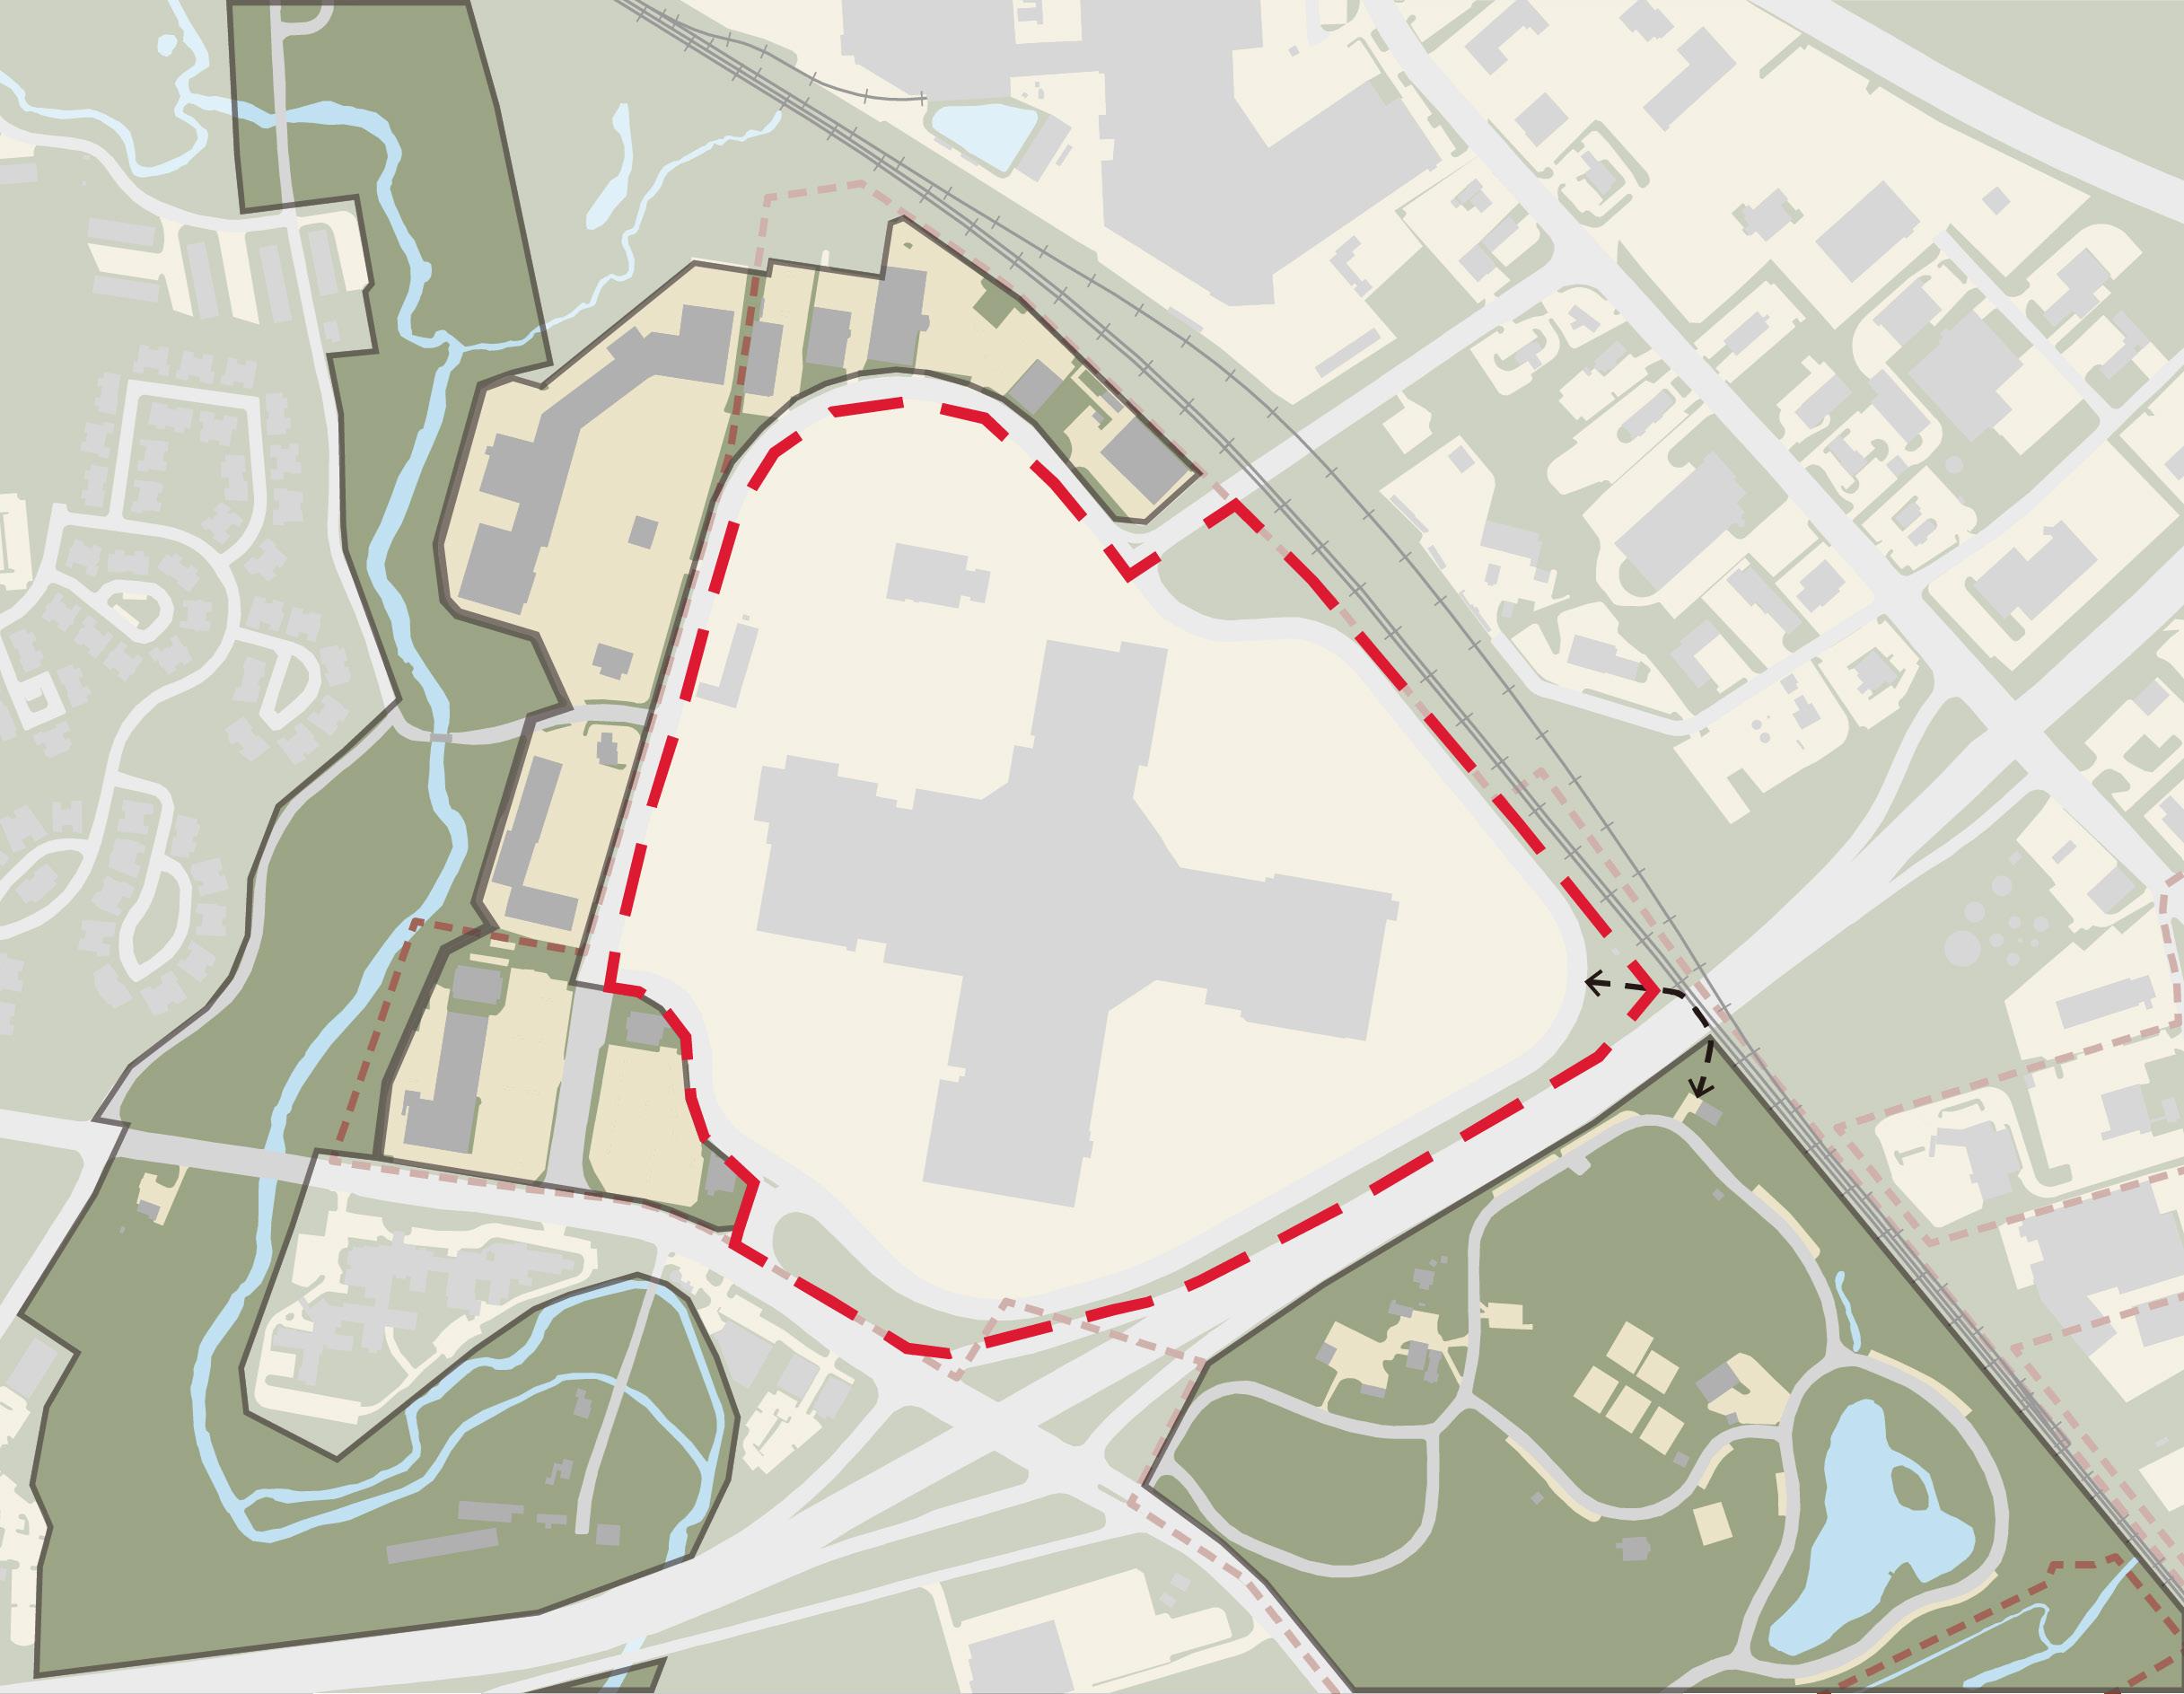
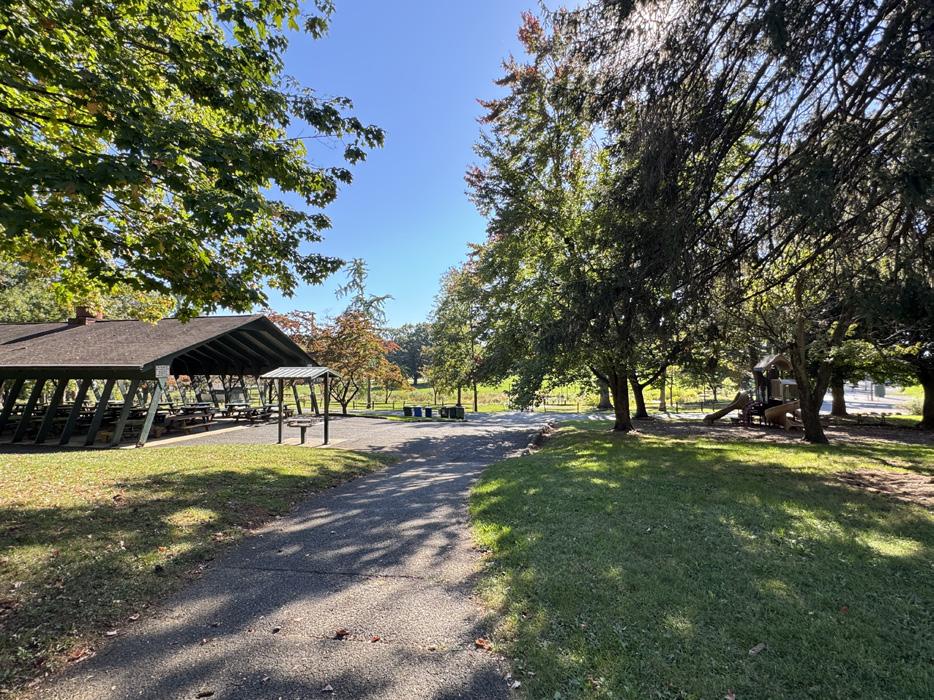
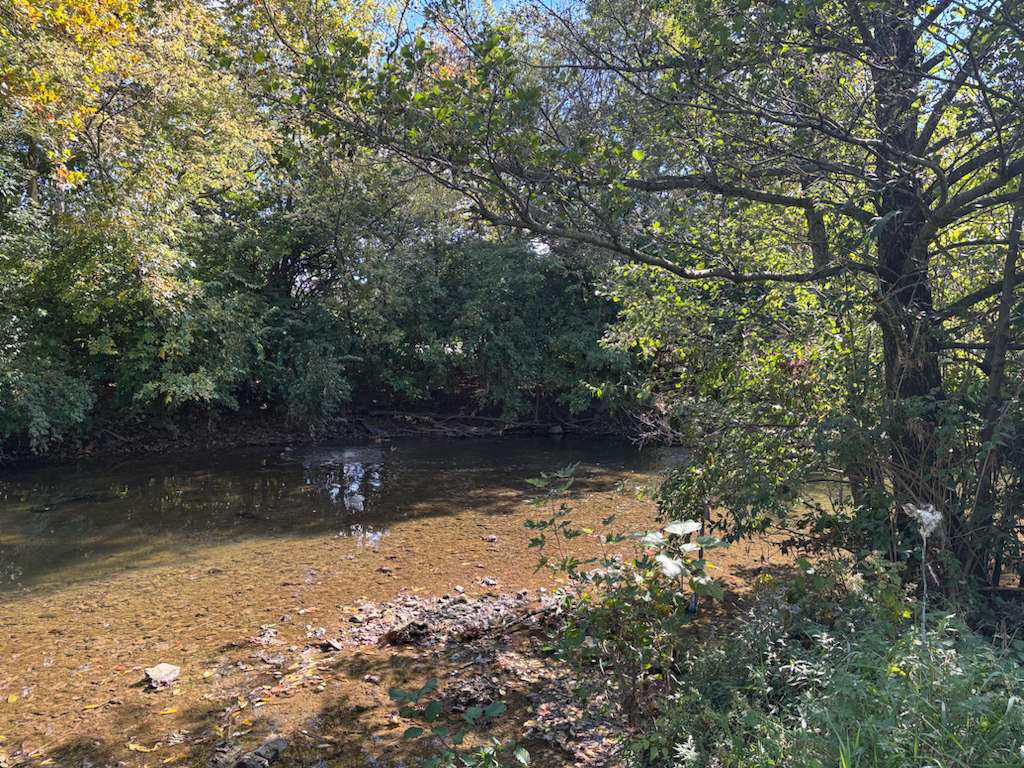
Figure 5: Current layout of Park City Site.
SITE
Long’s Park
Little Conestoga Creek
Dining Options
Parkview Plaza
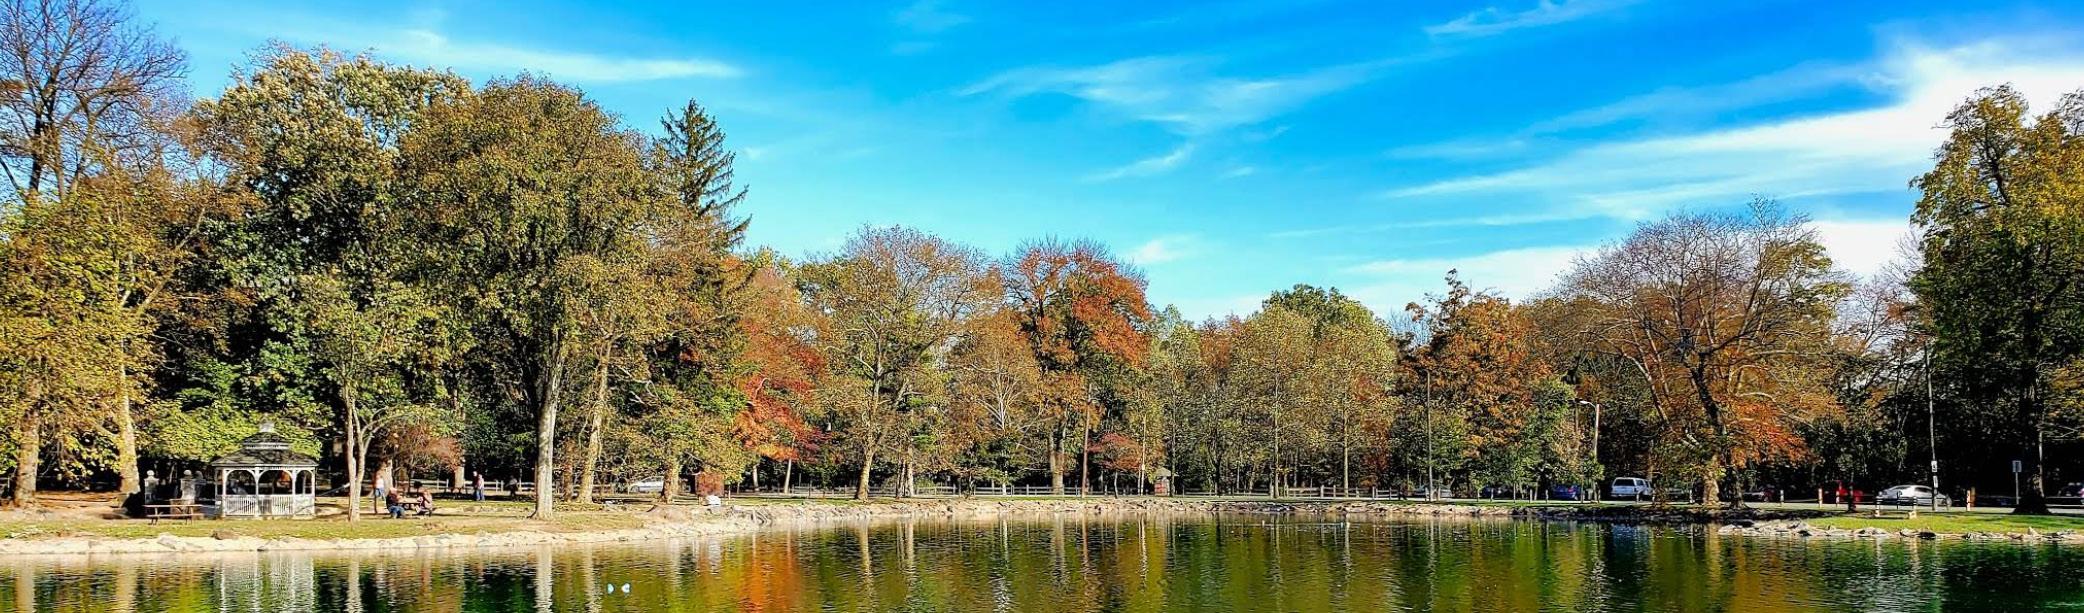
Figure 6: Long’s Park.
Figure 7: Little Conestoga Creek.
Nearby Green Assets
Long’s Park is an 80-acre city park which offers picnic pavilions, a petting farm, children’s playgrounds, a three-acre, spring fed lake, tennis courts, and a fitness trail. There are several special activities held there each year including a summer music series and an art festival.
The Little Conestoga Creek is a 21.1-mile-long tributary of the Conestoga River. The Blue Green Connector is a 3.5-mile trail under construction along the Little Conestoga, linking to the Health Campus, the Crossings, and Marietta Pike.
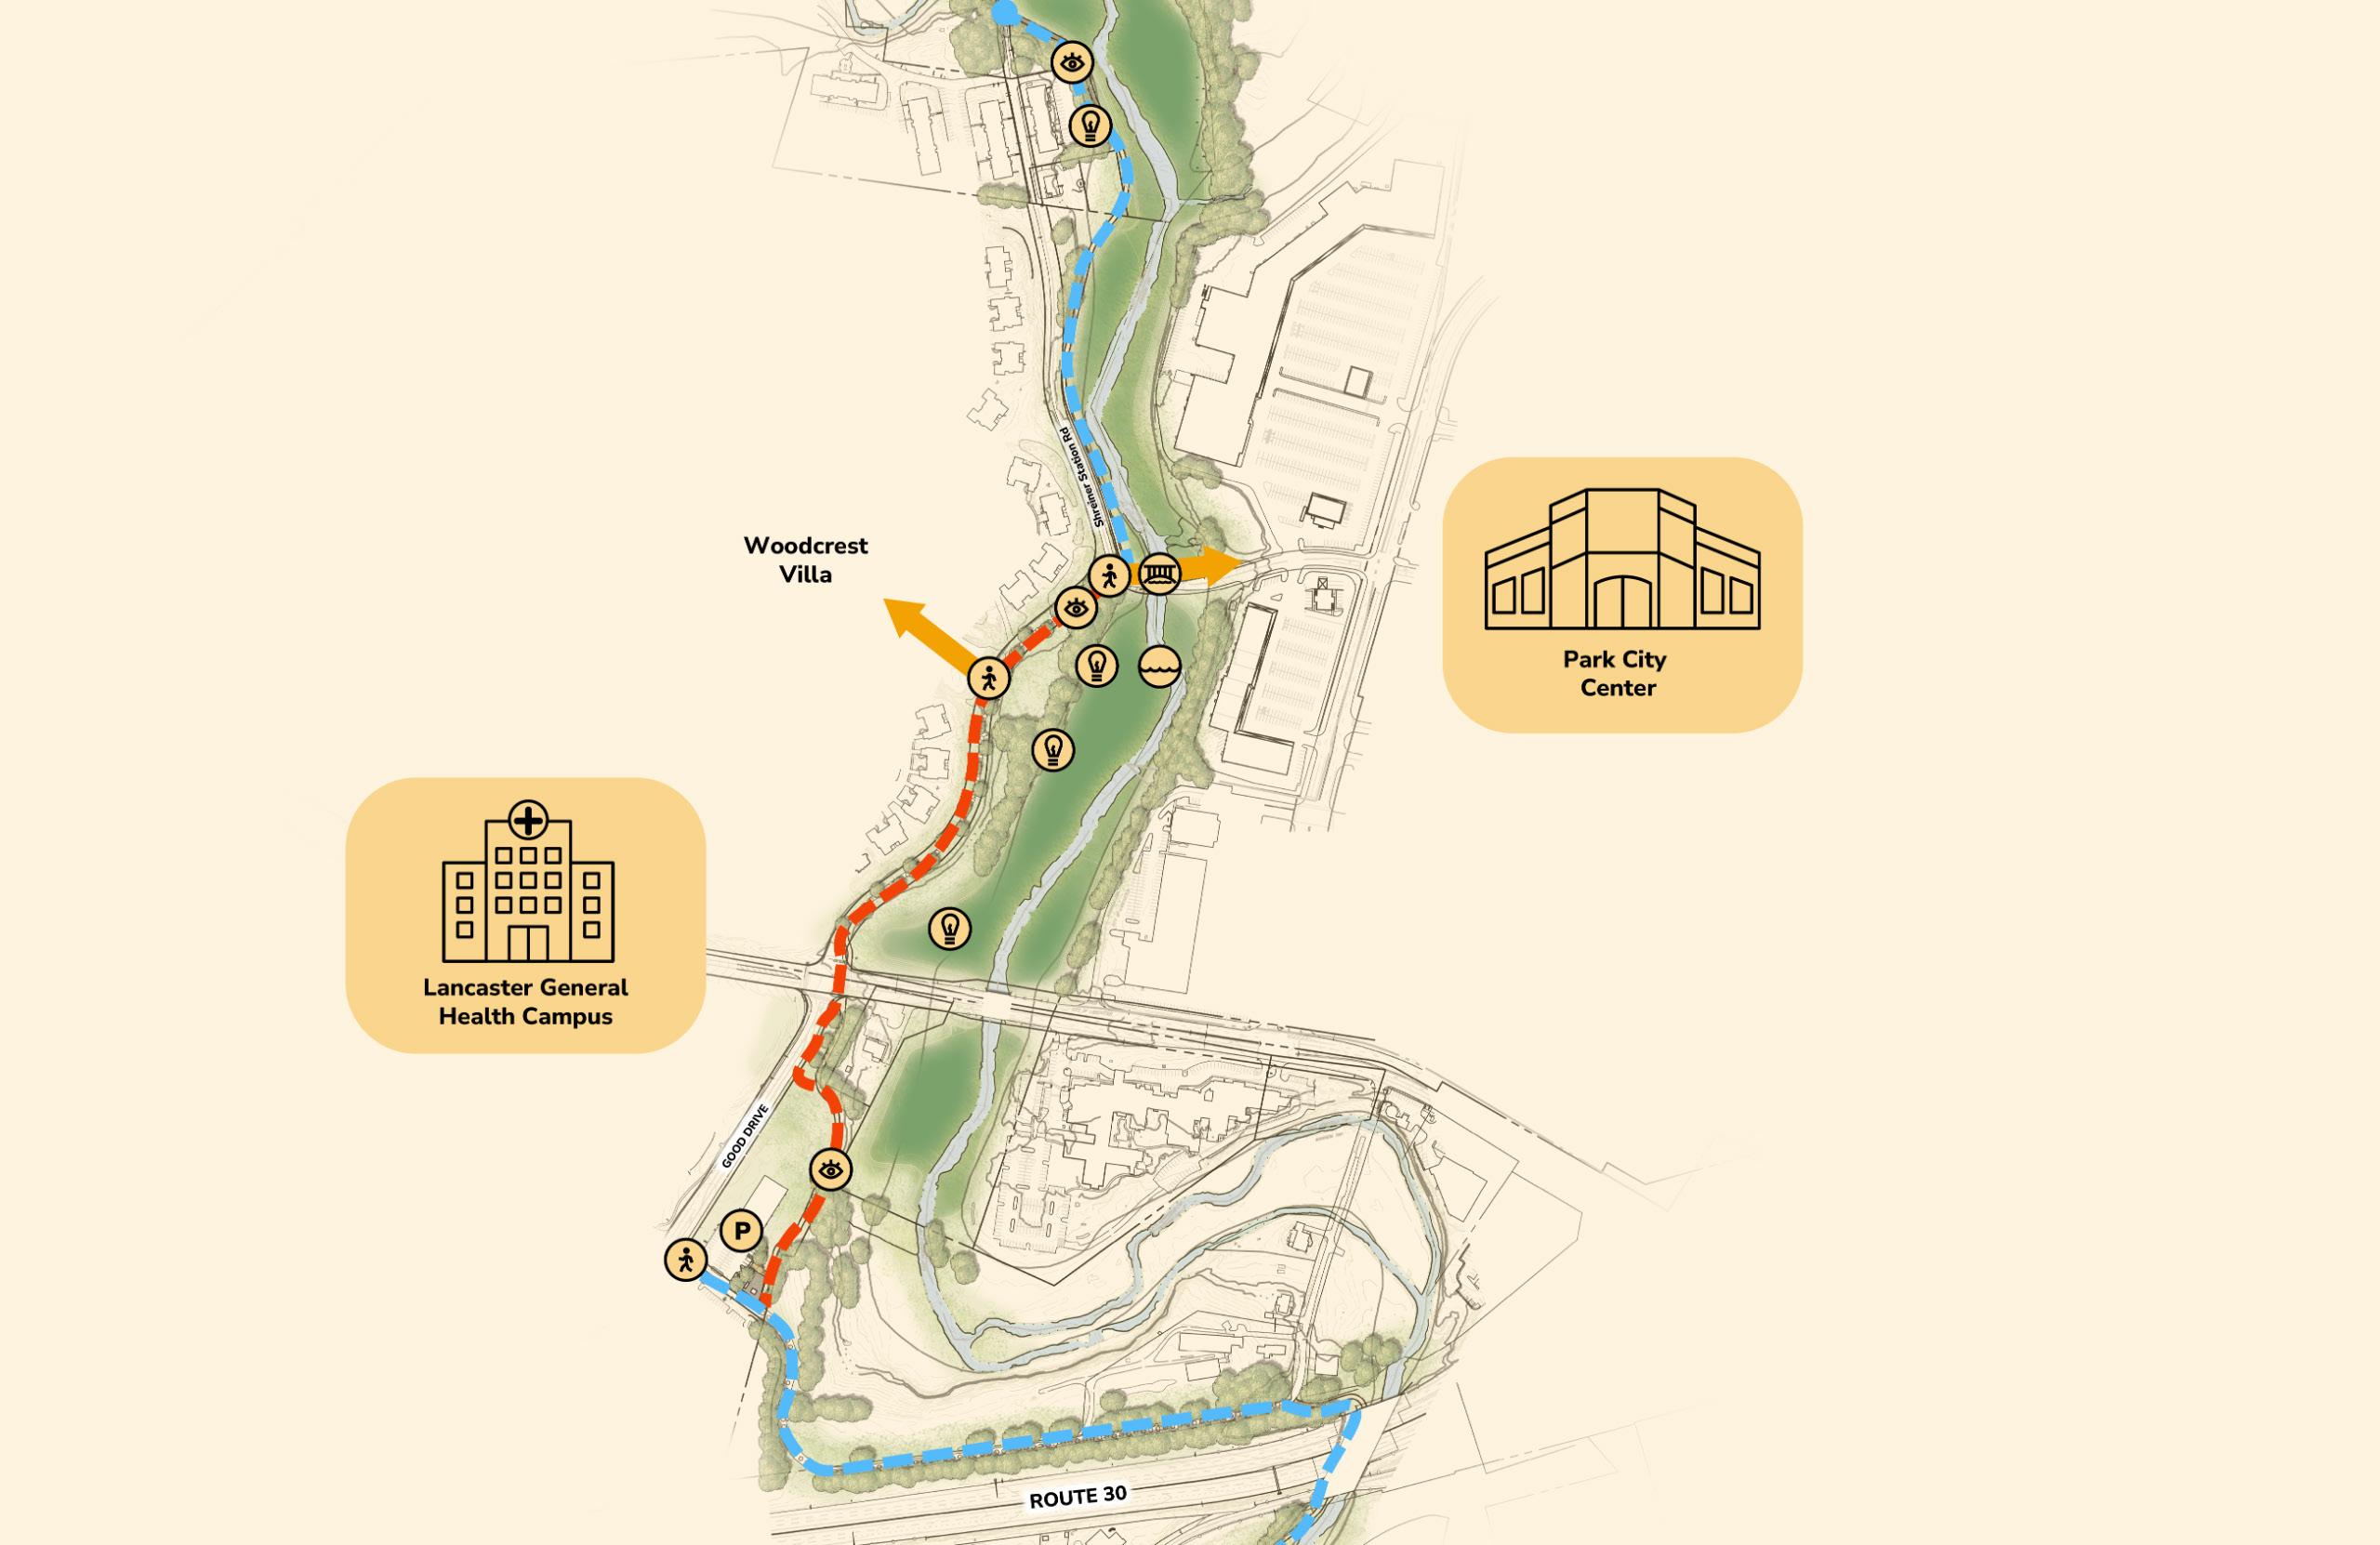

Figure 8: Map of the Blue Green Connector.
Regional Transportation
Park City’s accessibility is one of its biggest advantages. It sits just off US Route 30, which connects to York to the west and Philadelphia to the east. Local routes Manheim Pike and Harrisburg Pike connect directly to downtown Lancaster. Driving from downtown to Park City takes about 15 minutes. The Red Rose Transit Authority (RRTA) Route 8 bus line also provides transit access from downtown to Park City, with a trip duration of about 25 minutes long.
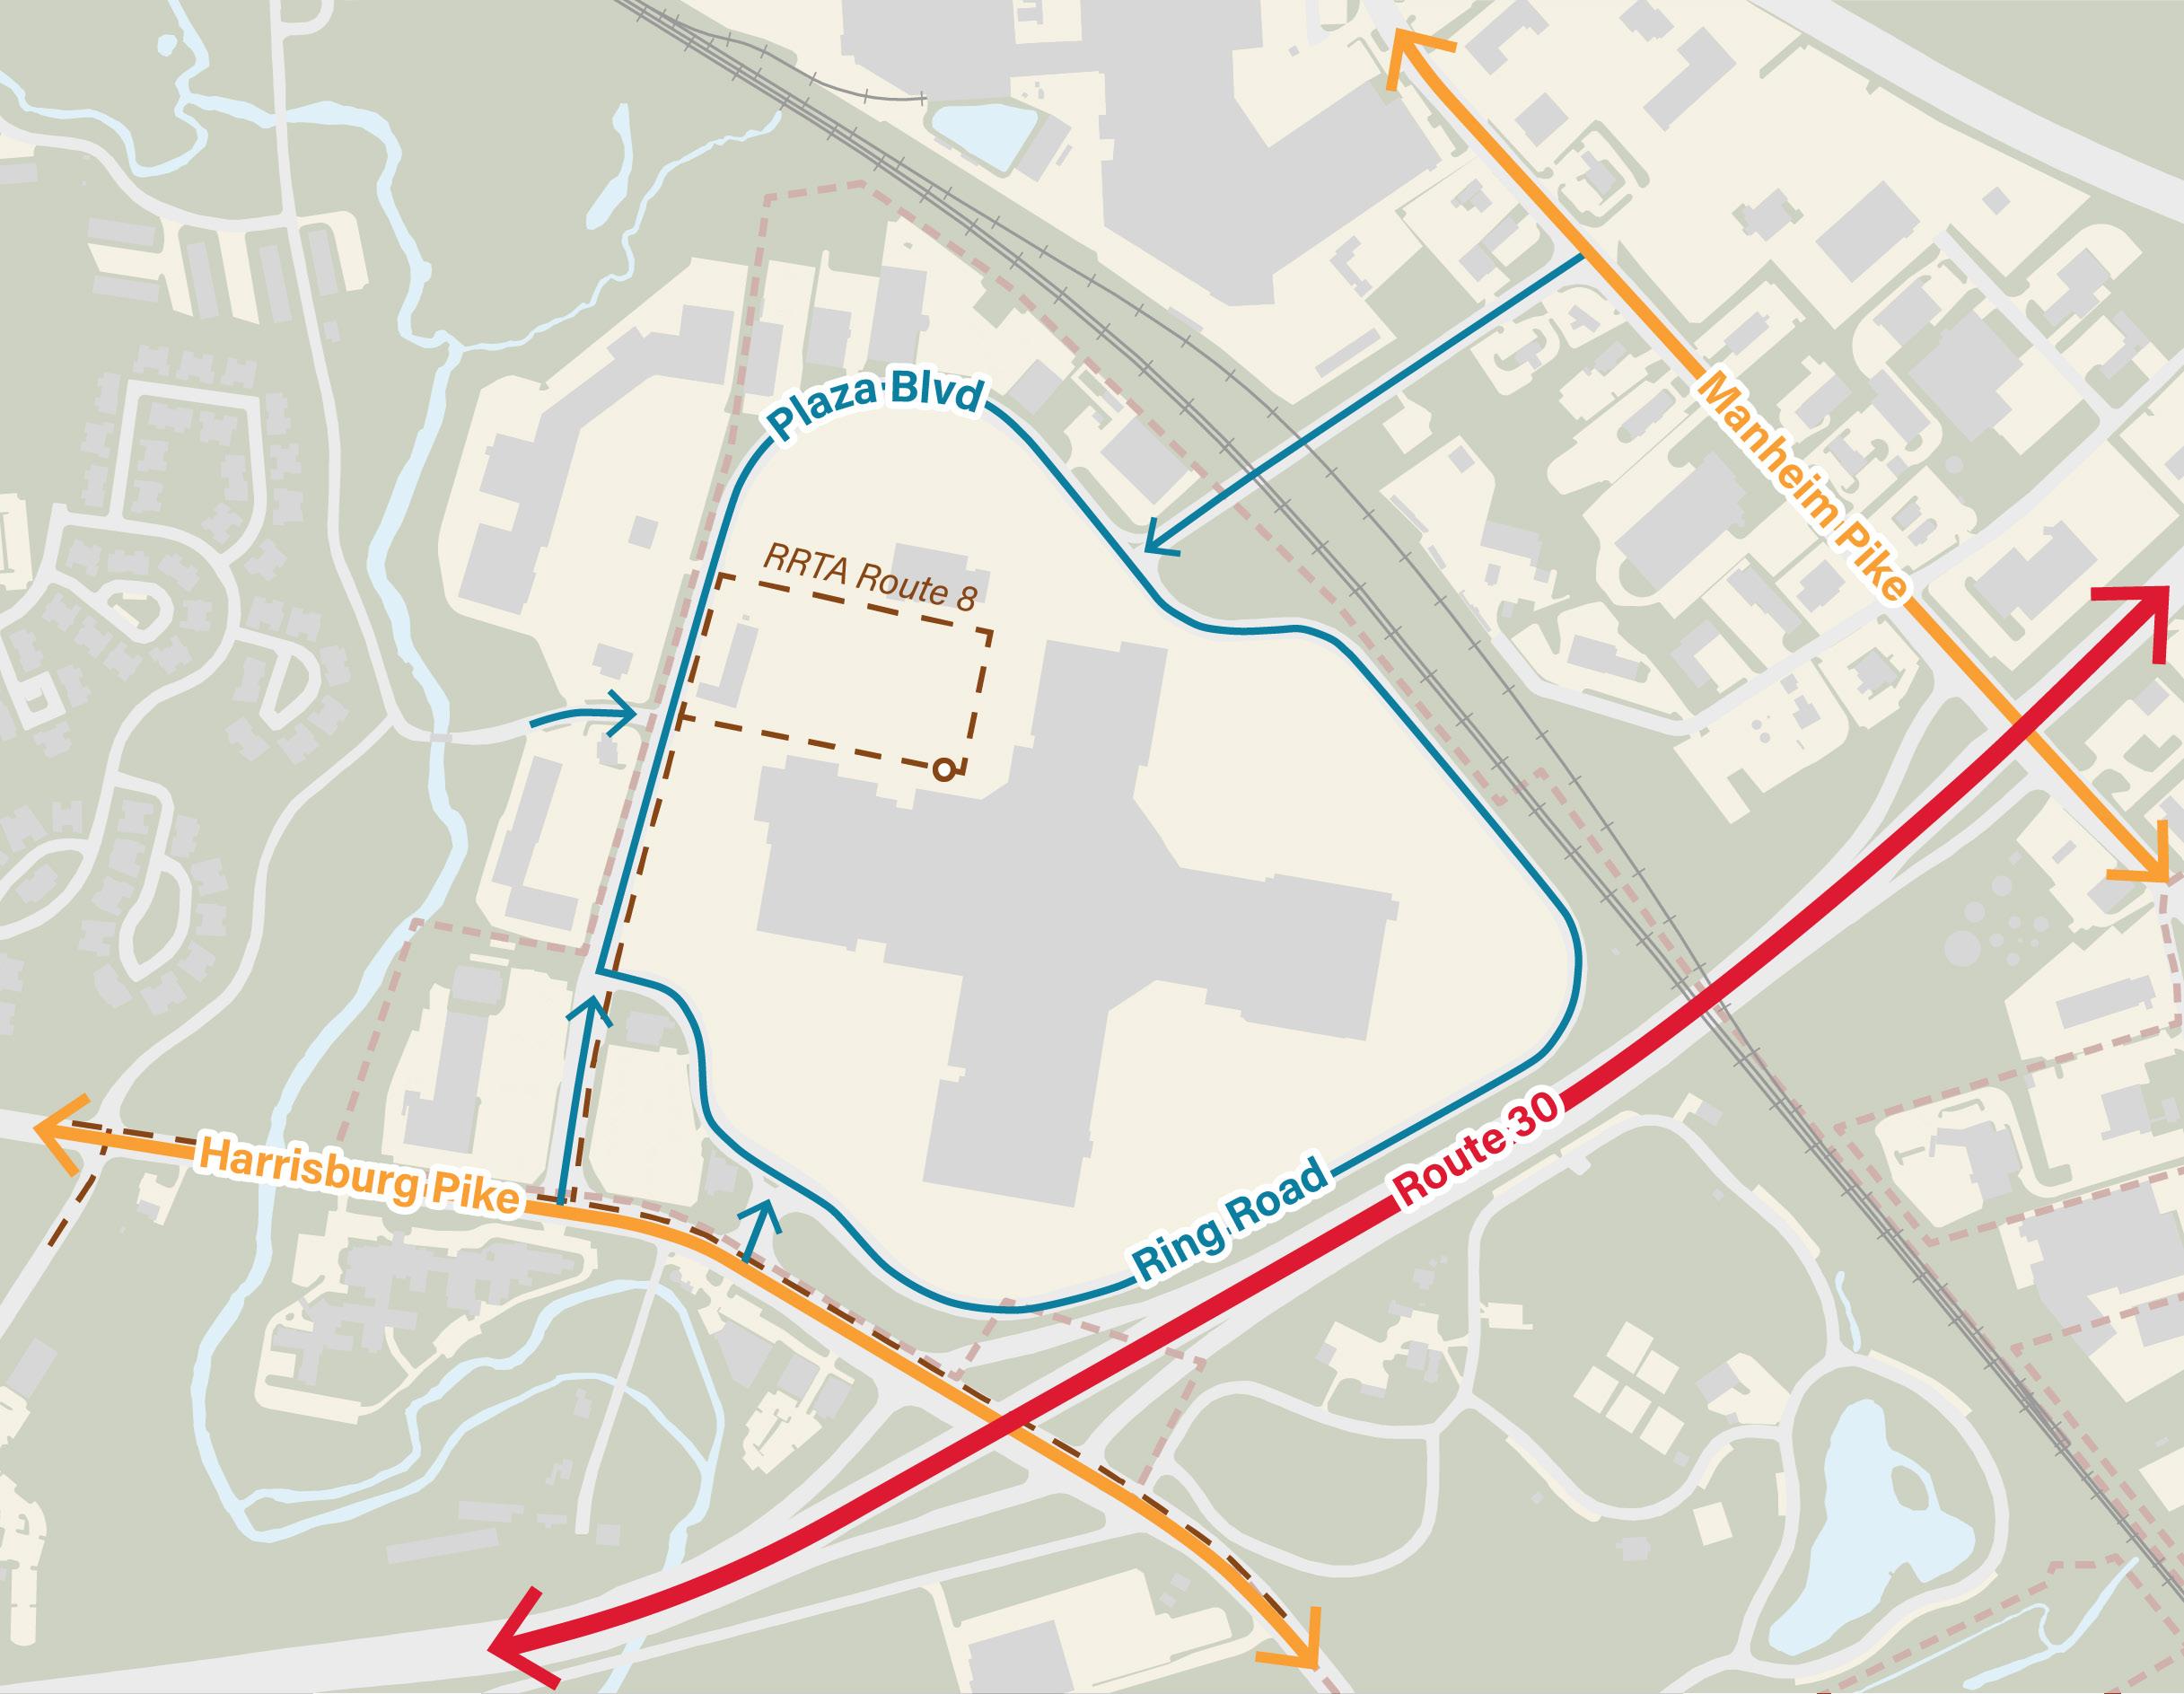
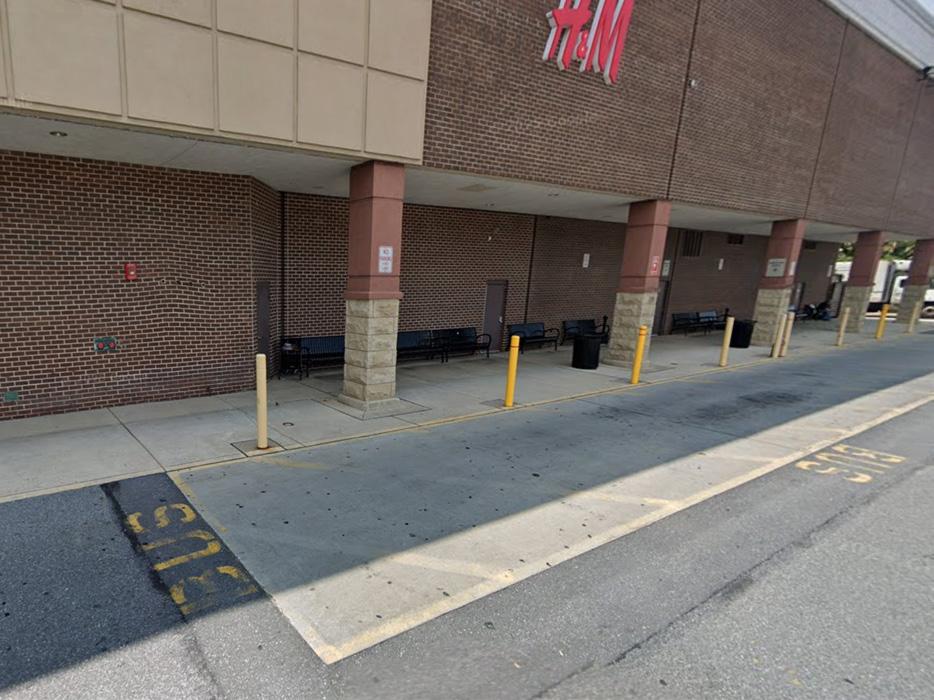
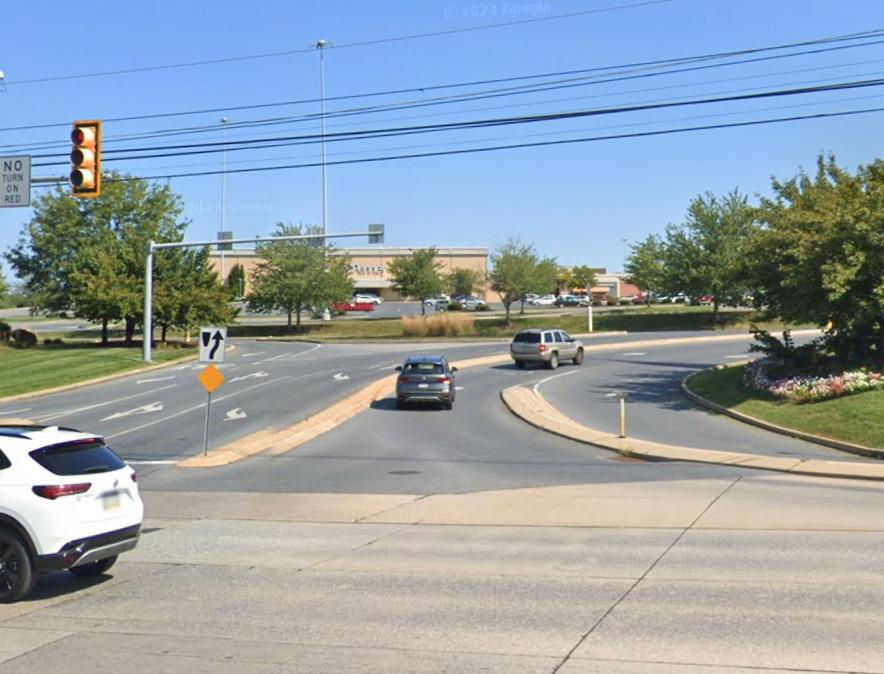
Figure 9: Regional transportation to Park City Site.
Downtown Lancaster
Downtown Lancaster Philadelphia York
Figure 10: Route 8 bus stop.
Figure 11: View from Harrisburg Pike, looking Northeast.
Comprehensive Plans
Lancaster City Comprehensive Plan (2023)
The city’s comprehensive plan, Our Future Lancaster, identifies Park City Center as a major redevelopment opportunity area through Policy PB-11. The comprehensive plan specifically calls for a Small Area Plan to help facilitate community and economic development objectives. The plan recommends the addition of housing and walkable, mixed-use development at the Park City site. The overall themes of the plan are inclusion, sustainability, and opportunity. Our project directly supports all three and aligns itself with existing city planning goals.
Lancaster County Comprehensive Plan (2018)
Lancaster County’s comprehensive plan, Places2040, emphasizes infill development and redevelopment within the county’s Urban Growth Areas (UGAs). The plan recognizes vacant land as a critical resource, encouraging density and compatibility with surroundings. The plan aims for 85% of new development to occur within UGAs, and Park City is clearly located within the Urban Growth Area of Lancaster City and its adjacent suburbs. Our recommendations for the Park City site align with the county’s objectives for compact, mixed-use, and efficient land use. In addition, the consistency between city and county comprehensive plans provides strong policy backing for our redevelopment vision at Park City.
Figure 12: Our Future Lancaster (2023).
Figure 13: Places2040 (2018).
Three Scenarios

Scenario Planning
Business as Usual
Scenario One
Scenario Two
Scenario Planning
We have explored three development scenarios for Park City Center that reflect different the social, environmental, and economic outcomes. The Businessas-Usual Scenario considers Park City’s current layout and commercial land uses if continued into the foreseeable future. Scenario One incorporates housing at Park City Center and envisions improvement to its retail and commercial mix with sufficient pedestrian access and the addition of green space to better manage stormwater. Scenario Two reconfigures Park City Center as town center that blends housing and commercial space in a pedestrian-friendly design with ample green space.

Business as Usual
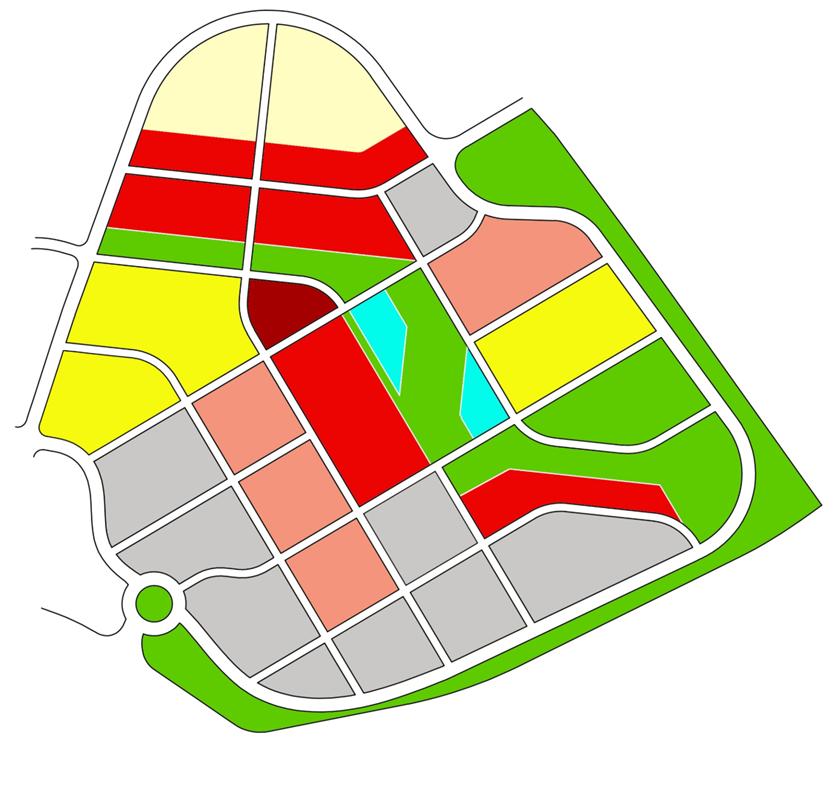
Figure 14: Layout of Park City Center under three scenarios.
Scenario One
Scenario Two
Business as Usual
The Business-as-Usual Scenario for Park City provides a baseline of urban design, environmental performance, social function, and economic activity. In other words, the Business-as-Usual Scenario offers a look at how Park City Center could be expected to contribute toward Lancaster City’s goals for environmental quality, social inclusion, and economic development for the foreseeable future. Since Park City Center opened in 1971, there has been only one major renovation to the mall in 2008. We are not aware of any proposed upgrades to the mall or additional proposed land uses for the site.
Land Use and Zoning
Park City Center lies within the largest of Lancaster City’s 10 separate C-3, Regional Commercial zoning districts (see Figure 15). C-3 districts are highway-oriented and located in areas isolated from residential districts.
The Lancaster City Zoning Hearing Board is responsible for hearing and granting special exceptions, provided reasonable conditions and safeguards are approved for a use not permitted by right but listed as a special exception in the zoning ordinance.
The Lancaster City Council is responsible for hearing and granting conditional uses, provided reasonable conditions and safeguards are approved for a use not permitted by right but listed as a conditional use in the zoning ordinance. The Lancaster City Council may seek guidance from the Lancaster City Planning Commission.
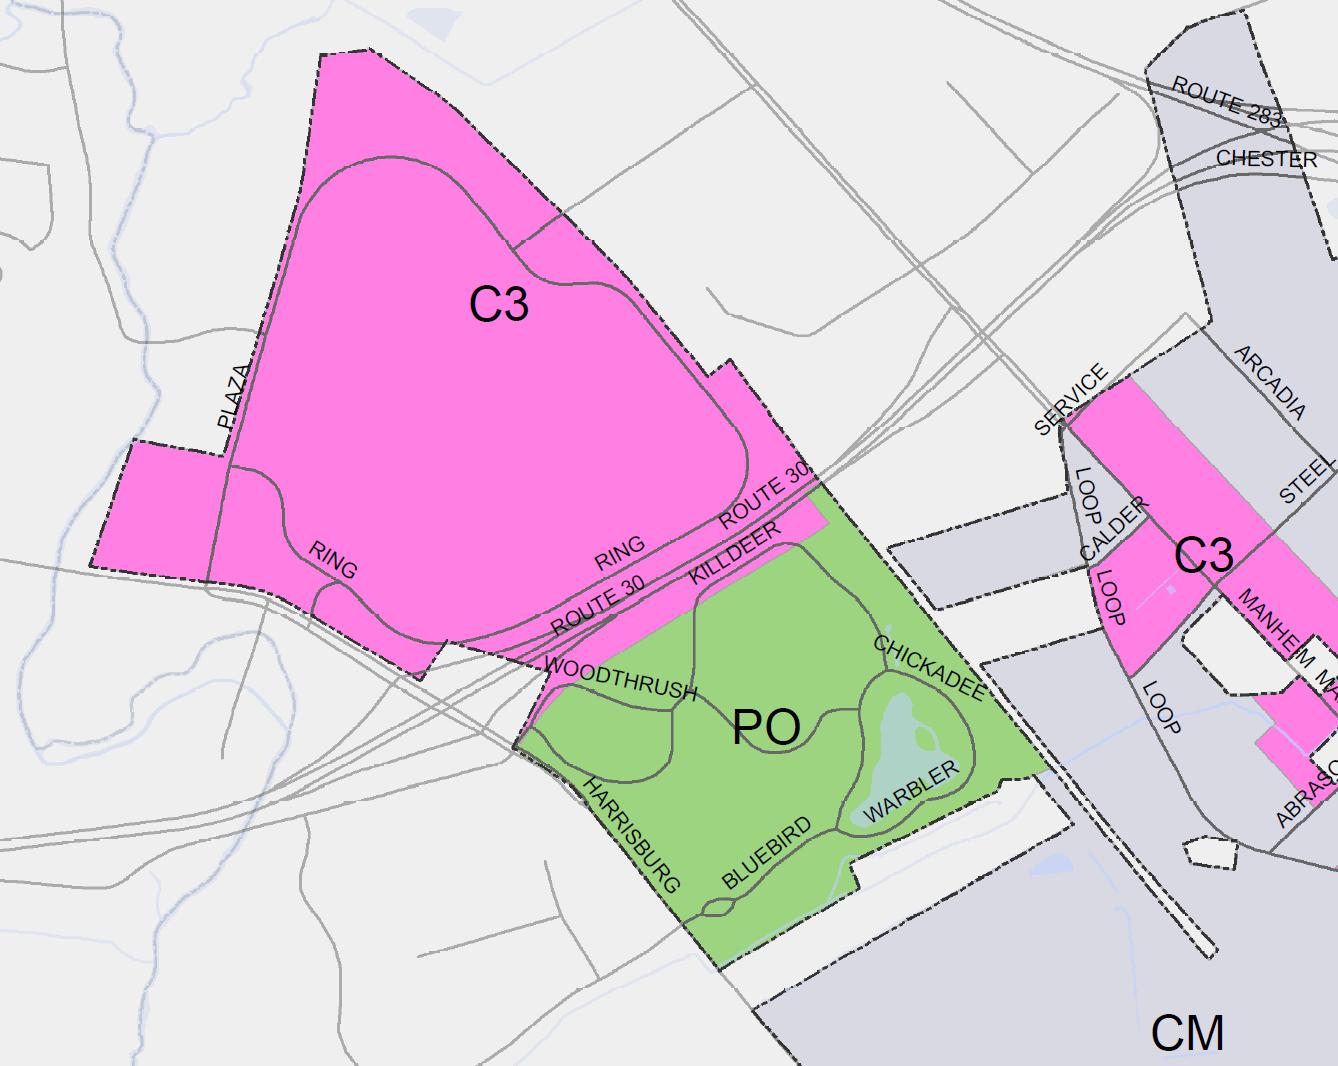
CM—Central City
C3—Regional
PO—Park/Open Space
Figure 15: Park City Center is located in the C-3 zoning district in the northwest corner of the City of Lancaster across from Long’s Park (Zoned Park/Open Space).
Pawn shop
Microbrewery, brewpub, or microdistillery
Educational and scientific research agency
Adult-oriented business
Parking lot (permitted by right as an accessory use)
Printing or binding at an institutional scale
Sports stadium or arena Swimming pool College or university
Parking garage/deck (permitted by right as an accessory use)
Private/restricted or commercial park, tot-lot, playground, or game court or course
Natural and manufactured gas or oil storage and distribution
Motor freight terminal without size restriction or over 150,000 square feet of lot area
Telecommunications antenna or tower (freestanding or affixed)
Telephone exchange station, electricity substation, water pressure control station, gas pressure regulator station, sewage pumping station
Manufacturing, processing, and/or packaging of animal and/or vegetable products or beverages other than 1.) distilling, rectifying, blending, brewing, processing and packaging of liquors, malt liquors, wines and brandy, or 2.) microbrewery, brewpub, or microdistillery
Conditional
Uses
Retail store, other than uses listed separately and not including gasoline or auto sales without size restrictions (above 150,000 square feet of floor area)
Table 2: Primary permitted uses in C-3 Zoning District.3
Existing Strengths and Weaknesses of Park City Center
In developing ideas for a Small Area Plan, we evaluated the strengths and weaknesses of the current urban design, transportation, and environmental conditions at Park City (see Table 3). The strengths include:
● The mall houses the retail stores under a single roof which provides climate control and shelter from the elements;
● Good highway access with a central location in the county; and
● A hub of consumer activity producing revenue for the owner of Park City Center and property tax and wage tax revenue for the City of Lancaster.
Weaknesses of Park City Center feature:
● Unattractive exterior building design for the mall;
● An absence of housing;
● A huge amount of impervious surface and unused parking space;
● A lack of key retail stores and services; and
● A decrease in visitors since the beginning of the COVID-19 pandemic.
Strengths
Urban Design Unity of the Mall building.
Weaknesses
Dated design, lacking sense of place.
Shortage of outer display windows.
Excessive parking area. Ugly circus and tire store.
Housing None
Environment Enclosed mall. Climate control.
Transportation Good highway access. Central location in the county.
No housing and no housing allowed in C-3 zoning district.
Excessive impervious surface and poor stormwater management.
Lack of green space and trees. Poor connections to Long’s Park.
Limited transit service. Not accessible by pedestrians. Not bike-friendly. Excessive parking area.
Retail and Services Mix 130 stores. Little vacant space.
Private & Public Revenue
Robust consumer activity. Important source of city property tax revenue.
Table 3: Strengths and weaknesses of the current Park City Center.
Lack of key retail: grocery, pharmacy. Lack of key services: bank, health clinic.
Decline in consumer visits 2019 to 2025. Uncertain future public revenue.
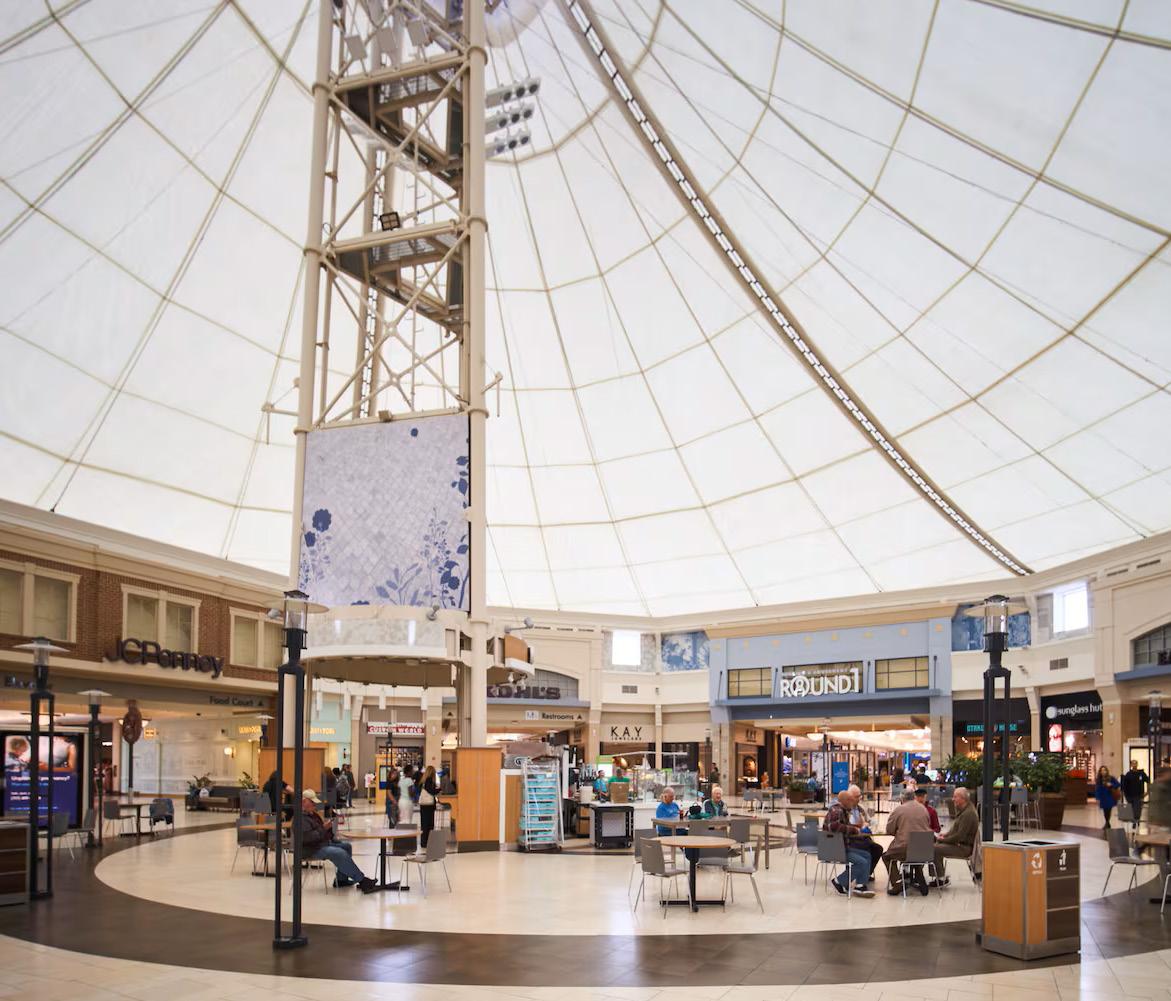
Unwelcoming Design
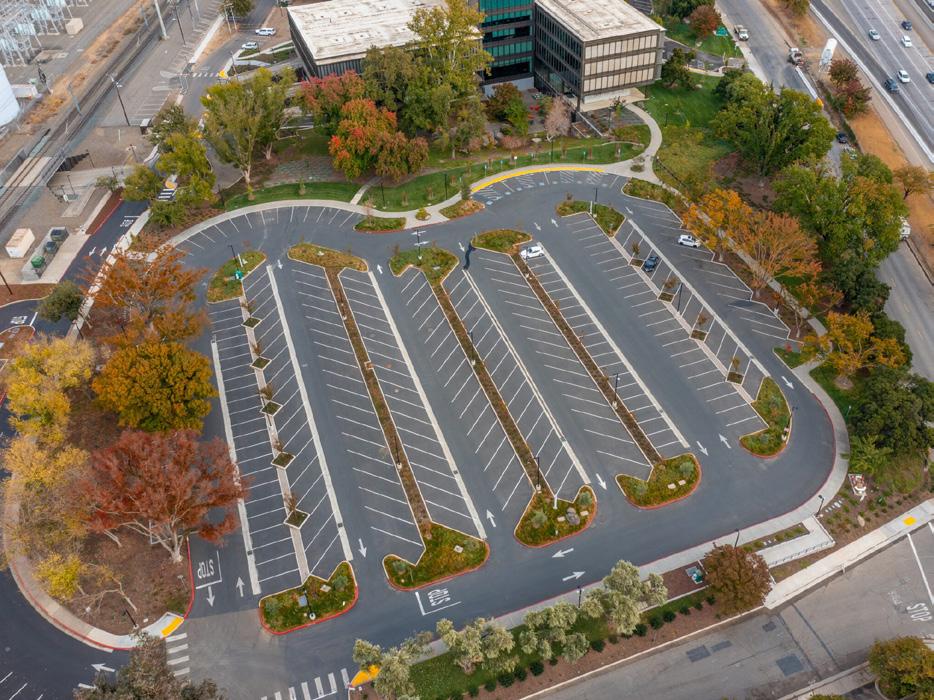
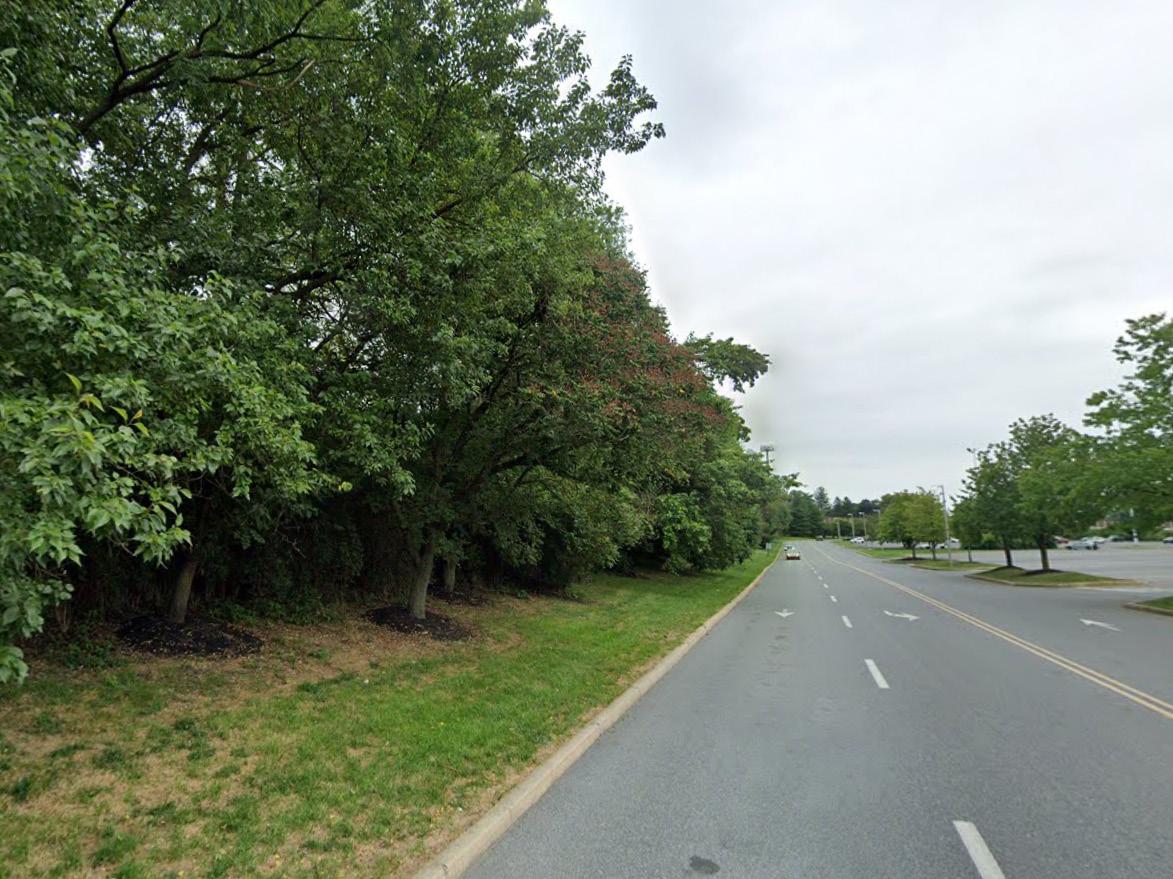
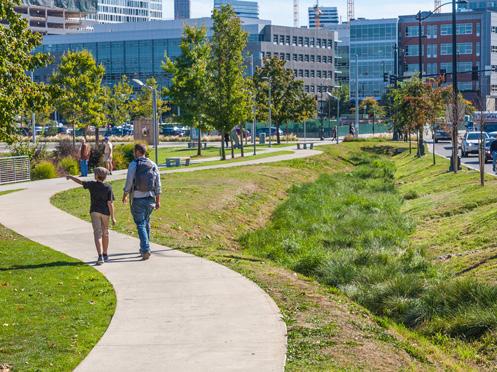
Park City Center embodies typical characteristics of a 1970s mall. Figure 16 shows the layout of the Park City site and the mall. Highway access is key, but it excludes pedestrians and makes bike access difficult. Park City is served by a ring road that connects the site to major highways, including Route 30, Harrisburg Pike, and Manheim Pike. The parking at Park City, however, is excessive and uninviting. There is no green space in the parking areas, and pedestrians must walk from their cars across a sea of asphalt to the mall (Figure 17). The connections to neighboring green spaces, Long’s Park and the Blue Green Connector, are weak or non-existent.
The brick and concrete walls of the exterior façade with limited (if any) windows limit natural light inside the mall, prevent pedestrians from seeing inside, and give the mall an isolated feel on the inside (Figure 18). The food court offers a limited selection, with many options serving the same types of fast-food cuisine. Additionally, many of these establishments are not well-known brands that visitors would recognize. The bus stop at Park City lacks signage, which may prevent visitors from using this service.
All told, the design of Park City reflects a very car-oriented era, which lacks a sense of place. The mall building was last upgraded in 2008 but has few outward facing stores and plenty of blank walls on the exterior.4 The parking is excessive and visually unattractive. It is also unsuccessful in managing stormwater and lacks trees and green spaces that could not only mitigate stormwater runoff but also help counter the urban heat island effect caused by extensive asphalt. Connections to Long’s Park and the Blue Green Connector could make Park City more inviting to pedestrians and cyclists.
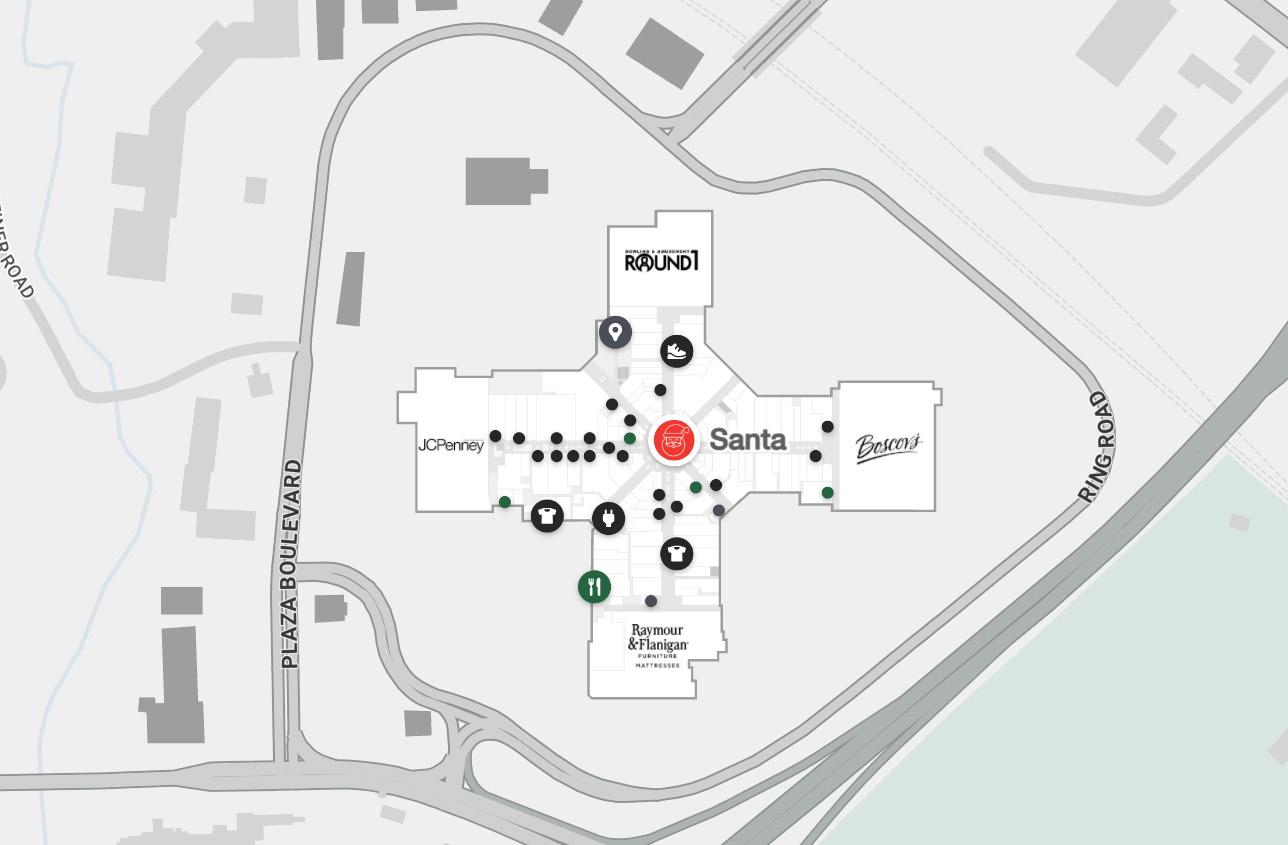
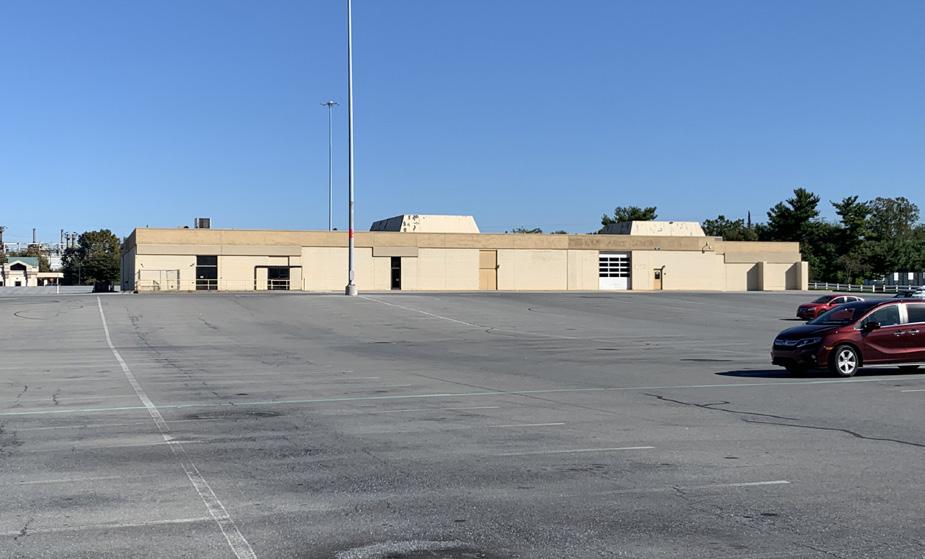
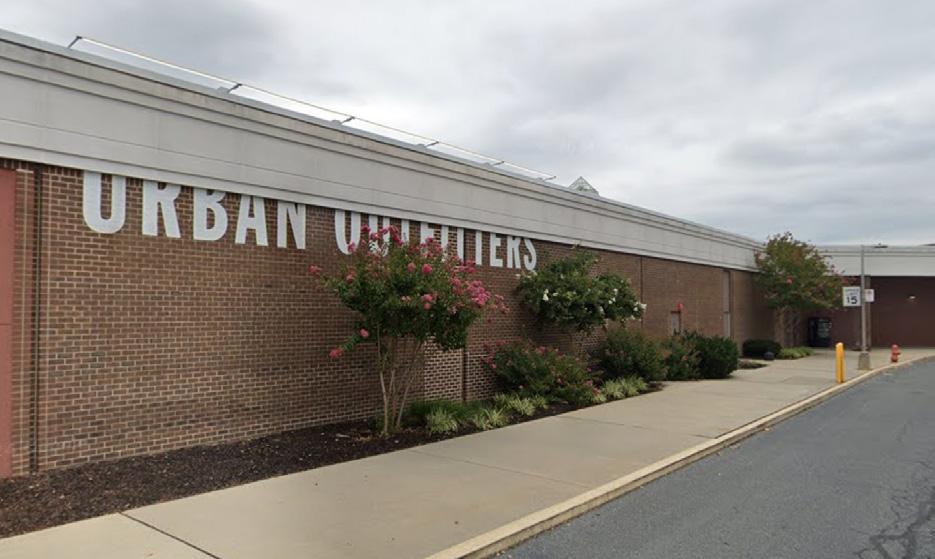
Figure 16: Diagram of Park City Center layout.
Figure 17: Acres of asphalt parking lot around the bunker-like circus building.
Figure 18: Uninviting brick wall exterior of Park City Mall.
Excessive Parking
Park City currently has 5,912 parking spaces. The gross floor area of the mall is approximately 1,710,460 square feet. This means there is one parking space for every 289 square feet of mall area (see Table 4), which closely aligns with the current zoning ordinance requirement of one parking space for every 250 square feet of gross floor area. However, based on site visits and anecdotal evidence, the parking spaces along the perimeter of the Park City site and in the northern area surrounding the circus building remain vacant for most of the year. Visitors typically park close to the mall to minimize the walking distance. Imagine walking across hot asphalt on a humid 90-degree day in the summer or on an icy day in the winter.
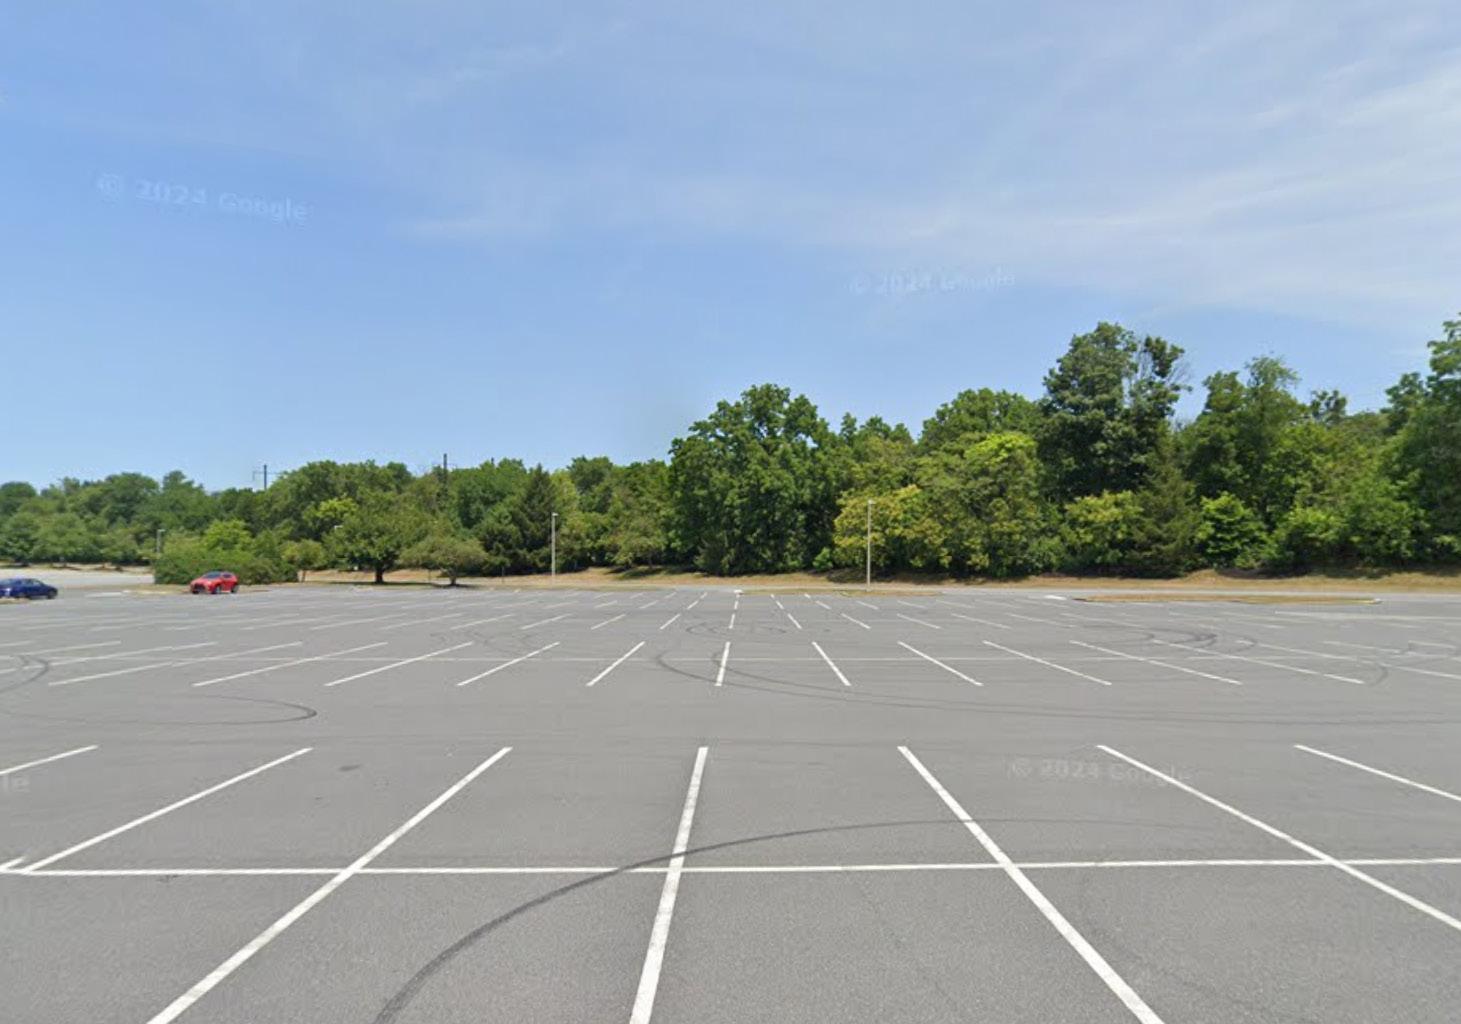
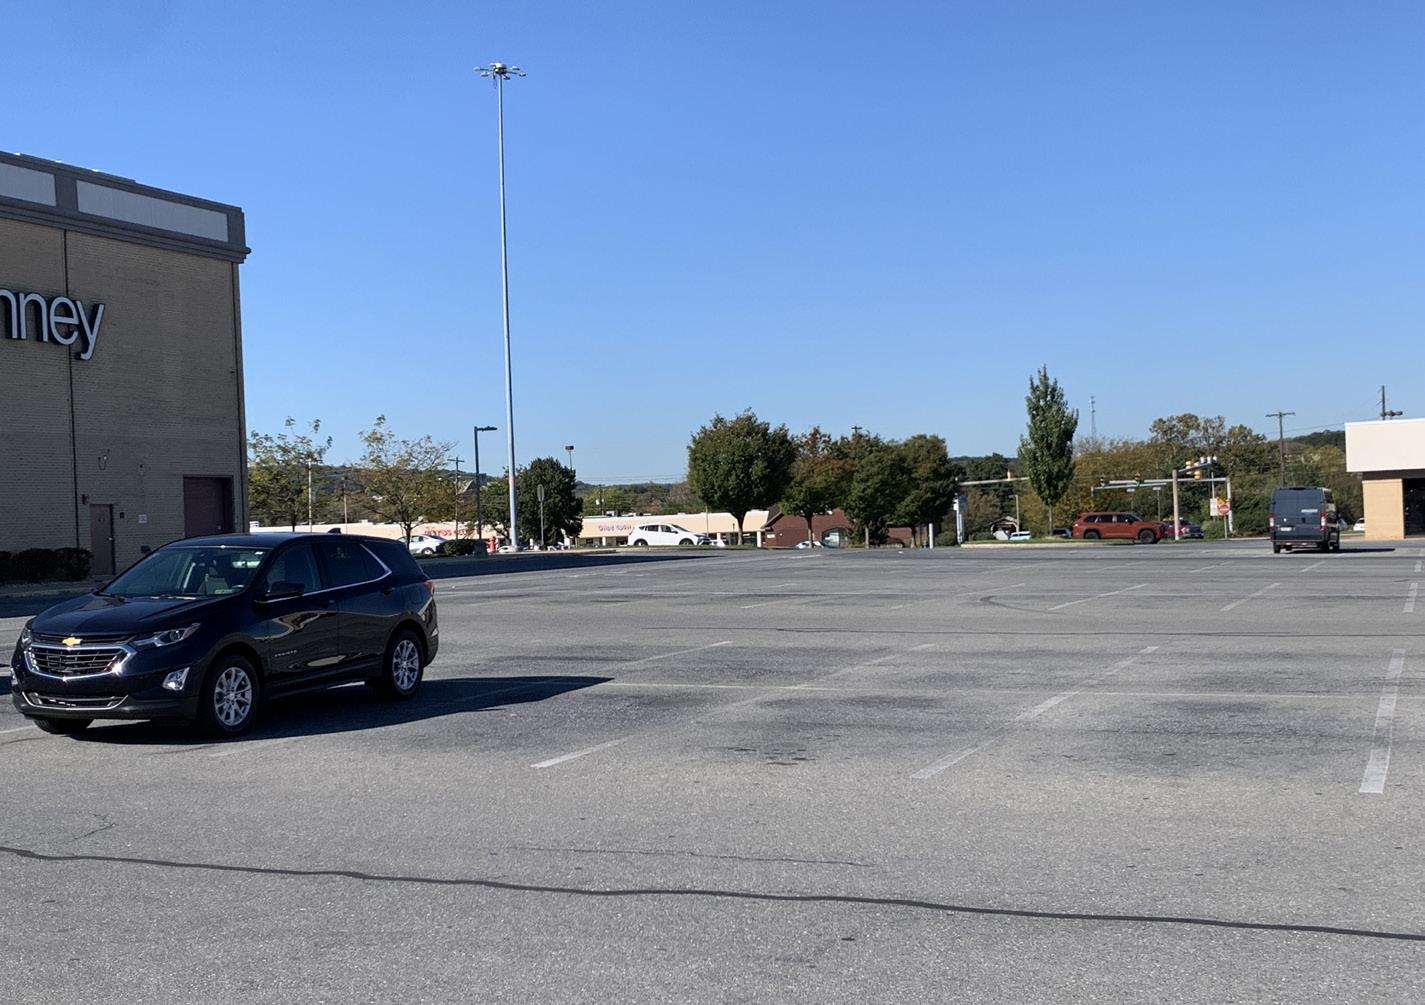
Figure 19: Unused parking spaces.
Figure 20: A long walk from parking to the mall.
Table 4: Current parking area and spaces.5
No Housing
The current C-3 zoning regulations at Park City Center prohibit all residential uses.6 Residential development in Park City could provide numerous benefits, including increased foot traffic, demand for new types of businesses and services, higher tax revenue for the city, and more effective use of underutilized parking spaces. Permitting residential development could also support the city’s goal of adding more housing and the county’s goal of promoting development within the urban growth areas.
Pedestrian-unfriendliness
Navigating to and from Park City can be challenging for pedestrians. Pathways in parking lots, force pedestrians to walk in the driving lanes to access both the mall and their cars. There are acute safety issues for pedestrians trying to access places outside Park City, such as Long’s Park, the Blue Green Connector, and Parkview Plaza. The scant streetscape greenery along the ring road and in the parking lots (see Figure 21) also make Park City less visually appealing and engaging. Walking outside of the mall, pedestrians are met with parking spaces, driving lanes, and concrete walkways with very little color or direction (see Figure 21), which hinders any sense of place or identity at Park City.
Given that the land area at this site is nearly as large as Downtown Lancaster, any plan [involving Park City Center] should include housing and aim to create a vibrant walkable place with a mix of uses. Development ideas could include a medium to high density town center and/or the phased integration of multifamily buildings with larger commercial stores.
—Our Future Lancaster, p.97
Figure 21: Parking lot design problems.
Sparse Trees
Pedestrian-unfriendly
Excessive Parking Intersection
Commercial and Retail Mix
Park City maintains a fairly robust tenant mix. The combination of large anchor department stores, and inline retail, dining, and entertainment opportunities caters to the commercial demands of visitors of all ages. Over the years, commercial units have changed hands to accommodate the evolving needs of a changing population. Under current conditions, vacancies can only be filled as they become available. This has been Park City’s strategy over the last 54 years, and it has been typically a slow process of change. As of October 2025, out of the 133 available commercial units, Park City had only two vacancies. This low vacancy speaks to the strong desire of existing businesses to operate at Park City. However, Park
City’s ability to adapt its retail and commercial mix may be limited, which in turn affects the shopping experiences of visitors. Day-to-day retail, such as a grocery store or pharmacy is missing as are services such as a bank or an urgent care facility.
Under the Business-as-Usual Scenario, Park City Center will continue to function as a superregional, anchor-store-driven mall, combining large department stores and big-box anchors with a mix of inline retail, dining, and entertainment tenants. The leasing strategy under this model assumes that tenants are replaced only as spaces become vacant, with no structural changes to the main mall building.
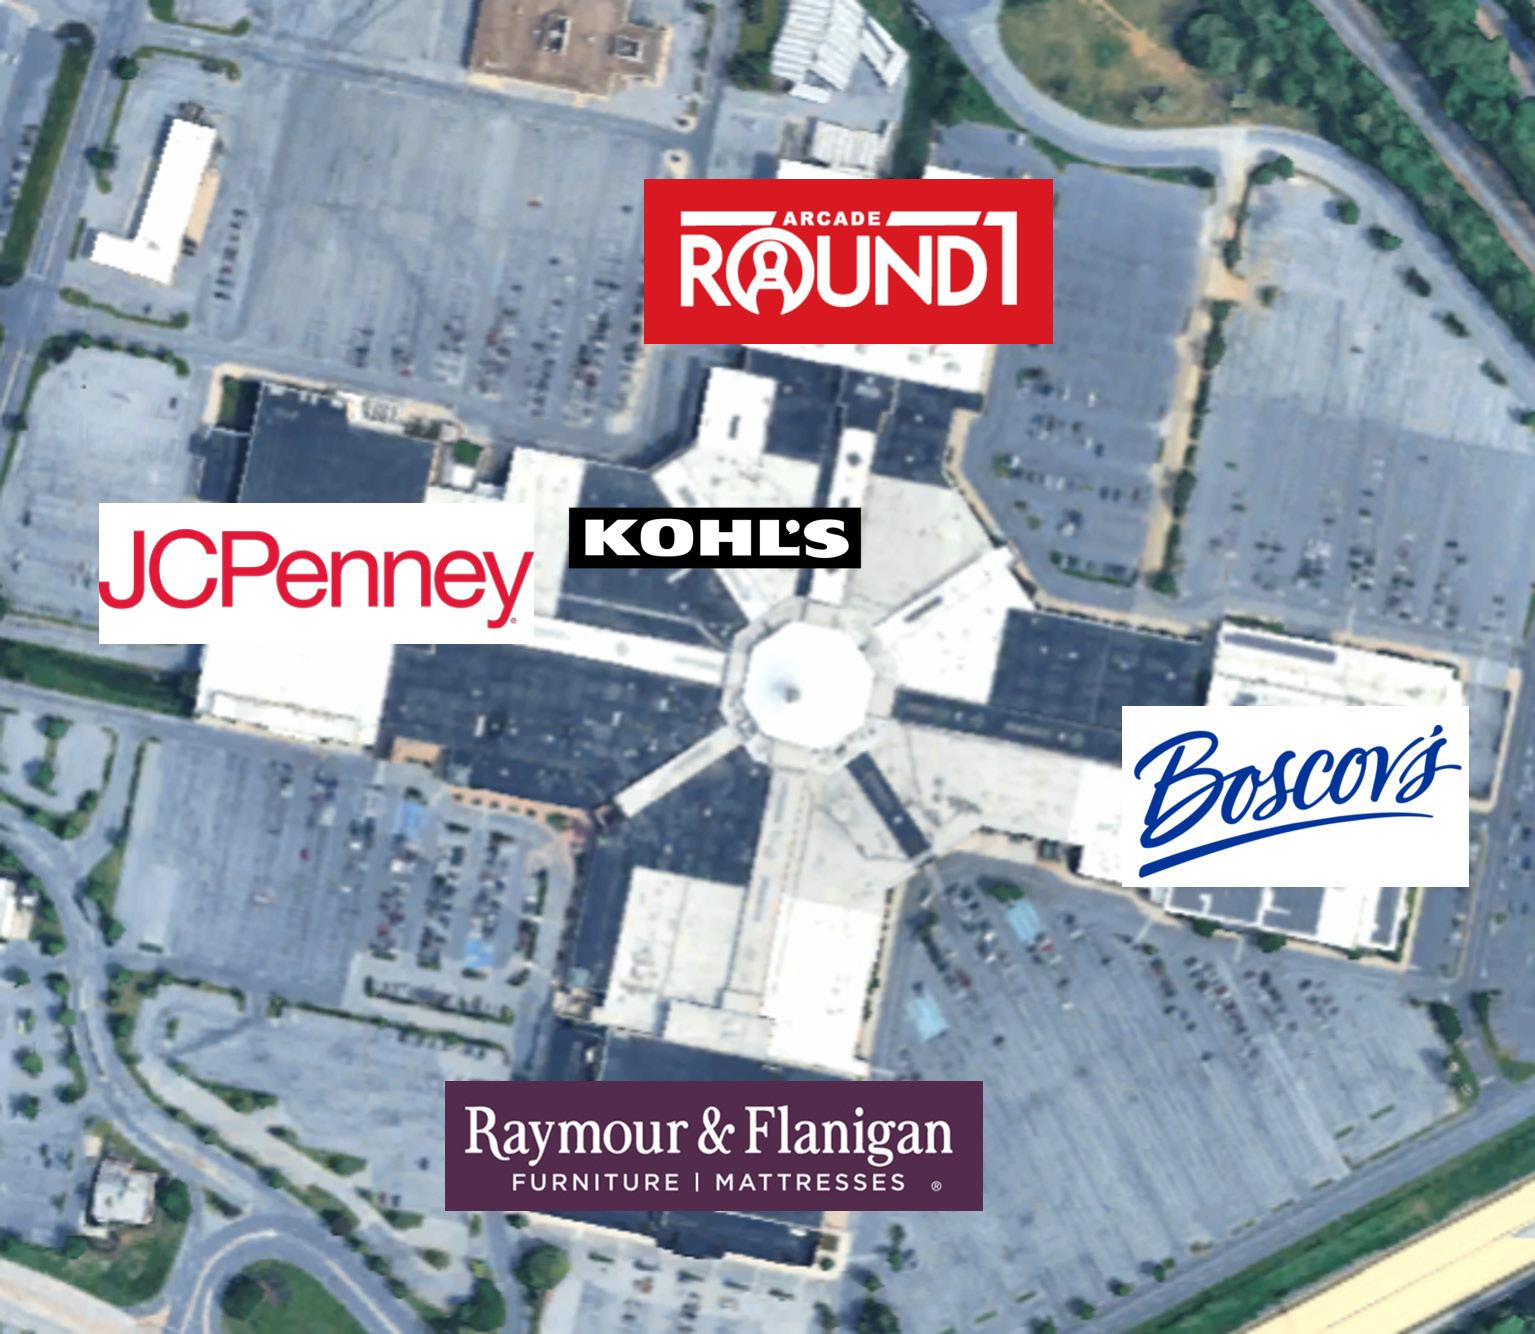
The mall currently has five anchor stores: JCPenney, Kohl’s, Boscov’s, Raymour & Flanigan Furniture & Mattresses, and Round1 Bowling & Arcade (see Figure 22). In total, there are 123 unique brands occupying 133 commercial units, including 117 storefronts and 10 kiosks. Several brands operate both a storefront and one or more kiosks. In addition, six non-retail service units are present: Lancaster County Academy, Little Pasitos Bilingual Preschool, Mall Management Office, Security Office, ATM, and Bitcoin Depot.7
2
Figure 22: Park City Mall’s five anchor stores.
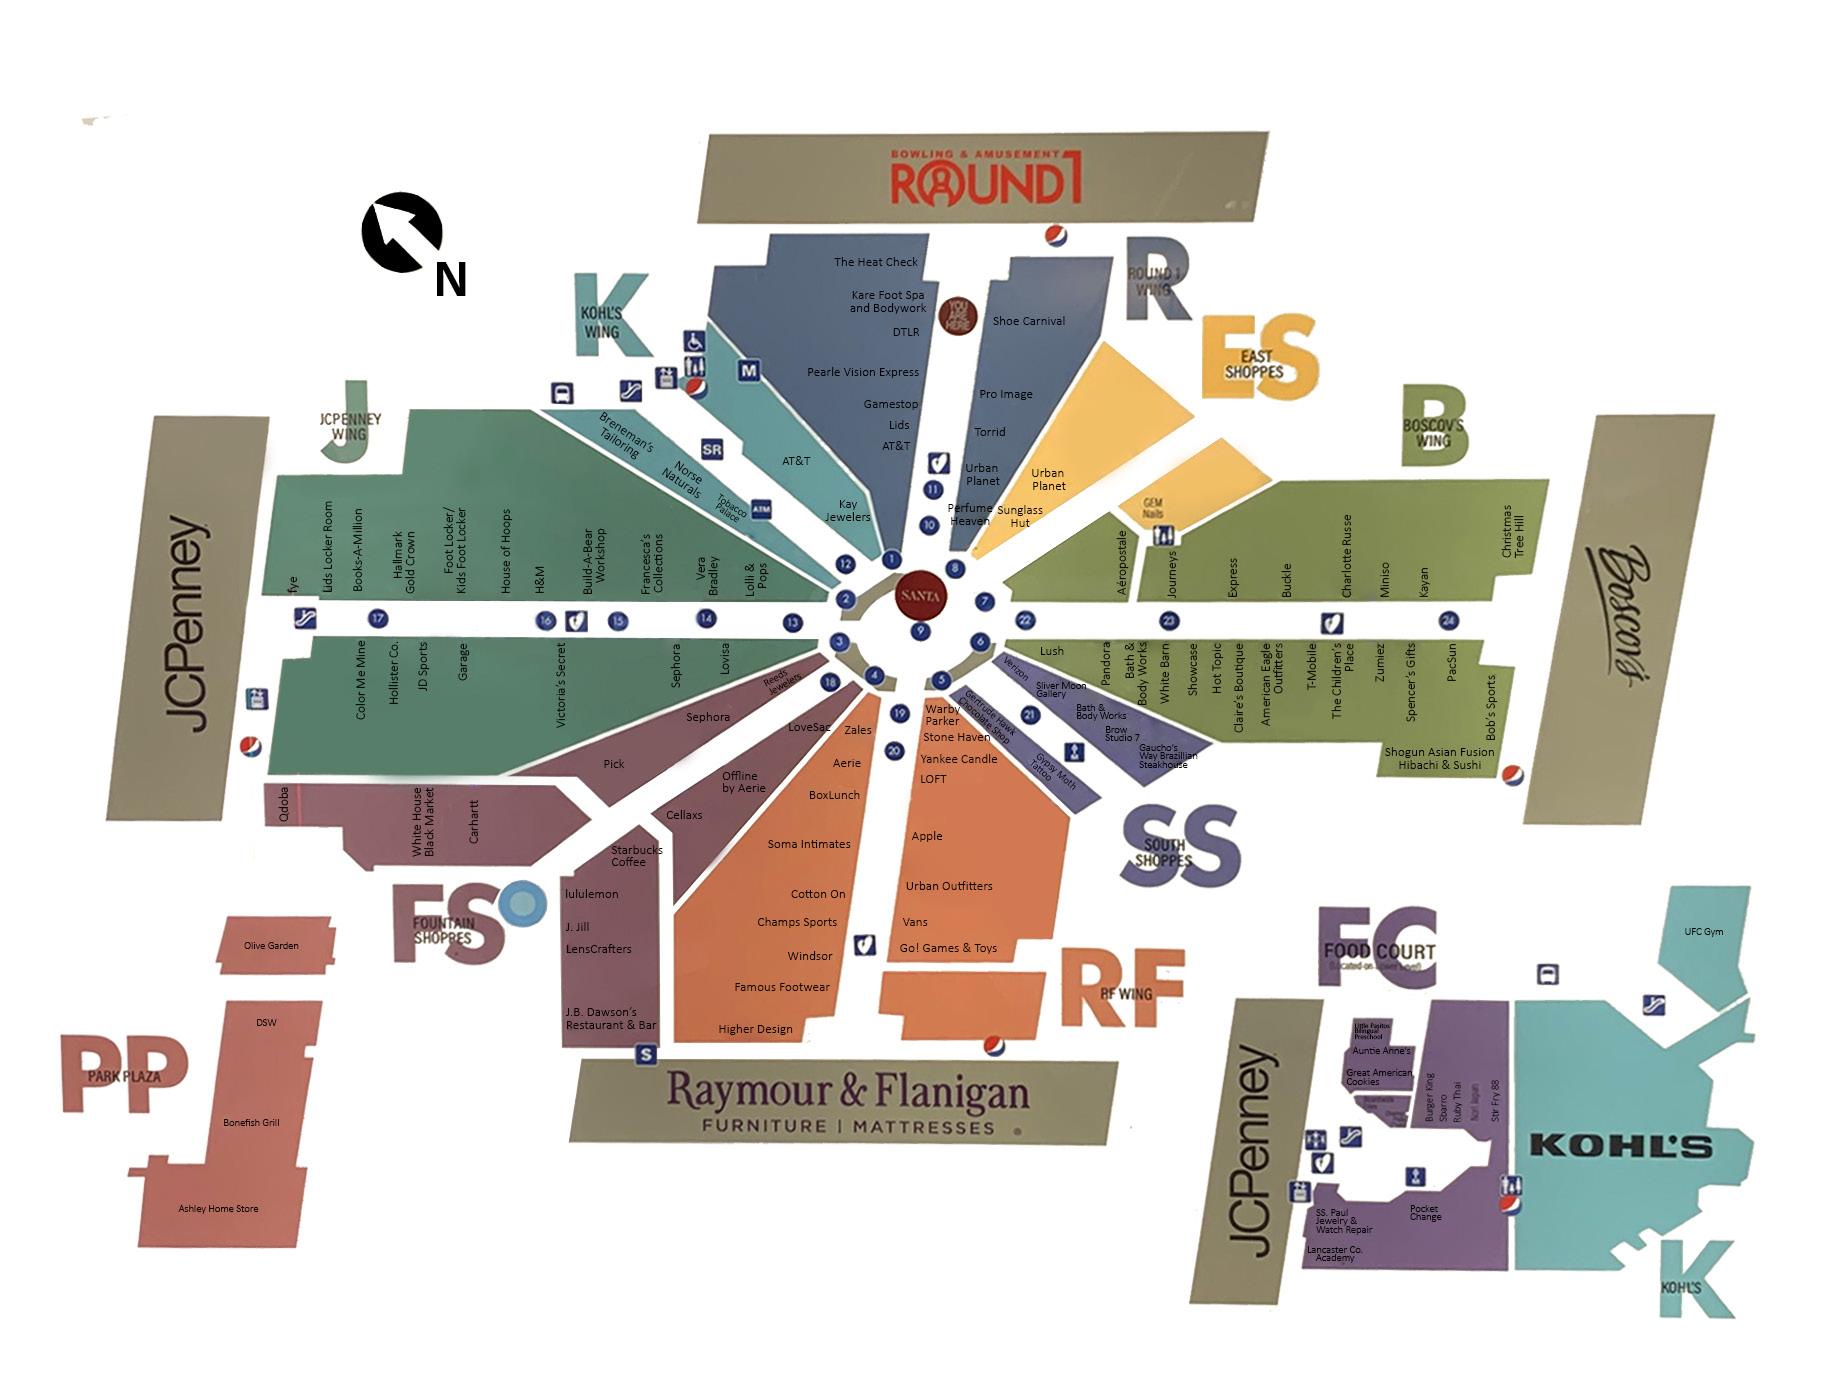
Figure 23: Park City Mall’s interior layout.
The tenant mix by number of commercial units shows 42 percent are Apparel and Accessories, 19 percent Beauty, Home, and Electronics, 17 percent Food and Beverage, 15 percent Entertainment and Specialty, 4 percent Service and Non-Retail, and 3 percent Retail Anchor. This distribution clearly demonstrates Park City Center’s heavy dependence on the apparel and accessories sector as its primary retail category. When examined by floor area, this pattern becomes even clearer. Fifty-one percent is Retail Anchor, 25 percent Apparel and Accessories, 12 percent Entertainment and Specialty, 5 percent Beauty, Home, and Electronics, 4 percent Services and Non-Retail, and 3 percent Food and Beverage. Because retail anchors JCPenney, Boscov’s, and Kohl’s also have large apparel departments, the heavy focus on apparel is even more apparent. In short, much of the mall’s space is oriented toward retail apparel goods.
The retail environment at Park City Mall is overconcentrated in fashion-related consumption at a time when consumer behavior is shifting toward experience-based and mixed-use destinations. Park City’s foot traffic has declined 12 percent since 2019, reflecting fewer repeat visits, reduced evening activity, and declining performance among traditional anchor stores. Visitor counts at JCPenney have dropped 40 percent and by 8 percent at Boscov’s, highlighting that Park City’s continued dependence on clothing and accessory retail is a vulnerability. In sum, Park City’s current tenant composition, especially its reliance on Apparel and Accessory retailers, requires strategic adaptation and diversification for long-term financial sustainability.
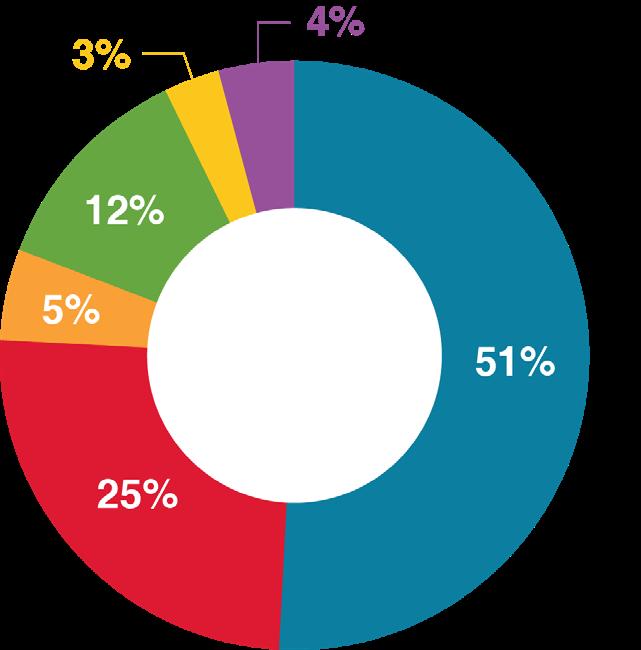
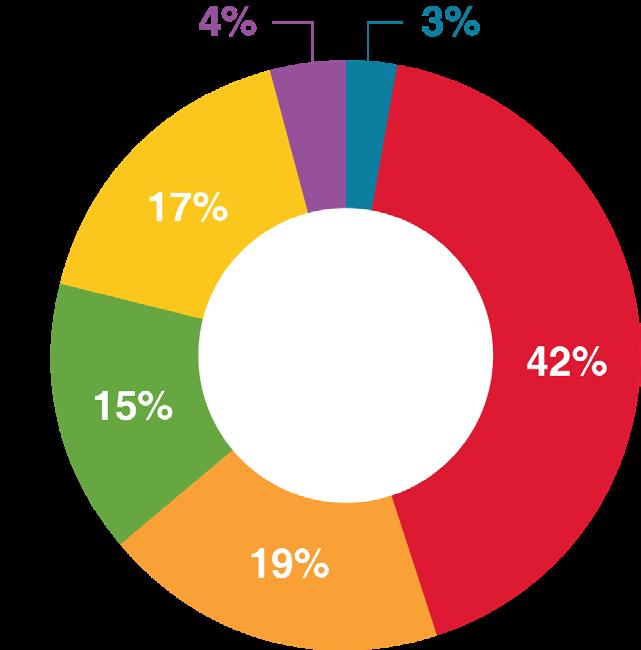
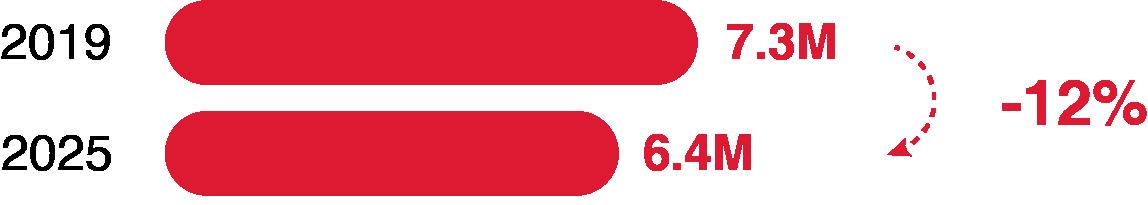
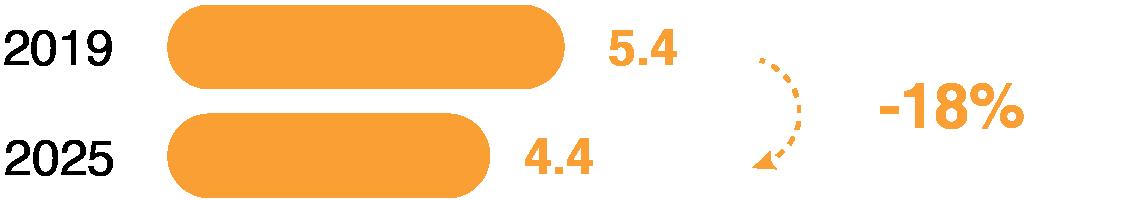


Figure 24: Tenant mix of Park City Center by square footage and number of units.
Figure 25: Total annual visits to Park City Center and average visitor frequency, 2019–2025.
Total Annual Visits
Average Visitor Frequency
Tenant Mix by Square Footage Tenant Mix by Number of Units
Transportation
Park City is a highly car-dependent destination. US Route 30 and Harrisburg Pike bound the southern end, while the intersections along Plaza Boulevard, which connect to outside of Park City and to Manheim Pike, are not accessible for pedestrians.
Park City is served by bus Route 8 of the Red Rose Transit Authority. This route runs from the Queen Street Station in downtown Lancaster and, in addition to Park City/Parkview Plaza, offers service to Wegman’s at The Crossings, Women & Babies Hospital, Lancaster General Hospital, and Penn State Health Lancaster Medical Center. This route operates between 6:00 AM and 10:30 PM, Monday through Friday, 7:00 AM and 10:30 PM on Saturday, and 10:00 AM and 7:30 PM on Sunday (see Table 5).
Although transit service operates during every hour the mall itself is open, several businesses are open beyond the end of service. Round1, for example, closes at 2 AM every day, limiting access to those without a car between 10:30 PM and 2 AM. Overall, the bus trip length and service frequency make driving a much more compelling choice when traveling to Park City.
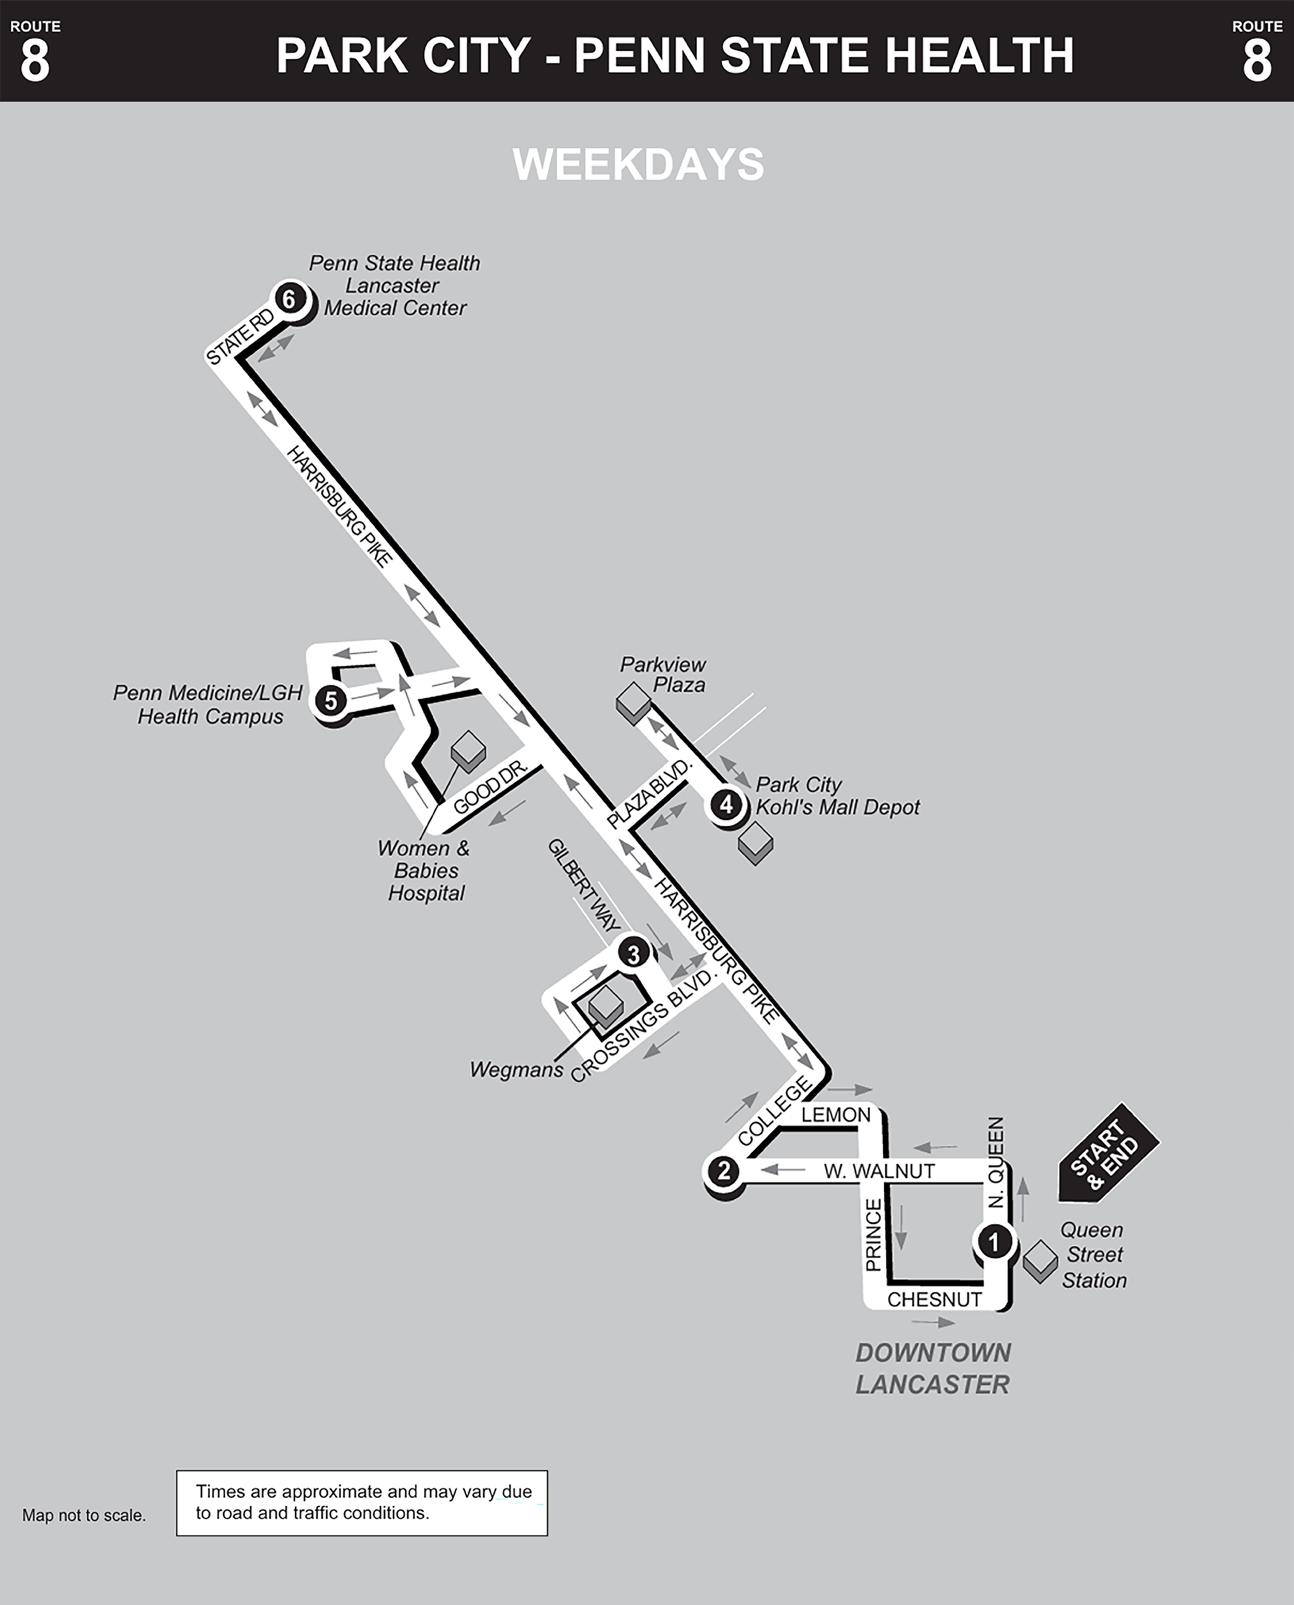
Figure 26: Bus Route 8 serving Park City.
Table 5: Route 8 Bus service operating hours, schedule, and frequency.8
Environment
The very large area of impervious surface at Park City poses a challenge to stormwater management, which is a priority for Lancaster City. With more than 50 percent of the site dedicated to parking, along with the roofs of the buildings, Park City has very little greenery. This translates to high stormwater management fees charged by the city, which cost $30.96 for every 1,000 square feet of impervious surface.9 Table 6 illustrates the stormwater management fee based on the current amount of impervious surface. The fee exceeds $100,000 annually, which translates to about $9,000 per month. To help offset stormwater management fees, the City of Lancaster offers credits to property owners who install green infrastructure and other mitigation measures, with the highest credit amount at 50%. However, Park City Center does not participate in this program, as it lacks green infrastructure. Both environmentally and financially, the owner of Park City could benefit from adding green infrastructure in the form of green space, trees, and stormwater retention areas. The City of Lancaster and Lancaster County would also benefit from the improved stormwater management.
Also, Lancaster County’s air quality issues could be addressed through the addition of more greenery, with the added benefit of beautification and fostering a sense of place.10 The County is currently out of compliance with the federal Clean Air Act. Finally, nearby US Route 30 is noisy, and the mall lacks sound screening which could be addressed in part with tree planting along the Ring Road opposite Route 30.
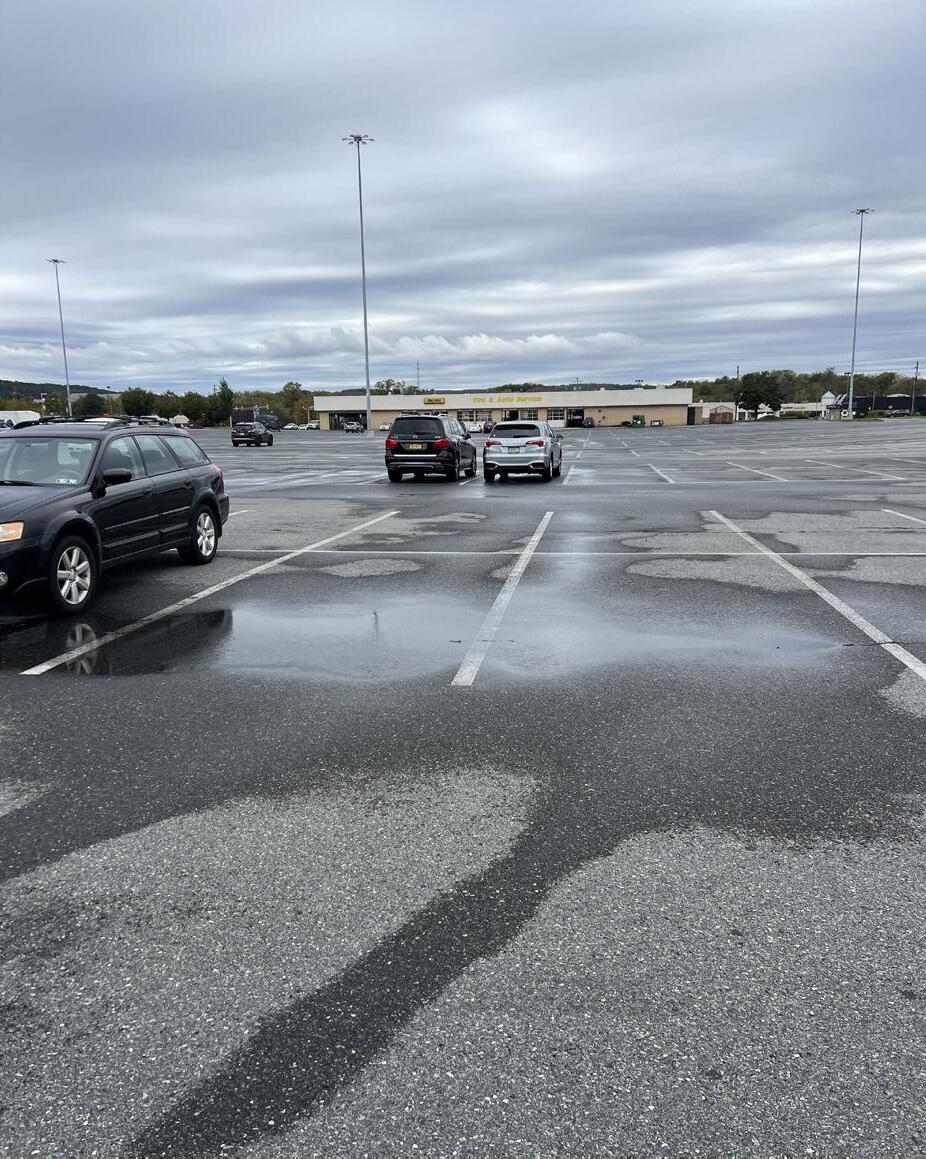
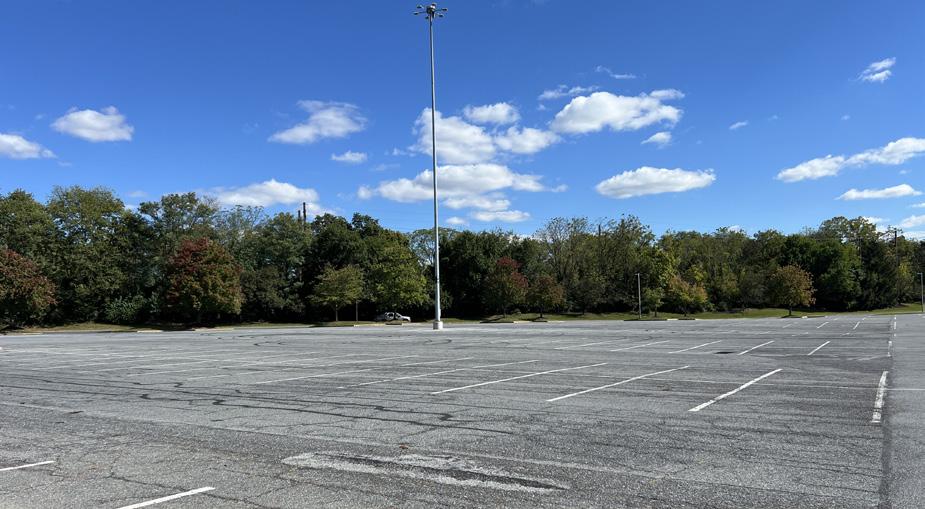
Table 6: Estimated Stormwater Management Fee (SWMF) of Park City Center based on calculations indicated by the City of Lancaster Stormwater Management Fee Policies and Procedures Manual.11
Figure 27: Ponding in the Park City parking lot.
Figure 28: Treeless parking lot at Park City provides no stormwater management.
Figure 29: Proximity to noisy US Route 30.
Chesapeake Bay Watershed
Lancaster County lies within the Chesapeake Bay Watershed, the largest estuarine watershed in the world, characterized by a very large land-to-water ratio. The Bay Watershed encompasses parts of six states (Delaware, Maryland, New York, Pennsylvania, Virginia, and West Virginia), well as the entirety of Washington, D.C. (see Figure 30). It spans over 64,000 square miles and is home to more than 18.5 million people. Lancaster County lies entirely within the Susquehanna River Basin, all of which is located within the Chesapeake Bay Watershed. The Chesapeake Bay Program is a federal–state organization dedicated to helping restore the water quality of the Chesapeake Bay and promoting environmental, economic, and social sustainability. Therefore, stormwater management in Lancaster County is crucial for meeting the goals of the Chesapeake Bay Program.
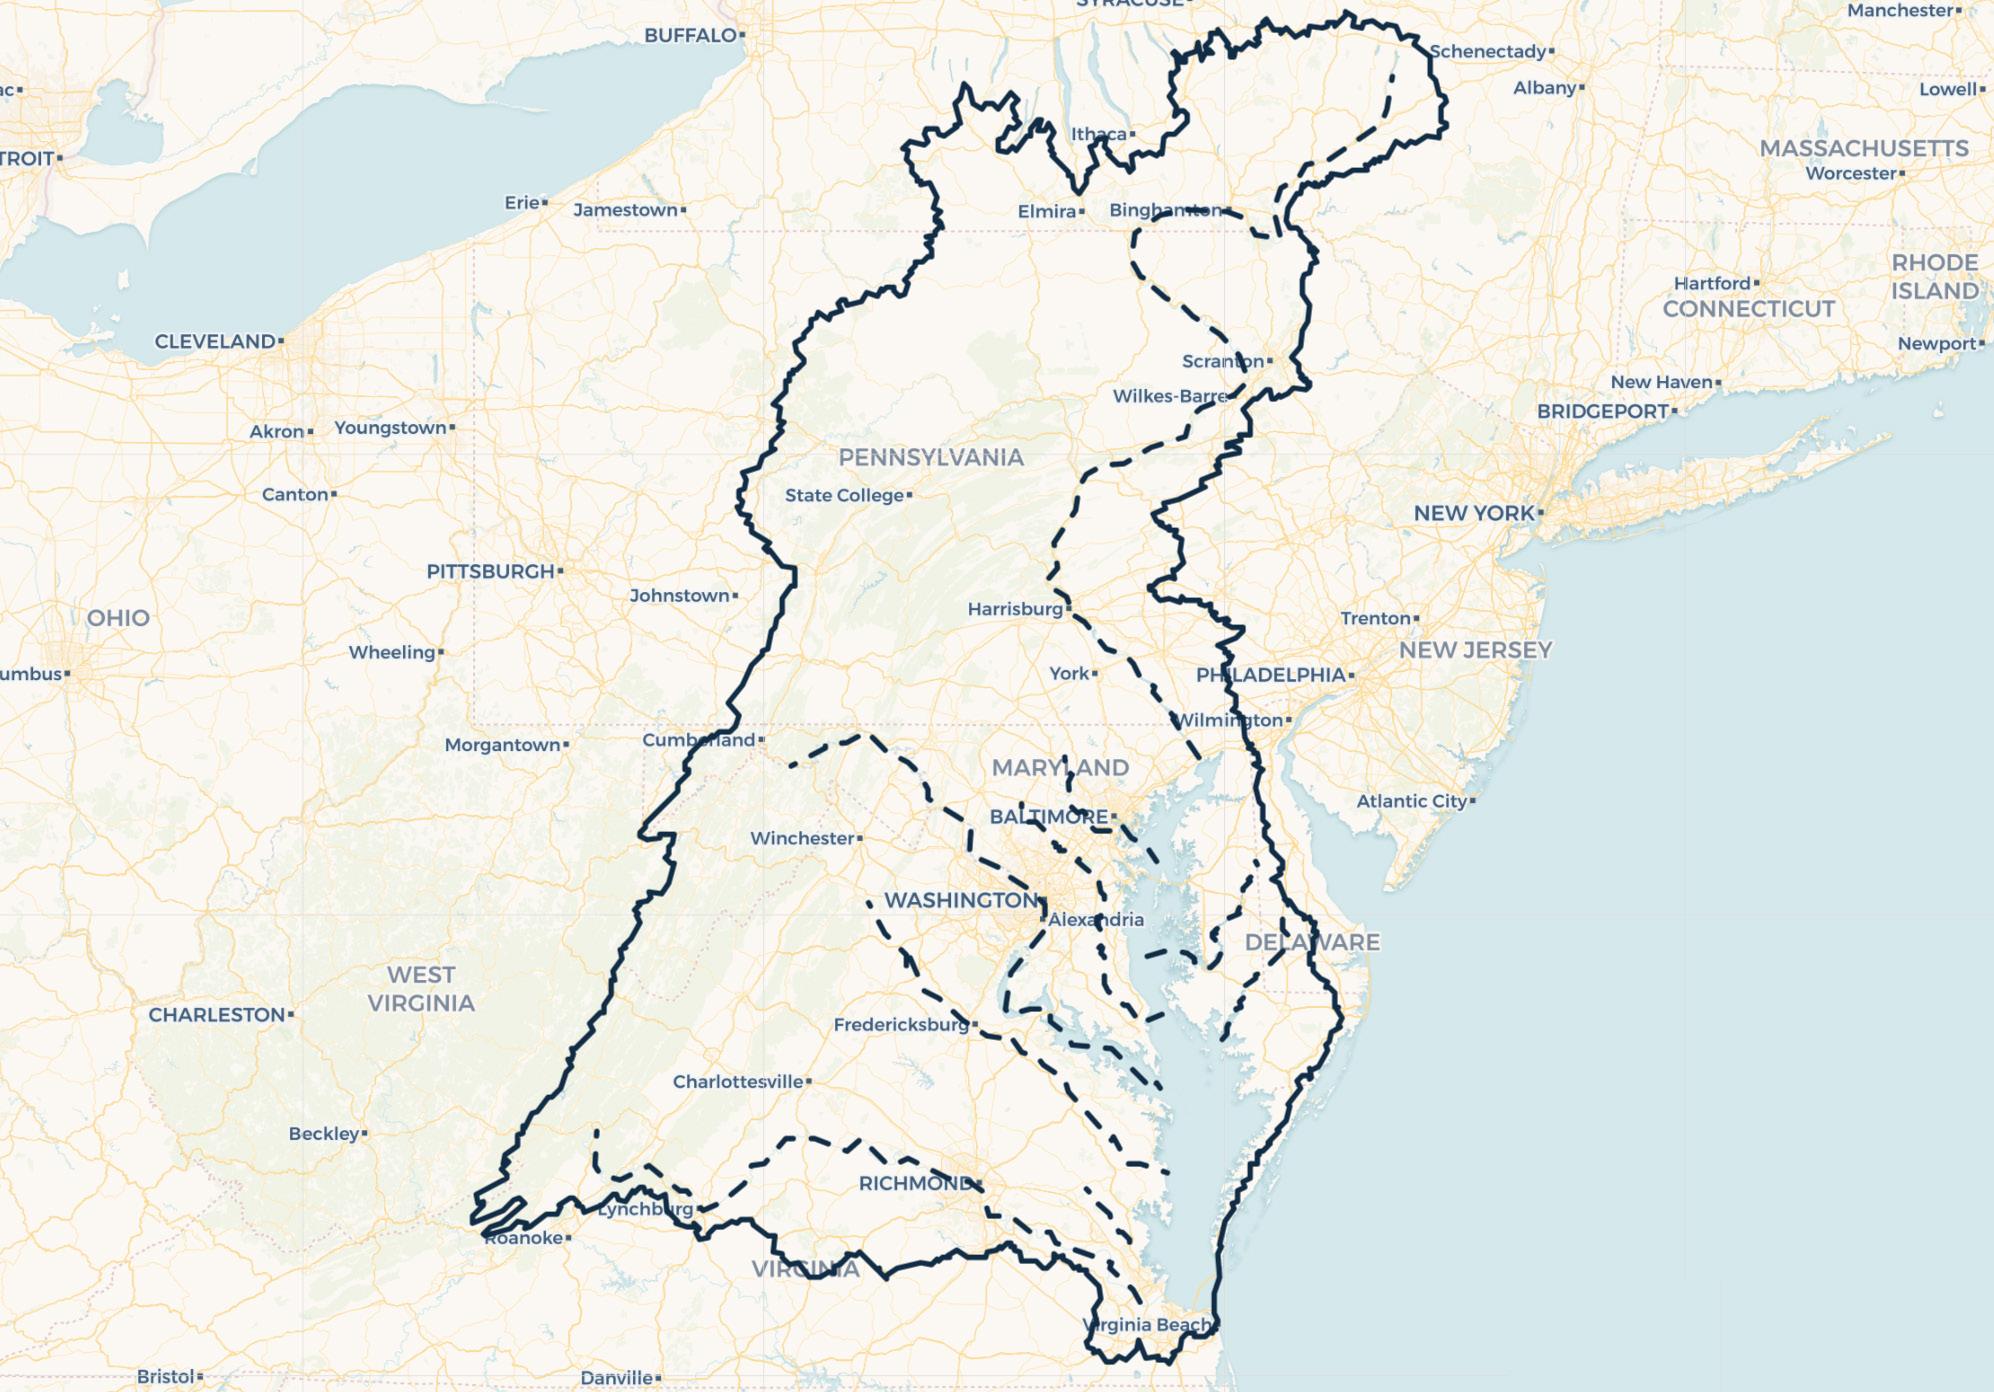
Figure 30: Map of the Chesapeake Bay Watershed. All of Lancaster County is included within the bay watershed.
Public Tax Revenue
Park City Center generates about $5.6 million in property tax and school tax revenues (see Tables 7 and 8). Park City Center contributes about 2.5% of Lancaster School District’s total revenue (see Table 8).
Table 8: Estimated Lancaster School District contribution.
Note: Brookfield Properties is a privately held company, and we did not have access to Brookfield’s revenue statements for the Park City Center. All revenue numbers are estimates based on the best information available. We did not contact Brookfield, as that was beyond the scope of our study.
Table 7: Estimated property tax revenue generated by Park City Center, 2025.
Summary
In its current capacity, Park City Center offers visitors a diverse range of commercial and retail experiences, located between downtown Lancaster and the northwest suburbs. Park City’s low vacancy rate reflects the demand for businesses to operate in the mall and speaks to the property owner’s ability to both retain and attract tenants. Its proximity to Harrisburg Pike and Route 30 makes it convenient for visitors to access the mall by car, and the abundance of parking reassures visitors that they can find a parking space at any time.
However, Park City Center is not without its challenges. Several glaring issues still exist with no plan to be rectified in the near- or long-term. While Park City Center benefits from sevenday transit access, limited frequency and early evening cutoffs constrain its potential to support higher visitation and nighttime activity. More frequent and extended service hours could better align transit availability with retail, entertainment, and future residential uses.
The extensive areas of underutilized parking along Park City Center’s ring road represent a significant opportunity for reinvestment and redevelopment, particularly for new housing. Both the City and County have indicated a clear objective to expand the local housing supply within urbanized areas and have explicitly called for any plan regarding Park City Center to incorporate on-site housing. The current configuration features expansive impervious surface, resulting in missed opportunities to integrate green infrastructure such as bioswales, street trees, and landscaped open space. These
elements could not only improve visual quality but also qualify for stormwater management credits, reducing the stormwater management fee while reducing runoff, flooding, and pollutant loading in nearby waterways.
Park City’s proximity to the Little Conestoga Creek and its location within the Susquehanna River Basin and Chesapeake Bay Watershed highlight the negative environmental impact of excessive impervious surfaces on stormwater management, which is a top priority for the City. The City of Lancaster’s air quality is among the poorest in the nation, indicating a significant need to incorporate more greenery throughout the area. Additionally, the lack of trees contributes to the urban heat island effect, which will worsen the rising temperatures, particularly during the summer months.
Finally, the dominance of surface parking, combined with minimal green space, few exterior windows, and uninspired façade articulation, undermines the mall’s ability to create a sense of place. Together, these conditions limit both the environmental performance and the long-term economic potential of the site, reinforcing the need for a more integrated, mixed-use, and placebased redevelopment strategy.
Overall, the Business-as-Usual approach does not adequately meet the goals and vision of the City of Lancaster from a social, economic, and environmental standpoint. The current format greatly limits the ability of Park City Center to grow and adapt to the dynamic needs of residents and visitors. Thus, change is necessary.
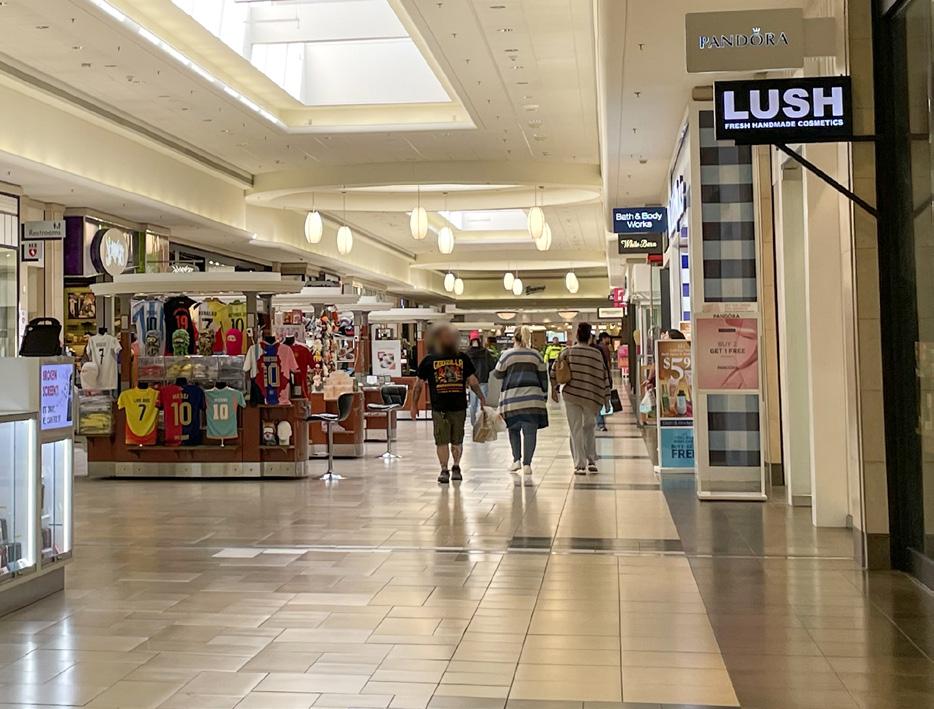
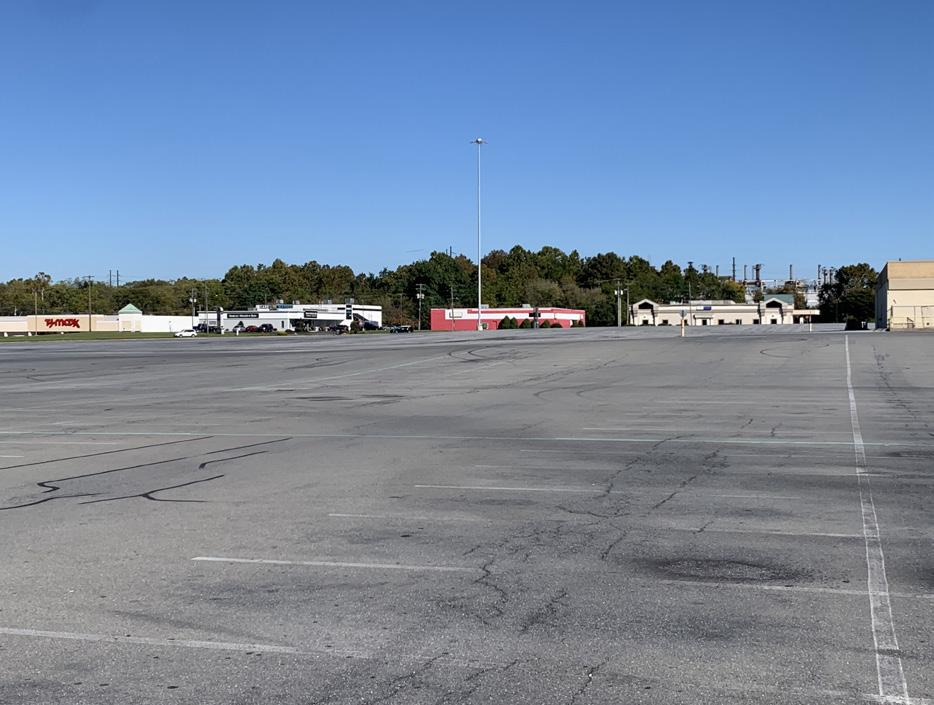
Figure 31: People shopping in Park City Center.
Figure 32: Lack of trees in Park City Center’s parking lot.
Scenario One
Scenario One presents a proactive yet highly achievable vision for Park City Center. We show how targeted zoning and design guidelines can produce a mix of housing types and green infrastructure to enhance the social and environmental performance of Park City. We also recommend transportation and retail adjustments to complement these land use changes.
Proposed Zoning Framework
For Scenario One, we recommend that the City of Lancaster adopt a Mixed-Use Zoning Overlay for the Park City Center site. The overlay district aligns with the City’s Comprehensive Plan, which identifies Park City Center as a “dual-use” area—designated for Neighborhood Mixed Use commercial and residential development—and calls for a detailed small area plan for the site. The Comprehensive Plan views Park City as a major opportunity to accommodate new housing. The current C-3 zoning does not permit any housing, but the proposed mixed-use Overlay allows for the addition of housing units.
The Overlay district would enable the underlying C-3 Regional Shopping District and the commercial uses to remain in place. The purpose of the Overlay is to facilitate the introduction of new housing, green spaces and trees for stormwater management, and climate-resilient
infrastructure by providing flexibility in design with predictable zoning approvals for new development at Park City.
The Overlay would include a superseding clause stating that in the event of any conflict between the Overlay district and C-3 base zoning standards, the Overlay standards take precedence.
Overlay Function and Application
Traditionally, overlay zoning is used to add additional regulatory controls, such as in historic or conservation districts. However, overlays can also be designed as pro-development tools, intended to encourage and enable desired
development outcomes.
The Park City Center Overlay embodies a pro-development set of land use regulations. The Overlay would be triggered only when a development proposal meets specific eligibility conditions, particularly the inclusion of housing and compliance with established design guidelines.
Once triggered, qualifying development proposals would be eligible for administrative or by-right approval, ensuring a more predictable and streamlined review process. Proposals that do not meet these criteria would remain subject to the existing C-3 base zoning requirements. A development proposal after receiving zoning approval would still be subject to the city’s subdivision and land development approval process.
Overlay
Base Zoning (C-3)
Table 9: Key elements of the Overlay and Base Zoning.
Conceptual Development Overview
Through the Overlay, the owners of the Park City Center can redevelop the site into a mixed-use and well-connected neighborhood. Scenario One features:
● The construction of townhomes and multifamily housing on underused surface parking areas; and
● The creation and improvement of pedestrian, biking, and green connections that link the site to Long’s Park and the Blue Green Connector.
These changes maintain the mall’s commercial function while gradually transforming the surplus parking areas into an integrated and attractive neighborhood.
Recommended Housing Types and Site Organization
The Overlay allows for two principal residential building types:
● Townhomes, limited to two stories; and
● Multifamily residences, limited to five stories.
Although the Overlay does not prescribe exact building locations, compliance with subdivision and land development regulations would ensure proper site organization. The northwest and northeast quadrants of the site are likely the most suitable sites for residential uses because of their distance from the noise of Route 30 and the potential to create a cohesive residential community.
Realizing this vision will require the removal of the two outlying buildings, the tire store and the circus, to make room for new housing and open space amenities.
Market Context and Opportunity
Park City exhibits strong potential for new housing development. An analysis of the census tract encompassing Park City shows that housing is generally newer, higher-priced, and predominantly renter-occupied compared to the City of
Lancaster. Household sizes in this census tract also tend to be smaller.
The census tract also extends beyond the limits of Lancaster City and includes suburban areas that influence its housing profile. For instance, The Crossings, a 258-unit multifamily community completed in 2018 and located within a mile of Park City, represents nearly 20 percent of the census tract’s total housing stock.
Higher rents relative to the city indicate robust housing demand and strong leasing potential for new multifamily units. The Crossings leased up in approximately two years and as of October 2025 had just three vacancies.
Strong market demand for housing also creates an opportunity to introduce below-market, workforce housing, where market-rate units could help cross-subsidize affordability. This new housing could attract county residents into Lancaster City, broadening both the housing mix and the City’s tax base.
Development Capacity and Unit Mix
Based on current site conditions and market feasibility, the Overlay district at Park City could support 360 housing units while maintaining balanced design and human-scale massing of buildings. This total includes 300 multifamily units and 60 townhomes (see Table 10).
The recommended unit mix aims to serve a diverse range of household types, balancing smaller units for singles and couples with larger units for families. The renter/buyer profile breaks down as follows:
● Studios: Single professionals, especially those employed by nearby Penn Medicine–Lancaster General Hospital;
● 1-Bedrooms: Young couples and empty nesters;
● 2-Bedrooms: Families;
● Townhomes: Entry-level ownership opportunities or “starter homes”.
To qualify under the Overlay, multifamily developments of more than 20 units must include 15 percent affordable and workforce units targeting households earning 80–120 percent of Area Median Income (AMI).
Residential development, including associated parking, would occupy approximately 22 percent of the Park City Center parcel, achieving an estimated 16.1 dwelling units per acre within the developed areas.
Design Guidelines for Multifamily and Townhome Residences
The design guidelines recommended here draw from the standards created for the Traditional Neighborhood Development zoning district at Linglestown Road and Progress Avenue in Susquehanna Township, Dauphin County, PA.12
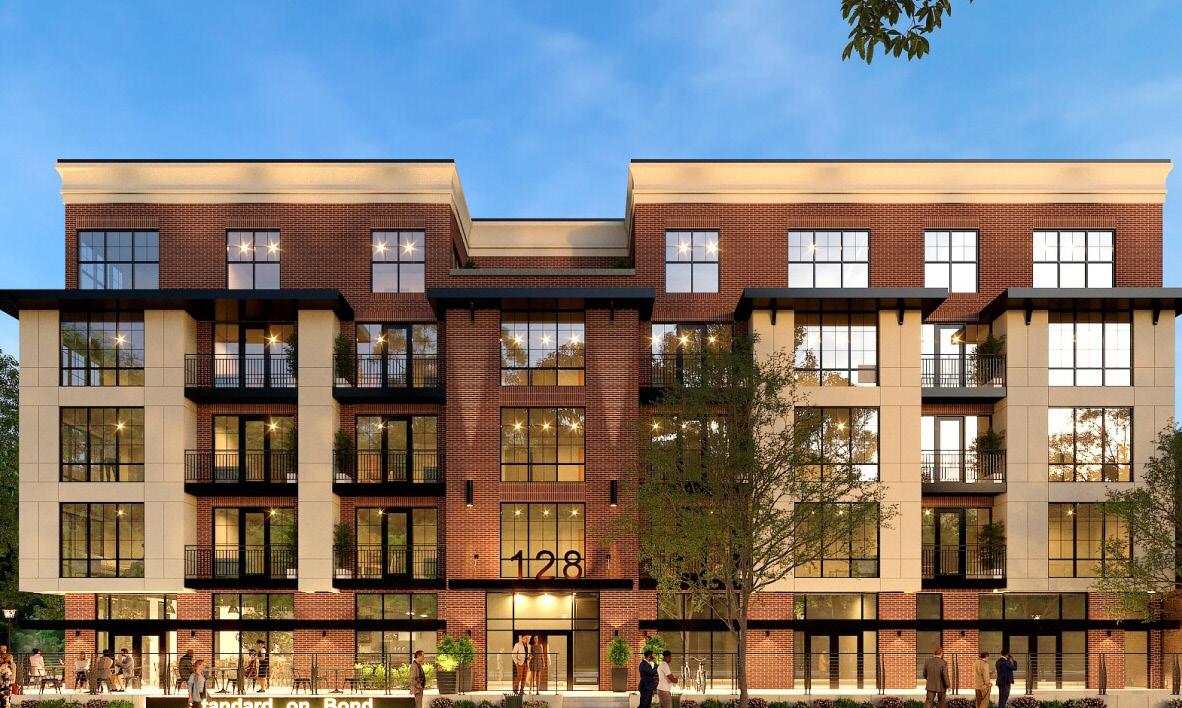
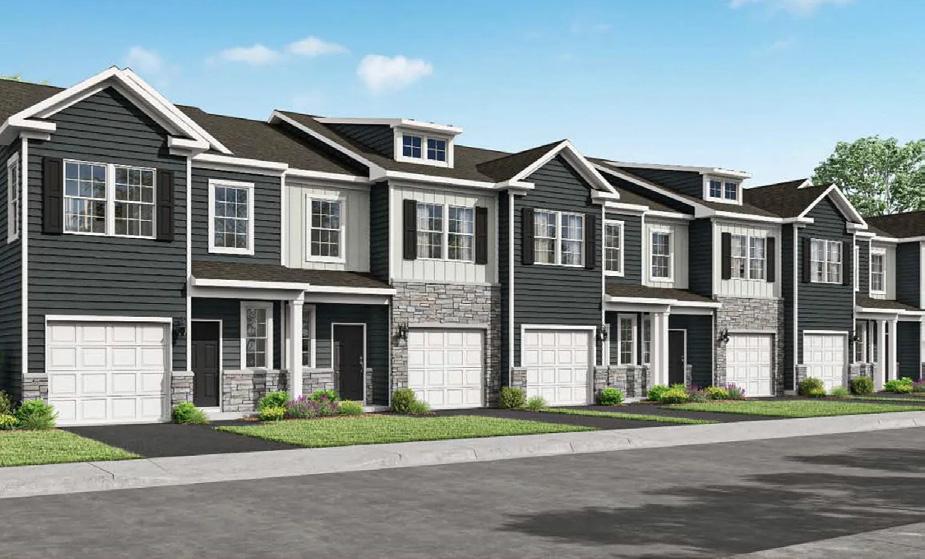
Table 10: The number of single-family attached and multifamily units recommended for Park City in Scenario One.
Figure 34: Example of multifamily housing.
Figure 35: Example of townhomes.
Zoning Element Multifamily
Intent
Height
Multifamily housing shall consist of apartments, lofts, and/or other multi-tenant dwelling units, for either public or private use and should be constructed as standalone buildings. Buildings may vary in size, but all should strive to maintain a residential character through appropriate massing, materials, and detailing. Examples shown in this plan are intended to be emulated and referenced for design inspiration.
The Maximum Principal Building Height shall be 68 feet or five stories.
Townhomes
Townhomes shall consist of attached or semi-attached singlefamily dwelling units arranged in rows or clusters. Buildings may vary in size, but all should maintain a residential character through appropriate massing, materials, and detailing. Examples shown in this plan are intended to be emulated and referenced for design inspiration.
The Maximum Principal Building Height shall be 26 feet or two stories.
Facade All floors of a building shall not contain blank façade walls along any side of the structure. No more than 40% of its length or 25 feet, whichever is less, shall be blank (i.e., without doors or windows, or architectural expression).
Ground Floor
Design
Articulation
A variety of design elements that create visual interest and distinguish the ground floors from the floors above shall be provided. This may include a combination of features such as articulated building entrances, covered porches, building cornices, window treatments and awnings, building accent lighting, or other similar embellished façade features.
Articulation shall be achieved by vertically off-setting façade walls a minimum of 16 inches every 30 feet, or by constructing horizontal protrusions or insets from the building that may include such features as balconies, cornices, or awnings.
Similarly, provide visual interest and a clear distinction between the ground floor and upper floors. In addition to the elements used for multifamily buildings, townhomes may incorporate articulated stoops or porches, recessed or projected entryways, bay windows, awnings, transoms, or similar features.
Maintain the same guidelines as multifamily buildings, except require a minimum façade offset of 12–16 inches at least every 20–30 feet.
Street Corners Buildings shall adjoin sidewalks at street corners unless a green, plaza or square is provided at a street corner.
Landscaping
Parking
Landscaping, including but not limited to landscaping beds, raised planting beds, etc. shall be placed around all sides of a building or structure to the greatest extent possible, as long as it does not impede pedestrian circulation or safety. Where possible, landscaping may be utilized as stormwater management facilities to decrease runoff from rooftops or adjacent impervious surfaces.
Parking (on-street and off-street) shall follow the city’s zoning code, be fully paved (porous pavers are allowed), and include required landscaping. All off-street parking areas shall be properly screened and buffered from streets and views using elements such as masonry piers and planted hedges.
Each townhome shall provide a one-car garage. Any on-street or off-street parking beyond the required garages shall follow the parking guidelines established for multifamily residences.
Table 11: Traditional Neighborhood Development Design Guidelines from Susquehanna Township, Dauphin County, PA.
Green Space Requirements
When a development proposal triggers the Overlay, it would also be required to incorporate new green spaces within the site. These landscaped areas serve as public gathering spaces, enhance the aesthetic quality of the site, and improve environmental performance through stormwater management and tree canopy coverage.
● Green Areas and Open Spaces shall be located in accordance with the plan proposed under this scenario. Placing green spaces to improve the connection between Long’s Park and the Blue Green Connector is highly encouraged.
● A minimum of 20% of the gross tract area of the Park City parcels shall be designed, constructed, and maintained as Green Space.
● Green Spaces shall provide both active and passive recreational opportunities for the community. They shall be central to the community, be focal points and provide a diverse set of uses.
● Landscape enhancements to Open Spaces shall complement the existing plantings. Native plantings that support ecosystems and wildlife habitat are desired.
● Amenities may include open lawns, pathways, walking trails, play areas, and seating areas. Special areas shall be designated for events such as markets, concerts, or other types of community celebrations or festivals.
● Green Spaces in residential areas shall complement the character of the neighborhood. Amenities such as open lawns, shade trees, community gardens, play areas, and shade structures are desired.
Figure 36: Example of green space.
Transportation Parking
For parking in Scenario One, we recommend a reduction in the commercial parking minimum from one space for every 250 square feet to one space per 500 square feet. This lowers the number of parking spaces to 3,721, a 37% reduction, as shown in Table 12.
Figure 37 shows the new layout of the commercial parking. It has been clustered toward the southern portion of the site to provide some separation from the noise of Route 30. The residential buildings in the northwest, northeast, and southwest areas of Park City have their own adjacent parking lots.
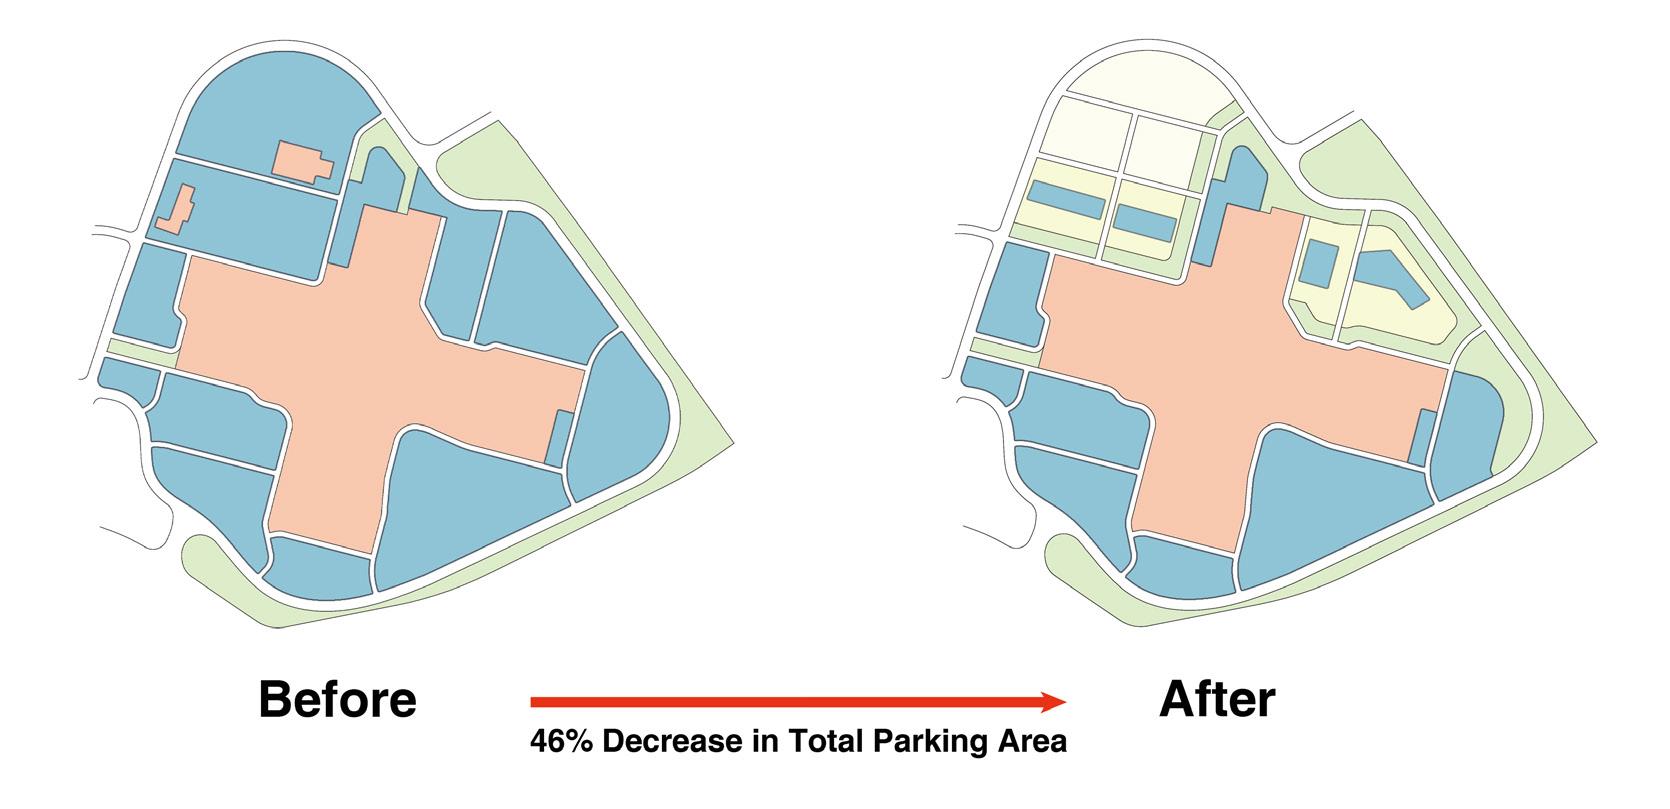
Table 12: Scenario One proposed parking space reduction compared to existing parking spaces.13
Figure 37: The current and Scenario One commercial parking layout.
Traffic Study and Street Layout
Before construction can begin on Scenario One, a traffic study must be completed to assess the impact of the new residential buildings. Scenario One also includes two new residential roads in the northwest quadrant of the Park City site. We expect the need for a new traffic signal at the intersection adjacent to Parkview Plaza, given its proximity to the townhomes and multifamily units. A pedestrian crosswalk could be added here to provide better access to nearby shops and amenities.
There is also a need for pedestrian crosswalks along Plaza Boulevard at Schreiner Station Road (which leads to the Blue Green Connector) and near the entrance to Long’s Park to support safe pedestrian access to these important green spaces.
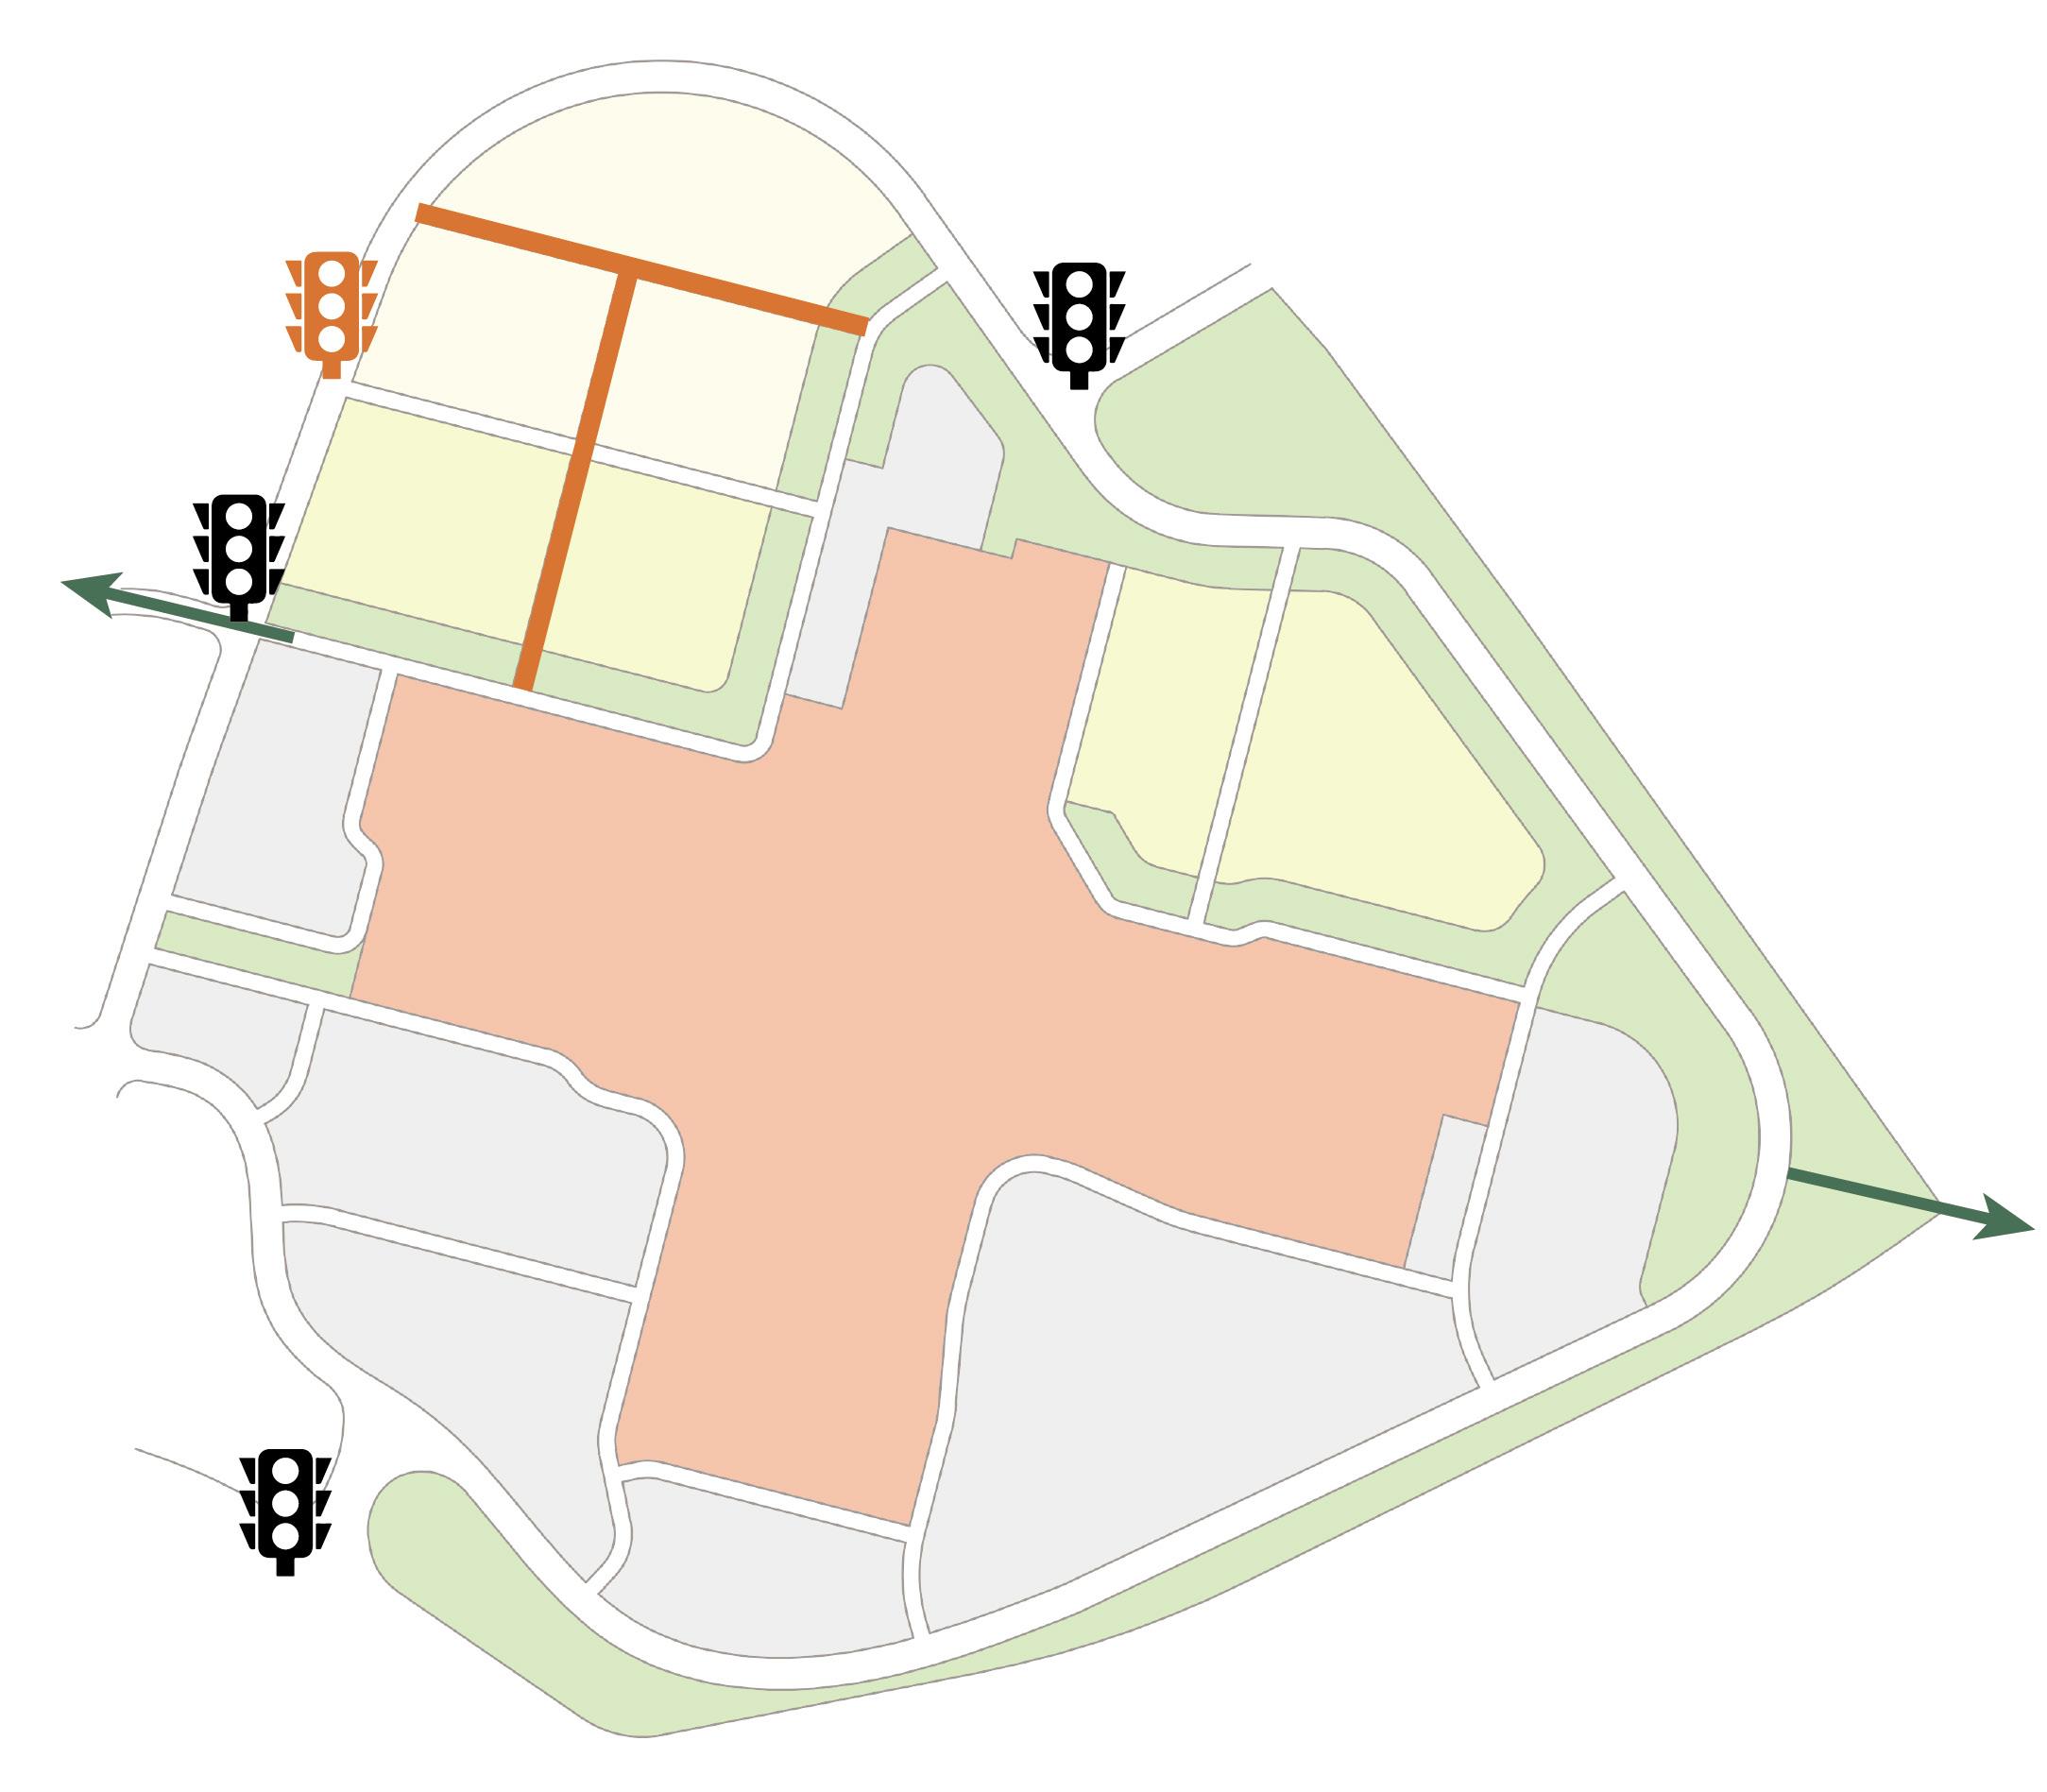


Figure 38: New roads and traffic signal at Park City Center.
To Long’s Park
To Blue Green Connector
Transit Access
With the addition of 360 residential units at Park City Center, transit demand is likely to increase. Currently, the Route 8 bus line connects Park City to downtown Lancaster. People using the Park City bus stop today are likely to be shoppers or workers at the mall. The new residents, however, may want to use transit to travel to downtown Lancaster to go to work, run errands, eat at restaurants, or for entertainment.
Route 8 currently runs hourly during the week and every other hour on weekends. This frequency is not high enough to provide a reliable, meaningful transit option to those living at Park City. We suggest increasing the service frequency to every 15 minutes during the week and every half hour on weekends.
Prior to the South–Central Transit Authority’s 2023 Transit Development Plan, Park City Center was serviced by three routes, which had peak frequencies of 30 and 35 minutes.14 This means there is already a precedent for a higher level of service.
Bus Stop at Kohl’s
The Park City Center bus stop at Kohl’s lacks both signage and a designated bus shelter. The mall façade does provide a covered place to stand but is primarily for shoppers entering and existing the mall.
The bus stop could be improved by adding signage and bike racks and upgrading the lighting to increase safety and enhance the rider experience.
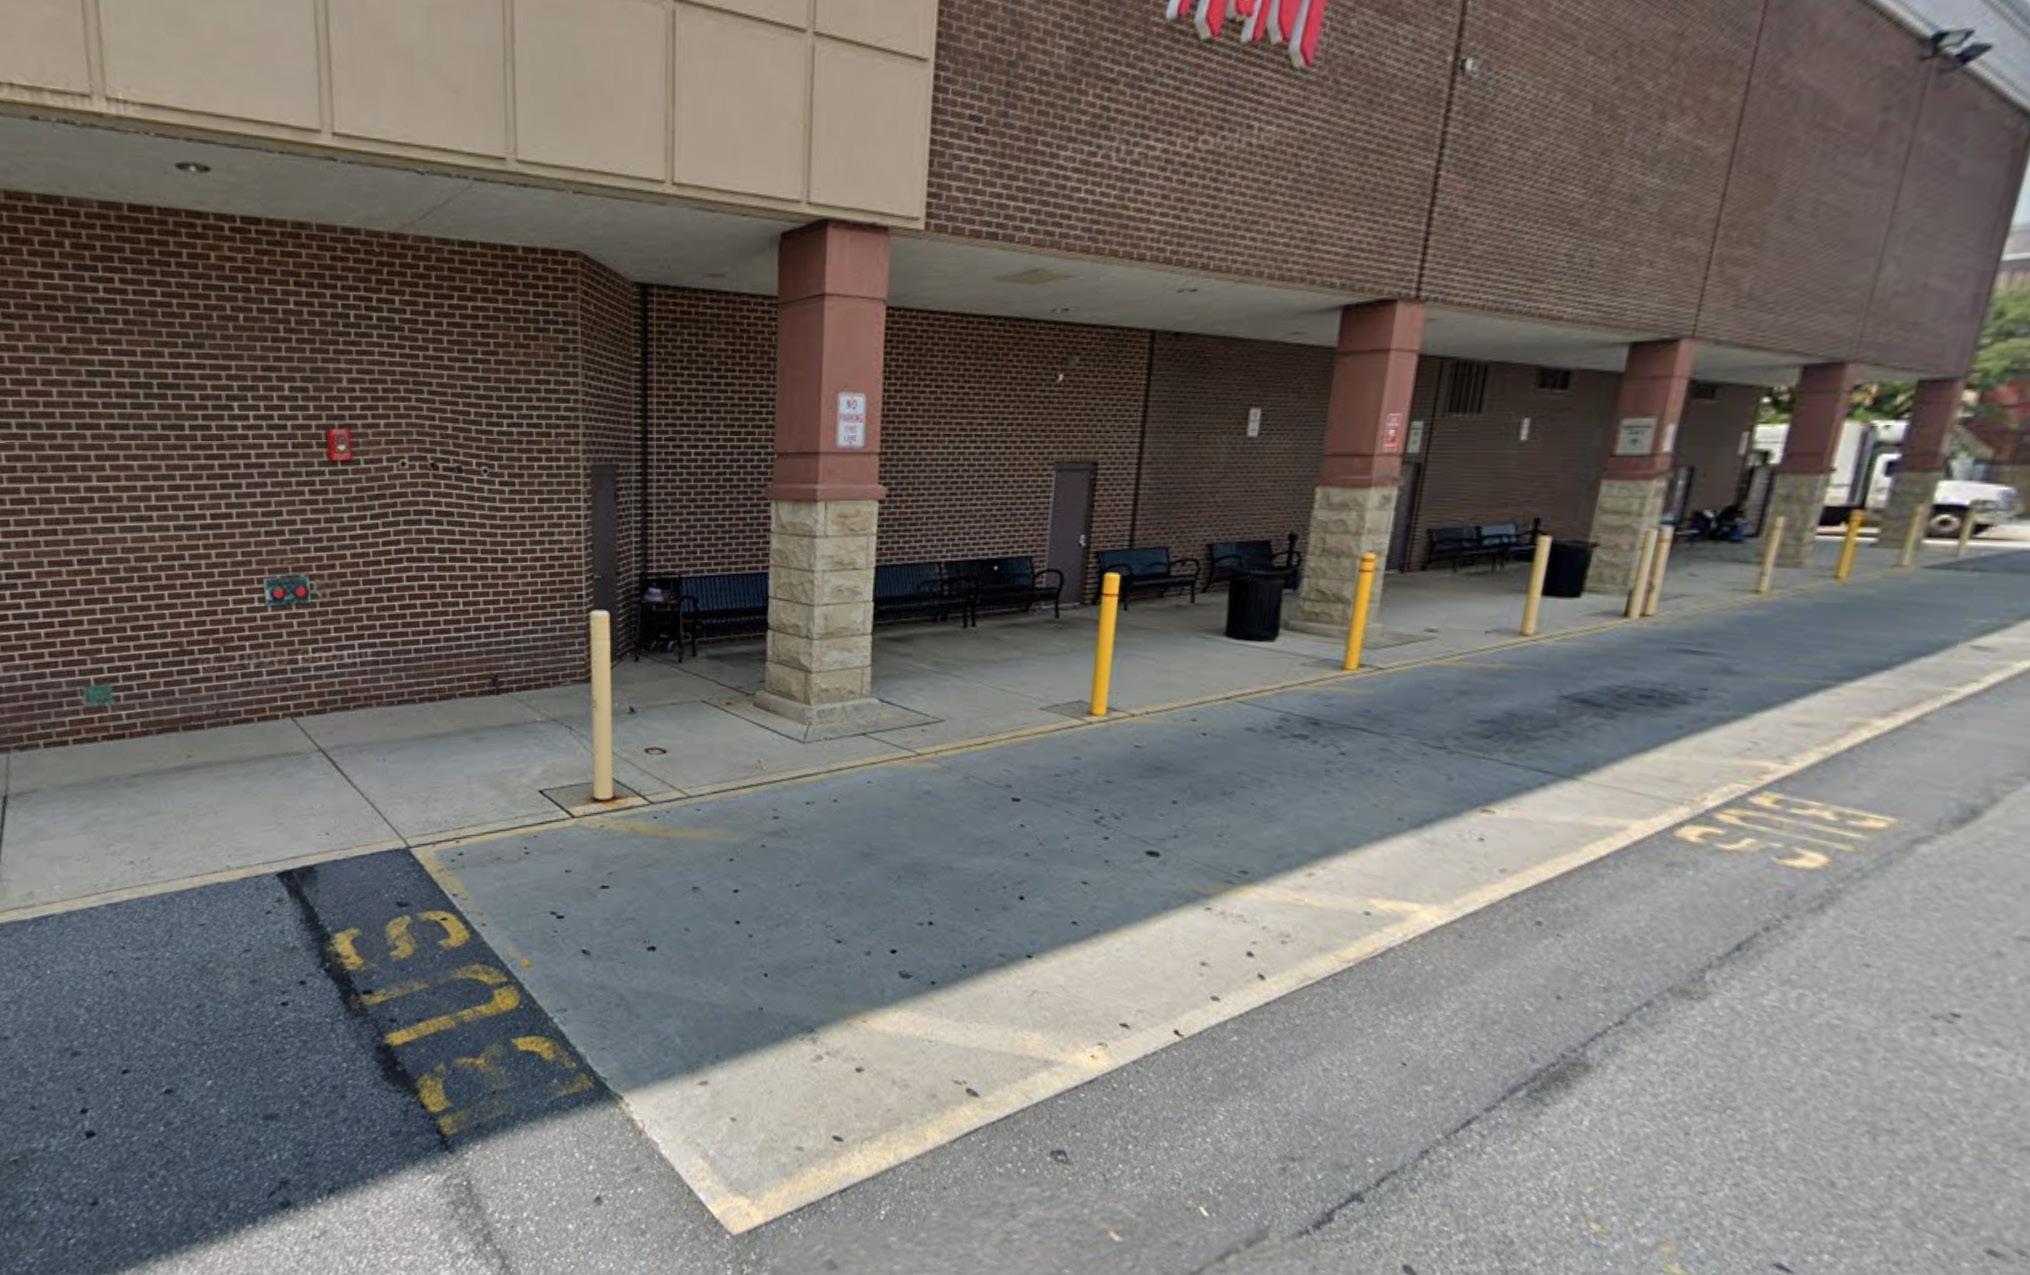
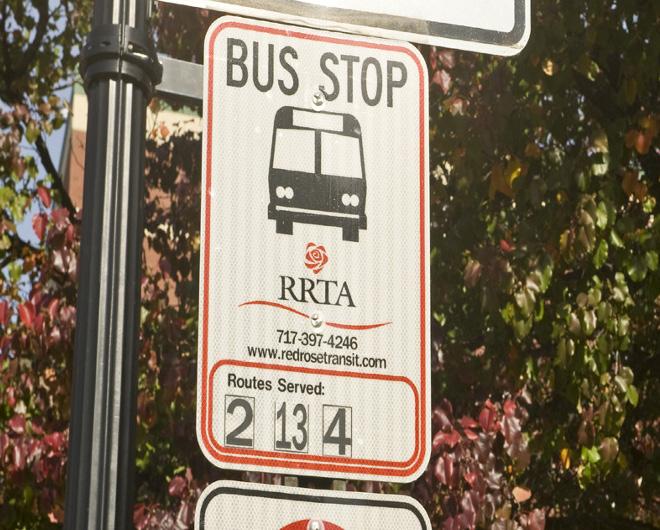
Figure 39: The current unmarked bus stop at Kohl’s.
Figure 40: Example of signage at bus stops. Figure 41: Example of bike rack at bus stops.
Active Transportation—Shared Use Path
The Scenario One site design includes a continuous shared use path above the northern perimeter of the mall (Figure 42). It will better link Park City Center with the Blue Green Connector and Long’s Park. The path should have a minimum width of 12 feet to provide access to a variety of users (see Figure 43).
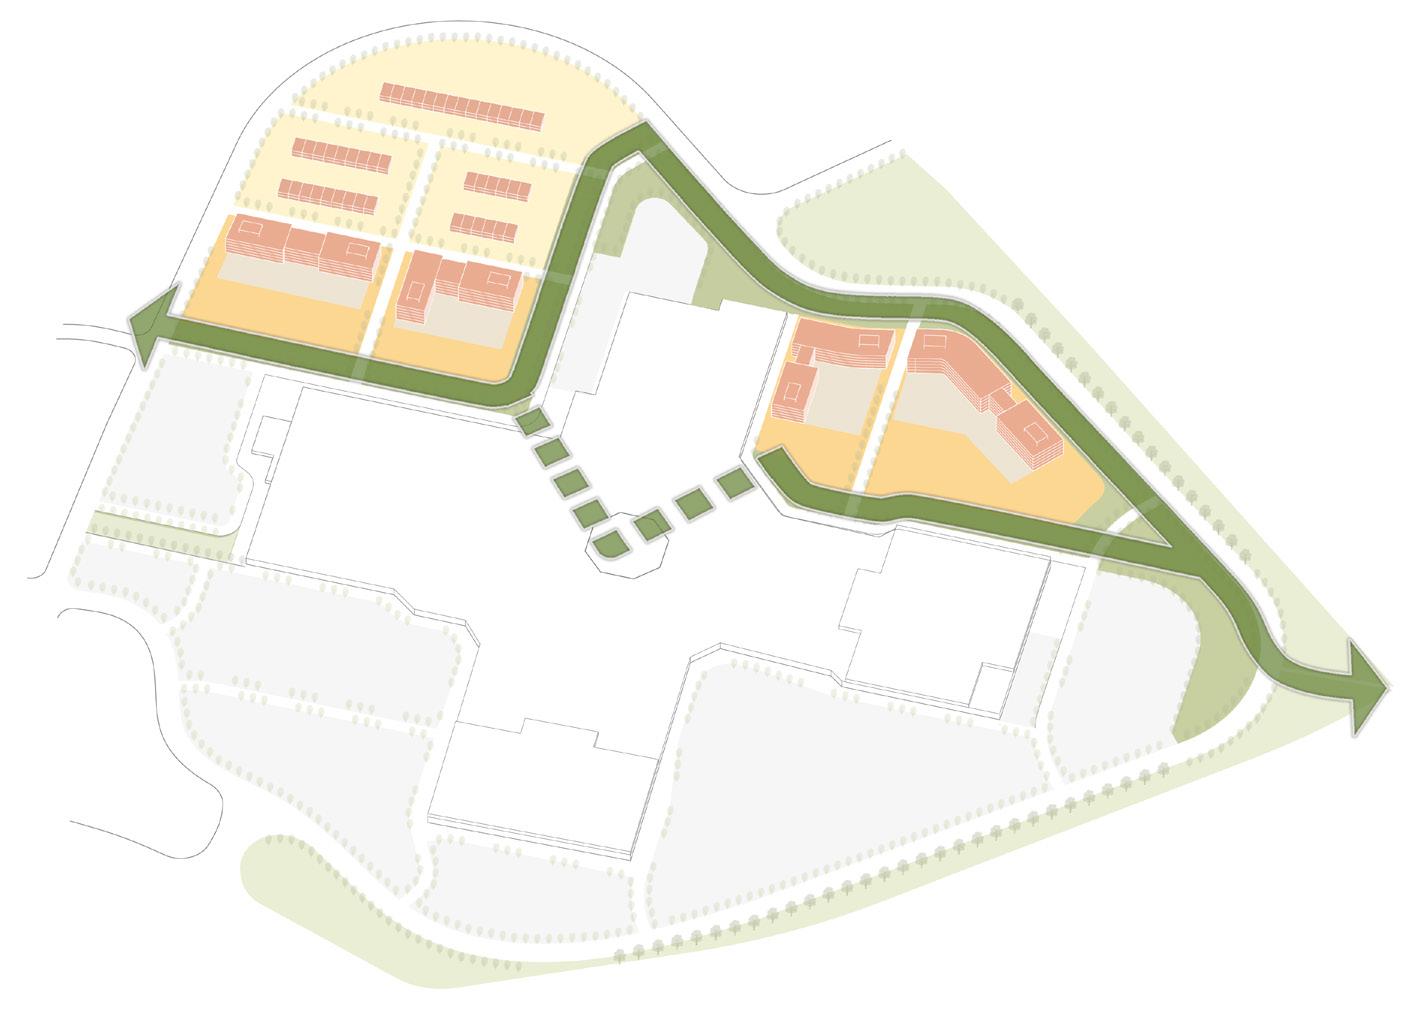
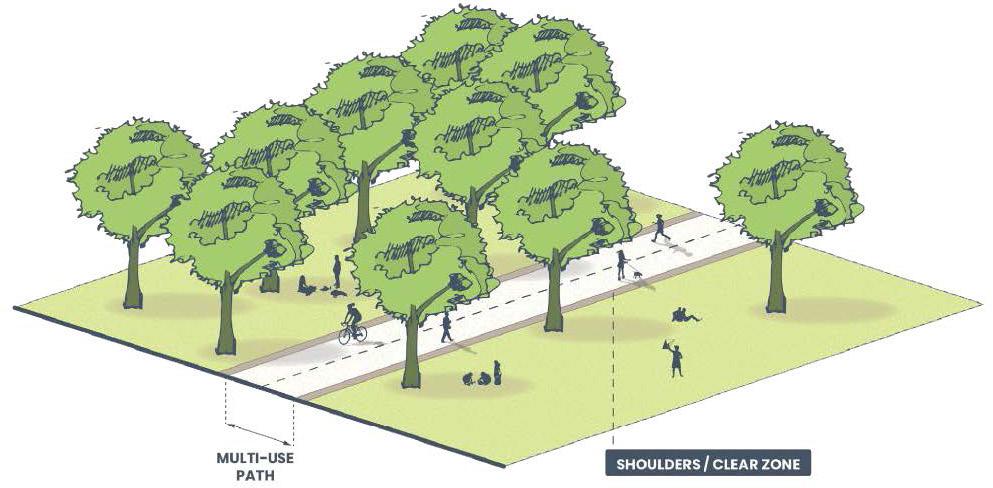
Figure 42: Shared use path around Park City Center.
Figure 43: Shared use path model.
Long’s Park
Blue Green Connector
Long’s Park Connection
Long’s Park is a large, attractive green space next to Park City, but currently the only connection is a poorly maintained underpass beneath Route 30. Scenario One proposes adding a pedestrian crosswalk and pedestrian sign on Plaza Boulevard to improve safety for those crossing the road. It should also be marked with clear signage directing visitors to the park.
Access from Park City to Long’s Park could be improved by widening the path and upgrading the lighting along the Route 30 underpass. This could also be a potential location for public art or murals.
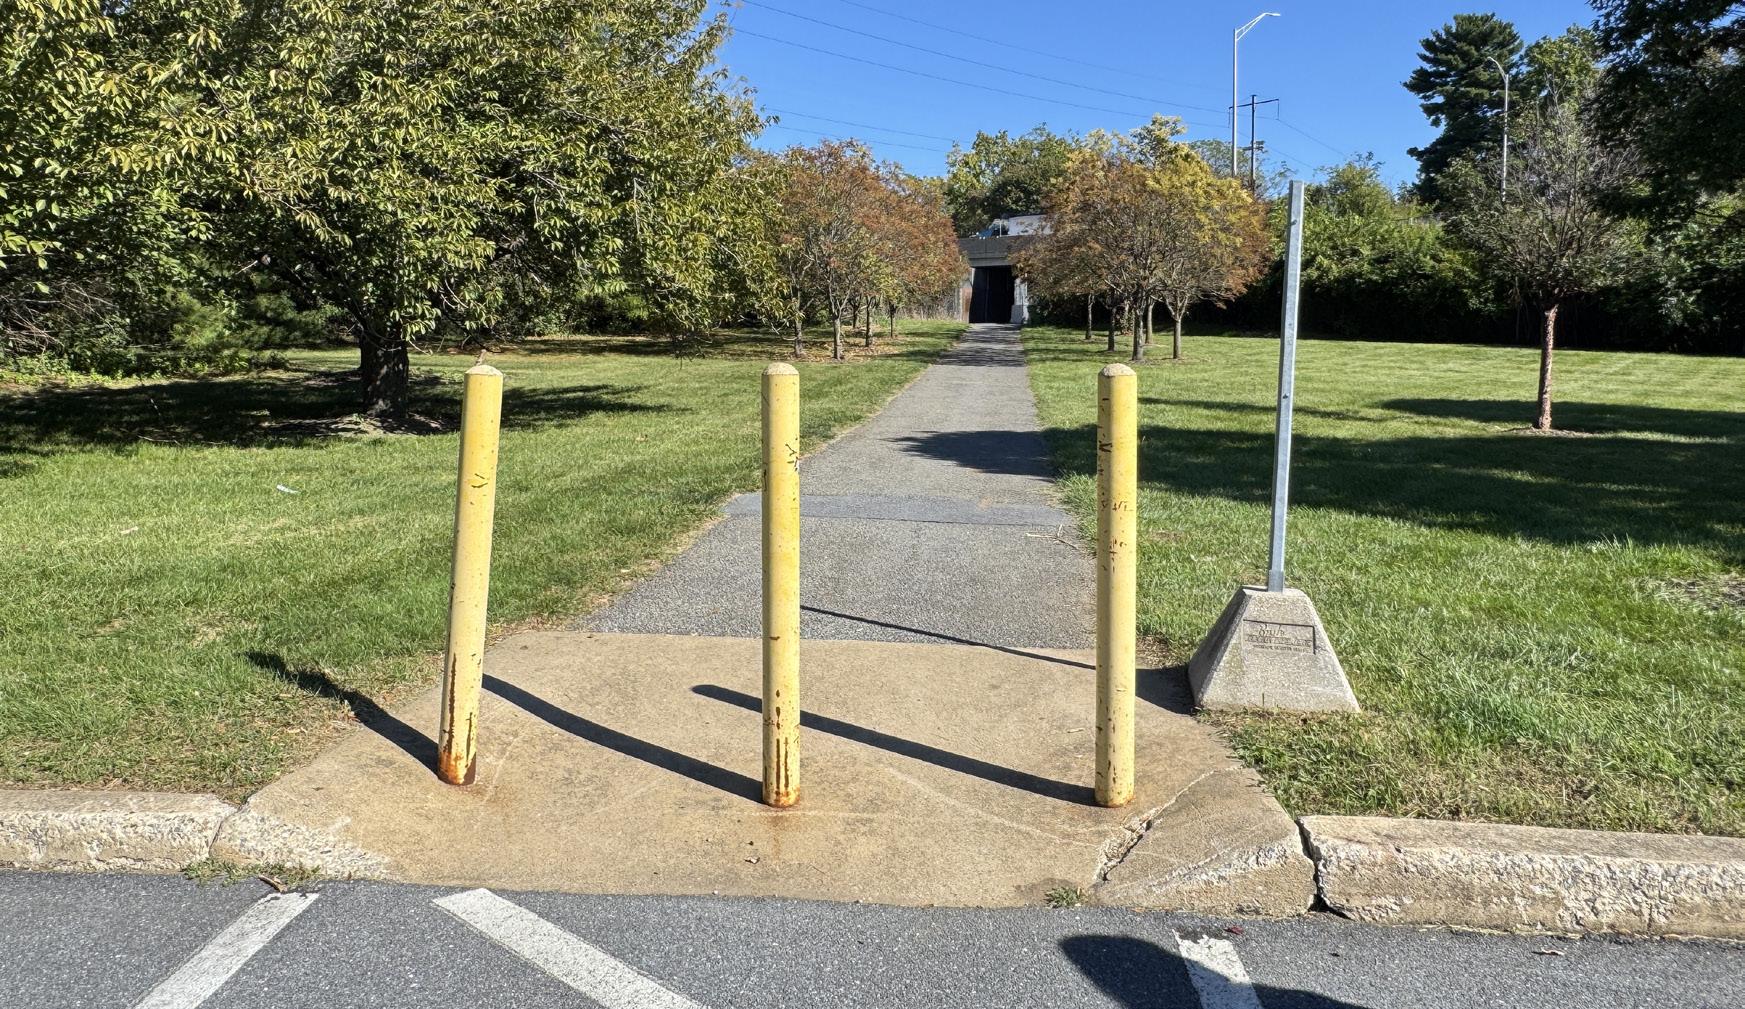
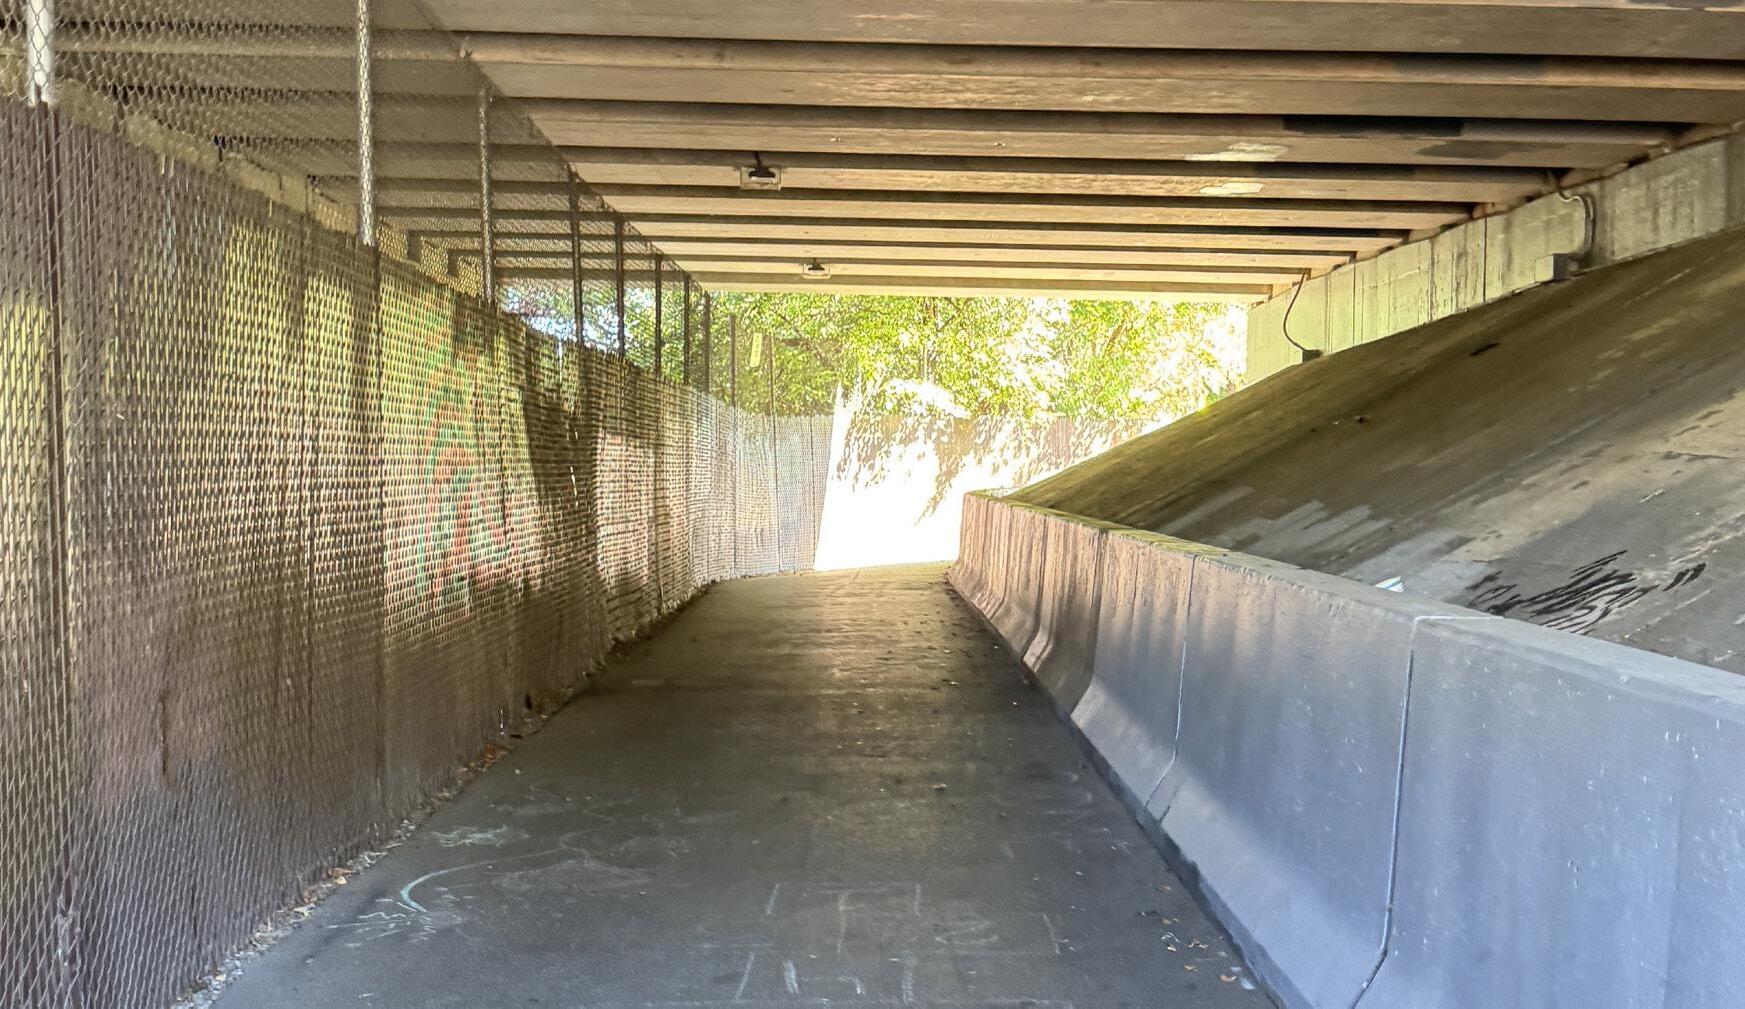
Figure 44: Path to Long’s Park.
Figure 45: Route 30 underpass between Park City and Long’s Park.
Environment
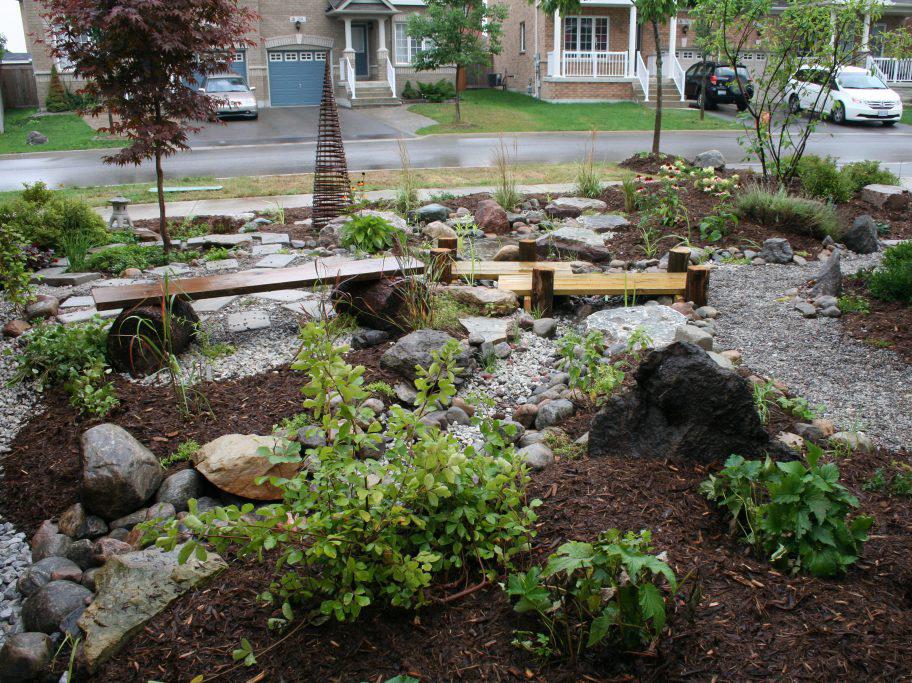
Stormwater Management
Scenario One addresses stormwater management by combining peak-rate control, water-quality treatment, and on-site volume reduction measures. As shown in Table 13, these interventions qualify the project for City of Lancaster stormwater fee credits: up to 25% for peak-rate flood and water-quality facilities and up to 50% for volume controls and green infrastructure.
Scenario One shows a substantial reduction in Park City’s impervious surface, primarily by shrinking the number of parking spaces and adding green areas and trees. Table 14 indicates that Scenario One lowers the total impervious area from 3.36 million square feet in the Business-as-Usual (BAU) Scenario to 2.55 million square feet and reduces the corresponding annual stormwater management fee from $104,959.35 to $78,933.42, a decrease of about 25%.
13:
Table 14: Scenario One impervious area and Stormwater Management Fee (SWMF) compared to Business-asUsual (BAU). Computations are based on City of Lancaster information.
Table
Stormwater management measures and available credits.
Subsurface Stormwater Management
This plan also considered subsurface stormwater management strategies. Underground detention systems temporarily store stormwater and slowly release it, helping manage runoff without affecting surface activities or site aesthetics. These systems can be built beneath nearly parking lots, buildings, and open areas and offer considerable flexibility, as they can be constructed using pipe, stone, concrete, or plastic grid chambers, depending on the project budget, design needs, and material availability.
This plan would require these systems to drain within 72 hours after a 24-hour storm event and include positive overflow capacity for a 100-year storm event, ensuring both regulatory compliance and long-term performance. Manholes or other access features will also be needed to enable safe routine maintenance. These regulations are typical for this kind of intervention to maximize environmental benefits. Collectively, these features add flexibility and resilience to the site’s overall stormwater strategy.
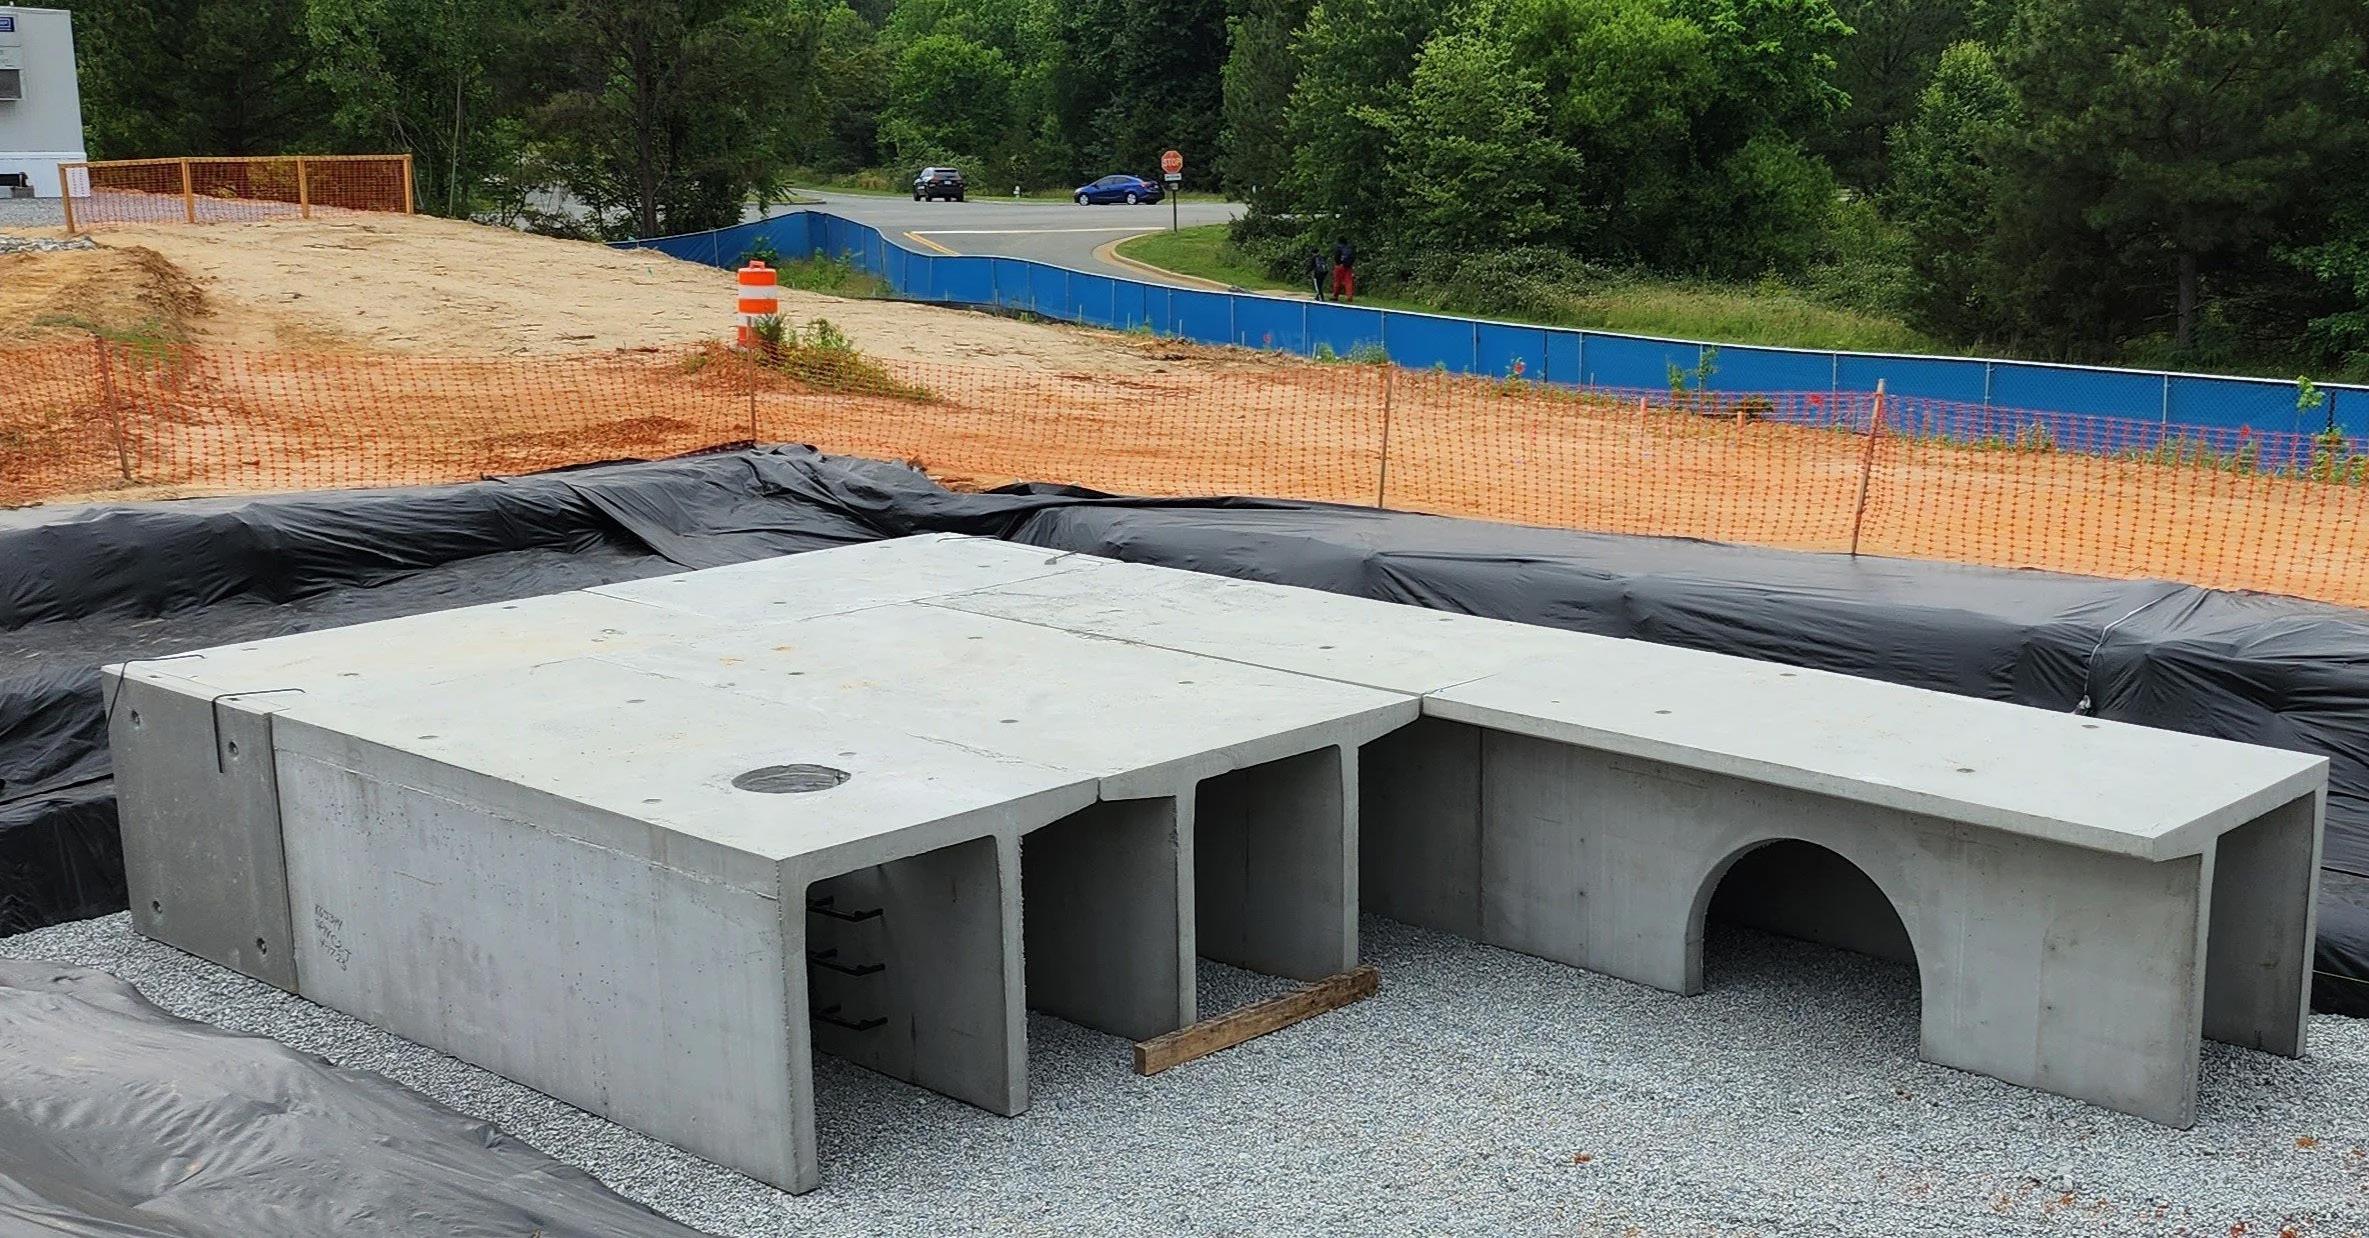
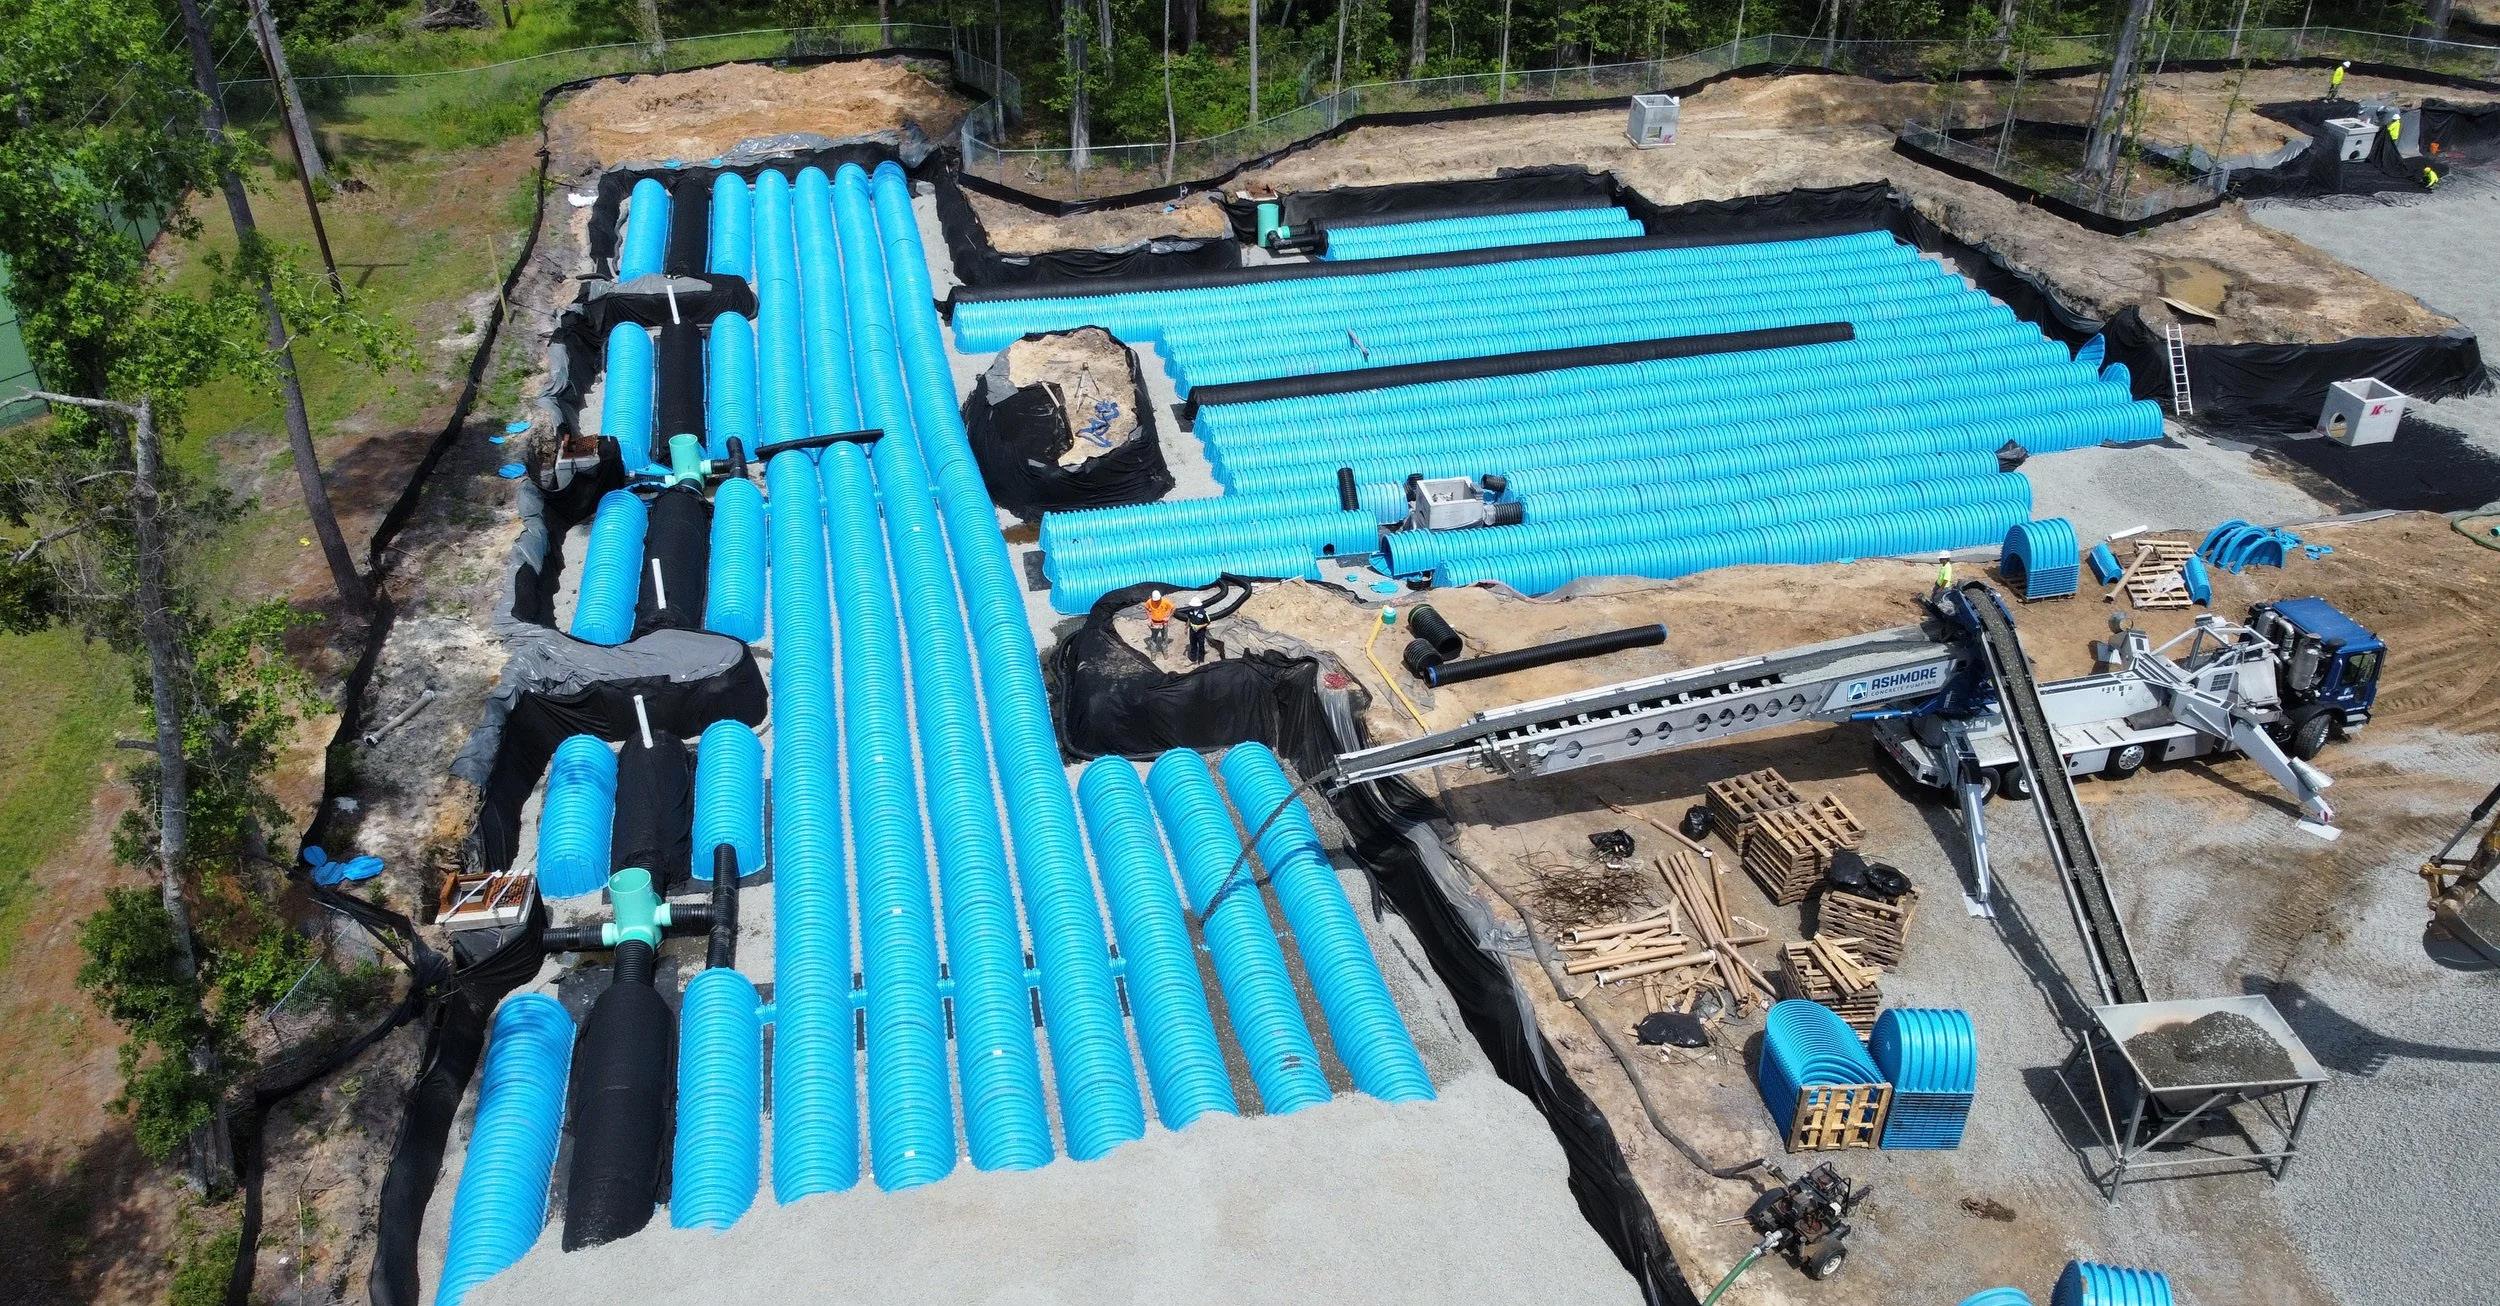
Figure 46: Example of subsurface stormwater management infrastructure.
Figure 47: Example of subsurface stormwater management infrastructure.
Water and Wastewater
Park City is located within the drainage area of the Little Conestoga Creek municipal separate storm sewer system (MS4). This design helps prevent combined sewer overflows (CSOs) that occur in older combined sewer systems (CSS), which still serve many parts of the city. A CSS carries both sewage and stormwater in a single pipe, which can overflow during heavy rain, resulting in untreated sewage and stormwater being discharged into nearby waterways. In contrast, an MS4 separates sewage and stormwater into two distinct pipes: one pipe transports sewage to a treatment plant, while the other directs stormwater straight into waterways. This separation significantly helps keep sewage out of our waterways. MS4s are more commonly found in newer developments and manage stormwater runoff more effectively, reducing CSO risks.
Conestoga River (including Mill
Little Conestoga Creek Eastern Unnamed Tributary Southeastern Unnamed Tributary
Figure 48: City of Lancaster MS4 drainage areas. MS4 outfalls
Creek)
Stormwater Conveyance
MS4 Drainage Areas
Green Infrastructure
Scenario One features a variety of green infrastructure elements distributed across the Park City site. These green spaces and trees knit together a new openspace network, providing stormwater management improvements as well as an enhanced visual and landscape experience for residents and visitors (Figure 49).
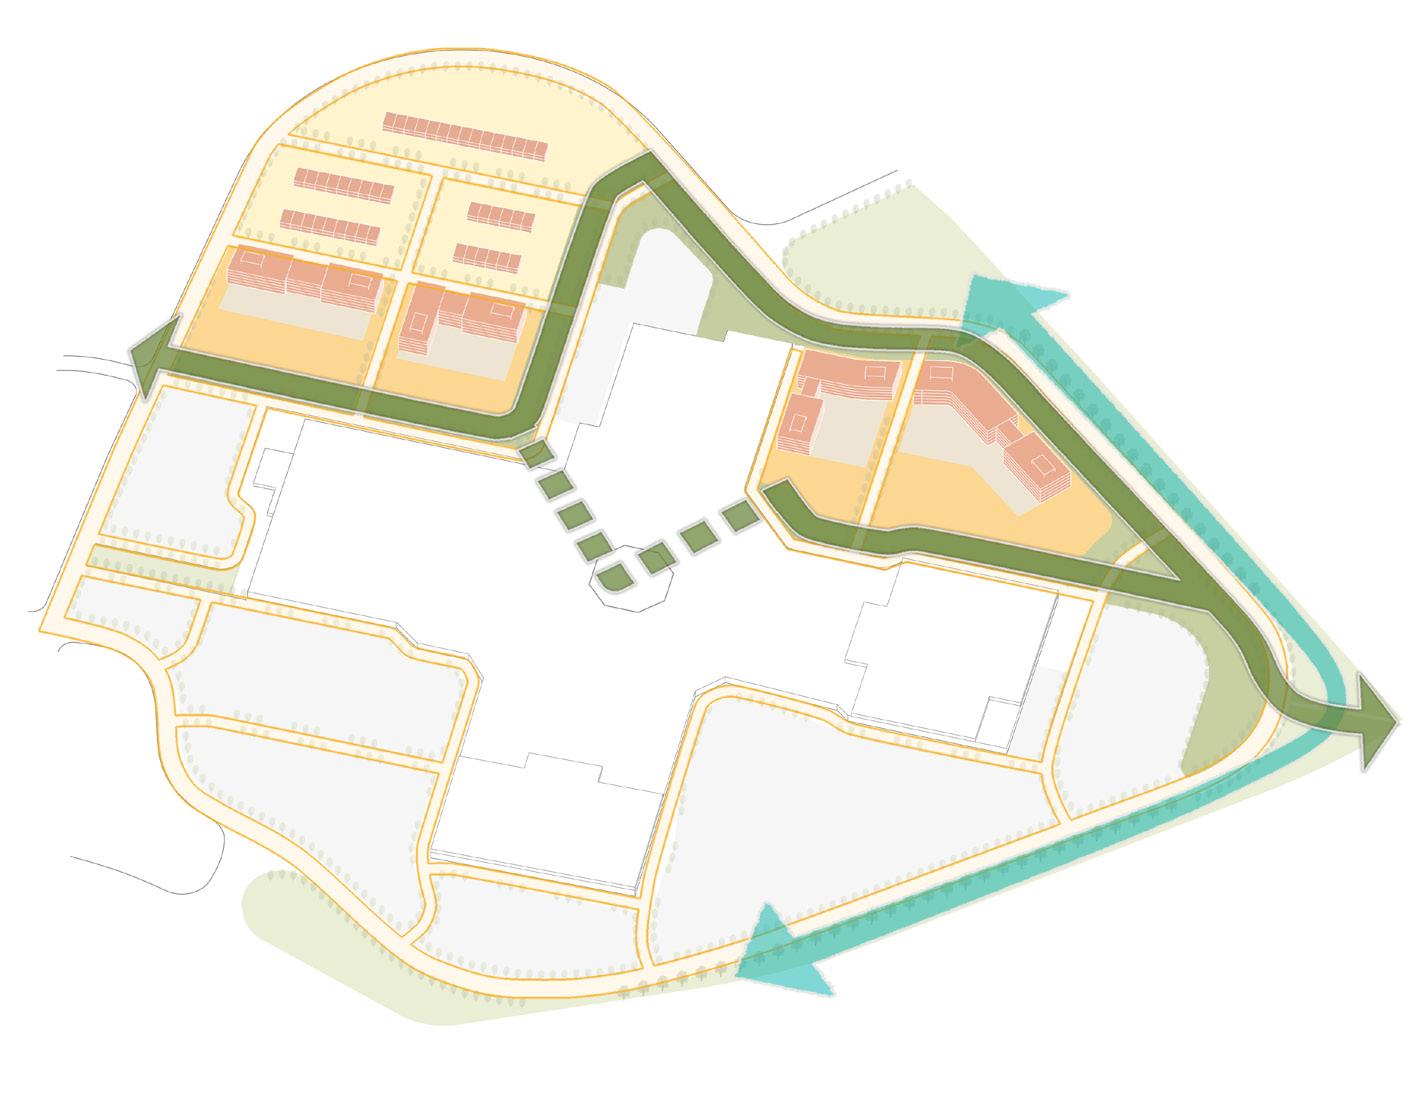


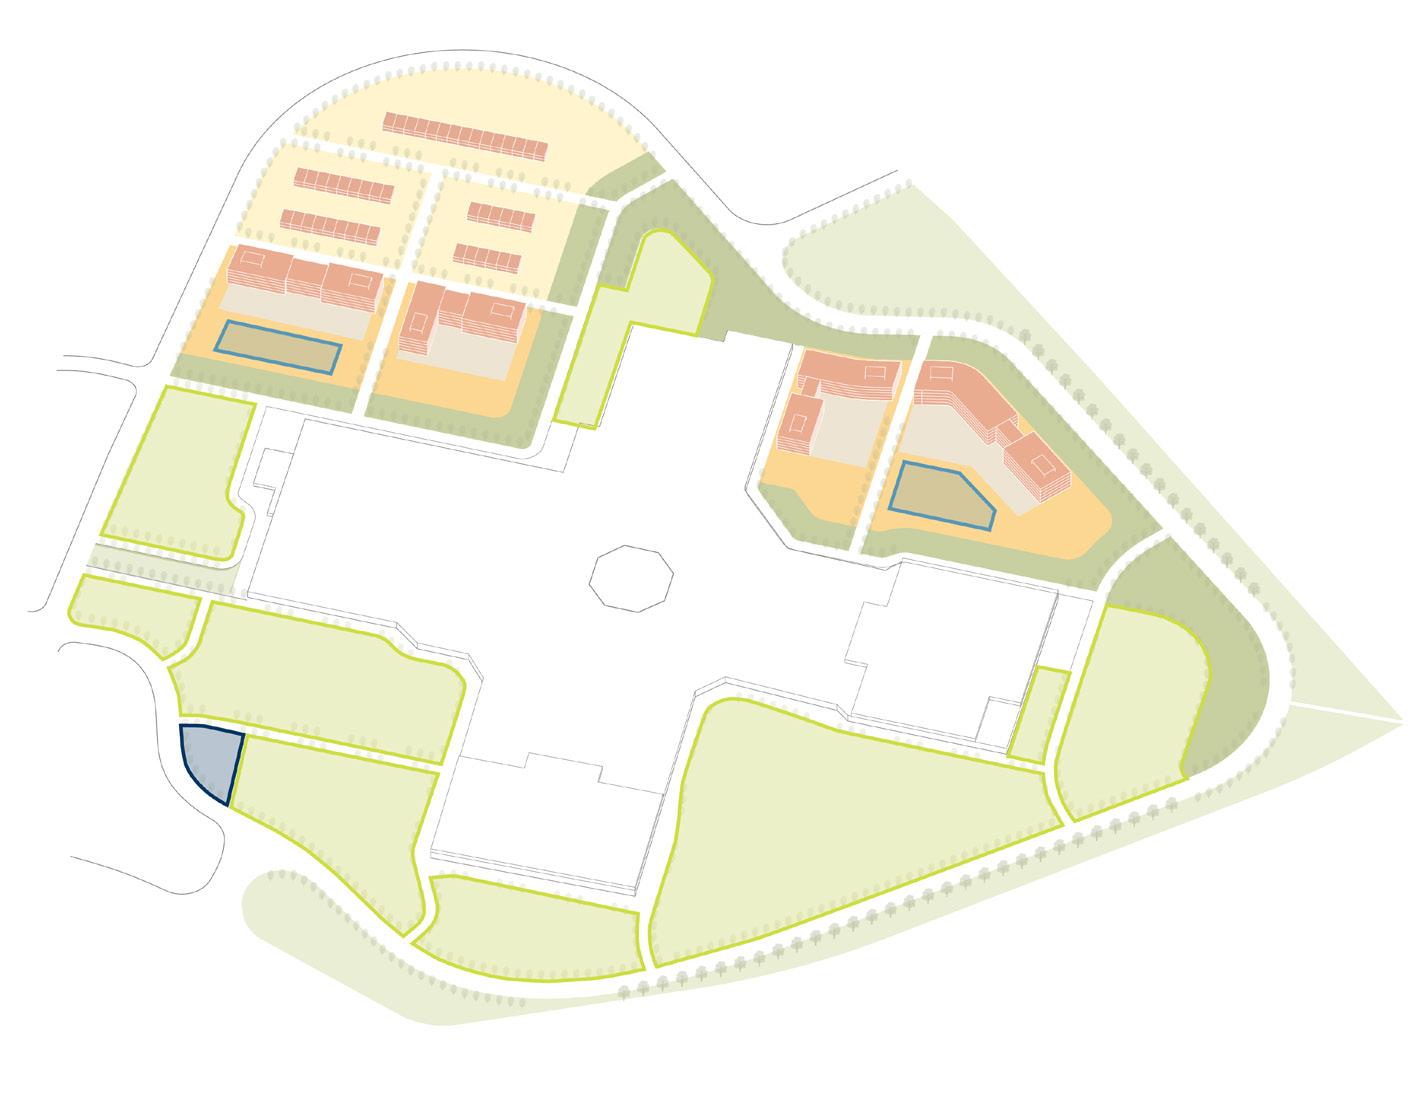

Figure 49: Distribution of green infrastructure—Scenario One.
Continuous tree trenches
Linear bioretention
Tree belts
Rain gardens
Green parking
Bioswales
Green Parking
Green parking islands and perimeter planting strips distribute trees evenly across the parking areas, providing shade and reducing heat gain for pedestrians and parked vehicles. Each lot includes a 5-foot perimeter green strip and 5-foot planting bays for every eight parking spaces, achieving about 5% landscaped area within the lots and creating shaded, visually softened parking.

Tree Belts
Double rows of trees are placed along the Ring Road facing Route 30. This layered planting helps reduce traffic noise and filter air pollutants from the highway. The tree installations are supported by the City Tree Planting Program, at approximately $250 per tree, including inspection and first-year watering.

Continuous Tree Trenches
Street trees are planted in continuous tree trenches approximately 4–5 feet wide along sidewalks, rather than in isolated pits. These linear tree trenches allow shared rooting volume, improve stormwater infiltration, and support healthier canopy growth while creating a unified green edge for pedestrians.

Figure 50: Example of green parking.
Figure 51: Example of tree belts.
Figure 52: Example of continuous tree trenches.
Linear Bioretention
Linear bioretention planters are integrated with the main pedestrian corridors, forming a green promenade where planting beds and walkways together create a 40–60-foot-wide landscape corridor. These planters intercept and treat runoff from adjacent streets and plazas while also functioning as everyday open space for walking, seating, and informal recreation.

Rain Gardens
Walkable rain gardens are located within each residential cluster, designed as small neighborhood greens that collect roof and courtyard runoff. Planted basins with seating and paths provide both stormwater storage and intimate social spaces for residents, turning necessary infrastructure into a visible amenity.

Bioswales
Bioswales without pedestrian access are placed in the southwest low-lying portion of the Park City site, where ponding risk is highest. These broad, planted swales capture, convey, and infiltrate runoff from the surrounding development while serving as a vegetated buffer and reducing downstream flood risk.

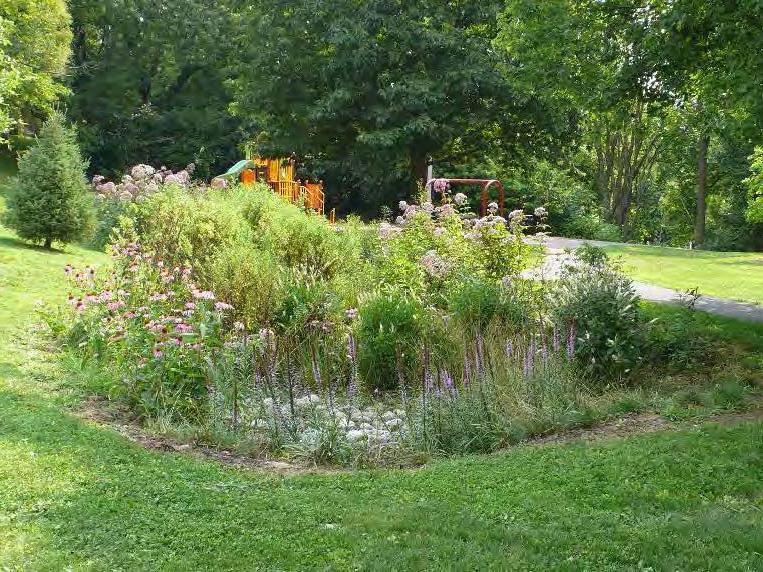
Figure 53: Example of linear bioretention.
Figure 54: Example of rain gardens.
Figure 55: Example of bioswales.
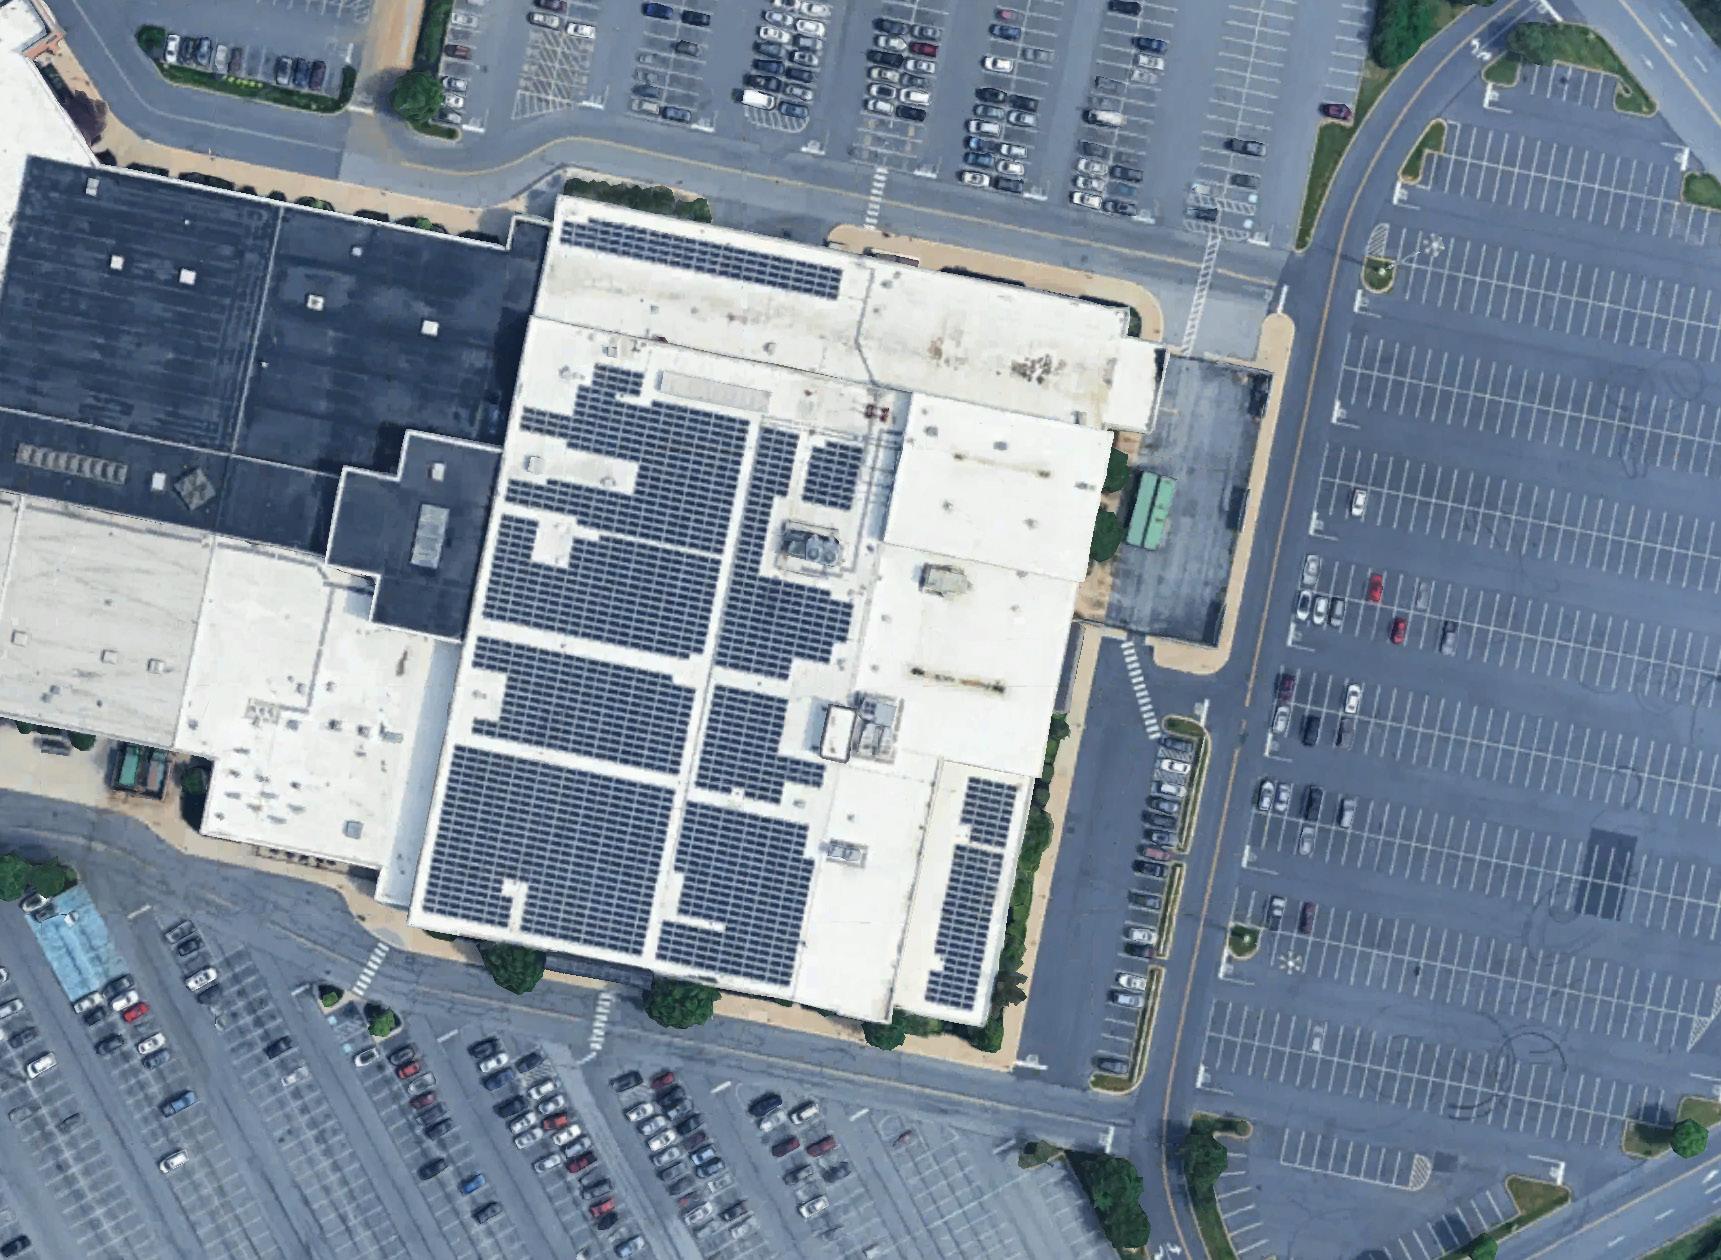
Energy and Decarbonization
Today at Park City Center, only the Boscov’s building has rooftop solar panels. The remaining large expanses of flat roof remain unused for generating renewable energy. Scenario One proposes a coordinated solar and electric vehicle (EV) strategy to help decarbonize Park City electricity use and to support cleaner mobility.
Scenario One concentrates solar panels on existing commercial structures and new residential buildings based on the assumption that
approximately 50% of the commercial roof area and 30% of new residential roofs can support solar panels. This corresponds to a system with a capacity of roughly 4.3 MW (megawatts or millions of watts) that could generate on the order of 5.7 GWh (gigawatts or billions of watts) of electricity per year.15 The solar investments would cost approximately $5.15 million, and annual generation at this scale is comparable to the electricity use of around 540 average households.16
Scenario One provides 40 Level 2 chargers located in commercial parking areas adjacent to the new residential buildings so that residents and visitors can share the infrastructure and take advantage of off-peak charging periods. Total installation cost for the chargers is estimated at about $400,000. The charging network is expected to deliver roughly 0.52 GWh of electricity per year.
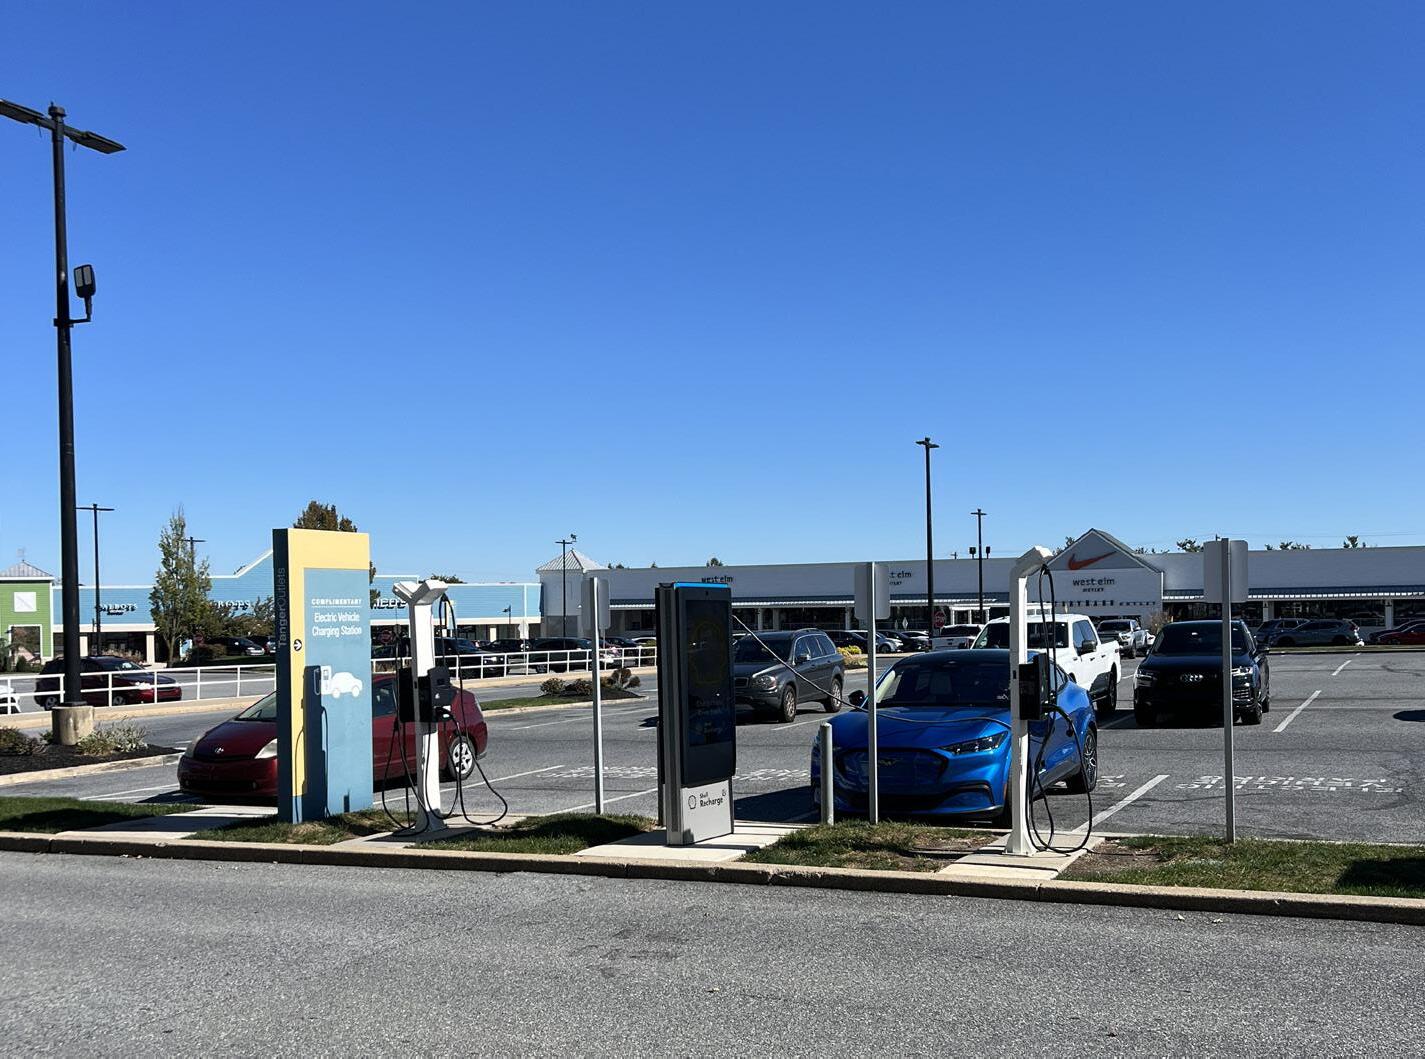
Figure 56: Existing solar panels on Boscov’s roof.
Figure 57: Existing EV charger at Tanger Outlets.
Commercial Strategy
The retail and commercial component in Scenario One involves selective changes rather than a full-scale overhaul. The existing mall structure is retained, but the two outdoor buildings—the tire store and the circus—are demolished. Several key spaces such as the JCPenney unit and current vacancies are reimagined to achieve a somewhat more community-oriented retail mix.
Scenario One has three main goals:
1. Add daily amenities and essential services to meet the needs of new residents and nearby workers;
2. Evolve Park City Center into a more dynamic regional destination for shopping, dining, and entertainment;
3. Strengthen the local economy by supporting small businesses, local makers, and service-based enterprises.
Park City Center currently lacks many of the essential services required to support a complete and balanced community. The site has no grocery store, bank, pharmacy, or urgent care facility, and childcare options remain limited. Existing non-retail tenants, such as Little Pasitos Bilingual Preschool and the Lancaster County Academy, provide valuable educational services but are undersized and insufficient to accommodate future residential growth. While entertainment options exist, they primarily serve youth and teenagers, and cultural or community-oriented uses are notably underrepresented. This absence of everyday amenities and civic functions limits Park City Center’s ability to evolve into a fully integrated mixed-use district.
Daily Amenities and Essential Services
Grocery and Food Access
A key component of Scenario One is the introduction of a neighborhood-scale grocery anchor to serve both new Park City residents and existing nearby households. Within a two-to-threemile radius, there are several traditional supermarkets that meet regional grocery needs. However, these stores are not conveniently located or accessible by walking or biking from Park City. To address this gap, we recommend adding a smaller-format grocer such as Trader Joe’s. The store’s compact footprint would maximize space efficiency and provide walkable access for new residents, while its private-label product selection would help differentiate it from nearby supermarkets, attracting outside shoppers. In addition, Trader Joe’s focus on in-store shopping, without offering online sales or delivery services, encourages frequent visits and supports both daily convenience and the mall’s overall economic vitality.17
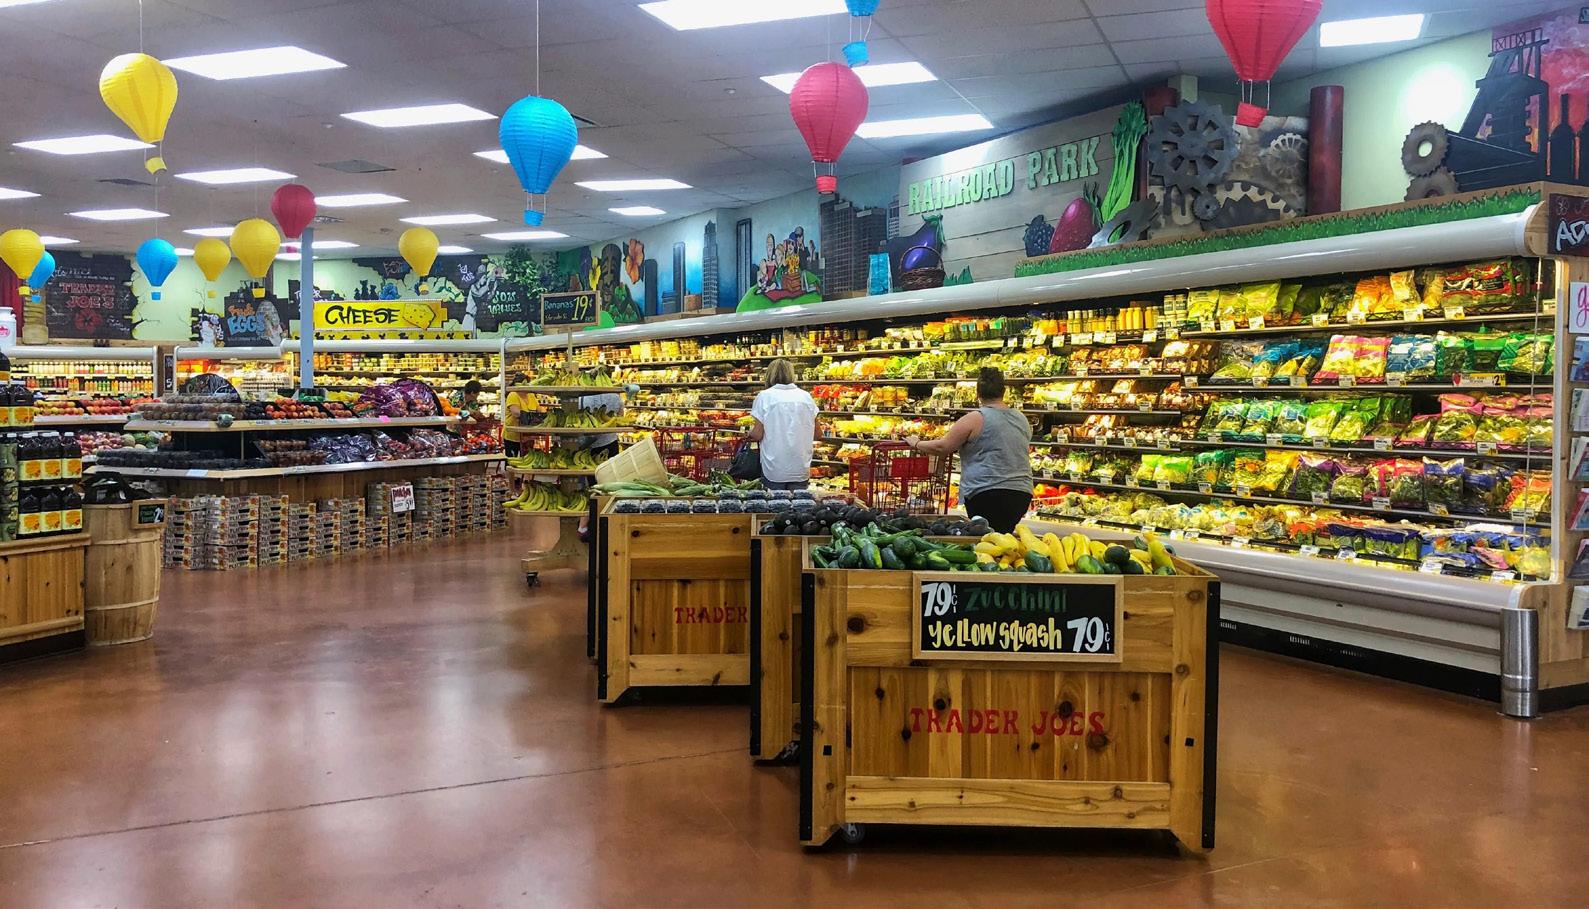
Figure 58: Example of grocery stores.
Healthcare and Pharmacy
A second major addition is healthcare services. This includes recruiting a CVS with a MinuteClinic, thus combining pharmacy services, basic medical care and convenience goods in one destination. The CVS model provides prescription fulfillment, over-the-counter medicine, vaccinations, screenings, and routine clinical services. Alongside CVS, we envision a walk-in urgent care center to expand access to immediate healthcare for residents and workers, ensuring that the redeveloped Park City Center provides convenient healthcare services for the surrounding community.
Childcare and Family Services
With new families moving into Park City Center, childcare represents a critical community need. The existing Little Pasitos Bilingual Preschool provides a strong foundation but currently operates with limited capacity. We suggest adding infant and toddler care, afterschool programs, and enrichment activities. Such an expansion would transform childcare into a community asset, supporting both residents and workers while contributing to the new mixed-use and community-oriented character of Park City Center.
Financial and Daily Services
We recommend a bank branch to provide essential financial services for residents and employees, particularly for those without access to mobile or online banking. This addition would improve financial inclusion and enhance daily convenience within the Park City Center neighborhood.
Pet Services
Another service gap involves pet care. With more than two-thirds of U.S. households owning a pet, demand for supplies, grooming, and boarding is both strong and sustained. Introducing a pet service center such as Dogtopia, which offers a combination of daycare, boarding, and spa services, would generate steady weekly or biweekly visits, support consistent foot traffic, create local employment opportunities, and enhance Park City Center’s overall mix of services.18
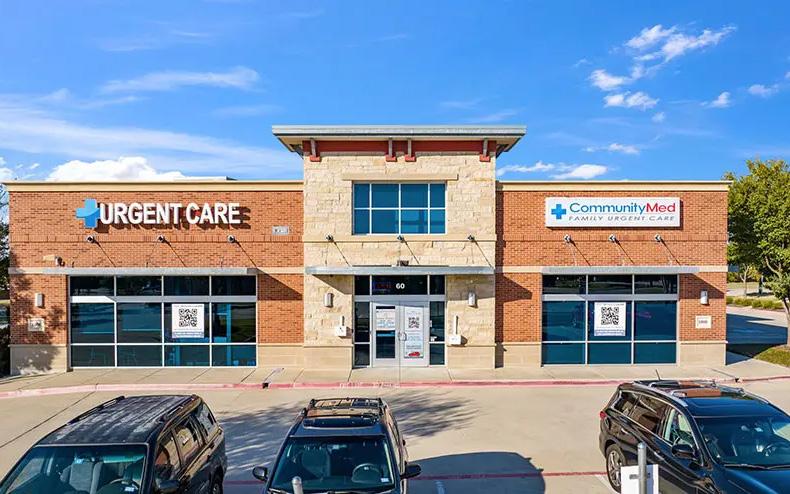
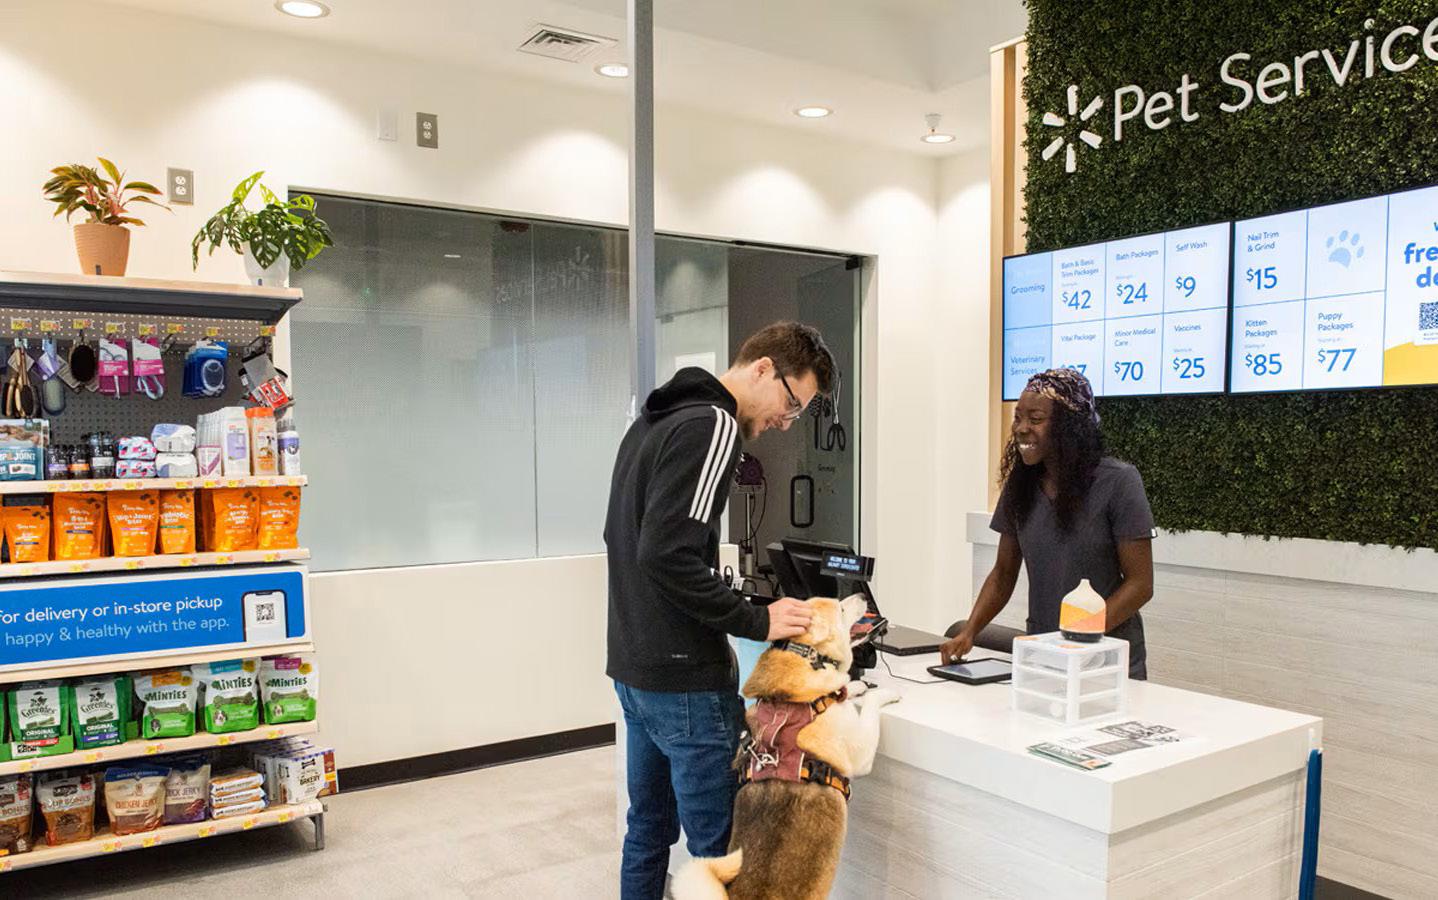
Figure 59: Example of community urgent care center.
Figure 60: Example of pet service center.
A More Dynamic Regional Destination
Food and Dining Upgrades
Scenario One also includes modernization of the existing food court to improve the quality of the dining experience and strengthen Park City Center’s economic performance. Although traditional mall traffic has declined, food court revenues nationwide have increased by an average of 8.7 percent annually over the past five years, reaching $574 million in 2024, according to Food & Beverage Magazine. 19 This trend highlights the growing role of food court dining as a key driver of customer engagement and revenue generation within mall environments. Planned improvements at Park City include upgraded seating, enhanced aesthetics, and a broader tenant mix, creating a more inviting and socially active dining space that encourages longer stays and repeat visits.
Cultural and Entertainment Amenities
To introduce cultural offerings, we propose a community theater with flexible performance space capable of hosting local plays, comedy nights, open-mics, small concerts, and seasonal events. This addition would help establish Park City Center as a community hub for social engagement. To further strengthen connections with the local economy, the outdoor site would be repurposed for a weekly local market featuring food, crafts, art, lifestyle goods, and live performances. The market would promote local entrepreneurship and increase visibility for small businesses.
Strengthen the Local Economy
Workforce Development
To support employment and skill development, Scenario One includes a Job and Skills Center that connects residents with local job opportunities and provides workforce training programs. In partnership with the Lancaster County Career & Technology Center, the Job and Skills Center would advance the goals of the Lancaster County Workforce 2030 plan, which seeks to build a thriving, workready community by the end of the decade.20
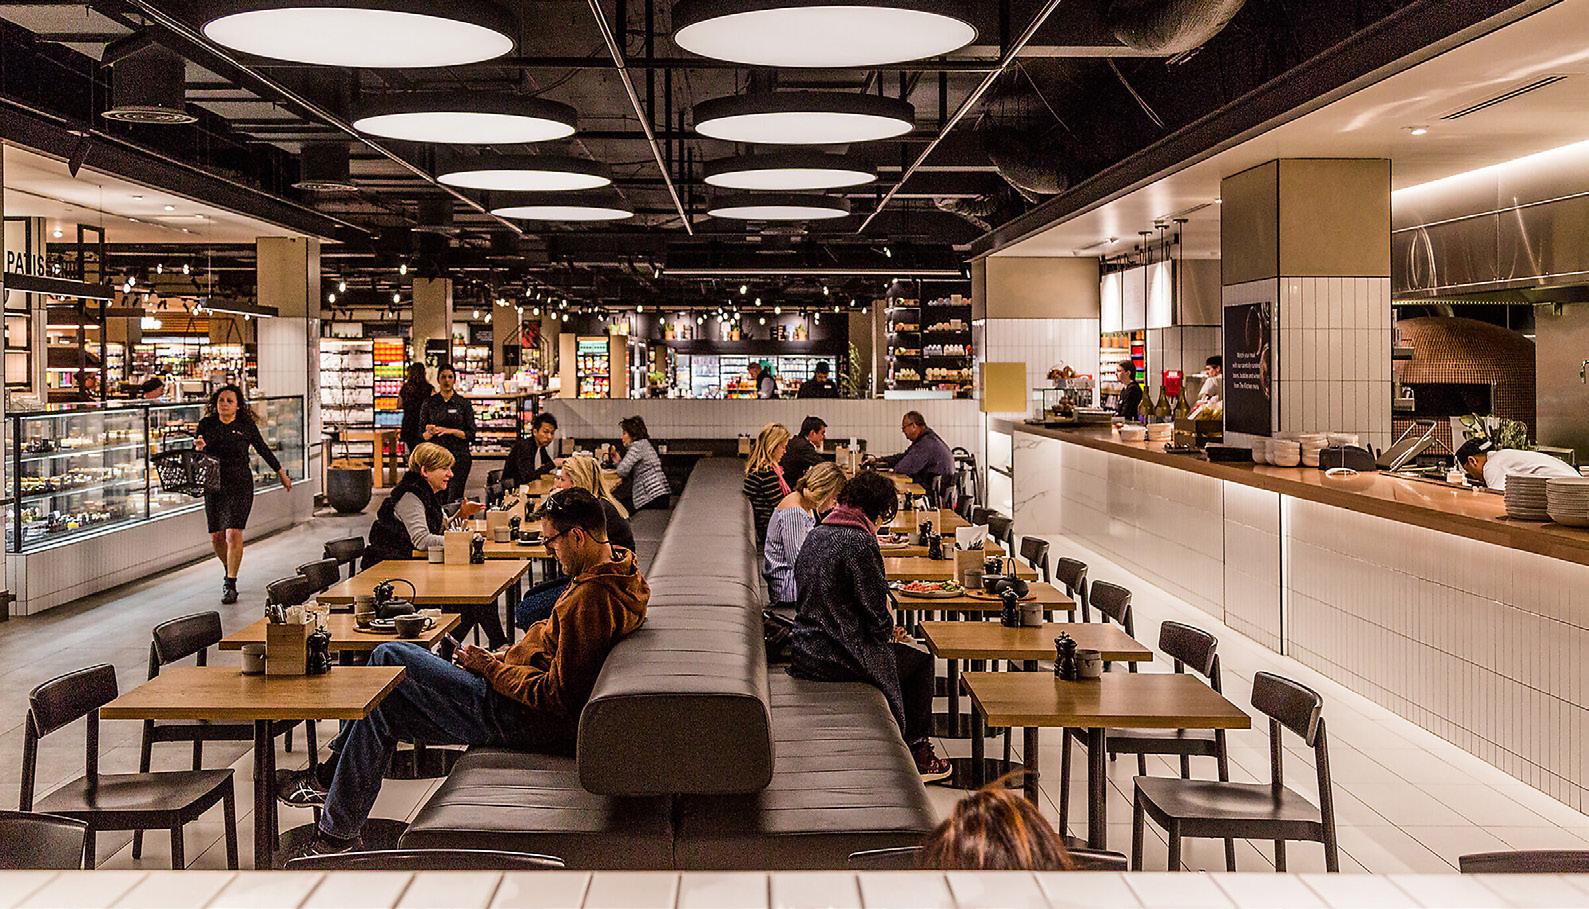
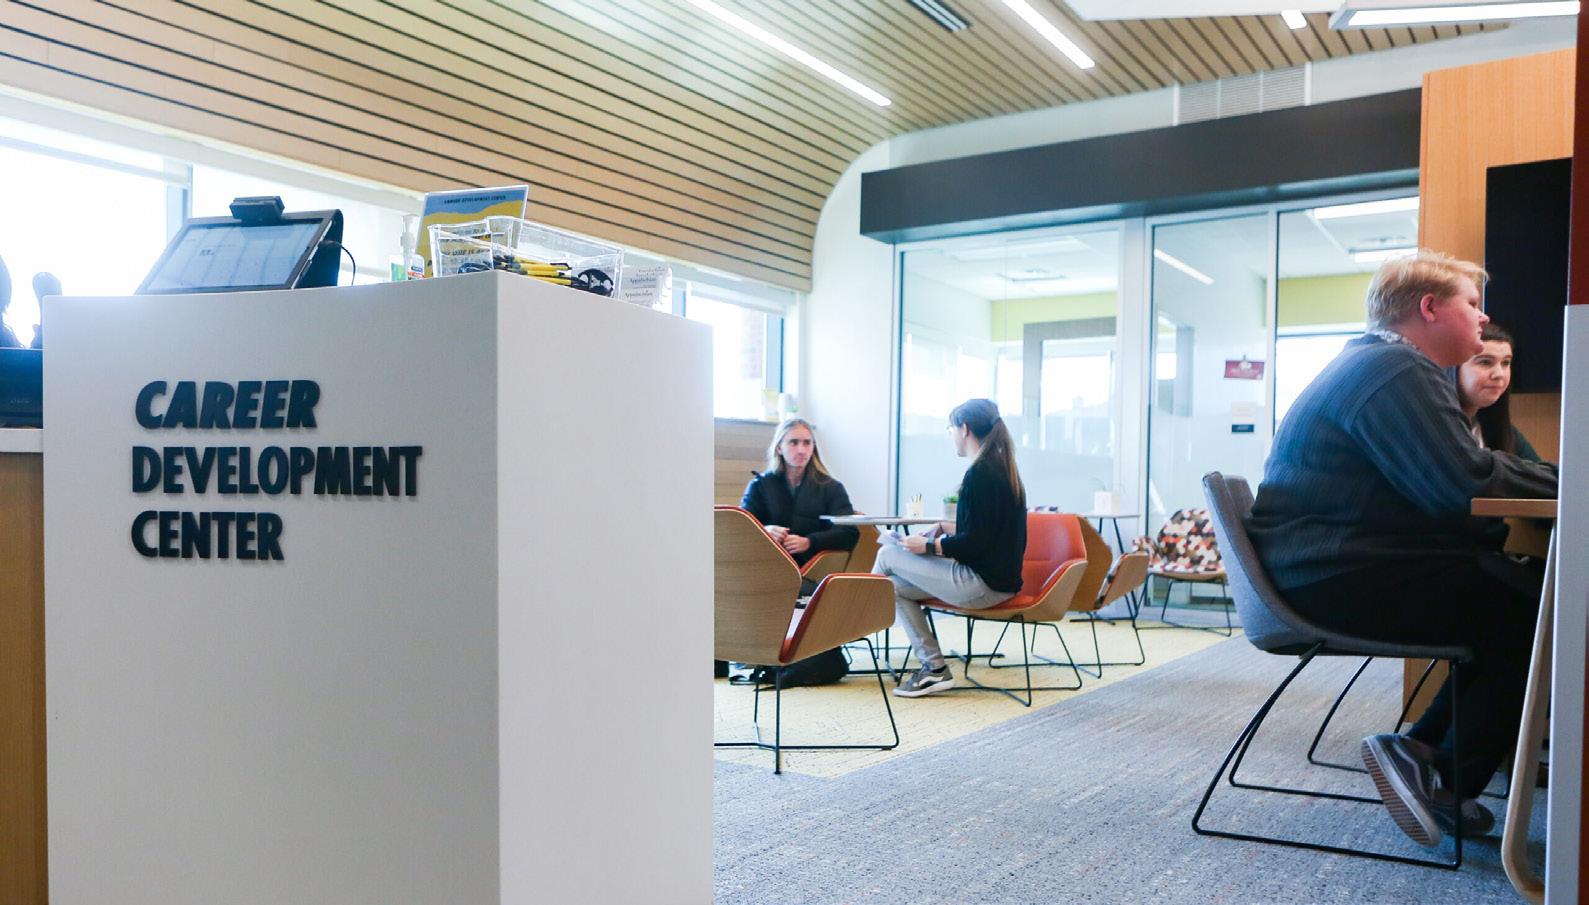
Figure 61: Example of food court.
Figure 62: Example of career development center.
Construction Costs
In order to determine whether the proposed development plans are feasible, we modeled out a 5-year pro forma analysis of the new construction alone (meaning inclusive of all costs for the proposed development, not inclusive of urban design, environmental, or other improvements). To determine base costs for the project, we used RSMeans 2025 construction data to get rough order-of-magnitude estimates.21 This process involved determining building specifications based on design and zoning standards as well as unit mix and size, then taking building materials, amenities, and square footages to calculate a total construction cost, then applying a location and size adjustment (to capture economies of scale and local labor/development costs). Our unit mix and unit sizes are based on a survey of multifamily buildings without our competitive set: new construction within a mile radius of the Park City site.
Table 15: Scenario One multifamily building size calculations.
Multifamily Construction Costs
Townhome Construction Costs
After calculating our hard costs estimate, we applied different construction assumptions for soft costs and acquisitions. In Scenario One, we assume Brookfield undertakes the project, therefore in-house design and legal teams would translate to cost savings and no acquisition cost.
Table 17: Table of sources and uses.
Once we resolved total construction costs, we looked at the local market and made assumptions about rent, vacancy, financing, and operations. We used a CoStar regional and local market analysis to validate our assumptions—though new construction is likely to be at the top of the market in rent per square foot, we wanted to make sure our offerings were not out-of-line with what Lancaster could support.22
Finally, we took these assumptions and modeled discounted project cashflows for a five-year holding period, making slight adjustments to the design and unit mix until the project penciled—this was more to verify proof-of-concept than an actual project recommendation.
DCF Assumptions
Table 18: Discounted cash flow analysis and assumptions.
Discounted Cash Flow Analysis
Table 19 shows the reversion information for the project. We estimate the single-family attached homes would cost roughly $19.1 million and the multifamily would cost around $75.7 million for a total of approximately $95 million. In order to capture some project variability, we made some more conservative assumptions for loan-tovalue, interest rate, and cap rate. Based on the above, we estimate that the project will have a net present value (NPV) of about $3.3 million (with a 6.8% discount rate) and an internal rate of return (IRR) of 9.57%. Our discount rate was determined by using Brookfield Properties’ publicly available weighted average cost of capital (WACC).23
Furthermore, based on these calculations, we determined average asking rents at $1,845 per month for a 755 square foot unit. While this is expensive, it does fit within our competitive set and is supported by our broader market analysis. Additionally, without needing to incorporate land acquisition into the sales price for our singlefamily attached townhomes, we estimate listing price at just over $390K, which includes a 20% profit for the developer. Assuming a standard 20% down (80% loan-to-value) with a mortgage rate of 6.20%, these homes will be affordable to households earning roughly $78K annually (affordable defined as housing costs are no greater than 30% of annual income).
Table 19: Reversion information.
20: Cash flow at sale and housing costs.
Summary
Scenario One builds on the commercial success at Park City Center while working toward the City’s goal of providing more housing and upgrading the stormwater management with a decrease in impervious surface area and the addition of green spaces and trees.
Scenario One proposes a mixed-use zoning overlay and the construction of 360 single family attached and multifamily residential units, expected to attract around 750 new residents. Scenario One envisions a more modern mall food court and provides new essential services, including a grocery store and healthcare facilities. The parking area is reduced by 46% to allow for new green spaces for leisure, green infrastructure for stormwater management, and a shared-use path to connect the mall to the residential areas and Long’s Park. This optimizes the utility of the parking area in transformative ways without sacrificing the minimum number of parking spaces required to support current and expected visitation patterns. Scenario One would also update the Park City bus stop and doubles bus frequency to downtown Lancaster. Through these measures, Park City will become more than just a mall. It will also become a neighborhood, a nexus between Long’s Park and the Blue Green Connector, and an inspiration for future mall redevelopments.
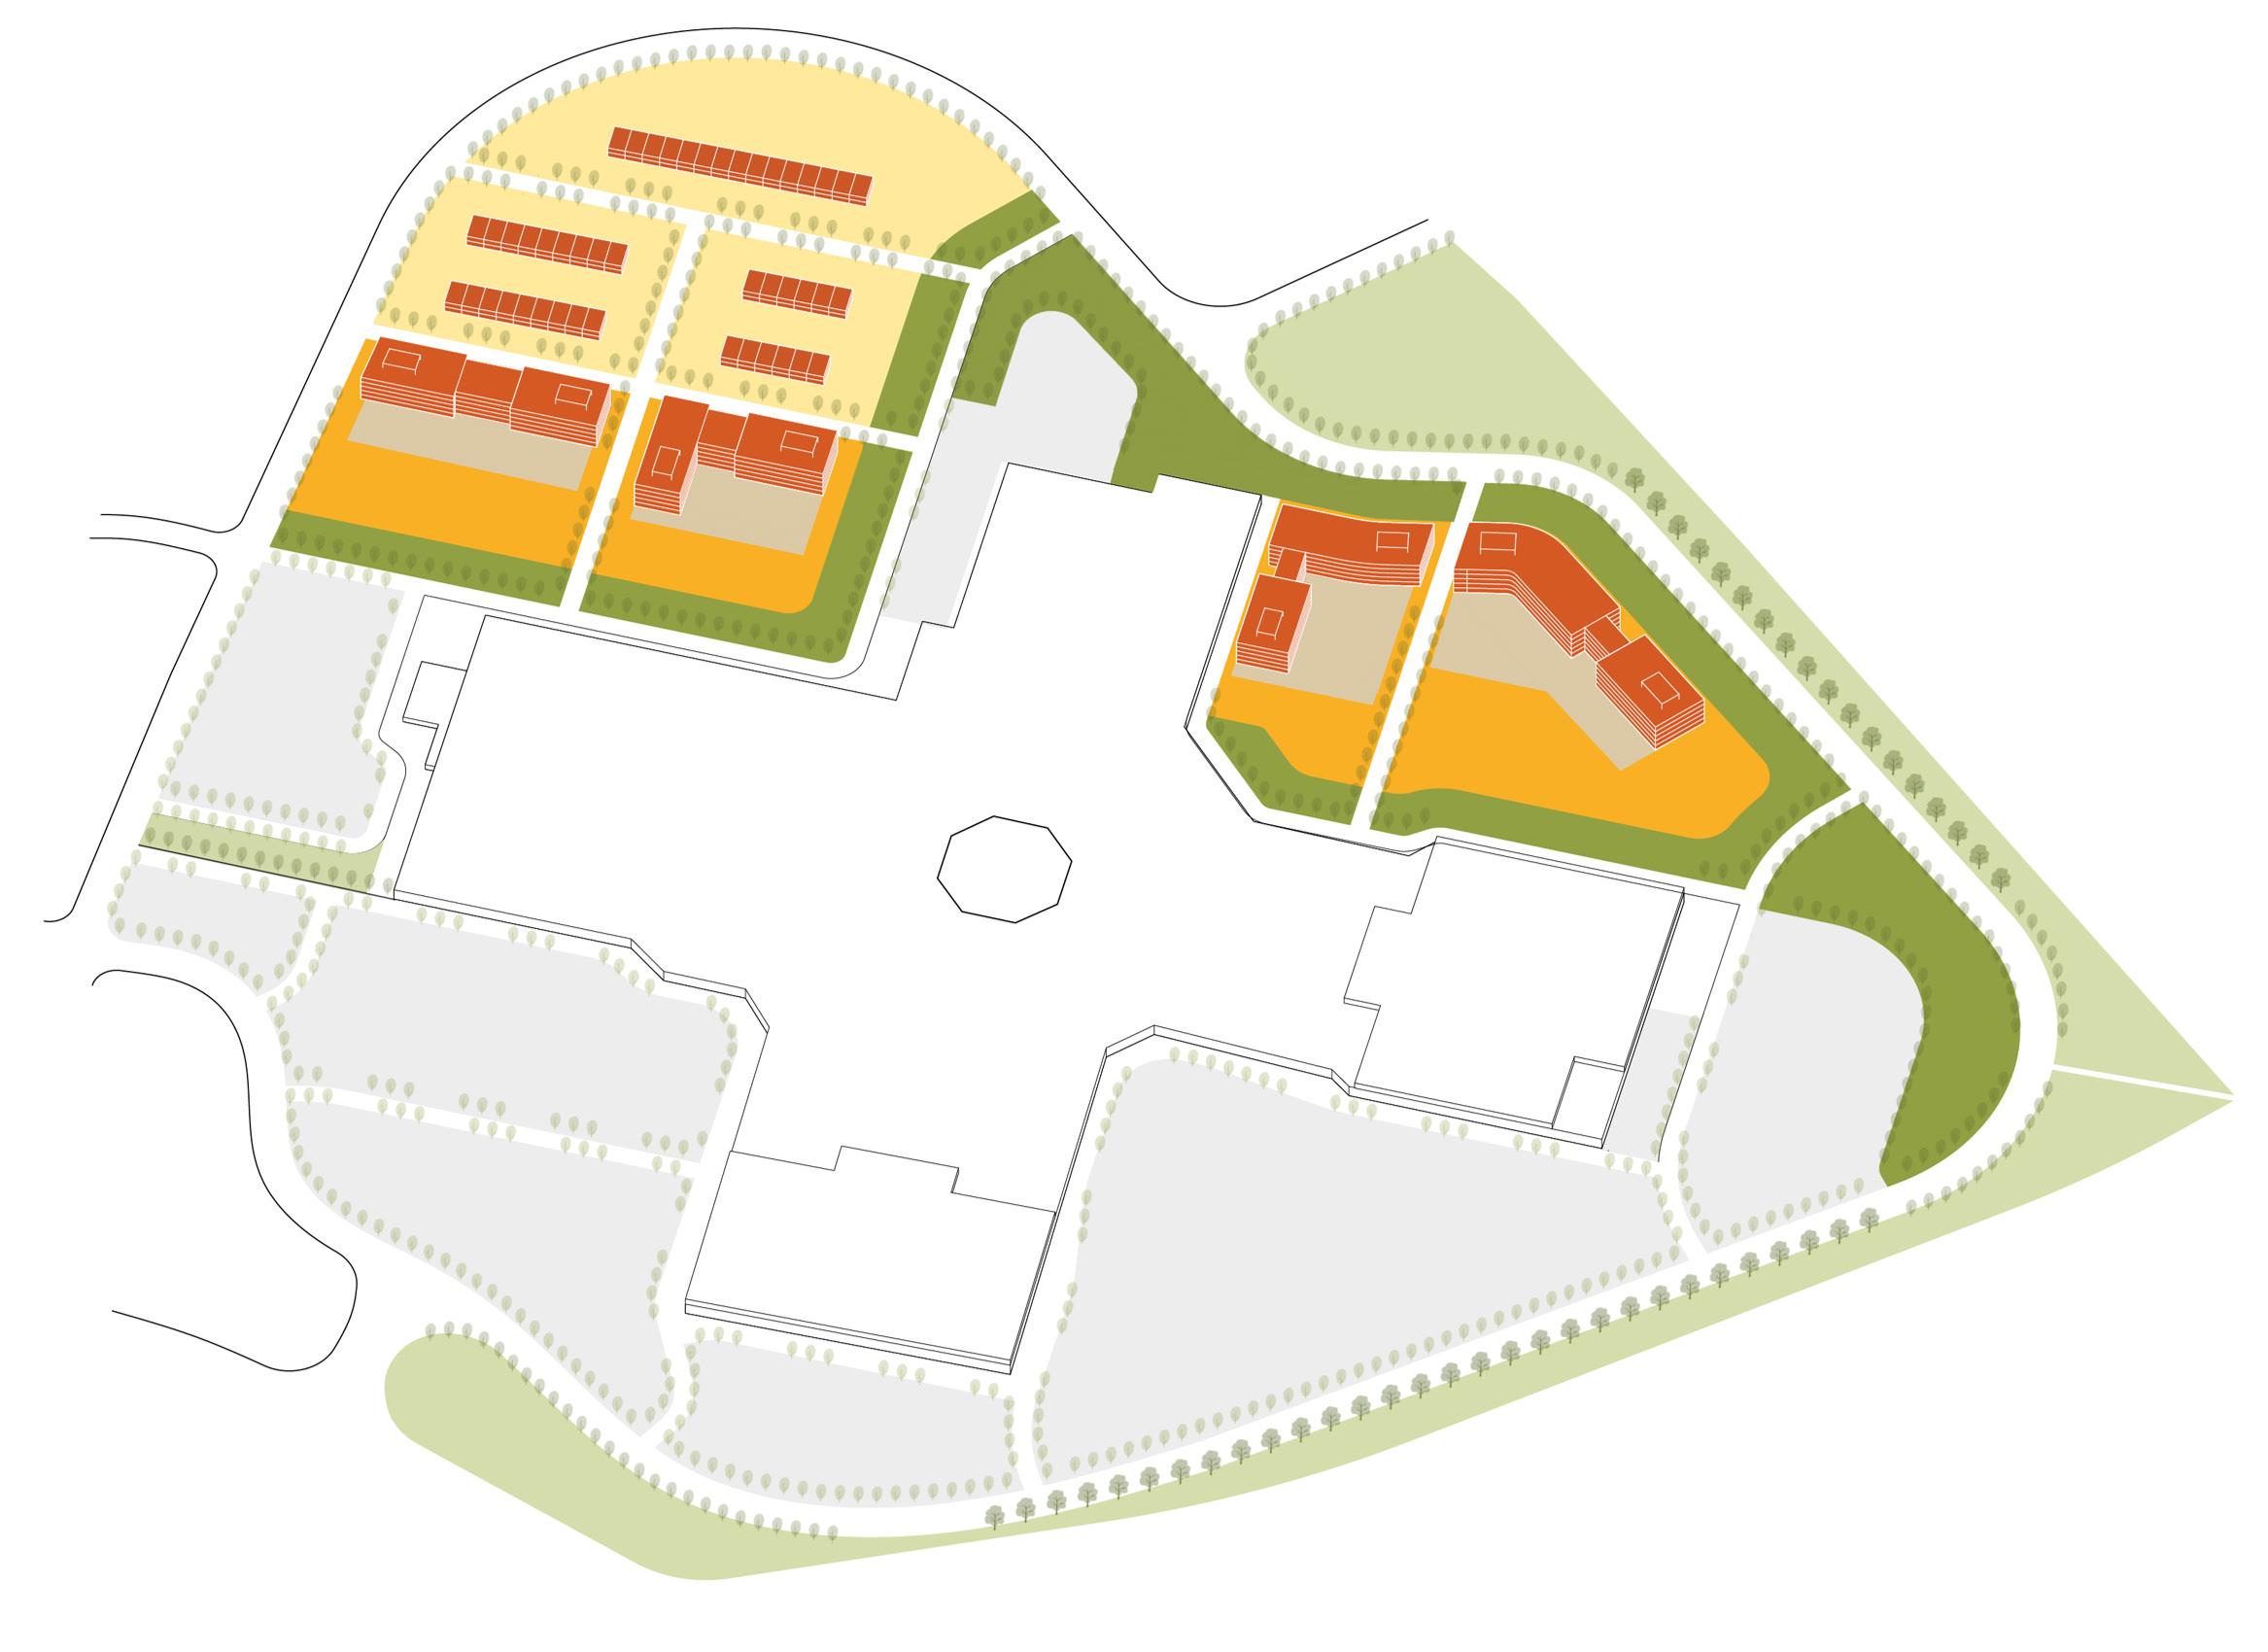
Figure 63: Rendering of Scenario One.
Scenario Two
Scenario Two envisions a total transformation of the Park City Center based on a town center design with townhomes and multifamily housing blended with commercial buildings and a green space path that links to Long’s Park and the Blue Green Connector. All of the buildings in the Business-as-Usual Scenario are demolished. The number of housing units in Scenario Two is greater than in Scenario One and the square footage of commercial space is reduced. Scenario Two has less impervious surface and fewer parking spaces than Scenario One along with more green space for enhanced stormwater management and the enjoyment of residents and visitors.
Proposed Zoning Framework
Scenario Two envisions a stand-alone zoning district titled the MU-R (Mixed-Use Regional) Park City Center Neighborhood District, created to replace the current C-3 zoning in order to guide the complete transformation of the Park City site into a compact, walkable, and mixed-use town center.
The zoning proposal sets standards for the urban design and block layout, density, permitted uses, street network, parking, and open space. Together, these components aim to promote diverse housing opportunities, a well-connected street system, human-scale buildings, accessible green spaces, and climate-resilient infrastructure.
The zoning and design guidelines proposed in Scenario Two draw heavily from standards established for the Traditional Neighborhood Development (TND) district at Linglestown Road and Progress Avenue in Susquehanna Township, Dauphin County, PA.24
That TND district enables a compatible mix of residential and commercial uses—placing homes, shops, and offices within easy walking distance of each other. The TND design guidelines emphasize tree-lined, sidewalk-connected streets, traffic-calming features, neighborhood parks, and central gathering spaces, creating an inviting and cohesive community environment. These same qualities form the foundation of the vision outlined in Scenario Two.
Permitted Uses
Municipal, county, state, and federal buildings and facilities
Public/Utility Uses
Public transit support activities Telecommunications structure
Public libraries and community activity buildings Museums, Galleries, other cultural uses
Institutional Uses
Business schools and computer and management training
Churches and similar places of religious worship
Day care centers
Public park, recreational areas and greenways
Indoor and outdoor recreational facilities, with the exception of outdoor shooting ranges, race tracks, and amusement parks
Green Spaces
Elementary and secondary schools Schools for fine arts and language
Junior colleges, colleges, universities and professional schools Technical and trade schools
Recreational & Open Space Uses
Green Courts Courtyards
Bulk and Area Regulations
General regulations apply across the Park City site. Refer to “Design Guidelines” section for more detailed regulations applicable to each land use type.
Minimum Tract Area: 40,000 square feet for Multifamily and Mixed-use dwelling units; 10,000 square feet for freestanding Principal Nonresidential (Commercial, Office, Cultural) Building.
Maximum Dwelling Units Per Gross Acre
● Single-Family Detached and Single-Family Attached: 10
● Multifamily Dwellings (Apartments, AgeQualified Independent Living Units, and the like): 27
Minimum Side Yard: 20 feet for non-residential buildings and multiple family dwellings; 15 feet for other residential buildings.
Maximum Impervious Coverage of Site: 75%.
Community Gardens Passageways
Accessory Uses
Customary accessory uses and buildings incidental to any permitted uses
Minimum Principal Building Height: 20 feet.
Maximum Principal Building Height: 55 feet or 4 stories.
Parking
One space per 500 square feet of commercial floor area and one space per residential unit.
Table 21: Permitted uses in the MU-R (Mixed-Use Regional) Park City Center Neighborhood District.
Applicability & Streamlined Zoning Approval
The proposed MU-R Park City Center Neighborhood District includes clear criteria and a streamlined zoning approval process. If a development meets all the criteria of this new zoning district, it can be approved by right. Projects that are fully compliant with the standards will only need to go through an administrative approval process without discretionary review or a public hearing, which makes the process faster and more predictable. Developers will still need to complete the subdivision process for site plan approval.
This new zoning district provides an efficient path to creating a high-quality, mixed-use development that promotes a consistent neighborhood form and reduces uncertainty for both developers and the city.
Case Study: Traditional Neighborhood Development in Susquehanna, PA
This proposal is informed by the Traditional Neighborhood Development (TND) district established by Susquehanna Township in 2017 at Linglestown Road and Progress Avenue, known as Susquehanna Union Green. That project aims to transform a 19-acre greenfield site into a walkable, mixed-use community of homes, shops, and offices, which closely aligns with this scenario’s vision. Its implementation relied on amendments to both the zoning and Subdivision and Land Development Ordinances, using a form-based code that prioritizes physical form over land use to ensure predictable, high-quality development. The TND-1 district also requires a regulating plan that coordinates streets, blocks, open space, and building form at a fine-grained scale. Development proposals that comply with the established guidelines are approved by right, promoting predictability for both the township and developers, as the regulating plan cannot be changed without a formal ordinance amendment. A similar framework and set of design guidelines will achieve the desired outcomes for this scenario.
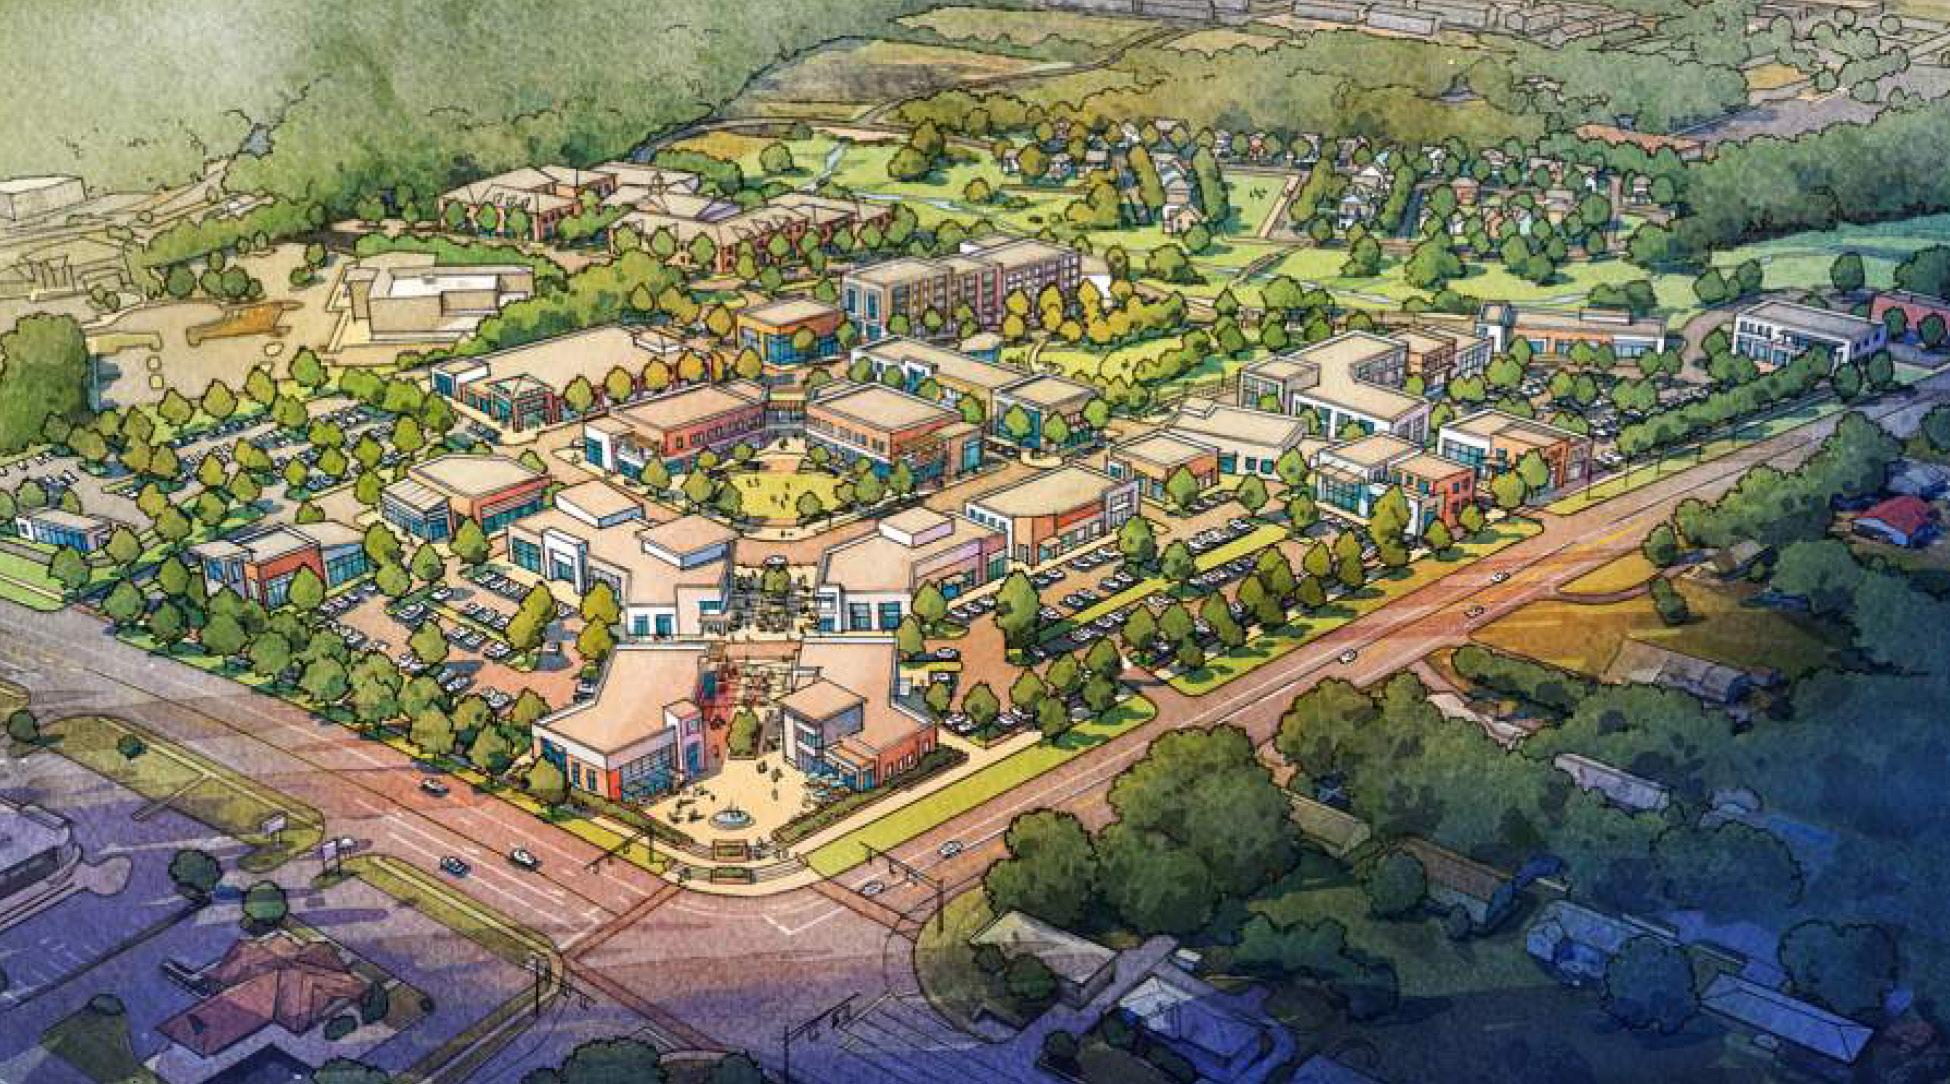
Figure 64: Susquehanna Union Green concept image.
Town Center Layout and Land Uses
Scenario Two removes all existing structures of the Park City Mall and reconstructs the interior circulation network. The proposal establishes a pedestrian-oriented town center organized around a central green corridor (see Figure 65, areas 4, 5, 6, 7, 8, 9, and 12).
Figure 66 presents the area in acres of the
different land use parcels shown in Figure 65. The amount of green space is notably greater than in Scenario One. The acres of the other land uses are about the same, but the public realm is much enhanced. The interior circulation features a grid street network, complemented by curved segments to reduce intersections and preserve the continuity of the central pedestrian spine.
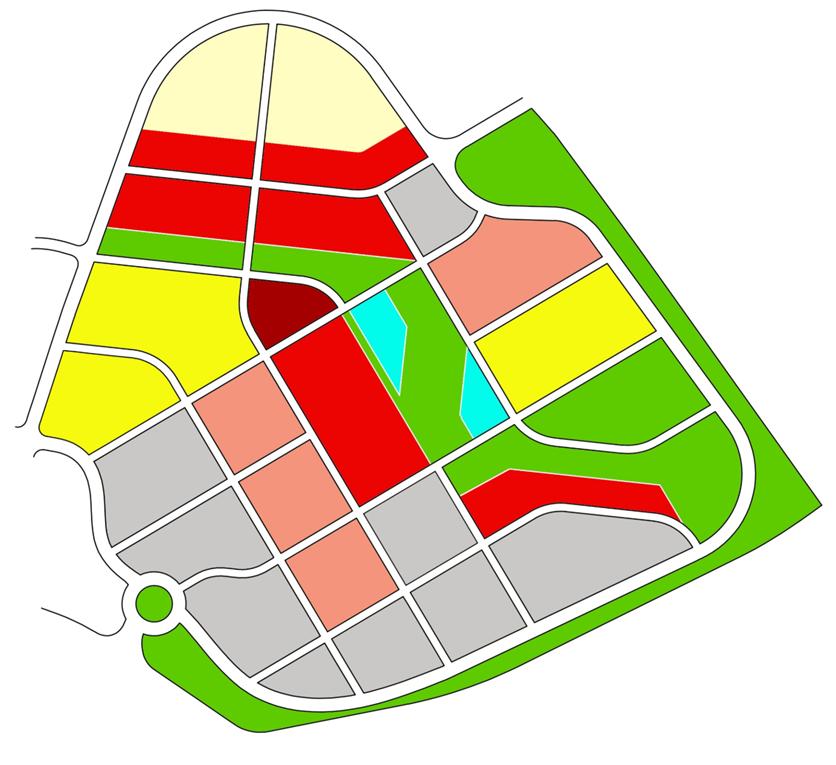
Note: All streets are two lanes with sidewalks; the map has not shown potential backstreets in residential lots.
Roads from adjacent areas extend into the Park City site without cutting across it, maintaining a cohesive circulation pattern while channeling cross-site traffic to Plaza Boulevard on the north. The ring road primarily serves parking access, whereas internal streets are designed to carry both residential and commercial local traffic.
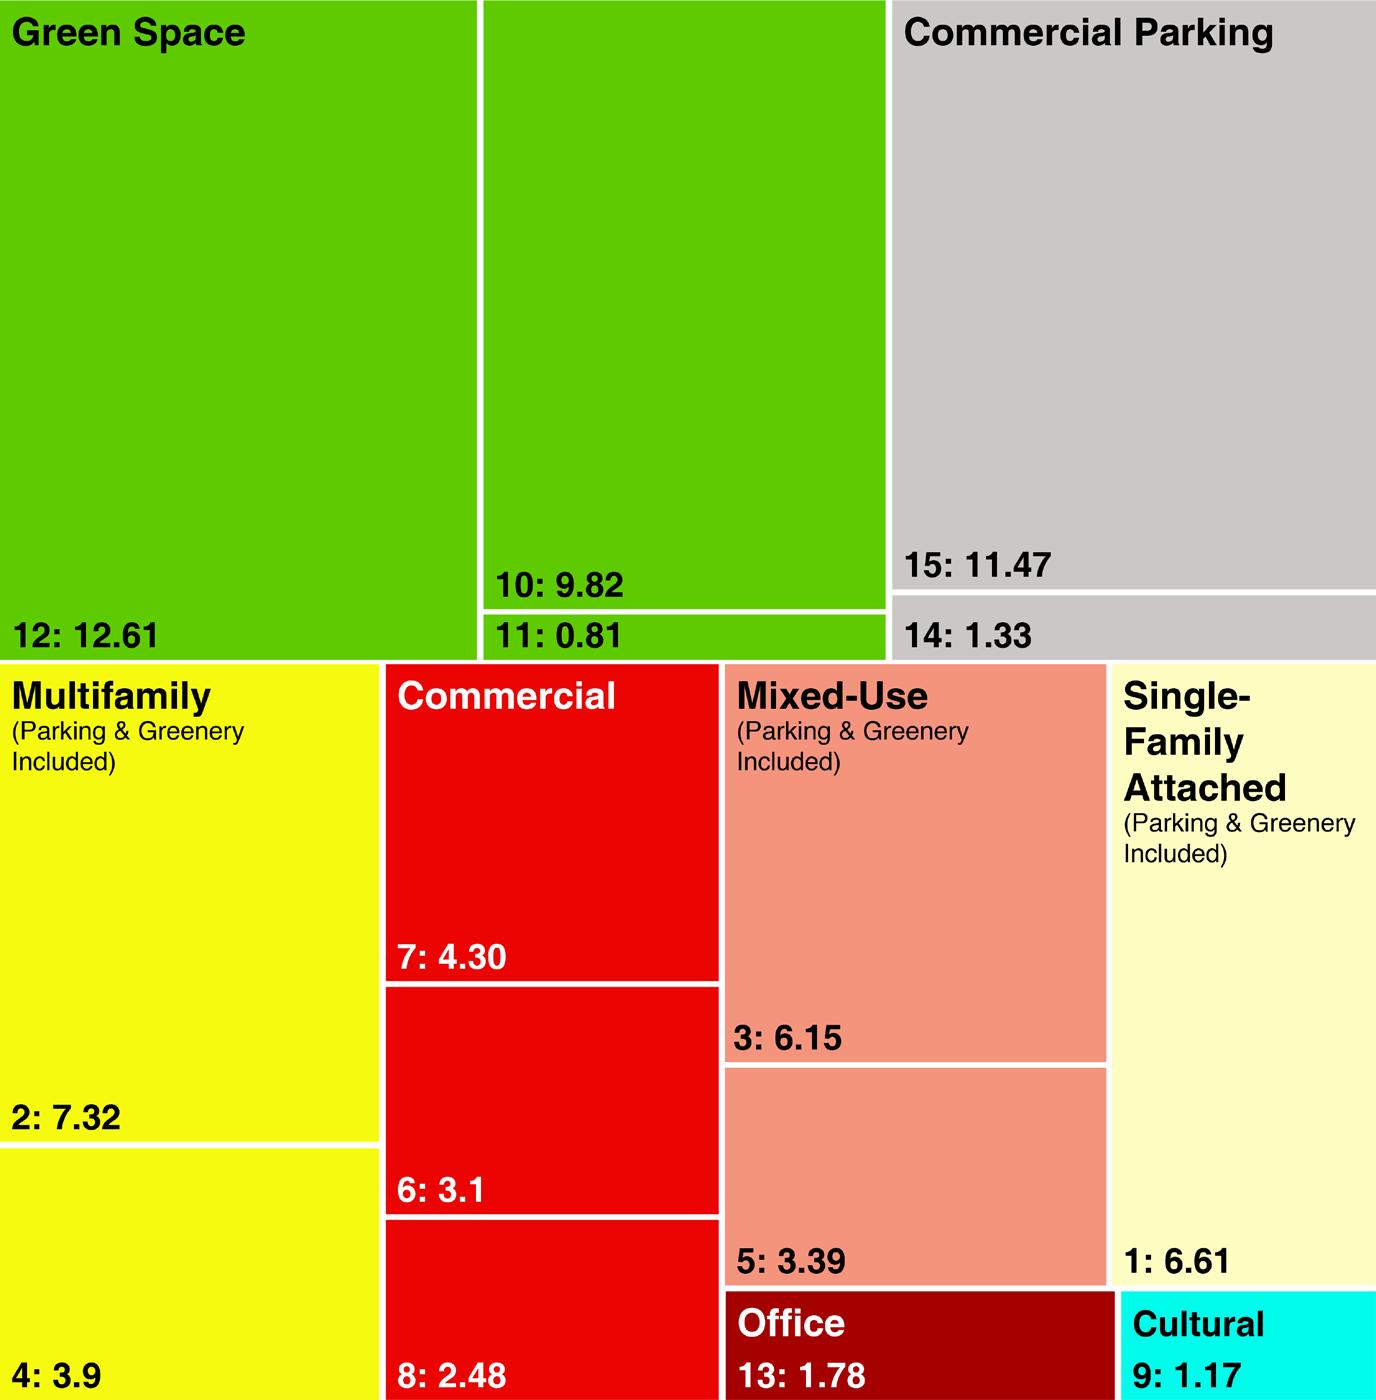
Figure 65: The proposed layout and land uses of the town center design.
Figure 66: The area of the proposed land uses.
The southeastern edge faces noisy Route 30, so it is used for parking and as a buffer for the rest of the site. The quieter northern area is reserved for singlefamily attached and multifamily housing, positioned near the southwestern and northeastern access points. Commercial uses cluster around the central green to strengthen walkability and activate the public realm, with a mixed-use band linking residential and commercial areas. The office building sits at the site’s center, while cultural facilities are arranged around the green space.
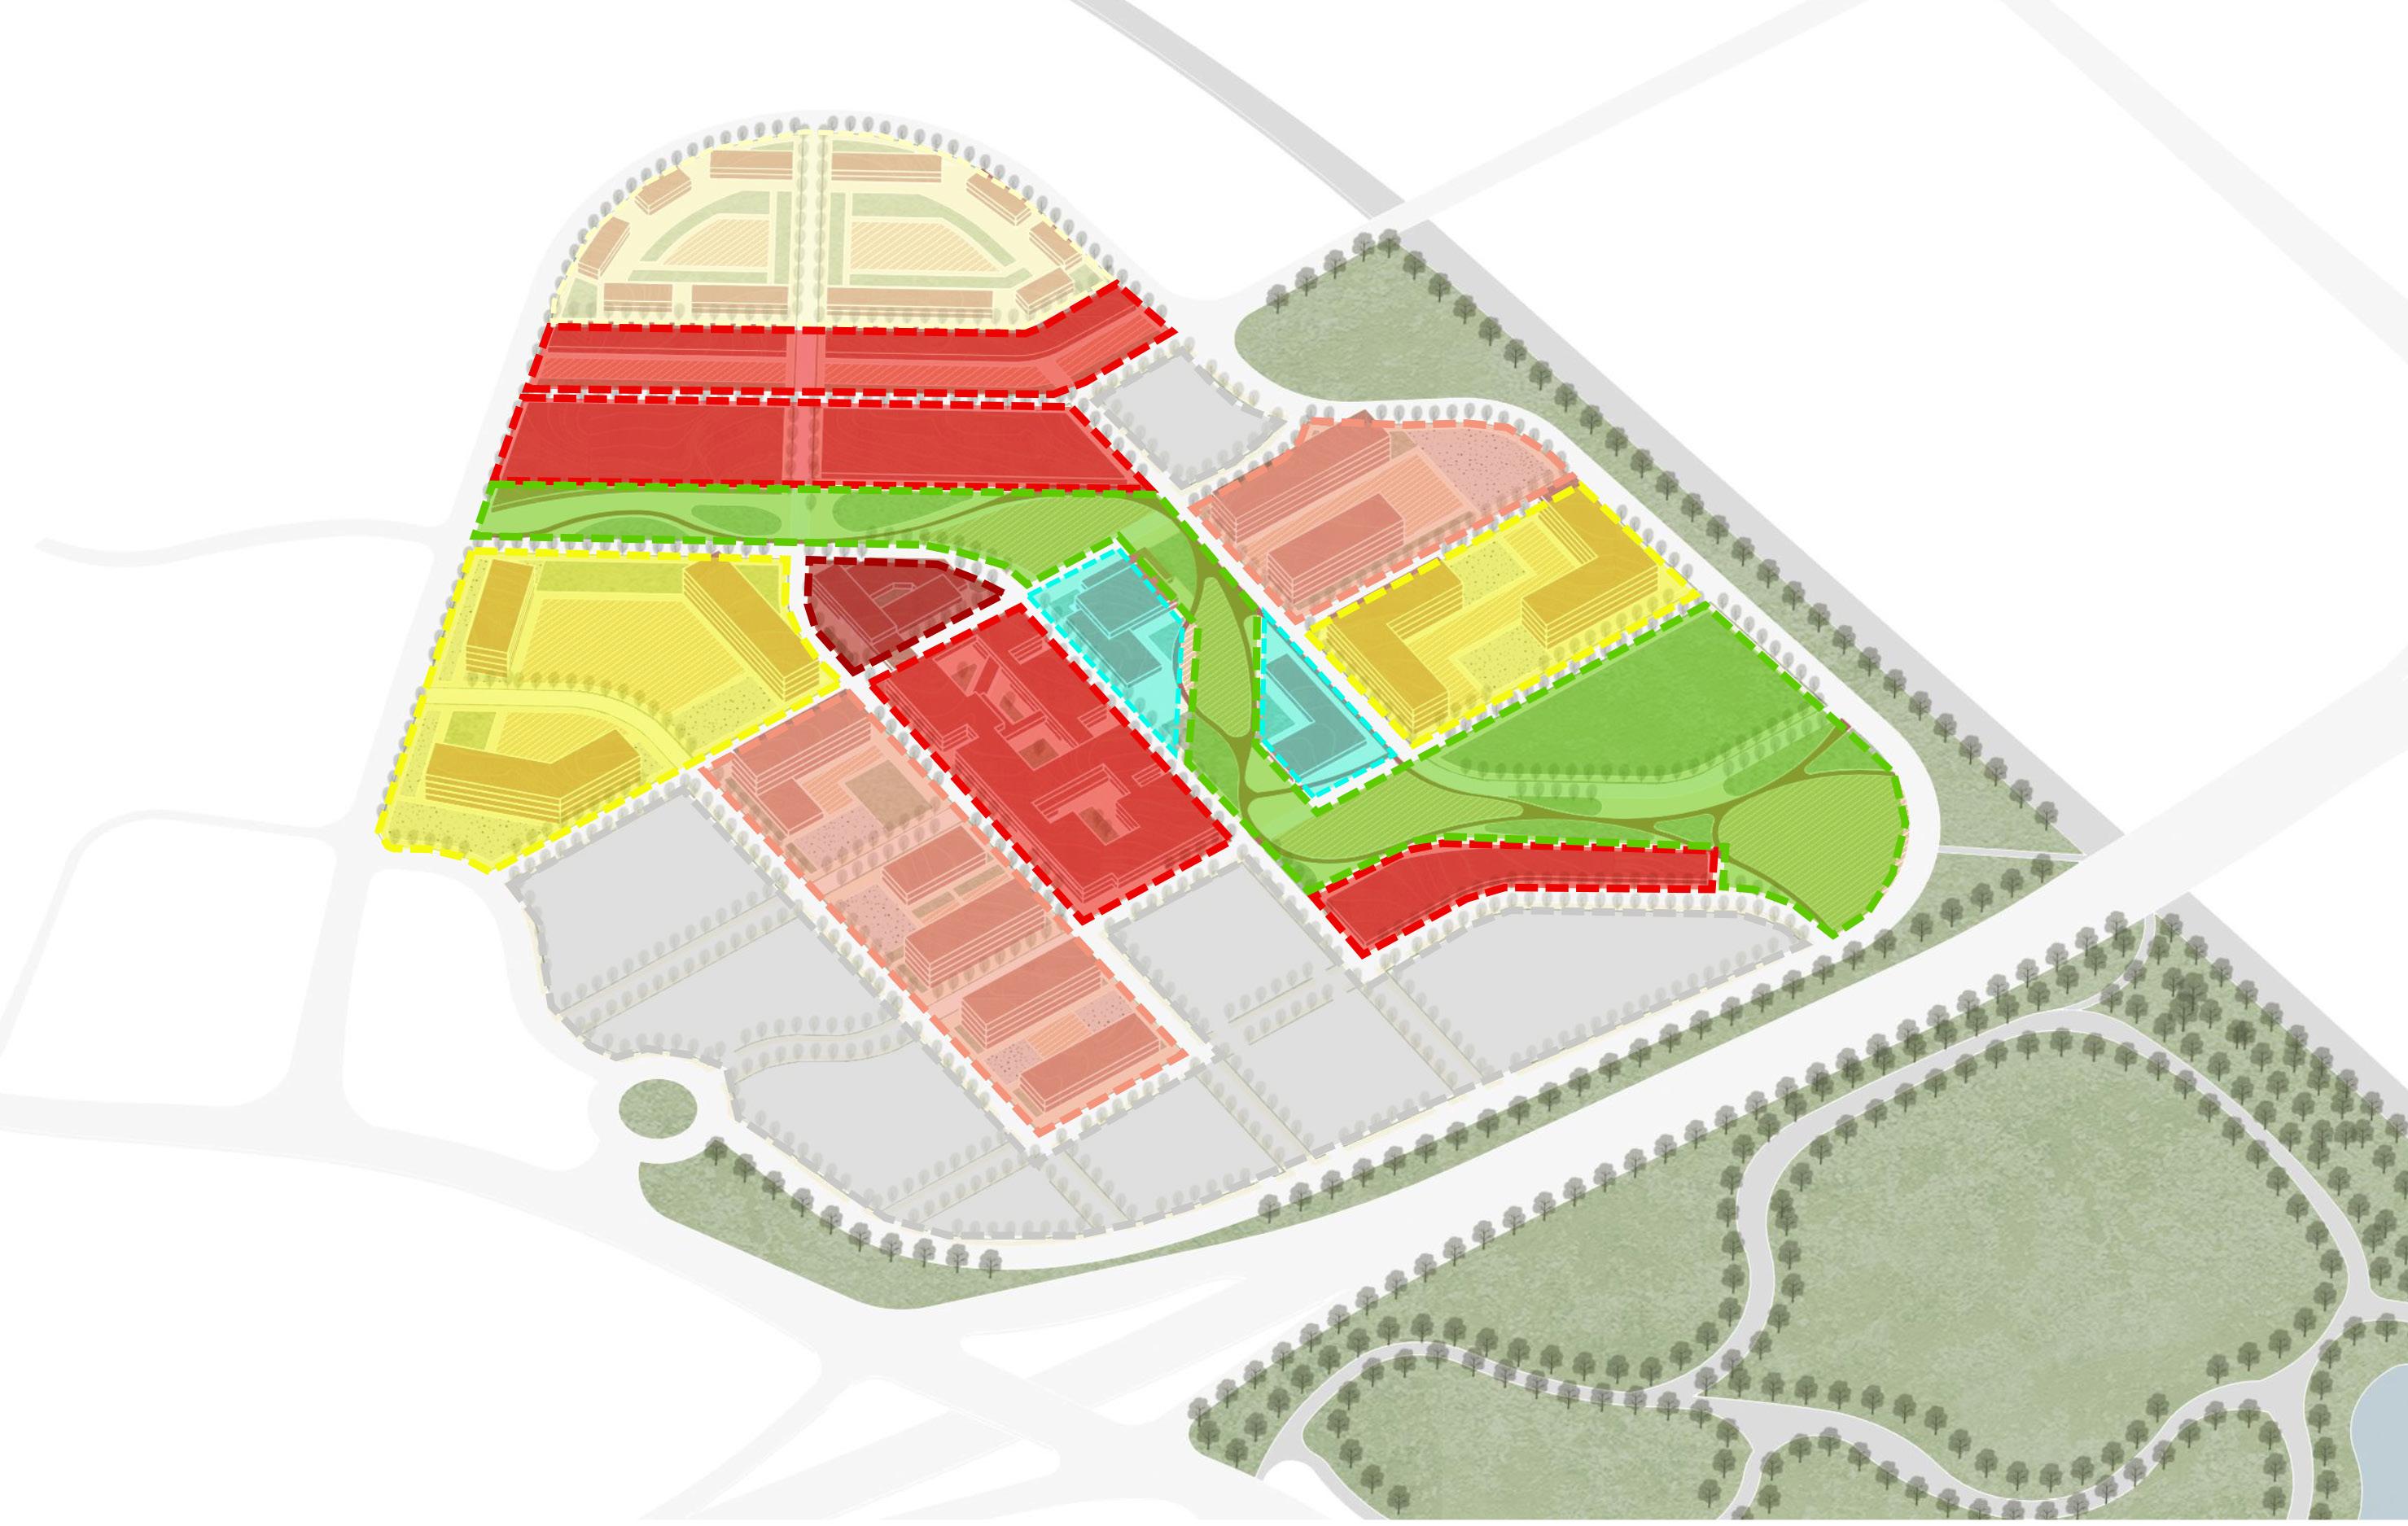
Single-family attached
Multifamily
Commercial
Mixed-use Office
Cultural Green space
Commercial parking
Figure 67: Overview of Scenario Two land uses.
Housing
Scenario Two proposes 600 homes in a combination of multifamily buildings and singlefamily attached townhomes. Multifamily housing has 540 units (90%), composed of 140 studios, 300 one-bedrooms, and 100 two-bedrooms. The remaining 60 units (10%) are single-family attached homes. These housing types support a diverse range of households, including young professionals, small families, and first-time homebuyers.
Fifteen percent of multifamily homes, approximately 81 units, are reserved as affordable for households earning 80 to 120 percent of Area Median Income.
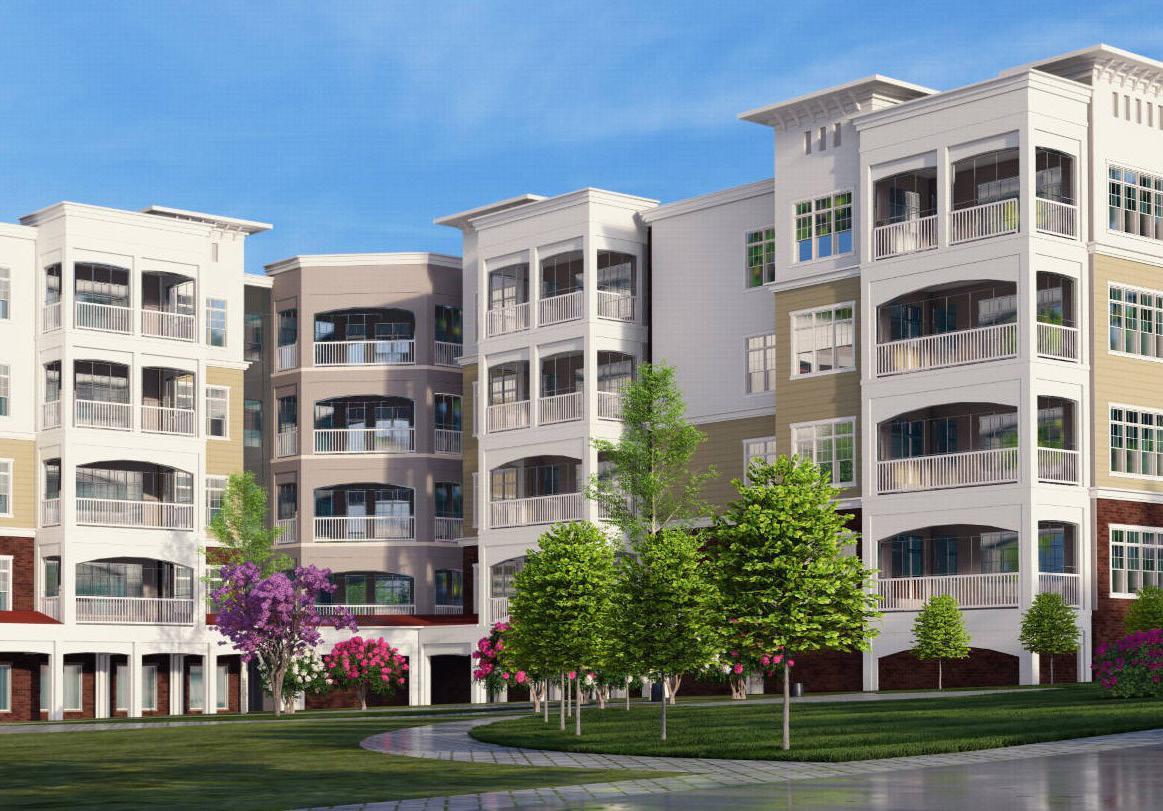
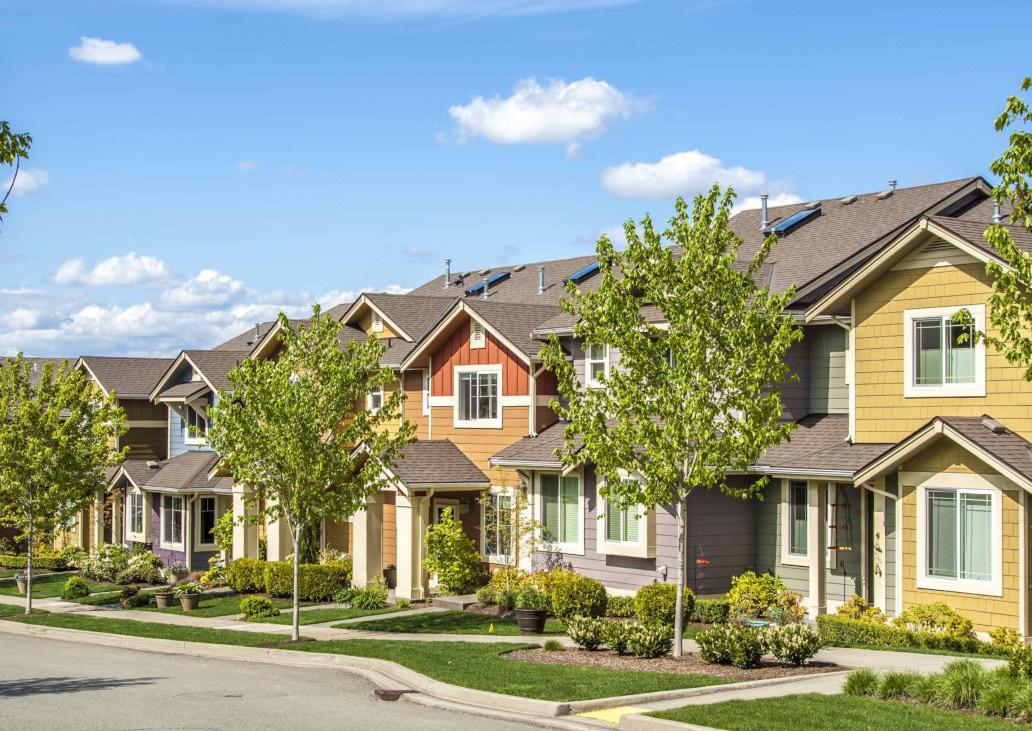
Table 22: The number of single-family attached and multifamily units recommended for Park City in Scenario Two.
Figure 68: Example of multifamily housing.
Figure 69: Example of single-family attached housing.
Commercial and Retail
The goal for the commercial and retail mix is to redevelop Park City Center into a new regional destination shaped by the principles of a pedestrian-oriented town center, with an emphasis on food, entertainment, wellness, and community services. The town center is expected to remain competitive in the regional market and be financially sustainable for the long term.
Visitor Analysis
We conducted a visitor analysis to better understand existing travel patterns to Park City Center. We identified three visitor areas through drive-time shed mapping, and an analysis of the demographic, socio–economic and housing characteristics of each area. These results enabled us make recommendations about market positioning and the blend of commercial activities for Park City.
Convenience Trade Area (0–10-minute drive)
This area encompasses nearby residents for whom Park City Center functions as a frequent destination. Households in this area tend to be affluent and well-educated, with high per-capita income ($44,734 compared to $42,605 for Pennsylvania) and 41.8% of the population holds a college degree or higher (compared to 35.3% for Pennsylvania).25 To continue to attract these nearby residents, we recommend adding high-end specialty retail, wellness services, and elevated dining options that align with their lifestyles.
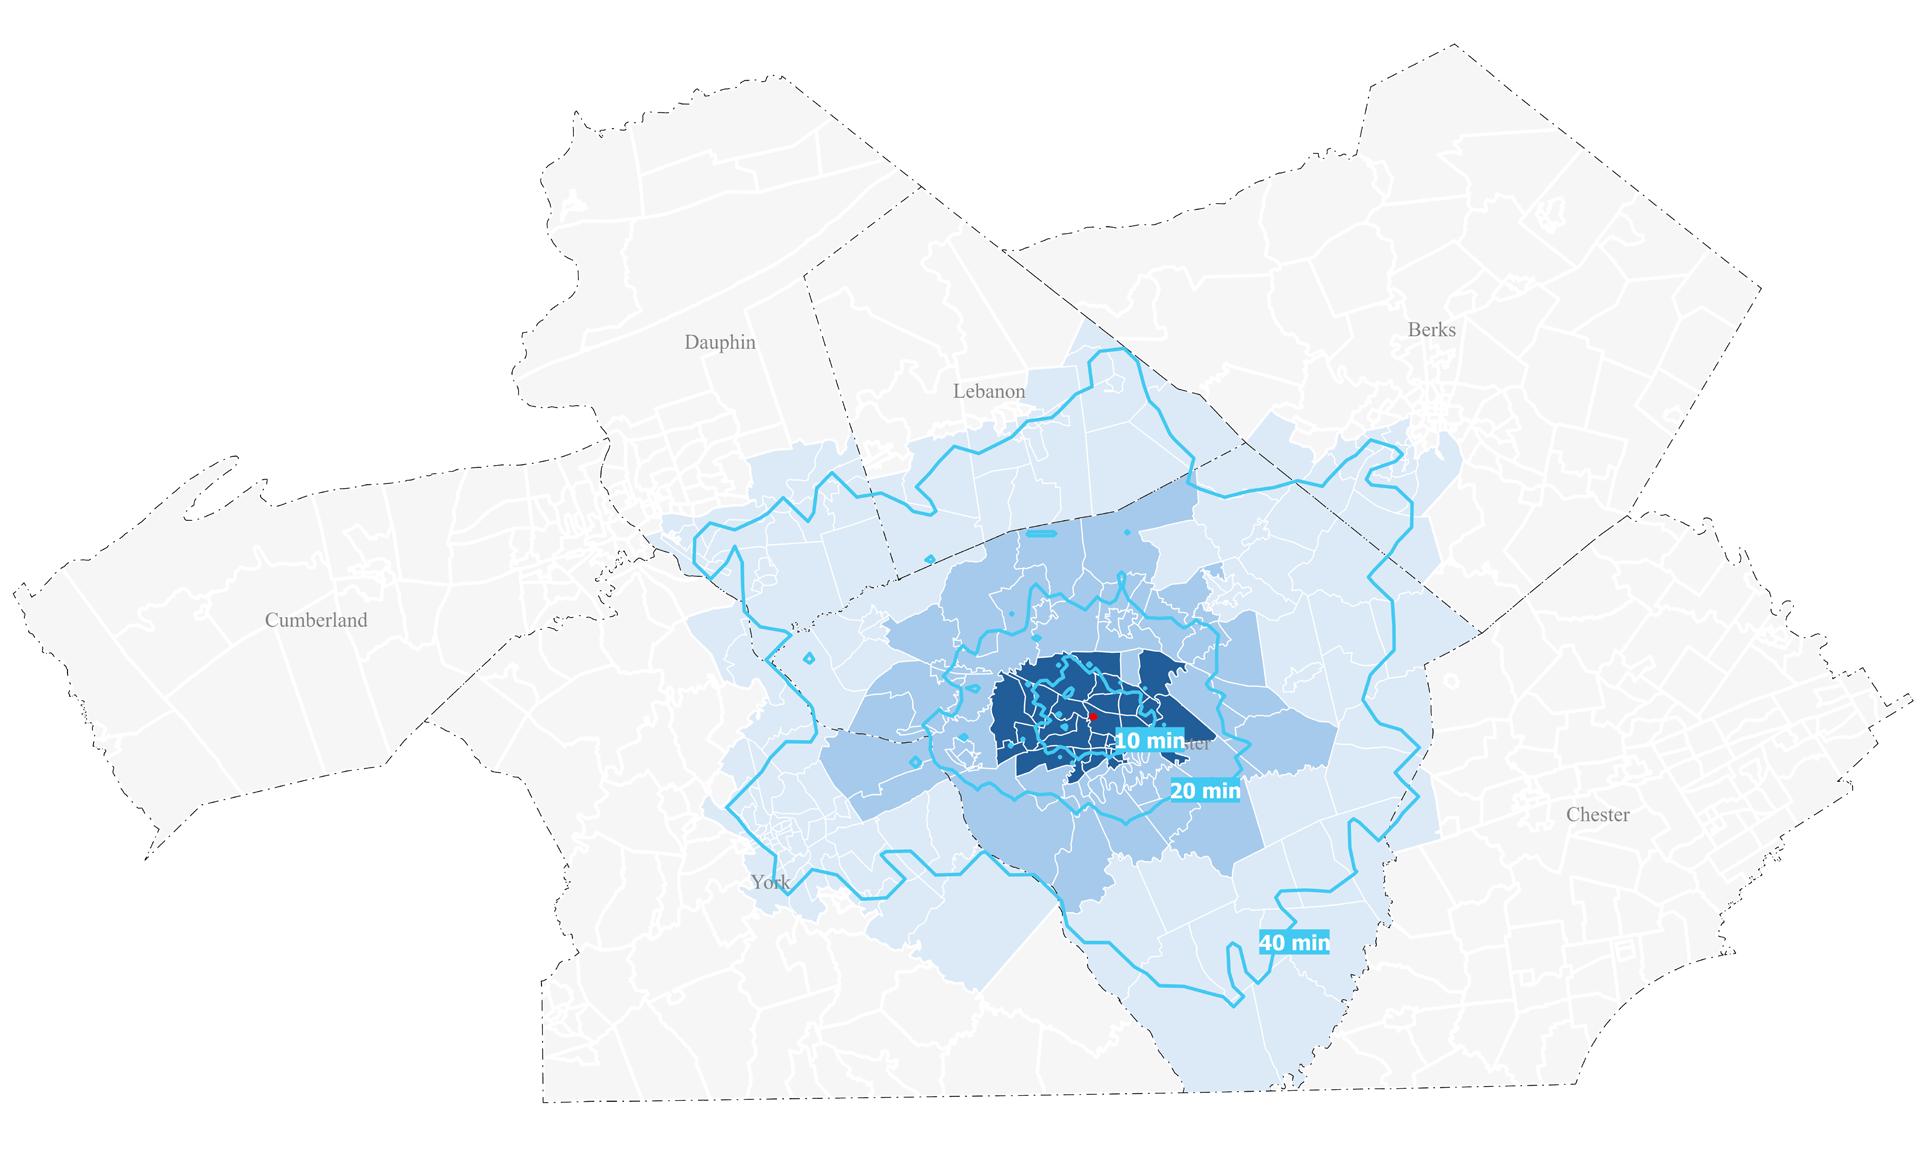
Destination trade area
Figure 70: Trade Areas for Park City.
Convenience trade area
Community trade area
Community Trade Area (10–20 minute-drive)
This trade area draws visitors who are likely to come to Park City Center for weekly shopping trips. They tend to have family-oriented lifestyles and larger households, with 70% of households classified as families, compared to 62.8% in Pennsylvania, and an average household size of 2.61, compared to 2.4 for Pennsylvania. To serve this market, we recommend adding familyfocused retail, home and lifestyle stores, grocery options, and all-age apparel. These uses support repeat visits and help the site function as a shared commercial and social hub.
Destination Trade Area (20–40-minute drive)
This broadest trade area captures visitors who travel between 20 and 40 minutes to reach Park City Center, often coming for a specific store or attraction. This group shows relatively lower per-capita income ($39,097 compared to $42,605 for Pennsylvania) but shows higher residential stability, which is reflected in a large share of owner-occupied homes (71.4% compared to 69% in Pennsylvania). To attract and serve this group, we recommend introducing value-oriented retail anchors along with active or experiential entertainment options that can strengthen Park City Center as a regional destination.
Summary
Across all three trade areas, the median household income is approximately $80,000.26 Households in this income range tend to spend more on food, entertainment, and healthrelated services.27 These spending patterns directly informed our recommendations for the commercial and retail mix in Scenario Two.
Recommendations
Market Positioning
The commercial and retail area of Scenario Two will occupy about 19.4 acres with a total floor area of 784,000 square feet, including a 3-story shopping mall, several 1-story retail buildings and mixed-use ground floor retail. The gross leasing area (GLA) is about 627,200 square feet. Based on prior analysis, the commercial and retail redevelopment will include five main categories:
1. Food and beverage as the primary driver;
2. Health, wellness and personal care as the daily traffic anchor;
3. Services and amenities to meet practical community needs;
4. Entertainment as the regional draw;
5. Diverse retail mix with selective apparel as a supporting layer.
Food and Beverage
Food and beverage purchases are a primary driver of daily and evening activity, especially attracting residents from the convenience and community trade areas. We recommend a mix of fast-casual and upscale dining, artisan cafés, grocery options, and bars. These uses help drive daily traffic, extend the time people stay at Park City, and activate outdoor and evening spaces. We propose three key strategies:
Create Anchors as Strong Draws
Sit-down restaurants are powerful draws for nearby residents especially for celebrations and social gatherings. There are several current popular sit-down restaurants, including BJ’s Restaurant & Brewhouse, J.B. Dawson’s, Shogun Asian Fusion. In the redevelopment, these existing restaurants will be retained, and
three high-quality specialty restaurants will be introduced to diversify dining choices. The existing Starbucks will also be kept and extended, serving as a key coffee and social anchor.
Another important anchor will be the special or international groceries, such as Trader Joe’s or H Mart. These stores will attract weekly shoppers from surrounding communities and fill current retail gaps in the area.
Meet Convenience Needs
As new housing is planned in Scenario Two, commercial offerings should include modern fastcasual brands and café/snack kiosks that cater to both new residents and those within a 10-minute drive. Based on trade area analysis, this group tends to be affluent and well-educated. Thus, brands such as Sweetgreen, CAVA, and Raman which fit well with the group’s consumption patterns and lifestyles will be added. Existing cafe/snake kiosks including Froots Smoothies, J.K. Cakes, Auntie Anne’s, Cinnabon and Bobacha can be retained to provide familiar convenience.
A Greater Variety of Dining Experiences
To enhance competitiveness with online food delivery and increase the site’s attractiveness, we recommend promoting a variety of dining opportunities (see Figure 71). A pedestrianfriendly dining street with outdoor cafés can help create a lively, human-scale environment. Bars and upscale dining choices will also be introduced to diversify offerings and attract visitors throughout the day and into the evening.
Health, Wellness, and Personal Care
Health, wellness, and personal care serve as daily anchors that generate consistent, need-
based trips. Recommended components include urgent care, pharmacies, and modern fitness activities. These uses generate steady foot traffic and attract both residents and nearby workers.
Health services represent a major gap in the surrounding areas and can serve as an important daily traffic anchor. The new Park City Center will be a comprehensive health cluster, including an urgent care facility such as MedExpress, a CVS pharmacy, and several specialty clinics like dermatology and dental offices.
For wellness and personal care, the redevelopment will retain existing tenants, including SEPHORA, Bath & Body Works, UFC Gym, and other personal care and vision/hearing service providers. The redevelopment will also offer a variety of fitness options such as yoga and Pilates studios, expanding lifestyle choices for nearby residents and employees.
Services and Amenities
Services and amenities provide community support. Services and amenities will be enhanced to meet the needs of both the convenience and community trade areas. Existing tenants providing practical services such as Breneman’s Tailoring & Alterations, Boscov’s Travel, and Cellaxs Phone
Repair will be retained. The current childcare and enrichment providers, Little Pasitos Preschool and Lancaster County Academy, will also be preserved and expanded to serve new residents.
In addition, a learning center such as Kumon will be introduced as a community-oriented amenity. A bank and a laundry will also be added to fill current service gaps and strengthen the daily convenience offering of the area. Together with the community library, these new amenities will help build a stronger neighborhood identity and enhance community cohesion.
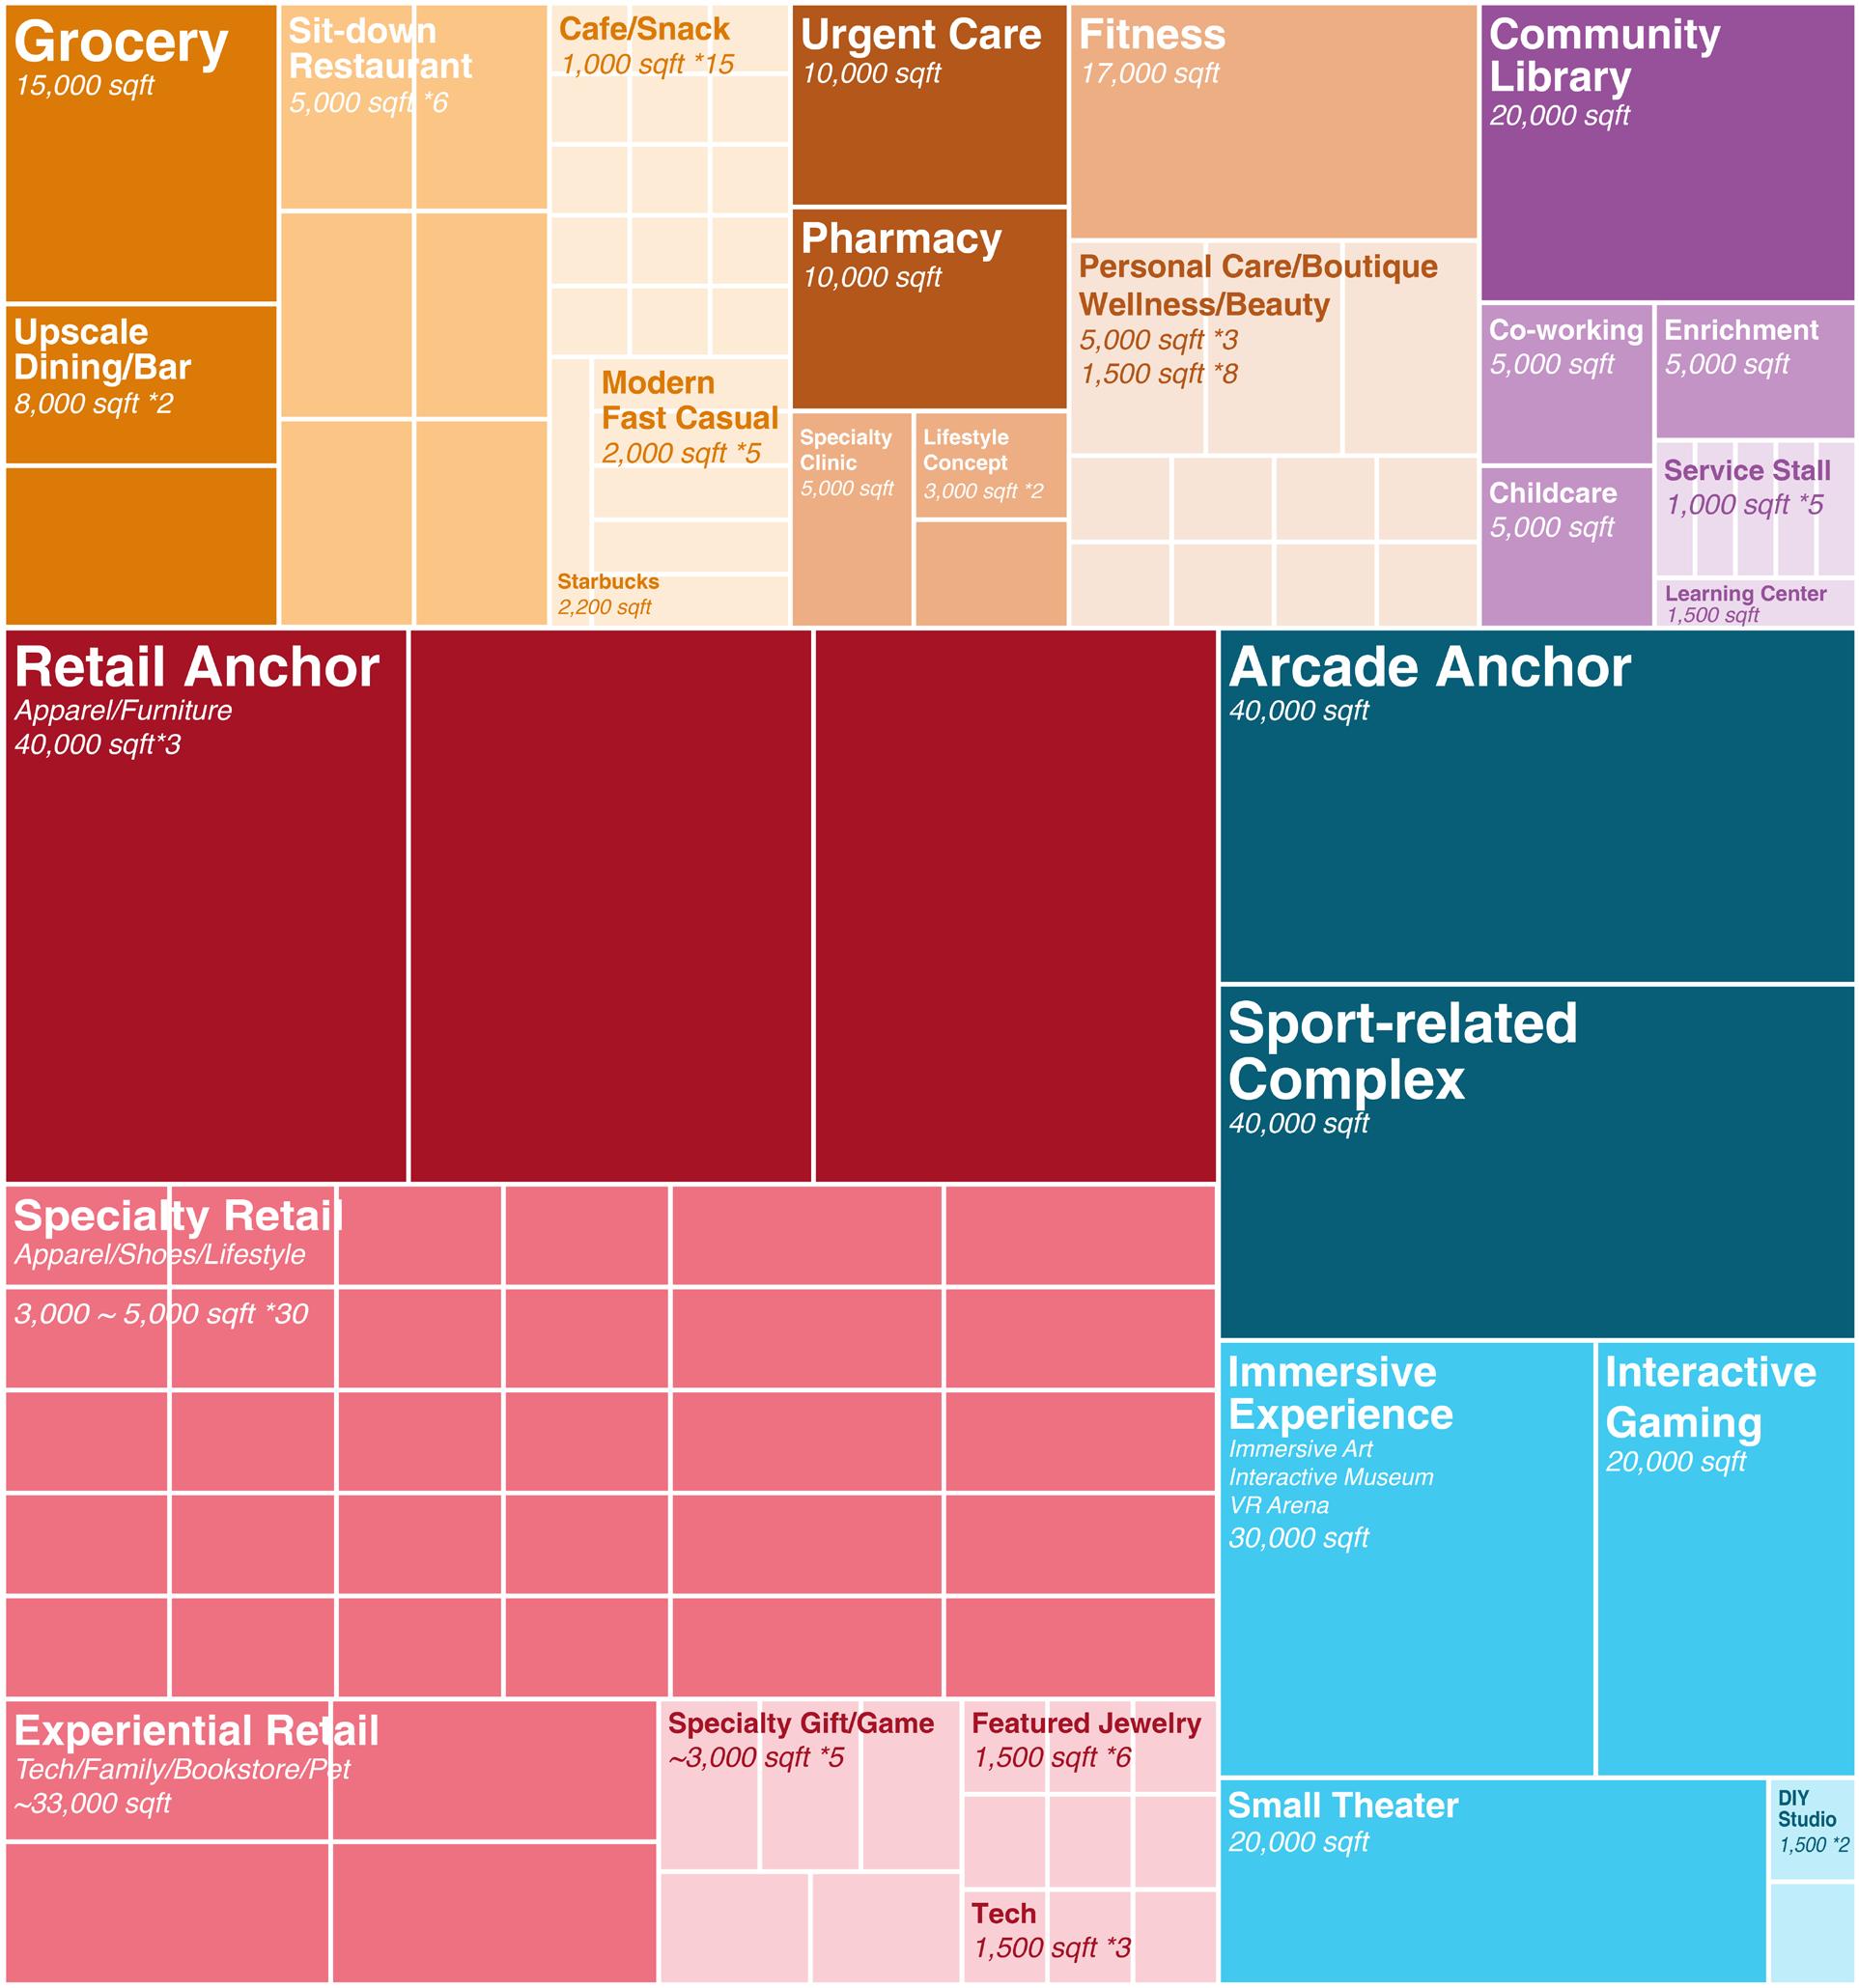
Figure 71: Recommended commercial and retail mix for Park City Center in Scenario Two.
Entertainment
Entertainment serves as an essential driver for increasing foot traffic and enhancing the overall experience in suburban malls. At Park City Center, the existing Round1 has seen rising visitors in recent years, enhancing its role as a major entertainment anchor. In the context of growing online retail competition, experiential and entertainment uses are key to strengthening destination appeal, extending visitor dwell time, and supporting food and retail. Together, these entertainment venues can create destination experiences that attract visitors from a wider area.
Leverage Existing Anchor
Round1 will be retained as a proven draw, especially for young and family. There are also two small DIY studios called Build-A-Bear Workshop and Color Me Mine, providing creative, hands-on experiences that support family-oriented activity and leisure.
Add Diverse Experiential Entertainment
To further enhance attraction and diversity, new experiential options will be introduced. These include small theaters, events and comedy/music stages, and sports-related entertainment such as pickleball, climbing gyms, and golf simulators, attracting all ages. Interactive gaming concepts will also be added to enrich the immersive experience, such as Active rooms combining movement, puzzles, and light-based challenges.
Retail
Retail remains an important economic draw and source of revenue for the owner of Park City. Currently, four retail anchor including Boscov’s, JCPenney, Kohl’s and Raymour & Flanigan serve as the primary draws of Park City Center,
attracting visitors to the suburban mall. In Scenario Two, retail will become more diverse and selective, complementing the food, wellness, and entertainment anchors to boost overall traffic and create a well-rounded visitor experience.
Keep Major Anchors Except JCPenney and Retain Well-known Tenants
Major anchor stores will be largely retained, including Boscov’s, Kohl’s, and Raymour & Flanigan. JCPenney will be removed due to declining visitors in recent years. Other wellknown tenants, including tech, jewelry, apparel, and lifestyle brands such as AT&T, Pandora, and PacSun, will also be retained.
Emphasize Experiential Retail
Experiential retail is a key strategy to compete
with online shopping. The redevelopment will expand Apple to create a major tech experience anchor. Additional experiential retail, including Nike Rise will be introduced to attract all-age shoppers, LEGO to appeal to families, and Dogtopia to serve pet-focused customers.
Diversify Retail Mix and Fill Gaps
Based on the different demographics of the three trade areas, the future retail mix will be diversified to meet their different needs. Highend apparel such as Ralph Lauren, and designer fashion such as Theory and Aritzia will cater to the affluent, well-educated residents especially in the convenience trade area. Existing games, gifts and pop culture stores will be retained to serve children and young visitors. Boutique lifestylefocused retailers, such as Lovesac, will be added to meet the needs of families.
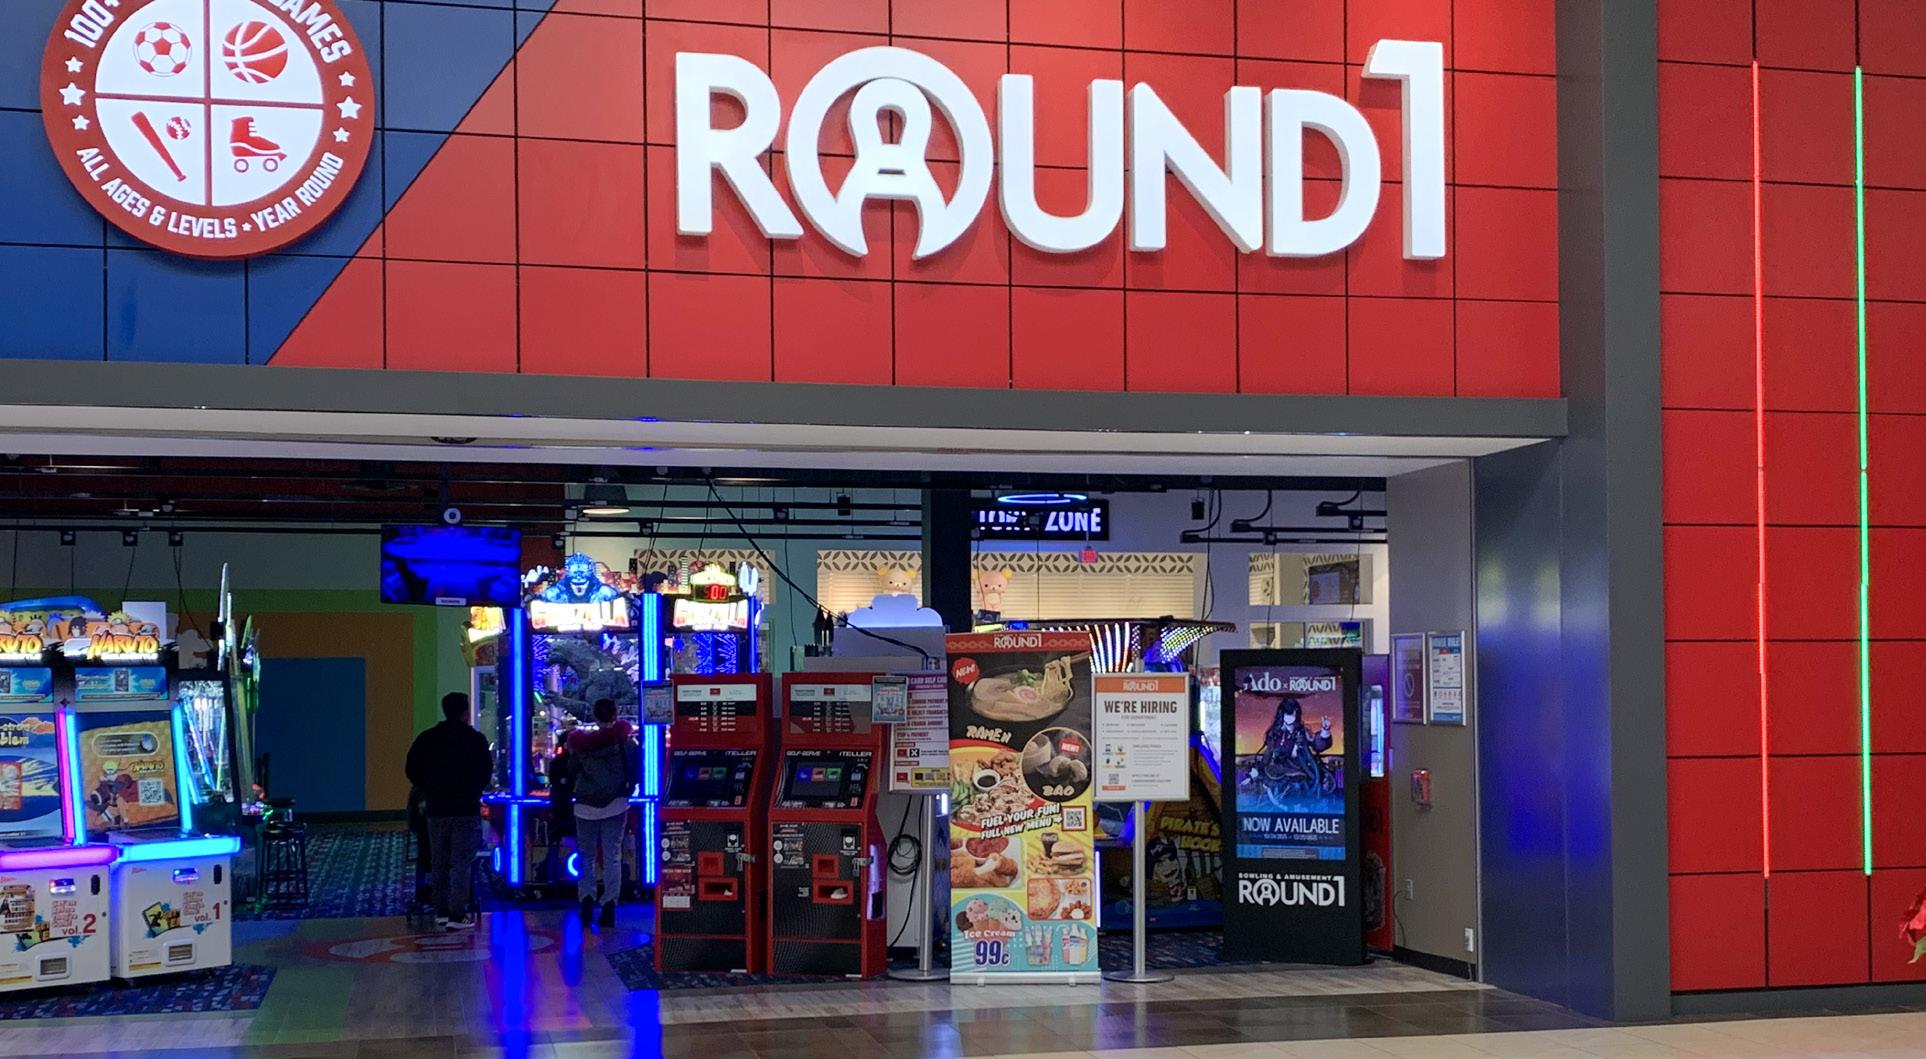
Figure 72: Existing Round1 as a proven successful entertainment anchor.
Design Guidelines
The new building types are organized as follows: mixed-use buildings with three stories of multifamily rental units above ground-floor retail; single-family attached and multifamily residential buildings; and standalone commercial buildings offered in two forms—one story along the site perimeter (areas 7 and 8 in Figure 65) and three stories in the center of the Park City site (area 6).
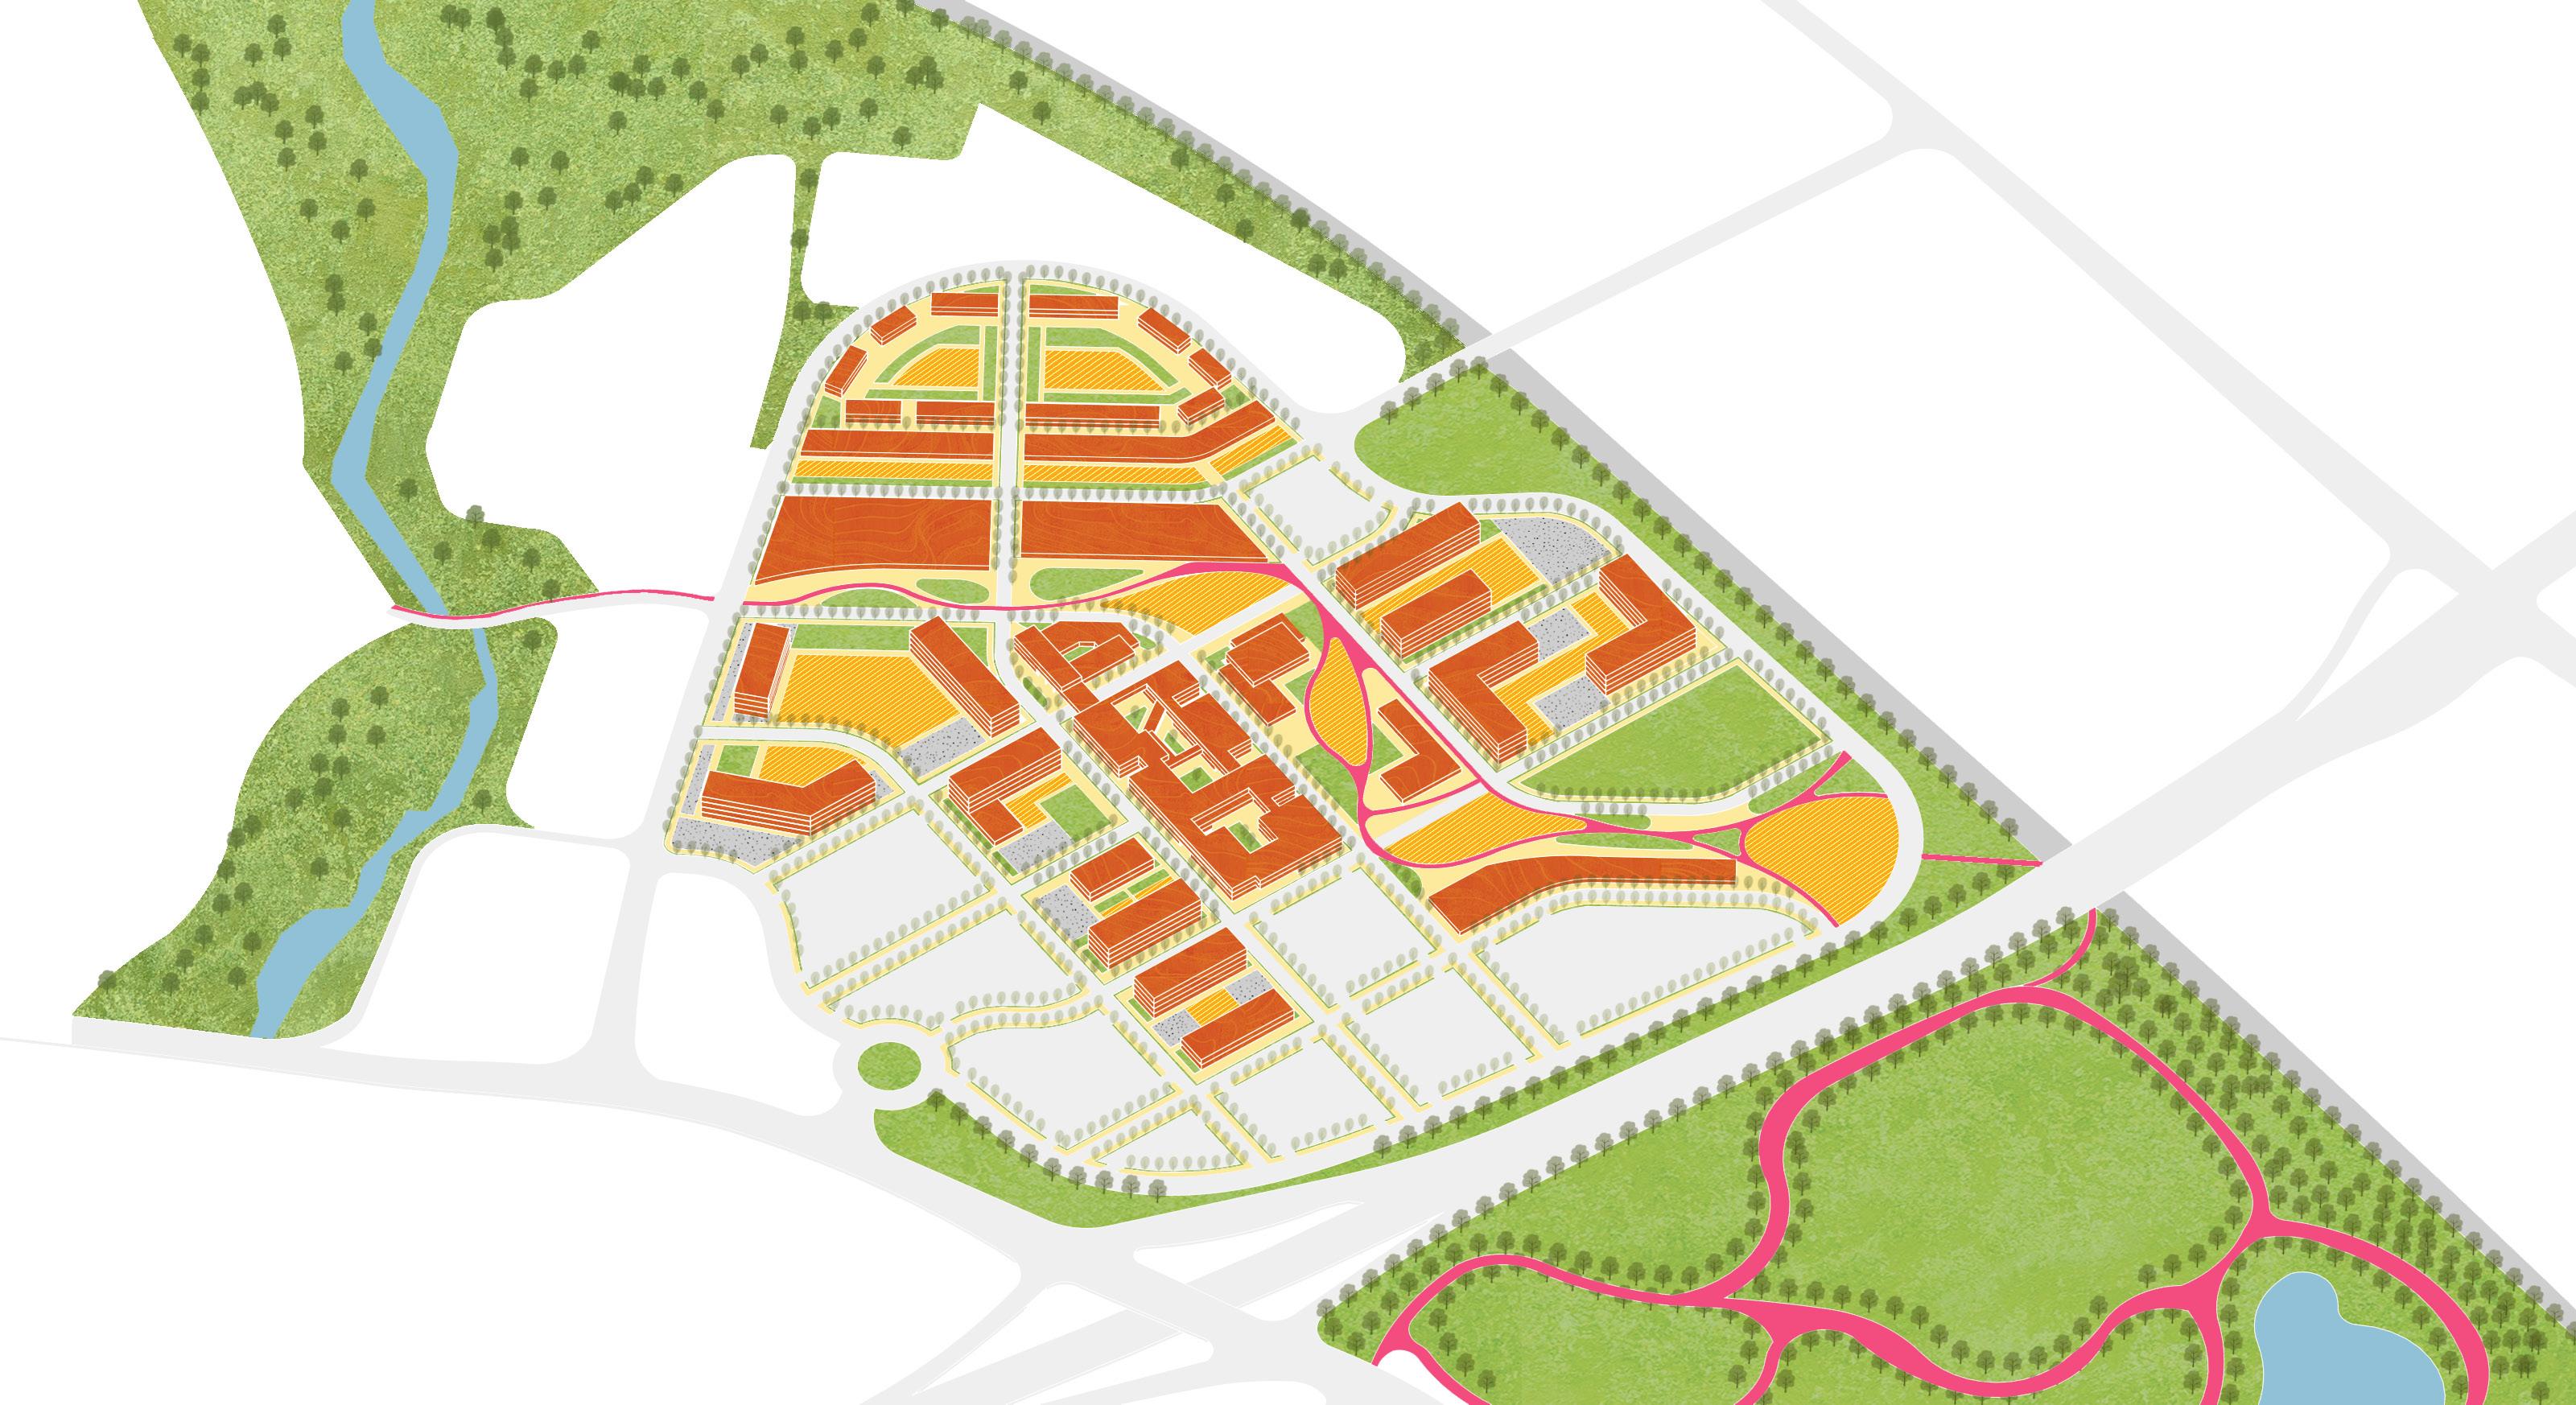
Figure 73: Overall bird's-eye view of Park City Center site in Scenario Two.
Figure 74 shows the proposed building types and their locations in Scenario Two. Each building type is subject to specific design guidelines, as outlined in the following pages.
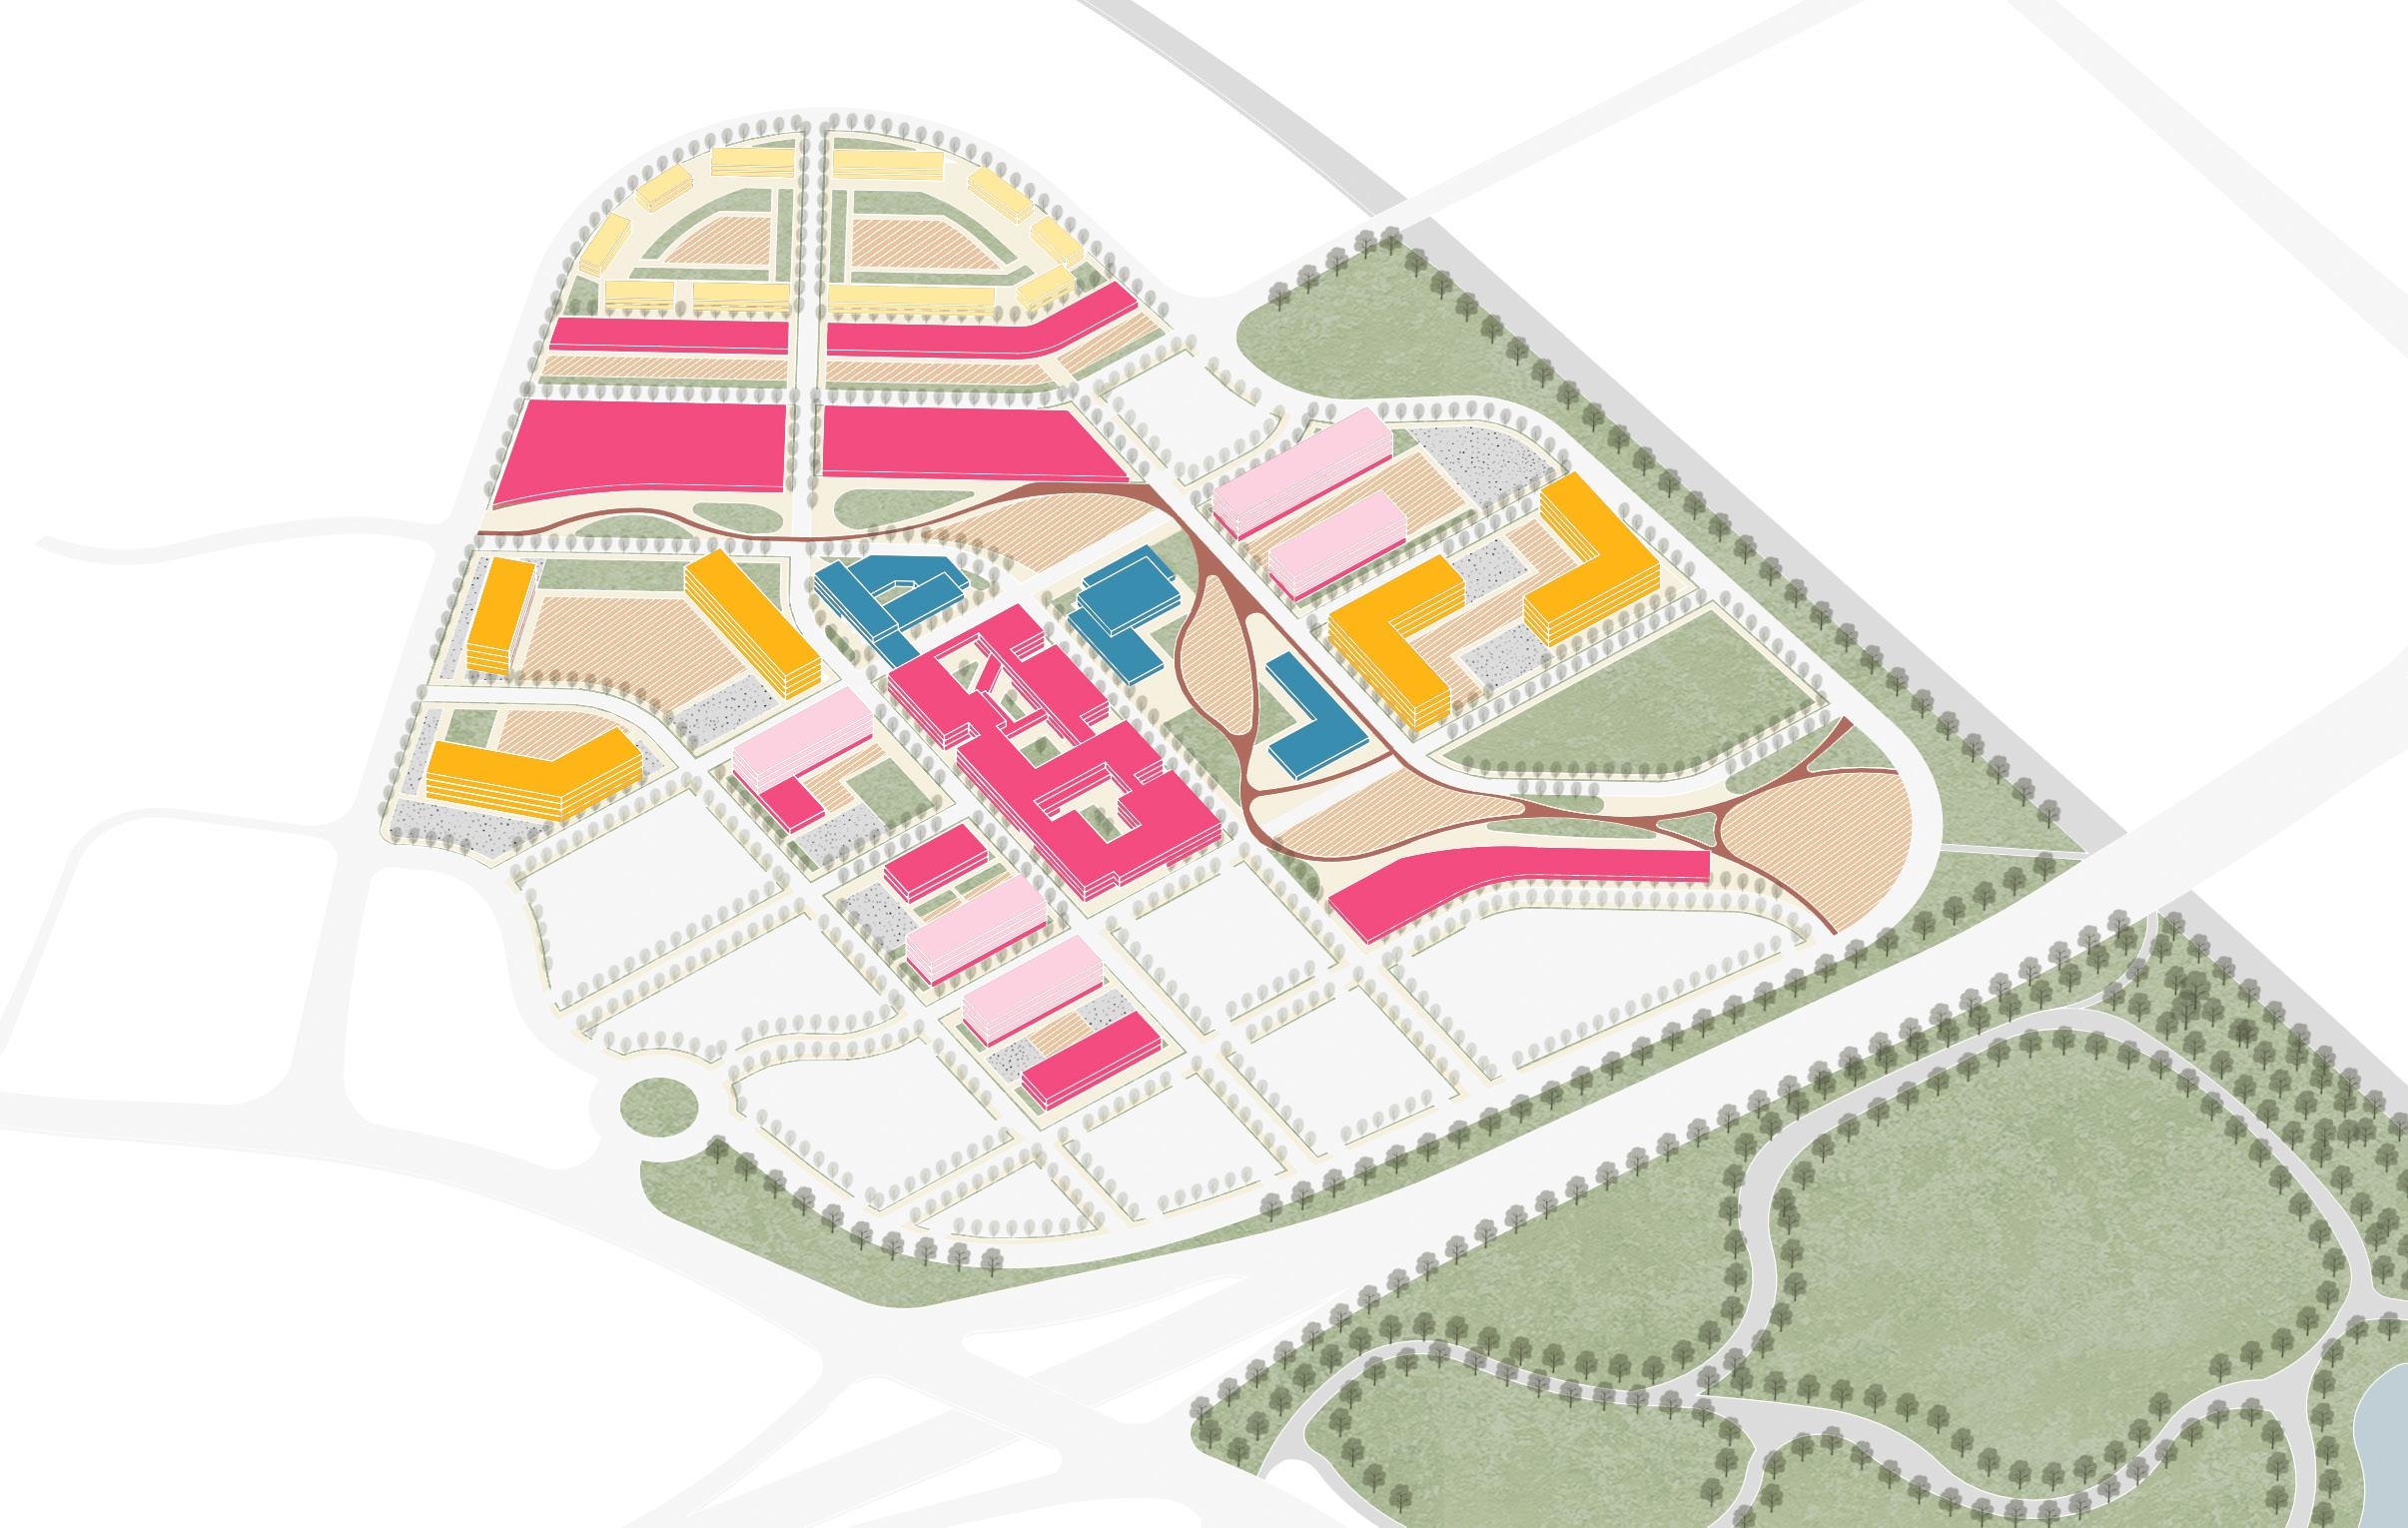
Single-family attached
Multifamily
Commercial
Mixed-use

Office/Cultural Open space
Figure 74: Map of different building types.
Residential
Design guidelines for single-family attached and multifamily residences in Scenario Two are to be consistent with those in Scenario One, except that The Maximum Principal Building Height for multifamily residences shall be 55 feet or four stories.
Commercial and Mixed-use
Mixed-use buildings are sited nearest to the commercial core of the town center, areas 3 and five in Figure 65; ground-floor retail enhances the pedestrian shopping experience for visitors and residents alike. There is also a commercial building with ground floor parking and two floors of office space in area 13.
The one-story commercial buildings emphasize placemaking. Oriented to a street on one side and the pedestrian greenway on the other, these buildings can serve customers arriving by different modes of transportation and offer outdoor seating. By contrast, the central mall (area 6) offers indoor shopping. Retail and services may be tailored to residents and/or visitors.
Office buildings are located at the heart of the site (area 13), surrounded by a diverse mix of functions including residential areas, open spaces, multi-level mall, and a central pedestrian corridor, which greatly enhances accessibility and convenience for the working population. The architectural form employs atriums and interlocking volumes, generating spatial shifts that enrich the spatial experience for both building users and visitors moving through the surrounding public realm.
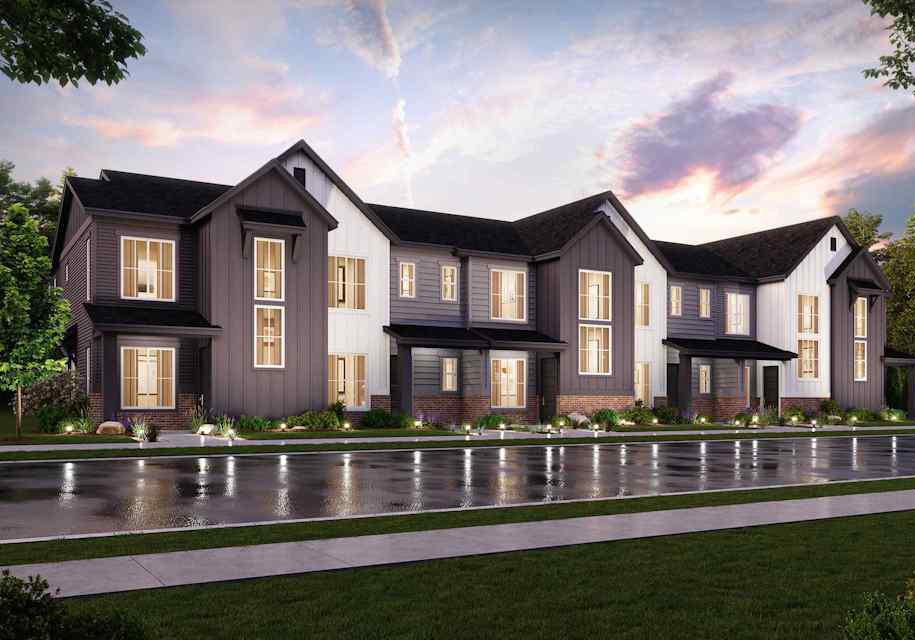
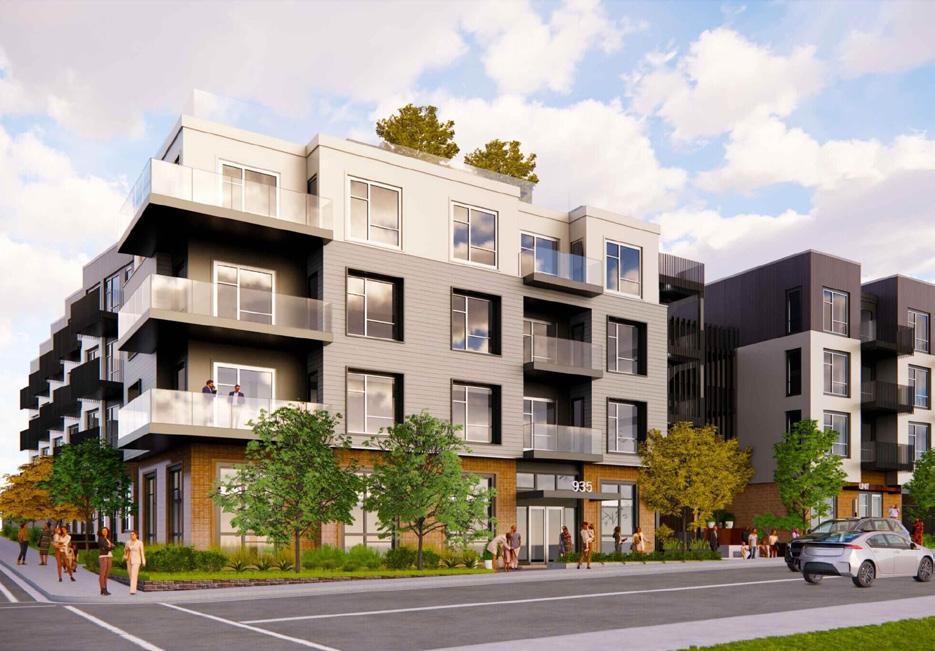
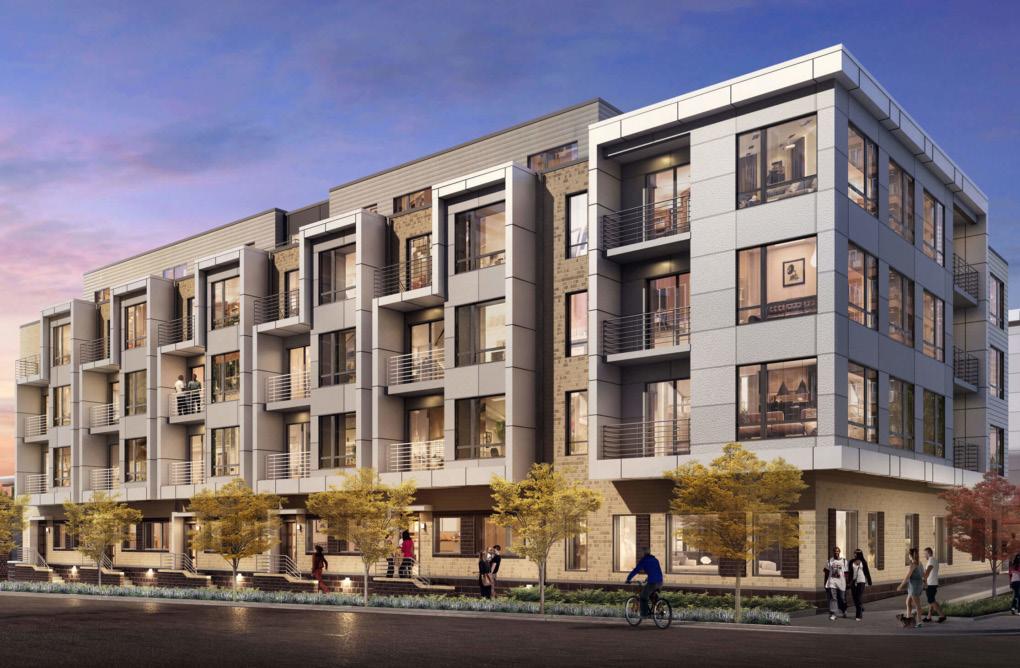
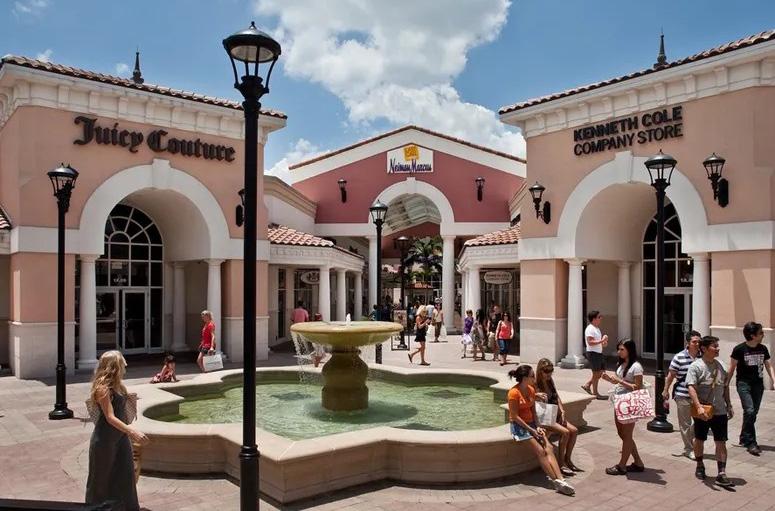
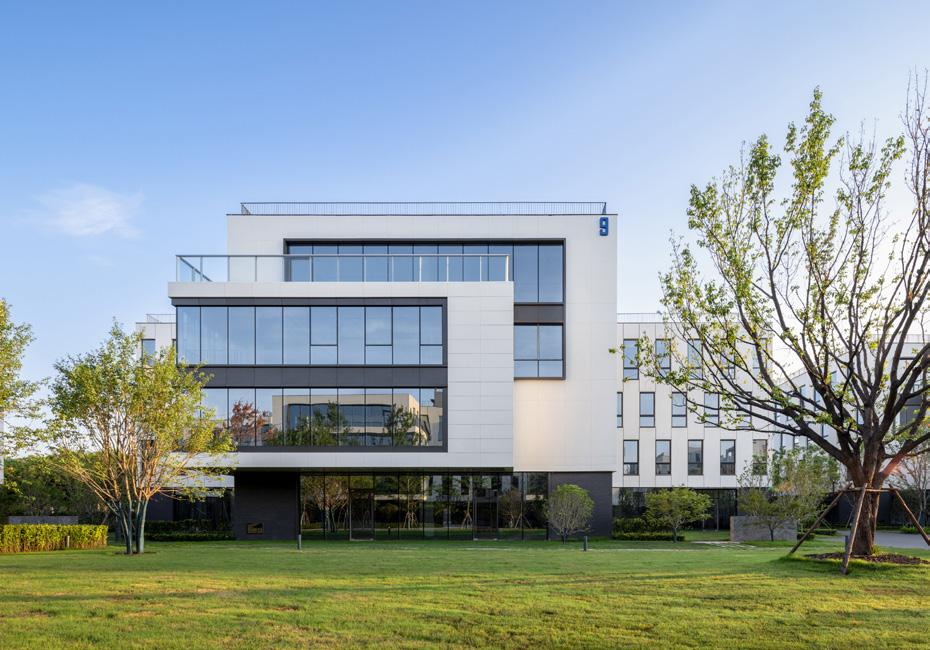
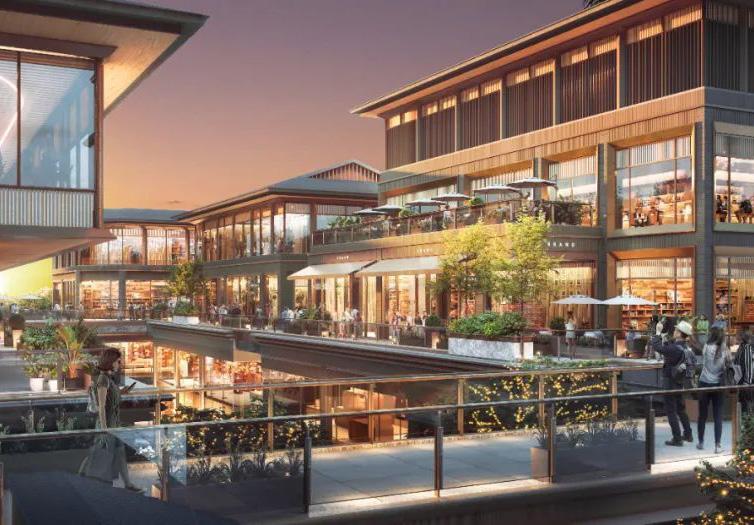
Figure 75: Example of single-family attached.
Figure 76: Example of multifamily buildings.
Figure 77: Example of mixed-use buildings.
Figure 78: Example of commercial buildings.
Figure 79: Example of office buildings.
Figure 80: Example of mall.
Intent
Height
Scenario Two is intended to promote and foster pedestrian connectivity and to encourage walking to the maximum extent. All commercial development shall pay specific attention to how their building(s) interacts with the streetscape and integrate design approaches that foster pedestrian activity. A diversity of building design, scale, and proportion is intended to be achieved utilizing a modern design approach comprised of traditional building materials. Examples shown throughout this guide should be emulated and used for design inspiration.
The Maximum Principal Building Height shall be 20 feet or one story.
The Maximum Principal Building Height shall be 54 feet or three stories. The Maximum Principal Building Height shall be 55 feet or four stories.
All floors of a building shall not contain blank façade walls along any side of the structure. No more than 30% of its length or 25 feet, whichever is less, shall be blank (i.e., without doors or windows, or architectural expression). A variety of design elements that create visual interest and distinguish the ground floors from the floors above shall be provided. This shall include a combination of features such as articulated building entrances, covered porches, building cornices, window treatments and awnings, building accent lighting, or other similar embellished façade features.
Primary entrances shall be identified with defining architectural features such as roofs and/or canopies. Vestibules are encouraged and shall be incorporated into the architecture of the building. For buildings with multiple commercial tenant spaces on the ground floor, entrances shall be located within the façade (i.e., no projecting vestibules will be permitted).
Articulation
Landscaping
Articulation in building façades shall be achieved by vertically off-setting façade walls of buildings greater than 20 feet in width, occurring at a maximum every 30 feet, or by constructing horizontal protrusions or insets from the building that may include such features as balconies, cornices, or awnings. This shall apply to all sides of a building.
Buildings shall adjoin sidewalks at street corners unless a green, plaza or square is provided at a street corner. Buildings that adjoin or meet at street corners and intersections should address the corner with enhanced architectural elements. Such elements shall consist of towers, special roof conditions, changes in height and/or unique architectural expression. Two or more buildings that adjoin the same corner shall vary in design and approach to addressing the street corner.
Landscaping, including but not limited to landscaping beds, raised planting beds, etc. shall be placed around all sides of a building or structure to the greatest extent possible, as long as it doesn’t impede pedestrian circulation or safety. Where possible, landscaping may be utilized as stormwater management facilities to decrease run-off from rooftops or adjacent impervious surfaces.
Parking
Commercial parking shall be provided in the dedicated surface lots; on-street parking will not be provided. Parking areas shall be paved. Porous pavers may be used if integrated with stormwater management practices. Parking areas shall be screened and buffered from adjacent streets and view sheds by using masonry piers and planted hedges. One canopy tree is required for every eight parking spaces. Planting islands are required no more than 15 spaces apart.
Table 23: Design Guidelines for commercial and mixed-use districts in Scenario Two.
Facade
Shopfronts
Street Corners
The first floor of the office building is opened for parking and integrated with the mobility hub. Because the terrain is lower in the north and higher in the south, the first floor on the north side of the mall is also opened for parking, while the main entrance on the south side is accessed from the second floor. Parking is illustrated in blue. A sky bridge is added between the two buildings to facilitate circulation.
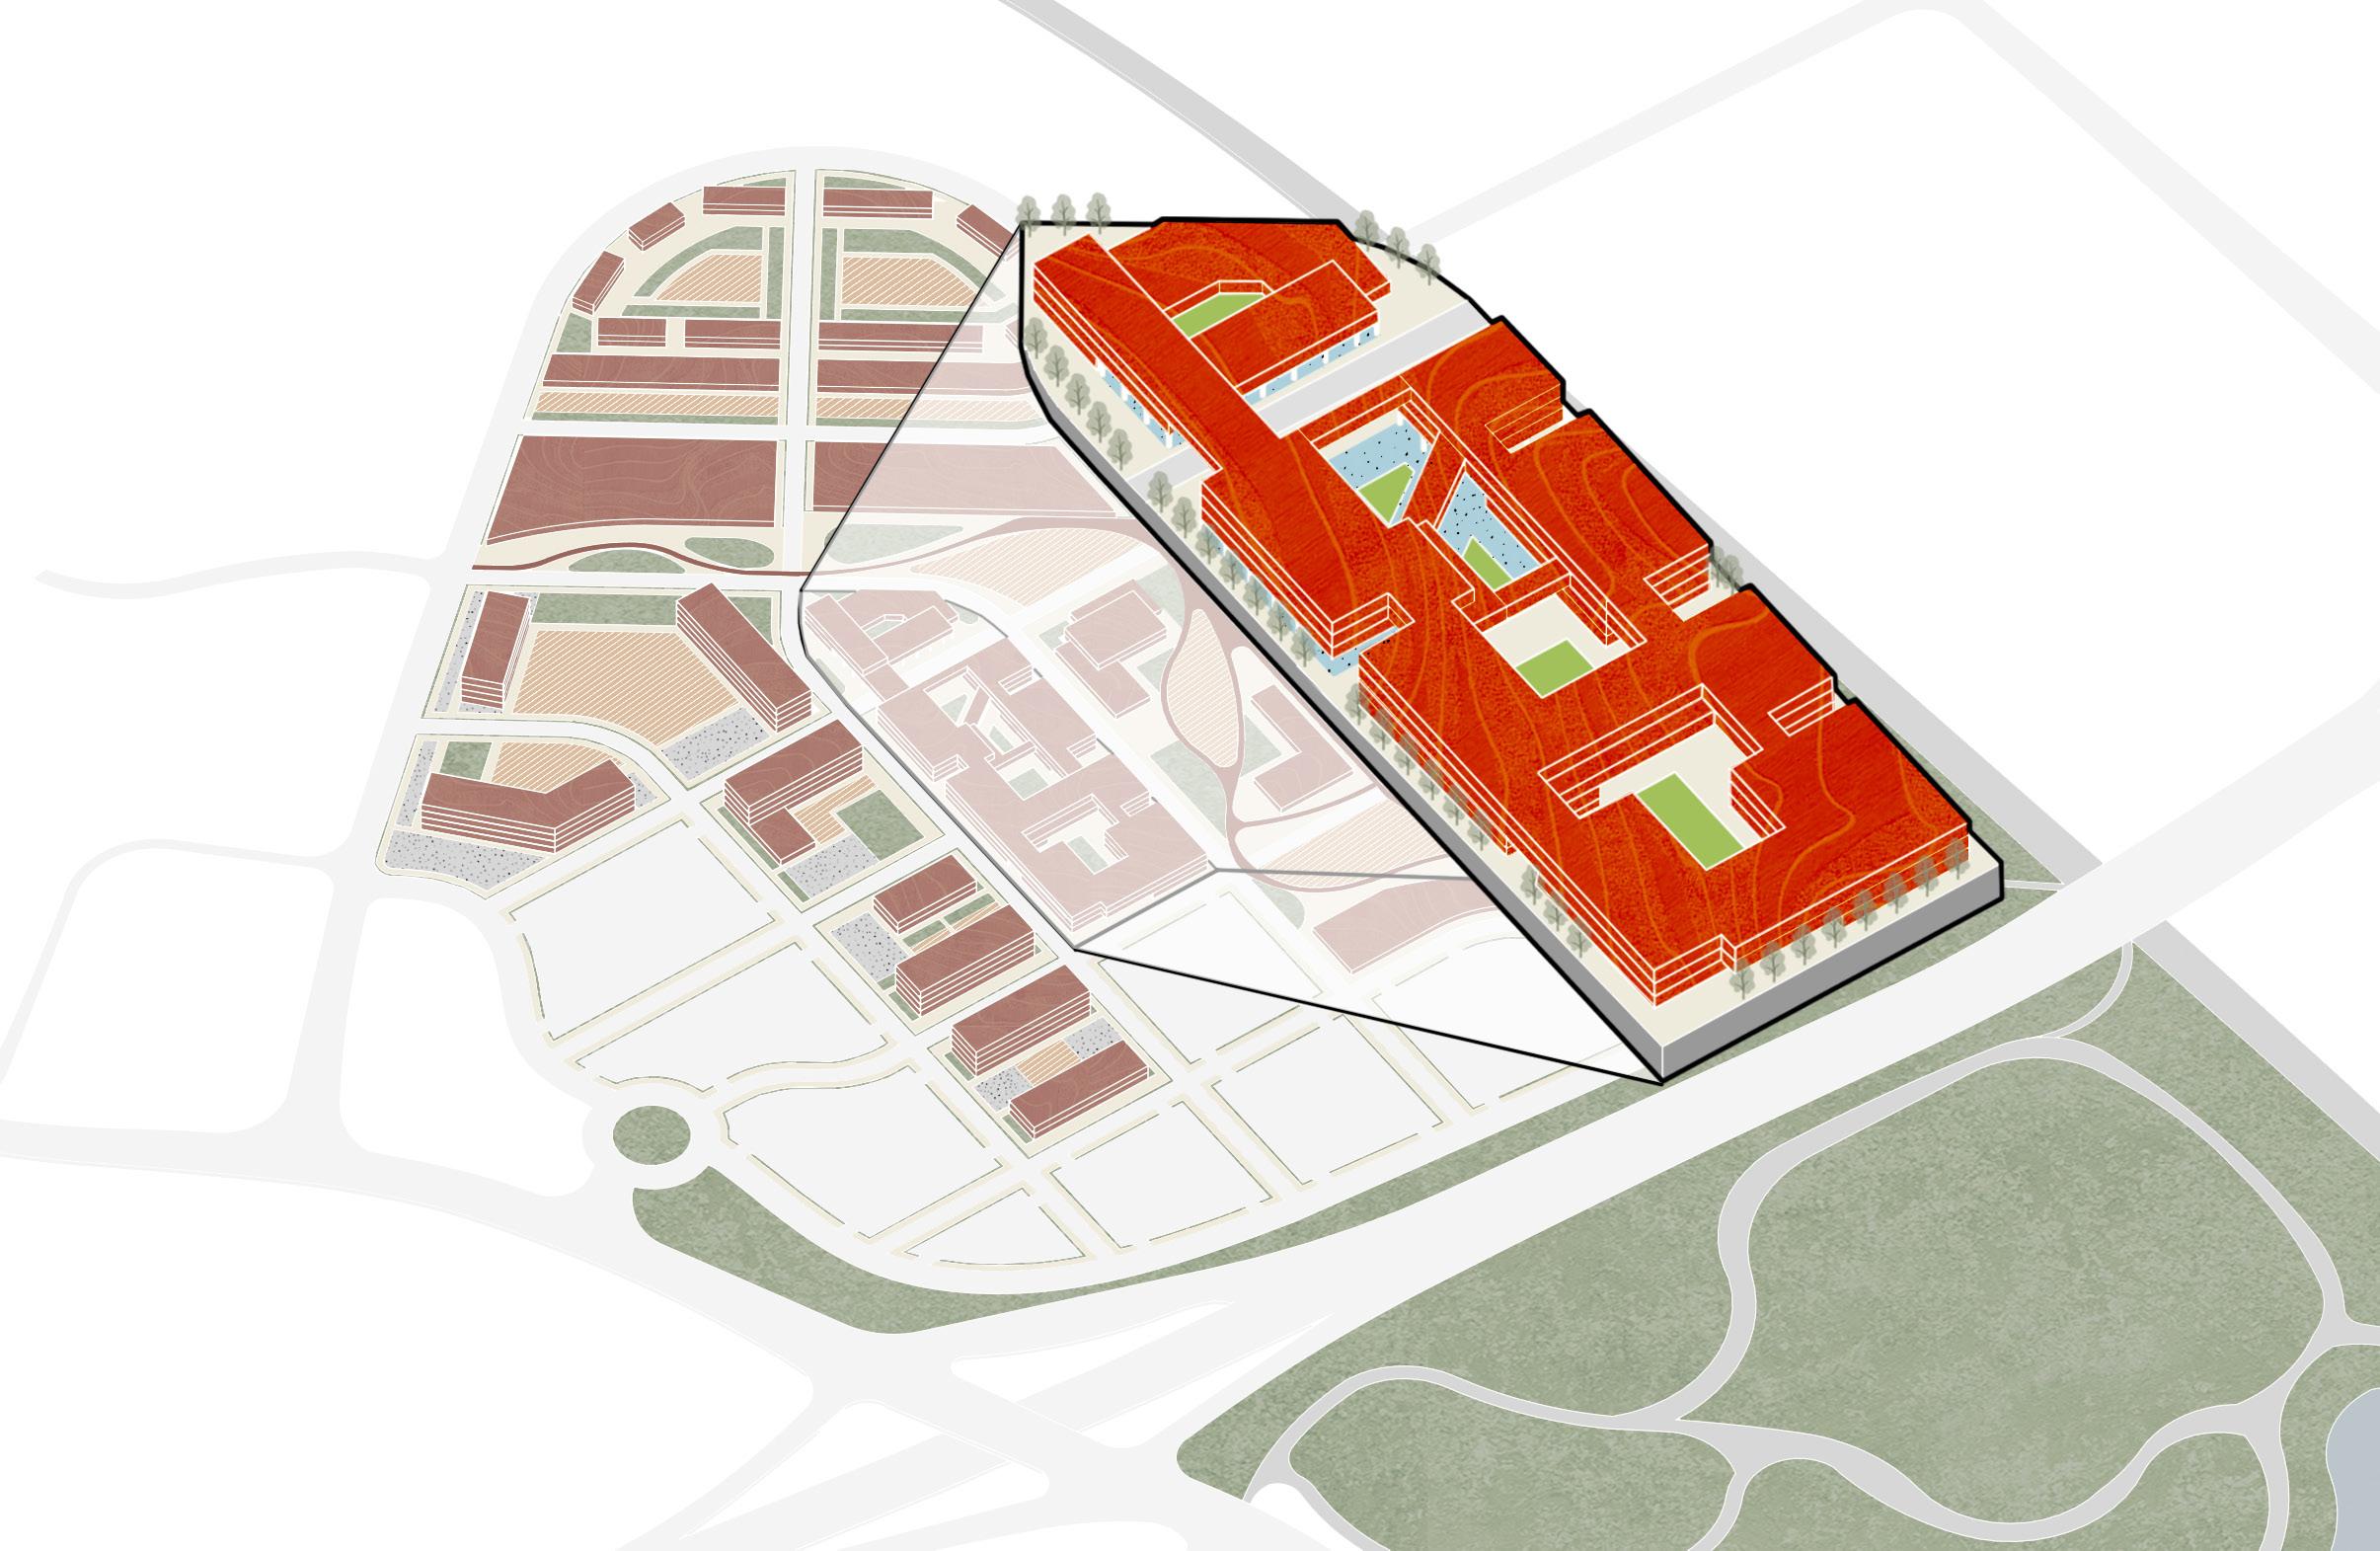
Figure 81: Proposed mall design for Scenario Two.
The overall site design thoughtfully addresses its relationship with the surrounding context. The central pedestrian path, shown in pink, is strategically shaped to ensure access to the Blue Green Connector on the west and to establish a linkage to Long’s Park on the east. Within the site, the pedestrian paths adopt curvilinear forms, which not only define a sequence of open spaces but also introduce a sense of playfulness and vibrancy to the heart of the site.
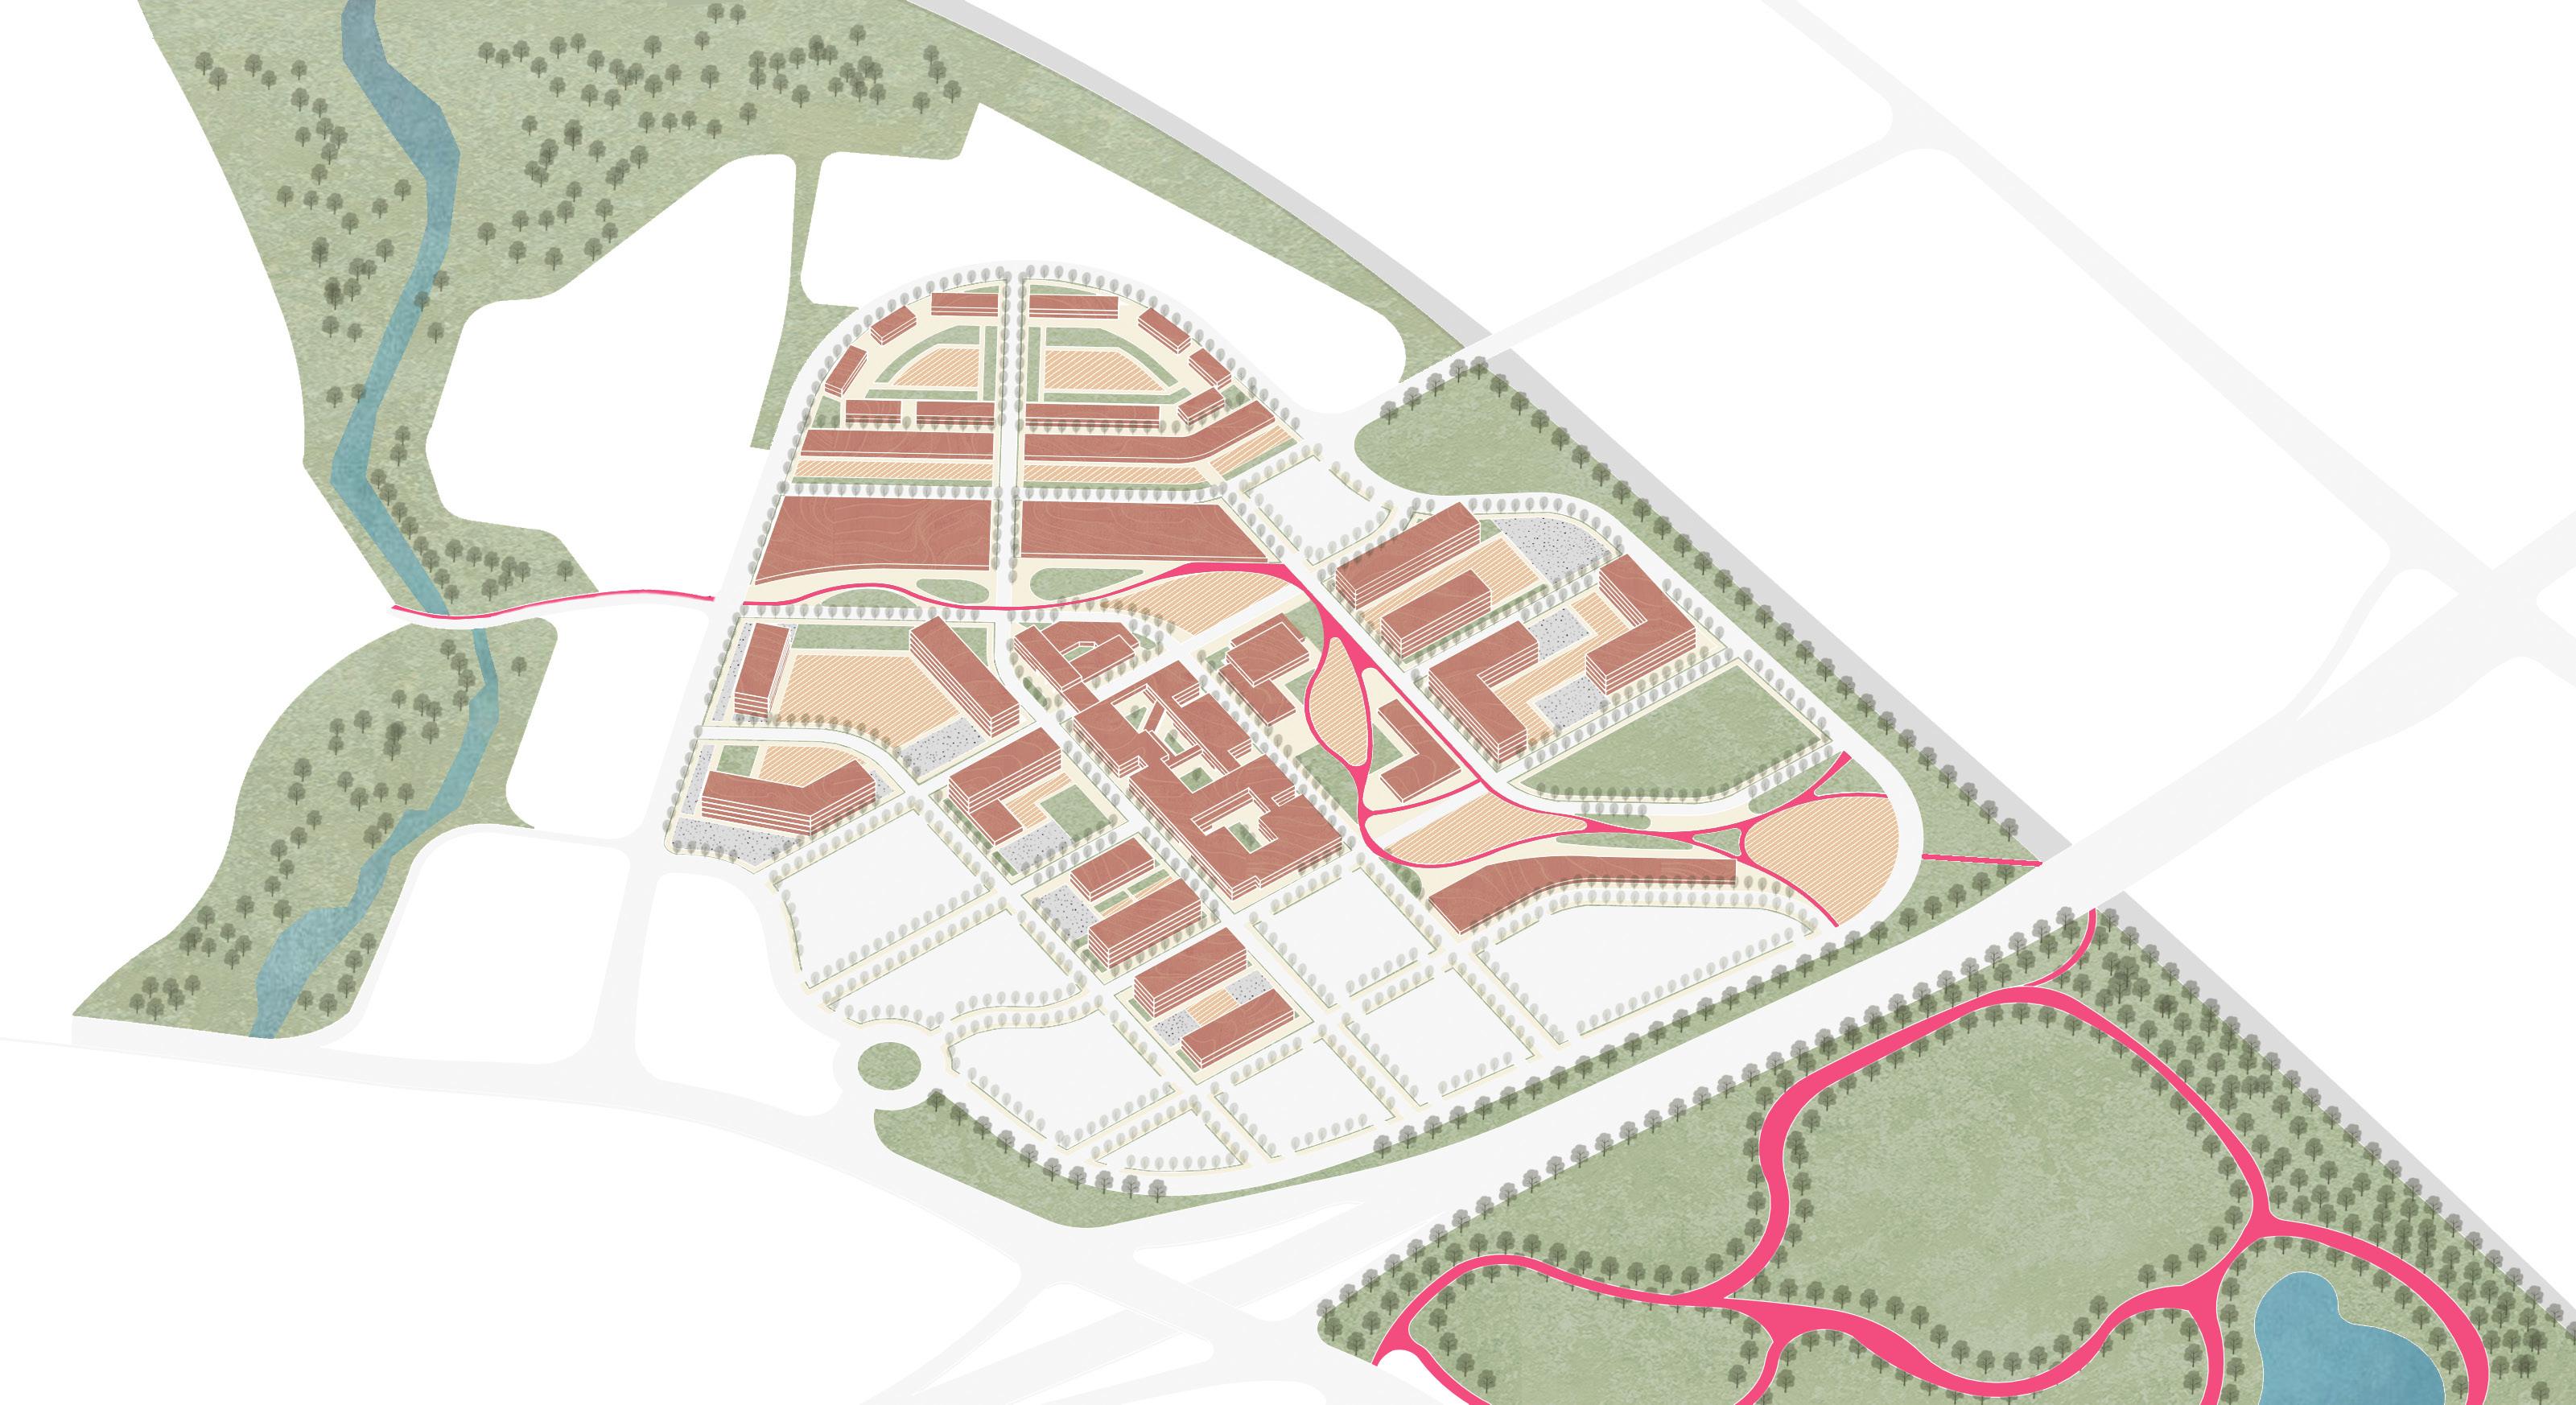
Link to Long’s Park
Access to Blue Green Connector
Figure 82: The central green connects Blue Green Connector to Long’s Park.
Figure 83 illustrates the intended character: threeto four-story buildings, integrated landscaping, and a system of open spaces combined to deliver a human-scale experience.
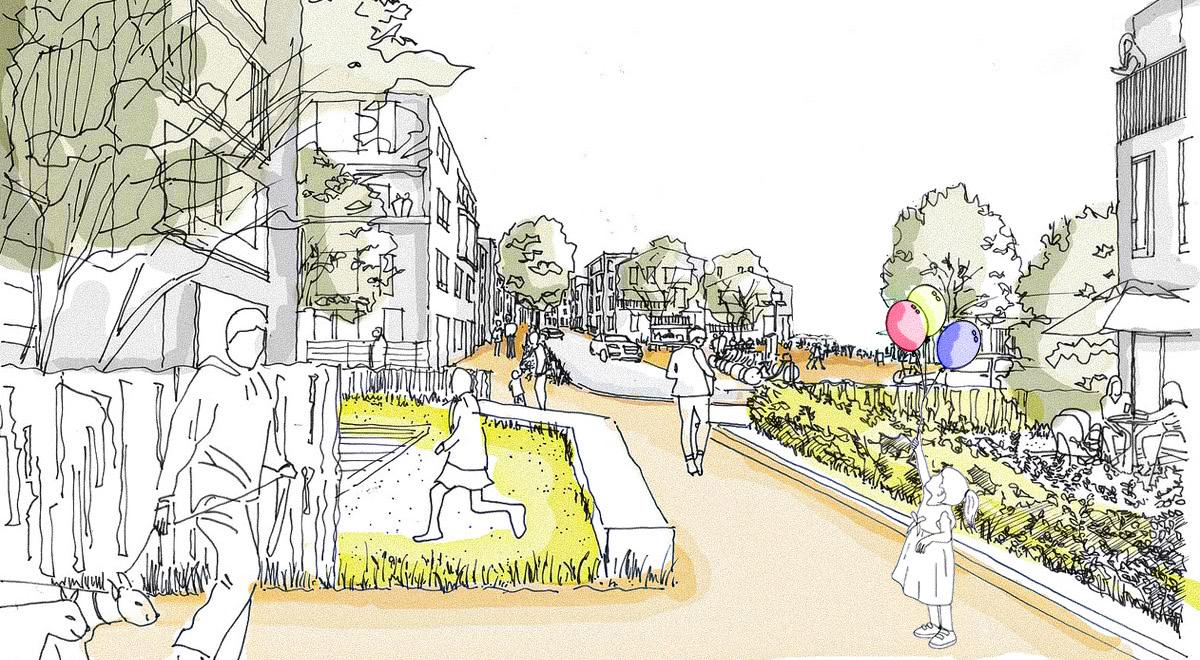
Figure 83: Drawing of mixed-use multifamily housing area.
Subdivision and Land Development
Any development in Scenario Two must also comply with the City of Lancaster’s Subdivision and Land Development Ordinance (SALDO), provided it first aligns with the zoning requirements of the MU-R (Mixed-Use Regional) Park City Center Neighborhood District. The following provides an addendum of plans and guidelines to the SALDO that apply specifically to Scenario Two.
Transportation
Most visitors will continue to access Park City by car. The key transportation components in addition to the road connections to highways, are parking and multi-modal opportunities.
Parking
Scenario Two applies the same parking standards as Scenario One: one space per 500 square feet of commercial floor area and one space per residential unit. The result is approximately 2,600 parking spaces, or about 1,200 fewer spaces than in Scenario One. Commercial parking is concentrated near the primary entrance from Harrisburg Pike, with a smaller amount at the secondary entrance from Plaza Boulevard to avoid disrupting through-traffic within the site. Residential parking incorporates garages within single-family attached homes and surface lots within multifamily parcels.
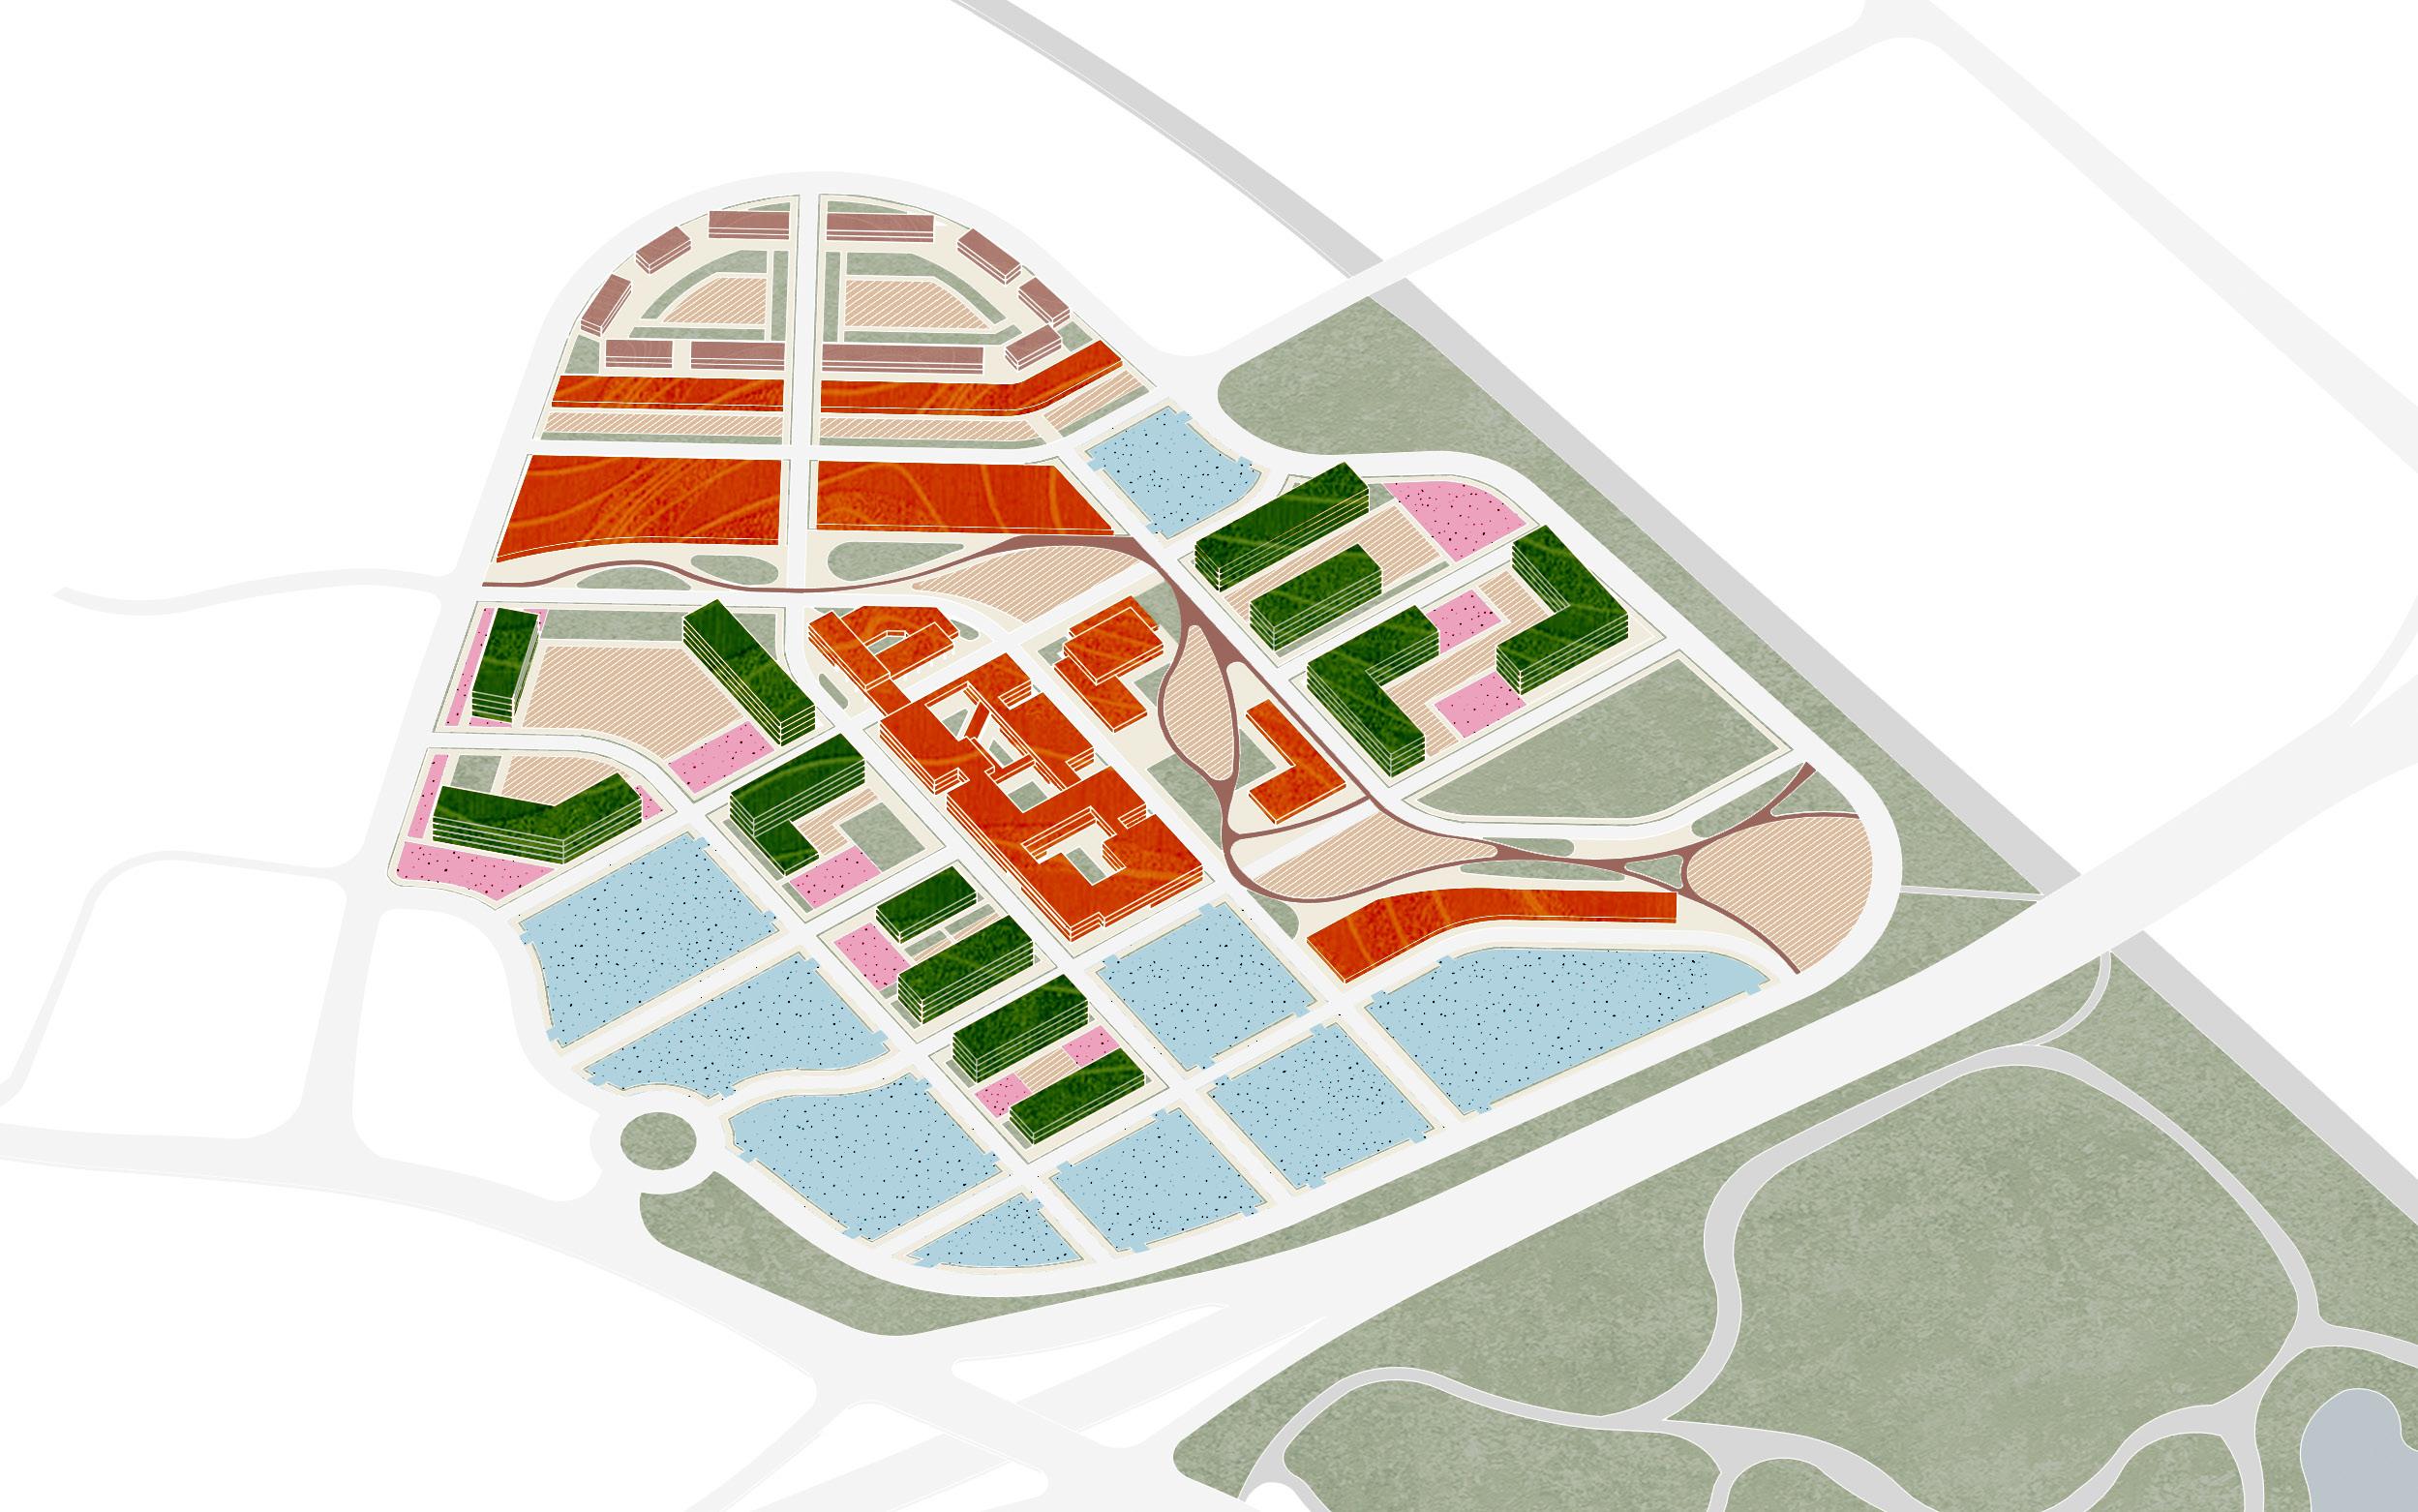
Figure 84: Map of proposed residential and commercial parking locations in Scenario Two.
Commercial parking Residential parking N
Streetscape Plan
In addition to the central pedestrian path that integrates with the street network, Scenario Two supports multimodal mobility. Bus Routes 8 will stop at the center of Park City. Four dedicated bike lanes will be added, and the city’s bike-share system could extend from downtown to Park City via a continuous trail, serving commuting, exercise, and leisure trips. The central green corridor provides space for walking and biking. The central corridor also links the town center to Long’s Park and the Blue Green Connector.
All streets must be designed in accordance with the city’s Design and Improvement Standards.
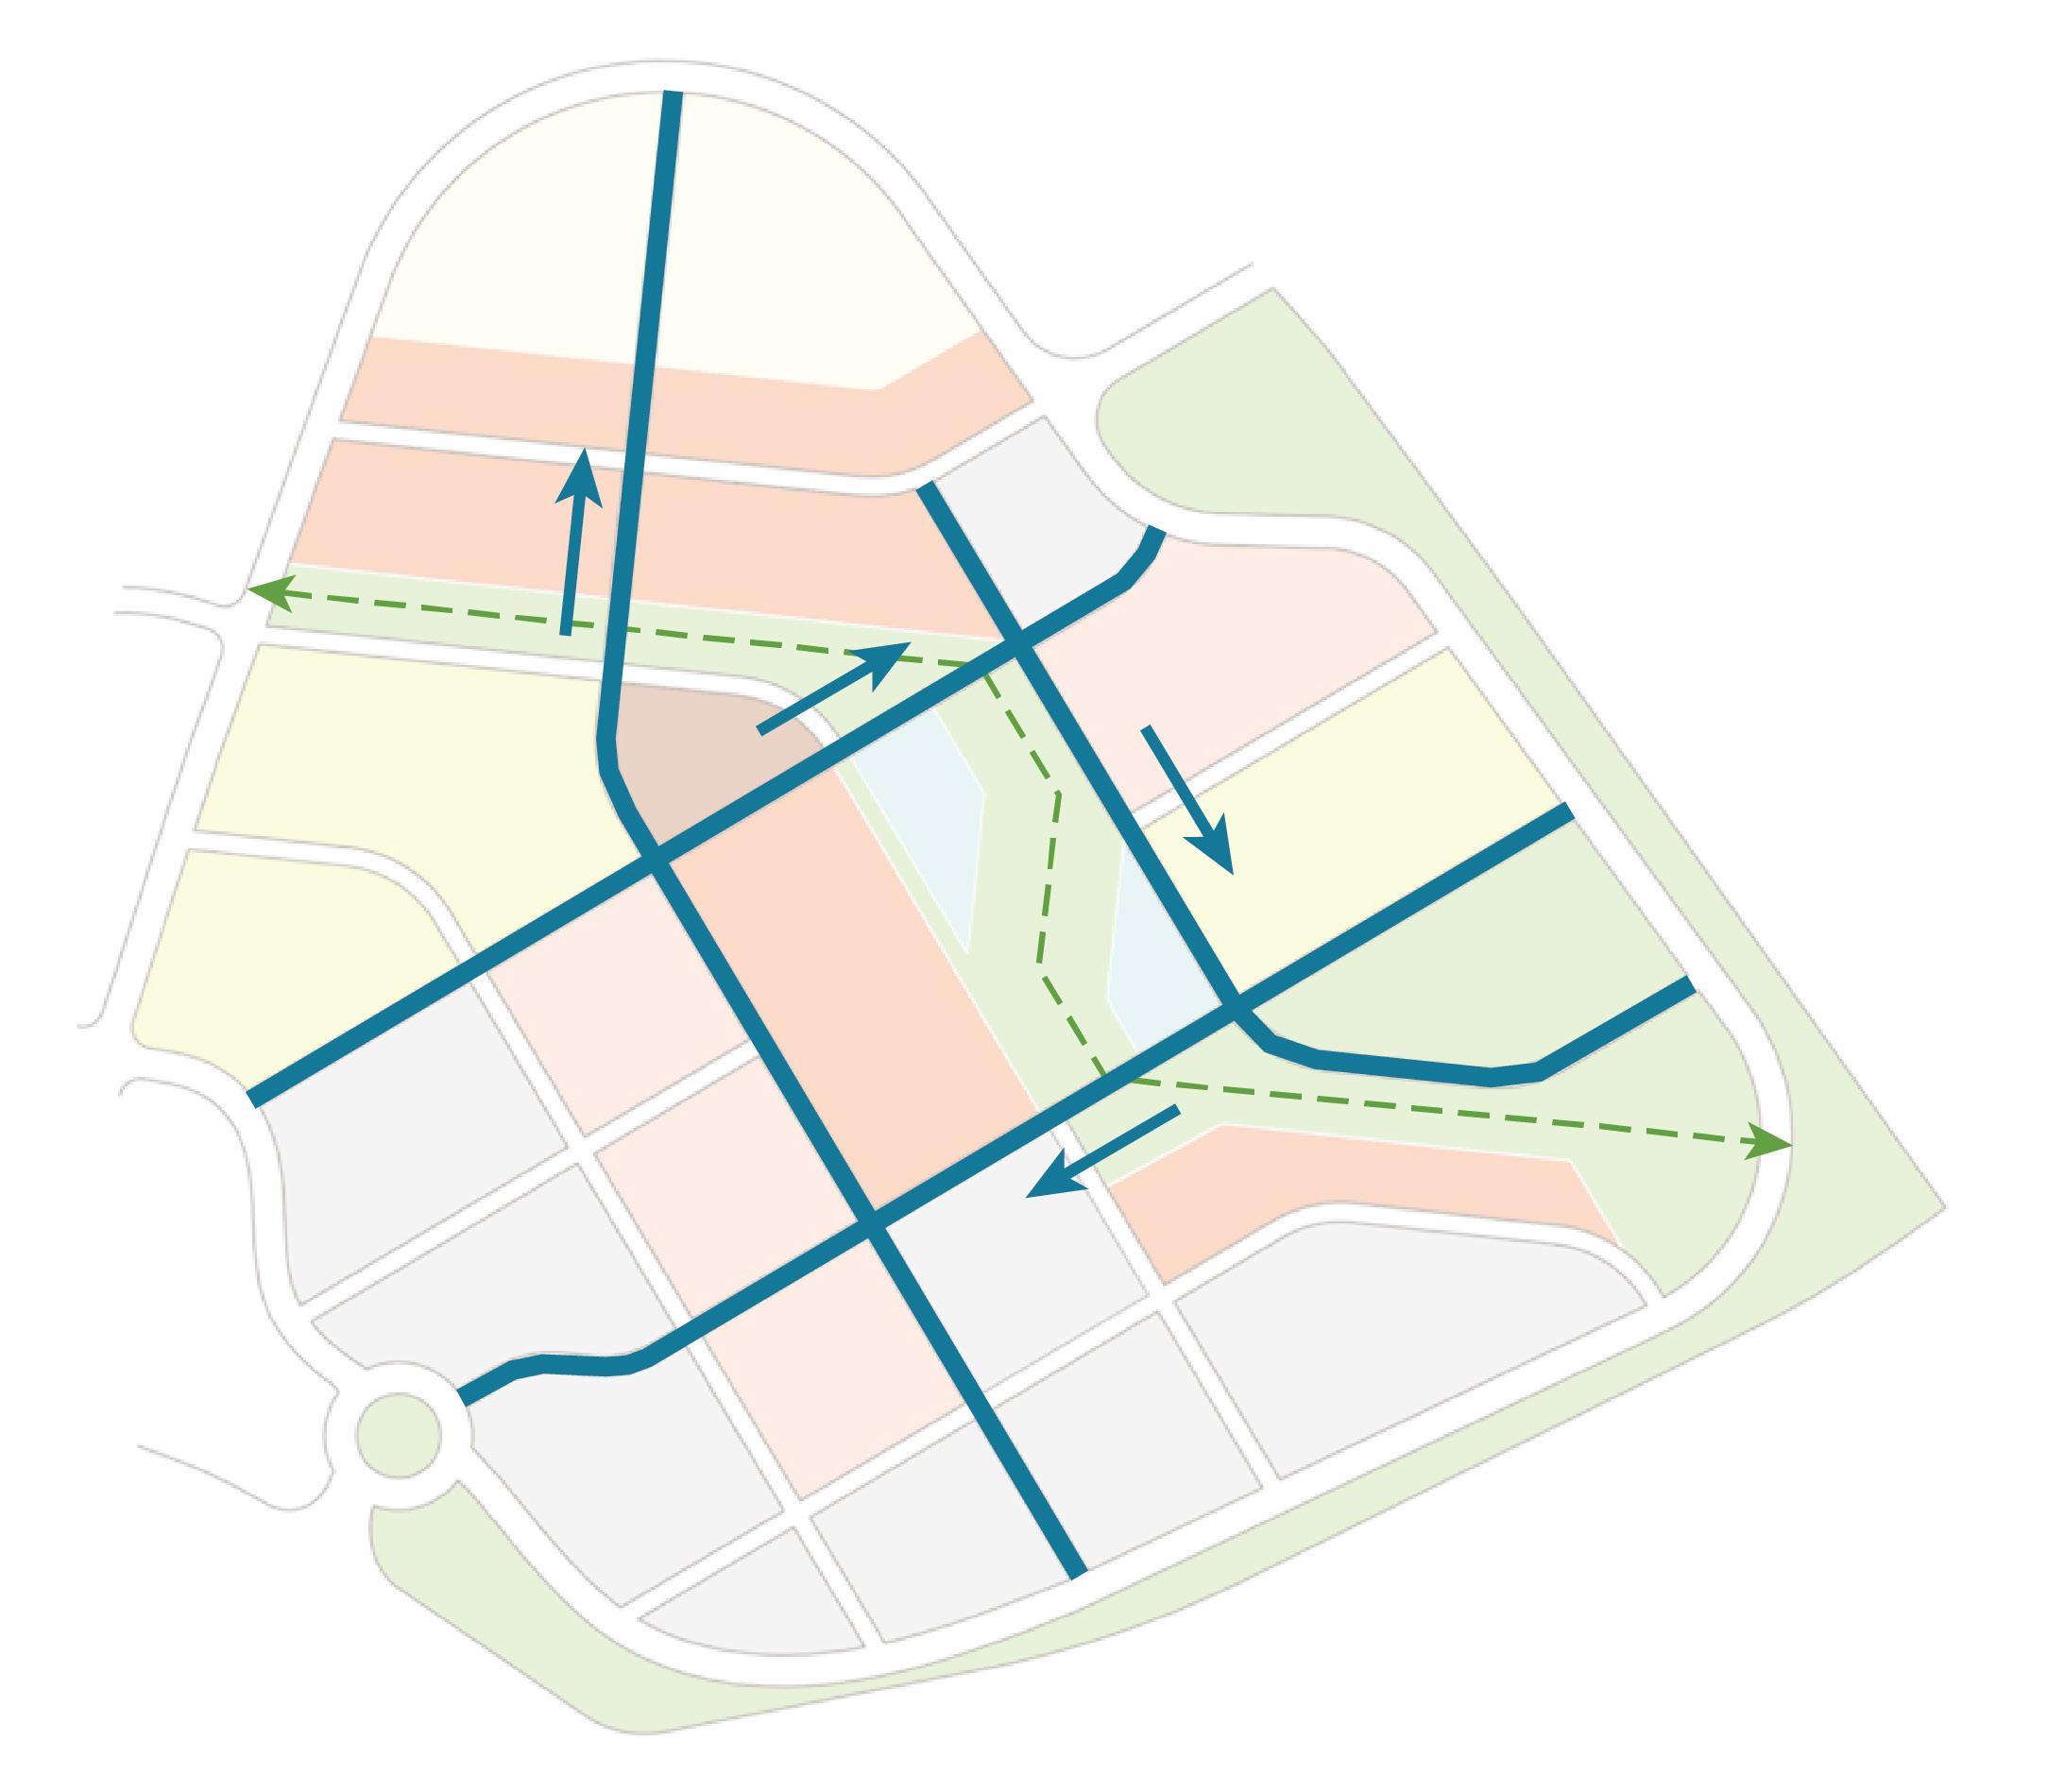
Roads
Shared use path
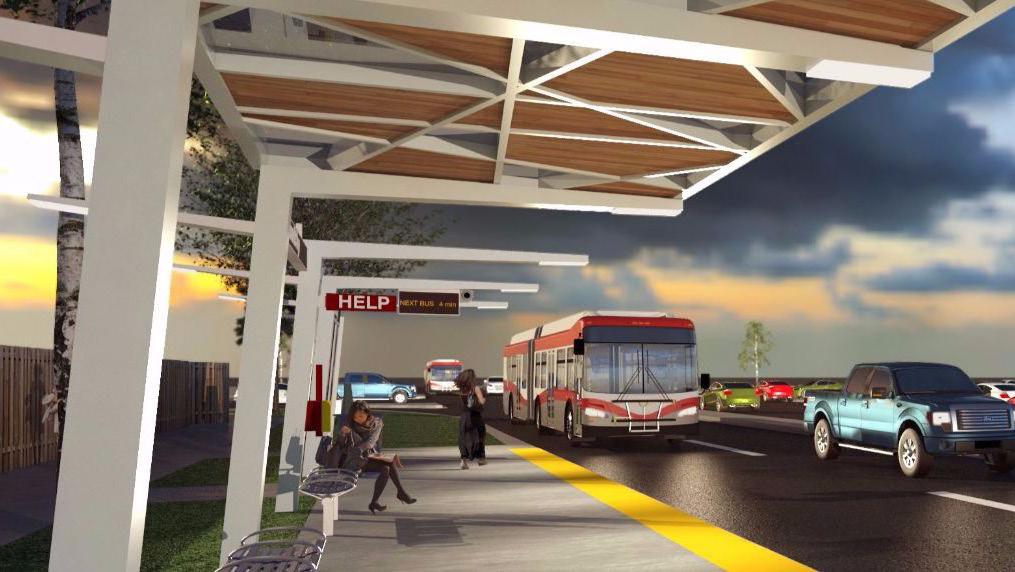
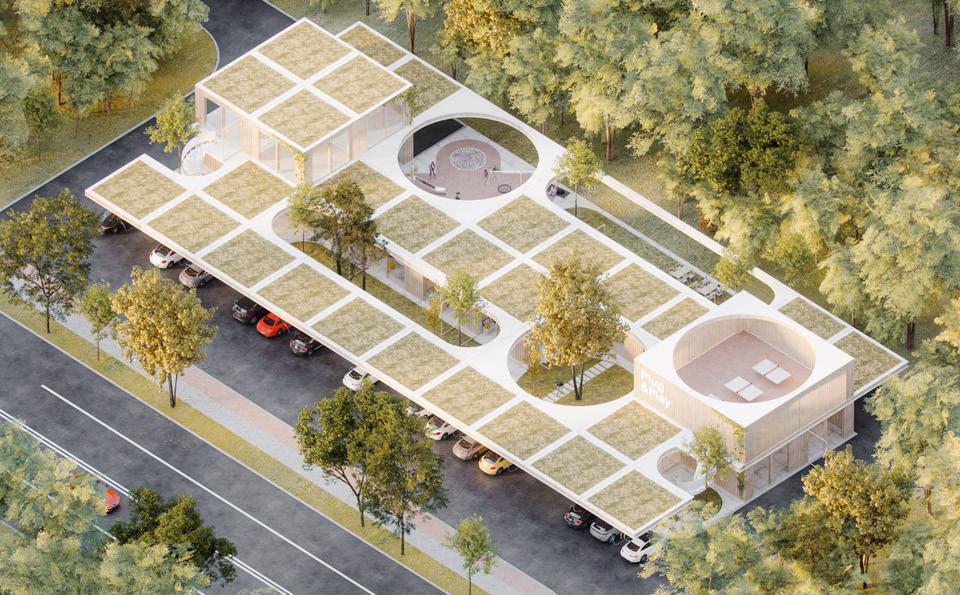
Figure 85: Scenario Two bike lanes.
Figure 86: Example of mobility hub.
Figure 87: Example of mobility hub.
To Long’s Park
To Blue Green Connector
with one-way bike lanes
Public Realm and Environment
Green Space
Guidelines
A minimum of 20% of the gross tract area shall be designed, constructed, and maintained as Green Space, of which there shall be one Central Green corridor between the Commercial Area of at least four acres in size, and an outer Green Area of at least nine acres in size.
Visioning
An S-shaped central green corridor links the Blue Green Connector to the Long’s Park underpass,
knitting regional open spaces into a connected network and creating an active public realm which complies with the guidelines outlined above. The central green corridor, including two cultural-use buildings, can host diverse events and community activities.
Scenario Two provides green space on 24.8% of the Park City site, significantly higher than the Business-as-Usual Scenario (13.9%) and slightly above Scenario One (22.5%), as shown in Figure 88. When peripheral buffers along Route 30 and the railroad are excluded, Scenario

Two’s advantage becomes clearer, with 16.9% of internal green space compared to 14.2% in Scenario One and only 4.6% under BAU. Notably, roughly half of Scenario Two’s green space (12.1%) is active, walkable open space, substantially improving everyday access to greenery, recreation, and social interaction for residents and visitors.
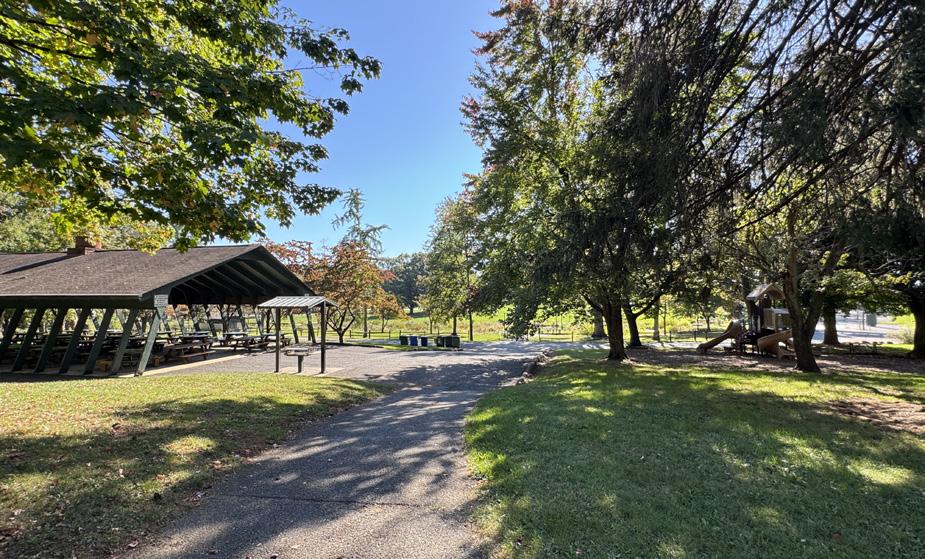
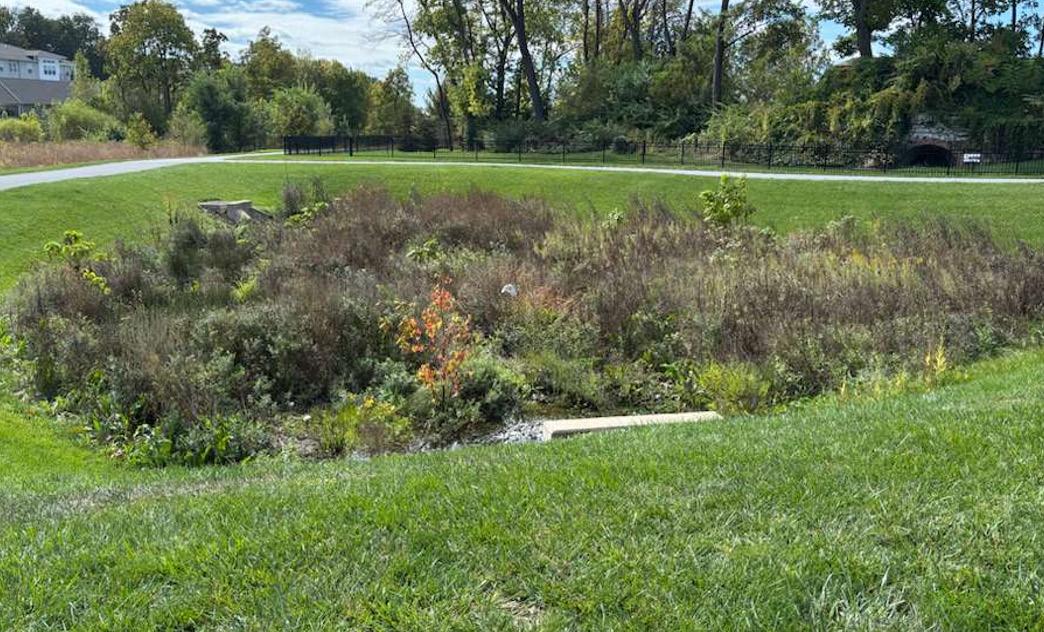
Figure 88: Percentage of green space in the three scenarios.
Figure 89: Example of active green space (Long’s Park).
Figure 90: Example of passive green space (bioswale at the Shoppes at Belmont).
Green Space Breakdown
Scenario Two
Scenario One
BAU
Stormwater Management
Scenario Two employs the same combination of peak-rate flood and water-quality facilities and green infrastructure as Scenario One to meet the City’s stormwater requirements and qualify for the available fee credits.
In Scenario Two, the site’s impervious area is further reduced. As shown in Table 24, total impervious area decreases from 3.36 million square feet in the Business-as-Usual (BAU) Scenario to 1.85 million square feet, and the corresponding annual stormwater management fee falls from $104,959.35 to $57,167.89. This represents an overall 46% decrease in the stormwater fee, compared to only a 25% reduction in the stormwater fee in Scenario One.
Green Infrastructure
Scenario Two maintains the same overall green infrastructure strategy as Scenario One. By adding on a larger share of green space and more active public areas, Scenario Two increases the extent and visibility of the green areas and trees to provide improved stormwater management and a more appealing everyday landscape (Figure 91 and 92).
The first six green infrastructure types from Scenario One are retained and expanded in Scenario Two, green parking, tree belts, continuous tree trenches, linear bioretention, rain gardens, and bioswales. These green interventions shade parking areas, frame streets and sidewalks, treat runoff along key corridors, and provide neighborhood-scale pocket parks. Together, the green spaces form the backbone of the site’s distributed stormwater and cooling network.
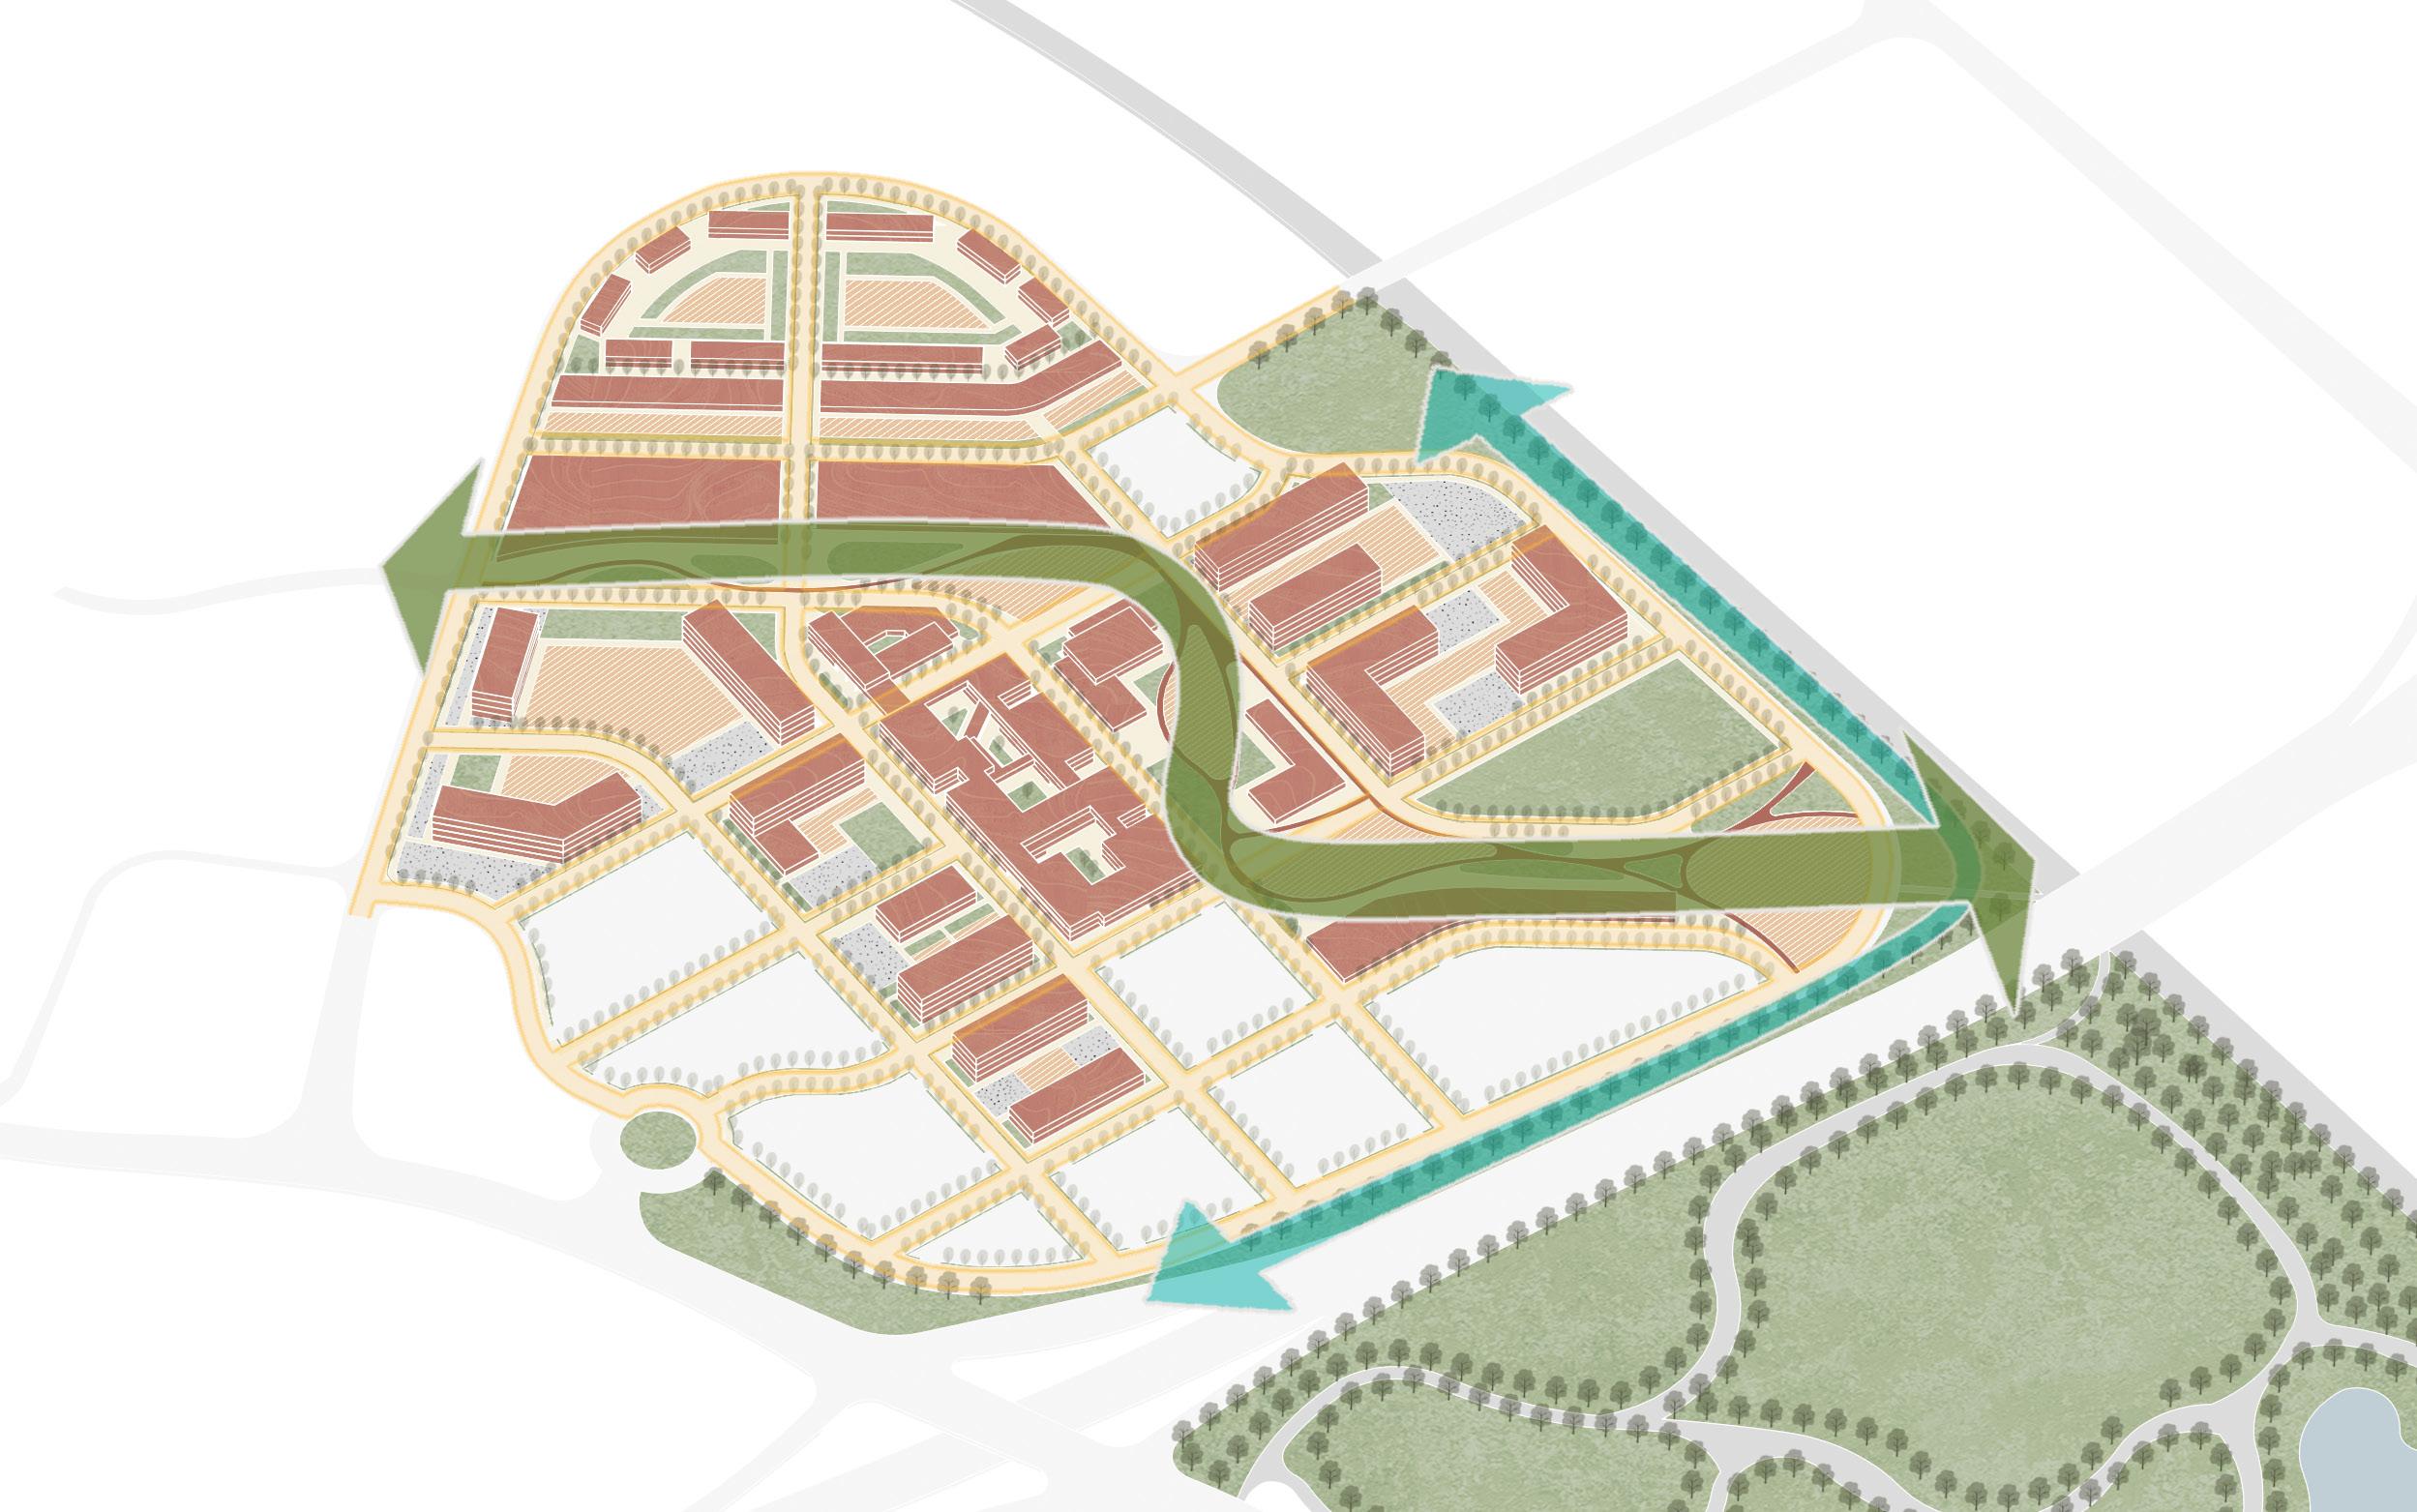
Table 24: Scenario Two impervious area and Stormwater Management Fee (SWMF) compared to Business-asUsual (BAU). Computations are based on City of Lancaster information.
Figure 91: Distribution of green infrastructure—Scenario Two.
Scenario Two adds green roofs on portions of the new buildings, combining intensive, walkable roof gardens with extensive planted roofs. Accessible roofs include paths, seating, and small terraces that create semi-public gathering spaces with views over the site, while non-accessible roofs primarily absorb rainfall, reduce heat gain, and improve building energy performance.
Multi-use Parkland
Scenario Two also introduces a sloped lawn and sports fields on a slightly higher part of the site, functioning as a piece of multi-use parkland. This vegetated area provides permeable ground for infiltration, slows and stores overland flow, and helps mitigate the urban heat-island effect, while the grass slope and playfields offer space for viewing, and everyday recreation.

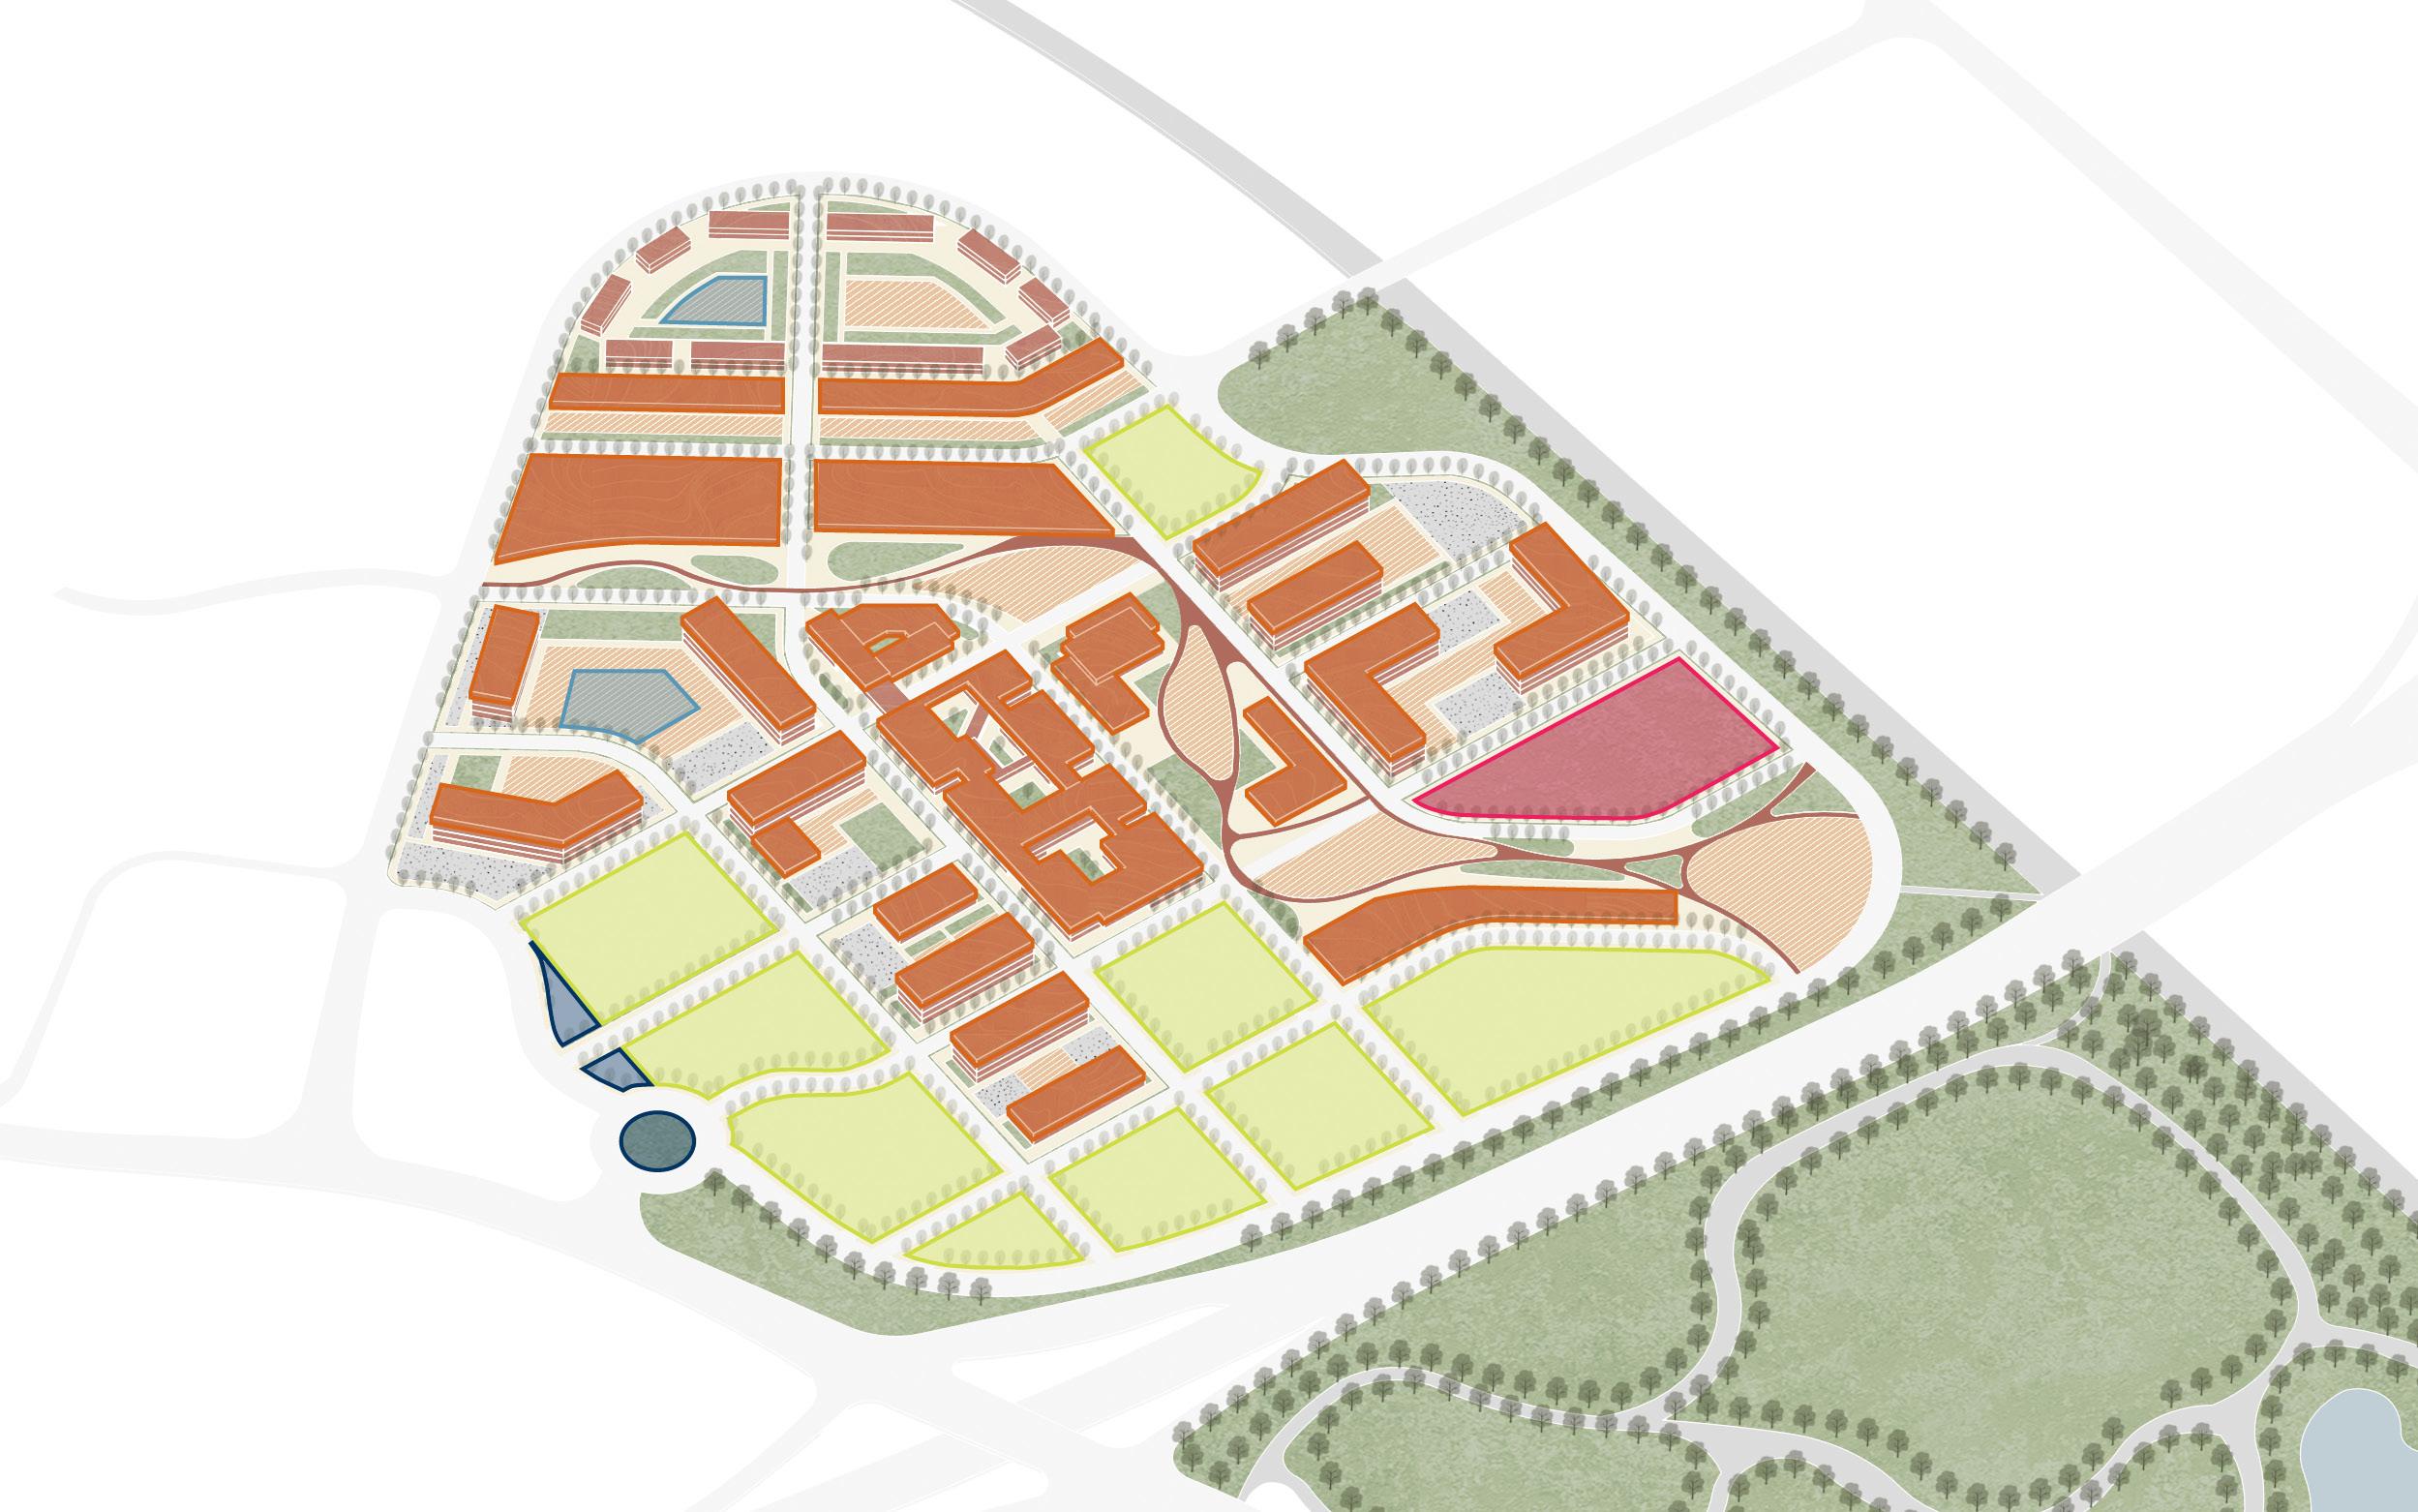


Rain gardens
Green parking
Bioswales
Green roofs
Multi-use parkland
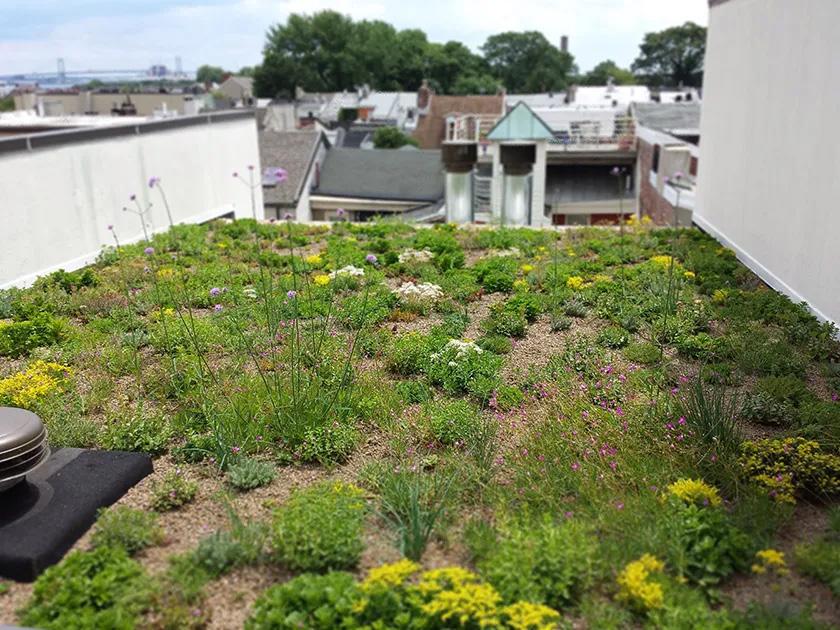

Figure 92: Distribution of green infrastructure—Scenario Two.
Figure 93: Example of green roof.
Figure 94: Example of multi-use parkland.
Energy and Decarbonization
Scenario Two promotes renewable energy through the installation of solar panels on new commercial and residential buildings and assumes that approximately 30% of commercial and residential roofs can be used for panels. This corresponds to a system of roughly 1.8 MW that would generate about 2.40 GWh of electricity per year at an estimated capital cost of $2.16 million.28 Annual generation at this scale is comparable to the electricity use of around 225 average households.
Scenario Two provides 80 Level 2 chargers located in commercial parking areas adjacent to the new residential buildings. Total installation cost is estimated at about $800,000. This is twice the number of chargers in Scenario One and is expected to deliver roughly 1.04 GWh of electricity per year.
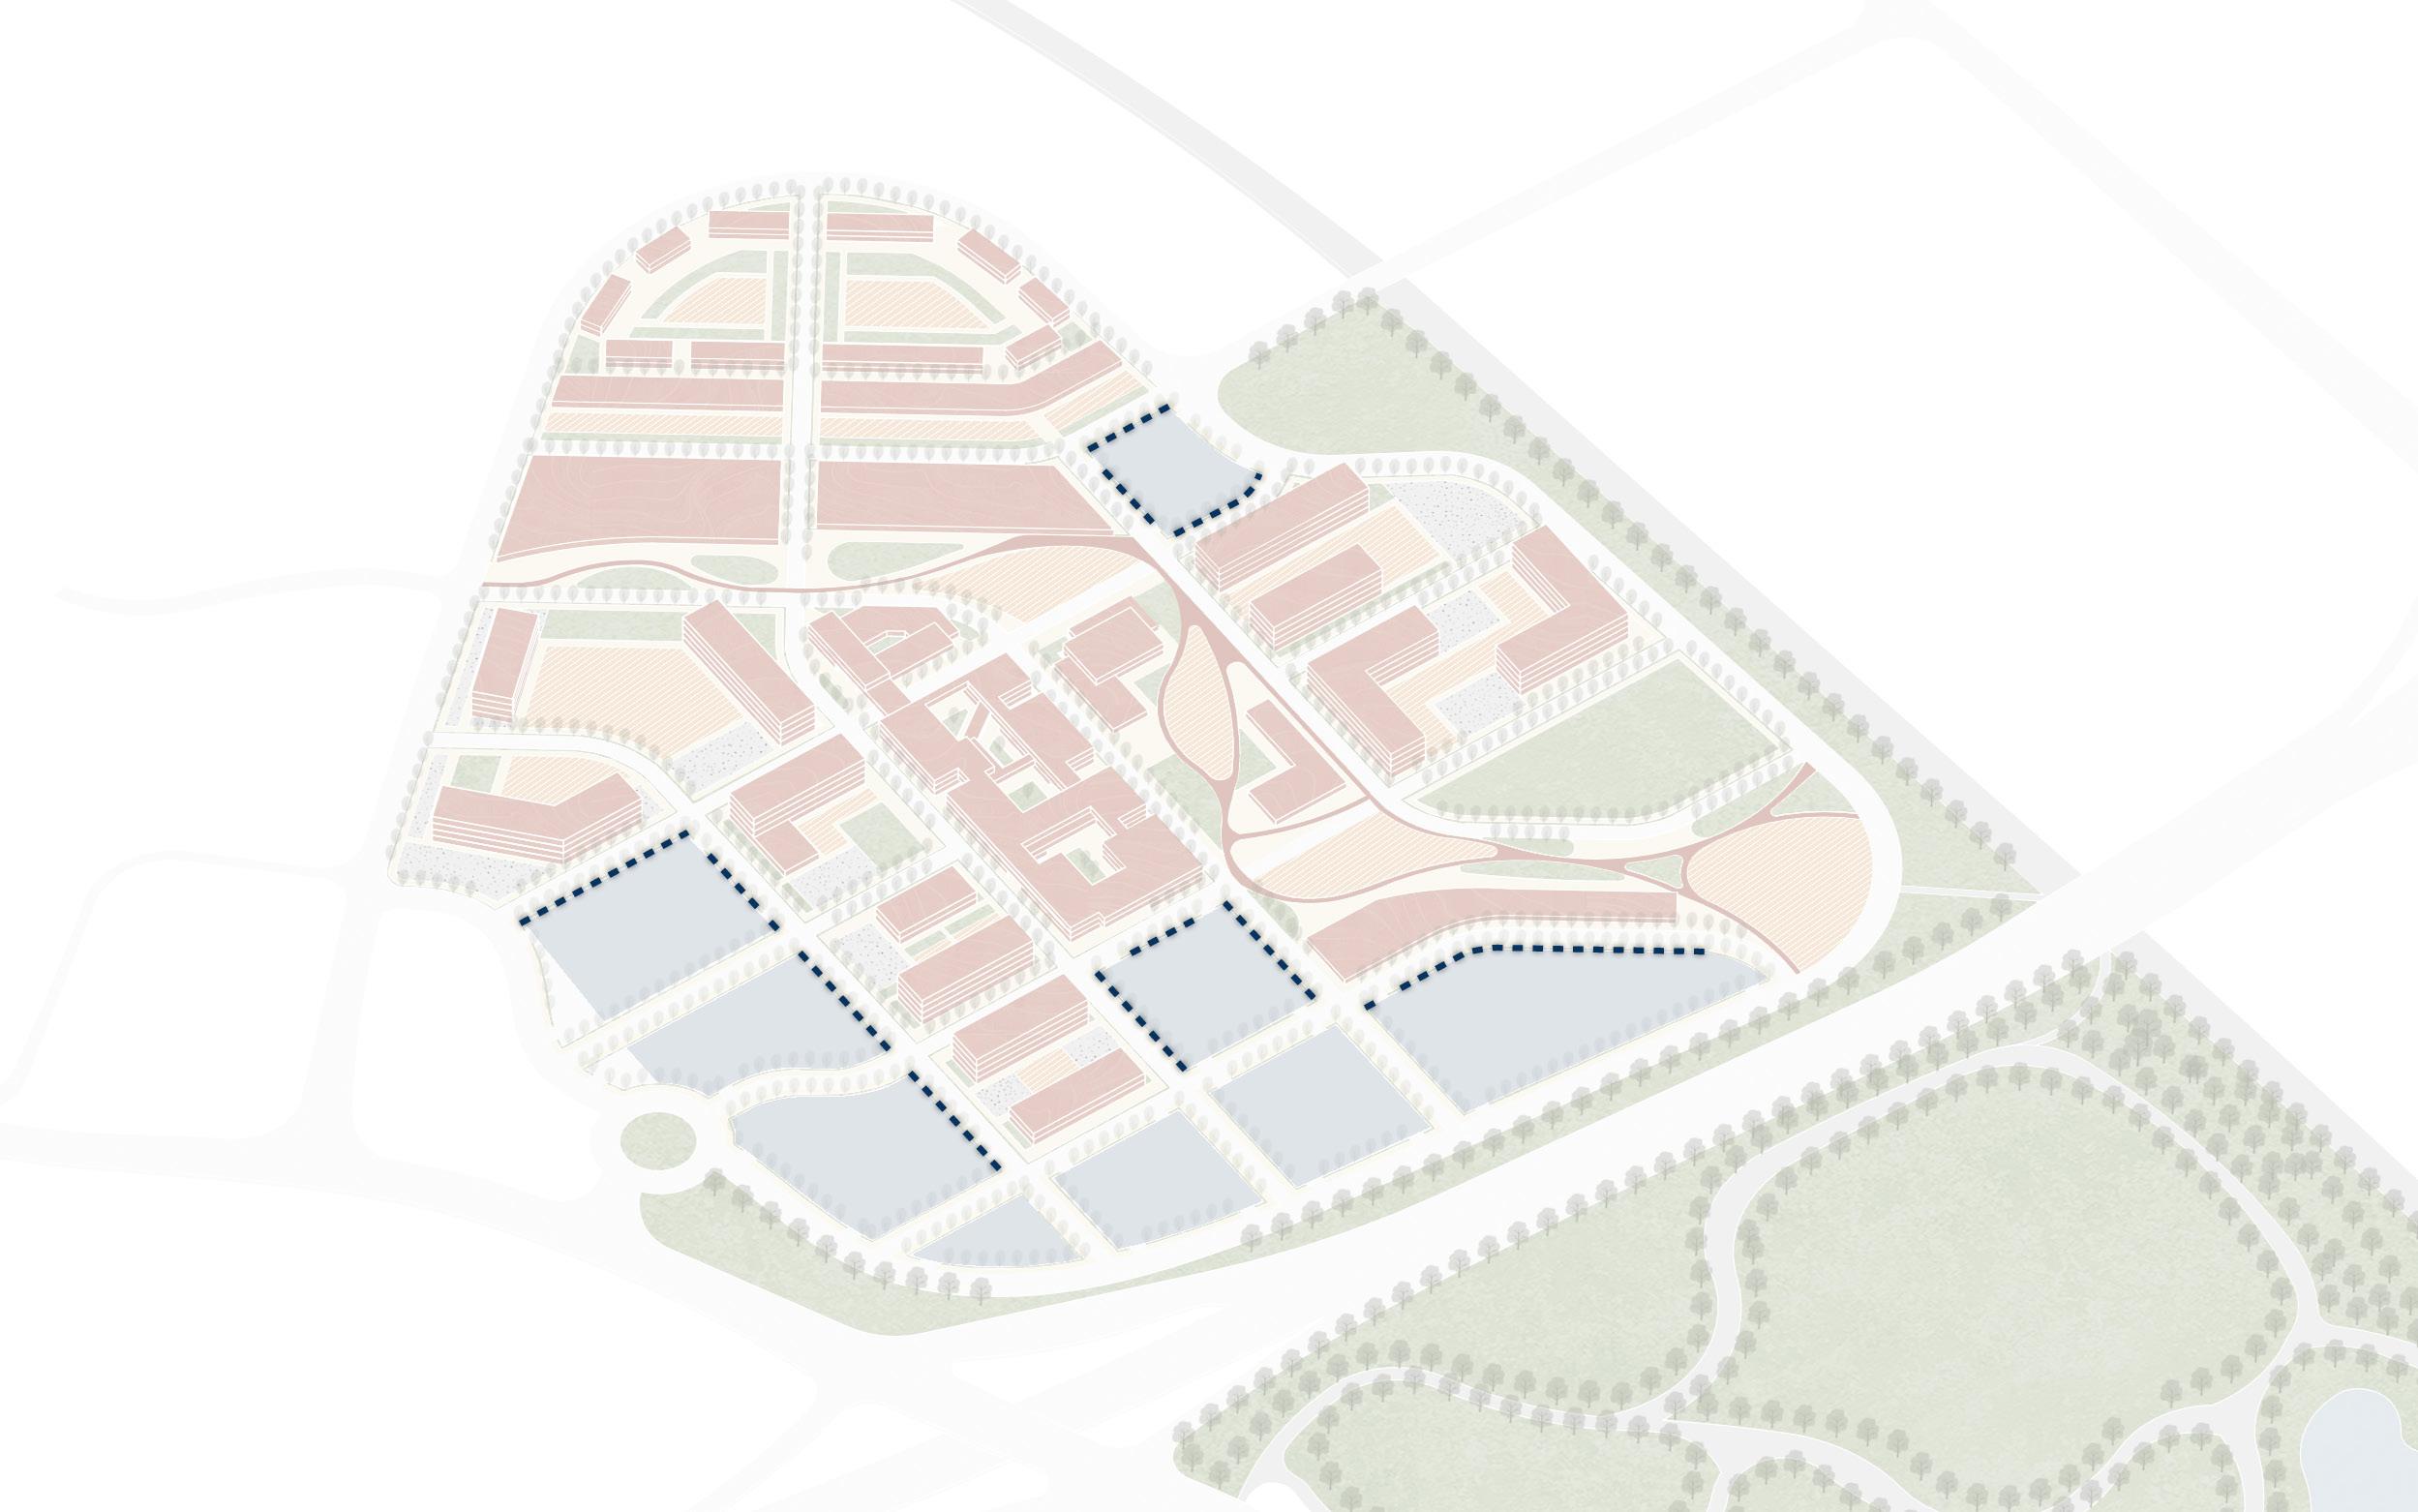
Figure 95: Proposed locations of EV chargers—Scenario Two.
Cost
Expectedly, Scenario Two cost modeling and financials are more complex than Scenario One. As a total redevelopment of the site, we now account for the acquisition and financing of Park City and its subsequent demolition. The difference in scope amplifies most costs, though this is offset slightly by economies of scale and assumed bulk purchasing. Using the same process described in the first scenario, we use RSMeans data to determine building costs based on exterior wall surface area, total square footage, building typology, size, material, and amenities. To determine feasibility, we again looked to our CoStar reports for residential, retail, commercial, and office rental rates and financing information in the greater Lancaster market and submarket.29
To determine building sizes, we took an iterative approach with the land use and design teams to determine how much retail, office, and general commercial the site could support based on economics and space restrictions—particularly parking. For Scenario Two, since the buildings are larger, we include an adjustment based on how much larger each building is over the average development by type. This reflects economies of scale and bulk purchase ordering (refer to “Square Foot Project Size Modifier” for more details).
Square Foot Project Size Modifier
One factor that affects the S.F. cost of a particular building is the size. In general, for buildings built to the same specifications in the same locality, the larger building will have the lower S.F. cost. This is due mainly to the decreasing contribution of the exterior walls plus the economy of scale usually achievable in larger buildings. The Area Conversion Scale shown below will give a factor to convert costs for the typical size building to an adjusted cost for the particular project.
Example: Determine the cost per S.F. for a 107,200 S.F. Multifamily housing.
Proposed building area = 107,200 S.F. Typical size from below = 53,600 S.F.
= 2.00
Enter Area Conversion Scale at 2.0, intersect curve, read horizontally the appropriate cost multiplier of .94. Size adjusted cost becomes .94 × $258.00 = $242.52 based on national average costs.
Note: For Size Factors less than .50, the Cost Multiplier is 1.1 For Size Factors greater than 3.5, the Cost Multiplier is .90
The Square Foot Base Size lists the median costs, most typical project size in our accumulated data, and the range in size of the projects. The Size Factor for your project is determined by dividing your project area in S.F. by the typical project size for the particular Building Type. With this factor, enter the Area Conversion Scale at the appropriate Size Factor and determine the appropriate Cost Multiplier for your building size.
Table 25: Unit mix for multifamily and mixed-use buildings in Scenario Two.
Furthermore, the urban design team determined that the following building sizes and heights would be appropriate for the imagined district. Note that the list does not include any multifamily, as those calculations were already determined. Multifamily buildings are designed as four-stories, while mixed-use are five.
Apartment Size Calculations
Table 26: Apartment size calculations.
Table 27: Building list and information.
We then go on to calculate the individual estimated cost for each building by type. The residential building sizes were calculated in the same manner as Scenario One: via unit size and mix calculations with the addition of common area, circulation space, and amenities. In Scenario Two, we program 540 multifamily units divided over four buildings. Each building is approximately 125K square feet and will cost around $24.5 million after adjusting for size and location for a total cost of $98 million.
Multifamily Construction Costs
28: Multifamily and townhome construction costs.
The overall retail construction (including mixed-use) is approximately $72.5 million, the new mall is about $71 million, office is $9.4 million, and the cultural buildings about $21.7 million. The cost for the ground-floor retail in the mixed-use buildings are included in the residential construction costs.
Table 29: Commercial construction costs.
From here we can build out our sources and uses table. Since we must include acquisition costs, we have roughly $331 million in hard costs, $50 million in soft costs, and $76 million in acquisition costs. Demolition, which is included in hard costs, amounts to nearly $27 million, which is reflective of the cost for hauling and regrading the site. Total project cost therefore is $456 million, and will be financed 70–30 debt to equity.
Finally, we are able to create an aggregated discounted cash flow analysis. First, we remove the townhome and cultural components as they are evaluated separately; we also reduce the acquisition, demolition, soft cost, and contingency charges on a pro-rata basis so our costs are correct. Next, we aggregate all revenue and expenses by each building type. Note that for the retail, mall, and office, the rent per square foot is reduced by non-rentable square feet—each building type has 20, 35, and 20 percent efficiency respectively. These portions of the buildings are reserved for circulation or otherwise unrentable. Also important to note is that retail and mall leases are considered triple net, meaning most of the costs of ownership are transferred to the tenant.
DCF Assumptions
Table 32: Discounted cash flow analysis and assumptions.
Discounted Cash Flow Analysis
Combined, the project generates enough revenue to cover its debt service starting in year one, and the net present value over the holding period is positive—just over $1 million—with an IRR of 7%. While this is not ideal, it does indicate Scenario Two pencils out.
Additionally, the single-family attached townhomes list for about $516K, a significant jump over Scenario One. These homes would be affordable to households earning just over $100K annually. This is a distillation of the financing for the entire Scenario: increased acquisition and demolition costs increase the basis cutting into developer profits. Though asking rents are lower in Scenario Two (approximately $1,780 per month), the site overall struggles to support the development without subsidy or a more intense use. This does present the City of Lancaster with the opportunity to partner with a developer, but ultimately this model indicates that if the City wishes to pursue a more dramatic redevelopment, the site will need to have more density, structured parking, and more retail and revenue-generating assets.
Summary
Compared to Scenario One, Scenario Two introduces a more compact, medium-density mixed-use neighborhood with approximately 600 residential units, accommodating roughly 1,300 new residents. The increased residential intensity supports a stronger mix of daily-need retail and destination anchors, reinforcing Park City’s role as both a community hub and a regional draw.
Scenario Two right-sizes parking to prioritize walkability and land efficiency, significantly expanding green space and integrating enhanced green infrastructure for stormwater management. Reductions in impervious surface allow for more landscaped public spaces, tree canopy expansion, green infrastructure, and improved stormwater infiltration, addressing flooding and water quality concerns while improving the overall character of the site. Connectivity is further strengthened through new and improved pedestrian and bicycle links to Long’s Park and the Blue Green Connector, alongside an upgraded transit and mobility hub designed to support more frequent service and sustainable travel options.
Through these coordinated investments, Scenario Two transforms Park City Center into a true town center with a distinct sense of place and community identity. By aligning higherdensity development with improved mobility, environmental performance, and public space, the scenario promotes fiscal sustainability for the City of Lancaster while supporting long-term profitability and resilience for the site’s private developers.
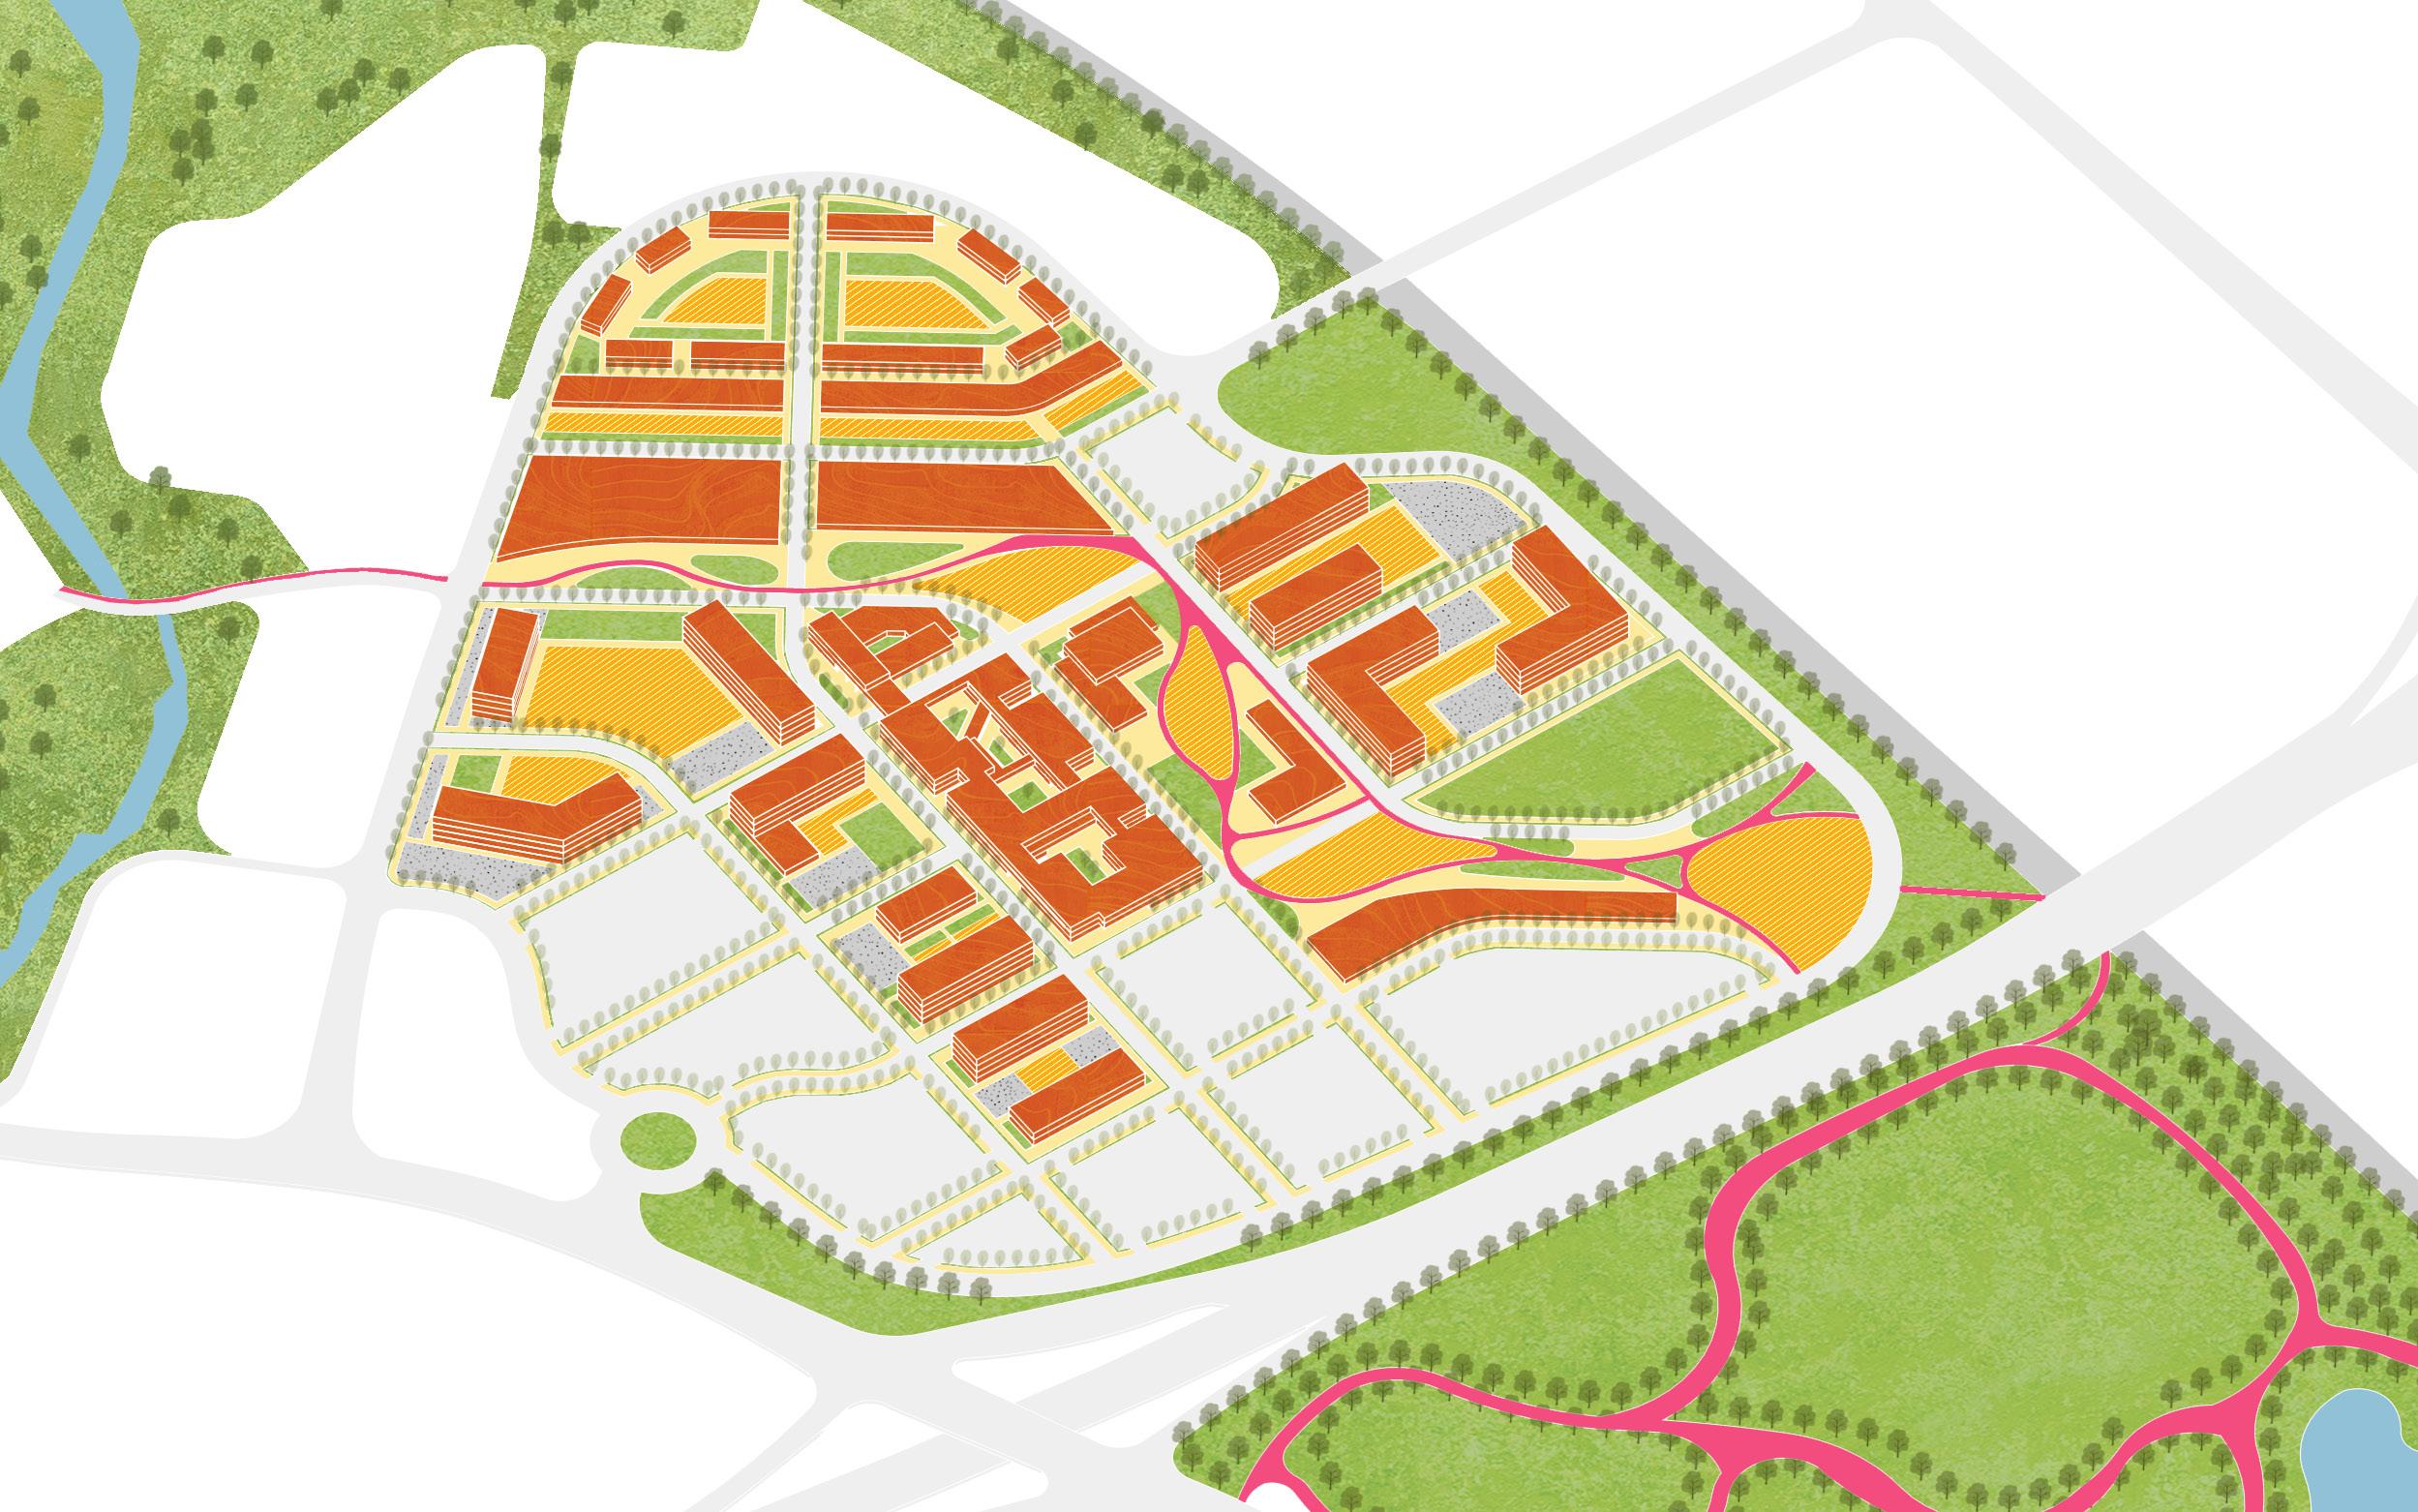
Figure 96: Rendering of Scenario Two.
Summary & Recommendation
Summary
The Preferred Scenario: Scenario One
Summary
The scenario planning approach to evaluating the future of Park City Center proved very useful, rather than simply recommending a particular design and array of land uses. Scenario planning enabled us to weigh the pros and cons of three possible outcomes.
Park City Center’s current Business-as-Usual configuration constrains the site’s ability to advance the City of Lancaster’s social, economic, and environmental objectives. Although the mall is served by transit seven days a week, limited service frequency and early evening cutoffs restrict visitation and suppress evening activity. Extensive areas of underutilized surface parking increase impervious cover, contributing to stormwater runoff, localized flooding, and pollutant loading into nearby waterways within the Susquehanna River Basin and Chesapeake Bay Watershed. At the same time, the absence of meaningful green space, tree canopy, and cohesive façade design diminishes environmental performance, weakens placemaking, and limits the site’s long-term adaptability and economic resilience. Under existing C-3 commercial zoning, the Business-as-Usual scenario does not permit on-site residential uses, effectively precluding housing development. This condition directly conflicts with the City of Lancaster’s 2023 Comprehensive Plan and Small Area Plan guidance, which explicitly call for the integration of housing at the Park City Center site better to support growth, sustainability, and community needs.
Scenario One represents a moderate, marketresponsive redevelopment that builds on Park City Center’s commercial success while introducing housing, green infrastructure, and improved mobility. This scenario proposes a mixed-use zoning overlay, approximately 360 new residential units, and targeted commercial upgrades, including essential services. A 46 percent reduction in surface parking enables new green spaces, stormwater management features, and a shared-use path connecting the site to Long’s Park. Transit improvements, including an upgraded bus stop and increased service frequency to downtown Lancaster, support greater accessibility and activity. Together, these changes reposition Park City as both a shopping destination and an emerging neighborhood.
Scenario Two advances a more transformative vision, introducing a compact, medium-density mixed-use district with approximately 600 residential units and a stronger emphasis on walkability, daily-need services, and public space. Parking is further right-sized to expand green space, enhance stormwater management, and strengthen environmental performance. Enhanced pedestrian, bicycle, and transit connections to Long’s Park and the Blue Green Connector reinforce sustainable mobility and regional connectivity. Under this scenario, Park City Center evolves into a true town center, fostering a stronger sense of place, supporting fiscal sustainability for the City, and enhancing long-term value for private developers.
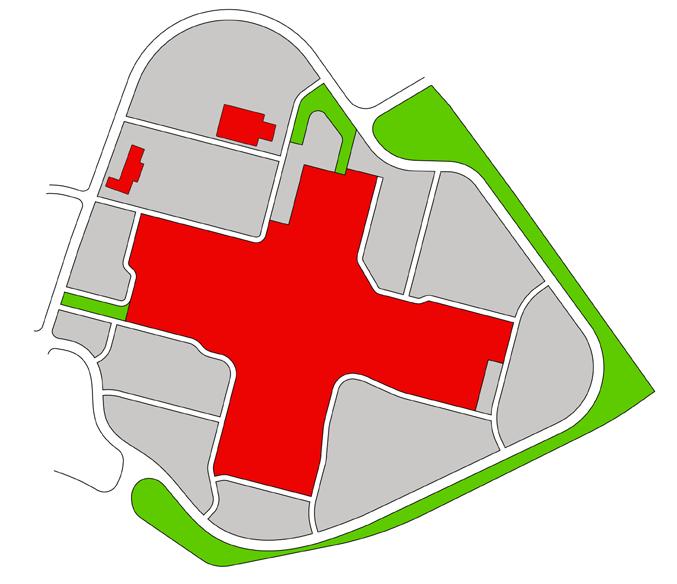
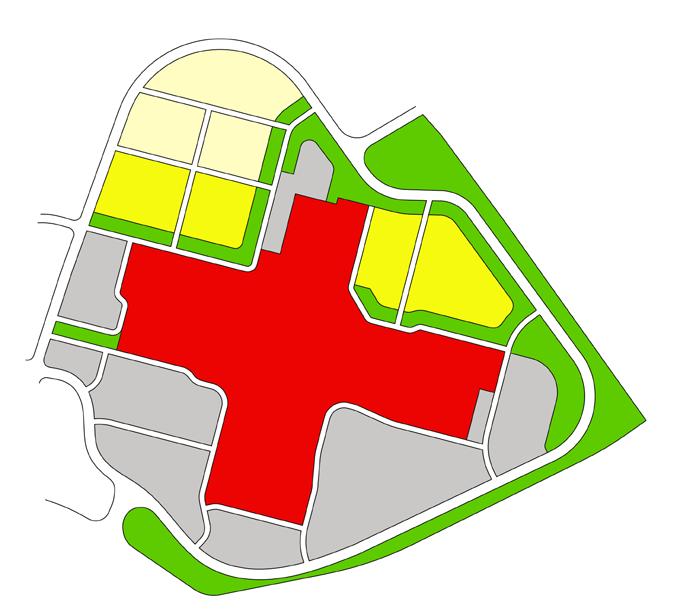
Business as Usual
Scenario One
Scenario Two
The Preferred Scenario: Scenario One
Our team recommends Scenario One as the preferred scenario for Park City Center. Scenario One has a simple urban design that integrates housing and green space, while maintaining the existing mall and removing the two outlying buildings. The Park City Center could add residents, improve walkability, reconfigure revenue-generating commercial activities, and enhance connections to Long’s Park and the Blue Green Connector.
We propose four housing sites, strategically sited to activate edges, replace excessive parking areas, and minimize noise intrusion. For transportation, Scenario One preserves sufficient parking but prioritizes upgraded pedestrian, bike, and transit access. Environmentally, this scenario reduces impervious surface area and adds trees and green space, which greatly improve stormwater management. Renewable energy from solar panels on rooftops and electric vehicle parking stations offer greater environmental sustainability.
Scenario One also encourages a more up-to-date mix of retail and services with an added focus on day-today needs, such as a grocery store and a bank. For zoning, we recommend an overlay district to implement the Small Area Plan—allowing a mix of residential and commercial uses without overhauling the underlying C-3 commercial zoning district.
Most importantly, this is a cost-effective and actionable plan that can begin within the next decade—unlike Scenario Two, which requires much higher investment and complete overhaul of the Park City site. In short, Scenario One offers a realistic pathway toward a sustainable, connected, and livable Park City Center.
Figure 97: Rendering of Scenario One.
List of References
Contents
1 From first row to last:
Brookfield Properties. (n.d.). Park City Center. https://www.brookfieldproperties.com/en/ourproperties/park-city-center-423/ Goldenberg Group. (n.d.). Red Rose Commons. https://www.goldenberggroup.com/ shopping-centers/red-rose-commons/ Tanger Outlets. (n.d.). Lancaster. https://www.tanger.inc/our-properties/locations/lancaster Waters Retail Group. (n.d.). Shoppes at Belmont. https://watersretailgroup.com/property/ shoppes-at-belmont/ Cedar Realty Trust. (n.d.). Golden Triangle (Lancaster, PA). https://cedarrealtytrust. propertycapsule.com/p/commercial-real-estate-listings/Lancaster-PA-17601/ goldentriangle
High Real Estate Group. (n.d.). Crossings at Conestoga Creek. https://www. highrealestategroup.com/crossings-at-conestoga-creek/ Federal Realty Investment Trust. (n.d.). Lancaster Shopping Center. https://properties. federalrealty.com/property/Lancaster-Shopping-Center/3313994
2 From first row to last:
LancasterOnline. (2018, November 16). Remember when: 11 things you might have forgotten about Park City Center. https://lancasteronline.com/features/rememberwhen-11-things-you-might-have-forgotten-about-park-city-center/article_65f2650ee9e2-11e8-9721-fffceac2aa2b.html
LancasterOnline. (2002, September 26). What’s in store at Red Rose Commons?. https:// lancasteronline.com/news/whats-in-store-at-red-rose-commons/article_2059c3594223-5110-b411-0dbb31ee90eb.html
LancasterOnline. (2000, March 17). Oodles of outlets. https://lancasteronline.com/news/ oodles-of-outlets/article_2a0a50a0-3d19-576f-8470-29f09ace3376.html
Ames Construction. (n.d.). Shoppes at Belmont. https://www.amesconstructioninc.com/ projects/retail-construction/shoppes-at-belmont
LancasterOnline. (2014, April 30). Golden Triangle facelift paying off for owner. https:// lancasteronline.com/business/golden-triangle-facelift-paying-off-for-owner/ article_074cecee-acce-5136-8ff3-ffb3b24d854e.html
High Real Estate Group. (n.d.). The Crossings: Highlighting smart growth in Lancaster https://www.high.net/our-company/what-we-do/the-crossings-highlight-smart-growthproject-in-lancaster/ LancasterOnline. (2018, October 15). Sears rode the retailing waves in Lancaster: A local history. https://lancasteronline.com/business/local_business/sears-rode-the-retailingwaves-in-lancaster----a-local-history-of-the/article_e0c6ee5e-d08c-11e8-9193-
73611f3e5ee1.html
3 City of Lancaster, PA. (2024, December 23). Chapter 300: Zoning. eCode360. Retrieved from https://ecode360.com/8122408
4 LancasterOnline. (2018, November 16). Remember when: 11 things you might have forgotten about Park City Center. https://lancasteronline.com/features/rememberwhen-11-things-you-might-have-forgotten-about-park-city-center/article_65f2650ee9e2-11e8-9721-fffceac2aa2b.html
5 Lancaster County Property Tax Inquiry. (n.d.). Parcel Details for 3393323900000. Retrieved from https://lancasterpa.devnetwedge.com/parcel/view/3393323900000/2025
6 City of Lancaster, PA. (2024, December 23). Chapter 300: Zoning. eCode360. Retrieved from https://ecode360.com/8122408
7 Park City Center. (n.d.). Map & directory. https://www.parkcitycenter.com/en/map/#/
8 Red Rose Transit Authority. (n.d.). Route 8/Park City – Penn State Health schedule [Web page]. Retrieved from https://www.redrosetransit.com/schedules/route-8-park-citypenn-state-health-11-11
9 City of Lancaster, Pennsylvania. (2014). Administrative Resolution No. 10-2014: Establishing the base rate and appeal fee for the Stormwater Management Fee under the City Stormwater Management Fee Ordinance [PDF]. Retrieved from https:// ecode360.com/documents/LA1674/public/257942688.pdf
10 American Lung Association. (2025, April 23). Lung Association Report: Lancaster, PA Metro Area Air Pollution Measures Worsen, Area Rejoins National Worst 25 in the U.S. List for Daily Particle Pollution, Ranking 2nd Worst in Mid-Atlantic. Retrieved from https:// www.lung.org/media/press-releases/2025-lancaster-sota
11 City of Lancaster, Pennsylvania. (2023). Stormwater Management Fee (SWMF) policies and procedures manual [PDF]. Retrieved from https://www.cityoflancasterpa.gov/wpcontent/uploads/2020/10/SWMF-Policies-and-Procedures-2023.pdf
12 Susquehanna Township, PA. (2019). Design Guidelines for Susquehanna Union Green [PDF]. https://www.susquehannatwp.com/sites/g/files/vyhlif3896/f/uploads/190815_ sug_design_guidelines_rev_09.pdf
13 Lancaster County Property Tax Inquiry. (n.d.). Parcel Details for 3393323900000. Retrieved from https://lancasterpa.devnetwedge.com/parcel/view/3393323900000/2025
14 South Central Transit Authority. (2024, March). Transit Development Plan. https://www. sctapa.com/wp-content/uploads/2024/03/SCTA-Draft-Final-Report-031124.pdf
15 National Renewable Energy Laboratory. (n.d.). Solar installed system cost analysis. U.S. Department of Energy. https://www.nrel.gov/solar/market-research-analysis/solarinstalled-system-cost
16 National Renewable Energy Laboratory. (n.d.). PVWatts® calculator. U.S. Department of Energy. https://pvwatts.nrel.gov/
17 Trader Joe’s. (n.d.). General FAQs. https://www.traderjoes.com/home/FAQ/general-faqs. html
18 Dogtopia. (n.d.). Dogtopia. https://www.dogtopia.com
19 Food & Beverage Magazine. (2025, October 7). Are food courts dead? How premium dining concepts are revolutionizing mall restaurant revenue. https://www.fb101. com/are-food-courts-dead-how-premium-dining-concepts-are-revolutionizing-mallrestaurant-revenue/
20 Lancaster County WIB. (n.d.). Lancaster County WIB. https://www.lancastercountywib.com
21 RSMeans. (2024). Square Foot Costs with RSMeans Data: 2025 (46th annual ed.). Gordian.
22 CoStar Group. (2025, November). Multi-Family Market Report: Lancaster, PA. CoStar Group. Retrieved November 7, 2025. CoStar Group. (2025, November). Multi-Family Submarket Report: Lancaster, PA. CoStar Group. Retrieved November 7, 2025.
23 Brookfield Property Partners L.P. (2025). Form 6-K: Q3 2025 Interim Report [Quarterly Report]. https://bpy.brookfield.com/sites/bpy-brookfield-ir/files/Brookfield-BPY-IR-V2/ quarterly-reports/2025/bpy-q3-2025-form-6-k.pdf
24 Susquehanna Township. (2017, February 23). Ordinance 17-04 [PDF]. eCode360. https:// ecode360.com/documents/SU2468/source/LF1002221.pdf
Susquehanna Township, PA. (2019). Design Guidelines for Susquehanna Union Green [PDF]. https://www.susquehannatwp.com/sites/g/files/vyhlif3896/f/uploads/190815_ sug_design_guidelines_rev_09.pdf
25 All data for the convenience trade area, community trade area, and destination trade area come from: U.S. Census Bureau. (2023). American Community Survey 5-Year Estimates, 2019–2023 [Data file]. https://www.census.gov/data/developers/data-sets/ acs-5year.html
26 U.S. Census Bureau. (2023). American Community Survey 5-Year Estimates, 2019–2023 [Data file]. https://www.census.gov/data/developers/data-sets/acs-5year.html
27 U.S. Bureau of Labor Statistics. (2023). Table 1203. Income before taxes: Annual expenditure means, shares, standard errors, and relative standard errors, Consumer Expenditure Surveys, 2023. https://www.bls.gov/cex/tables.htm
28 National Renewable Energy Laboratory. (n.d.). Solar installed system cost analysis. U.S. Department of Energy. https://www.nrel.gov/solar/market-research-analysis/solarinstalled-system-cost
National Renewable Energy Laboratory. (n.d.). PVWatts® calculator. U.S. Department of Energy. https://pvwatts.nrel.gov/
29 CoStar Group. (2025, November). Retail Submarket Report: Lancaster County, PA. CoStar Group. Retrieved November 7, 2025.
CoStar Group. (2025, November). Office Submarket Report: Lancaster County, PA. CoStar Group. Retrieved November 7, 2025.
CoStar Group. (2025, November). Retail Market Report: Lancaster, PA. CoStar Group.
Retrieved November 7, 2025.
CoStar Group. (2025, November). Office Market Report: Lancaster, PA. CoStar Group. Retrieved November 7, 2025.
Photos & Figures
Front and back cover:
Google. (n.d.). [Map of Park City Center, Lancaster, PA] [Map]. Google Maps. Retrieved from https://maps.app.goo.gl/b7f7jwFMyBUK7kFt5
“Table of Contents”:
Brookfield Properties. (n.d.). Park City Center. Retrieved from https://www. brookfieldproperties.com/en/our-properties/park-city-center-423/
“Introduction”:
Park City Center. (2017). [Photograph of Park City Center] [Photograph]. Google Maps. Retrieved from https://maps.app.goo.gl/rTURSY3gNb6WF56n6
“Context”:
Park City Center. (n.d.). Retrieved from https://www.parkcitycenter.com/en/ “Three Scenarios”:
Google. (n.d.). [Map of Park City Center, Lancaster, PA] [Map]. Google Maps. Retrieved from https://maps.app.goo.gl/b7f7jwFMyBUK7kFt5
“Summary & Recommendation”: Brookfield Properties. (n.d.). Park City Center. Retrieved from https://www. brookfieldproperties.com/en/our-properties/park-city-center-423/
1 Data source:
Lancaster County. (2025). Lancaster County - Municipal Boundaries [Dataset]. PASDA. https://www.pasda.psu.edu/uci/DataSummary.aspx?dataset=1267
2 Data source:
Lancaster County. (2025). Lancaster County - Municipal Boundaries [Dataset]. PASDA. https://www.pasda.psu.edu/uci/DataSummary.aspx?dataset=1267
3 Data source:
Penn DOT GIS. (2025). Pennsylvania County Boundaries [Dataset]. https://datapennshare.opendata.arcgis.com/datasets/pennsylvania-county-boundaries/explore
4 Data source:
U.S. Census Bureau. (2023). Selected social characteristics in the United States (Table ID: DP02) [American Community Survey 5-Year Estimates data table]. Retrieved from https://data.census.gov
U.S. Census Bureau. (2023). Selected economic characteristics (Table ID: DP03) [American Community Survey 5-Year Estimates data table]. Retrieved from https:// data.census.gov
U.S. Census Bureau. (2023). ACS demographic and housing estimates (Table ID: DP05)
[American Community Survey 5-Year Estimates data table]. Retrieved from https:// data.census.gov
5 Data source:
Lancaster County. (2025). Lancaster County - Buildings (polygon) [Dataset]. Pennsylvania Spatial Data Access (PASDA). https://www.pasda.psu.edu/uci/DataSummary. aspx?dataset=1257
Lancaster County. (2014). Lancaster County - Hydro poly [Dataset]. PASDA. https://www. pasda.psu.edu/uci/DataSummary.aspx?dataset=1264
Lancaster County. (2022). Lancaster County - Land Use Types [Dataset]. PASDA. https:// www.pasda.psu.edu/uci/DataSummary.aspx?dataset=1265
Lancaster County. (2008). Lancaster County - Railroad Centerlines [Dataset]. PASDA. https://www.pasda.psu.edu/uci/DataSummary.aspx?dataset=1269
Lancaster County. (2019). Lancaster County - Road Edges (polygon) [Dataset]. PASDA. https://www.pasda.psu.edu/uci/DataSummary.aspx?dataset=1272
6 Photo by Ziyue Li.
7 Photo by Guangze Sun.
8 Blue Green Connector. (n.d.). Retrieved from https://bgc.pennant.dev/
9 Data source:
Lancaster County. (2025). Lancaster County - Buildings (polygon) [Dataset]. Pennsylvania Spatial Data Access (PASDA). https://www.pasda.psu.edu/uci/DataSummary. aspx?dataset=1257
Lancaster County. (2014). Lancaster County - Hydro poly [Dataset]. PASDA. https://www. pasda.psu.edu/uci/DataSummary.aspx?dataset=1264
Lancaster County. (2022). Lancaster County - Land Use Types [Dataset]. PASDA. https:// www.pasda.psu.edu/uci/DataSummary.aspx?dataset=1265
Lancaster County. (2008). Lancaster County - Railroad Centerlines [Dataset]. PASDA. https://www.pasda.psu.edu/uci/DataSummary.aspx?dataset=1269
Lancaster County. (2019). Lancaster County - Road Edges (polygon) [Dataset]. PASDA. https://www.pasda.psu.edu/uci/DataSummary.aspx?dataset=1272
10 Google. (2024). [Street View image of Park City Center, Lancaster, PA] [Photograph]. Google Maps. Retrieved from https://maps.app.goo.gl/tEA8pwsF2vWbdE5Z6
11 Google. (2024). [Street View image of Harrisburg Pike, Lancaster, PA] [Photograph]. Google Maps. Retrieved from https://maps.app.goo.gl/FwkXxEJzMqpPpUnq7
12 City of Lancaster, PA. (2023). Our Future Lancaster: A comprehensive plan for the City of Lancaster, PA [PDF]. Retrieved from https://compplan.cityoflancasterpa.gov/plan-pdf/
13 Lancaster County Planning Department. (2018). Places2040: A comprehensive plan for Lancaster County, PA [PDF]. Retrieved from https://lancastercountyplanning.org/184/ Places2040
15 City of Lancaster, PA. (2021). Zoning Map: §300, Attachment 1 [PDF]. Retrieved from https://ecode360.com/attachment/306100/LA1674-300a%20Zoning%20Map_ Aug2021.pdf
16 Park City Center. (n.d.). Map & directory. https://www.parkcitycenter.com/en/map/#/
17 Photo by Tom Daniels.
18 Google. (2024). [Street View image of Park City Center, Lancaster, PA] [Photograph]. Google Maps. Retrieved from https://maps.app.goo.gl/qJRDNdHMJWUFr3y3A
19 Google. (2024). [Street View image of Park City Center, Lancaster, PA] [Photograph]. Google Maps. Retrieved from https://maps.app.goo.gl/FVZUZNrc1xX6gBv48
20 Photo by Tom Daniels.
21 Google. (n.d.). [Map of Park City Center, Lancaster, PA] [Map]. Google Maps. Retrieved from https://maps.app.goo.gl/b7f7jwFMyBUK7kFt5
Google. (2024). [Street View image of Park City Center, Lancaster, PA] [Photograph]. Google Maps. Retrieved from https://maps.app.goo.gl/sgoPAg8cM1GPWec37
22 Google. (n.d.). [Map of Park City Center, Lancaster, PA] [Map]. Google Maps. Retrieved from https://maps.app.goo.gl/b7f7jwFMyBUK7kFt5
23 Photo by Tom Daniels.
24 Data source: Park City Center. (n.d.). Map & directory. https://www.parkcitycenter.com/en/ map/#/
25 Data source:
Placer.ai. (n.d.). Property overview: Park City Center (Sep 1, 2018–Aug 31, 2019; length of stay > 10 min) [Dataset]. Retrieved from Placer.ai
Placer.ai. (n.d.). Property overview: Park City Center (Sep 1, 2024–Aug 31, 2025; length of stay > 10 min) [Dataset]. Retrieved from Placer.ai
26 Red Rose Transit Authority. (n.d.). Route 8/Park City – Penn State Health schedule Retrieved from https://www.redrosetransit.com/schedules/route-8-park-city-penn-statehealth-11-11
27 Photo by Tyler Maynard.
28 Photo by Tyler Maynard.
29 Photo by Tyler Maynard.
30 Chesapeake Bay Program. (n.d.). The watershed. Retrieved from https://www. chesapeakebay.net/discover/watershed
31 Photo by Haoyu Zhu.
32 Photo by Tom Daniels.
33 Data source:
U.S. Census Bureau. (2023). American Community Survey 5-Year Estimates, 2019–2023 [Data file]. https://www.census.gov/data/developers/data-sets/acs-5year.html Lancaster County. (2025). Lancaster County - Municipal Boundaries [Dataset]. PASDA. https://www.pasda.psu.edu/uci/DataSummary.aspx?dataset=1267
34 Bryna Zumer. (2024, May 22). Five-story mixed-use building moves forward in downtown Bel Air. 2WMAR. https://www.wmar2news.com/local/five-story-mixed-use-buildingmoves-forward-in-downtown-bel-air
35 Zillow. (n.d.). 4 Whaler Dr, Runnemede, NJ 08078. Retrieved from https://www.zillow.com/ homedetails/4-Whaler-Dr-Runnemede-NJ-08078/449863753_zpid/
36 satish putti. (2019). [Photograph of Long’s Park] [Photograph]. Google Maps. Retrieved from https://maps.app.goo.gl/4maw91maE1UvqLXdA
39 Google. (2024). [Street View image of Park City Center, Lancaster, PA] [Photograph]. Google Maps. Retrieved from https://maps.app.goo.gl/tEA8pwsF2vWbdE5Z6
40 South Central Transit Authority. (2017). Annual Report 16 | 17 [PDF]. Retrieved from https:// www.redrosetransit.com/wp-content/uploads/2022/08/2017-SCTA-Annual-Report.pdf
41 vxla. (2009, April 6). Bus Stop and Bike Rack in Louisville, KY. Flickr. https://www.flickr.com/ photos/vxla/3416569815
43 City of Belmont, NC. (2023). Pedestrian Master Plan (Section 172). Retrieved from https:// online.encodeplus.com/regs/belmont-nc-pmp/doc-viewer.aspx?secid=172#secid-172
44 Photo by Ziyue Li.
45 Photo by Ziyue Li.
46 Exact Stormwater Management. (n.d.). Underground Detention Systems. Retrieved from https://www.exactstorm.com/rtank-underground-detention
47 Exact Stormwater Management. (n.d.). Underground Detention Systems. Retrieved from https://www.exactstorm.com/rtank-underground-detention
48 City of Lancaster, PA. (n.d.). Green It! Lancaster [PDF]. Retrieved from https://www. cityoflancasterpa.gov/stormwater-information/greenit-lancaster/
50 Westlin, J. (2024, July 10). From gray to green: Rethinking parking lots. DeepRoot Blog. https://www.deeproot.com/blog/blog-entries/rethinking-parking-lots/
51 Google. (2024). [Street View image of Park City Center, Lancaster, PA] [Photograph]. Google Maps. Retrieved from https://maps.app.goo.gl/s5qW7G5CBodLQCim9
52 Photo by Tyler Maynard.
53 City of Chesapeake. (2025). Greenbrier Area Plan: Design guidelines (Published May 7, 2025).
54 Toronto and Region Conservation Authority. (2018, August 14). A complete guide to building and maintaining a rain garden. https://trca.ca/news/complete-guide-buildingmaintaining-rain-garden/
55 City of Lancaster. (2019). Green It! Lancaster (Appendix B: GI technology fact sheets).
56 Google. (n.d.). [Map of Park City Center, Lancaster, PA] [Map]. Google Maps. Retrieved from https://maps.app.goo.gl/b7f7jwFMyBUK7kFt5
57 Photo by Tyler Maynard.
58 RadiantBrands. (2023, September 30). Trader Joe’s vs. Whole Foods: A Retail Strategy Breakdown. Retrieved from https://radiantbrands.com/trader-joes-vs-whole-foods-arethey-the-same-customers-for-different-brands/
59 CommunityMed Family Urgent Care. (n.d.). Urgent Care in Prosper TX. Retrieved from https://communitymedcare.com/location/prosper/
60 Natalie Dreier. (2024, October 11). Walmart to open pet clinics in some locations. WSB-TV Channel-2. Retrieved from https://www.wsbtv.com/news/trending/walmart-open-petclinics-some-locations/MNUOIPUMKVD6JK4U67DRLBEY2U/
61 Architizer. (n.d.). David Jones Foodhall in Sydney, Australia by Landini Associates. Retrieved from https://architizer.com/projects/david-jones-foodhall/
62 AppState. (n.d.). Career Development Center Relocation. Retrieved from https://www.
appstate.edu/appalachians-future/building-physical-infrastructure/career-dev/
64 Susquehanna Township, PA. (2019). Design Guidelines for Susquehanna Union Green [PDF]. https://www.susquehannatwp.com/sites/g/files/vyhlif3896/f/uploads/190815_ sug_design_guidelines_rev_09.pdf
68 Greystone. (2025, August 20). Successful $93.5 Million Financing for Oak Hammock Expansion. Retrieved from https://www.greystonecommunities.com/insights/ successful-93-5-million-financing-for-oak-hammock-expansion
69 Association Management Services. (n.d.) About. Retrieved from https://www.ams-hoa.com/ about/.
72 Photo by Tom Daniels.
75 Century Communities. (n.d.). Avalon | Residence 202 | New Homes for Sale in Castle Pines, CO. Retrieved from https://www.centurycommunities.com/find-your-new-home/ colorado/denver-metro/castle-pines/the-townes-at-skyline-ridge/lagae-townhomes200s/plans/avalon--residence-202/
76 Aldersgate Investment. (n.d.). Untitled Downtown Ventura Apartment Project. Retrieved from https://aldersgateinvestment.com/projects/untitled-downtown-ventura-apartmentproject/
77 KBS. (2020, January 21). Dairy Central’s Residential Component Breaks Ground Retrieved from https://kbsgc.com/2020/01/dairy-centrals-residential-componentbreaks-ground/
78 GRAND HOTEL Orlando AT Universal Blvd. (n.d.). D-shopping. https://grandhotelorlando. com/d-shopping
79 三益中国. (n.d.). 南京招商紫金智谷总部园. Retrieved from https://www.sunyat.com/ chanyeyuan/331.html.
80 华商网. (2023, December 20). 太古里、CBD、公园……大批项目最新进展. Retrieved from https://gqdangjian.hsw.cn/system/2023/1220/1578.shtml.
86 City of Calgary, CA. (n.d.). 2016: Bus Rapid Transit (BRT) Station Design. Retrieved from https://engage.calgary.ca/BRT/StationDesign.
87 Grace Kay. (2022, February 9). EV充電ステーションの未来はこうなる 退屈な停留所 ではなく、目的地に. Tech Insider. Retrieved from https://www.businessinsider.jp/ article/250100/.
89 Photo by Ziyue Li.
90 Photo by Guangze Sun.
93 Philadelphia Water Department. (2023). Stormwater management guidance manual (v3.3), Chapter 4.3: Green roofs. https://water.phila.gov/development/stormwater-plan-review/ manual/chapter-4/4-3-green-roofs/
94 Visit Fairfield County. (n.d.). Martens Park. Retrieved from https://visitfairfieldcounty.org/ listings/martens-park/