Value and Effect of Sustainability Measures in the Built Environment through Certification
Executive summary
Building certification schemes are increasingly used within the Danish built environment. However, Danish developers, investors, and public authorities are making decisions on whether to certify or not with limited clarity on the economic, environmental, and social impacts of building certification. This report addresses this knowledge gap. By consolidating fragmented knowledge and adding new empirical analysis based on Danish building data, we provide a clearer picture of the value and effects associated with certification. The need for such evidence is growing rapidly as the green transition accelerates, regulation tightens, and EU institutions and financial markets demand credible proof that capital is flowing toward assets with sustainability measures
The aim is to deliver a comprehensive, analytically robust assessment of how certification schemes create value in Denmark. The analysis covers economic, environmental, and social dimensions, applying methods that reflect the availability and maturity of data within each area. Below, we summarise the key insights for each of the three dimensions.
Economic value
• Rental levels: Certified rental units in Denmark are associated with a clear asking rent premium: ~8% for residential and ~16% for non-residential assets versus non-certified peers, primarily observed in larger cities. We control for a range of observable characteristics – e.g. location and rental- and building level characteristics. Drivers of the premium is likely a mix of inherent quality and signaling and unobserved advantages (e.g., superior fit-outs, stronger owners, premium micro-locations). Still, the results provide the best current estimate with available Danish data.
• Rental development: We find no evidence of differential rental growth for certified assets between 2019–2025 (largely based on residential data), suggesting no incremental premium expansion to date. Future tenant demand shifts could change this picture.
• Transaction prices: Plausible pathways to transaction premia include higher operating income driven by e.g., tenant demand, lower costs and regulatory/operational resilience, and preferential financing/investor appetite. However, data constraints on certified buildings with recorded transactions currently limit robust quantification in Denmark. Still, we show a large investor focus on certification in building portfolios.
Environmental value
• Additionality of certification: Environmental requirements form a core part of certification schemes, with particular emphasis on climate, biodiversity, pollution and resource use. Certification both ensures third-party validation of regulatory compliance and sets additional requirements beyond Danish Building Regulations. We show that a building that only meets building regulations fulfils only very limited requirements in certification schemes.
• Global warming: While direct effect evaluation is currently limited due to a lack of substantial emissions data for non-certified buildings, we argue that certification has acted as a key market driver, accelerating early LCA adoption and increasing demand for EPDs. DGNB-certified buildings finished in recent years show life cycle emissions well below regulatory thresholds, and there is a clear and growing use of EPD-documented materials.
• Biodiversity: Biodiversity is becoming a major focus area in the built environment. Although systematic measurement is still lacking, certification schemes are increasingly integrating biodiversity requirements and have strong potential to advance practice and create associated value.
Social value
• Additionality of certification: An important aspect of the value generated by certification runs through the way buildings affect the people who use them. We show that certification not only ensures validation with building regulation requirements within areas such as light, sound, chemicals, air and mobility – but also sets additional requirements above these. Some of these requirements may drive both market and socioeconomic value.
• End user value: While the willingness to pay for socially desirable attributes isn't measured here, the report highlights a range of socially beneficial outcomes from certification - which could ultimately drive a building's market value if tenants and owners perceive this as valuable.
The most empirically robust results are found within the economic dimension, where detailed and comparable data for certified and non-certified buildings allow for more rigorous quantitative analysis. These findings therefore provide the strongest evidence base for assessing the market value of certification.
For environmental and social outcomes, systematic and comparable data are less developed. In these areas, the report applies descriptive and scenario-based analyses, drawing on best available data, certification requirements, and existing research to illustrate how certification can create value and influence building performance and user experience. These differences in analytical depth reflect current data availability rather than differences in relevance across the three dimensions.
1. Introduction
Building certification schemes such as DGNB, Nordic Swan Ecolabel, LEED, and BREEAM have become central instruments in the Danish construction and real estate industry’s efforts to advance sustainability. Yet despite their widespread use, there remains a striking lack of robust, quantitative evidence of which value these certifications actually deliver. As a result, Danish developers, investors, and public authorities often operate with limited insight into the real economic, environmental, and social effects of certification, making strategic decision-making harder than it needs to be.
This report seeks to narrow this knowledge gap. We consolidate existing, fragmented knowledge and bring new empirical analysis based on Danish building data to provide a clearer understanding of the value and effects of building certification. The need for such documentation is pressing: the green transition is accelerating, regulatory requirements are tightening, and both EU institutions and financial markets increasingly demand credible evidence that capital is directed toward sustainability focused assets
The core question addressed in this report is: to what extent, and through which mechanisms, do building certification schemes create economic, environmental, and social value in Denmark? This is no simple task. Certification schemes differ across providers, evolve over time, and apply differently across building types. Additionally, the range of potential effects is broad, and the possibilities for direct quantification vary across outcomes. To navigate this complexity, the report begins by unpacking the heterogeneity of certification schemes inherent in the analysis’ area of investigation.
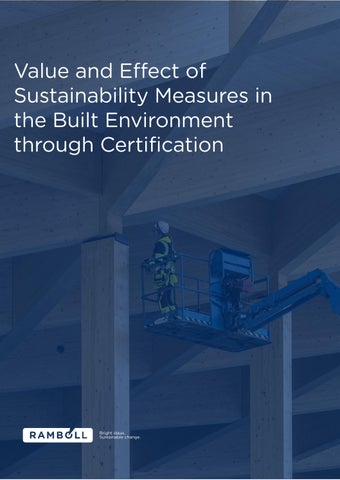
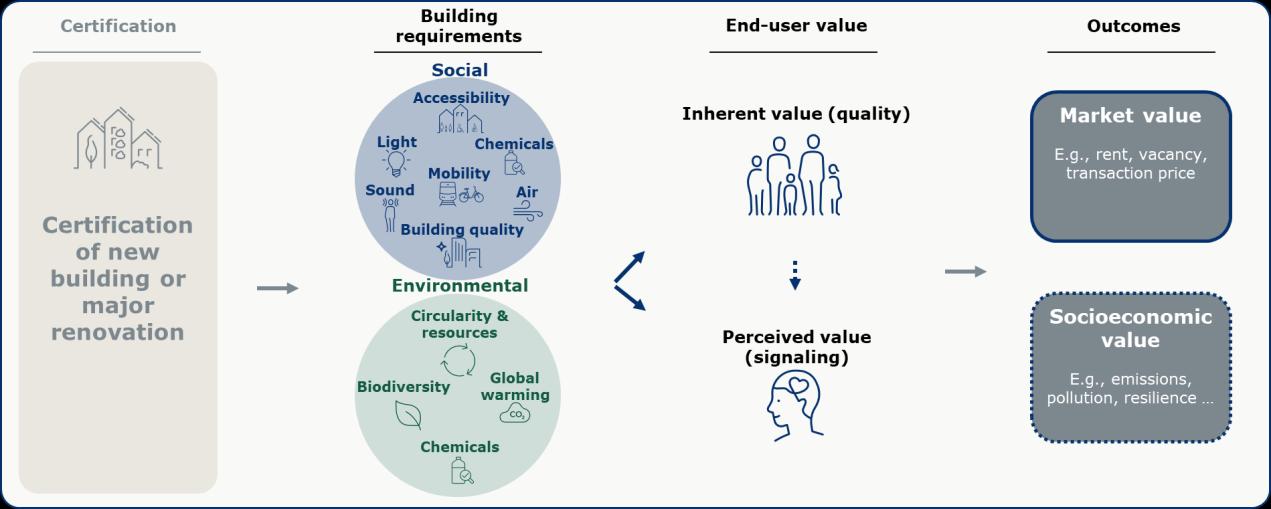
Figure 1: The effect of building certification on different outcomes
The certification schemes studied in this report are all voluntary schemes developed to measure and steer construction in the built environment towards more sustainable solutions. We delimit ourselves to study certification schemes for new construction or major renovations1. The building types in scope range from residential to commercial and institution buildings, with primary focus on residential and office buildings. In Denmark, the most prominent certification providers include DGNB, the Nordic Swan Ecolabel, BREEAM and to a lesser extent LEED, as shown in chapter 2. These schemes are operated independently, and as
1 Within this category, certification of new buildings is by far the most prevalent. “In-use” or “Operations” certification schemes for existing buildings are increasingly being used in the construction sector in addition to the certification of new construction. Such certification schemes types are excluded to delimit complexity in the analysis, and the causal pathway and drivers of effects for such schemes could differ from the ones in this report.
a result, their frameworks, focus areas, and assessment criteria differ. The heterogeneity in the schemes and their respective prevalence in Denmark is expanded in Chapter 2.
Despite the certification schemes’ differences, they all require that buildings meet a defined set of standards and document adherence to them. Crucially, many of these standards go beyond what is legally mandated by national building codes. In other words, certified buildings must fulfill additional criteria that are often more demanding or comprehensive than basic compliance with regulations. While the emphasis on different dimensions varies by scheme, they all incorporate requirements related to environmental and social quality of the building to some extent. Within the framework in figure 1, certification schemes thus act as a driver of additional building quality. It introduces additional standards that influence how buildings are planned, designed, constructed, and operated. This is the foundation for the causal pathway through which certification can affect outcomes related to the building – a mechanism we expand in chapters 4-5 The basic proposition is that certification directly leads to elevated standards, which in turn affect various outcomes.
In addition to the direct “quality” effects, certification can also influence some of the outcomes indirectly through its signaling value. Certification acts as a visible and credible marker of quality, sustainability, or technical robustness. This matters in a market where many aspects of a building’s performance are difficult for tenants, investors, or policymakers to observe directly. In this sense, certification can reduce information asymmetry and serve as a proxy for unobserved attributes, resembling what economists refer to as "sheepskin effects": the idea that holding a credential sends a signal about unobserved characteristics such as quality, reliability, or long-term value that go beyond the content of the credential itself. In practice, observed effects for especially the economic value of certification are likely a combination of inherent quality improvements and signaling Disentangling these two empirically is challenging, and the effect estimates in this report should therefore be interpreted as composite effects rather than purely causal quality differences. Importantly, signaling does not arise in a vacuum: credible signals only carry market value when stakeholders believe they reflect real underlying quality. Certification therefore creates value both by improving actual building performance and by making that performance visible and verifiable.
The rightmost boxes in Figure 1 present the primary outcomes examined in this report. Our main focus is the economic value of certification to owners and investors - most notably the rent premiums and property value effects analysed in Chapter 3. These observed market outcomes represent the collective value of all underlying building requirements - environmental as well as social - as they are capitalised into investor and owner returns – through the quality and signalling pathway Chapters 4 and 5 then step back from these economic outcomes to explore why such value emerges. Here, we examine how certification goes beyond ordinary building regulations, and how these additional requirements may translate into the market premiums documented in Chapter 3.
Generally, the potential to quantify the effects of certification varies considerably across different outcome domains. Identifying true causal effects requires suitable comparison groups, consistent outcome measures, and accessible data - conditions that are not equally fulfilled across all areas We come the closest to identifying such causal effects in the economic analyses in Chapter 3, whereas the social and environmental analysis relies on the best available descriptive data rather than formal causal inference The concluding chapter outlines the data and methodological developments that would enable more robust identification of certification’s total value creation - particularly for the outcomes that are currently the most challenging to evaluate.
Insights from the literature – the effect of certification
A growing body of research in the international literature has examined the impacts of building certification on economic, environmental and social outcomes Such studies either directly evaluate the effects of certification – or indirectly assess the effects of the attributes associated with certification. However, current knowledge remains fragmented and uneven in scope and quality.
Economic outcomes are by far the most extensively studied in the certification literature. Multiple studies consistently demonstrate a positive rent and sales price effect of certification, though the magnitude of these effects varies depending on certification type, score, geographic location, time, and building characteristics. There is also some indication that vacancy rates may be lower for certified buildings, although findings are less consistent. When it comes to construction costs, there is general agreement that construction with a focus on sustainability tends to increase upfront costs. However, these conclusions are based on a smaller body of evidence and vary depending on how and when sustainability initiatives are integrated into the building process.
In terms of environmental outcomes, the most studied aspect is energy consumption. There is a broad consensus that certified buildings tend to reduce energy use. However, these savings often fall short of theoretical expectations, as efficiency gains are sometimes offset by increases in comfort levels, such as greater use of heating or cooling. Other environmental outcomes, such as life-cycle emissions, are much less well studied. In particular, there is a lack of studies that compare emissions from certified buildings with those from non-certified counterparts using rigorous life-cycle assessments (LCA).
The literature on the effect of certification on social outcomes is perhaps even less well understood. Some studies have directly or indirectly indicated that certification can lead to improvements in health, well-being, and productivity - typically linked to better indoor environments and workplace satisfaction. However, outcomes such as equity, aesthetic value, and accessibility are rarely addressed in the existing empirical literature
1.1 Reading guide
Chapter 2 provides an initial description of the differences inherent in the different certification schemes in Denmark, along with a descriptive overview of the usage of certification for new build construction. Finally, we provide a brief literature review, covering Danish and international literature with regards to the effect of certification on a range of outcomes
Chapter 3 studies economic effects of certification from multiple angles in Denmark, including potential rental premiums and asset returns. In the chapter, we apply econometric modelling to find the association between certification and rent levels and rent development over time. We also provide a discussion of potential drivers of such effects.
Chapter 4 focuses on the environmental effect of certification, particularly CO2e emissions and biodiversity. While current data availability does not allow the isolation of certification’s effect on these parameters directly, we provide insights into certifications role in advancing methods and documentation within these parameters and use LCA data from DGNB certified projects to provide descriptive details of development over time. We also point towards future possible analyses and data needs, to isolate the effect of certification more rigorously.
Chapter 5 provides a set of descriptive analyses of certification’s role in advancing socially desirable outcomes in the built environment. While data is not currently available for isolation of the direct effect of certification on social value, we investigate the additionality of certification schemes on social dimensions as opposed to following the minimum requirements of building regulations. We then provide scenario analyses of the social effects of following certification scheme’s requirements on a range of socially desirable outcomes.
Chapter 6 revolves around recommendations to further evaluate and understand the effect of certification. Based on experiences from this project, we provide suggestions for additional data and studies required to fulfill stakeholder knowledge demand for understanding the effect of certification more completely.
2. Certification schemes in the Danish built environment
2.1 The basics of certification schemes in Denmark
As outlined in chapter 1, certification schemes are playing an increasingly important role in the Danish construction sector. To get a better understanding of certification schemes and their prevalence, this section provides an initial descriptive overview of the certification schemes most relevant and widely used in Denmark.
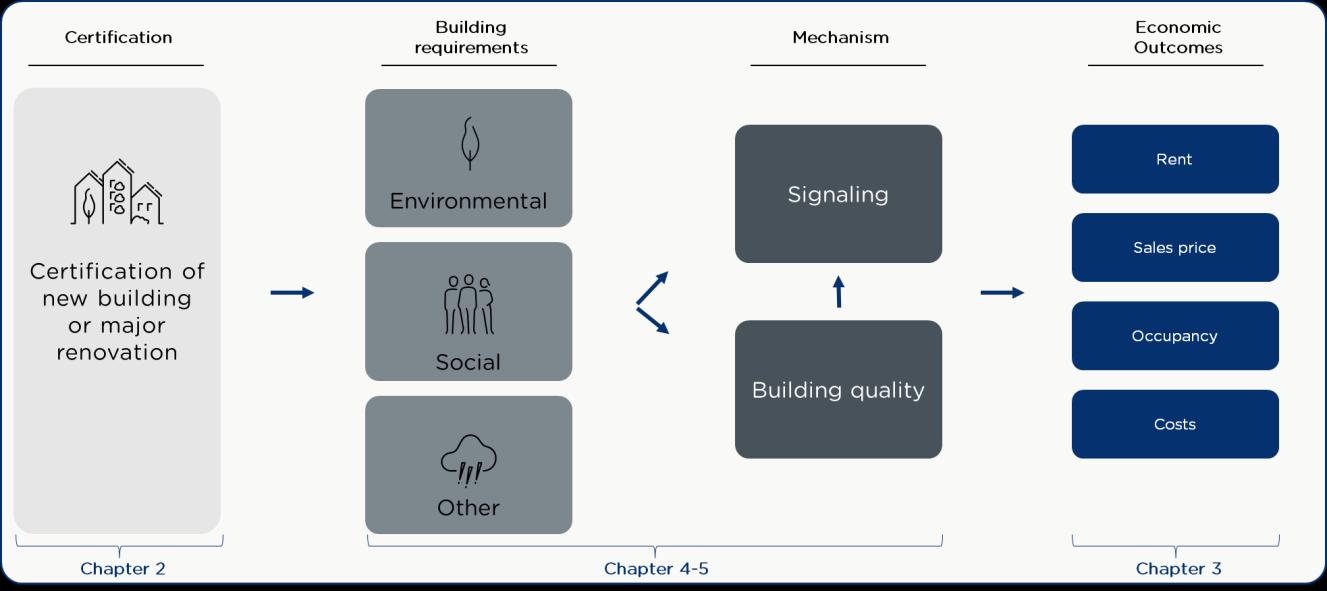
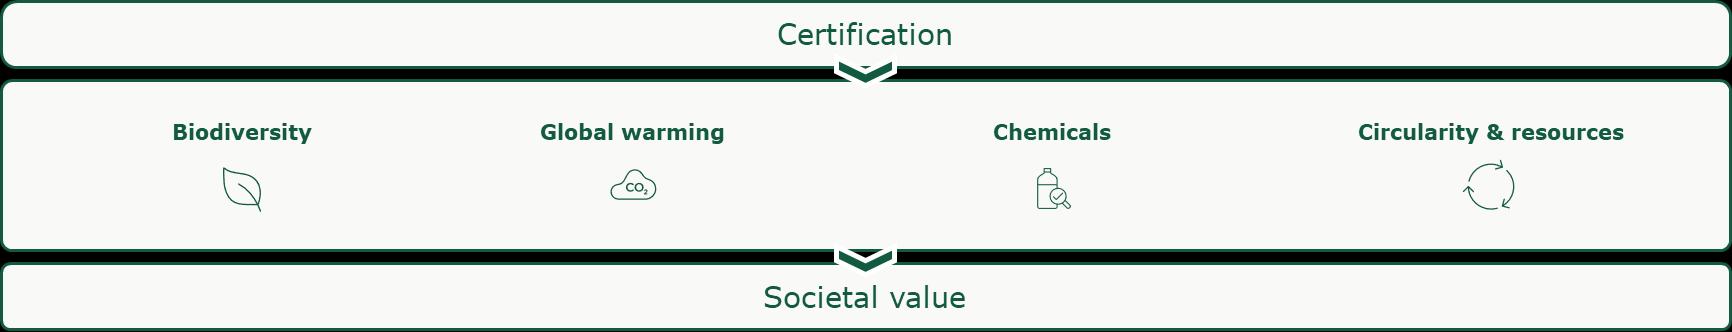
In Denmark, the building Regulations (Bygningsreglementet, BR) sets out the minimum requirements for buildings. Compliance with these regulations is therefore a fundamental requirement for any construction project, although documentation of compliance is not always necessary. However, as expectations for sustainability, quality, and accountability continue to rise, voluntary certification schemes have taken on a growing role in the construction sector – both in advancing requirements and documenting compliance. When building owners choose to certify a project, they commit to meeting additional standards that go beyond what the building Regulations require – and in many cases also to document compliance with regulations, that is not otherwise formally checked. While the schemes vary in focus and scope, they typically introduce supplementary requirements that cover the economic, environmental, and social aspects of a building’s design, construction, and operation. Four certification schemes are especially relevant in Denmark. This includes DGNB, Nordic Swan Ecolabel, BREEAM and to a lesser extent LEED. To obtain certification from these providers, building owners are required to document adherence to the requirements of the certification scheme as stipulated in comprehensive manuals outlining technical requirements. Figure 2.1 exemplifies some such requirements for the DGNB scheme, to give an idea of the contents of certification
Figure 2.1: Example building requirements in DGNB 2025 manual
Source: DGNB manual (2025)
As is evident from the detailed examples of requirements, these are all technical in nature. Figure 2.1 illustrates only a very limited set of requirements, and similar technical requirements are present for all categories and sub-categories illustrated in the figure (see also chapters 4-5). The requirements thus compare building performance based on threshold limits, reference values etc. for very specific materials, technical installations, chemicals etc. Similar detailed examples could be made for other certification schemes, e.g. Nordic Swan Ecolabel and BREEAM. The figure illustrates that certification is not “just” a
rubber stamp, but rather a technical endeavor requiring specialized knowledge, building choices and documentation.
The analysis in this report centers on new-build (or major renovation) projects, which are by far the most frequently certified project types in Denmark and therefore the most suitable foundation for quantitative assessment. Certification schemes for renovation and operational phases are becoming increasingly important, and these may represent valuable areas for future study
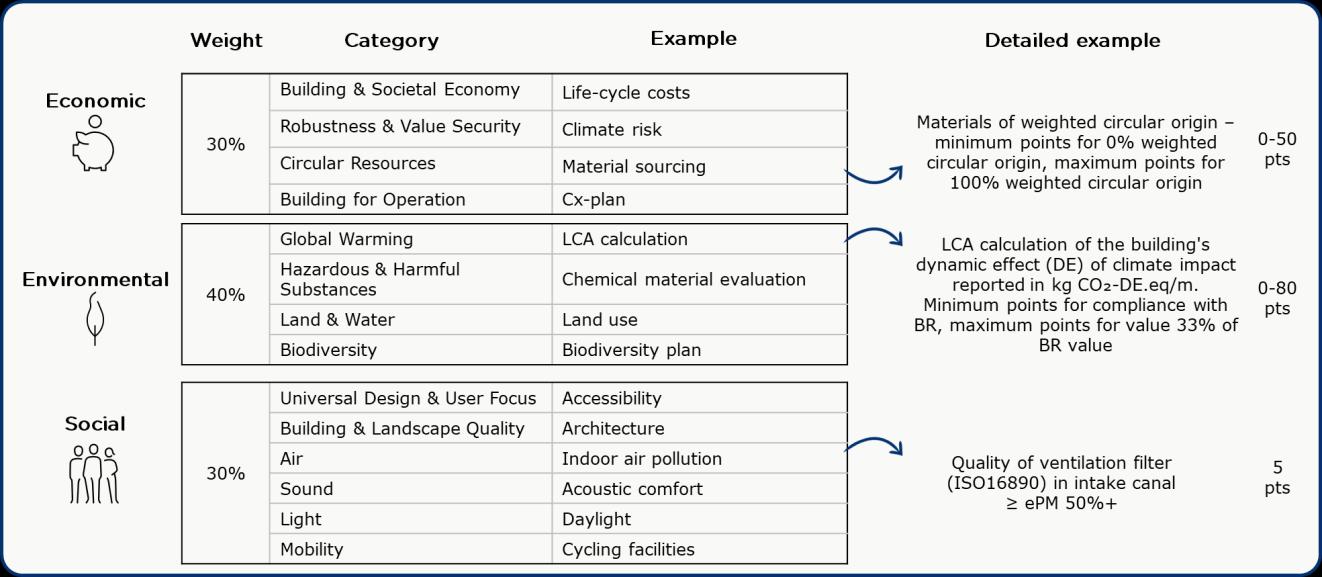
It is important to note that specific requirements differ across certification scheme, building type (e.g. residential or office buildings), and the version of the scheme applied. Additionally, for all but the Nordic Swan Ecolabel, buildings are ranked based on the degree of adherence to specific requirements, where stricter adherence gives access to differentiated certification distinctions. For each criterion in the certification manuals, points are awarded based on criteria fulfilment. For DGNB and BREEAM, certification is awarded based on a total assessment of the score on all such criteria2, where extra total points above certain thresholds can result in added distinctions (e.g. “gold” for DGNB or “very good” for BREEAM). The Nordic Swan Ecolabel is binary in nature – and requires a minimum of points and fulfillment of all mandatory requirements to receive certification without any added distinctions. This complexity underlines the fact that building certification is not one fixed, and isolated concept, but rather a heterogenous combination of different factors. In the figure below, we have summarized key differences between certification schemes.3
Table 1.2: Complexity in certification landscape in Denmark. New-build or major renovation.
Source: Own construction based on DGNB, Nordic Swan Ecolabel and BREEAM
2.2 The use of certification in Denmark
With the basic properties of certification schemes covered, we now turn to the extent to which certification schemes are used in Denmark. Based on floor area, residential buildings are the primary building type in Denmark covering approximately 60% of the total floor area (Statistics Denmark, BYGB34) The
2 They also include some base requirements, that must be fulfilled but are not point-giving.
3 LEED is not included, since its use in Danish buildings is generally limited. The general composition of LEED is similar to DGNB and BREEAM, although exact contents differ.
4
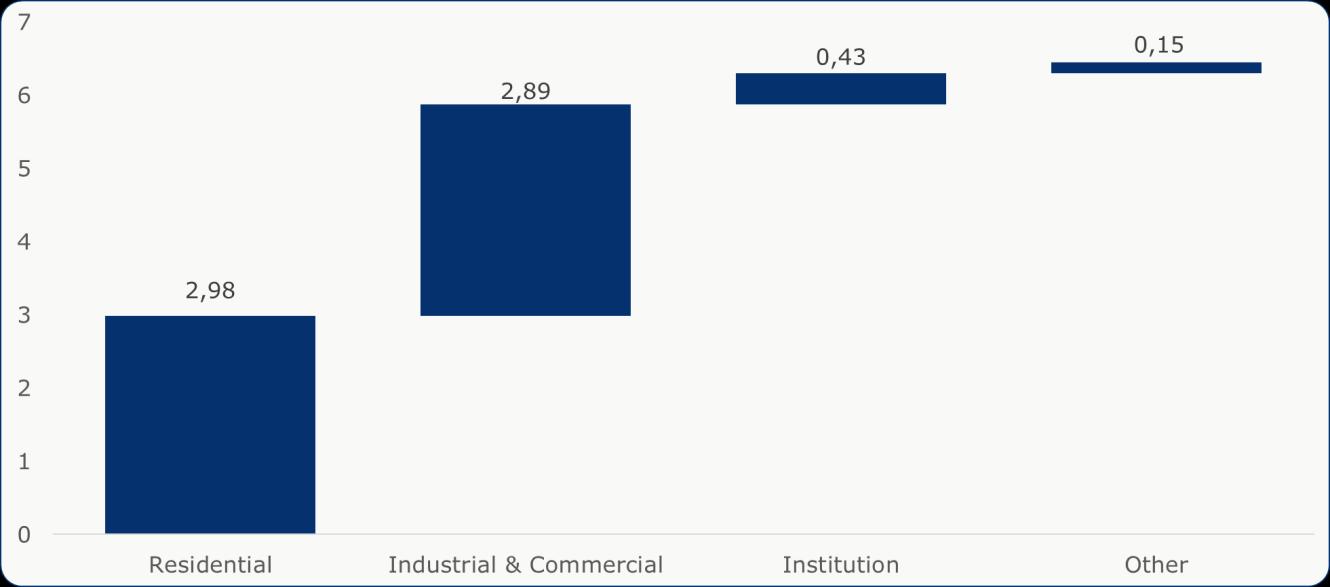
prominence of residential buildings is also reflected in all newly constructed floor area Figure 2.3 provides an overview of the total floor area built in 2024, classified into four broad categories.
Figure 2.3: Constructed floor area finished by building type. Million m2 . 2024.
Source: Statistics Denmark BYGB34. Note: Own classification based on 29 building uses. ‘Residential’ includes e.g., detached houses and apartments, industrial & commercial includes e.g. office and warehouses, and ‘institution’ includes e.g. daycare and hospital ‘Other’ include garages, carports and outhouses.
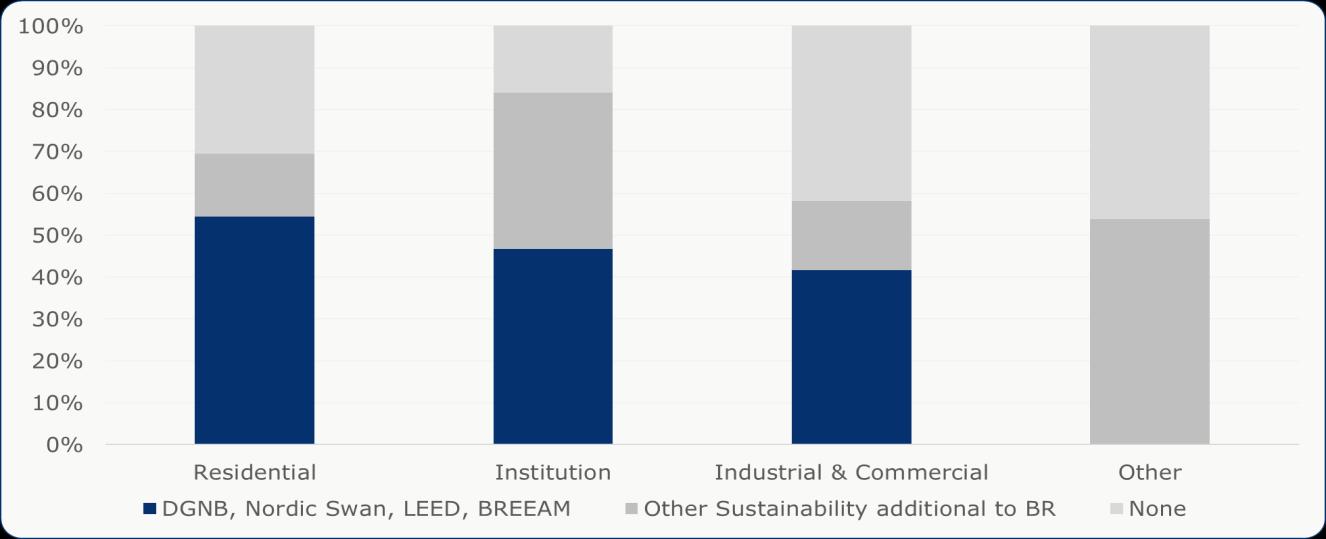
Statistics Denmark does not track the use of certification across the constructed building mass However, commercial data platforms gather project information across a large range of actors in the professional building market (residential and non-residential) While such platforms do not cover the full range of buildings constructed in Denmark, they offer insights into a sizeable part of the market. Figure 2.4 shows the prevalence of different certification types for all projects completed in 2024 listed in such a commercial database The database covers projects corresponding to roughly 55% of the total newly constructed floor area registered by Statistics Denmark (Figure 2.3) and should therefore be interpreted as a substantial but not complete view of the market4
and
Figure 2.4: Certified floor area by building type. Percent. Finished in 2024.
Source: Byggefakta. Note: Own classification of building types based on project description. Other sustainability additional to BR includes but is not limited to non-commercial sustainability measures such as ”Bygningsreglementets Bygningsklasse 2020” , “Den frivillige bæredygtighedsklasse” and “Bygningsreglementets frivillige Lavenergiklasse”. Buildings registered with both a commercial certification and other sustainability additional to BR are included in the commercial (DGNB etc. category).
Figure 2.4 shows that more than half (54%) of new registered residential floor area in the database were registered with one or more of the commercial certification schemes (DGNB, Nordic Swan Ecolabel, LEED and/or BREEAM). For institution buildings such as daycare institutions, retirement homes and schools, this figure is 47%, while for industrial and commercial buildings such as company domiciles, offices or logistic centers, the figure is 42%. A non-negligible part of buildings also complies with sustainability measures that are additional to the building code (BR), while these are mostly less comprehensive in nature.
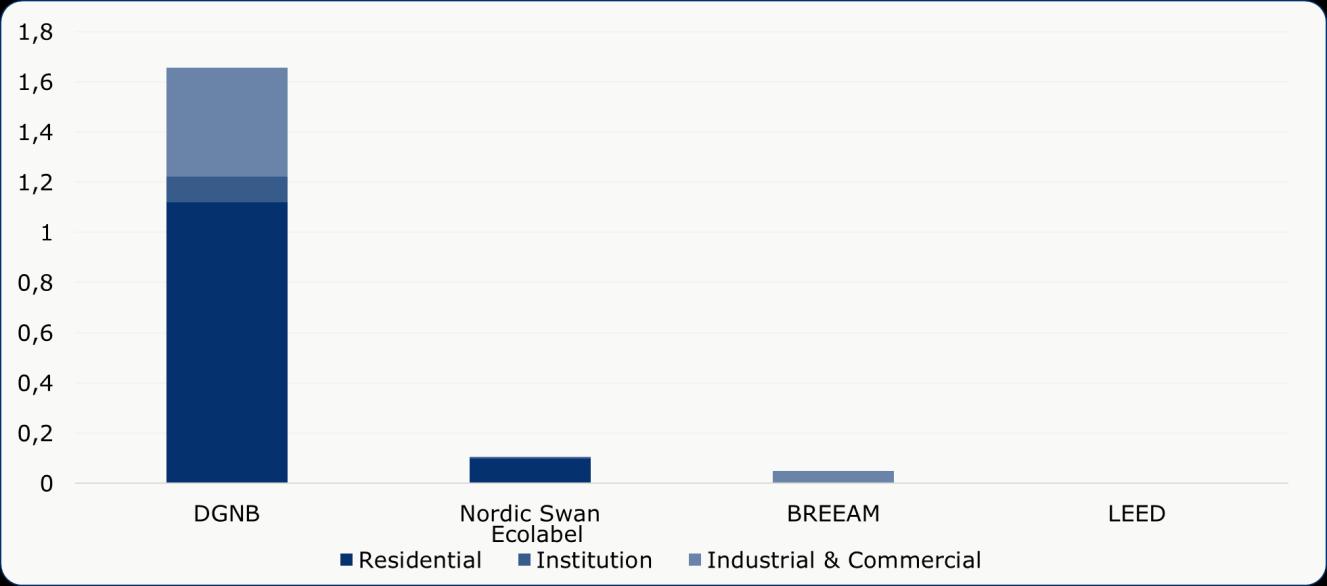
When zooming in on the specific commercial certification schemes, it becomes evident that the DGNB certification by far is the most used certification scheme in Denmark. Figure 2.5 shows the total floor area finished in 2024 that has obtained a given certification based on the database above. It should be noted that some buildings have obtained multiple certifications. Such buildings are thus counted twice in the figure.
Figure 2.5: Commercially certified floor area by certification provider and building type finished in 2024. Million m2 .
Source: Byggefakta. Note: Certification across all building types. Buildings with multiple certifications counted included in each relevant certification scheme.
The figure shows that almost 1,66 million completed m2 were DGNB certified in 2024 Of this, the majority was certification of residential buildings at approximately 1,1 million m2 . The relatively large coverage by DGNB across the certification market especially owes to the fact the DGNB offers certifications across all 3 major building types (residential, commercial & industrial and institutions) and has significant market penetration in each of these building types. The Nordic Swan Ecolabel was the second most used certification scheme in 2024, covering 0,1 million m2 - and particularly in residential buildings, and to smaller extent industry and institutions. BREEAM and LEED, cover a smaller share of total buildings constructed in 2024. BREEAM certification was obtained for industrial buildings, whereas no LEED certification is observed for new builds in 2024.
In summary, Denmark's construction sector is increasingly integrating certification schemes to meet rising standards of sustainability, quality, and accountability. The landscape of building certifications is diverse, encompassing various schemes, certification versions and distinctions covering different building types. Residential buildings represented the largest segment of newly constructed floor area in Denmark in 2024, followed by industrial & commercial and institutional buildings. A substantial portion of these buildingsparticularly residential buildings - achieved certification. Among the available certification schemes, DGNB is by far the most prevalent, especially certifying residential buildings. The Nordic Swan Ecolabel follows, with the strongest presence also in residential buildings. BREEAM and LEED represent a smaller portion of the certified building mass, at least in 2024
3. The economic case for certification schemes
For building owners, investors and developers, a central question is whether certification generates economic value. Certification requires both time and financial resources, ranging from direct certification and consultancy fees to potential indirect costs such as alternative material choices or additional documentation. For certification to represent a viable business case, these costs must be offset by measurable economic benefits. Some such tangible economic benefits could be observed in differential rental levels, vacancy or transaction prices for certified buildings – indicators we assess in this chapter Certification may also generate non-monetary advantages, for example a reduced carbon footprint, healthier materials, more efficient processes or branding value (see also chapters 4-5). Most investors will, however, typically seek evidence of a direct financial effect. The first objective of this chapter is, therefore, to examine whether certified buildings exhibit observable monetary benefits, focusing particularly on rental outcomes. Transaction premiums are addressed in section 3.3, where data constraints on certified buildings with recorded transactions currently limit robust quantification
Box 3.1 Summary
• Rental levels: Certified rental units in Denmark are associated with a clear asking rent premium: ~8% for residentialand~16%fornon-residentialassetsversusnon-certifiedpeers,primarilyobservedinlargercities. Driversofthepremiumislikelyamixinherentqualityandsignalingandunobservedadvantages(e.g.,superior fit-outs, stronger owners,premium micro-locations). Still, the results provide the best current estimate with availableDanishdata.
• Transaction prices: Plausiblepathwaystotransactionpremiaincludehigheroperatingincomedrivenbye.g., tenant demand, lower costs and regulatory/operational resilience, and preferential financing/investor appetite. However, data constraints on certified buildings with recorded transactions currently limit robust quantificationinDenmark.Still,weshowalargeinvestorfocusoncertificationinbuildingportfolios.
3.1 Econometric analysis – rental levels
One of the most well-researched aspects of the effects of certification is on potential rental premiums on certified buildings. This very direct economic outcome is of large interest to owners and investors, since the possible rental price of a building is one of the main drivers of the returns on the asset. We investigate these aspects on Danish rental data from EjendomDanmark’s market database using an econometric model inspired by Holtermans & Kok (2019)5. The data and econometric model are presented in the box below. In essence, our model seeks to isolate the effect of certification on rent and vacancy levels by comparing similar rental units on a long range of variables with and without certification. By holding a range of factors “constant”, we ensure that it is not differences in these variables between certified and non-certified buildings that drive a difference in the outcomes. More concretely, the model keeps the following factors constant:
• Building traits: Total building size, typology and age, ensuring that rental units are nested within comparable buildings, e.g., so units in older and newer buildings are not mixed
• Building location: We compare units within the same parish (“sogn”), the smallest administrative unit in Denmark, ensuring that certified and non-certified buildings are compared within the same local neighbourhood
• Unit traits: Unit size, number of rooms, bathrooms and terraces so we do not compare fundamentally different units Hence, for similar rental units on these dimensions, we isolate whether certification is associated with rent levels and vacancy. It should be noted that certification can be associated with factors that are not
5 Holtermans, Roger & Kok, Niels. On the Value of Environmental Certification in the Commercial Real Estate Market (2019) - Real Estate Economics
necessarily a result of certification itself – e.g., premium micro-locations within a parish or superior fit outs not mandated by certification. In the case of such “selection” effects, the effect that we estimate will also include the effect of these factors.
We use rental data in Q3 2025 of approximately 200.000 rental units provided by EjendomDanmark. It is important to note that our sample of certified buildings is rather limited - 173 buildings with certification - covering approximately 8.000 rental units. While 8.000 “treated” units traditionally would result in very high statistical certainty, the fact that these units are nested within only a limited number of buildings limits statistical certainty, since the effect for each unit in a building is likely similar. The results would thus benefit from a larger dataset, which is not available at the time of writing.
BOX 3.2: Data and methods for rental premium analysis
Rental prices are generally not recorded centrally in Denmark. To estimate the effect of certification on rental price, we have obtained data on ~200.000 unique rental units from a market database operated and maintained by EjendomDanmark, which offers the most complete rental dataset accessible in Denmark. The database contains data on the rental price and vacancy status per rental unit (address), alongside background information like size, building typology (residential, office etc.) and building year. We only include buildings where the rental price is market driven, excluding buildings with e.g., cost based rental price setting, that risk capping the potential rental price of a building. The database is based on voluntary reporting from building administrators using quarterly system-to-system reporting aggregated and cleaned by EjendomDenmark.
To identify certified buildings in the database, we collected data on certification status for all certified buildings in Denmark from BREEAM, LEED, DGNB and Nordic Swan Ecolabel. Building BFE-number was inferred from the addresses of the buildings using Datafordeler.dk. Some addresses could not be identified based on the information from certification providers, and the dataset is therefore not a complete list of all certified buildings. The vast majority of observations are, however, successfully classified. For some buildings, one BFE-number covers multiple buildings and addresses – and in some cases only some of these addresses are certified. To alleviate treatment contamination, such addresses were manually excluded. Since exclusion is manual, we risk that some buildings were mistakenly classified as certified. In case a non-certified address is identified as certified, there is a risk that potential rental premiums will be biased downwards, since also non-certified buildings would be erroneously marked as certified. This should be kept in mind in the interpretation of the results.
Our final dataset of certified buildings with observed rental data consists of ~8.000 units nested in 173 buildings (BFE-numbers) across Denmark. Most units are in residential, multistory buildings (137). We estimate several models for the effect of certification on asking rent, vacancy and effective rent, that alle aim to take account of unobserved heterogeneity. This includes fixed effects on the parish level, the smallest administrative unit in Denmark, that partition the country into 2.158 smaller geographical areas – with the smallest geographical extent of each parish within larger cities. We also include sets of controls for building and rental-unit variables, to control for many variables directly influencing outcomes. We estimate a set of different on the general form:
• ���� represents a geographical cluster (parish/sogn)
• ���� represents a set of building background variables (total floor area, building age and age squared)
• ���� represents a set of rental unit variables (baths, rooms, unit type, floor- and terrace floor area).
�� represents the variable of interest, namely the effect of certification. This parameter does not distinguish between “quality” or “signaling” effects of certification but instead pools the two into one effect. The outcome is specified in different ways, including net asking rent, vacancy status and effective rent (vacancy status × asking rent). Standard errors are clustered at the BFE-level, to take account of correlation in errors within same-owner buildings with multiple addresses. The model is run separately for residential- and non-residential buildings.
The regression framework enables us to control for observable building characteristics. However, certification is unlikely to be randomly assigned, which introduces the potential for selection bias affecting both rental levels and certification status. As discussed earlier, part of the certification effect may operate through improvements in building quality. This channel is not a source of bias but rather the mechanism we seek to measure. The concern arises when certified buildings systematically differ from non-certified ones in ways unrelated to the certification itself. Selection bias occurs if certification is correlated with unobserved attributes that independently influence rent levels - such as inherently superior fit-outs, more capable owners, or premium micro-locations. In such cases, the observed rental premium may reflect these pre-existing advantages rather than the causal impact of certification Such selection should be kept in mind when interpreting the results.
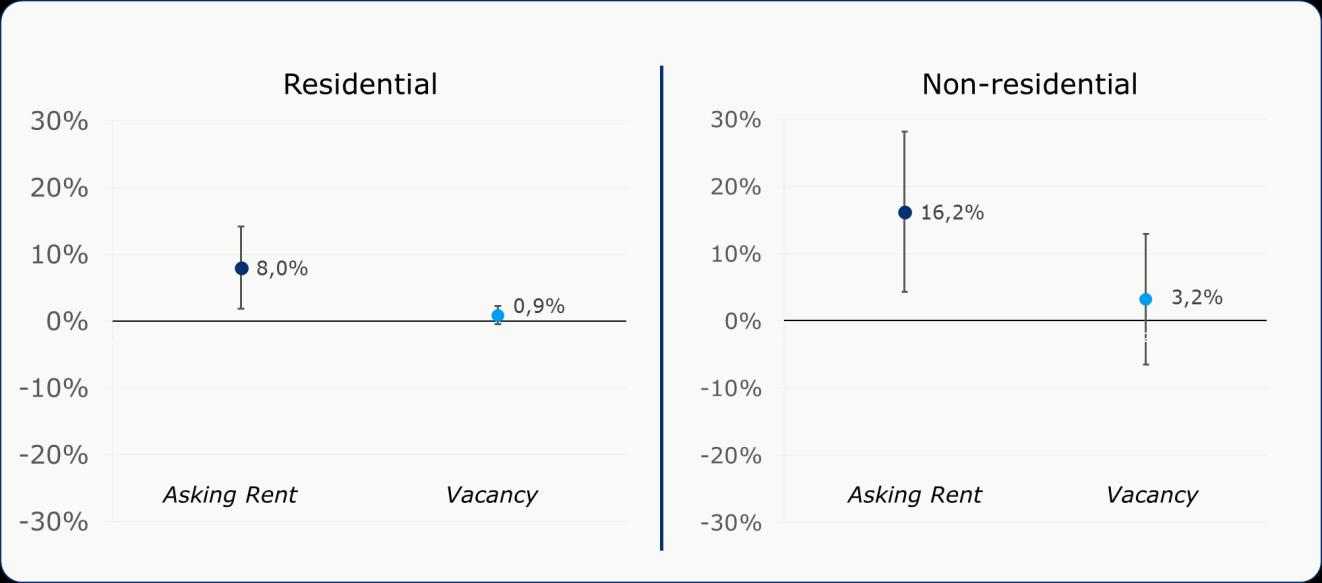
The results of the rental analysis are presented in figure 3.1 below, with detailed results presented in appendix 1. In our preferred model specification for residential buildings6 , certification entails an 8% asking rent premium, which is statistically significant at a 1% significance level. In other words, the results suggest that certified residential buildings are associated with an 8% rental premium. It is important to note that our sample of certified buildings primarily consists of large multistorey apartment buildings with DGNB certification in the capital region (Greater Copenhagen area) or Aarhus, Odense and Aalborg (see also appendix A3). This also means that we cannot necessarily generalize our results outside of this setting.
Looking at vacancy, the estimated coefficient for residential buildings is insignificant at all common significance levels. This means that we cannot statistically reject that vacancy rates are equivalent for certified and non-certified units. In other words, the result suggests similar vacancy levels for certified and non-certified rental units. While we do estimate a positive coefficient of 0,9%, indicating larger vacancy for certified buildings, this effect is too small and uncertain to conclude that differences exist. Vacancy levels are, in general, rather low in the sample, and even a 0,9% difference would be equivalent to a low difference in levels (pct. pts). In the appendix, we also estimate the model using effective rent as the outcome7 . The effective rent is a measure that models the actual cash flow for owners, as opposed to the rent they ask in the market, by taking potential vacancy into account. Unfortunately, our vacancy indicator is rather crude, classifying a rental unit as vacant for the full quarter if the unit is vacant on the first day of the quarter. This creates some noise in the measurement. Estimates in this specification show a positive coefficient not significantly different from zero. In total, the results suggest that there is an association between certification and rent levels. Certified residential buildings demand an 8% higher rent, in our sample of Danish buildings in Q3 2025. Vacancy levels are not significantly different from each other. The results thus also indicate a higher effective rent in certified buildings, although significantly noisier due to data limitations8 .
Figure 3.1: Estimated effect of certification on asking rent and vacancy by building type.
Note: Own calculation based on data from EjendomDanmark, BBR and certification providers. Standard errors clustered at BFE-level (building). Coefficient calculated as 1-exp(��) 95% confidence band around estimate. N certified (buildings) for residential is 137 (1.177 non-certified) and for non-residential 36 (5.525 non-certified). See also appendix for full regression output.
6 This model includes all controls explained in box 3.2
7 Effective rent is calculated as the asking rent adjusted for vacancy. Vacancy is recorded only once per quarter, meaning we know whether a building was vacant on the first day of each quarter. To measure vacancy over a full year, we take the share of quarters during which a unit was vacant between Q4 2024 and Q3 2025. This approach provides an approximate measure of vacancy, as a unit is considered vacant for an entire quarter even if it was only vacant at the start of that quarter.
8 Although we exclude buildings undergoing renovation or sale, and control for building age, our vacancy indicator is sensitive to timing. If certified buildings have a systematic difference in e.g., their active time on the market, this could affect the vacancy indicator disproportionally and mask the more stable vacancy pattern of buildings that are more established on the market.
Figure 3.1 also shows estimated coefficients from our sample of non-residential buildings, e.g., offices, commercial or industrial buildings. Our sample of certified buildings in this group is small, with 37 identified buildings with a certification, primarily office buildings (~80%) in Copenhagen and Aarhus (~90%). The limited sample size complicates finding significant effects, especially for each non-residential typology separately (e.g. office, commercial etc.)9 With this in mind, our estimated coefficient for asking rent is estimated at 16%, which is significantly different from zero at a 5% level. It thus suggests that certified non-residential buildings have a 16% higher asking rent compared to non-certified buildings, approximately double that found for residential buildings. The vacancy coefficient is again not significantly different from zero, indicating similar vacancy levels for certified and non-certified buildings. It should be noted that the effects we find primarily are driven by office buildings in major Danish cities, which do not necessarily hold equally for other non-residential buildings or geographies (see also appendix A5).
In summary, the analysis shows a clear association between certification and rent for certified buildings in Denmark Certified residential units achieve rents that are approximately 8 percent higher, while certified non-residential units achieve rents about 16 percent higher than comparable non-certified buildings. These findings align with international research The estimates should be interpreted as the combined effect of underlying quality improvements and signaling, since the two mechanisms cannot be separated empirically.
The results primarily reflect certified units in Denmark’s larger cities, which might not hold equally for other geographies10 Also, as with all statistical models, not all relevant characteristics can be observed and controlled for. Thus, it cannot be ruled out that part of the estimated premium is related to unobserved attributes, such as superior fit outs, particularly competent owners or premium micro-locations that are not a direct consequence of certification. As an example, while we do compare buildings with and without certification within small geographical areas, we cannot rule out that owners choose to certify buildings on the most premium locations within a neighbourhood, driving part of the observed effect. This creates an inherent risk that some unmeasured factors influence the estimates. Within these constraints, and given the current Danish data landscape, our model offers the most robust estimate available of certification’s rental effects.
3.2 Econometric analysis – rental development
Section 3.1 indicated a positive level difference in rental prices for certified and non-certified buildings However, an important question for investors is also the returns of the assets over time. In this section, we use our rental dataset to investigate how building certification affects the economic performance of buildings over time – e.g. the relative rental development compared to non-certified buildings. Such changes could occur due to e.g. changing tenant demand, leading to potential stranding of assets (see also box 3.3) or increased demand for buildings with more sustainable profiles.
9 We include a control for unit typology in the regression, e.g. office or commercial, but do not estimate interaction effects between certification and typology due to the limited number of certified, non-office units. The estimated effect is thus the average effect of certification across typologies, with the average effect primarly driven by office units.
10 Isolating the effect outside of the larger Danish cities are hindered by 1) a smaller mass of certified buildings outside large cities, and 2) lower rental data coverage outside the larger Danish cities
Box 3.3: The theoretical concept of stranded assets in the construction sector
Stranded assets in the real estate sector can arise through different pathways, commonly classified into regulatory, economic,andmarketstranding. Market stranding happenswhenchangingtenantdemands,investorexpectations,or societal norms reduce the desirability or competitiveness of a property, even if it remains legally compliant and operationallyfunctional. Economic stranding referstosituationswherethecostofnecessaryupgradesorrenovations outweighsthepotentialfinancialreturn,renderingtheasseteconomicallyunviable. Regulatory stranding occurswhen assetsnolongercomplywithupdatedlaws,buildingcodes,orenergyperformancestandards,makingthemlegallynonconformant–mostlyrelevantinthecaseofmajorrenovations,wherenewbuildingcodescanhavebeenintroduced. Each oftheseformsofstrandingrepresentsadistinctriskthatcansignificantlyaffectassetvalueandlong-terminvestment performance.
To investigate whether rental levels for certified and non-certified buildings develop differently over time, for example due to changes in tenant demand, we use data from buildings where we observe the rent in at least two years between 2019-2025. The data again comes from EjendomDanmark’s market database.
We apply a statistical approach, expanded in box 3.4 below, that allows us to construct a rental index for buildings with repeated observations, while accounting for the fact that some buildings enter or leave the database over time. In simple terms, this enables us to track how rents develop over time for the same buildings We then compare the trend for certified and non-certified buildings, respectively. A major advantage of the applied method is that we control for all variables that are constant for each building over time. By design, we thus keep all observable characteristics of a building, e.g. size, type or location fixed, while also keeping unobserved variables fixed, that do not change over time. Figure 3.2 presents the results.
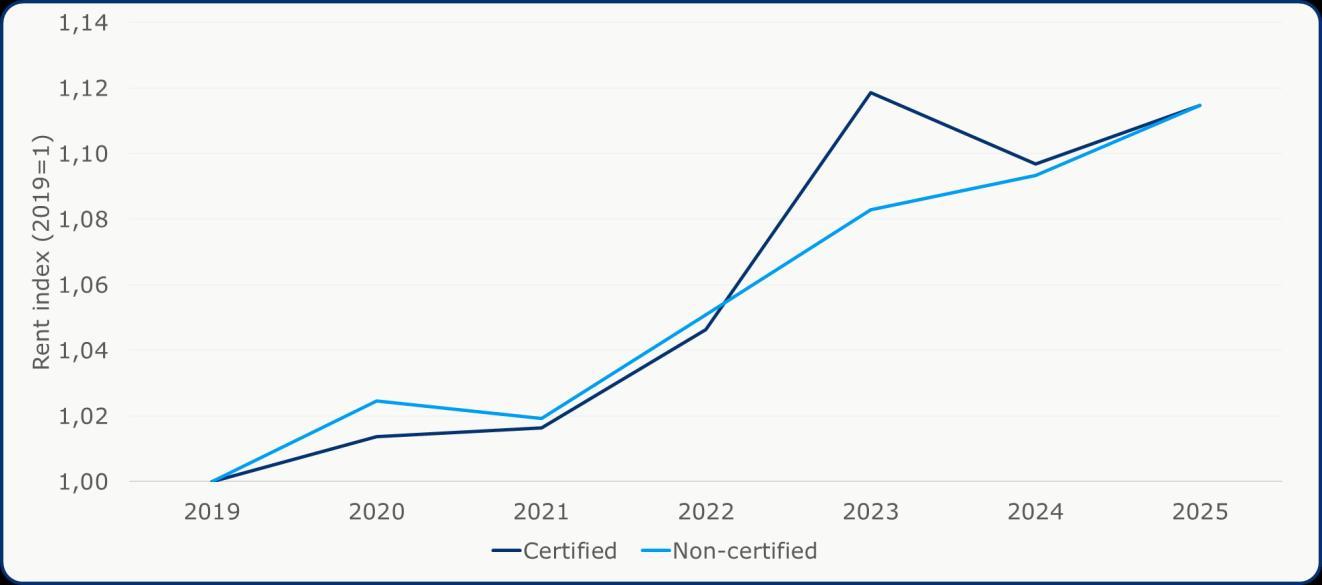
Figure 3.2: Development in rent levels for certified and non-certified buildings over time. Index.
Note: Own calculation based on data from EjendomDanmark, BBR and certification providers. Standard errors (not shown) are clustered at the BFE-level and overlapping in all periods for all relevant confidence levels. See box 3.4 for model specification. The analysis pools residential- and non-residential buildings, while developments are largely similar for the two segments respectively N=43.066 rental units with an observation for at least 2 periods.
Figure 3.2 shows a largely similar development in rent for certified and non-certified buildings on average over time Over the studied period, both see an approximate yearly rent increase of 2% on average. Some minor deviations exist from this average over the years, with a slower average growth from 2019-2021, and somewhat larger from 2021-2024. The sharp increase for certified buildings from 2022-2023 could be due to additional, new certified buildings in relatively high-growth areas entering the dataset, while the subsequent decline from 2023-2024 could suggest an anomalous behavior in 2023, not representative of the general growth11 .
In summary, where the first analysis showed clear evidence of higher rental levels for certified buildings, we do not observe differences in rental growth between certified and non-certified buildings in the period 2019 to 2025. This suggests that the rental premium associated with certification has been stable over time rather than driven by shifting tenant demand in recent years. As before, this conclusion is primarily based on a sample of certified residential buildings, and the findings should be interpreted in that context. It does not rule out that changes in tenant preferences could emerge in the future as the market and regulatory landscape continues to evolve, leading to diverging rental development for certified and noncertified buildings in line with theoretical expectations of stranded assets
11 Differential growth rates could occur for subsections of the rental market, e.g. if some areas, building types or attributes see non-average demand change for either certified- or non-certified buildings (or both) Such analyses are not presented in this report - especially since finding any statistically significant differences across sub-markets would be very difficult due to the relatively scarce data on certified units. This does not, however, preclude that such differences do exist.
Box 3.4: Data and methods for the analysis of rental development over time
In our second econometric analysis, we investigate how building certification affect the economic performance of buildings over time – e.g. the building returns. To study this, we apply a repeated rent regression similar to Holtermans & Kok (2019) on our sample of buildings with observable building rents from EjendomDenmark.
Specifically, we collect a dataset with the rent in our sample of buildings from the first analysis for additional third quarters from 2019-2024. We then construct the rental growth between two quarters in two different years as
=2019, ,2025, ��=1, ,6
And retain only the �������� between 2019 and 2025. �������� is the total growth in rent between of a rental unit i during periods (�� ��,��) and R is the net asking rent of the unit. This specification allows us to include the rental growth of units that do not necessarily have data for all quarters and still attribute the rental growth for observable quarters to the total between the quarters where we observe the unit. We then estimate the model:
Where the rental growth is regressed on time dummies ������ that are equal to -1 in period �� =�� ��, 1 in period �� =�� and 0 otherwise. The time dummies are interacted with an indicator ���� that is 1 for certified units and 0 for non-certified units. The model includes a unit fixed effects ���� to take account of unobserved but time-independent variables affecting the rental unit. We cluster standard errors at the BFE-level. The final rent indice is defined as ���� =exp(����), ��=2020, ,2025, ��2019 =1
The rent indices calculated tell us how the rent has evolved for certified- and non-certified buildings over time, indicating whether one or the other has the potential to yield greater returns than the other
3.3 Economic Analysis – building value
Where sections 3.1 and 3.2 showed that certified buildings achieve higher rental levels, but similar rental growth compared to non-certified buildings, we also investigated whether the differences in rents translate into differences in transaction prices If investors and owners expect rental differences to persist, or even increase over time, this should be reflected in transaction prices for certified buildings equivalent or above the observed difference in rental levels To explore whether certified buildings also demand a sales premium, we attempted an econometric comparison of certified and non-certified building transactions. However, the available sample of newly built certified buildings with an observed public transaction after certification was very limited, with fewer than 30 highly heterogenous sales ranging from single Nordic Swan Ecolabel certified row-houses to large DGNB projects worth hundreds of millions DKK. Given this small and diverse sample, it was not possible to conduct a formal statistical assessment of whether certified buildings obtain a sales premium12 . Such an analysis may become feasible once more certified transactions have been recorded.
12 For the analysis, we obtained a dataset on all registered building sales until 2024 from SVUR (Statens Salgs- og Vurderingsregister) and enriched the data with building characteristics from BBR, and certification status found using data from certification providers. We are able to identify the sales price for ~1500 buildings that were certified at some point. However, after excluding sales from before certification was obtained, only including sales through ordinary sales (“Almindeligt frit salg”) or other sales (“Salg i øvrigt”), and deleting sales prices of 0, we were left with a very limited sample of the transaction of certified buildings. If the sample had been larger, a hedonic regression similar to the rental analysis would have been preferred,
While a formal analysis of transaction prices thus requires the ability to observe additional transactions of certified real estate13 , several theoretical arguments can be made as to why certified buildings might experience a sales premium. The value of a building, and the return on investment (ROI) of a building asset is the result of a complex set of interacting forces.
At its core, a building’s value is determined by its ability to generate income and by how that income is capitalized in the market. The primary determinant is the property’s net operating income, which reflects rental revenues minus operating expenses. Higher rents and lower vacancy both increase operating income and, by extension, the assets’ market value. Section 3.1 provided an indication that certified buildings most likely experience a transaction premium, since rents are higher. Beyond the income generated, building value or ROI is affected by a range of other factors. These include asset-level characteristics such as property type, location, and physical condition Some investors view certified assets as more resilient to regulatory change and better positioned to meet future energy efficiency standards, reducing potential obsolescence risk. As a result, these buildings may attract a broader investor base and trade at higher price. Moreover, certification can improve access to capital, as lenders and institutional investors increasingly integrate sustainability criteria into portfolio strategies. This argument is expanded in the section below.
In summary, it is easy to point at mechanisms as to why certified buildings could see a transaction premium. This includes but is not limited to 1) increasing tenant demand pushing net operating income above non-certified buildings, 2) larger regulatory, maintenance or operations resilience, decreasing costs, or 3) preferential financing terms and investor demand for more sustainable assets, pushing demand and prices. Quantifying these would be beneficial, while data limitations currently complicate formal analysis on Danish real estate data.
13 A formal transaction price analysis on Danish data would benefit from (1) Increased precision in the registry of certified buildings, meaning fewer observations are dropped due to inconclusive determination of certification status in sales registries and BBR (2) Inclusion of non-public sales (“nontinglyst” and (3) Time – allowing additional transactions to be recorded
aaaadfCorporate social responsibility as a driver of
certification demand
The econometric analysis in section 3.1 suggested that tenants might prefer certified buildings and are willing to pay a premium to inhabit them. This is one mechanism through which investors could see a potential premium for holding certified real estate and would drive transaction prices up for these buildings. However, another channel through which certified buildings could experience a transaction premium compared to non-certified buildings is through a potential growing investor demand for sustainable practices of their assets that align with broader corporate social responsibility (CSR) objectives. If this is the case, certification can act as a visible marker of asset quality and sustainability and drive a transaction premium for certified buildings. To understand whether this general notion is supported in Denmark, we have made an indicative analysis of investor demand for certified real estate in Denmark.
In a November 2024 economic memo, Danmarks Nationalbank (the Danish central bank) provides a detailed overview of the stock of commercial real estate (CRE) in Denmark. The market is estimated to be worth between DKK 3,500 and 4,000 billion in total. The transaction volume was DKK 53.5 billion in 2024 (RED Danish Investment Atlas). The companies acting in the market span a diverse set of investors, companies and organizations. 36% of the Danish CRE market is owned by CRE companies, while other industries, e.g. pension funds, account for 27%. The remaining stock is owned by nonprofit housing organizations (almene boligforeninger) and housing cooperatives (andelsboligforeninger)
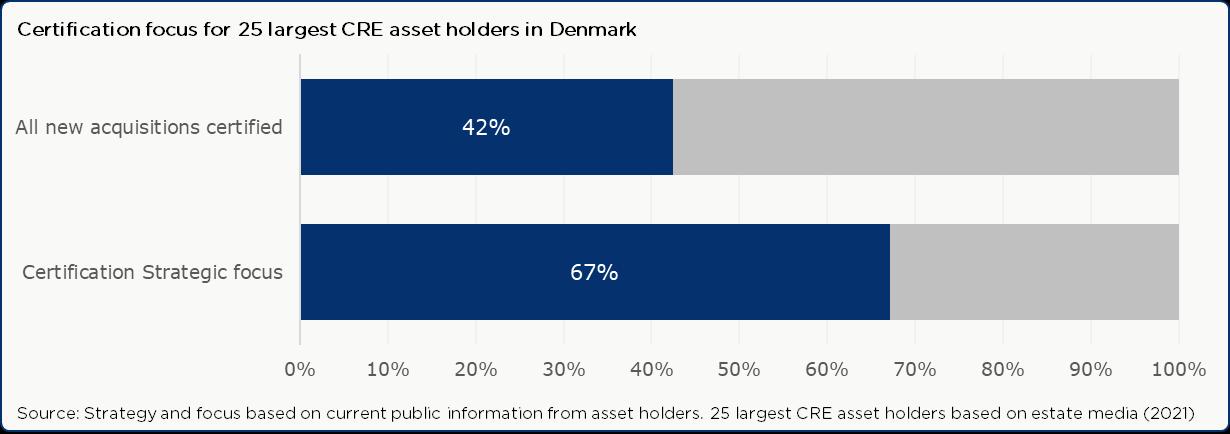
While we have not conducted a full mapping of certification strategies across the entire market, we undertook and indicative analysis of the 25 largest CRE asset holders in Denmark (2021) Collectively, these top 25 actors held approximately DKK 750 billion in assets in 2021, representing a sizable portion of the total CRE market We searched for certification focus in publicly available information from these 25 actors, and found that 67% of the asset stock had an explicit strategic focus on certification while 42% required certification for all new developments or acquisitions. These figures are indicative only, since they are not based on actual interviews with the asset holders. However, the figures underline a strong investor demand for certified properties, at least in the professional real estate market. From a market economics perspective, such intense demand for certified assets can have price and liquidity implications. If the supply of certified buildings does not expand at a pace that matches investor demand, the market may observe transaction premiums for certified properties. Conversely, non-certified or non-compliant assets risk value erosion over time. Whether these tendencies amount to real transaction premiums above what rental premiums can explain, is an empirical question that should be subject to investigation once the volume of transactions of certified buildings increase in coming years.
Figure 3.3: CRE ownership and certification focus for 25 largest CRE holders in Denmark.
3.4 Economic Analysis – building costs
To get a complete analysis of the value of certification to investors and owners, it is necessary to understand not only the positive benefits and value of certification. It is equally necessary to understand the potential additional costs of certification. Since certification entails additional requirements regarding a building, this can result in changes in both construction costs, e.g., due to changes in materials or advisor needs, and operational costs, e.g., due to changes in maintenance, insurance or capital costs
For both construction and operations costs, it has not been possible to obtain comprehensive and comparable data for certified and non-certified buildings. These costs are typically treated as private information by developers and owners, and no centralized sources exist. Moreover, estimating causal differences in costs would require a relevant counterfactual scenario, for example how a specific project would have been designed or executed had it not pursued certification. Such comparisons are inherently difficult to construct, and suitable controls are therefore not readily available14 For these reasons, we do not assess potential cost differences associated with certification in this report directly.
Instead, based on detailed construction cost data for 133 DGNB certified buildings certified under the 2016- and 2020 DGNB manual, we have been able to gather some baseline construction cost data for such projects The cost figures include total building construction costs as well as advisor and construction site expenses directly related to delivering the completed building15. Figure 3.4 shows the average cost per square meter for the construction of a DGNB gold certified residential building larger than 5.000 m2 under the 2016 manual. Using multivariate regression, we then analyze how this figure changes when varying the DGNB distinction, building floor area, manual and building typology. More detailed information is not provided due to the discretion of the construction budgets for the buildings. The LCC methodology, including the costs covered, differ somewhat between projects under the 2016 and 2020 manuals Some caution should therefore be applied when comparing 2016 and 2020 projects directly specifically More generally, the averages mask heterogeneity not accounted for, since we cannot strictly hold “all else equal”, since several relevant background variables unique to each project are not observed. Results should therefore be interpreted as a first, but not perfect picture of the costs associated with constructing a certified building.
14 A hedonic regression setup could control for observable differences in similar buildings. However, unobservable characteristics specific to certain owners or constructors could impact even such an estimate.
15 The construction costs are based on the finalized building accounts, covering the full contract sum including additional works, and include the entire building. Fixed inventory and external works such as sheds, terraces, landscaping etc. are only included for 2020 projects, while data has not been detailed enough to correct this difference compared to projects under the 2016 manual Costs do not include land development such as potential soil contamination clean-up, demolition of any existing structures, utility connection fees, or other administrative and ownership-related expenses (e.g., taxes, insurance, land costs, capital costs, demolition and disposal). Advisor costs include architectural and engineering consultancy services from design and planning through to handover. Construction site costs include temporary facilities and measure necessary for execution of the work, including worker facilities, tool containers, fencing, safety measures, crane operations, scaffolding, and similar onsite logistics.
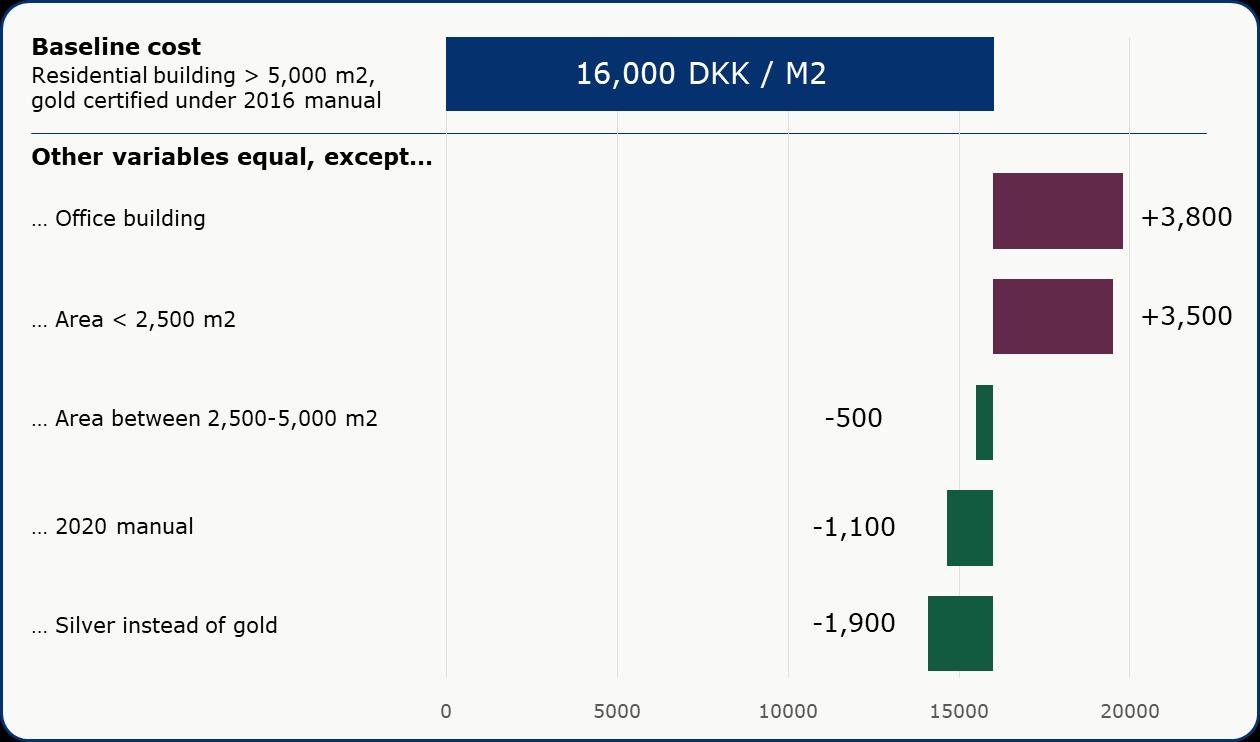
Figure 3.4: Cost per m2 for DGNB certified buildings
Note: Based on LCC calculations for 133 DGNB certified projects. All else equal analysis based on coefficients from a multivariate regression of cost (including acquisition costs, one-off expenses and advisor costs where specified) on the variables in the figure. Differences are not statistically significant at common significance levels, except the office coefficient (p=0,01) Costs are in 2025-fixed prices (based on certification year). Included projects certified between 2020 and 2025. Rounded to nearest 50 DKK.
Figure 3.4 shows that an average DGNB gold certified residential building larger than 5,000 m2 under the 2016 manual cost 16,000 DKK per m2 to construct. On average, a similar building opting for a silver distinction lowers construction costs by 1,900 DKK per m2. For relatively small projects (<2,500 m2), average costs are larger by 3,500 DKK per m2. Office buildings are generally more costly, with an average of 3,800 DKK per m2 above a residential building. Certifying under the 2020 manual is slightly less costly (1,100 DKK per m2), which could partly be due to learning benefits and experience with certification in the sector improving from the 2016 to 2020 manual. The fact that “medium-sized” buildings with an area between 2,500-5,000 m2 is slightly less costly (500 DKK per m2) than buildings above 5,000 m2 could be due to third variables not controlled for, creating a somewhat counterintuitive result. In general, data is too scarce to precisely estimate the effect of multiple changes in variables – e.g. both a silver distinction and an office building, and it is no guarantee that changes in multiple variables are additive in nature. It is also important to note that the averages mask quite large heterogeneity within categories. The relatively small sample size also makes results sensitive to outliers. Nonetheless, they provide some descriptive information for the construction costs of certification – without being able to compare these with noncertified buildings due to data limitations.
For operating costs, which can include both costs of capital, maintenance and insurance, actual data is simply not available even for certified buildings16 Hence, we cannot provide similar estimates for this.
In summary, although we cannot directly compare construction costs of certified and non-certified buildings, we provide detailed construction cost data from 133 DGNB-certified projects (2016 and 2020 manuals) to provide baseline insights. A multivariate regression shows that a typical DGNB Gold–certified
16 While LCC calculations do provide a calculation for the expected maintenance cost of a building, we have not included such figures, since they do not necessarily reflect actual costs 1:1. Insurance and capital costs would require additional data.
residential building larger than 5,000 m² costs about 16,000 DKK per m². Costs tend to be lower for silver certification (−1,900 DKK/m²), but higher for small projects (+3,500 DKK/m²) and office buildings (+3,800 DKK/m²). These results are generally not statistically significant, vary widely across projects, and may not combine additively. Due to limited and heterogeneous data, the findings are descriptive only. For operating costs such as maintenance, insurance, and capital expenses, we have not been able to provide similar estimates.
Certification and building quality
The economic value of certification to investors as represented in the economic analysis above is one very direct measurement of the value of certification. We presented arguments that both tenants and investors could have a demand for certification, or the attributes associated with certification, and results indicate that they are willing to pay a premium for this. This investigation is thus relatively simple, as exemplified below
While establishing this association is one thing, we also want to expand our view in the following two sections on the environmental and social effect of certification. In these analyses, we unpack the potential reasons why the demand and market value premium exists to better understand drivers of market value creation. We also expand our view from strict financial value – and examine parts of the socio-economic value that certification can create. The figure below illustrates the causal mechanism through which certification can affect value creation more broadly.
In essence, certification influences market value through two main channels. First, certification encourages specific environmental and social requirements. These requirements change characteristics of a building, thereby creating inherent value for building users and other stakeholders. In the following sections, we exemplify this additionality of certification. Second, certification functions as a signal Because certification provides credible, standardized information about the building's performance, it allows buyers and tenants to trust that certain desirable attributes are present, and that a building complies with official requirements. While signaling can be an important driver of market value, it might be less relevant for the creation of socioeconomic value. While inherent value and signaling effects translate into higher market valuations for building owners, environmental and social requirements often have broader consequences beyond individual buildings. Most environmental improvements - such as reductions in carbon emissions or pollution control - generate socioeconomic value that benefits the community at large, not only building occupants.
Finally, is should be noted that some environmental parameters may reinforce each other, while others may create trade-offs. For example, circular material requirements may positively influence resource efficiency but potentially reduce durability, with implications for long-term performance and cost. These interactions are not rigorously evaluated in the chapters but would be an important part of understanding the full effect and value of certification.
4. The Environmental case for certification schemes
In this section, we focus on the environmental effects of certification. We first assess the additionality of certification on a set of environmental outcomes and discuss certification’s role in advancing these dimensions. Environmental value is inherently socioeconomic in nature, since environmental improvements benefit society at large. However, environmental effects can also affect market value, e.g. through investor preferences for more sustainable portfolios – and potentially also through tenant demand for sustainability.
One of the key issues in assessing the effect of certification on environmental outcomes is generally the lack of data on relevant outcomes for non-certified buildings. In other words, we lack a suitable control group. As will become evident in this chapter, certified buildings generally need to document environmental outcomes such as lifecycle CO2 emissions, biodiversity measures like wood origin, resource efficiency or chemical contents of products in the buildings. This documentation thus provides data for certified buildings specifically. The issue becomes finding relevant data for non-certified buildings –buildings that have no direct requirements for similar documentation. The lack of relevant control groups dramatically complicates proper effect measurement in an econometric sense.
Due to these limitations, this chapter seeks to describe how certification addresses environmental factors, show indications of the added value of certification, and point towards data requirements to properly effect-evaluate the environmental effect of certification. We focus on climate impacts17 and biodiversity through descriptive analyses of Lifecycle assessment (LCA) data, Environmental Product Declaration (EPD) usage and discussion on biodiversity metrics and impacts
Beyond climate impacts and biodiversity, certification also targets other important environmental dimensions - particularly circularity, chemical pollution, and resource use – and the interplay between them These factors are increasingly central to sustainability in the built environment, even though reliable data and established methods for measuring their effects remain limited. They are, therefore, not addressed separately in the report. The inability to accurately measure and evaluate certification’s effect in these areas currently does not, however, preclude that such effects exist. Circularity requirements influence material choices, reuse potential, and long-term waste generation. Chemical requirements reduce exposure to harmful substances, limit environmental pollution, and enables more circularity Resource-use criteria encourage more responsible consumption of materials and land-use. These are all profoundly important environmental areas, and certification effects within these areas should be subject to more rigorous analysis.
Limiting environmentally hazardous and health-damaging substances is important not only from an environmental standpoint but also from a user perspective, as it directly impacts the occupants/users of the building. This topic is further explored in Chapter 5, which addresses social outcomes
17
Box 4.1 Summary
• Additionality of certification: Environmentalrequirementsformacorepartofcertificationschemes,with particularemphasisonclimate,biodiversity,pollutionandresourceuse.CertificationbothensuresthirdpartyvalidationofregulatorycomplianceandsetsadditionalrequirementsbeyondDanishBuilding Regulations.Weshowthatabuildingthatonlymeetsbuildingregulationsfulfilsonlyverylimited requirementsincertificationschemes.
• Global warming: Whiledirecteffectevaluationiscurrentlylimitedduetoalackofsubstantialemissionsdata fornon-certifiedbuildings,wearguethatcertificationhasactedasakeymarketdriver,acceleratingearlyLCA adoptionandincreasingdemandforEPDs.DGNB-certifiedbuildingsconstructedinrecentyearsshowlife cycleemissionswellbelowregulatorythresholds,andthereisaclearandgrowinguseofEPD-documented materials.
How DGNB and Nordic Swan Ecolabel address the environmental dimension
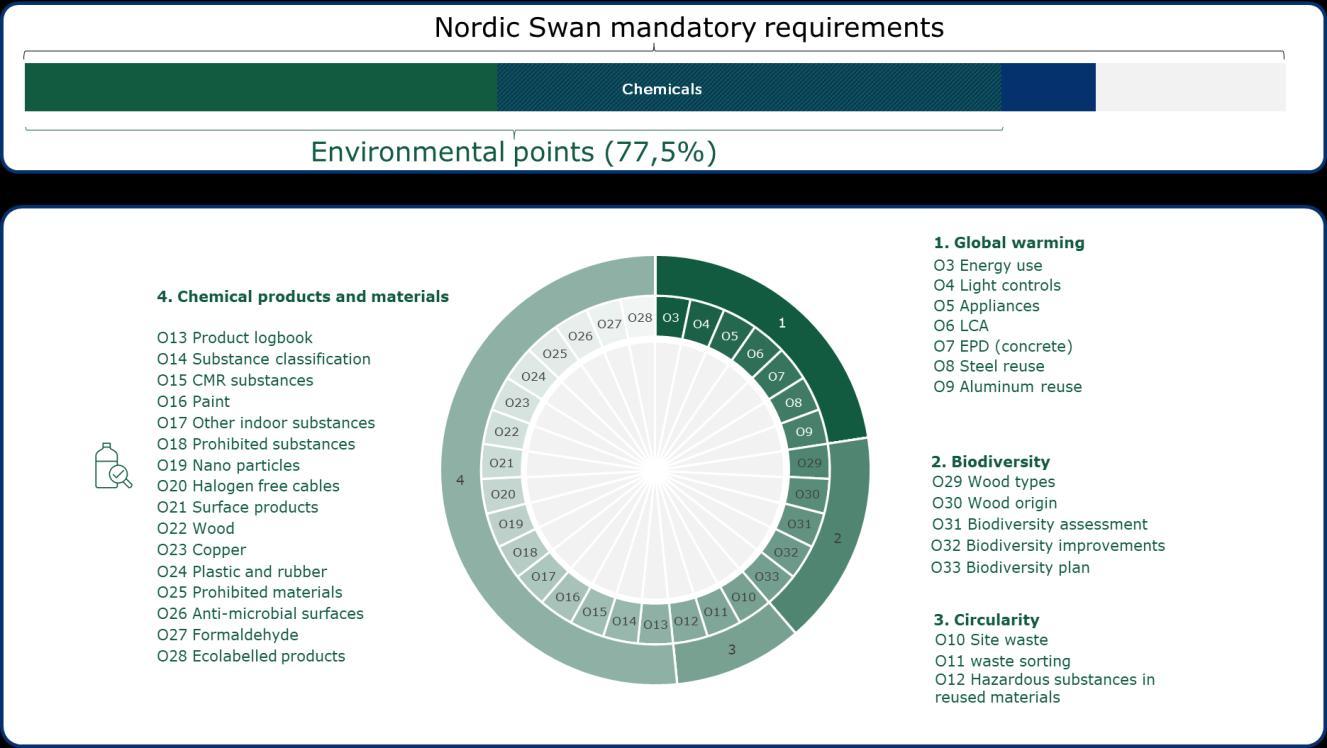
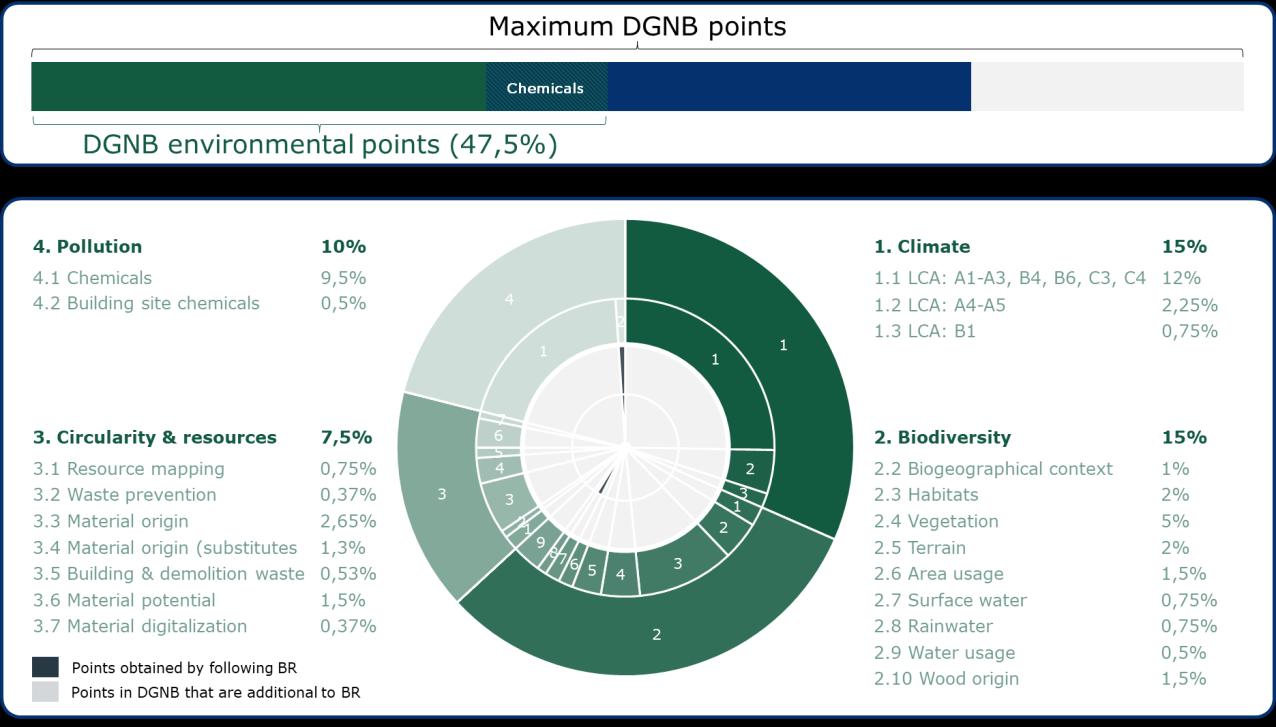
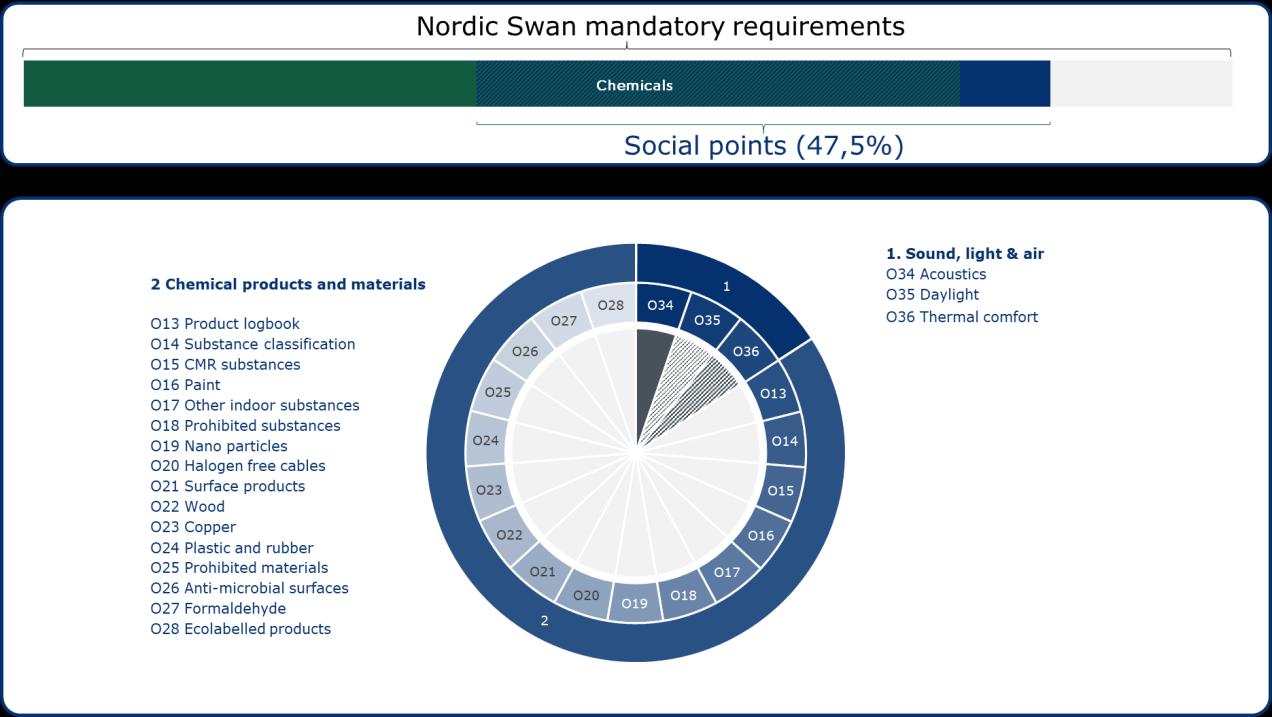
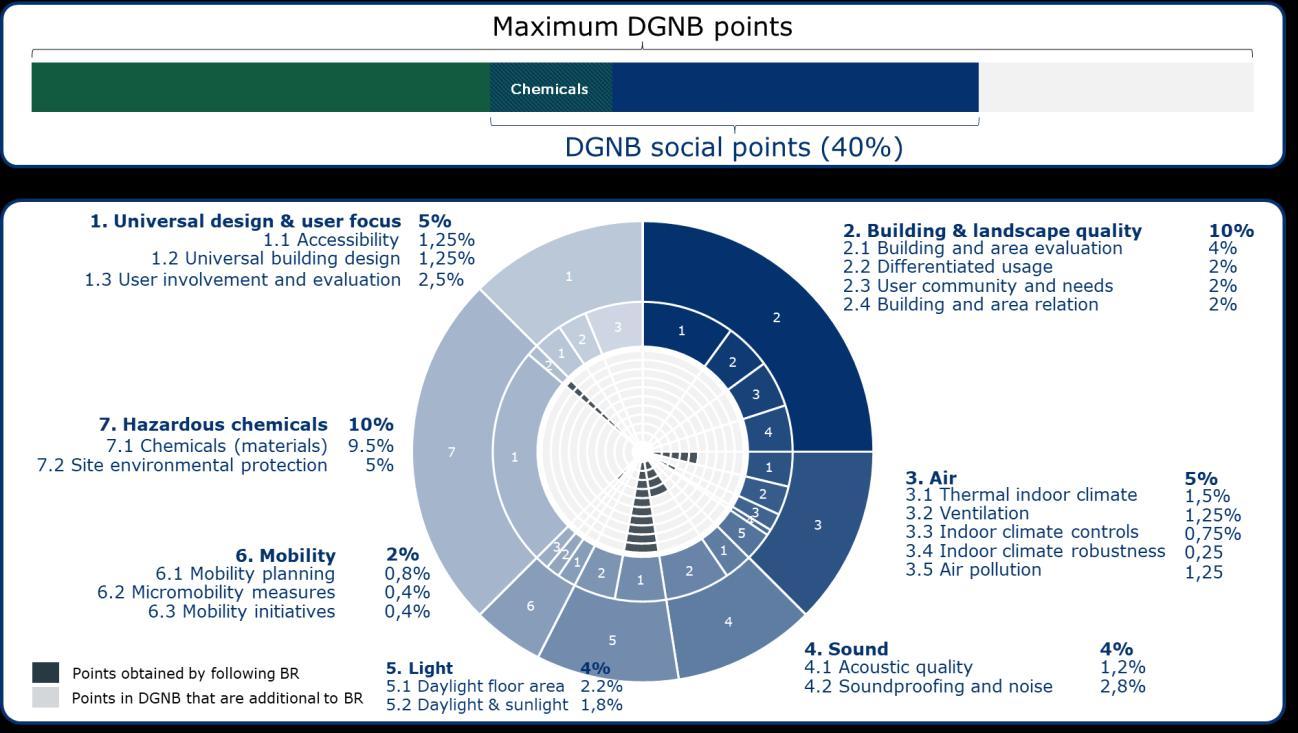
As outlined in Chapter 2, achieving certification requires compliance with a defined set of technical criteria specified in each certification scheme. In DGNB, 47,5% of all possible points obtainable are related to environmental criteria while 31 out of 40 knockout criteria in Nordic Swan Ecolabel are related to environmental requirements. Although each specific criterion differs in compliance difficulty and scope, these figures underline that the environmental dimension is a central part of both schemes.
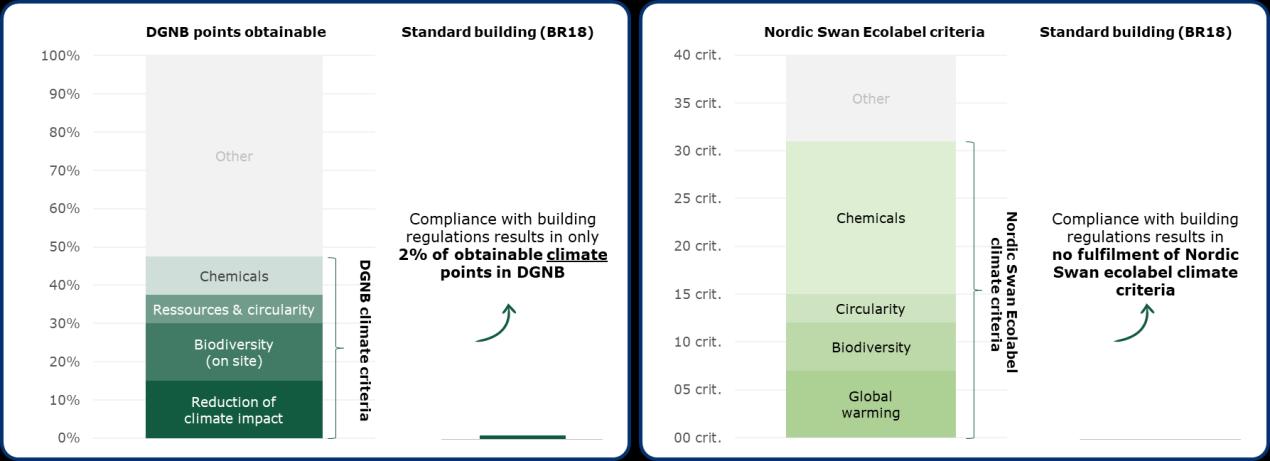
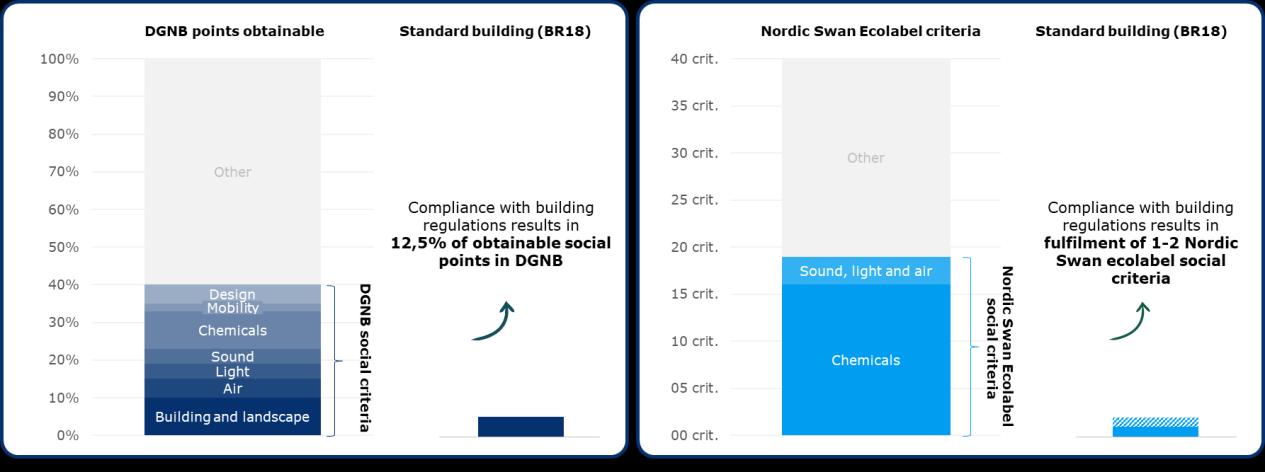
To demonstrate the added value (“additionality”) of certification, we compare how a conventional building that meets Danish Building Regulations (BR18) would perform if assessed against selected environmental criteria in DGNB and Nordic Swan Ecolabel. This comparison is not straightforward, as BR18 is not designed to be directly mapped onto certification schemes. The comparison should therefore be understood as an illustrative exercise rather than a full technical assessment. However, by showing how many points or fulfilled requirements that a BR18-compliant building would score under DGNB and Nordic Swan Ecolabel, we make the gap between regulation and certification more tangible. While the examples are illustrative and do not capture every possible criterion that has environmental implications, they provide an indication of the environmental performance that certification schemes demand. The figure seeks to visualize the degree of additionality - that is, how certification drives performance beyond regulatory compliance. It should be noted that DGNB and Nordic Swan Ecoloabel are different in nature. DGNB operates with weighted point requirements, whereas Nordic Swan Ecolabel operates with binary knockout criteria. The relative size of requirements are therefore not comparable between the two schemes.
In Figure 4.2, when evaluating a BR18-compliant building against environmental criteria in DGNB, a building that just complies with the Danish Building Regulations (BR18) achieves points in about 2% of the environmental criteria. This visually emphasizes the gap between regulatory compliance and the higher performance standards required for DGNB certification across the environmental dimension. Similarly in Figure 4.3, A BR18-compliant would fulfil none of the 31 environmental criteria set by the Nordic Swan Ecolabel – again underlining the gap between compliance and certification. The figures thus illustrate how both schemes set stricter environmental requirements than those mandated by BR18.
The two figures simplify the contents of the two certification schemes dramatically. A more detailed point scoring example of a BR18 compliant building is provided in appendix A6 and A7
Figure 4.2
Figure 4.3
Note: DGNB manual 2025 for residential buildings and Nordic Swan Ecolabel 4.6 compared to BR18 (2025). DGNB points are scaled based on the relative weight in the total DGNB assessment. Source: own construction
4.1 The climate impact of certification
Climate performance is one of the areas where certification most clearly adds value, both by raising the environmental ambition of buildings and by reducing long-term regulatory and transition risks for investors. Understanding the climate dimension is therefore central to assessing the broader enviromental value of certification.
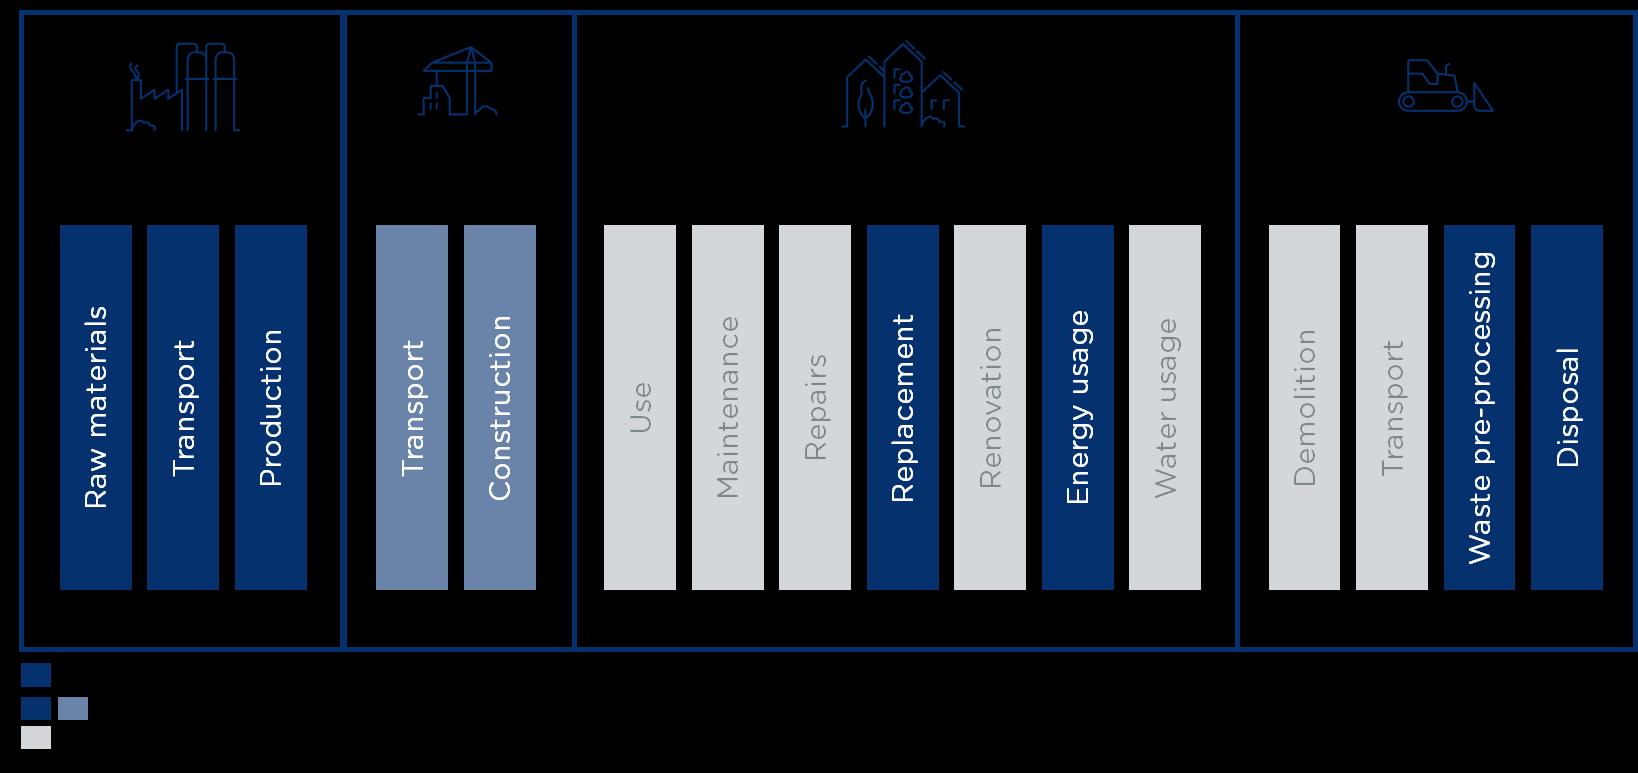
The construction sector is one of the major sources of climate emissions in Denmark Looking at the climate emissions from buildings alone (i e. excluding roads and bridges), approximately 10% of Danish consumption-based emissions comes from new-construction and renovation of buildings alone18. Climate emissions from buildings have long been high on the political agenda, which has led to regulatory tightening in the past years. A central tool implemented is the mandatory use of Life Cycle Assessment (LCA) of buildings with a requirement to adhere to centrally governed reference values for the emissions associated with the construction of a building. The measure was first introduced in building regulations in 2023 (BR18 – 2023), covering most new construction above 1,000 square meters. Essentially, LCA is a method for calculating the emissions associated with a building throughout its lifetime, from the production of building materials through the process of assembling the building, its usage and renovation requirements to the building’s end of life and disposal of materials. Figure 4.3 illustrates the building process and sources of emissions in the building life cycle
Figure 4.3 Lifecycle assessment phases and inclusion in building requirements in Denmark
The integration of Life Cycle Assessments (LCAs) into Danish building regulations in 2023 is the result of a long, cumulative process of voluntary practice, method development, and policy alignment. Certification systems have served as early adopters, creating arenas where LCA methodologies could be tested, refined, and finally put into practice.
DGNB was among the first to formalize this development by including LCAs already in the first Danish manual in 2012. In the 2014 manual, the criteria ENV-1.1 “Livscyklusvurdering” and ENV-2.1 set benchmarks for whole-building assessments. This ensured that Danish design teams and developers began to apply LCA systematically almost a decade before it became regulatory. BREEAM followed a similar path, and from its 2018 New Construction update, the MAT01 credit introduced structured LCA requirements at early design stages, replacing earlier and less comprehensive environmental rating methods. Nordic Swan Ecolabel has likewise increased its focus on material and climate impacts in recent years, with the criteria generation 4 published in 2023 for new buildings requiring stricter documentation
18 Byggeriets klimapåvirkning | Social- og Boligstyrelsen
of environmental impacts, including measures to reduce embodied carbon from key materials such as concrete and mandatory minimum requirements for LCA calculations.
In parallel with these certification systems, political ambition was translated into practice through e.g., the voluntary sustainability class (“Den Frivillige Bæredygtighedsklasse”), introduced in 2020, and the voluntary low emissions class (“Den Frivillige Lavemissionsklasse”) focusing specifically on building emissions after 2021. This ensured that when LCA was formally integrated into building regulations in 2023, both industry capacity and methodological experience were already established.
Together, these voluntary systems and pilots created a stepwise process: certification schemes demonstrated feasibility and generated benchmarks, the voluntary class expanded application, and regulation could then build on a mature base of knowledge. Without this gradual build-up, the political feasibility and technical robustness of mandating LCAs in 2023 would have been far more limited.
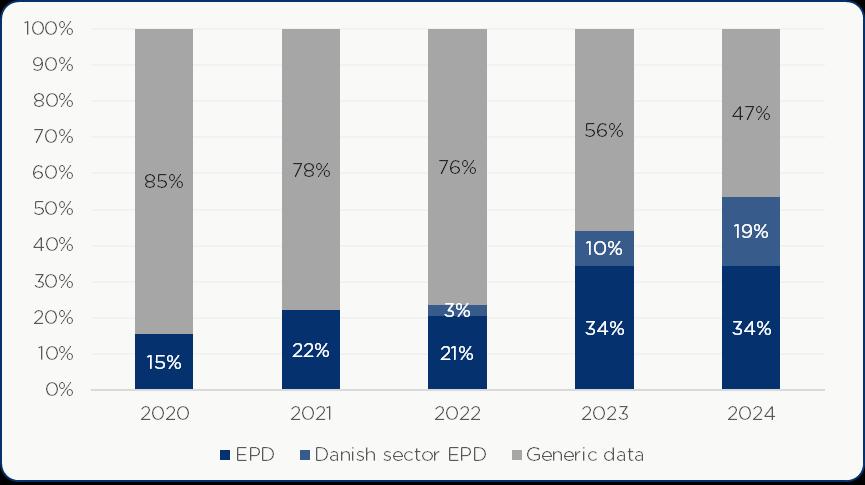
Case study: LCA for DGNB certified buildings
To investigate the impact of certification on life cycle emissions from buildings, we have obtained LCA data for 110 buildings that have been DGNB certified. Preferably, to obtain an estimate of the effect of certification on life cycle emissions of buildings, we would want to compare certified buildings with noncertified buildings based on their LCA. However, since the mandatory use of LCAs has only just been incorporated into building regulations, no comprehensive dataset exists for both certified and non-certified buildings. Therefore, only data on early adopters, e.g. certified projects planned before regulations entered into effect, were available for this study. Second, even within buildings where LCA data exists, several major caveats exist. LCA calculations for DGNB projects in Denmark are based on the software LCAbyg developed and maintained by BUILD. The software has been continuously updated and adapted – most recently to apply the methodology stipulated in the building requirements for LCAs. The consequence of the updates is that LCAs calculated under different versions of the software can have different calculated figures for different phases, as well as different totals depending on available reference data and methodology. In practice, this means that comparison between LCA methods is not possible. As an example, BUILD has done LCA calculations on the same building using three different LCA methods, yielding more than 15%-points differences in total calculated CO2e, and even larger %-point differences within building subprocesses (ibid). Therefore, we select only the LCAs of 61 buildings that all apply the same LCAbyg methodology, namely 5.3.1.0. This version coincides with the methodology for the 2023 building regulations (BR18 – 2023). Below, we show the LCA of the 61 buildings. The figure includes the upper limit of emissions from the 2023 building regulations. It is important to note that the regulation only applies to buildings started after January 2023 – and that the building LCA data thus covers buildings that did not have to comply with the regulation.
Note: Based on LCAByg 5.3.1.0 across years. Emission factors vary by time, which influence averages The Figure provides simple means – area weighted means are 8,96, 9,06 and 7,48 for residential, office and other, respectively N=9-38
The results show that the emissions are well below the building regulation limit of BR-18 (2023) – even though the buildings were not necessarily regulatorily bound by the limit. This could indicate that certified buildings had a head start on complying with regulations. Since we do not have LCA data for non-certified buildings, we cannot conclude that DGNB certified buildings are necessarily more climate friendly than non-certified buildings at the time. However, much of the value creation from certified buildings have been in pushing the development, baselining, measurement and reference value setting of emissions from buildings. This has supported the tightening of regulation – something we expand below.
Figure 4.4 CO2e of 61 DGNB certified buildings compared to reference from building requlations (BR-2023).
4.1.1 Environmental product declarations (EPDs)
Additional to the certification schemes acting as an arena for developing and testing LCA calculations for buildings, certification schemes can also have acted as a market driven incentive for construction suppliers to develop environmental product declarations (EPDs) for their products. An EPD is a standardized method for documenting the environmental impact of a specific building material/product. EPD’s play a central role in LCA calculations by providing the most accurate and product-specific documentation of the carbon footprint of the building materials used. In practice, LCA tools typically operate with a hierarchy of data sources. At the lowest level, very general generic data offer broad averages of the products emissions with limited precision. This could be data from e.g. Ökobaudat19, which does not necessarily reflect products used in the Danish construction sector. Second, Danish Sector EPDs have been developed by BUILD, and represent a step forward, as they are tailored to match materials typically used in Denmark. The data exists for a range of products and typically reflect the emissions somewhere near the most emitting EPD for a given product type used in Denmark to incentivize the use of actual EPDs in LCA calculations20. At the highest level, product specific EPDs provide verified, product-specific data directly from manufacturers. This hierarchy means that projects using EPDs can achieve both greater accuracy in their assessments and potentially improved scores in certification systems, while manufacturers are incentivized to develop EPDs to make their products more attractive for projects aiming to optimize embodied carbon.
The uptake of Environmental Product Declarations (EPDs) in the building sector has followed a similar path of voluntary adoption, market testing, and gradual mainstreaming as the use of LCA methods. Certification schemes have played an important role in creating early demand for EPDs by linking points in their manuals to the availability of product-level environmental data. DGNB Denmark incorporated EPDs explicitly in its material criteria from the 2016 manual, rewarding projects for sourcing materials with third-party verified declarations and thereby encouraging suppliers to invest in developing them. BREEAM took comparable steps in its 2018 New Construction manual, where the MAT02 credit incentivized the use of EPD-backed materials to improve the accuracy of LCA calculations. Nordic Swan Ecolabel has since reinforced this trajectory, with its generation 4 requirements obliging key materials such as concrete and insulation to be accompanied by valid EPDs in order to document embodied carbon. Through these mechanisms, certification schemes not only created an early market for EPDs but also raised expectations for suppliers to improve performance over time - rewarding not just the presence of an EPD but also lower carbon intensities compared to market averages. In this way, buildings could obtain lower carbon footprints by making informed choices of the materials used.
The figure below shows how the use of EPDs have developed over the years in Danish DGNB certified buildings.
4.5 Share of total building carbon emissions covered by EPDs in DGNB certified buildings by certification year
Note: EPD covers the use of product specific EPDs, while Danish Sector EPDs cover Danish data based on EPDs for building materials regularly used on the Danish construction sector. Generic data refers to data sourced from e.g., Ökobaudat, which is generally considered less precise than the other sources. The year represents the year the building obtained certification and covers both LCAs calculated using the 2016- and 2020 LCA method. Source: ’Rådet for Bæredygtigt byggeri’ LCA-database for selected projects. N=1-52
The figure shows an increase in the use of product specific EPDs in DGNB certified buildings since 2020. For buildings obtaining certification in 2023 and 2024, 34% of the total emissions were documented by product specific EPDs (excluding building energy usage in operations). This represents a sizeable demand for EPDs in the construction sector and provides a significant incentive for material producers to develop efficient, low carbon materials, which in turn can help lower constructors’ calculated emissions.
4.1.2 Building emissions and LCAs going forward
Up until this point, we have argued that certification schemes have supported the development and baselining of CO2e emissions for buildings, paving the way for regulatory tightening in the building regulations. Going forward, the tightening of regulatory pressure on building emissions is set to continue.
Since its introduction in building requirements in 2023, the scope of the LCA has been expanded to also include the building process (A4-A6) in the updated building regulation (BR18 – 2025). Additionally, the reference values for the emissions have been tightened, and will be tightened even more in the coming years. These reference values act as binding maximum CO₂e limits that buildings must comply with in order to obtain a building permit. Figure 4.6 illustrates how these limits decrease significantly over time. Before 2023, no LCA requirement existed at all, so the shift represents a fundamental change in how the construction sector must approach material choices and design.
Figure
Figure 4.6 Lifecycle assessment reference values for new construction in Denmark over time
Note: Based on Social- og Boligstyrelsen.
Both DGNB (2025) and Nordic Swan Ecolabel (4.6) currently incentivize emission levels below existing building regulation levels. Certification thus places projects ahead of the regulatory curve and reduces future compliance risk.
To remain compliant, developers will need to reduce emissions by both substituting high-carbon materials with lower-impact alternatives and adopting new approaches to construction. In many cases, material substitution alone can deliver large reductions. Ramboll has analysed five existing buildings and modelled the effect of replacing selected products with best-in-class (EPDs)21. The results of this analysis, summarised in figure 4.7, show that four out of five buildings could already comply with the BR18 (2025) emission thresholds through such one-to-one material substitutions alone at only a marginal increase in costs
Figure 4.7 EPD potential for 5 buildings for CO2e reductions and cost changes.
Note: See Ramboll 2025 LCA Whitepaper “2025 LCA requirements”.
Figure 4.7 illustrates this cost–benefit relationship: across building types, emissions reductions of 20–30% can be achieved with cost increases in the range of 0.2–2.5%. It is, however, important to note that the comparison in the figure is simple The relationship should not be assumed to hold universally, particularly in future scenarios where regulatory tightening may outpace the availability of lower-emission products.
In summary, certification schemes played a central role in driving the early adoption of Life Cycle Assessments (LCAs) within the building industry. By introducing incentives for more sustainable design and construction, these schemes not only encouraged practitioners to assess emissions across a building’s entire lifecycle but also helped refine and test the LCA methodology itself.
In parallel, certification schemes helped create a demand for Environmental Product Declarations (EPDs), which incetivizes material producers to innovate and reduce the carbon footprints of their products. Although comparing LCA methodologies across different periods is difficult due to changing methodologies over time, data from DGNB-certified buildings consistently demonstrate emissions that fall well below the 2023 building regulation thresholds using comparable methodology.
4.2 Biodiversity in certified buildings
Biodiversity is increasingly gaining attention within the sustainability agenda in the built environment. While climate mitigation has dominated the discussion for years, biodiversity is now emerging as one of the next major focus areas. The construction sector plays a key role, as building activities consume natural resources and reshape habitats, with direct consequences for species and ecosystems. For investors and developers, biodiversity considerations are expected to become more important as regulation, ESG frameworks and market expectations evolve.
Certification schemes such as Nordic Swan Ecolabel, DGNB and BREEAM have already strengthened their biodiversity requirements in recent updates. These frameworks encourage actions that protect and enhance ecological value, both on the building site and throughout the construction value chain. In practice, biodiversity in the built environment can be divided into two main dimensions: on-site and offsite biodiversity.
Figure 4.8 illustrates how biodiversity requirements embedded in certification schemes can influence environmental performance. The figure highlights how certification can drive improvements in habitat quality, vegetation, and ecological management, while also reducing upstream impacts through material choices and supply-chain considerations.
Source: Own construction. Note: For off-site biodiversity, certification schemes primarily target the underlying drivers of biodiversity loss, e.g., through reduced use of raw materials and focus on origin, rather than measuring ecological outcomes directly. This differs from on-site biodiversity, where tools such as the UrbanBioScore assess observable ecological conditions.
On-site biodiversity
On-site biodiversity refers to the diversity of living organisms and habitats within the physical boundaries of the project. This includes green roofs, living walls, trees, gardens and landscaped areas that support local flora and fauna. On-site measures aim to create or enhance habitats, strengthen ecological resilience and improve human well-being through proximity to nature.
Certification schemes have gradually increased their expectations in this area. For example, the DGNB 2025 manual incorporates the UrbanBioScore as one method for documenting on-site biodiversity.22 UrbanBioScore is a new Danish standard developed with inspiration from England’s Biodiversity Metric 4.0 and adapted to local conditions.23 The method maps and evaluates habitats, plant species, fauna observations and other indicators, providing a structured way to assess on-site biodiversity quality and track changes over time.
22 On-site biodiversity weighs 10 percent in the DGNB criteria from the 2025 manual. – (15 pct global opvarmning, 10 pct. kemi, 5 pct. land og vand)
23 “Registrering af indikatorer for biodiversitet I byer”, Teknisk rapport fra DCE – Nationalt Center for Miljø og Energi, 2024.
Figure 4.8 Effect from biodiversity in certification of buildings
In DGNB, projects above 500 m² of open space24 are required to document at least 30% habitat area to achieve points within the biodiversity criteria.25 The method supports municipalities, professionals and landowners in documenting improvements and ensuring that biodiversity is integrated systematically into project planning.
As another example, The Nordic Swan Ecolabel also includes requirements regarding biodiversity on the building plot. The site’s biodiversity should be professionally assessed before construction using public data and on-site surveys to identify valuable habitats, species, and ecological features. Measures should preserve important natural elements, remove invasive species, and promote native vegetation to strengthen local ecosystems. A long-term biodiversity management plan is required to guide future maintenance and ensure lasting ecological value.
Off-site biodiversity
Off-site biodiversity covers the ecological impacts that occur along the construction value chain – from material extraction and forestry practices to manufacturing, transport and waste handling. Because most building materials originate outside the project site, off-site impacts can exceed on-site effects by a large margin.
Certification schemes today primarily address off-site biodiversity indirectly, for example through requirements for certified wood, responsible sourcing, recycled or re-used materials. This indirect focus reflects a general lack of consistent and comparable metrics and data.
A recent industry collaboration (the BBV26 project) in Denmark represents an important step toward addressing this gap27 . By applying life-cycle-based biodiversity assessments across 50 case projects, the study demonstrated substantial variation in off-site performance and significant potential for improvement. It also proposes an emerging industry standard for assessing and benchmarking off-site biodiversity impacts.
The method addresses three scientifically recognized drivers of biodiversity loss throughout material life cycles:28
• Land-use change (e.g. forestry, agriculture, raw material extraction)
• Climate change impacts from energy-intensive production
• Pollution, including eutrophication, acidification and toxicity pathways
These drivers are expressed through the indicator Potentially Disappeared Fraction of species (PDF·yr), which estimates the share of species expected to be lost over time due to these pressures. To make results more intuitive, the standard introduces Lost Danish Nature Equivalents (m² TDN) as a supplementary interpretation unit. Although not a physical land area, it translates biodiversity damage into a more tangible expression of magnitude.
The BBV project is an important step towards establishing a meaningful method for estimating and benchmarking off-site biodiversity impacts. The project provides useful recommendations on how different stakeholders in the industry can work with minimizing their biodiversity impact. However, the tool provided with the proposed industry method is lacking product specific and regionalised data for the resource use and emissions that occur in the value chain and impact biodiversity. In practice, this means
24 Open-space area consists of a property’s undeveloped land area, including the part of the undeveloped area that is reserved for pedestrians and bicycles, but excluding parking areas and driving areas.
25 Habitat areas refer to areas designated for promoting biodiversity and have no other use (DGNB Renovering og nybyggeri Version 2025 2.0.0)
26 BBV stands for: “Branchestandard for måling af byggeriets biodiversitetspåvirkning i hele værdikæden”
27 The project is funded by Realdania, AP Pension, PensionDanmark, and the Planetary Responsibility Foundation, and is developed by Aaen Engineering, Sweco, Oiko, Upstream Partners, and Concito Reports: Biodiversitetspåvirkning fra 50 byggerier. Forslag til metode og baseline for måling af byggeriets biodiversitetspåvirkning i hele værdikæden (2025) and Guide til implementering af biodiversitet i ejendommes værdikæde. Forslag til hvordan bygherrer og branchens øvrige aktører kan reducere deres påvirkning på natur og biodiversitet (2025)
28 IPBES (2019): Global assessment report on biodiversity and ecosystem services of the Intergovernmental Science-Policy Platform on Biodiversity and Ecosystem Services. E. S. Brondizio, J. Settele, S. Díaz, and H. T. Ngo (editors). IPBES secretariat, Bonn, Germany. 1148 pages. https://doi.org/10.5281/zenodo.3831673
that the tool can only be used for screening and should be complemented with other assessments of biodiversity impacts. The study also found that off-site impacts are typically larger than on-site impacts, suggesting that certification schemes may increasingly need to expand criteria to include upstream valuechain effects.
Biodiversity as a source of broader value
Even though systematic data on biodiversity outcomes are still immature, biodiversity can contribute to indirect socio-economic value through ecosystem services 29 These include:
• Regulating services, such as improved air quality, local climate regulation and stormwater management.
• Cultural services, such as recreation opportunities, mental well-being and enhanced aesthetic value.
• Provisioning services, such as timber, drinking water protection and soil productivity.
For example, research shows that urban vegetation can improve mental health outcomes, reduce respiratory issues and support physical activity30 Even modest green areas can generate measurable annual health-related economic benefits, underscoring the broader societal and user-level value of integrating biodiversity into urban environments.
For certification systems, this connection highlights an opportunity: biodiversity measures can contribute not only to ecological value, but also to user well-being and, potentially, long-term asset value. Understanding and documenting these mechanisms will be an important next step. Experience from the UK suggests that nature-based solutions such as green walls, street trees, green roofs and urban parks can in some cases increase land and property values, reduce operating costs (e.g., through lower maintenance and energy savings), and expand the lifespan of buildings31 .
Biodiversity is becoming a central element of more sustainable construction, and certification schemes already play an important role in advancing both on-site and off-site practices. While the field of biodiversity measurement is still developing, new standards such as UrbanBioScore and the emerging industry method for off-site impacts provide promising foundations. As data improves, certification schemes have strong potential to shape more systematic biodiversity actions across the value chain and support better alignment with future regulatory and market expectations.
29 ”Biodiversitet I Bygge- og ejendomsbranchen – økonomisk betydning og anbefalinger”, RBB, 2024
30 ”The Economic Value of Health Benefits Associated with Urban Park Investment”, 2023, Jeffrey Wilson and Xiao Xiao
31 Nature-based solutions to the climate emergency. The benefits to business and society
Socioeconomic value from increasing green space in Green Building Council Denmark’s investor portfolio
This scenario illustrates the type of socio-economic value that biodiversity actions required in certification schemes may support, using a real Danish investor portfolio as an example. The scenario illustrates the indirect socio-economic value that can be generated by expanding green areas and tree canopy cover across the 6,130-hectare real estate portfolio of 24 investors in Green Building Council Denmark’s network. The scenario is an illustrative case previously presented in Green Building Council Denmark’s biodiversity report32 . Based on data collected from the investors, approximately 26% of the portfolio area is built-up, 50% is grey space (roads, parking, hard surfaces), and 24% is already green. Of the existing green space, 17% consists of low-value vegetation (mainly grass), while 7% consists of trees, which hold significantly higher biodiversity and ecosystem service potential. The scenario uses the 30% green-space threshold required in DGNB certification as a benchmark for improved biodiversity performance. Expanding the green share from 24% to 30% corresponds to an additional 380 ha of green areas, achieved through expanded tree canopy cover, so it will consist of 15% of the total area. Tree canopy is particularly important, as it drives many of the ecosystem services quantified in the scenario. On-site biodiversity generates indirect value for people and society through ecosystem services. In urban areas, this primarily includes regulating services as natural processes that control climate, air, and water quality -and cultural services, providing non-material benefits such as recreation, learning, and wellbeing. The figure below shows estimated ecosystem service values from RBB’s 2024 biodiversity report, used to assess the socioeconomic value of biodiversity in certification.
Figure 4.9 Overview of socioeconomic value from increased biodiversity
Increasing green space from 24% to 30% yields an estimated annual socio-economic value of DKK 206 million, distributed across the five ecosystem services. Stormwater retention and health benefits represent the largest components, reflecting the portfolio’s heavy urban footprint and the well-documented link between green space and improved public health.
This scenario should be viewed as a rough but conservative estimate. The participating investors are already among the most advanced in implementing certification measures, and many have proactively increased green areas independently of certification requirements. Additionally, the model does not include several relevant ecosystem services, such as reduced heat-island effects, which suggests that the true total value is likely higher. The results represent an illustrative potential rather than measured effects, as actual biodiversity outcomes depend on design choices, local conditions and long-term maintenance. Nevertheless, the scenario demonstrates how certification-driven biodiversity measures can align environmental improvements with measurable socio-economic value.
32 ”Biodiversitet I Bygge- og ejendomsbranchen – økonomisk betydning og anbefalinger”, Green Building Council Denmark, 2024
5. The social case for certification schemes
An important aspect of the value generated by certification arises from the way buildings affect the people who use them. This chapter therefore focuses on the social outcomes of certification. Social value can be meaningful for investors and owners, but it may also influence market value if users are willing to pay a premium for buildings that offer better comfort, health or well-being. While this report does not measure such willingness to pay directly, it examines how certification schemes address social aspects and how these may translate into tangible user benefits The analysis is descriptive, and scenario based, drawing on existing Danish and international evidence.
Measuring the direct causal impact of certification on social outcomes is challenging. There is no systematic data collection for outcomes such as tenant satisfaction, health, or cognitive performance in certified versus non-certified buildings, which makes direct comparison difficult. Instead, the analysis relies on documented associations between specific design features frequently included in certified buildings and well-established social outcomes.
In this chapter, we define social benefits narrowly as the advantages that buildings provide to their immediate users. While environmental improvements such as lower emissions or increased biodiversity ultimately benefit other people as well, our focus remains on the user-level effects that are most tangible for investors, developers and owners. Such benefits include the availability of natural light and fresh air, the management of noise and indoor chemicals, the aesthetic and spatial qualities of design, and features that support accessibility and mobility. Together, these elements shape everyday comfort and well-being and, ultimately, influence the perceived value of a building.
The chapter does not attempt to quantify the broader socio-economic impacts of these improvements, such as health cost savings or productivity gains, even though such effects are highly relevant. Instead, the aim is to clarify the user-level mechanisms through which certification may contribute to social value and, in turn, support the overall value proposition of certified buildings.
Box 5.1 Summary
• Additionality of certification: An important aspect of the value generated by certification runs through the way buildings affect the people who use them. We show that certification not only ensures validation with building regulation requirements within areas such as light, sound, chemicals, air and mobility – but also sets additional requirements above these. Some of these requirements can drive both market and socioeconomic value.
• End user value: While the willingness to pay for socially desirable attributes isn't measured here, the report highlights how these social benefits can ultimately drive a building's market value – by creating beneficial effects for end-users.
How DGNB and Nordic Swan Ecolabel address the social dimension
Within our definition of social outcomes for the end-users of buildings, we once again visualize the relative importance of this dimension within DGNB and Nordic Swan Ecolabel. For DGNB specifically, 40% of total obtainable points are related to the social dimension as illustrated in figure 5.1. while 19 out of 40 mandatory requirements for Nordic Swan Ecolabel are within this dimension. It should be noted that the category “chemicals” are the same for both the environmental and social dimension and included in both sections, since chemicals have both a distinct social (e.g. health) and environmental (e.g. pollution) side.
Similar to figure 4.2 and 4.3, the figure below illustrates how DGNB and Nordic Swan Ecolabel set stricter requirements within the social dimensions compared to those mandated by Building Regulations (BR18). By comparing how a BR18-compliant building would score under the two schemes, the graph highlights the additional performance demanded by certification beyond regulatory compliance. Again, this comparison is not straightforward, as BR18 is not designed to be directly mapped onto certification schemes. The comparison should therefore be understood as an illustrative exercise
BR18 (2025). DGNB points are scaled based on the relative weight in the total DGNB assessment. Source: own construction.
Figure 5.2 compares the requirements under DGNB with BR18. A BR18 compliant building would obtain 12,5% of the possible social points, equivalent to 5% of all points in DGNB. A BR18 compliant building obtains a large part of the possible points within light (specifically the daylight reaching a set part of the floor area), some points within sound (specifically within soundproofing and noise), and some points within air and chemicals. Still, a BR18 compliant building is rather far from obtaining any DGNB distinctions.
Figure 5.2 shows a similar comparison for the Nordic Swan Ecolabel. The figure shows, that while BR18 compliance would fulfill parts of the requirements within light, air and sound (specifically with regards to acoustics and thermal comfort), this still leaves a large gap between achieving certification and BR18 compliance - especially within materials and chemicals
A more detailed breakdown of the criteria in which a BR18 compliant would obtain points is provided in appendix A8-A9. Again, these results show that a building only meeting Building Regulations, fall short of obtaining distinctions in DGNB and Nordic Swan Ecolabel.
Figure 5.1
Figure 5.2
Note: DGNB manual 2025 for residential buildings and Nordic Swan Ecolabel 4.6 compared to
5.1 Effect on end users
To understand how certification creates social value, we begin by examining its effects on the people who use certified buildings. Certification schemes introduce a set of design and performance requirements that directly shape users’ comfort, health and everyday experience. These user-level impacts form the foundation of the broader value proposition of certification and are therefore the first step in assessing the social dimension.
The previous section showed that the social dimension is a major component of certification schemes, and many of their requirements exceed what a BR18-compliant building would normally provide. It is debatable whether BR18 compliance should be considered the baseline level for non-certified buildings. In Denmark, documentation and assessment of social outcomes under building regulations are generally not required or centrally reviewed, besides occasional sampling. Certification schemes address this gap by incorporating third-party validation to ensure that requirements are met – and incentivize further improvements above this Since baseline compliance is not fixed, we still use BR18 as a useful baseline comparison, acknowledging that this could produce conservative estimates of the value generated33 A natural next step is therefore to assess the effects of this additionality. Measuring such effects involves two stages. First, the additional requirements must generate tangible or perceived benefits for end users - for example, improved comfort, health or well-being Second, these end-user effects must translate into perceived or realized market value, typically through users’ willingness to pay (WTP) for these enhanced attributes.
In this section, we focus on the first step in the causal chain: the potential effects of certification on end users. Measuring how these user-level effects translate into market value would require dedicated WTP studies or hedonic analyses, which are beyond the scope of this report. Instead, we examine the mechanisms through which certification can influence users’ comfort, health and everyday experience. These mechanisms also help explain part of the rental premiums found in chapter 3 User-level improvements such as lower noise, better air quality or enhanced comfort can drive higher demand, which in turn supports higher market value.
Because social outcomes are context-dependent and difficult to isolate causally, we do not attempt an exhaustive account. Rather, we illustrate selected examples of end-user benefits that are supported by evidence and linked to specific DGNB or Nordic Swan requirements. These examples highlight areas where certification goes beyond BR18 standards, and where improvements in indoor air quality, thermal comfort, acoustics or accessibility can be expected to enhance user well-being and, ultimately, perceived building value.
The table below summarizes these examples by pairing specific certification requirements with documented user-level effects.
33 One could also argue that non-certified buildings can be more ambitious than building regulations, meaning the value generated by certification is smaller than the gap between BR18 and certification requirements. There is, however, some evidence that cost of construction weighs much more heavily than ambition within social requirements (e.g. Grangaard, Lygum & Bredmose (2023))
6. Perspectives on the future of certification – the need for additional knowledge
This report set out to investigate the value and effects of certification schemes in the Danish construction sector. As highlighted throughout the analysis, certification is not a single, fixed concept. Schemes differ in scope and ambition, they evolve over time, and they apply differently across building types. Combined with the wide range of potential economic, environmental and social outcomes, certification represents a complex and moving area of study.
A full assessment of every potential effect would therefore require extensive data and long-term tracking. At present, several key datasets are either incomplete, inaccessible or simply not collected for certified and non-certified buildings. These limitations especially affect areas where systematic outcome measurements do not exist, making some types of direct effect evaluation impossible with current data.
Despite these constraints, the analyses in this report provide the most robust picture currently possible of certification’s value and mechanisms in Denmark. At the same time, the demand for more detailed and comprehensive knowledge will only increase as certification becomes more widespread and regulatory expectations rise.
Based on the insights from this project, we outline a set of recommendations that can help advance future knowledge on the effects of certification below. These are not exhaustive, but they reflect the areas where better data, methods, or collaboration would make the greatest difference for understanding certification’s long-term impact.
Knowledge demand – future advances in understanding certification effects
As the demand for quantitative robust, quantitative evidence on the effect of building certification remain high, several additional analyses will become possible as data availability improves. Some developments are already underway, while others are still in early stages Advancing knowledge in these areas would require targeted effort and collaboration actors in the built environment. environment.
Economic effect
1
WTP for green attributes: We identify a clear demand for understanding the sustainable attributes – whether related to social or environmental aspect of certification – that building users are willing to pay for A dedicated Willingness to Pay (WTP) study - potentially supported by hedonic regression – could be used to identify which specific building attributes end users value most
2
Construction cost analysis: To evaluate the costs associated with certification, a comparative construction cost study is required using consistent and verifiable data for both certified and non-certified buildings. Reliable cross-project cost data is essential to isolate the incremental cost of certification.
3
Operations cost analysis: To understand whether variable costs of certified assets differ from non-certified, it is necessary to systematically gather data on insurance premiums, financing terms (including green loans), maintenance expenses etc. for certified and non-certified buildings.
4
Transaction analysis: To better understand how investors value certified buildings, transaction-based studies could be pursued once a larger number of certified building sales have been recorded. A longer time horizon is required to ensure statistically sound comparisons of price differentials.
Environmental effects
5
Comparative LCA analysis: With the introduction of LCA-requirements in building regulations, the missing link of obtaining comparable emissions data for certified and non-certified buildings are underway. Once additional relevant buildings under BR18 (2023) are finished, an evaluation of certifications effect on emissions will be possible.
6
Comparative biodiversity analysis: With work underway to develop a unified metric for the quality of biodiversity in the built environment. This requires both the development of the metric – and uptake of its use for both certified and non-certified buildings.
Social effects
7
Direct end-user effect measurement: The effect of end-user well-being, health or productivity could be measured directly. Possible analyses include field measurements of social factors such as air, noise or chemical exposure. Evaluating health and productivity effects could be made using register-based analyses – following cohorts of individuals inhabiting certified and non-certified buildings, comparing e.g., sick-leave.
8
Socioeconomic effects: While the scope of this report have been narrow – effects for owners or investors, or end-users, certification also has a distinct socioeconomic effect - such as reduced environmental burdens, improved public health, or enhanced resilience. Such beneficial effects are not necessarily part of an investment case – but is a fundamental value driver of certification.
A1: Regression output, residential buildings.
Note: Own calculation based on data from EjendomDanmark, BBR and certification providers. SE’s clustered at BFElevel (building). ***p<0,01, **p<0,05, *p<0,1. Building controls include total floor area, building age and building age squared. Unit controls includes number
and
A2: Regression output, non-residential buildings.
Note: Own calculation based on data from EjendomDanmark, BBR and certification providers. SE’s
level (building). ***p<0,01, **p<0,05, *p<0,1. Building controls include total floor area, building age and building age squared. Unit controls includes number of baths, rooms, unit type, floor and terrace floor area. See also box 3.1.
A3: Descriptive statistics by certification status – Residential sample
A4: Descriptive statistics by certification status – Non-residential sample
A5: Regression output, office buildings.
Note: Own calculation based on data from EjendomDanmark, BBR and certification providers. SE’s clustered at BFElevel (building). ***p<0,01, **p<0,05, *p<0,1. Building controls include total floor area, building age and building age squared. Unit controls includes number of baths, rooms, unit type, floor and terrace floor area. See also box 3.1.
Note: Nordic Swan 4.6 for residential buildings compared to BR18 (2025). A BR18 compliant building would not fulfil any of the included requirements. Source: own construction based on Ecolabelling Denmark. See Nordic Swan Ecolabel criteria (V 4.6) for specific requirements.
A7: BR18 compliance and DGNB points – comparison (enviromental)
Note: DGNB 2025 for residential buildings compared to BR18 (2025). A BR18 compliant building would obtain points in the specific criteria for surface water criteria and building site chemicals. Source: own construction See DGNB manual (2025) for specific requirements.
Note: Nordic Swan Ecolabel 4.6 for residential buildings compared to BR18 (2025). A BR18 compliant building would achieve points in O34. For 035 a BR-compliant building could in principle fulfil requirements, if the 10% rule for daylight is not used (one of 2 options). For O36, A BR compliant building achieves points – however, simulations are required for certain building types under the Nordic Swan Ecolabel. Source: own construction based on Ecolabelling Denmark. See Nordic Swan Ecolabel criteria (V 4.6) for specific requirements.
A9: BR18 compliance and DGNB points – comparison (Social)
Note: DGNB 2025 manual for residential buildings compared to BR18 (2025). A BR18 compliant building would achieve points within daylight on relevant floor area, soundproofing, thermal indoor climate, climate controls, site chemicals, and part of mobility initiatives. Ecolabel. Source: own construction based on Ecolabelling Denmark. See DGNB manual (2025) for specific requirements.