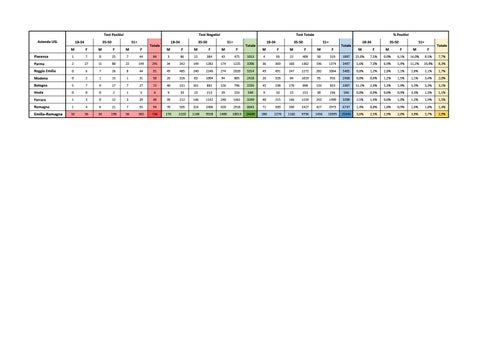
Test Positivi Azienda USL
18-34 M
Test Negativi
35-50 F
51+
M
F
M
F
Totale
18-34 M
Test Totale
35-50 F
M
51+ F
M
F
Totale
18-34 M
% Positivi
35-50 F
M
51+ F
M
F
Totale
18-34
35-50
51+
M
F
M
F
M
F
Totale
Piacenza
1
7
0
25
7
44
84
3
86
22
384
43
475
1013
4
93
22
409
50
519
1097
25,0%
7,5%
0,0%
6,1%
14,0%
8,5%
7,7%
Parma
2
27
11
80
22
149
291
34
342
149
1282
174
1225
3206
36
369
160
1362
196
1374
3497
5,6%
7,3%
6,9%
5,9%
11,2%
10,8%
8,3%
Reggio Emilia
0
6
7
26
8
44
91
49
485
240
2246
274
2020
5314
49
491
247
2272
282
2064
5405
0,0%
1,2%
2,8%
1,1%
2,8%
2,1%
1,7%
Modena
0
2
1
15
1
31
50
26
326
83
1004
94
885
2418
26
328
84
1019
95
916
2468
0,0%
0,6%
1,2%
1,5%
1,1%
3,4%
2,0%
Bologna
5
7
9
17
7
27
72
40
231
161
881
126
796
2235
45
238
170
898
133
823
2307
11,1%
2,9%
5,3%
1,9%
5,3%
3,3%
3,1%
Imola
0
0
0
2
1
3
6
9
33
23
213
29
233
540
9
33
23
215
30
236
546
0,0%
0,0%
0,0%
0,9%
3,3%
1,3%
1,1%
Ferrara
1
3
0
12
3
29
48
39
212
146
1142
240
1461
3240
40
215
146
1154
243
1490
3288
2,5%
1,4%
0,0%
1,0%
1,2%
1,9%
1,5%
Romagna
1
4
6
21
7
55
94
70
505
324
2406
420
2918
6643
71
509
330
2427
427
2973
6737
1,4%
0,8%
1,8%
0,9%
1,6%
1,8%
1,4%
Emilia-Romagna
10
56
34
198
56
382
736
270
2220
1148
9558
1400
10013
24609
280
2276
1182
9756
1456
10395
25345
3,6%
2,5%
2,9%
2,0%
3,8%
3,7%
2,9%