COVID-19 Community Mobility Report
Italy March 29, 2020 Mobility changes Google prepared this report to help you and public health officials understand responses to social distancing guidance related to COVID-19. This report shouldn’t be used for medical diagnostic, prognostic, or treatment purposes. It also isn’t intended to be used for guidance on personal travel plans. Location accuracy and the understanding of categorized places varies from region to region, so we don’t recommend using this data to compare changes between countries, or between regions with different characteristics (e.g. rural versus urban areas). We’ll leave a region out of the report if we don’t have statistically significant levels of data. To learn how we calculate these trends and preserve privacy, read About this data. Retail & recreation +80%
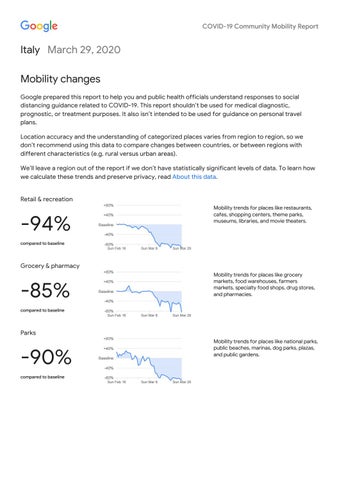
-94% compared to baseline
Mobility trends for places like restaurants, cafes, shopping centers, theme parks, museums, libraries, and movie theaters.
+40% Baseline -40% -80%
Sun Feb 16
Sun Mar 8
Sun Mar 29
Grocery & pharmacy +80%
-85% compared to baseline
Mobility trends for places like grocery markets, food warehouses, farmers markets, specialty food shops, drug stores, and pharmacies.
+40% Baseline -40% -80%
Sun Feb 16
Sun Mar 8
Sun Mar 29
Parks +80%
-90% compared to baseline
Mobility trends for places like national parks, public beaches, marinas, dog parks, plazas, and public gardens.
+40% Baseline -40% -80%
Sun Feb 16
Sun Mar 8
Sun Mar 29