29 minute read
Research

from Energy Audit Report
by Maryam Azim
Alfaisal University is a private institute of higher education located in Riyadh, Saudi Arabia. It first opened its doors and admitted its first 80 students in 2008. Alfaisal's total enrollment now exceeds 2500. The enrollment is 67% Saudi National with the remaining 33% being students from over 40 other nations. The total number of faculty is nearly 200 with international faculty from 31 countries. The whole campus surrounds the previous manor of King Faisal, with a total area including the landscape of around 1,400,00m2, that is showing that is nothing but growing in time.
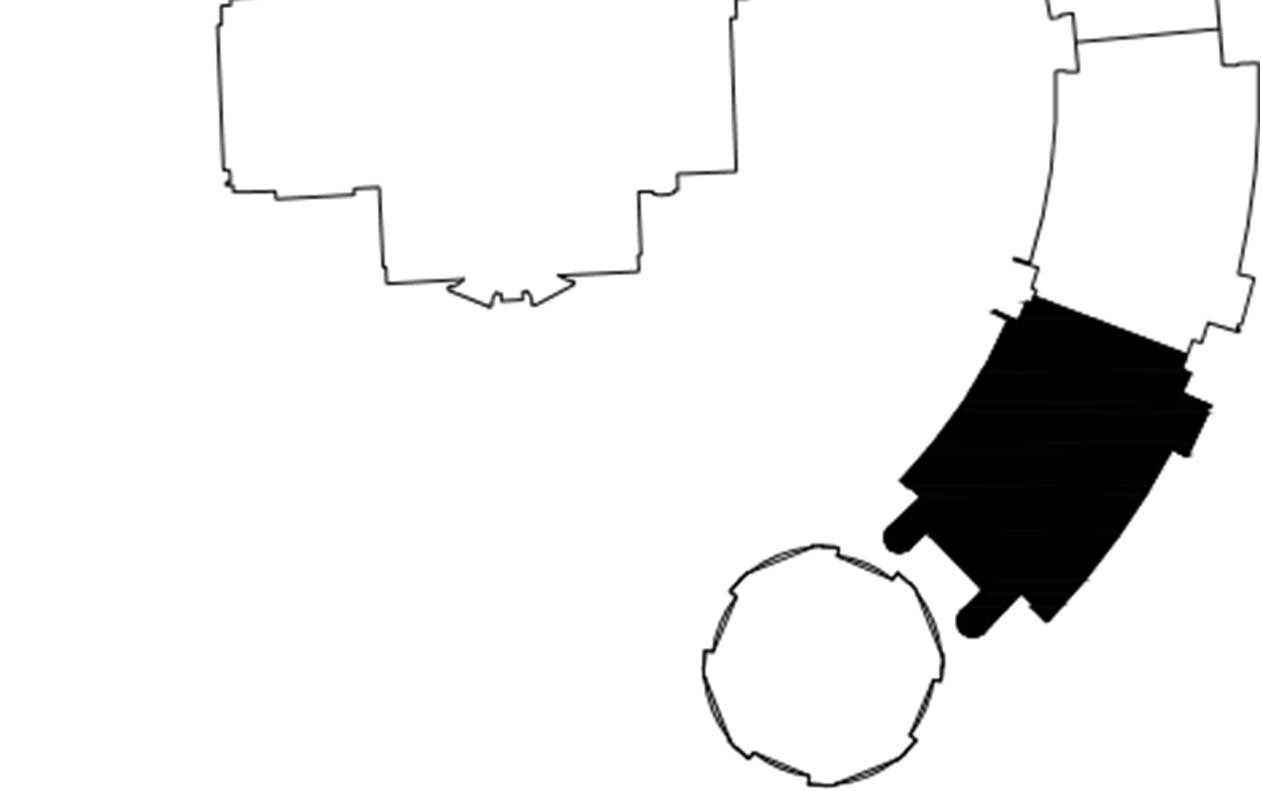
Fig. 2.1
Advertisement
The above figure shows the masterplan of the university, with size of areas. However, construction has not yet been completed in certain areas, like areas number 6,7,10, and 11.
11
Fig 2.2
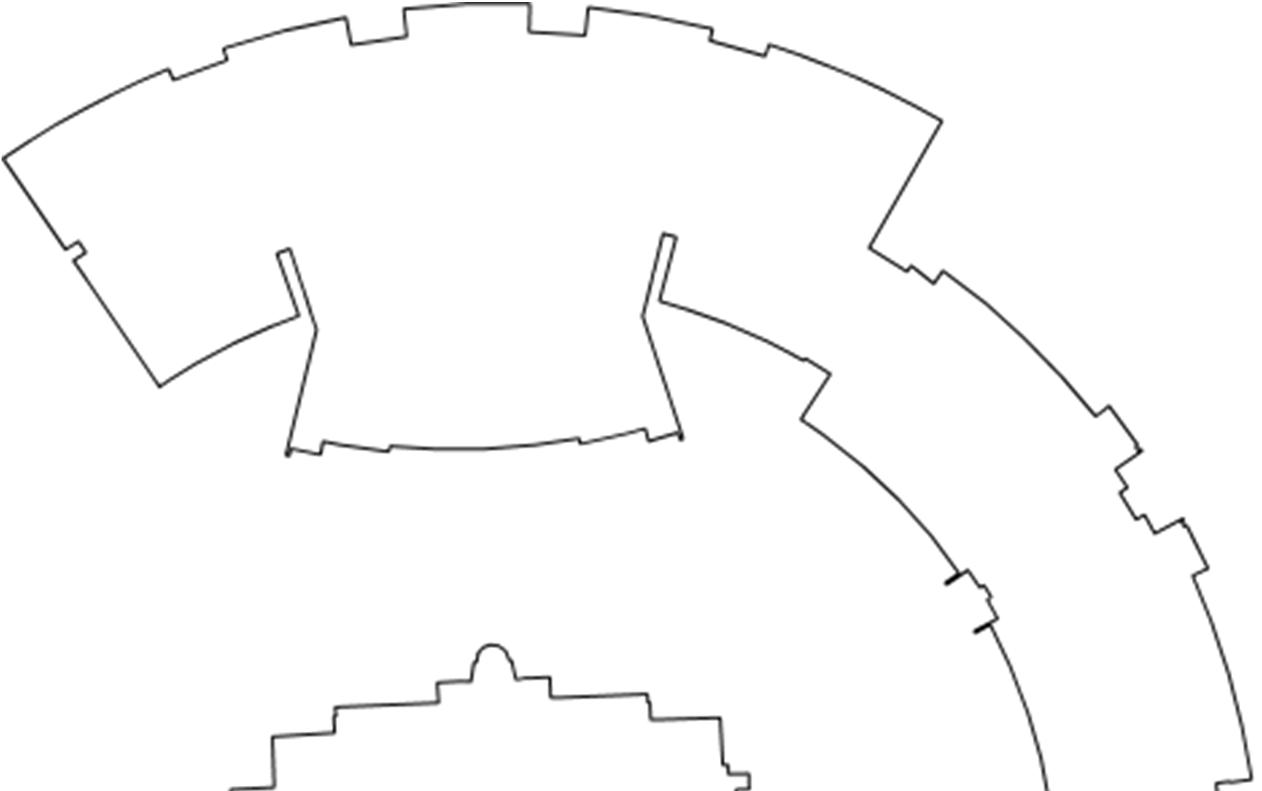
The above figure shows the actual built construction. As such, the building has been divided into several sections/zones, each of which will be thoroughly analyzed by different groups of students: The atrium, a central vein across the college buildings. Female student center zone Female zone of the library Southern end of the College of Science While our group will be focusing on analyzing the south end of the constructed part of the university, which is around the area located opposite the mosque.
12
Research analysis
This report will focus on the last section - south zone, encompassing the College of Science.
Auditorium
N
Manor COB
COS
Mosque
Fig 2.3
The zone consists of the atrium running through the center of the college, with classroom clusters on east and west sides, as well as a curtain wall facing the south with a view to the mosque.
13
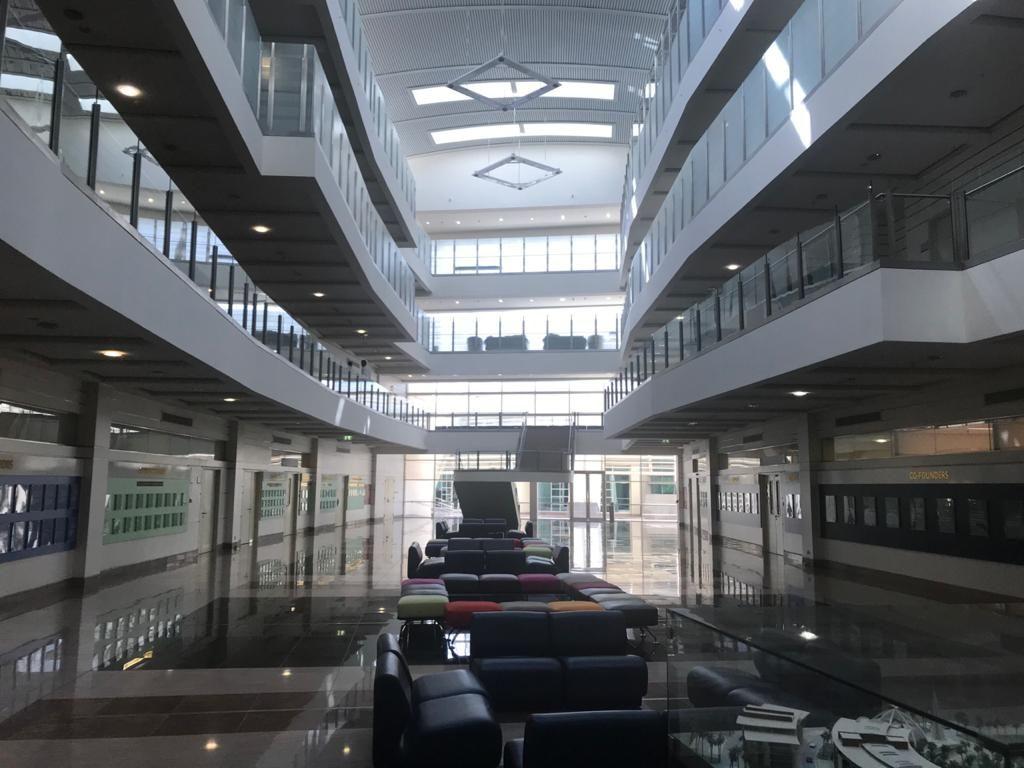
Image 2.2 Image 2.3
Image 2.1
Images 2.1-2.3 introduce the zone on the second floor, showing the clusters of classrooms down the corridors, the south-facing fenestration,and the opaque glass that protects the female student body from male visual access.
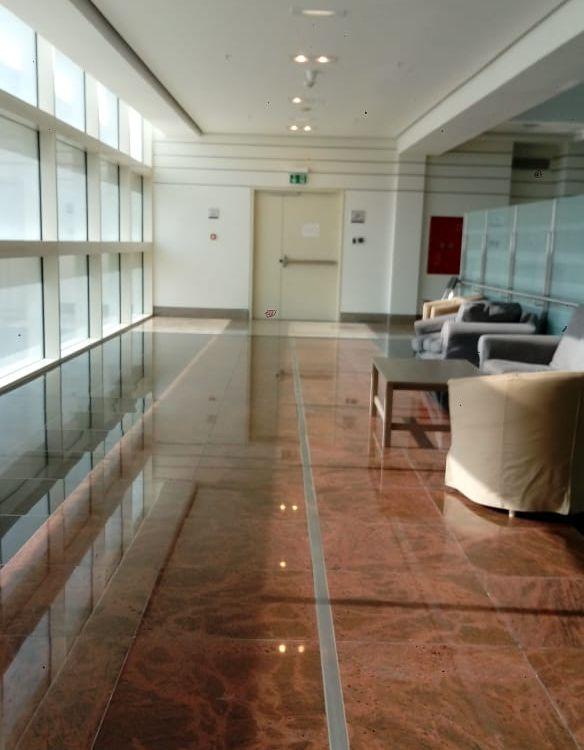
Image 2.4 shows all the floors and the curtain wall facing the south, from the ground floor. This area was chosen so as to continue from the Atrium section to the Image 2.4 end of the university, allowing continuity and completeness of study on the university. Classrooms on the 1st floor S1.31 to S1.39 on along the east façade, and the mirrored classrooms across the west, were chosen to be within limits. The area on the 1st floor is repeated throughout ground, second and third floors as our zone of study – along with the part of the atrium overlapping in this area, so as to be able to understand the range of factors and occurrences taking place in this zone, along with interrelation of factors and experiences. The area on the 1st floor is mirrored on the 2nd aka the female floor, since both floors open to the same classrooms they share the same lighting systems. Whilst the ground and 3rd floors are composed of faculty offices and laboratories. To be able to understand the range of factors and occurrences taking place in this zone, along with interrelation of factors and experiences ,This report will focus on gathering data to better understand how to intervene, from user surveys, facility interviews and statistics, as well as energy audit and relevant calculations. There will also be an attempt to understand how the campus consumes water from its underground source, and whether or not it would be possible to conserve more water. According to contemporary solutions and analysis of secondary research, interventions for the issues found will be provided.
14
There will also be an attempt to understand how the campus consumes water from its underground source, and whether it would be possible to create a water conservation system. According to contemporary solutions and analysis of secondary research, interventions for the issues found will be provided.
15
BUILDING OPERATIONAL MANAGEMENT
In order to handle the different issues and understand properly what we need to deal with, we must know and assess the way the building performs and operates. In order to do so, an interview was conducted with the facility department manager, Eng. Malek, and found the following:
HVAC & Atmospheric Comfort:
The system that consumes the most energy on campus than anything else is the HVAC system. This is because all rooms, in general, need HVAC operations, at least 10-15 hours every day. Additionally, there are some zones that need 24/7 HVAC - certain labs in the College of Science and College of Engineering that need to be cooled constantly. Upon inquiring why some lights are left turned on, whilst the HVAC system is running even if the spaces are unoccupied, we found that the Facility department receives a weekly operational schedule from Student Affairs, detailing which rooms will be used, during which time periods. Therefore, Facility must begin operations in those rooms a preparatory interval before those time periods through the BMS, to ensure the room is comfortable for use by the time occupants start entering. There is also the fact that students also book additional rooms for study/meetings/events, etc., beforehand, but in case of class cancellation, or meeting/event cancellation, Facility is rarely notified, so HVAC and lighting systems are still running at those areas even in times of vacancy. Another problem that users come across is the inadequacy of the HVAC system – there are times when a temperature of 25oC would be more appropriate, but instead users experience a temperature well below 20oC – and vice versa. Whenever users notify the Facility department, there is rarely a change detected. When faced with this question in the interview, Eng. Malek explained that the reason for temperature being this low in the first place, is because the first scheduled lectures usually are for College of Medicine, with many occupants. Therefore, more occupants in a certain volume of space (classroom) will require more HVAC systems to be running in order to cool said space to a comfortable temperature. When lectures with fewer occupants follow up, the temperature will be perceived to be too cold, since fewer occupants require a higher temperature and less HVAC work to achieve a comfortable state. Therefore, temperatures can be too cold based on the first-come first-serve number of occupants per classroom. About the issue regarding Facility’s reaction to notifications: there are innate structural/systemic design issues, some zones share an AHU, whereas others are solely provided for by a single AHU. When there are multiple zones linked to an AHU, then the request of one room cannot be accommodated, without disturbing the other zones. Therefore, HVAC settings can only be changed upon notification by Facility, if the zone is either solely served by an individual AHU, or if all zones linked to a single AHU demand the same conditions. Since the latter does not occur oftentimes, the conditions must stay as they are, to accommodate the greatest number of people possible.
16
We also asked the Facility department about their implementations to save energy/cost, if any. They answered that they have set seasonal temperatures - a specific regular temperature in winter, and another one for summer. However, they are subject to continuous alterations due to occupant requests for change. There are also time-restrictions; they have coordinated with the library team, requested their official timings, and scheduled the HVAC and lighting systems to be running according to those timings, with the BMS. We have programmed those services in a way that subtly directs traffic and concentration of occupants throughout the week, daily, and on the weekends as well. As such, on weekdays, lighting in the library starts from 7AM, and turns off at 11PM. Thursday is an exception with an earlier ending time, since it is the last day of the work week. On Fridays and Saturdays (the weekend), lights on the 3rd floor in the general library zone do not turn on, and HVAC is turned off. However, services are retained inside the library. Therefore, for students coming on the weekends and wishing to study, can redirect themselves from the area outside the library on the 3rd floor, into the library itself. This is more efficient, as HVAC and lighting services are activated to a smaller area, using less energy. This strategy has been implemented for 2 months now, and it has proved to decrease energy use and bills by 21%. There have also been other proposals by professors and students that were unable to become concrete, but they were also considered for implementation: Among past proposals, there has been an occupancy sensory design that would be placed in doorways, able to sense occupants entering and leaving, and therefore able to inform the BMS when to stop/start HVAC and lighting services to a certain room, depending on occupancy/vacancy. Currently there is a proposal regarding a ‘model room’ for faculty offices, depending only on light and occupancy sensors, allowing the light to turn and the thermostat to start working once occupancy is detected. The services will turn off once vacancy is detected. This proposal is still under review.
Water usage, disposal, and recycling:
It was found that the campus has its own groundwater source: a well. Water is not reused or recycled. Although there have been requests from Facility that were put forward to senior management, to be able to reuse white water (water from handwashing, ablution), to be used in flushing and irrigation, the requests have been denied. Water is not allowed to be reused or recycled for sanitary and monetary purposes. When asked about records for waste and classification, they answered that they do not have categorization of waste by material or weight, but they do have information on biohazard waste that they keep track of for College of Medicine and College of Science labs. What the BOM department concluded was that the overarching factor of a lot of decisions that could lead to either energy waste or efficiency is operational management. The functional departments across the university and the senior management are not in full collaboration/do not have an aligned view towards sustainability and user comfort as much as they could be, leading to decisions that are not as geared towards energy and cost saving as could be.
17
Facility is ready to spearhead different programs for energy efficiency while retaining optimum user comfort, but other departments are not as willing to collaborate on this vision as they priorities other activities, events and programs over sustainability on campus.
18
Observations and photographs
In this section, notes, observations and photographs of different issues found in the zone will be shown. The issues explored will be categorized both by general area, as well as by floor, as the zone encompasses the ground floor, the 1st floor, the 2nd floor, and the 3rd floor. The areas include: South Façade - exterior and interior (all floors) Fire stairwells (all floors) Classrooms and corridors - east and west (1st floor) Classrooms and corridors - east and west (2nd floor) Offices and corridors - east and west (3rd floor)
We will be analyzing the different images, taken a certain time period apart. To analyze the views depending on the different weather changes, users, and time of day taken.
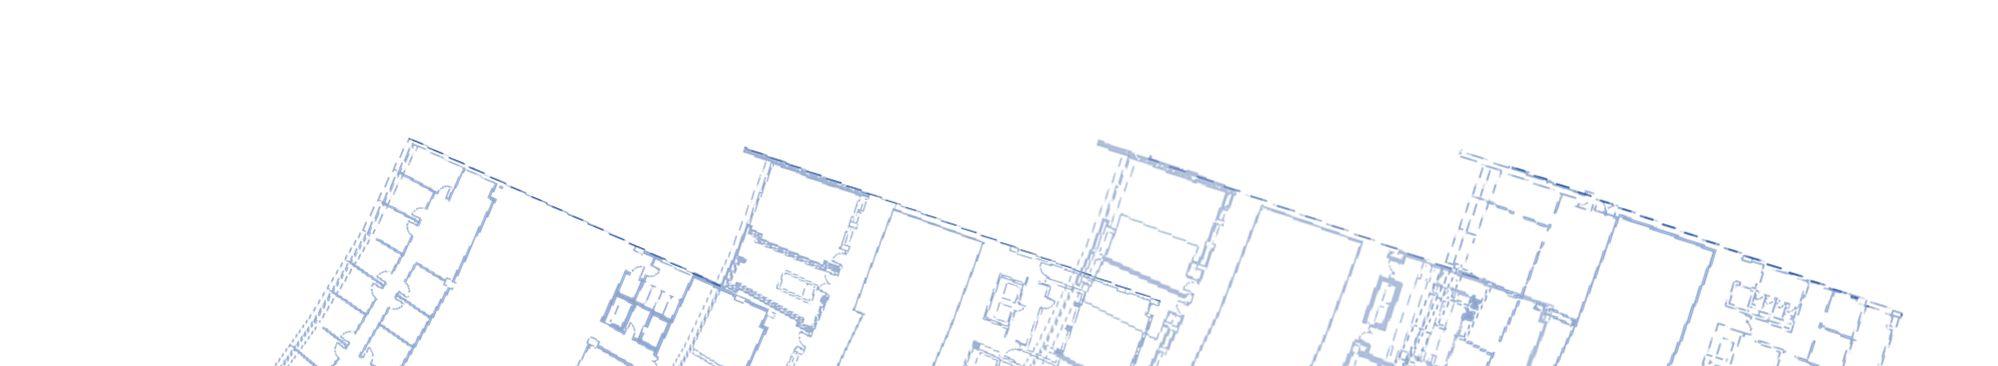
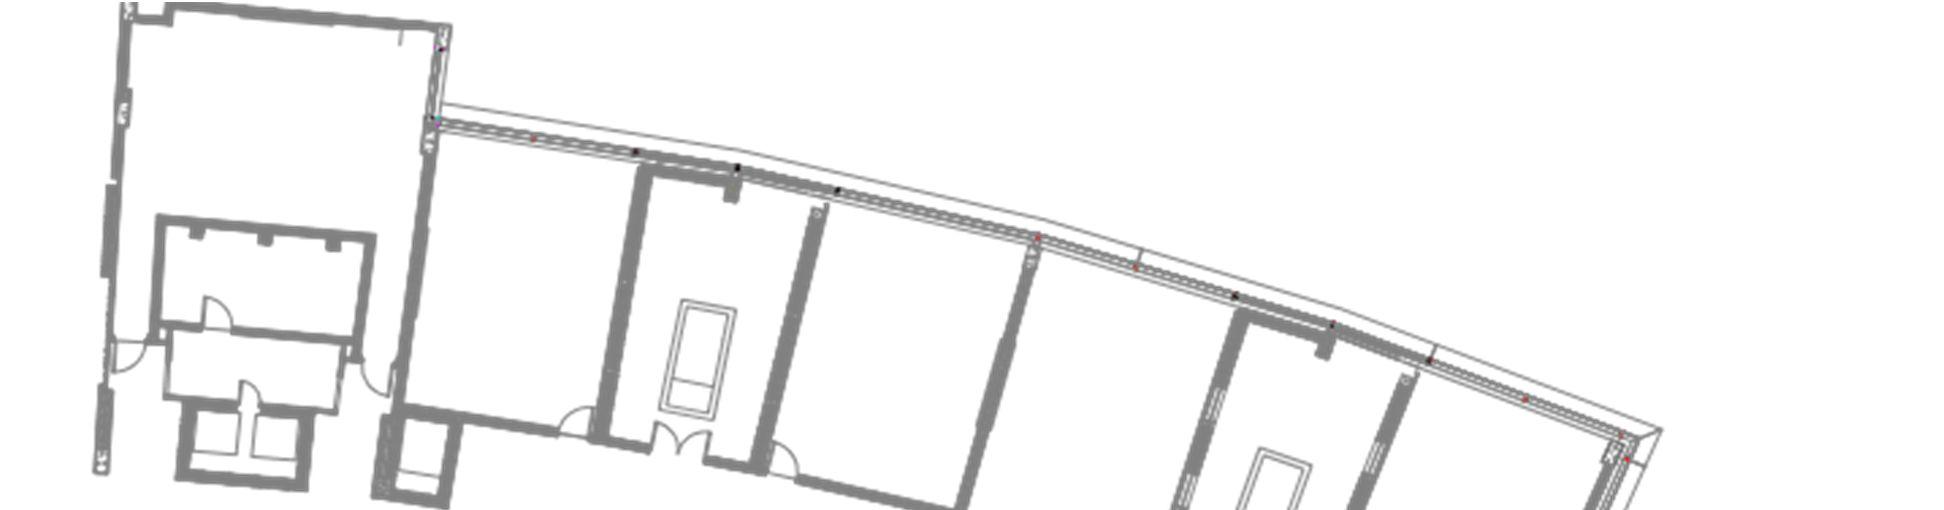
Fig. 3.1 Showing the plans of the floors in order, from left to right: (Ground floor – 1st floor – 2nd floor – 3rd floor)
19
Façade facing the mosque (all floors):


Fig. 3.2


20
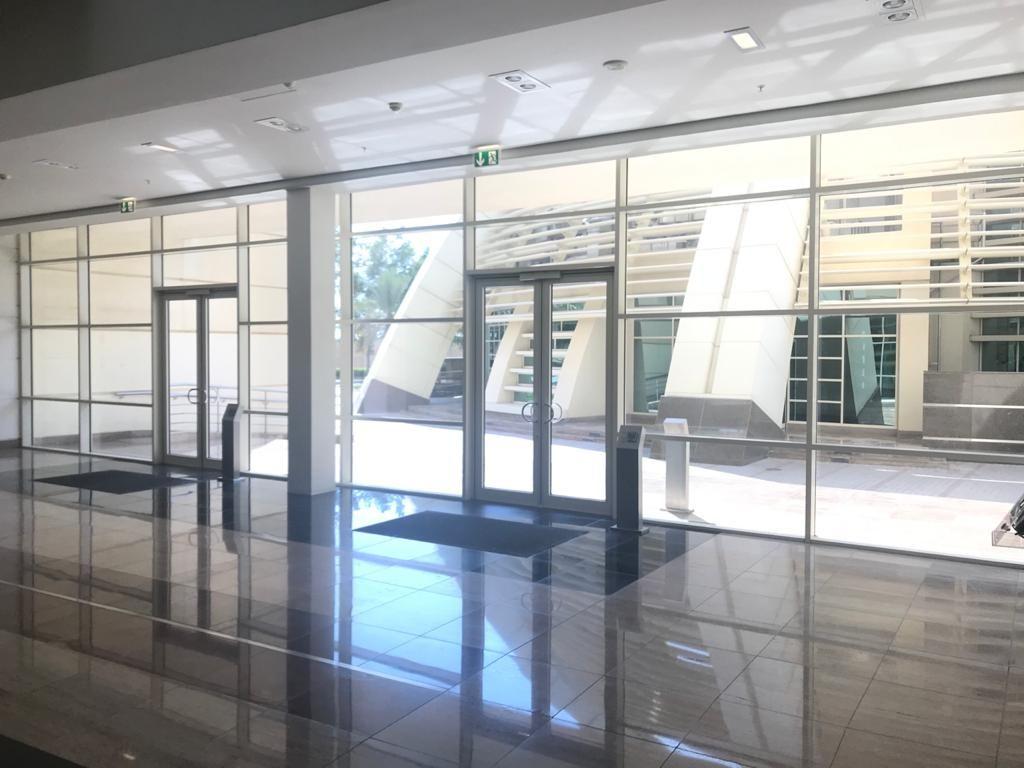
Image 3.1
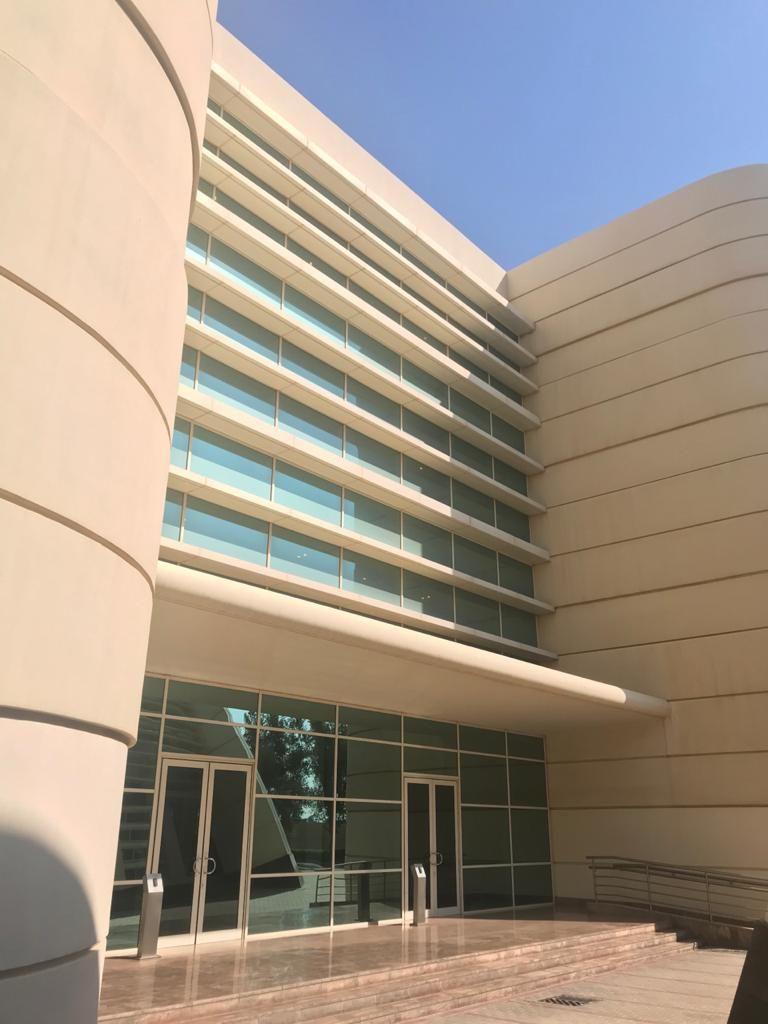
Image 3.2

Notes:
Image 3.1 shows that there is no double door air lock. The glass seems to allow an extreme amount of daylight into the building, which then gets reflected further into the space due to the reflective floor. This in turn renders the doorway spotlights obsolete.
Image 3.3

21
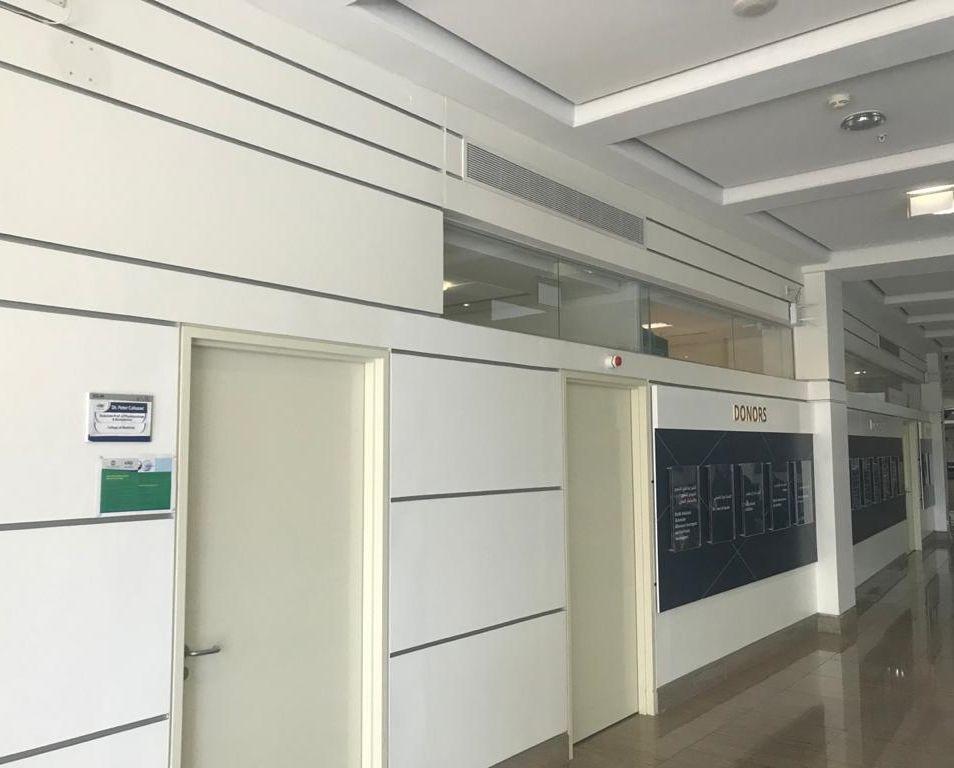
Façade facing the mosque (all floors):


Fig. 3.3


22
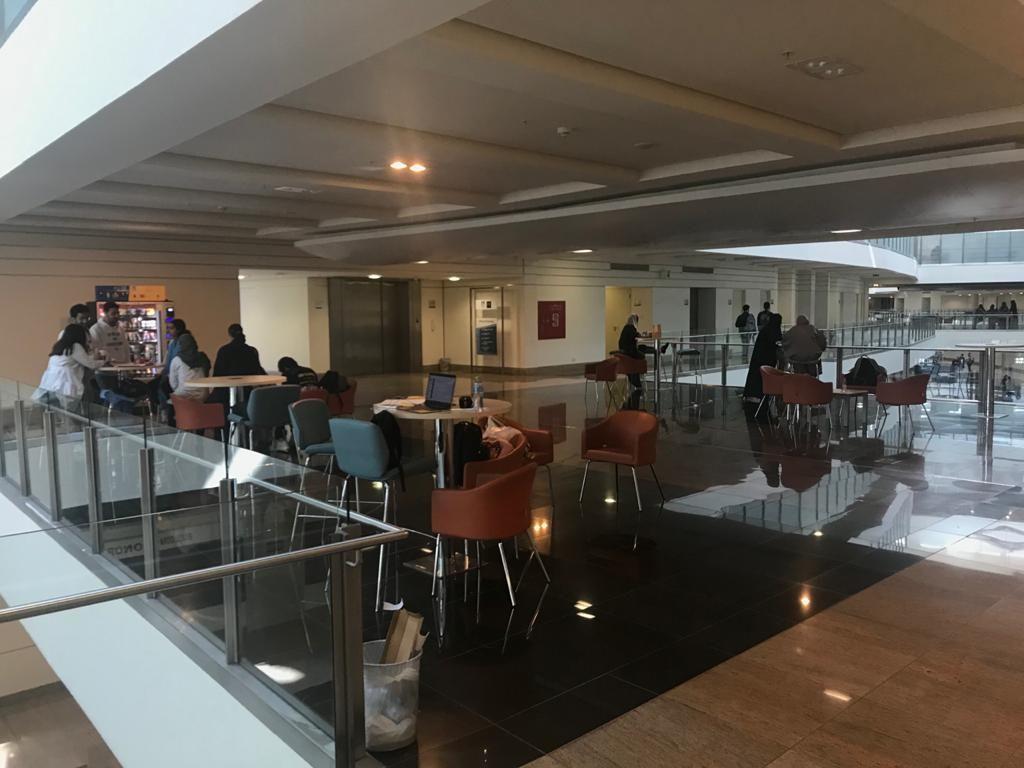
Image 3.4 First floor seating, populated on a cloudy day.
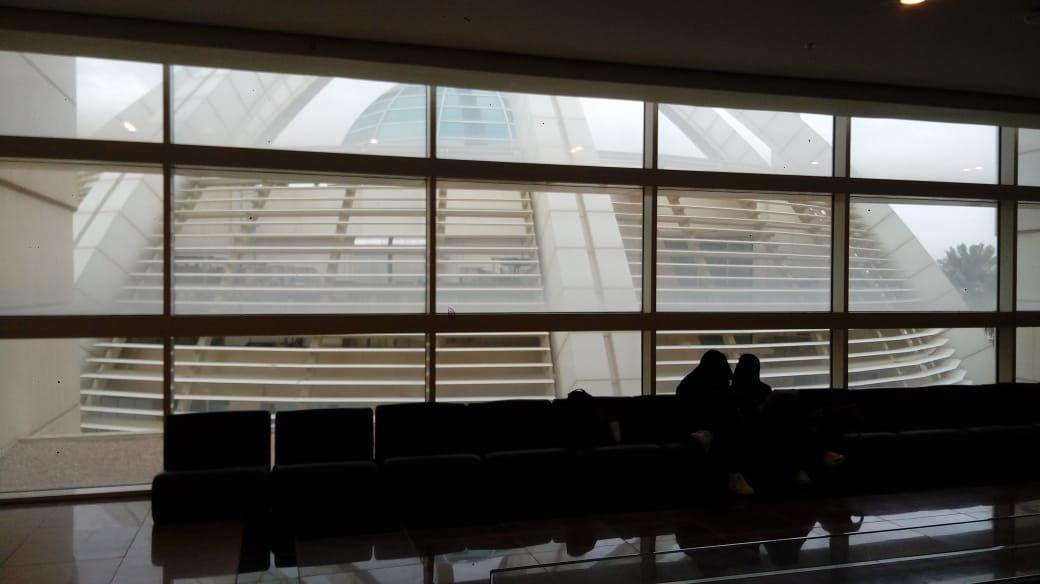
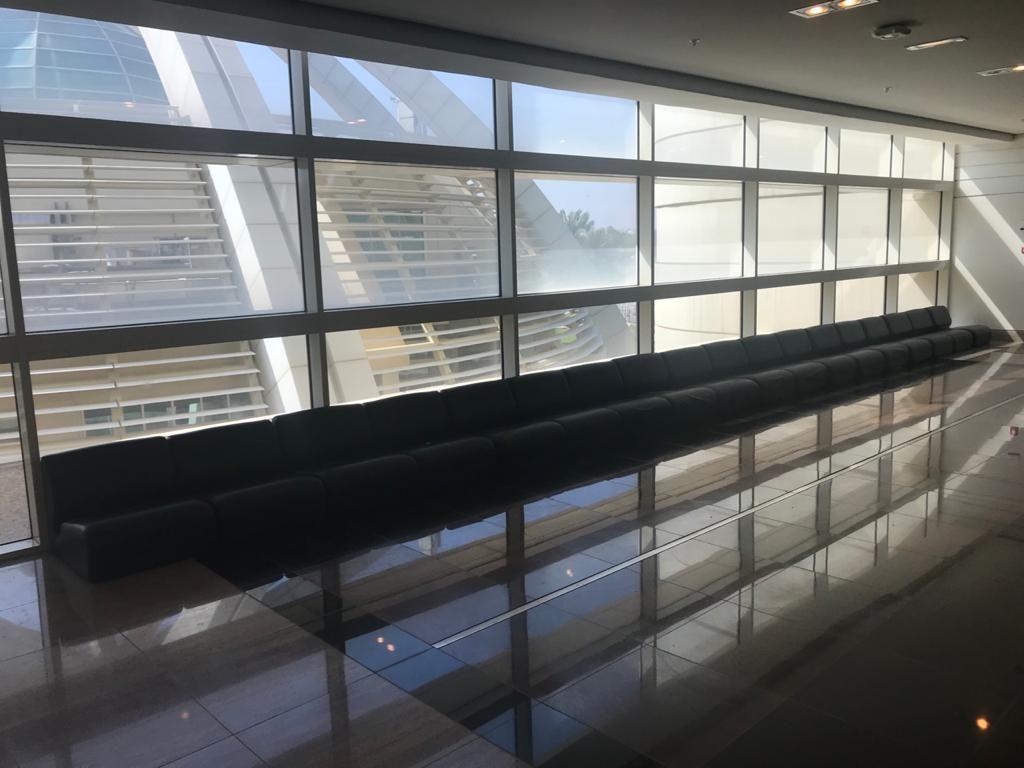
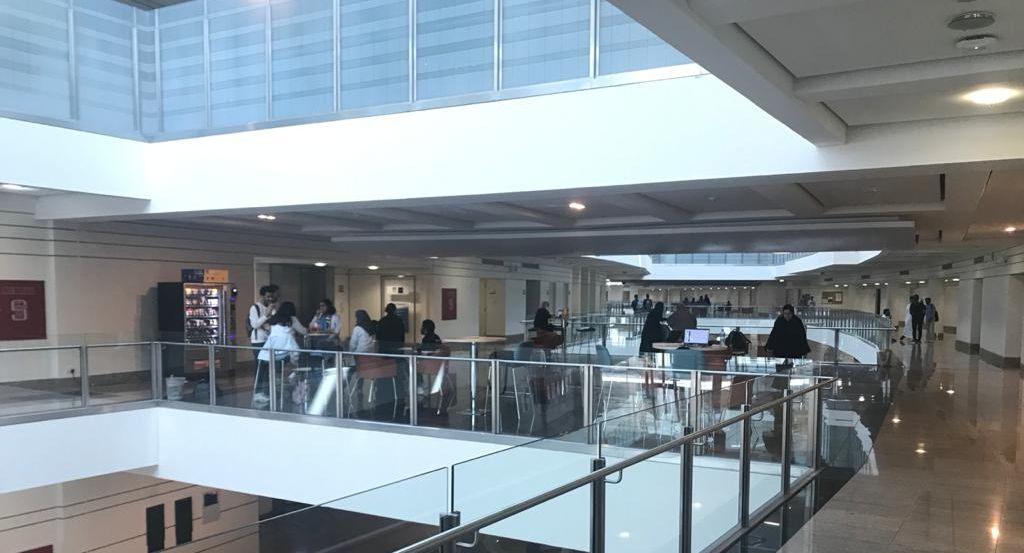
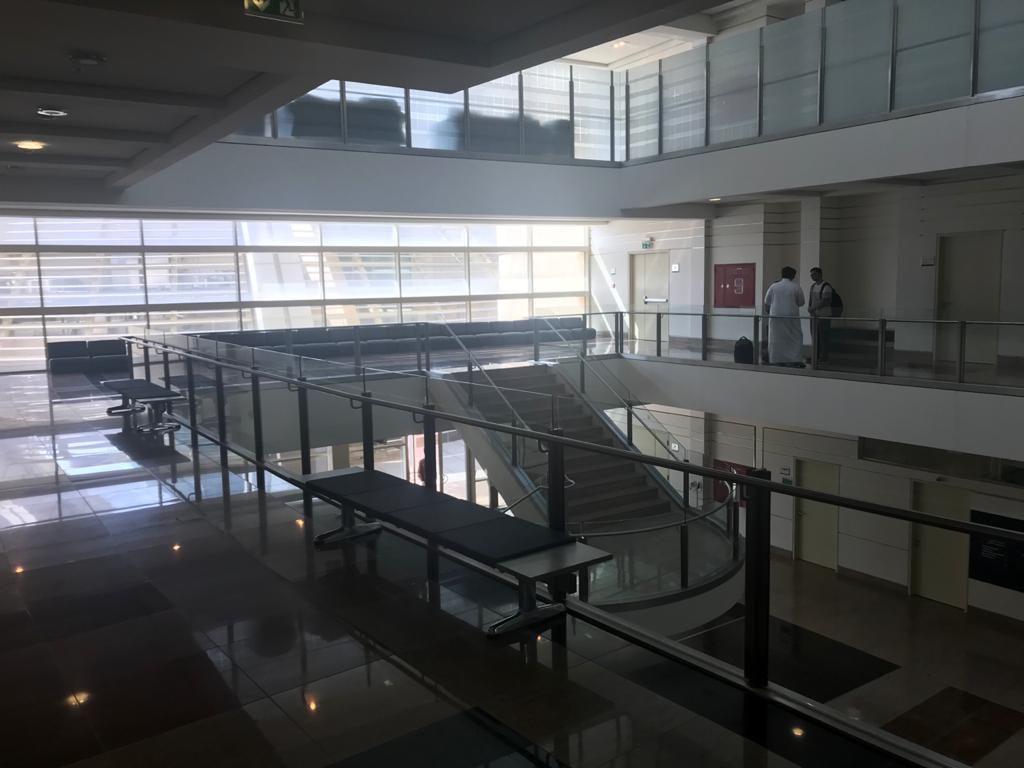
Image 3.5 People staying in the social bridge under the shade on a sunny day.
Image 3.6 First floor seating, deserted on a sunny day.
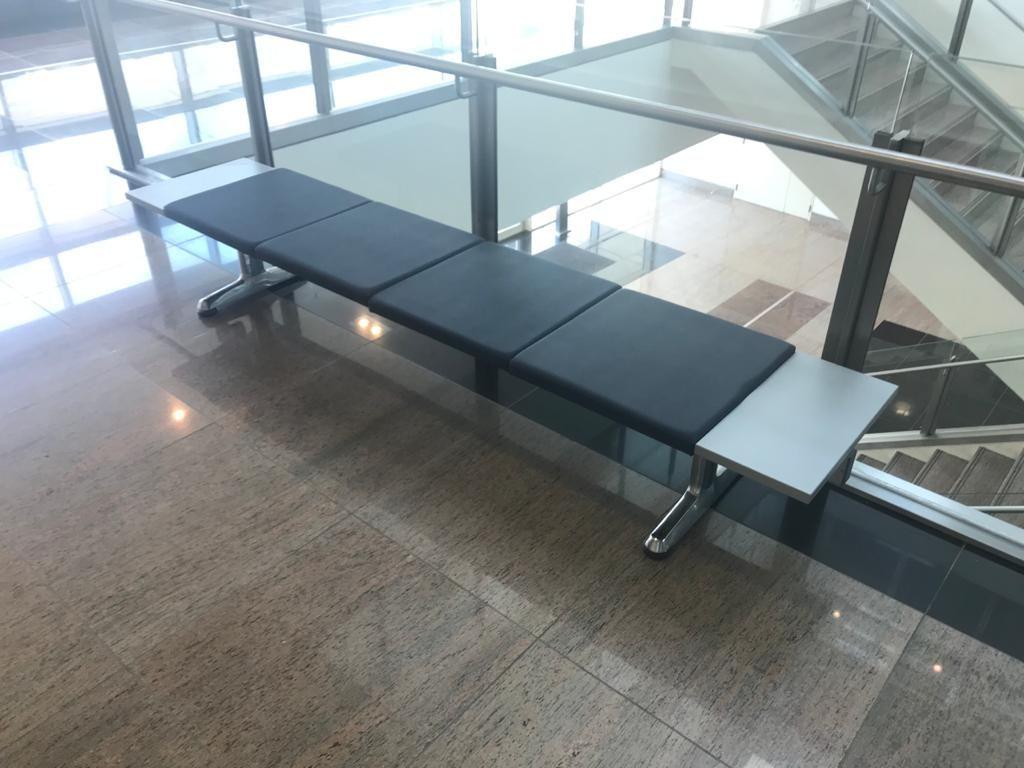
Image 3.7 People preferring to talk in the shade standing up as opposed to sitting on the couches.
Image 3.8 Extra benches near the glazing.
Notes:
The first floor has the greatest number of seats and spaces. However, they are positioned against the windows, which allows glare to reflect off users’ and allow heat in. Image 3.4 was taken during a rainy day, which is why it is occupied by students, as opposed to Image 3.6 and Image 3.7 which suggest that it is mostly empty during sunny days. Students tend to flock to the social bridge, to be under the shade, on sunny days – as seen in Image 3.5. Also, the HVAC system cuts off 4 meters before wall – as on the ground floor, and all floors above.
23
Façade facing the mosque (all floors):


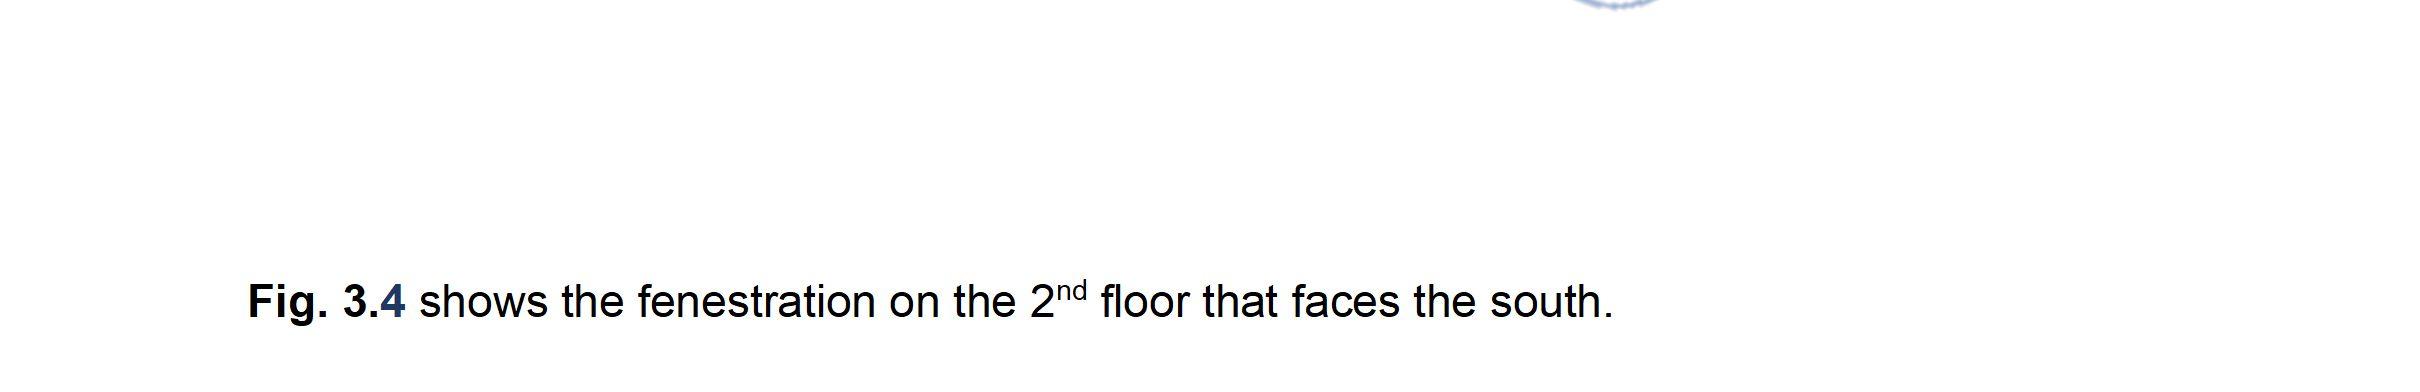
Fig. 3.4


24
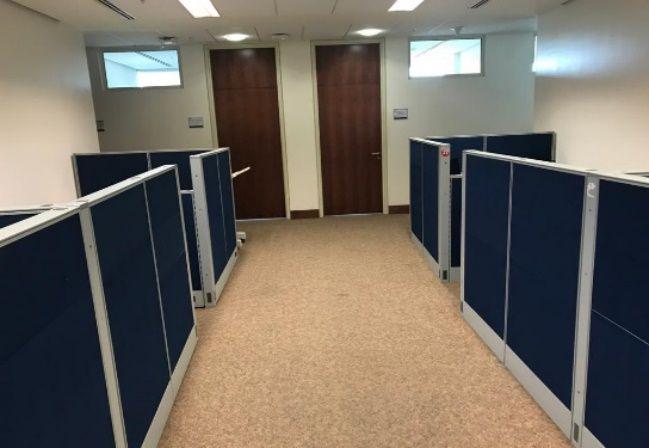
Image 3.9 2nd floor glazing, no users against the
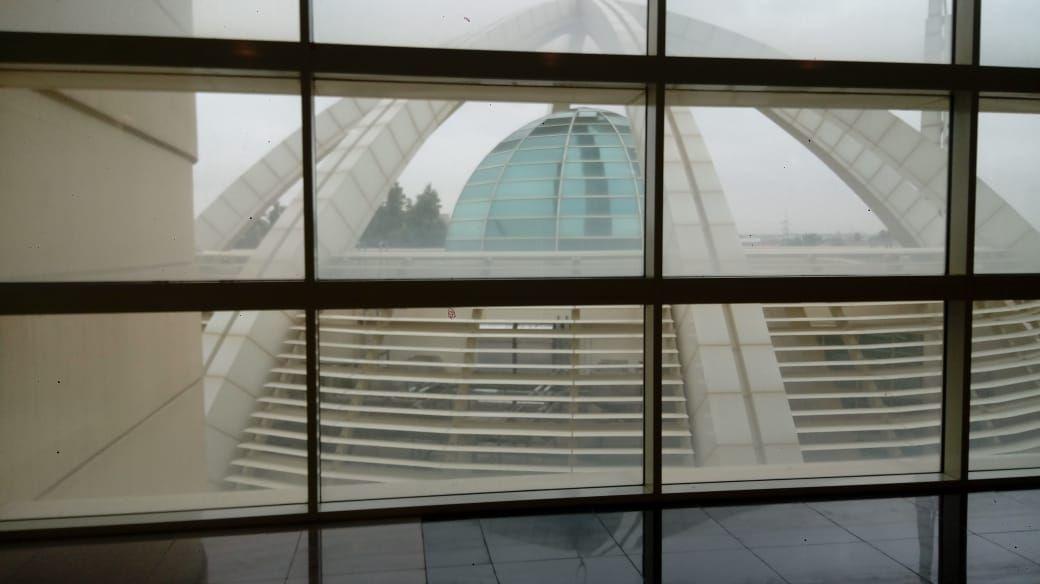


glazing, it is a sunny day.
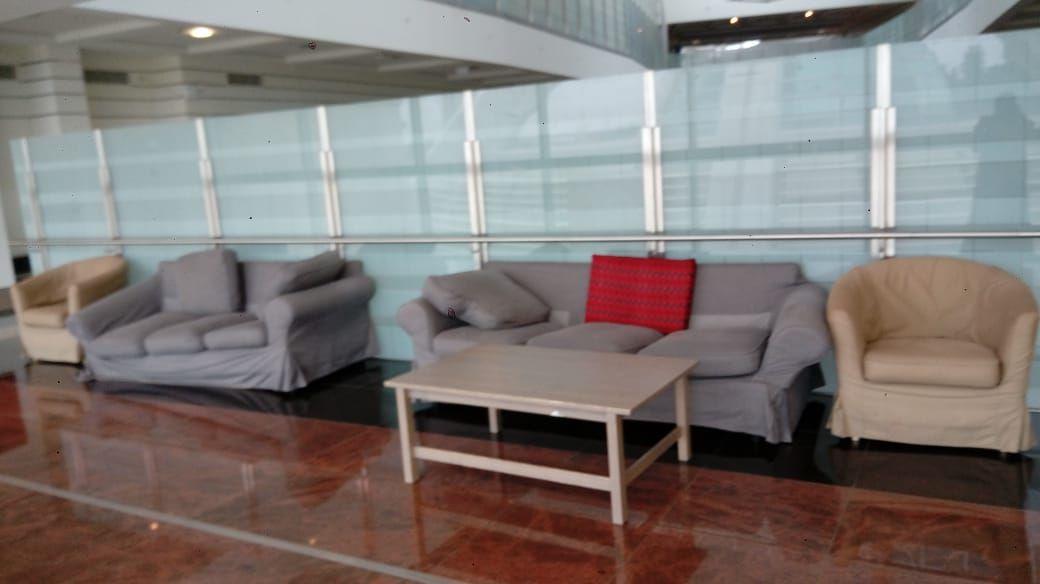
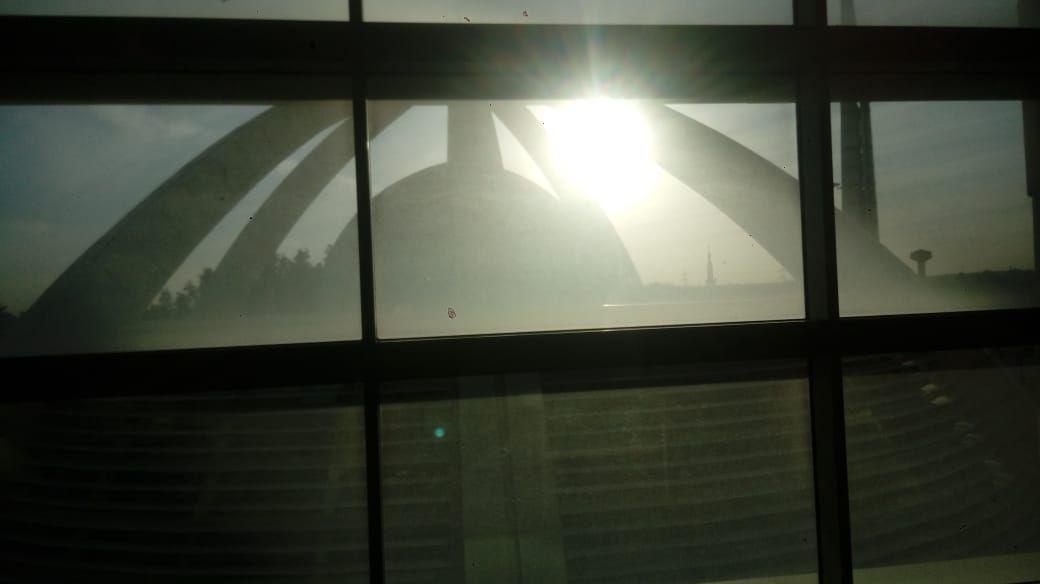
Image 3.10 2nd floor seating accommodations
Notes:
Image 3.10 shows multiple sofas, facing the glazing. This orientation of the furniture would enable users to view their working surfaces properly and not face too much glare. Unfortunately, they are all broken, and some are missing seats. The seating accommodation is not ergonomically healthy for users, and may partly be the reason this area sees such little traffic – heat and glare aside, even on cloudy days people don’t come here often. This could be because of the discomfort faced with the sofas.
25
Façade facing the mosque (all floors):


Fig. 3.5


26
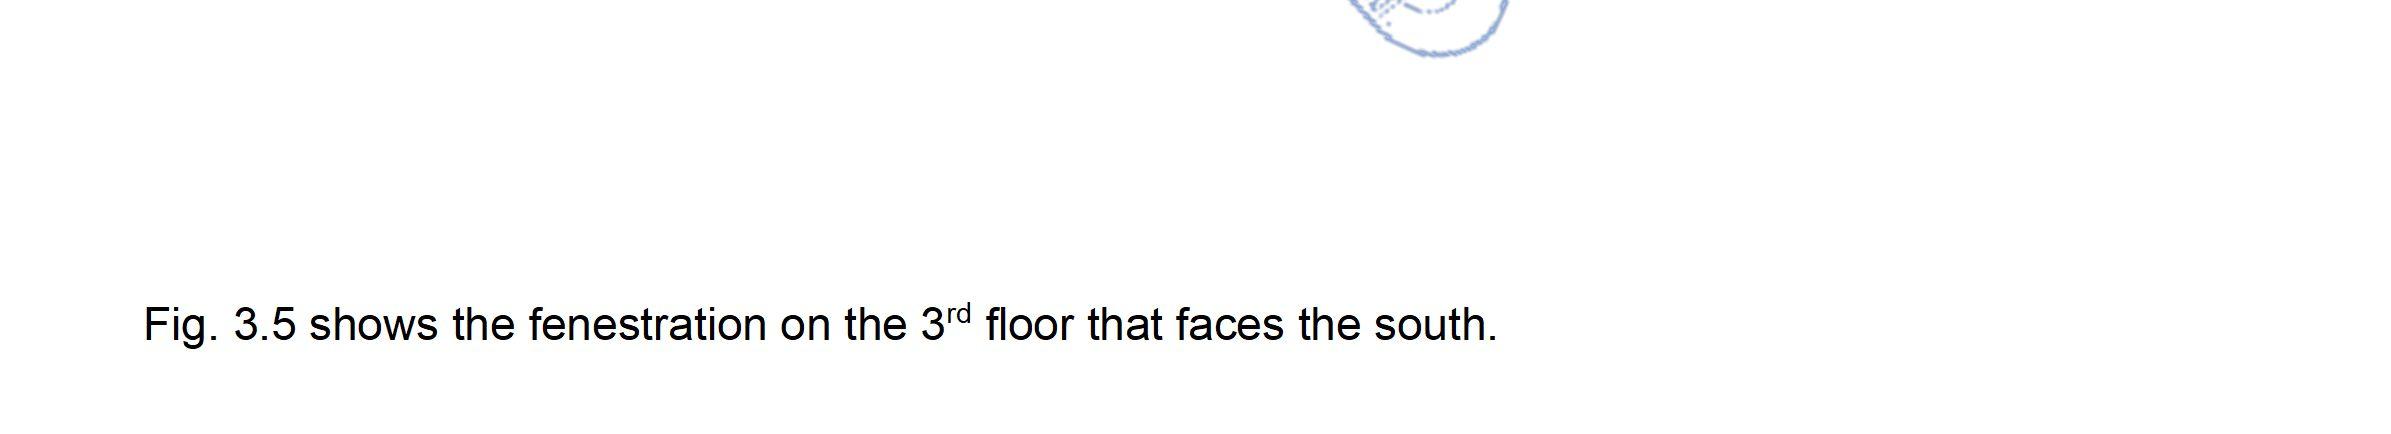
Image 3.11 3rd floor glazing, users requested not to be included.
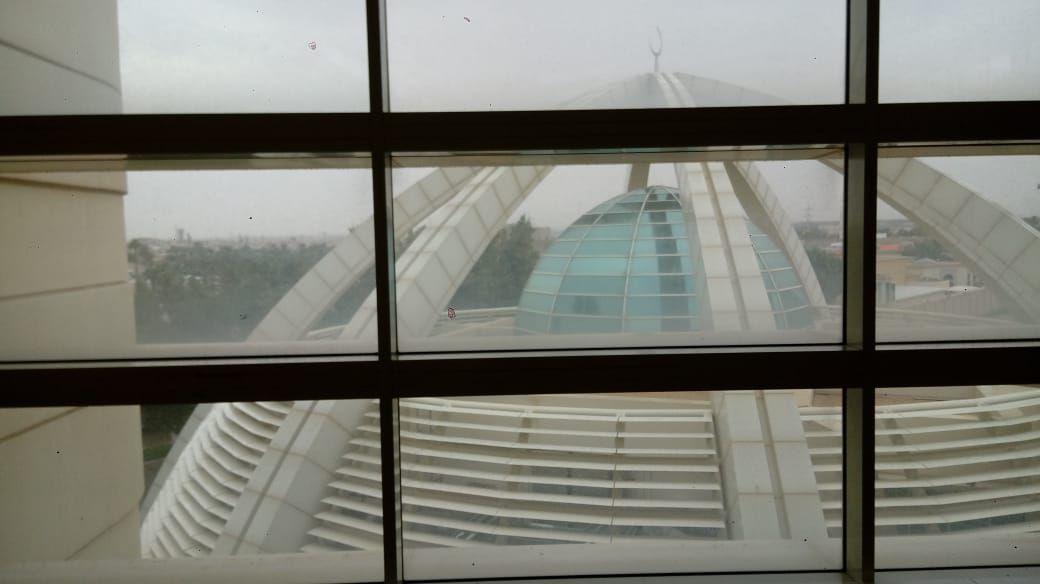
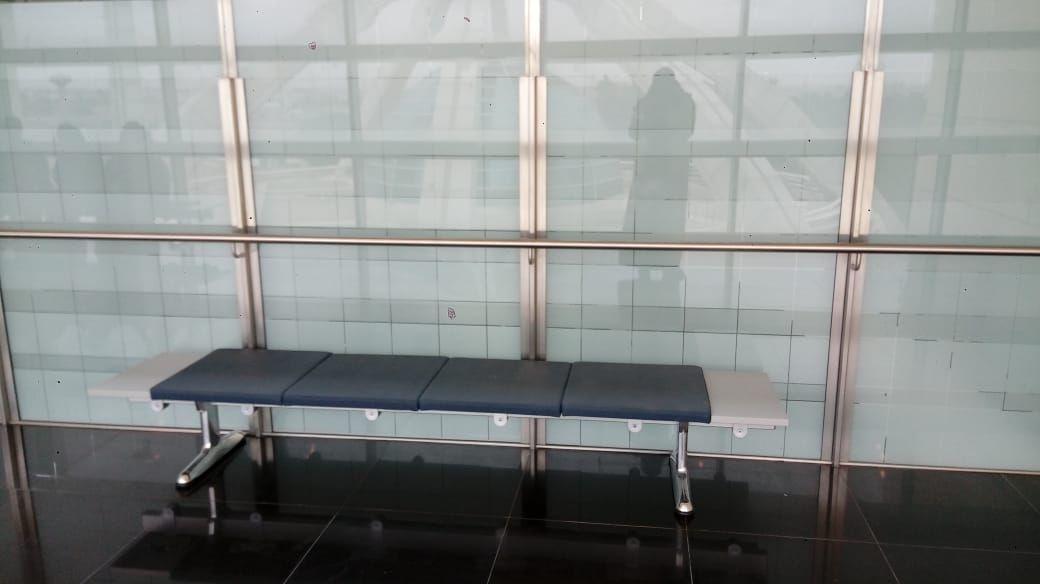
Image 3.12 3rd floor seating as shown.
Notes:
There are two narrow, hard benches, each with a capacity of 4 people. They grow increasingly uncomfortable to sit on as hours pass.
27
Fire stairwells (all floors):
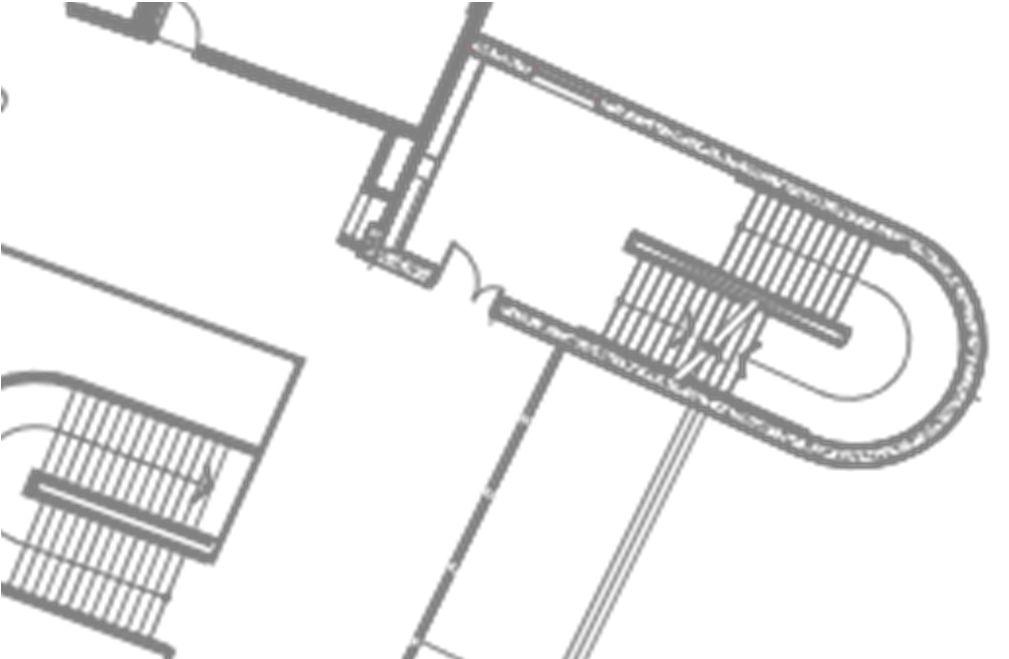
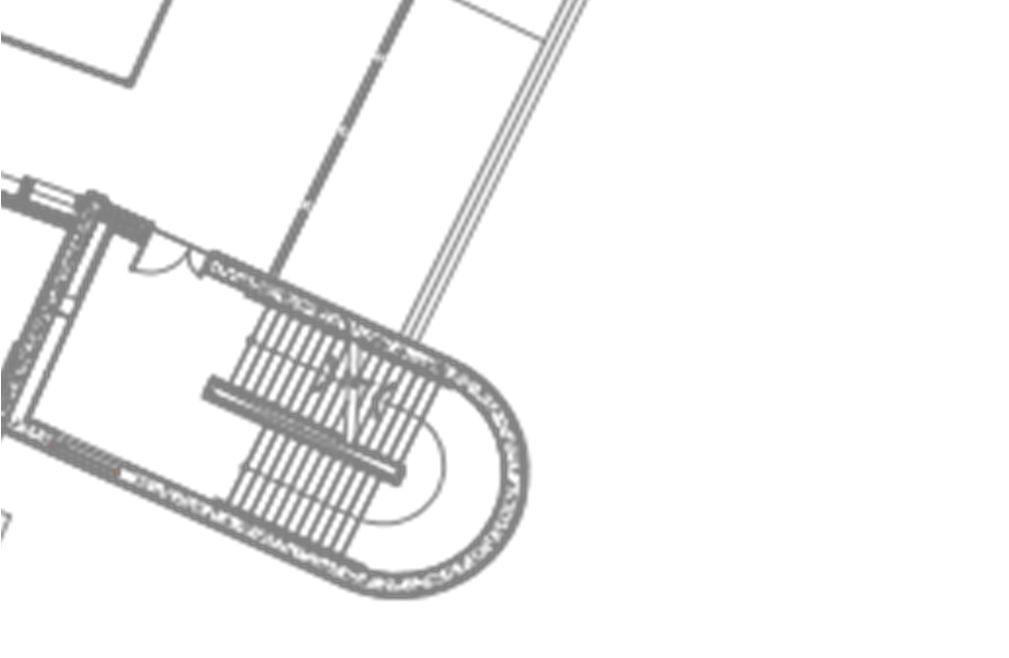
Image 3.13 Emergency landing Fig. 3.6 shows the stairwells that are repeated across every floor. Notes: It is an unnecessary waste of resources to have electrical lights on while there is direct daylight entering the whole space. It is, however, prudent, to keep lights on when there is no direct access to daylight, as in the first photograph.
between flights of stairs. It can be seen that the electrical light is on in the area. That is recessed and away
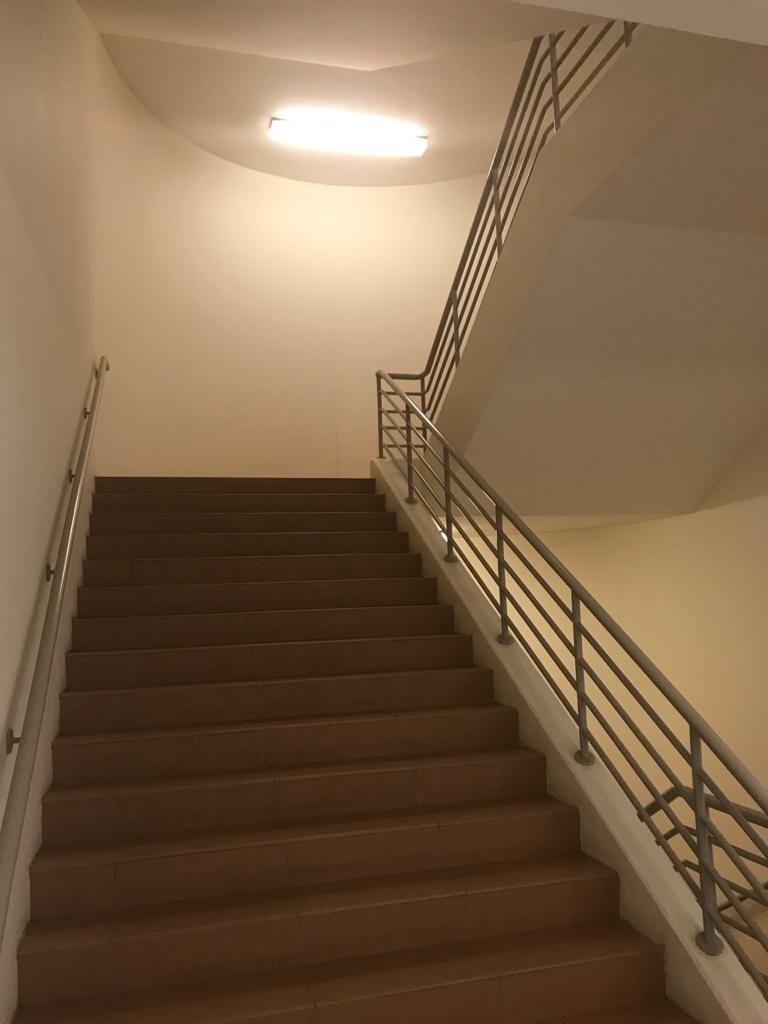
Fig. 3.6
from any windows. (fig1
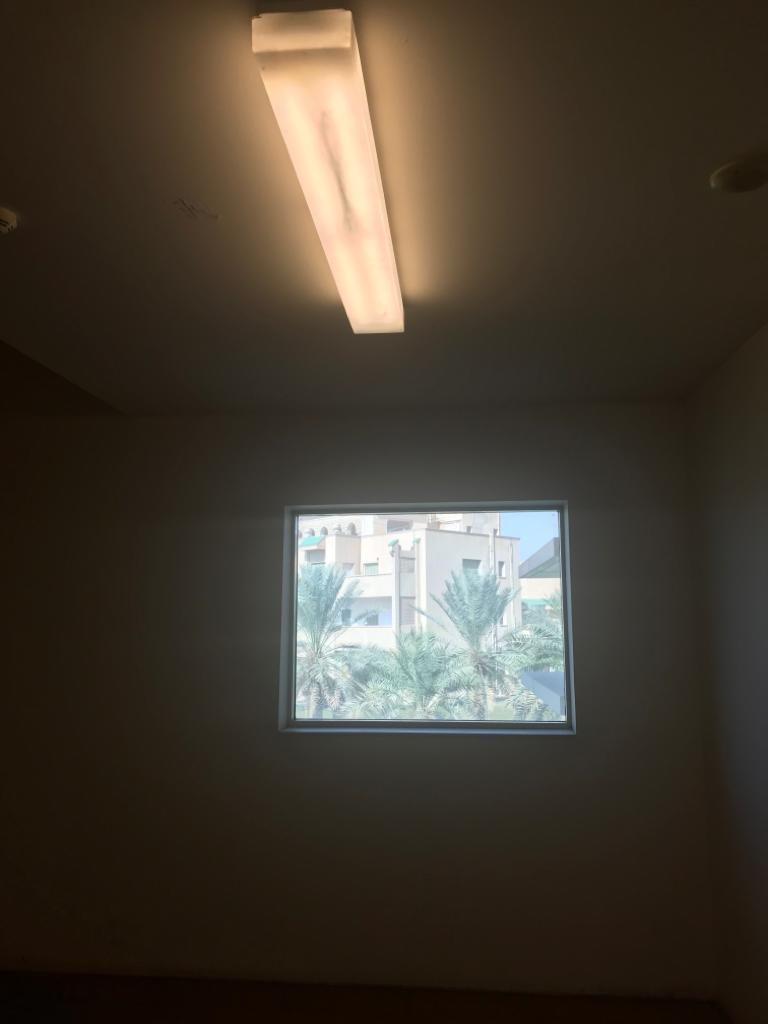
Image 3.14 Emergency landing facing egress door. It can be seen that the electrical light is on despite sunlight being shining outside.
28
Classrooms and corridors (1st floor): Corridors:
(fig3)
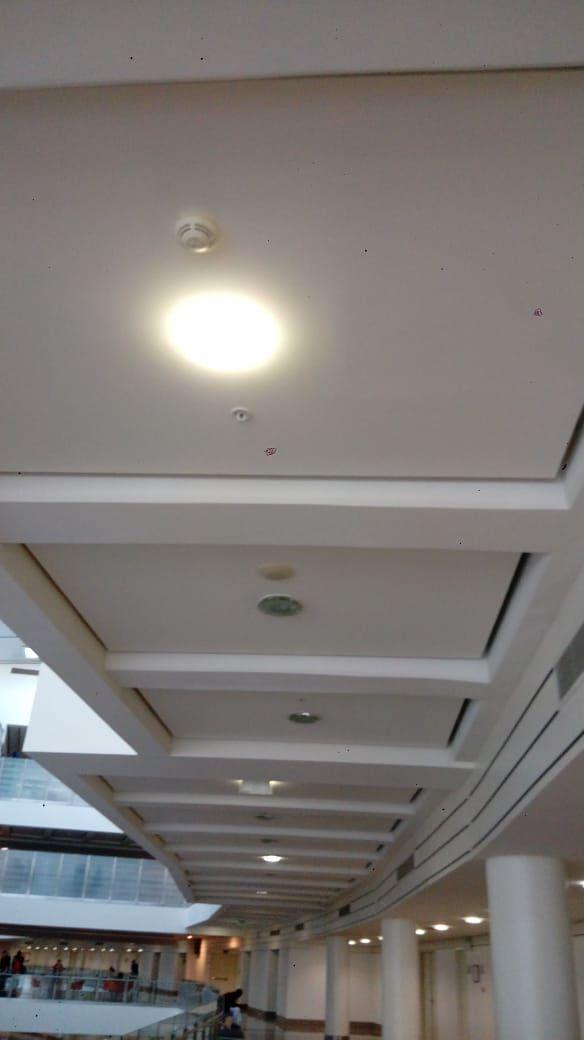
Image 3.15 Ceiling of corridor facing the glazing of the mosque.
Fig. 3.7
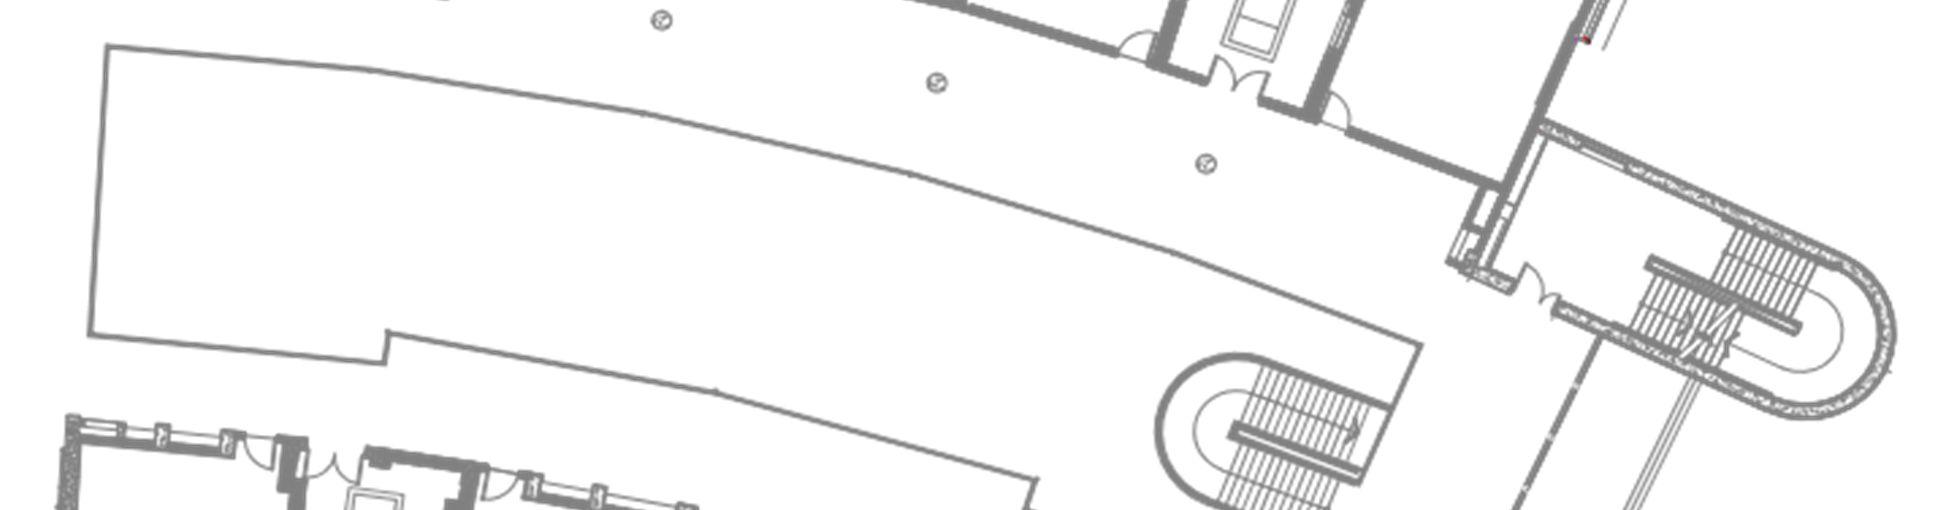
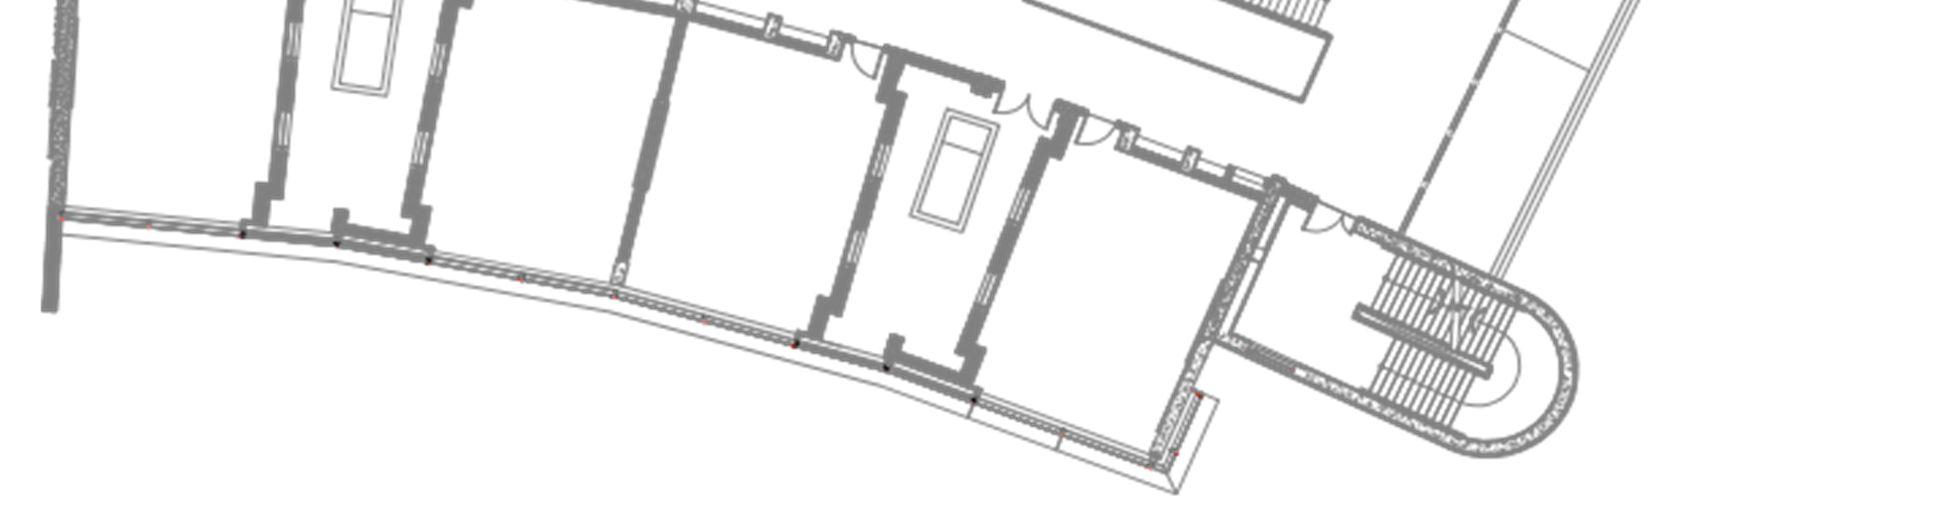
Fig. 3.7 shows the corridors on the 1st floor that we will be studying.
Notes:
In Image 3.15, it is shown that there are no HVAC vents - neither intake nor outtake. This results in stale, and somewhat musty-smelling air that is noticeable by users.
In Image 3.17, every single electrical light directly beside the classrooms is turned on. There is no rational need for this, however, given the fact that Image 3.16 Corridor in these classrooms are facing the atrium, and the front classroom clusters. time is 9am, therefore adequate sunlight is entering the corridor.
29
Image 3.17 Another view of the corridor facing the classroom clusters.
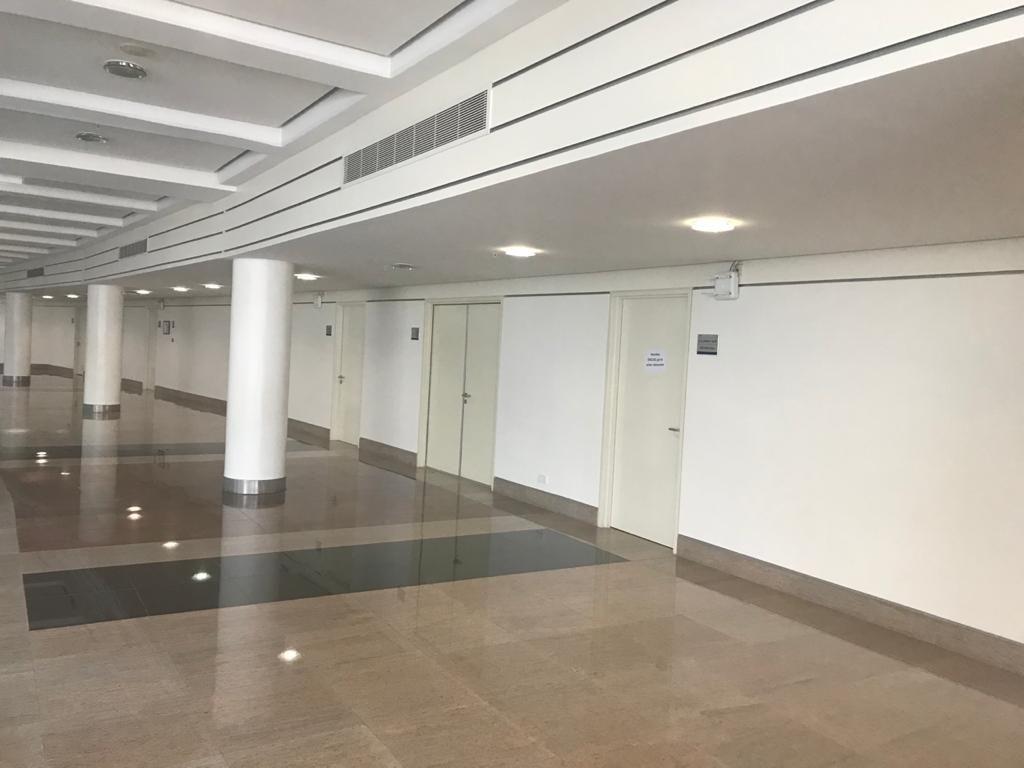
In both Image 3.17 and Image 3.18,, it is shown that there are HVAC vents - however, they are facing away from the classrooms (where most of the circulation/user activity is taking place), and instead facing more towards the atrium.
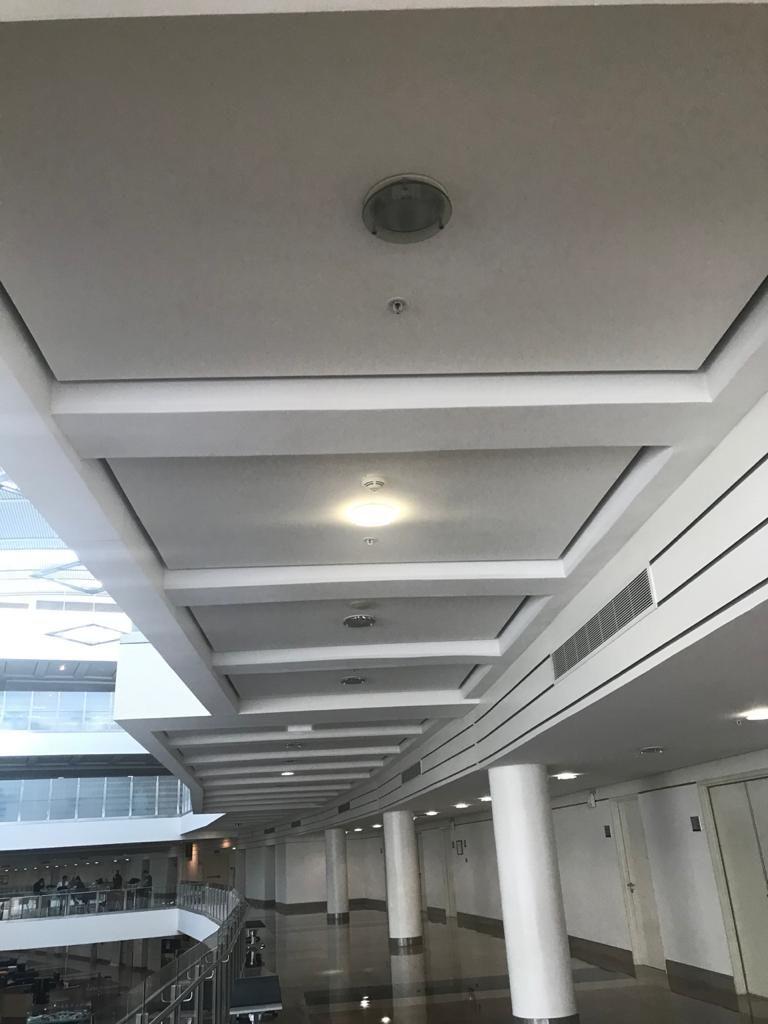
This ventilation is therefore not too effective at taking venting the air directly throughout the corridors.
Image 3.18.
30
Classrooms:
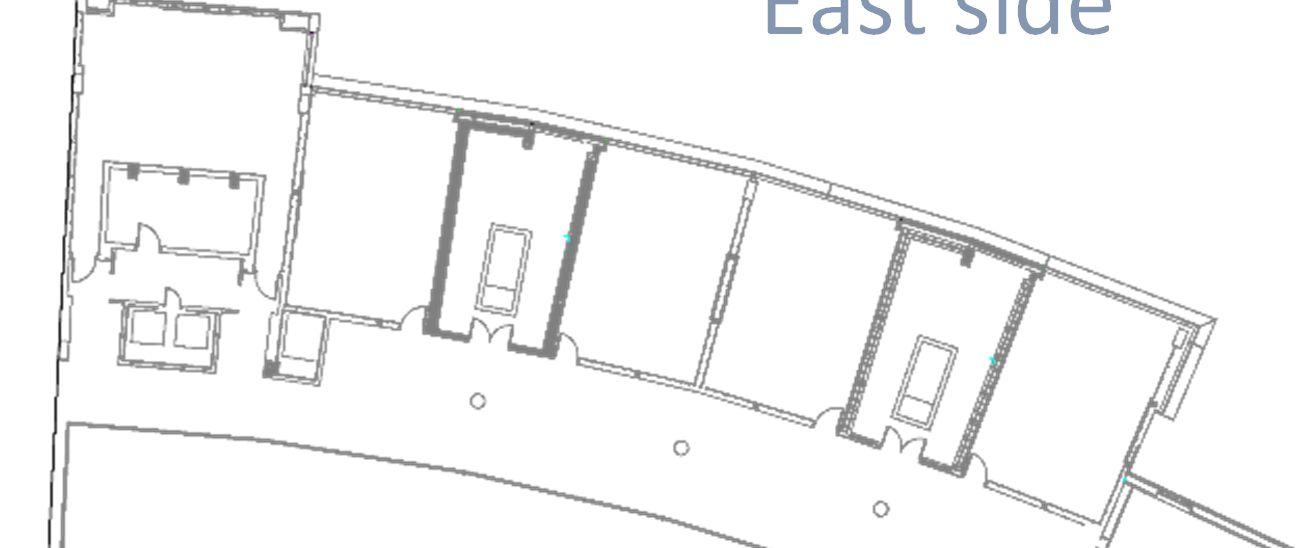
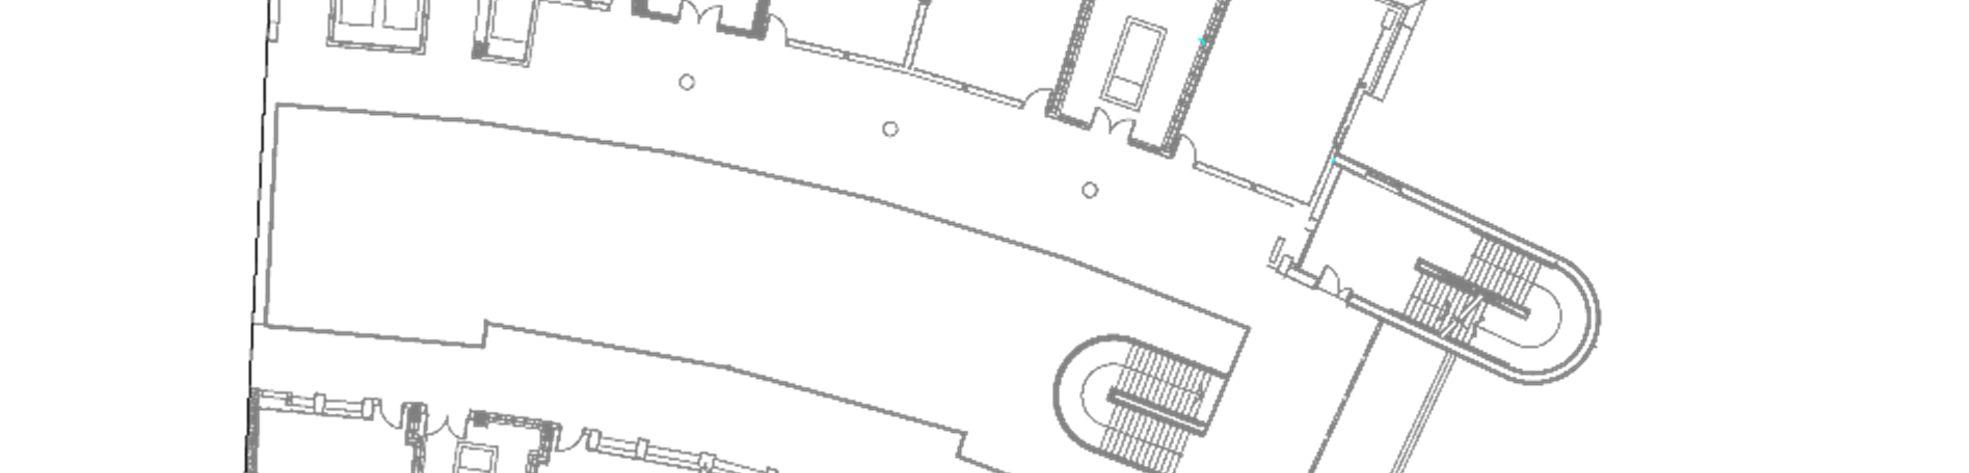
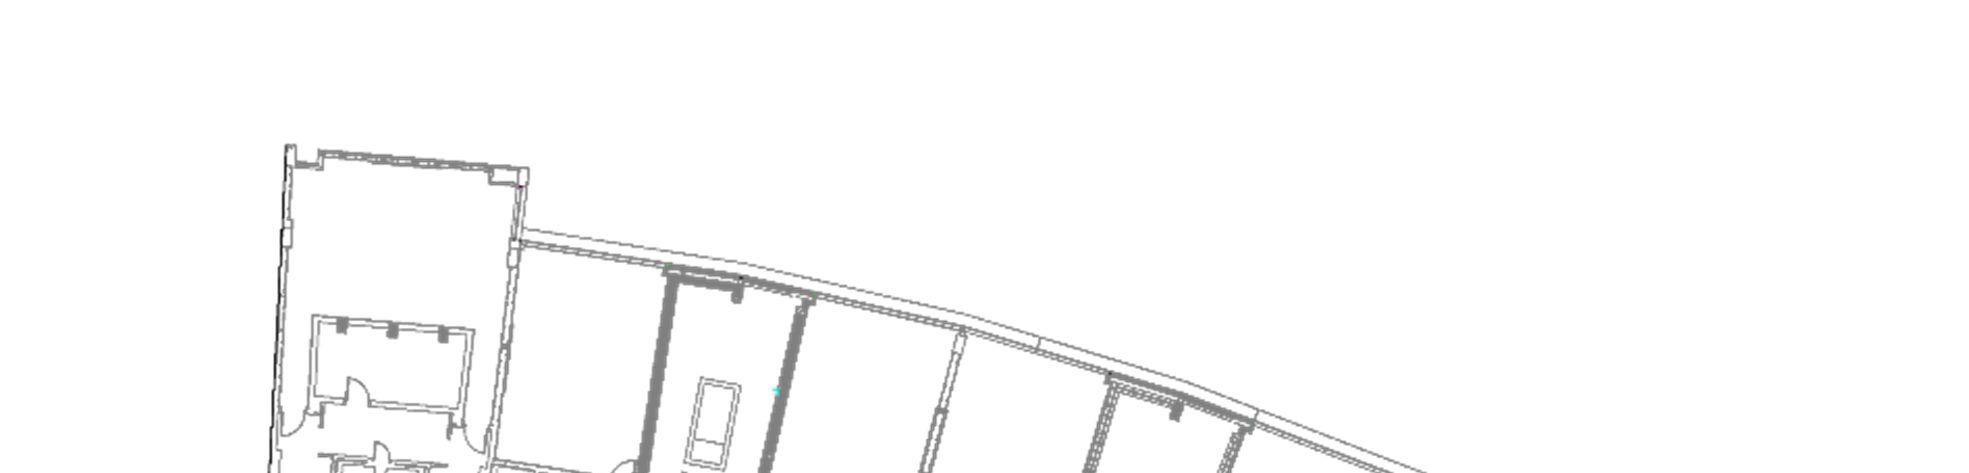
East side
Fig. 3.8
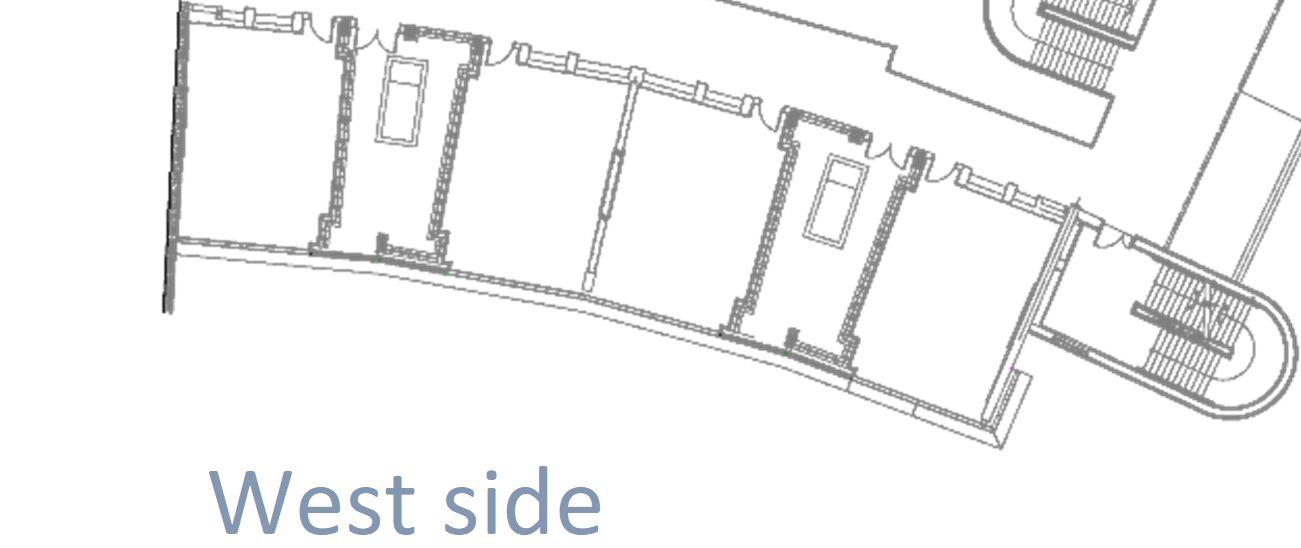
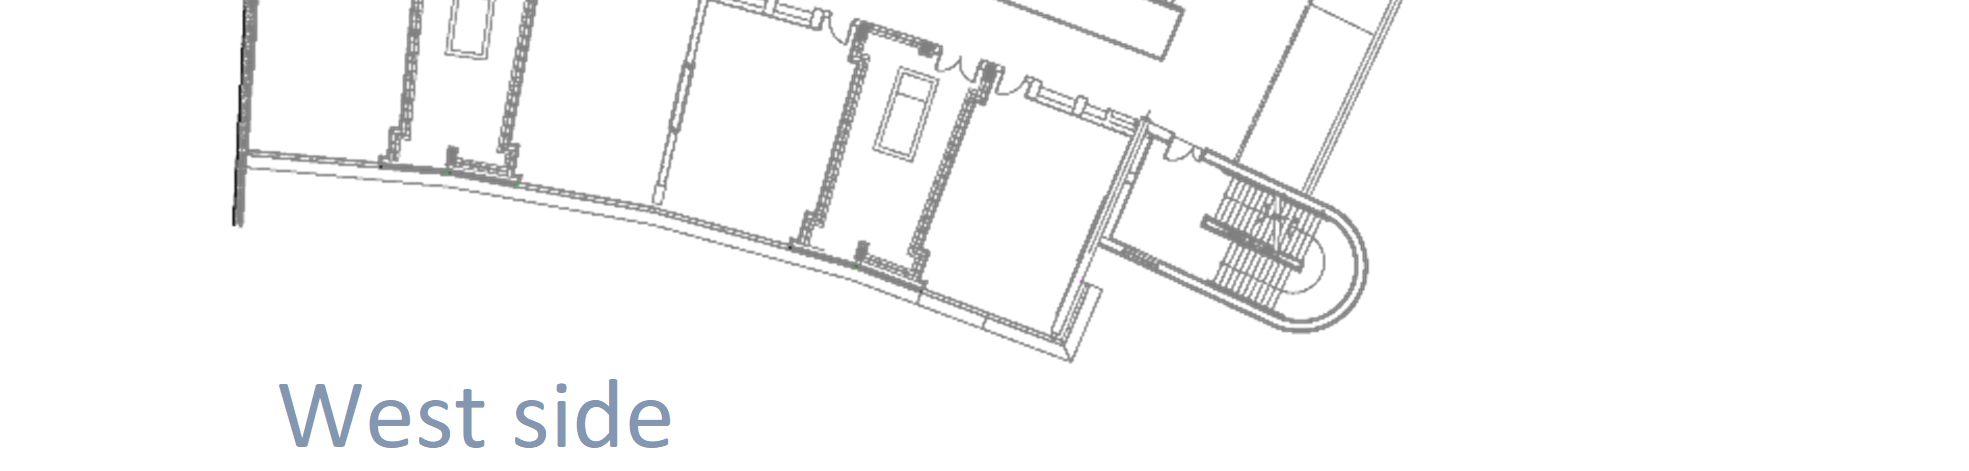
West side
Fig 3.8 shows the orientation of each of the classrooms on the 1st floor.
31
West side classrooms
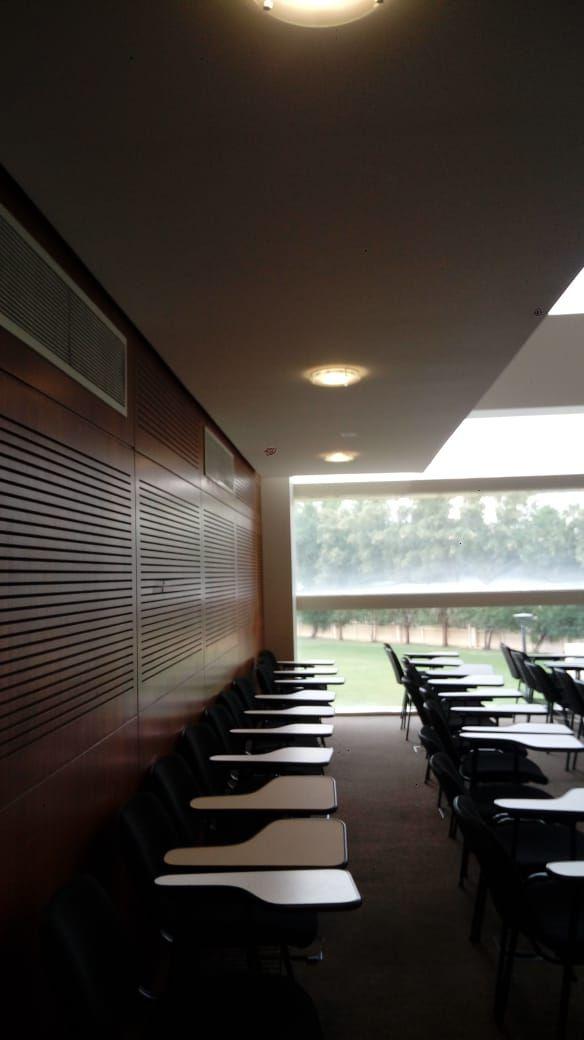
Image 3.19 An empty classroom in broad daylight, with the lights on.
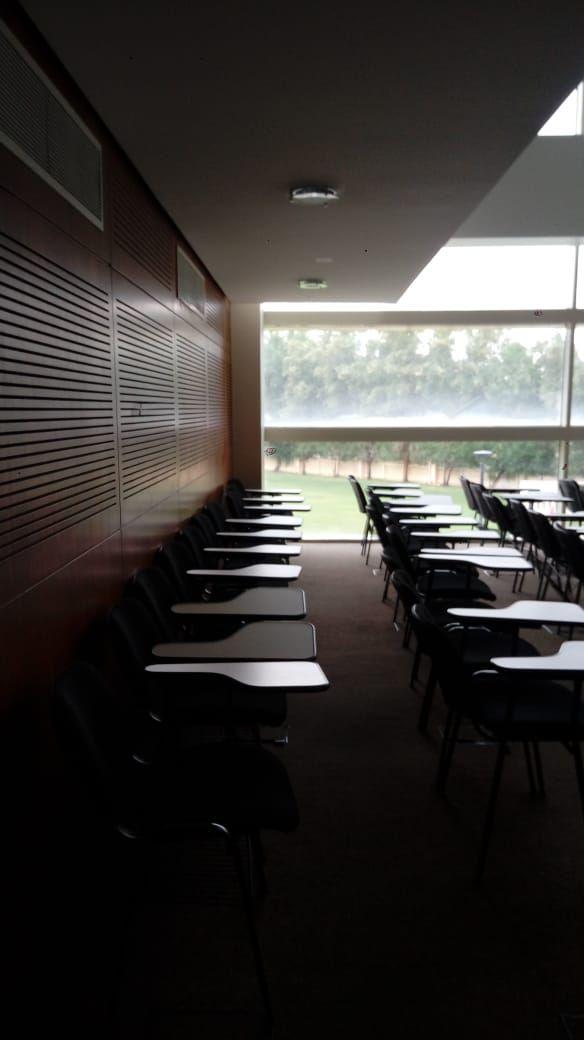
Image 3.20 The same classroom at the same approximate time, with the lights off.
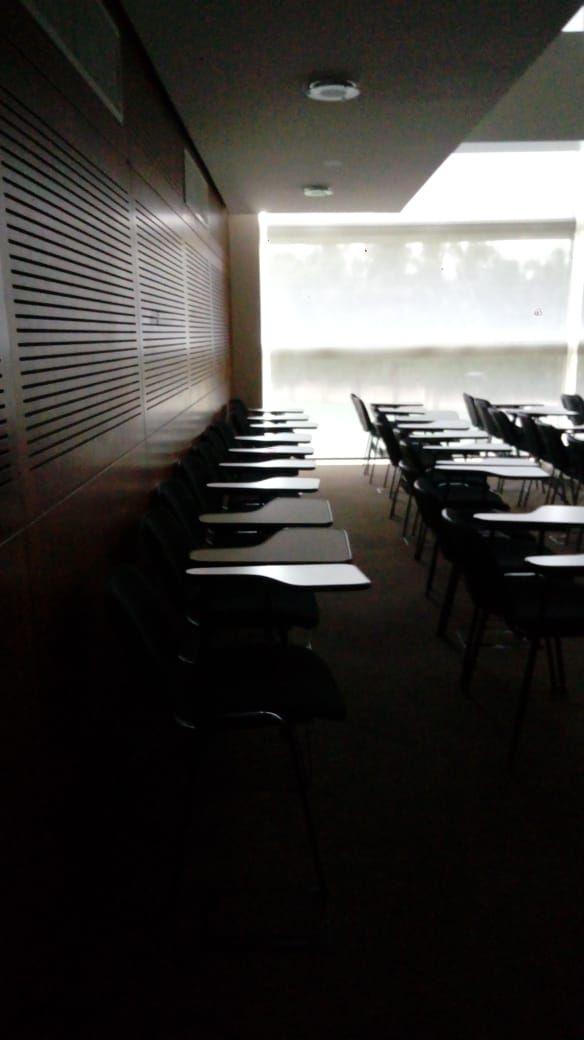
Image 3.21 The same classroom with the blinds down, with lights on.
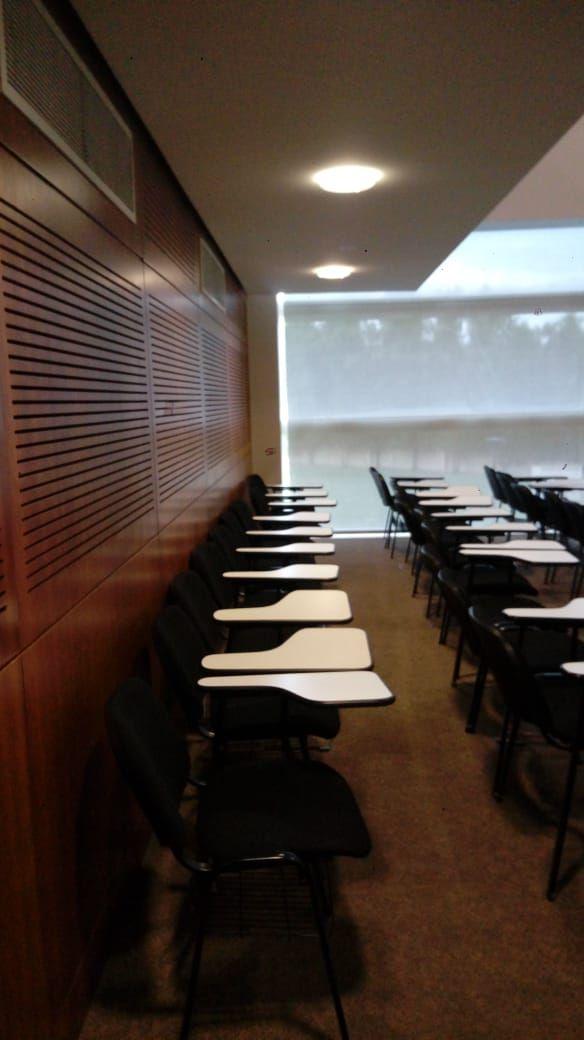
Image 3.22 The same classroom with the blinds down, and the lights off.
NOTES: Comparing the first pair of photographs, it can be seen that there was wastage of resources in first photograph - an empty classroom, and yet the lights are on. Additionally, it can be noted that even if the classroom were not empty, lights would not be needed since the daylight is enough. In the second set of photographs, the blinds were drawn down, in case the sun is oriented in such a way as to bring glare into the classroom. As such, the lights were in fact useful to an extent, but there was still adequate light throughout the classroom to work by if the lights were off.
32
East side classrooms
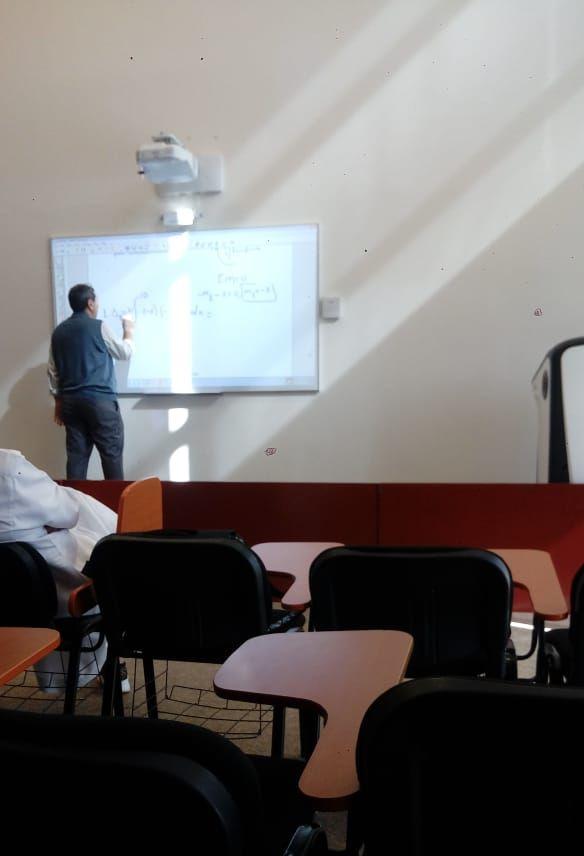


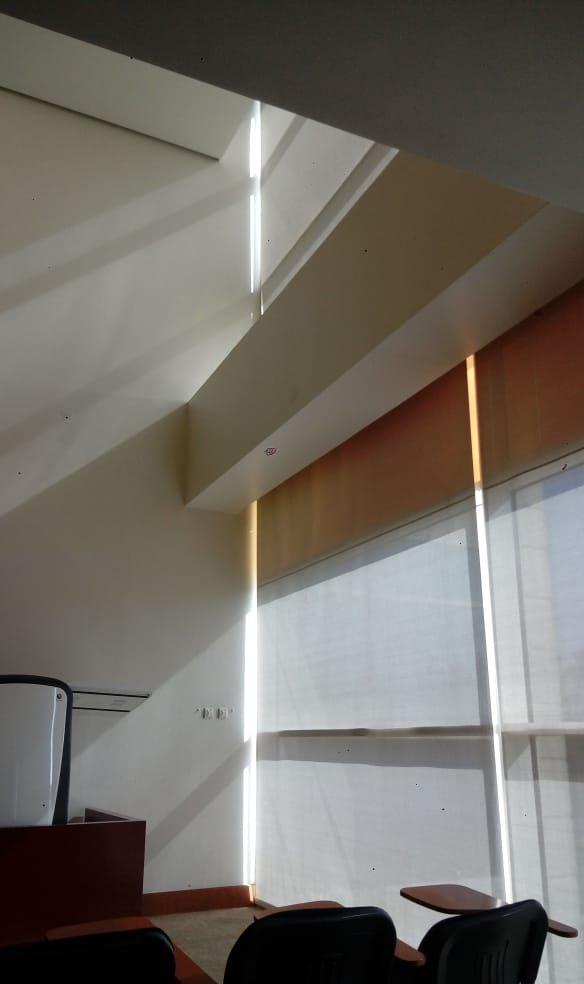
Image 3.24 Light interrupting the space through the slit between the blinds and the wall. Image 3.25 The light able to interrupt the lesson if the blinds were lifted. As it is, the light is still distracting.

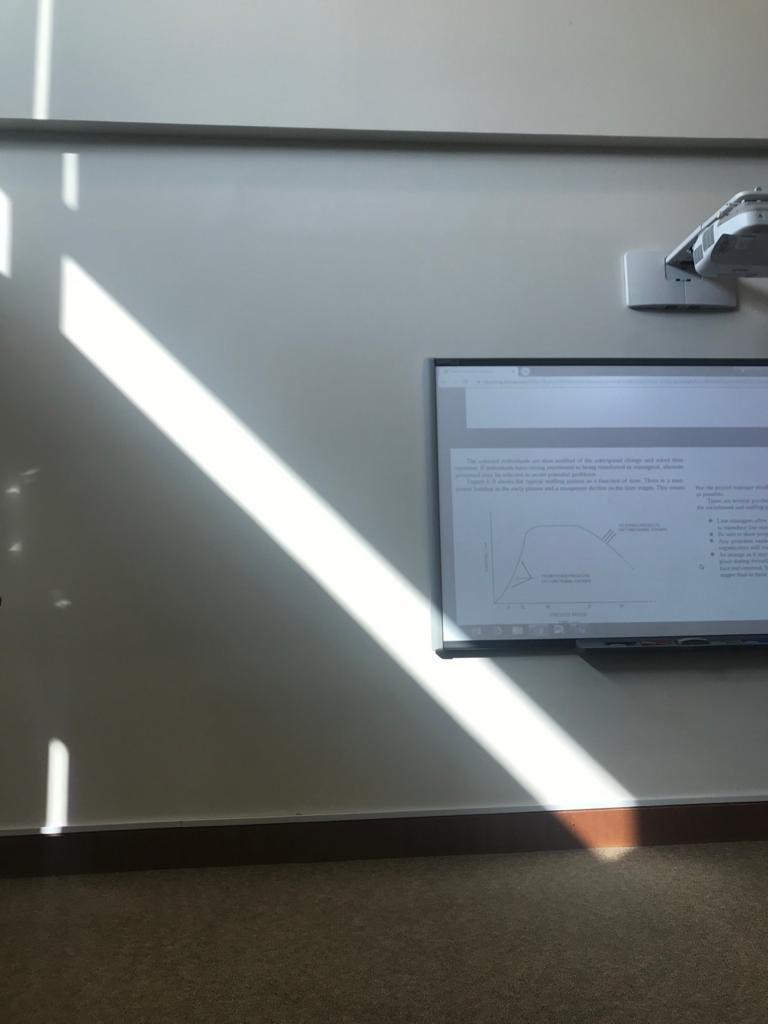

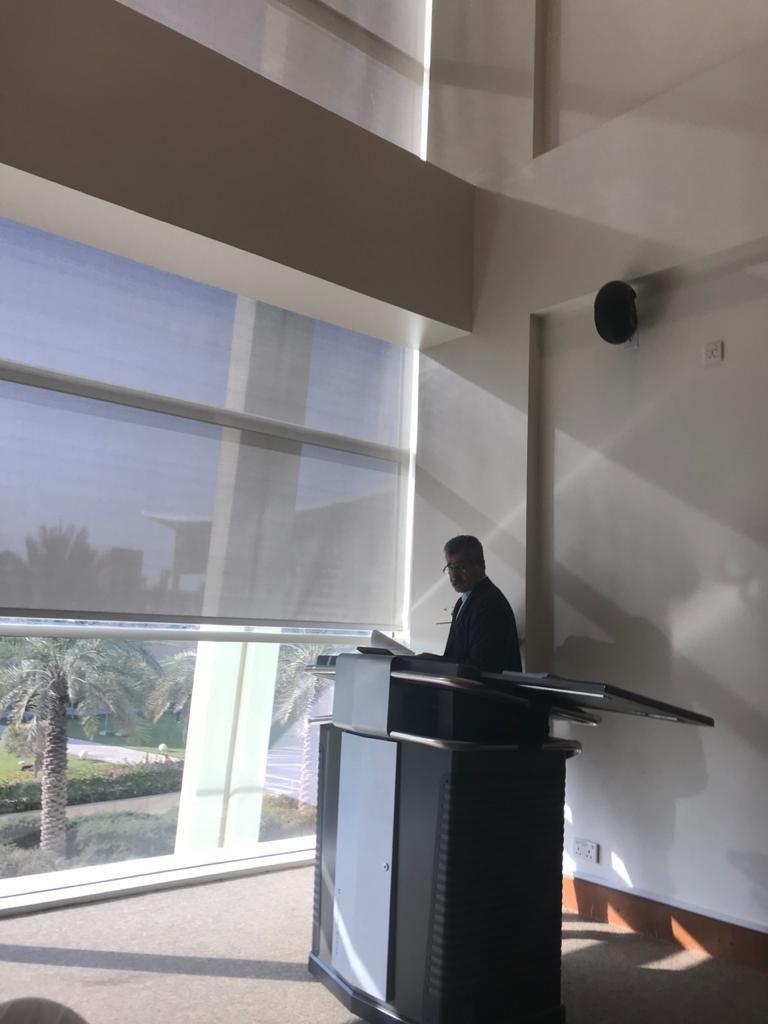
Image 3.26 Despite the drawn blinds, the light still manages to interfere with the digital interface of the podium.
Notes:
Regarding the west side, Images 3.23-3.26 )show excessive glare in the afternoon classes, which affects professors’ studying tools like the smart boards, and provides visual discomfort. It can be seen that even though the blinds are down, there is still a lack of total control over how much light enters the space, and how it enters it. There are edges between the fabric and the walls of the exterior, that are not accounted for. Light then enters at an angle through these slits, and fill up the space strongly – because the orientation of the façade is lined up with the sun’s movement. These east-side classrooms face the sun as it rises through the sky – as the morning classes are held in these, and only these, classrooms.
The same problems are faced by the west-side classrooms, because west-side classrooms have been booked for afternoon classes. Therefore, as the sun sets, the light hits at angles through the west glazing, and hits smart boards strongly, providing visual discomfort and distraction.
33
South zone social bridges (1st floor):
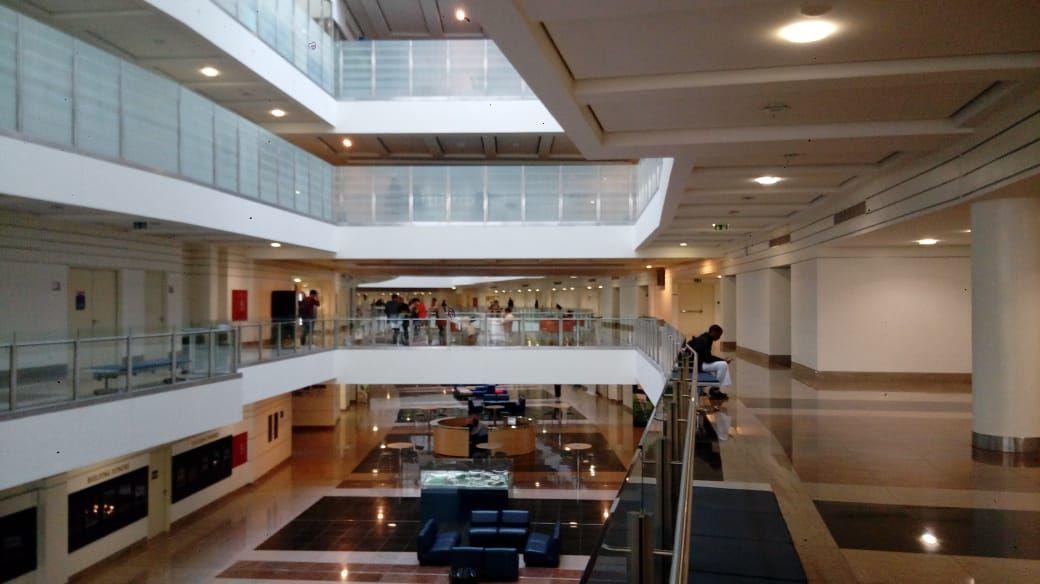
Image 3.27 The social bridge between class times.
Fig. 3.9 Plan of social bridge Image 3.29 The atrium windows as seen, shut. on the 1st floor.
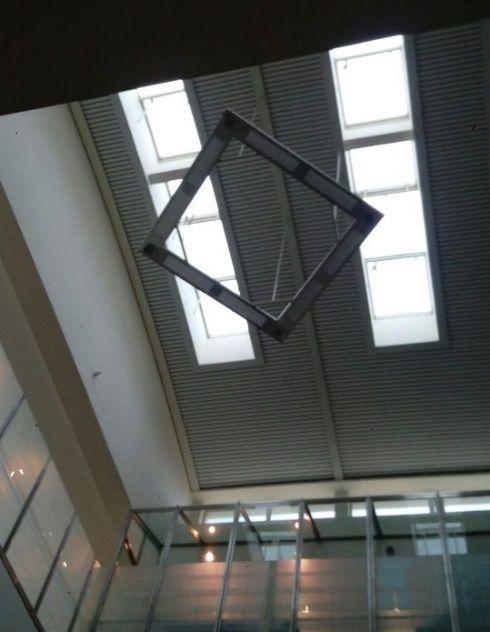
Image 3.28
Notes:
The atrium skylights are not opened during the day in good weather. This is a waste of HVAC resources, as they could help in natural ventilation if opened. The atrium and bridge connection adjacent to the classrooms causes conversational noise and other sounds of human and
machine activity to the classrooms, without a barrier. 34
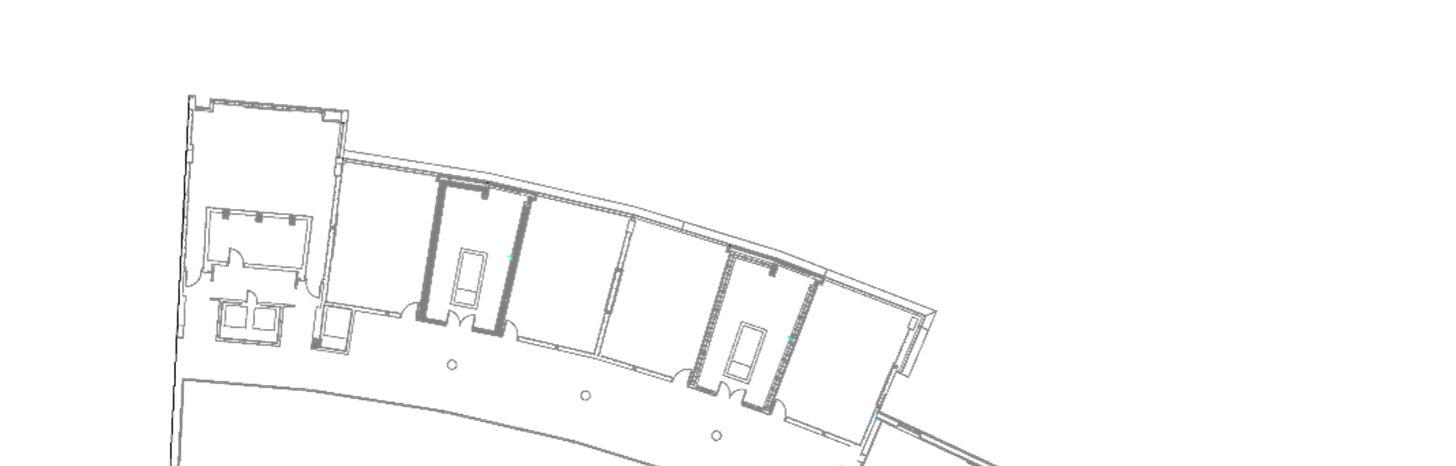
Classrooms and corridors (2nd floor): Corridors:
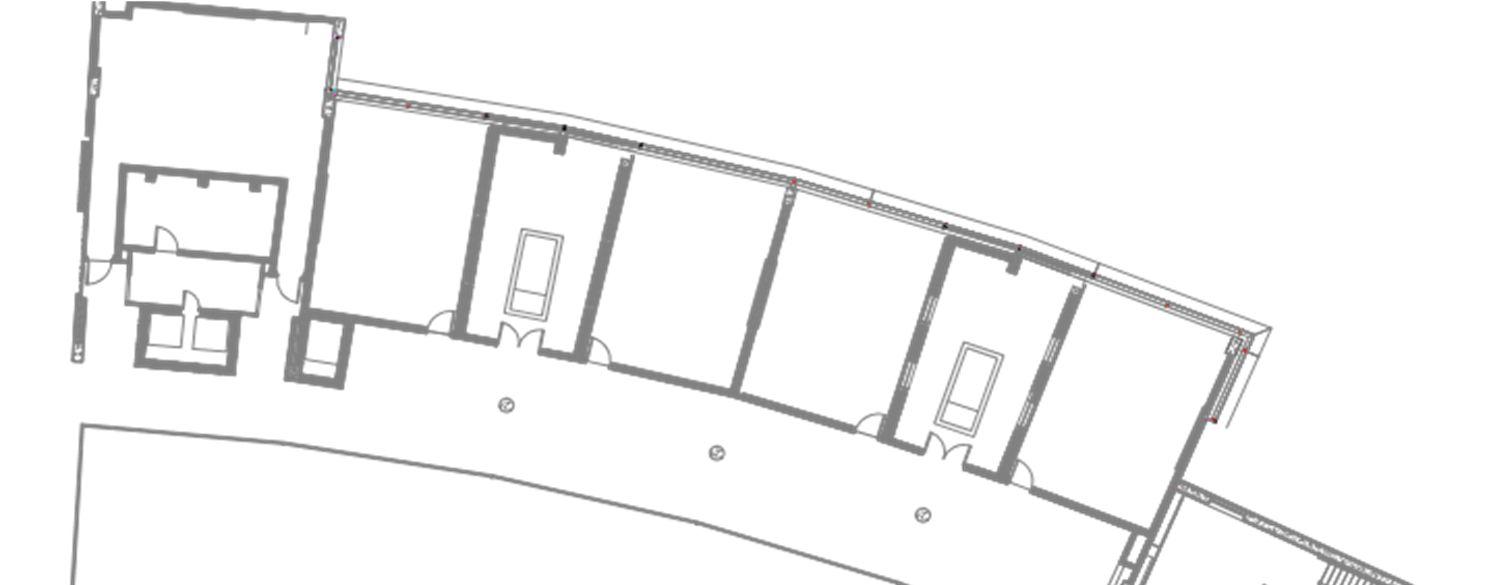
Fig. 3.10
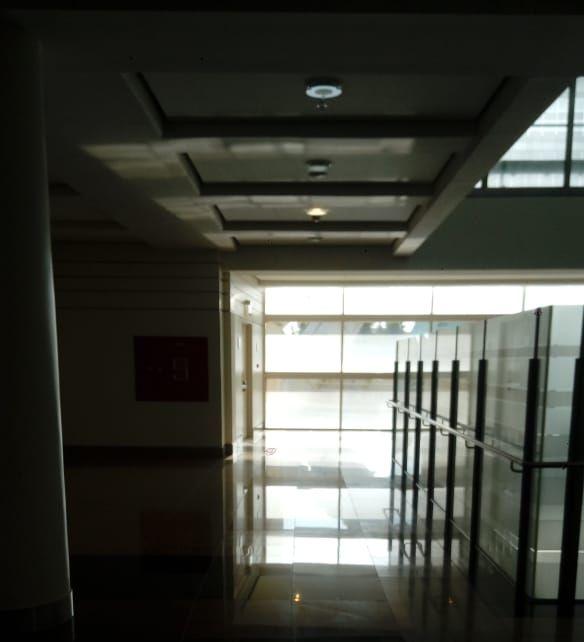
Image 3.30
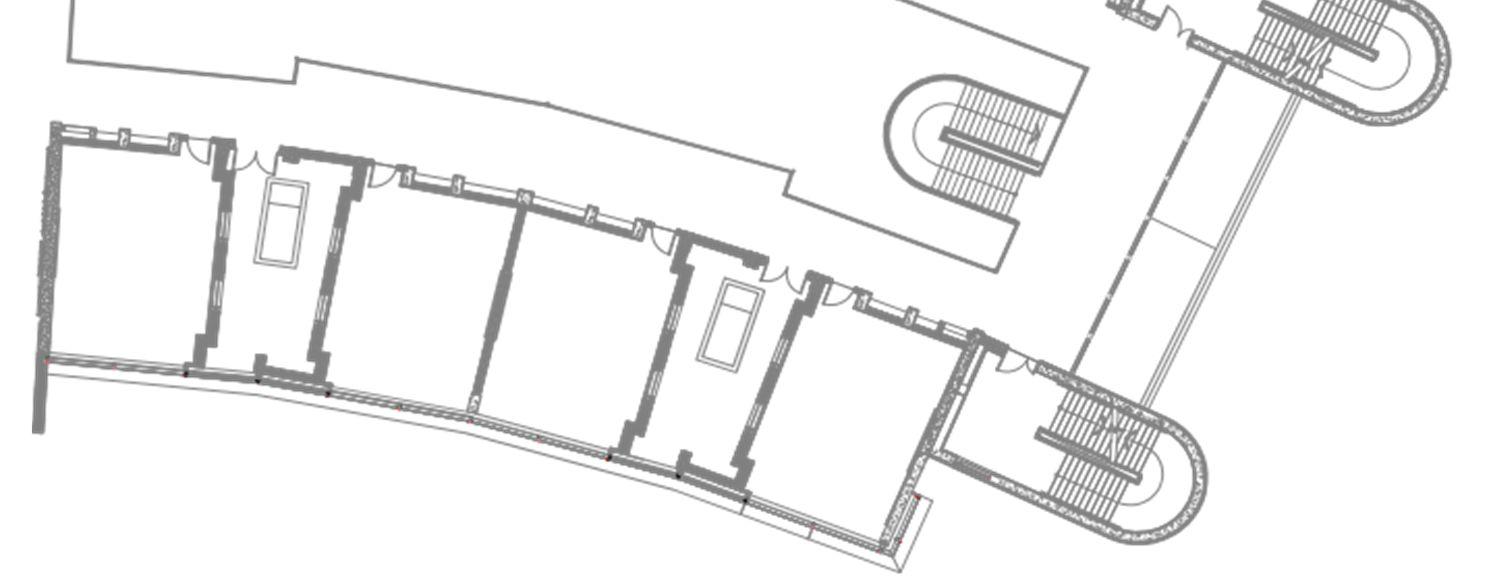
Image 3.31
Fig. 3.10 shows the plan of part of the 2nd floor, with the corridors highlighted as shown. Notes:
Images 3.30 and 3.31 show the corridors with classroom clusters on either side. Image 3.31 shows an unnecessary need for lights being turned on, as the reflective materials used in the glass and floor are able to light up the space well enough.
35
Classrooms:
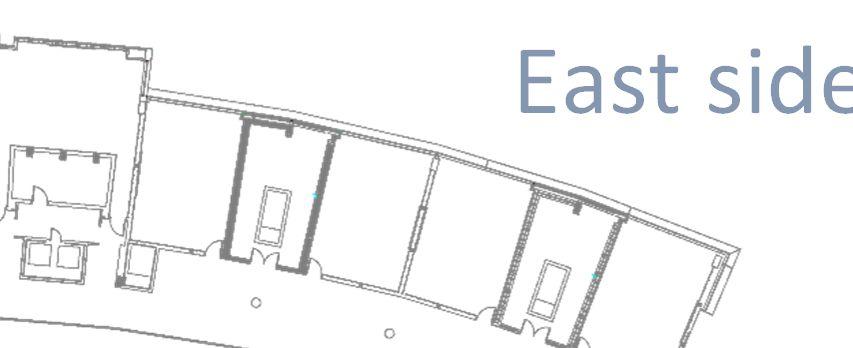
East side
West side
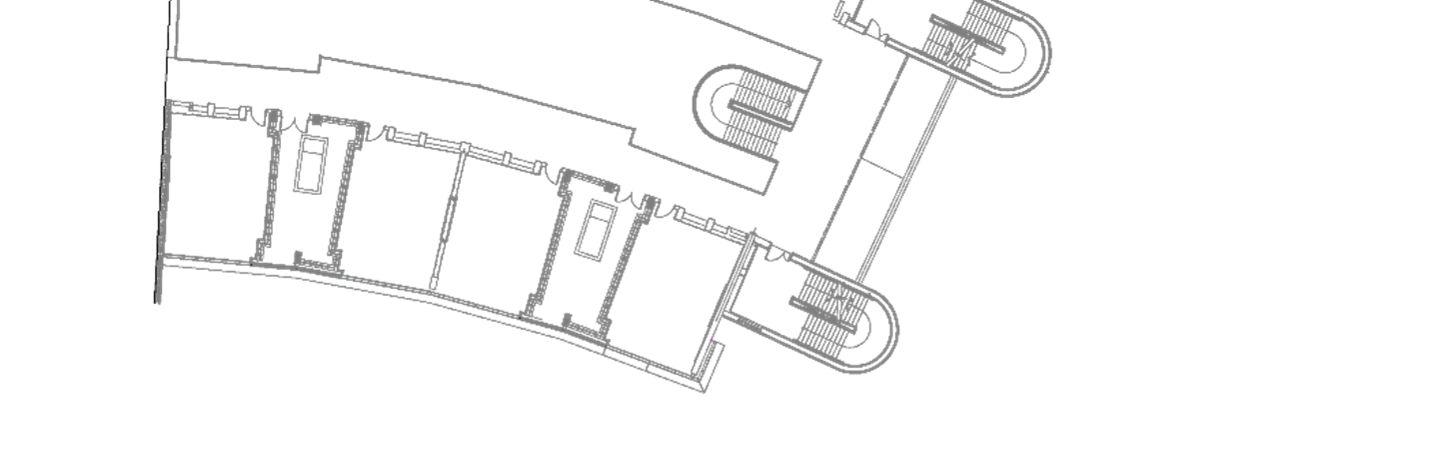

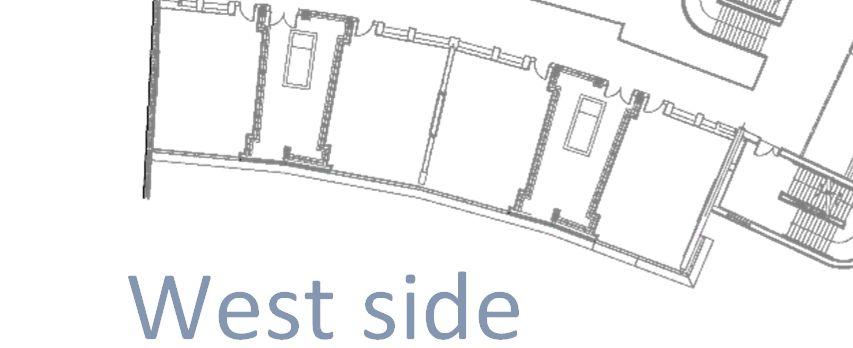
Fig. 3.11 This figure shows the classroom distribution along each corridor on the 2nd floor, as well as their orientations.
Image 3.32 East side classroom.
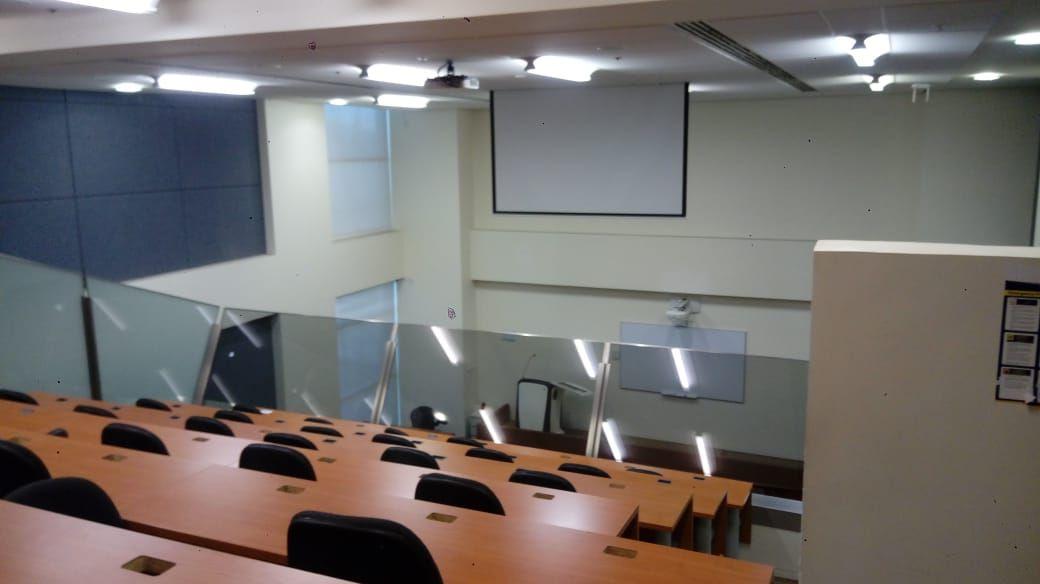
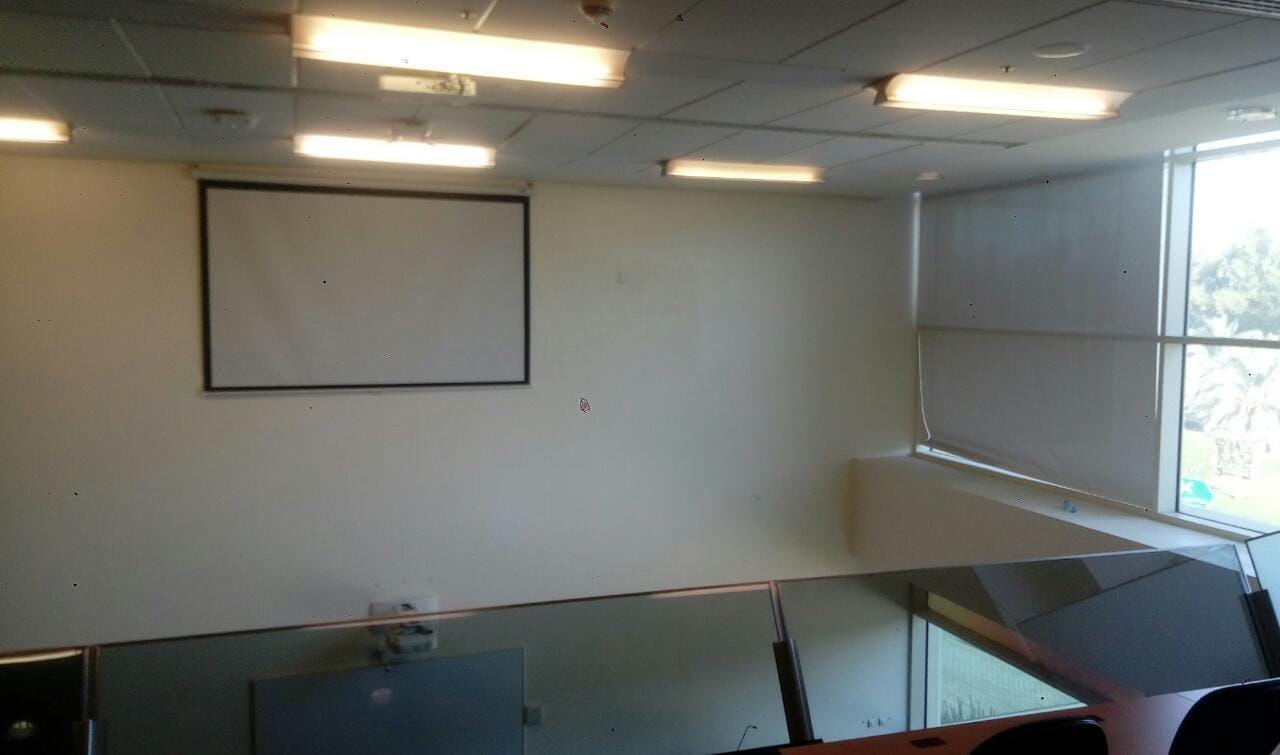
Image 3.33 West side classroom.
Notes:
Empty classroom with lights on as seen, and blinds drawn. Classrooms face visual noise on the 2nd floor projector at certain times. Lights are shared, thus do double duty – if there is a user in the second floor only, the entire room’s lights will be turned on, as if for a full class. The same goes for the event in which one individual enters the space through the 1st floor classroom.
36
South zone social bridges (2nd floor):
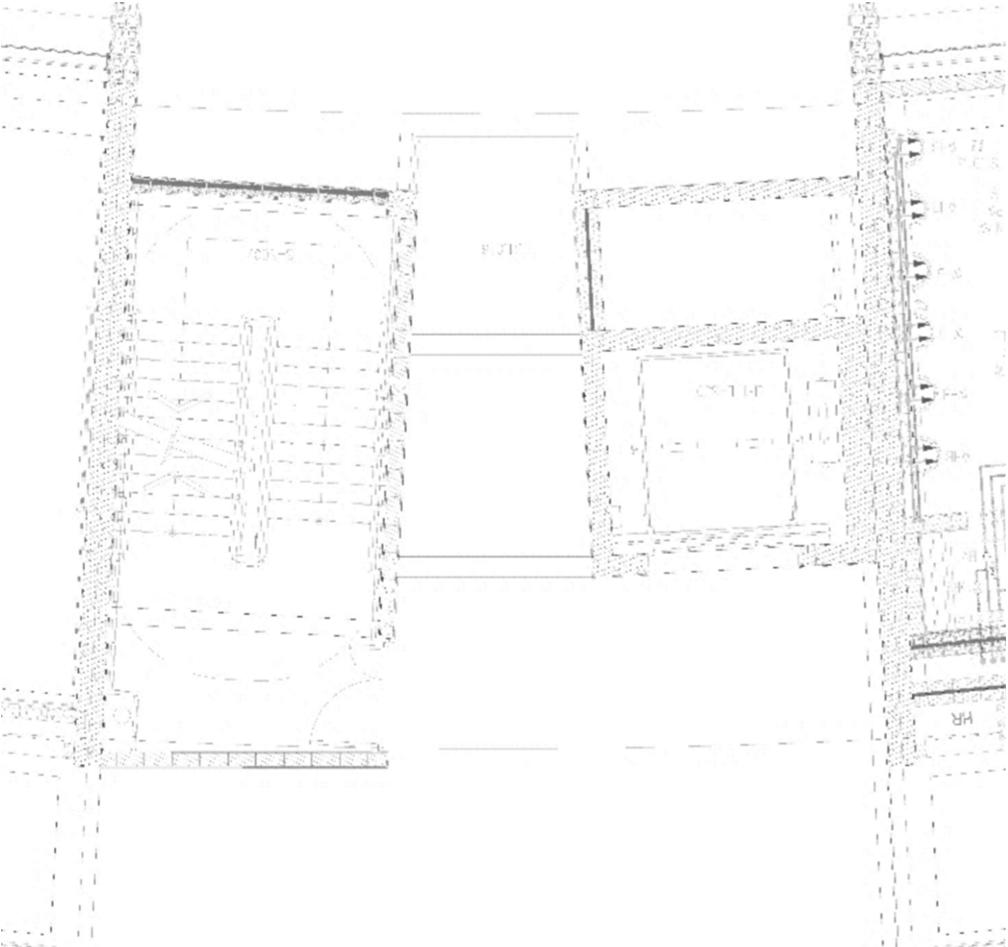
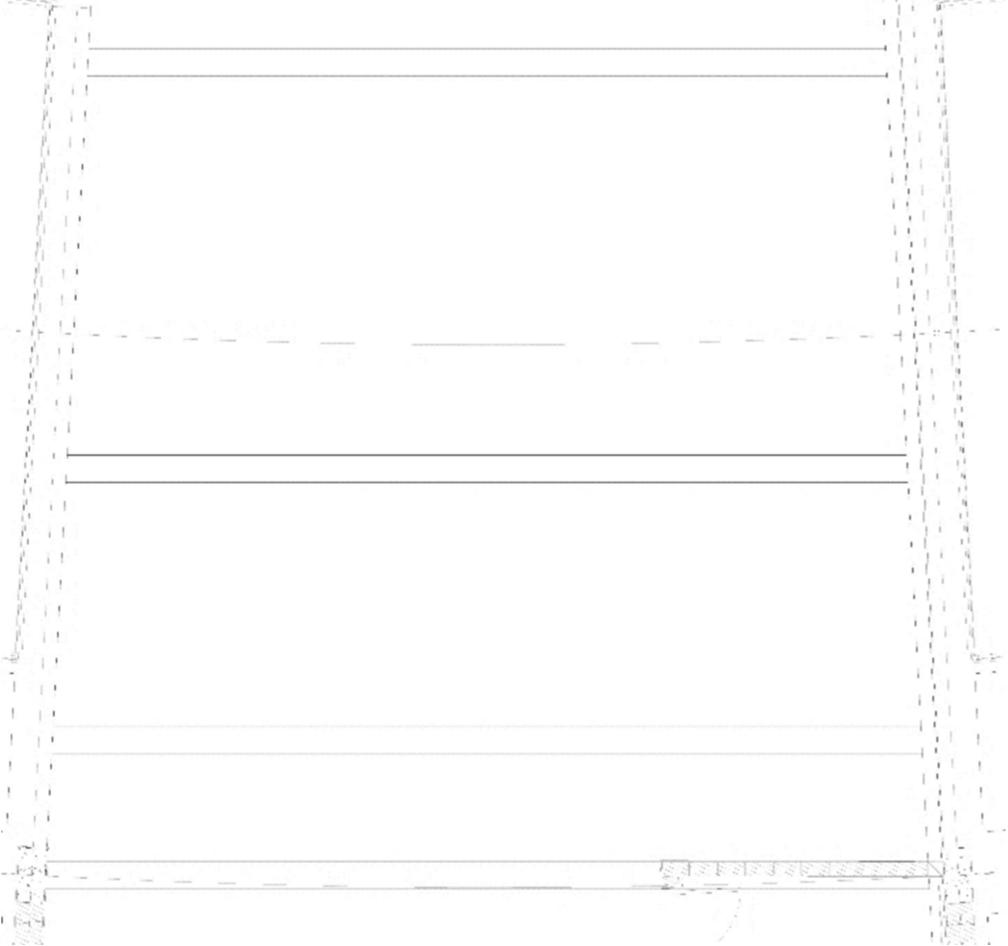
Fig. 3.12 Plan of social bridge on the 1st floor.
Notes:
No acoustic issues found, however the natural lighting is dimmer than expected, and there is a heavy reliance on electrical lighting in this area.
37
Offices and corridors (3rd floor):
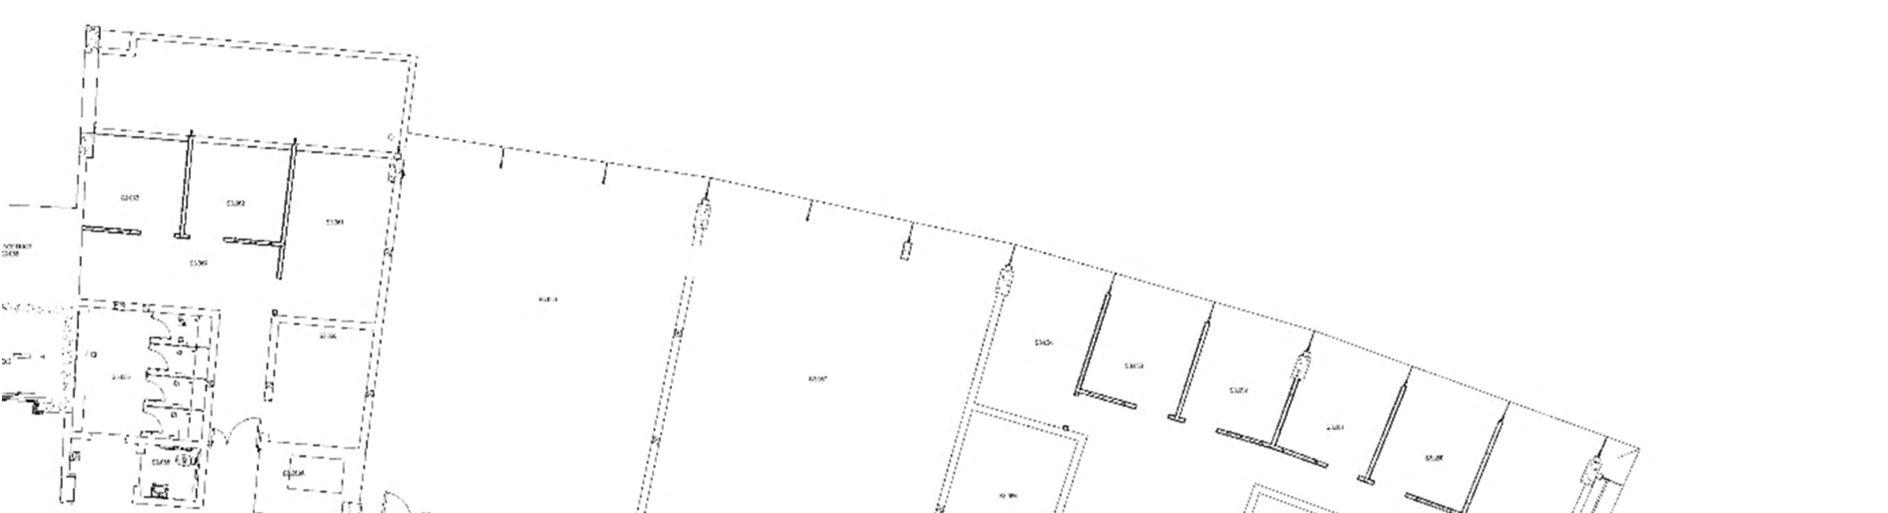

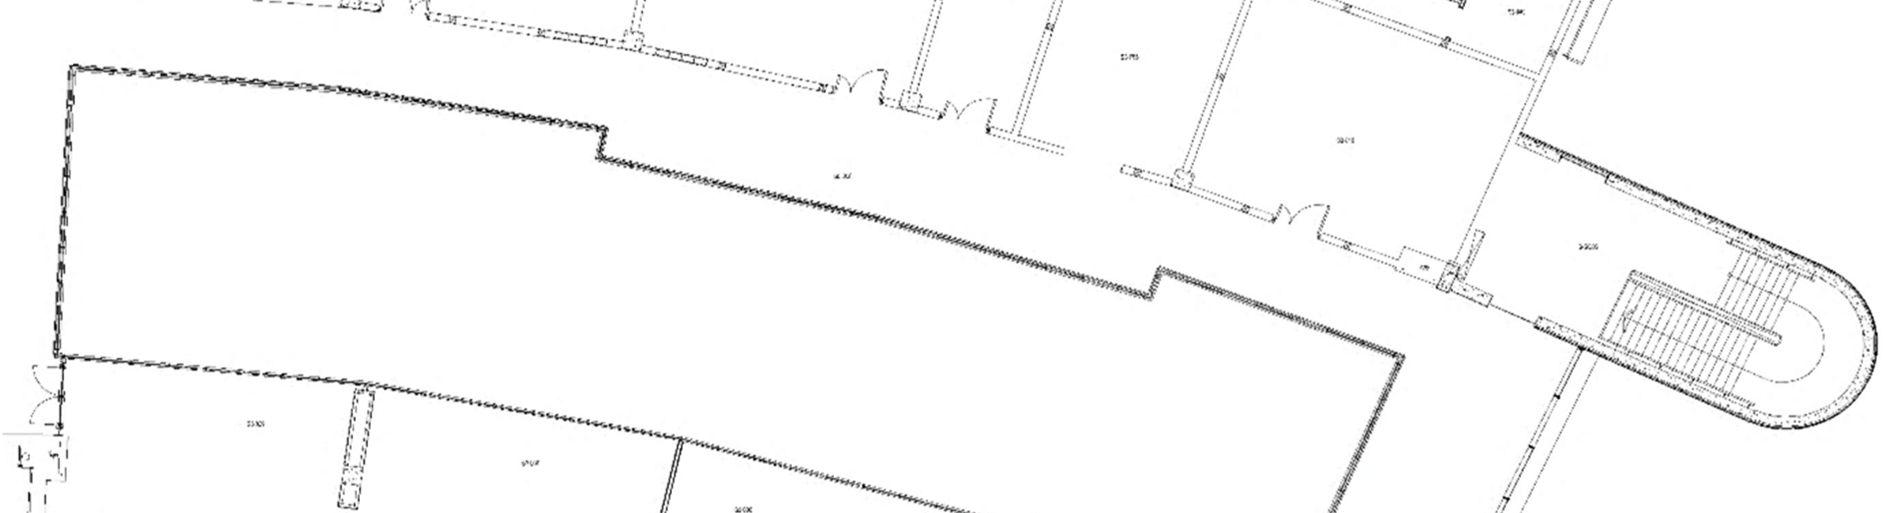
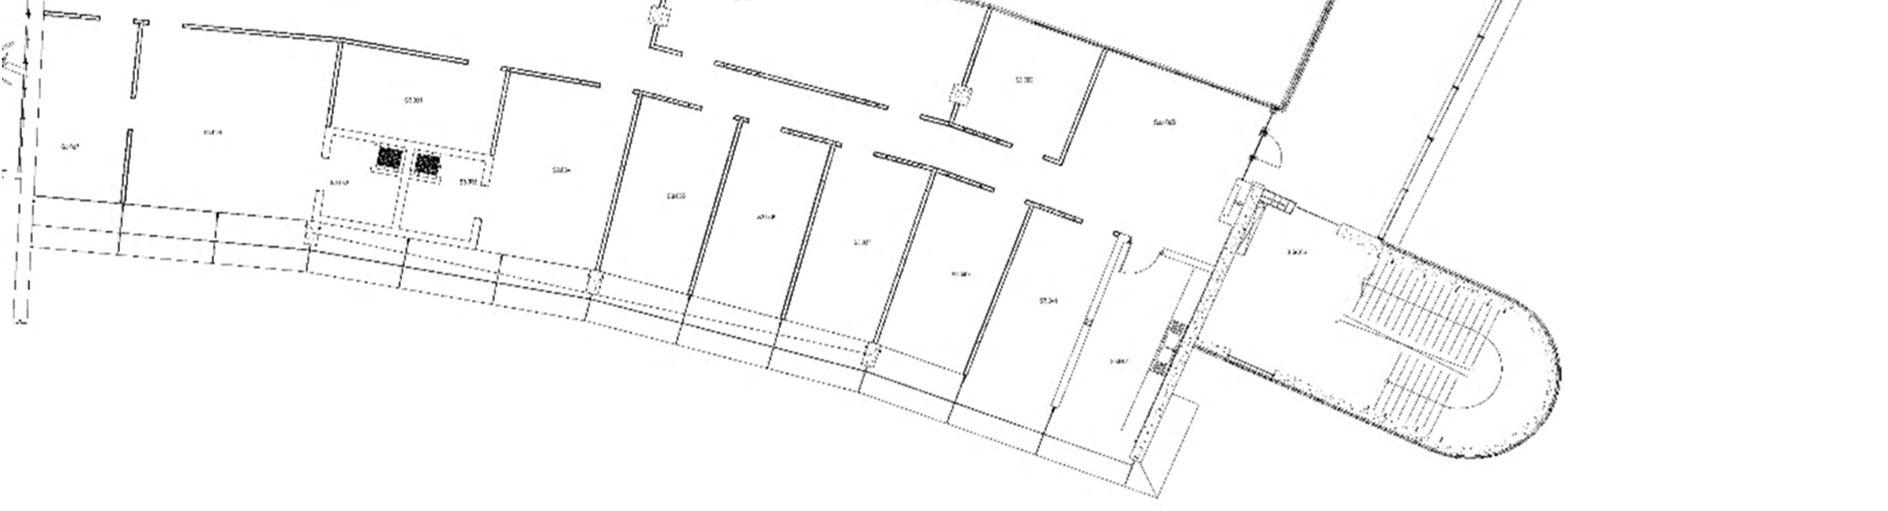
Fig. 3.13 Plan of 3rd floor outlining where the offices are located..
38
Offices:
Image 3.34 Showing the reception area of the offices.
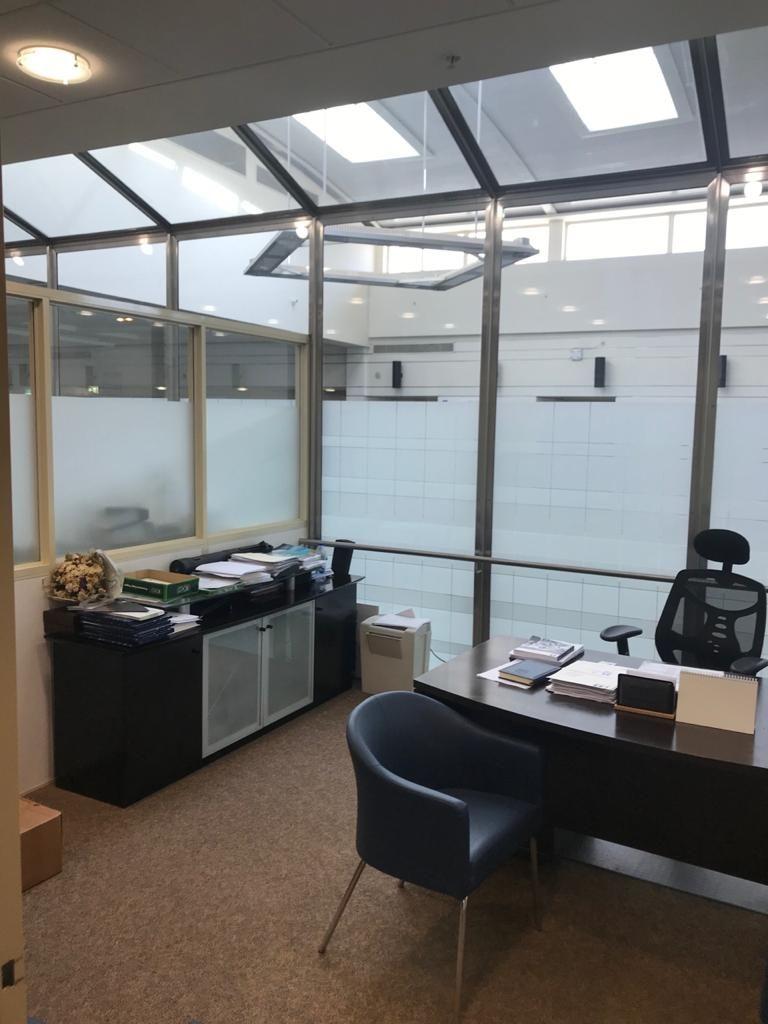
Image 3.35 Showing the skylight openings directly over the office area.
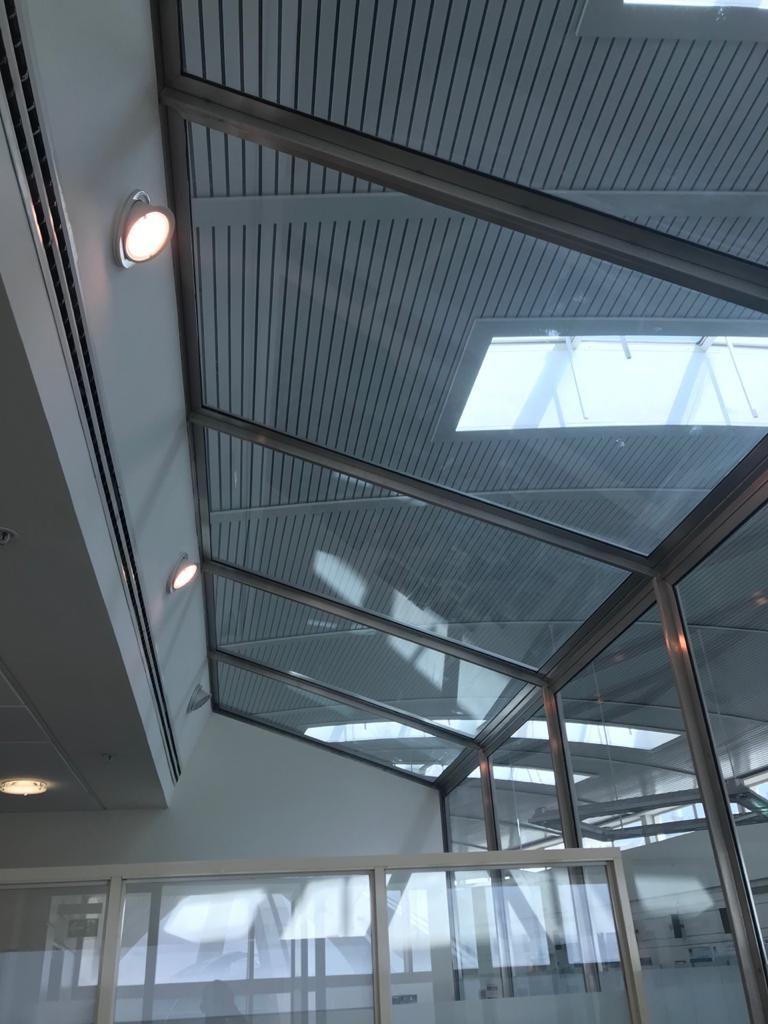
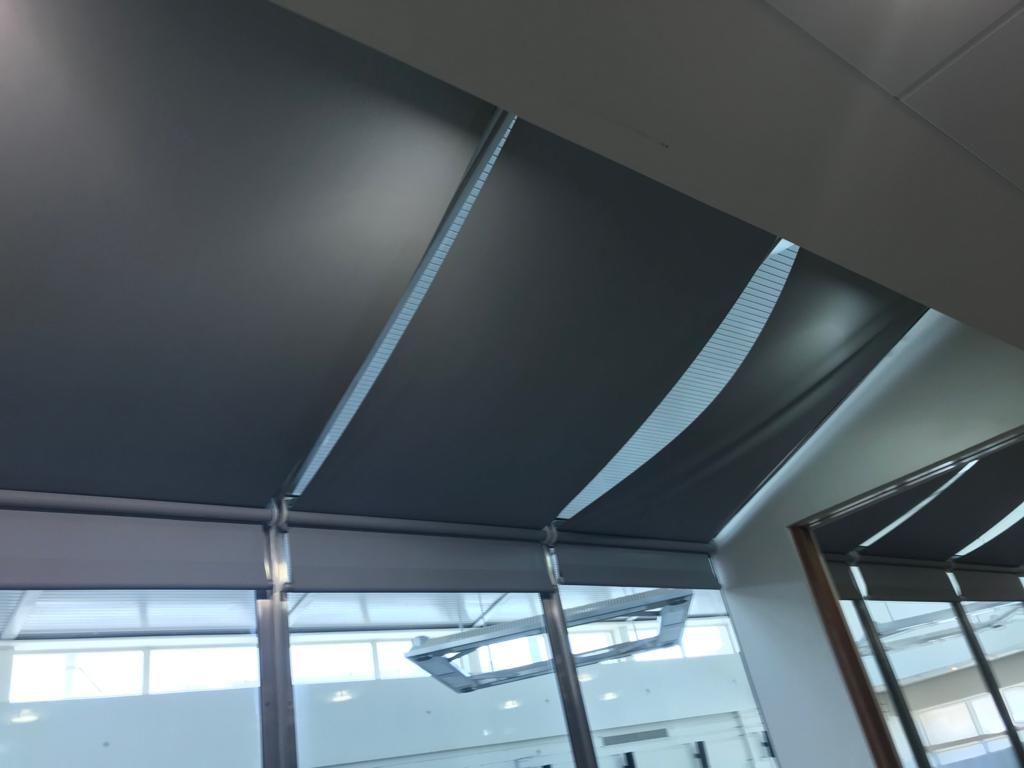
Image 3.36 Fabric blinds installed to shade from light and heat.
Image 3.37 Passage further into the office cluster.
Notes:
As can be seen in Images 3.35 and 3.36, the offices face glare at certain times of the day, from the light penetrating into the skylight above. The light and heat were so much initially, that fabric blinds were installed later to shade from them. Additionally, from Images 3.34 and 3.37, it can be seen from the half walls and partition walls, that lights are shared, and thus do double duty.
39
Finally, from Image 3.38, it can be gathered that the shades are drawn all day for most days, since the morning sun penetrates the window completely, allowing excessive heat and light to come inside; this provides discomfort for users.
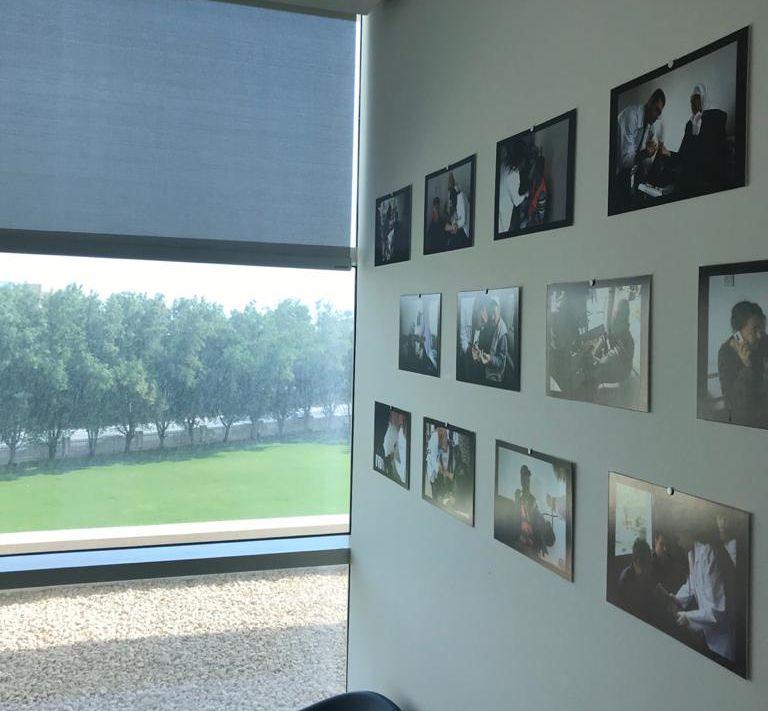
Image 3.38 Light entering the space is strong and arrives at a certain angle, capable of ruining prints/affecting art pieces that may be sensitive to light and having on the walls.
40
Corridors:
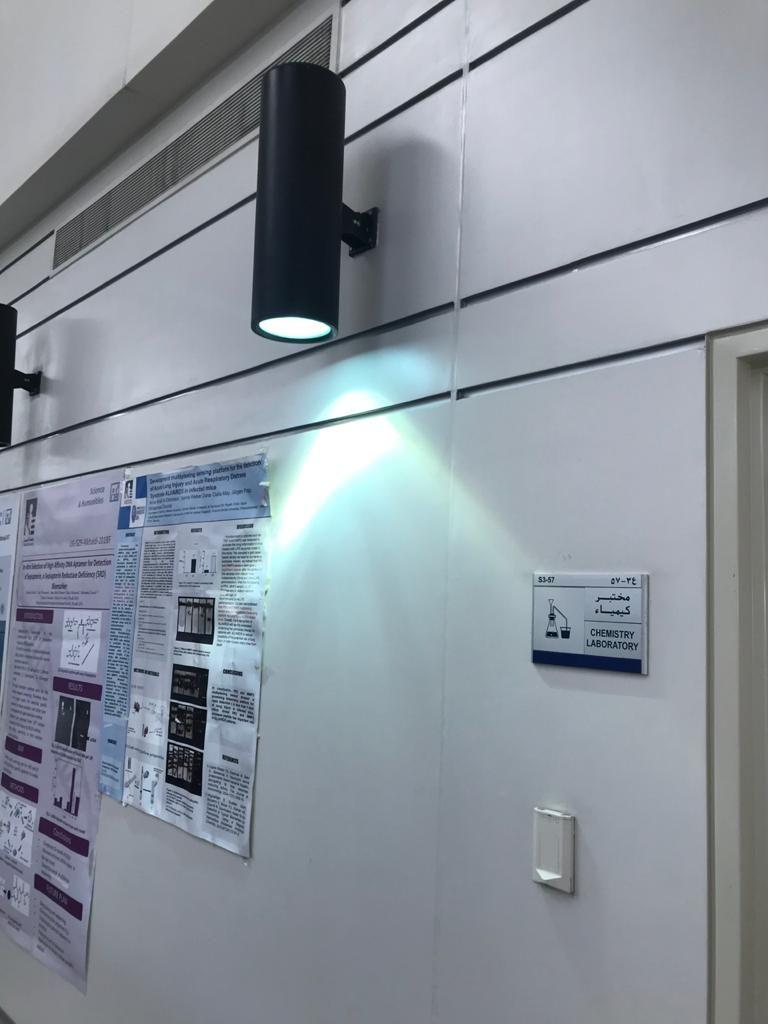
Image 3.39 Light between lab rooms, in the 3rd floor corridor.
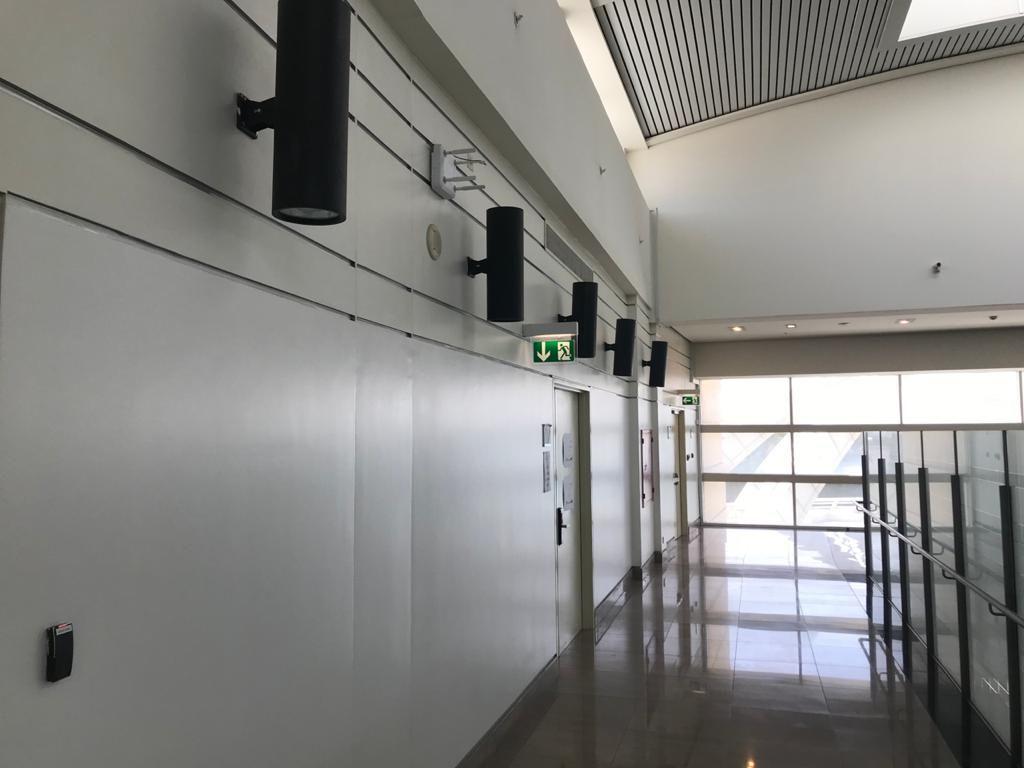
Image 3.40 Another view of the lights. Not all of them are on right now, presumably because they have been burnt out by being on all the time, regardless of need.
Notes:
Images 3.39 and 3.40 show that the corridors have lights that – thought they were meant to be open at night to show pathways – are open In the middle of the day. This consumes energy without necessity, not only is the south façade providing enough light that is then reflected further into the spaces, but there are skylights directly overhead flooding the area with natural light at all hours of the day.
41
Lighting analysis
Given 1-unit costs SAR 0.257, and that the following fixtures are used on 2nd floors: the ground, 1st, and
1 4 . . F i g
. 2 4 . i g F
3 4 . F i g .
4 4 . F i g .
Fluorescent fixture, containing 1 round light source. 26 W per source = 52 W per fixture
26 W per source = 52 W per fixture The 3rd floor has the following additional fixture:
26 W per source = 52 W per fixture
52 W per source = 52 W per fixture
The method for lighting analysis of the current fixtures in the south zone will be as follows: Assuming lights work from 7AM to 10PM every day, this means lights turn on 14 hours daily.
Method
W/hr of a fixture x 14 hours / 1000 = kW/day kW/day x 365 days = kW/year kW/year x similar fixtures on the floor = kW/year/all similar fixtures on the floor.
42
Ground floor
Fig 4.5 Plan of ground floor with lights.
43
Totaling all consumed electricity per year, results in 40,389.44kW, equaling 40,389.44 units. Each unit is SAR 0.257, meaning each year, for the south zone’s ground floor, the costs of lighting run up to SAR 10,380.09.
44
First floor
Corridor:
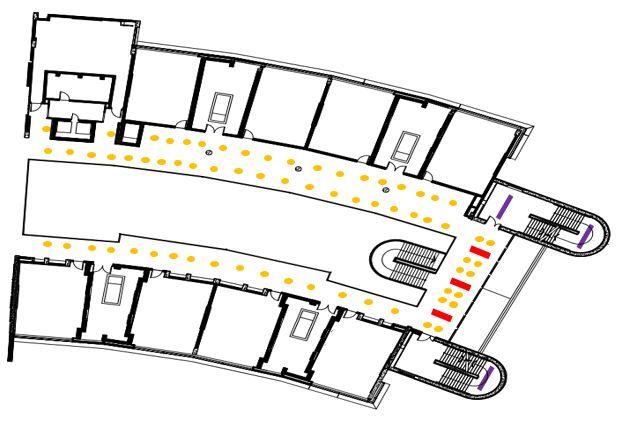
Fig. 4.6 Plan of 1st floor with lights in corridors.
52 W: 52 W x 14 hours / 1000 = 0.728 kW/day 0.728 kW/day x 365 = 265.72 kW/year 265.72 kW/year x 67 fixtures = 17,803.24 kW/year/all fixtures in the 1st floor corridor
52 W: 52 W x 14 hours / 1000 = 0.728 kW/day 0.728 kW/day x 365 = 265.72 kW/year 265.72 kW/year x 3 fixtures = 797.16 kW/year/all fixtures on the floor
52 W: 52 W x 14 hours / 1000 = 0.728 kW/day 0.728 kW/day x 365 = 265.72 kW/year 265.72 kW/year x 3 fixtures = 797.16 kW/year/all fixtures on the floor
45
Classrooms:
Fig. 4.7
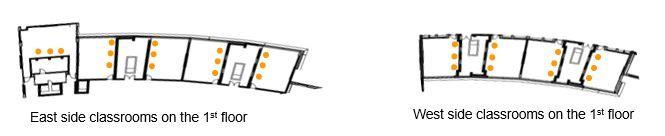
Fig. 4.8
52 W 52 W x 14 hours / 1000 = 0.728 kW/day 0.728 kW/day x 365 = 265.72 kW/year 265.72 kW/year x 27 fixtures = 7,174.44 kW/year/all fixtures in the 1st floor classrooms
Totaling all consumed electricity per year, results in 26,572kW, equaling 26,572 units. Each unit is SAR 0.257, meaning each year, for the south zone’s 1st floor classrooms and corridors, the cost for lighting runs up to SAR 6,829.
46
Second floor
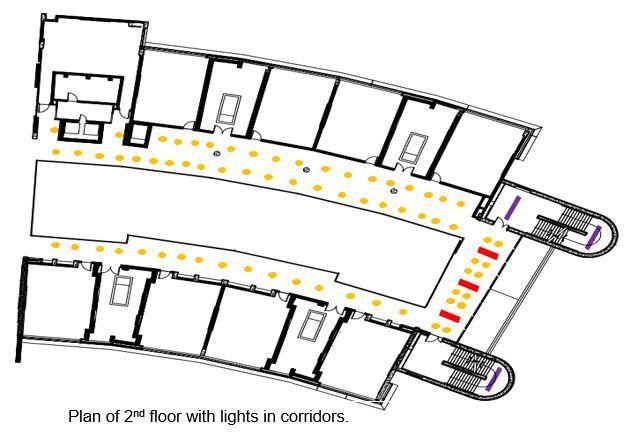
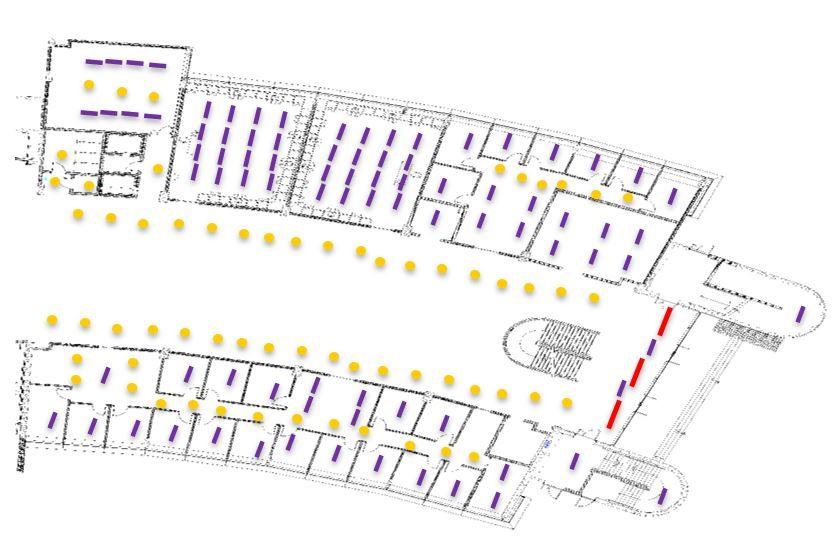
Fig. 4.9 Corridor:
52 W: 52 W x 14 hours / 1000 = 0.728 kW/day 0.728 kW/day x 365 = 265.72 kW/year 265.72 kW/year x 67 fixtures = 17,803.24 kW/year/all fixtures in the 1st floor corridor
52 W: 52 W x 14 hours / 1000 = 0.728 kW/day 0.728 kW/day x 365 = 265.72 kW/year 265.72 kW/year x 3 fixtures = 797.16 kW/year/all fixtures on the floor
52 W: 52 W x 14 hours / 1000 = 0.728 kW/day 0.728 kW/day x 365 = 265.72 kW/year 265.72 kW/year x 3 fixtures = 797.16 kW/year/all fixtures on the floor
47
Classrooms:
Fig. 4.10
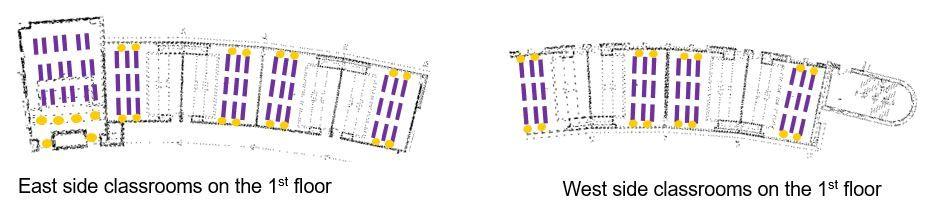
Fig. 4.11
52 W: 52 W x 14 hours / 1000 = 0.728 kW/day 0.728 kW/day x 365 = 265.72 kW/year 265.72 kW/year x 38 fixtures = 10,097.36 kW/year/all fixtures in the 2nd floor classrooms
52 W: 52 W x 14 hours / 1000 = 0.728 kW/day 0.728 kW/day x 365 = 265.72 kW/year 265.72 kW/year x 90 fixtures = 23,914.8 kW/year/all fixtures in the 2nd floor classrooms
Totaling all consumed electricity per year, results in 53,409.72kW, equaling 53,409.72 units. Each unit is SAR 0.257, meaning each year, for the south zone’s 2nd floor classrooms and corridors, the lighting bill runs up to SAR 13,726.30.
48
Third floor
Fig. 4.12
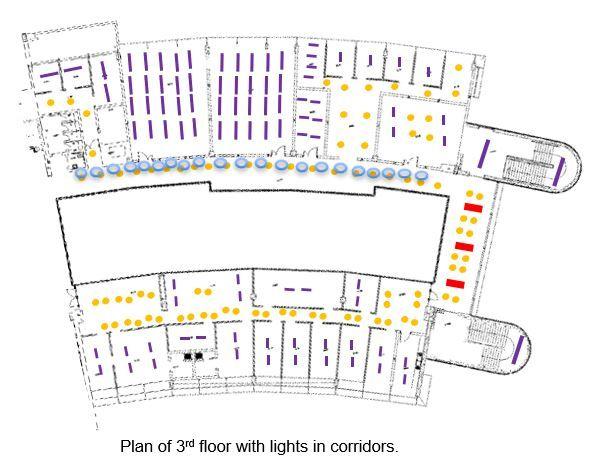
52 W: 52 W x 14 hours / 1000 = 0.728 kW/day 0.728 kW/day x 365 = 265.72 kW/year 265.72 kW/year x 90 fixtures = 23,914.8 kW/year/all fixtures in the 3rd floor.
52 W: 52 W x 14 hours / 1000 = 0.728 kW/day 0.728 kW/day x 365 = 265.72 kW/year 265.72 kW/year x 93 fixtures = 24,711.96 kW/year/all fixtures in the 3rd floor.
49
52 W:
52 W:
Totaling all consumed electricity per year, results in 54,738.32 kW, equaling 54,738.32 units. Each unit is SAR 0.257, meaning each year, for the south zone’s 3rd floor, SAR 14,067.75 is spent.
Conclusion of lighting analysis
Total spent on lighting every year, assuming each light runs 14 hours a day, for the South Zone (CoS) is the sum of the cost of lighting on ground, 1st, 2nd, and 3rd floors are: 10,380.09 + 6,829 + 13,726.30 + 14,067.75 = SAR 45,003.144/yr.
50