M:

Headlines
Summer 25/26
Canberra Residential
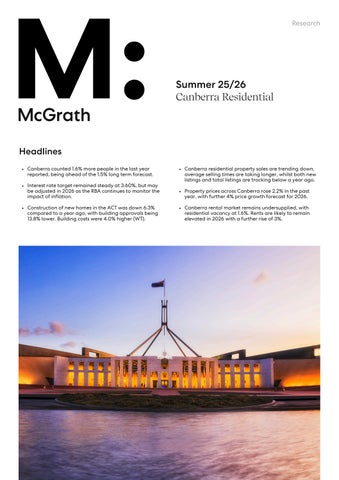
Summer 25/26
Canberra Residential


Canberra residential sale transactions tallied to 2,567 in the third quarter of 2025, down 5% from the previous quarter In the past year, the total number was 5% lower, reaching 11,310 sales This was shaped by restrictive lending conditions and an overall lower number of properties listed for sale on the market As a benchmark over the past five years, the quarter tally averaged 3,316 sales and annually, this average was 13,145 sales

In the last week of September 2025, 116 residential auctions were held across Canberra. According to Cotality, 64.7% of the homes were sold under the hammer Clearance rates above 70% suggest strong demand and a seller’s market, while a rate below 60% indicates weaker demand and a buyer’s market This result was higher than 64 2% one quarter ago when 67 auctions were held By comparison, the same quarter last year saw 62 0% homes sold, from 108 auctions.
Tracking the total number of sales each quarter
Canberra
Auction clearance rate
Canberra

Canberra homes averaged 75 days on market in Q3 2025, from the time they were listed to the day they went under contract This average duration was also 75 days (+0 days) the quarter before and 56 days (+19 days) one year ago A lower number of days on market tends to mean homes are selling faster with more desirable properties, while a higher number of days suggests a slower market with above market values. Looking back over the five-year average, it has taken 61 days to sell a home
Tracking average days on the market
Newly advertised property listings in Canberra were 8 7% lower in the month of September 2025 than the equivalent period last year, according to Cotality This change trended above the Australian average of -10.3% and above the -11 2% across Australian capital cities
Canberra’s total number of listings in the month of September 2025 were 11.5% below the equivalent period last year, according to Cotality By comparison, the Australian average change for total listings was -13.3% and across Australian capital cities was -13 6%

Residential property prices across Canberra rose by 2 2% in the year ending Q3 2025, with a 1 4% increase recorded in the most recent quarter This brought the median residential value to $916,500, reflecting a steady upward trajectory in housing demand and underlying resilience in the market. Annual residential price growth has averaged 5 6% over the past five years.
Tracking
prices

Looking ahead, McGrath Research forecasts Canberra residential property prices to increase by 5% by the end of 2025, followed by a 4% rise in 2026. These projections reflect a mix of ongoing demand from limited housing supply, a lowered number of sales transactions and a longer average number of days on market
Forecast for median prices

Canberra residential rental vacancy was recorded at 1 6% in Q3 2025, 10 bps higher in the quarter but 50 bps lower over the past year according to REIA Generally, around 3% vacancy is considered a balanced market between rental supply and demand Below this equilibrium is considered to be an undersupplied pool of rental homes. Over the past five years, rental vacancy has averaged 1 5% per year
Tracking

Tracking gross rental yield Canberra Yield +10 bps
Residential gross rental yields rose 3 bps in the Q3 2025 quarter to be 4 49% across Canberra, whilst being 10 bps more than a year ago. Gross rental yields are a good initial measure of comparing the return of a property investment before expenses are deducted. A yield greater than 4% tends to be considered most desirable for properties located in capital cities, while below this, tends to indicate high property prices relative to rent, or low rental demand Gross rental yields have averaged 4 39% over the past five years
Median weekly rent
Canberra residential rents remained steady in Q3 2025, after increasing 4 0% over the past year, to stand at $655 per week Low vacancy and high migration have kept rents elevated, now rising at a faster pace than previous years On average, over the past five years, rents grew 3 8% per year.
Tracking median weekly rents
Whilst Canberra continues to experience tight rental supply and a low delivery of new homes, McGrath Research forecast sustained upward pressure on rents of 3% at the end of 2025, with a further 3% rental growth likely in 2026
Forecast for median rents
Guiding you home
Michelle Ciesielski National Head of Research, McGrath Research
www.mcgrath.com.au/research

Canberra Canberra refers to the Greater Capital City Statistical Area or ‘Greater Canberra’ as defined by the Australian Bureau of Statistics. Find an agent