


San Francisco Bay Area and 10 Districts


Jump to Alameda Report
Jump to Contra Costa Report
Jump to Napa County Report
Jump to Santa Clara Report
Jump to Solano County Report
Jump to Sonoma County Report
San Francisco County
Jump to San Francisco County Report
San Mateo
Jump to San Mateo Report
Southern/Central Marin
Jump to Southern/Central Marin
Sea
Jump to District 1 - Northwest
Jump to District 6 - Central North
That's the question you should be asking yourself.
Our market is incredibly diverse and rapidly changing. Values vary not just by neighborhood but by street. Your home isn't necessarily worth what your neighbors' home is. It's the current market that sets the value of your home.
So, do you know what your home is worth in today's market?
Icanhelp...
Contact me for a confidential, no obligation assessment of your home's value.

If you’re planning to buy a home this year, there’s one expense you can’t afford to overlook: closing costs.
Almost every buyer knows they exist, but not that many know exactly what they cover, or how different they can be based on where you’re buying. So, let’s break them down.


Secure Your Dream Home Today

Navigating the mortgage application process can be a breeze with a little preparation. To ensure a successful application and closing, consider these helpful tips for what to avoid.


3
4 5 6 1 2
Avoid major purchases like furniture, cars, or vacations to keep your credit profile stable. Maintain your current employment to show financial stability. Always consult your mortgage professional before making large financial moves.
Avoid paying off debts or collections without professional advice.
Use verified funds for deposits to prevent closing delays.
Don't have your credit report pulled too many times - this can hurt your credit score.


In2024,thehomebuyingmarketfacessignificantchallenges highprices, steepinterestrates,andlimitedhousinginventory Formany,renovatingtheir currenthomeisamoreattractiveoptionthanpurchasinganewone.Whilethe LIRAreportpredictsadeclineinrenovationspending,expertsemphasizethat small-scaleupdatesortargetedlargerprojectscanstilldelivermajorbenefits.
Beforedivingintoarenovation,it’sessentialtoplan carefullyandbudgetwisely.Workingwithreputable professionalsiskey,especiallythoseoffering financingoptionsandtransferablewarranties.Sharing yourbudgetwithcontractorsupfrontandinvolving designersearlyensuresthatyourrenovationruns smoothlyandachievesbothfinancialandfunctional success Adetailedplanwillkeeptheprojectontrack andhelpavoidcostlysurprises


Bathrooms are a safe investment. Simple changes like a new vanity, upgraded flooring, or fresh lighting can completely transform the space. For a luxurious touch, consider adding a freestanding tub for a spa-like experience


The kitchen is a crucial space for resale value. Opening up the space or adding functional features can make a big difference Smaller updates, like upgrading appliances, cabinets, or flooring, can give your kitchen a fresh, modern feel


Bold design choices, such as statement wallpaper, unique lighting, or striking color palettes, can refresh any room. Layering textiles or mixing traditional and modern styles creates a space that feels cohesive and impactful


Renovations focusing on health are becoming increasingly popular. Use non-toxic materials free from Red List chemicals like BPA and VOCs. Consider adding air purifiers, water filtration systems, and better ventilation to create a healthier living environment


First impressions matter, and curb appeal can greatly impact your home's value. Exterior upgrades like siding, roofing, and landscaping enhance both aesthetics and security. Adding outdoor living spaces, such as a garden or entertainment area, boosts appeal even more.


Tailor renovations to your family’s lifestyle. Flexible spaces that accommodate workfrom-home needs, growing children, or future buyers will add lasting value. Think about both how your family uses the space and how it will appeal to future buyers.

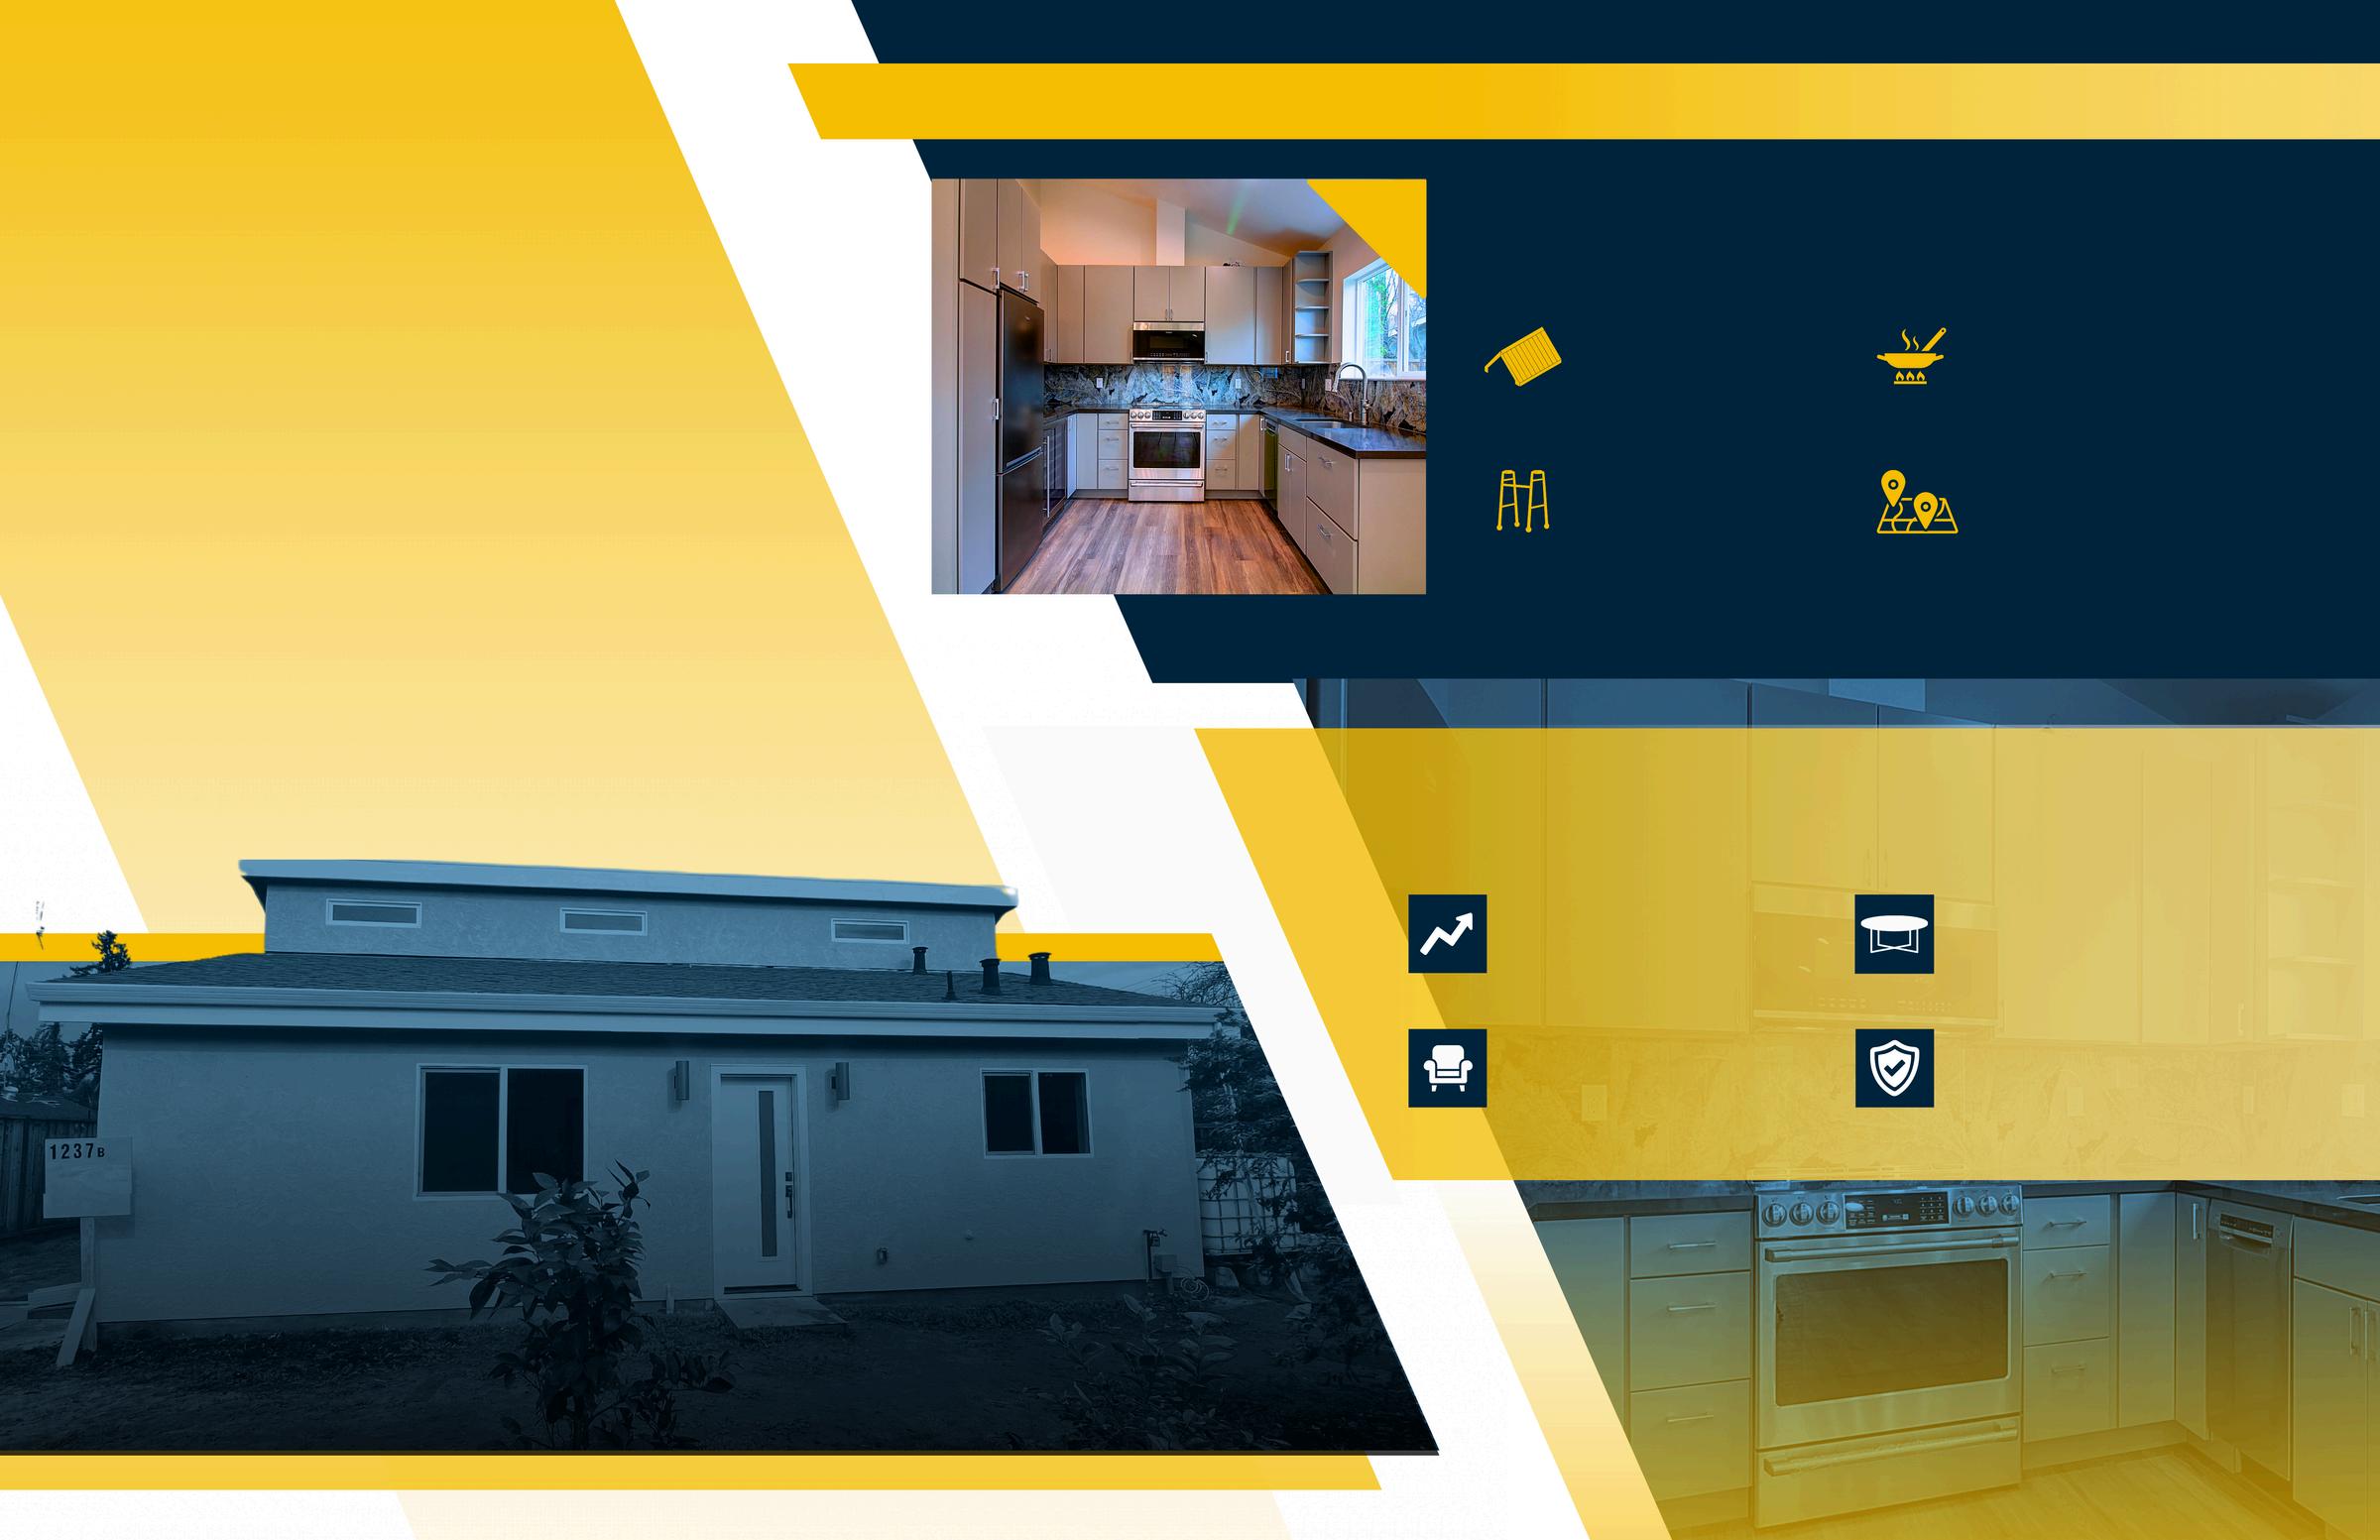

The Anenberg-Essert family in Campbell collaborated with Acton ADU to create a versatile, comfortable, and valuable addition to their property. This ADU project is a shining example of how a well-designed accessory dwelling unit can increase property value and serve a family’s unique needs.
The family envisioned an ADU that would function as an independent living space for family members, enhance their property’s worth, and provide seamless integration with the main home They wanted a space that balanced privacy with connectivity, feeling like a natural extension of their residence
Constructed at 747 square feet, this ADU was designed with modern, high-quality finishes to serve both aesthetic and practical needs. Key features include:
Vaulted Ceilings
Creates a spacious, open atmosphere
Senior-Friendly Living
Safe, independent space for elderly family members
Fully Equipped Kitchen
Modern amenities for everyday convenience
Open Living Area
Multipurpose area for relaxation and entertainment
The completion of the Anenberg-Essert ADU led to several valuable outcomes:
Increased Property Value
The ADU addition significantly boosted property value
Flexible Living Space
A versatile space for family, guests, or as a rental
Modern Comforts
High-end finishes and amenities enhance both function and style.
Enhanced Family Living
The ADU enriches the AnenbergEssert family’s home with both privacy and connection

Thinking about how an ADU could fit into your family’s lifestyle or property investment strategy?
Trust Acton ADU to guide you every step of the way.

When it comes to home ownership, knowing who you can trust is crucial. That's why we've curated a select list of trusted vendors who are ready to help with your home goals.


There were 1,674 single-family homes for sale, providing 3.1 months of inventory. There were 852 new listings, and 534 homes sold at a median price of $1.2m. The median overbid percentage was at 106.8%, with an average of 27 days on the market.
There were 1,058 condo and townhome units for sale, providing 7 9 months of inventory There were 316 new listings and 134 units sold at a median sale price of $645k. The median overbid percentage was at 99.6%, with an average of 52 days on the market.

mily Homes ory
534 Sold Listings
$1.2M Median Sale Price
8% ist
27 Avg Days on Market
InfoSparks, includes all single-family homes, condos and California Area above from September 2024 to September 2025. This data, and may vary from the time the data was gathered. All but not guaranteed. DRE# 01995149. Copyright KW Advisors San Francisco | Napa Valley 2025. Each office is independently owned and operated.
316
New Listings
134 Sold Listings
7.9
Months of Inventory $645K
Median Sale Price 99.6%
Median Sale vs List 52 Avg Days on Market
SEPTEMBER 2024 - SEPTEMBER 2025
Single-Family Homes
Last 12 months, year-over-year.
Condos & Townhomes
Last 12 months, year-over-year
The median sale price has decreased from $1 265m last September 2024, to $1 26m as of September 2025
The median sale price has decreased from $685k last September 2024, to $645k as of September 2025
The average time spent on the market went up from 25 days last September 2024, to 27 days as of September 2025
The average time spent on the market went up from 30 days in September 2024, to 52 days as of September 2025.
The overbid percentage has decreased from 107% last September 2024, to 106 8% a year later
The overbid percentage has decreased from 101.2% last September 2024, to 99.6% a year later.

There were 1,585 single-family homes for sale, providing 2.5 months of inventory. There were 989 new listings, and 660 homes sold at a median price of $850k. The median overbid percentage was at 100%, with an average of 37 days on the market.
There were 561 condo and townhome units for sale, providing 3.5 months of inventory. There were 265 new listings and 189 units sold at a median sale price of $599k. The median overbid percentage was at 99.2%, with an average of 41 days on the market

989 New Listings
660 Sold Listings
2.5 Months of Inventory
$850K
Median Sale Price
100%
Median Sale vs List
37
Avg Days on Market
The data, sourced from InfoSparks, includes all single-family homes, condos and townhomes in the California Area above from September 2024 to September 2025. This may include preliminary data, and may vary from the time the data was gathered. All data is deemed reliable but not guaranteed. DRE# 01995149. Copyright KW Advisors San Francisco | Napa Valley 2025. Each office is independently owned and operated.
265
New Listings
189 Sold Listings
3.5
Months of Inventory $599K
Median Sale Price 99.2%
Median Sale vs List 41 Avg Days on Market

SEPTEMBER 2024 - SEPTEMBER 2025
mes year-over-year.
omes , year-over-year
The median sale price has decreased from $863k last September 2024, to $850k as of September 2025
Condos & Townhomes
The median sale price has decreased from $625k last September 2024, to $599k as of September 2025
The average time spent on the market went up from 30 days last September 2024, to 37 days as of September 2025
The average time spent on the market went up from 35 days in September 2024, to 41 days as of September 2025.
The overbid percentage has remained the same from 100% last September 2024, to 100% a year later
Condos & Townhomes
The overbid percentage has decreased from 100% last September 2024, to 99.2% a year later.
What's in the Napa County data?
There were 495 single-family homes for sale, providing 7.1 months of inventory. There were 100 new listings, and 76 homes sold at a median price of $899k. The median overbid percentage was at 97 4%, with an average of 108 days on the market
There were 63 condo and townhome units for sale, providing 6 months of inventory. There were 17 new listings and 16 units sold at a median sale price of $732k. The median overbid percentage was at 98%, with an average of 68 days on the market.

100 New Listings
76 Sold Listings
7.1 Months of Inventory
$899K Median Sale Price
97.4%
Median Sale vs List
108 Avg Days on Market
Listings
Median Sale vs List
Listings

SEPTEMBER 2024 - SEPTEMBER 2025 LISTINGS FOR SALE
Single-Family Homes
Last 12 months, year-over-year.
Condos & Townhomes
Last 12 months, year-over-year
The median sale price has increased from $898k last September 2024, to $899k as of September 2025
Condos & Townhomes
The median sale price has decreased from $747k last September 2024, to $732k as of September 2025
The average time spent on the market went up from 63 days last September 2024, to 108 days as of September 2025
The average time spent on the market went up from 47 days in September 2024, to 68 days as of September 2025.
Single-Family Homes
The overbid percentage has decreased from 98 1% last September 2024, to 97 4% a year later
Condos & Townhomes
The overbid percentage has decreased from 99.8% last September 2024, to 98% a year later.

What's in the San Francisco County
There were 268 single-family homes for sale, providing 1.4 months of inventory. There were 337 new listings, and 172 homes sold at a median price of $1.7m. The median overbid percentage was at 110.7%, with an average of 27 days on the market.
There were 576 condo and townhome units for sale, providing 3 months of inventory. There were 430 new listings and 208 units sold at a median sale price of $1.1m. The median overbid percentage was at 100%, with an average of 47 days on the market.

337 New Listings
172 Sold Listings
1.4 Months of Inventory
$1.7M Median Sale Price
110.7%
Median Sale vs List
27 Avg Days on Market
InfoSparks, includes all single-family homes, condos and California Area above from September 2024 to September 2025. This data, and may vary from the time the data was gathered. All but not guaranteed. DRE# 01995149. Copyright KW Advisors San Francisco | Napa Valley 2025. Each office is independently owned and operated.
Condo & Townhomes
430
New Listings
208
Sold Listings
3
Months of Inventory
$1.1M
Median Sale Price 100%
Median Sale vs List
47 Avg Days on Market

SEPTEMBER 2024 - SEPTEMBER 2025
gle-Family Homes
t 12 months, year-over-year.
ndos & Townhomes
t 12 months, year-over-year
The median sale price has increased from $1 6m last September 2024, to $1 7m as of September 2025
Condos & Townhomes
The median sale price has decreased from $1 12m last September 2024, to $1 11m as of September 2025
The average time spent on the market went down from 28 days last September 2024, to 27 days as of September 2025
Condos & Townhomes
The average time spent on the market went down from 56 days in September 2024, to 47 days as of September 2025.
Single-Family Homes
The overbid percentage has increased from 110 4% last September 2024, to 110 7% a year later
Condos & Townhomes
The overbid percentage has remained the same from 100% last September 2024, to 100% a year later.

507 New Listings
359 Sold Listings
1.7 Months of Inventory
$2M Median Sale Price
100.6%
Median Sale vs List
31 Avg Days on Market
sourced from InfoSparks, includes all single-family homes, condos and in the California Area above from September 2024 to September 2025. This preliminary data, and may vary from the time the data was gathered. All deemed reliable but not guaranteed. DRE# 01995149. Copyright KW Advisors San Francisco | Napa Valley 2025. Each office is independently owned and operated.
New Listings
97
Sold Listings
3
Months of Inventory
$876K
Median Sale Price 98.1%
Median Sale vs List
61 Avg Days on Market
The median sale price has increased from $1 9m last September 2024, to $2m as of September 2025
Condos & Townhomes
The median sale price has decreased from $888k last September 2024, to $876k as of September 2025
The average time spent on the market went up from 25 days last September 2024, to 31 days as of September 2025
Condos & Townhomes
The average time spent on the market went up from 43 days in September 2024, to 61 days as of September 2025.
Single-Family Homes
The overbid percentage has decreased from 103% last September 2024, to 100 6% a year later
Condos & Townhomes
The overbid percentage has decreased from 100% last September 2024, to 98.1% a year later.

There were 957 single-family providing 1.4 months of inve new listings, and 695 homes price of $1.9m. The median o was at 100 5%, with an avera market.
There were 729 condo and to sale, providing 2.6 months of were 429 new listings and 28 median sale price of $955k. T percentage was at 100%, wit days on the market
964 New Listings
1.4 Months of Inventory
100.5%
Median Sale vs List
695 Sold Listings
$1.9M Median Sale Price
26 Avg Days on Market
homes, condos and September 2025. This data was gathered. All Copyright KW Advisors San Francisco | Napa Valley 2025. Each office is independently owned and operated.
New Listings
2.6
Sold Listings
Months of Inventory $955K
Median Sale Price 100%
Median Sale vs List 37 Avg Days on Market 280

The median sale price has increased from $1 9m last September 2024, to $1 95 as of September 2025
Condos & Townhomes
The median sale price has decreased from $1m last September 2024, to $955k as of September 2025
The average time spent on the market went up from 22 days last September 2024, to 26 days as of September 2025
The average time spent on the market went up from 29 days in September 2024, to 37 days as of September 2025.
Single-Family Homes
The overbid percentage has decreased from 102 7% last September 2024, to 100 5% a year later
Condos & Townhomes
The overbid percentage has decreased from 100.5% last September 2024, to 100% a year later.

What's in the Solano County
There were 866 single-family homes for sale, providing 2.9 months of inventory. There were 324 new listings, and 289 homes sold at a median price of $606k. The median overbid percentage was at 100%, with an average of 52 days on the market.
There were 107 condo and townhome units for sale, providing 4.4 months of inventory. There were 32 new listings and 21 units sold at a median sale price of $385k. The median overbid percentage was at 100%, with an average of 48 days on the market

324 New Listings
289 Sold Listings
2.9 Months of Inventory
$606K
Median Sale Price
100%
Median Sale vs List
52
Avg Days on Market
The data, sourced from InfoSparks, includes all single-family homes, condos and townhomes in the California Area above from September 2024 to September 2025. This may include preliminary data, and may vary from the time the data was gathered. All data is deemed reliable but not guaranteed. DRE# 01995149. Copyright KW Advisors San Francisco | Napa Valley 2025. Each office is independently owned and operated.
New Listings 4.4 Months of Inventory
Median Sale vs List
Listings
The median sale price has decreased from $615k last September 2024, to $606k as of September 2025
The median sale price has increased from $375k last September 2024, to $385k as of September 2025
The average time spent on the market went up from 47 days last September 2024, to 52 days as of September 2025
The average time spent on the market went down from 65 days in September 2024, to 48 days as of September 2025.
The overbid percentage has remained the same from 100% last September 2024, to 100% a year later
The overbid percentage has remained the same from 100% last September 2024, to 100% a year later.
There were 1,078 single-family homes for sale, providing 3.3 months of inventory. There were 312 new listings, and 328 homes sold at a median price of $805k. The median overbid percentage was at 99.4%, with an average of 70 days on the market.
There were 146 condo and townhome units for sale, providing 3.6 months of inventory. There were 47 new listings and 55 units sold at a median sale price of $490k. The median overbid percentage was at 98 9%, with an average of 69 days on the market.

312 New Listings
328 Sold Listings
3.3 Months of Inventory
$805K Median Sale Price
99.4%
Median Sale vs List
70 Avg Days on Market
47
New Listings
55
Sold Listings
3.6
Months of Inventory $490K
Median Sale Price 98.9%
Median Sale vs List
69 Avg Days on Market
The median sale price has decreased from $831k last September 2024, to $805k as of September 2025
The median sale price has decreased from $510k last September 2024, to $490k as of September 2025
The average time spent on the market went up from 53 days last September 2024, to 70 days as of September 2025
The average time spent on the market went up from 61 days in September 2024, to 69 days as of September 2025.
The overbid percentage has decreased from 100% last September 2024, to 99 4% a year later
Condos & Townhomes
The overbid percentage has decreased from 100% last September 2024, to 98.9% a year later.
There were 435 single-family providing 2.8 months of inve new listings, and 162 homes price of $1.7m. The median was at 100%, with an averag market.
There were 146 condo and to sale, providing 3.5 months o were 47 new listings and 38 sale price of $752k. The med percentage was at 98.7%, wi days on the market.

169 New Listings
2.8 Months of Inventory
100%
Median Sale vs List
162 Sold Listings
$1.7M Median Sale Price
43 Avg Days on Market
homes, condos and September 2025. This data was gathered. All Copyright KW Advisors San Francisco | Napa Valley 2025. Each office is independently owned and operated.
47
New Listings
38
Sold Listings
3.5
Months of Inventory $752K Median Sale Price 98.7%
Median Sale vs List 74 Avg Days on Market

The median sale price has decreased from $1 75m last September 2024, to $1 71m as of September 2025
The median sale price has decreased from $805k last September 2024, to $752k as of September 2025
The average time spent on the market went up from 35 days last September 2024, to 43 days as of September 2025
The average time spent on the market went up from 43 days in September 2024, to 74 days as of September 2025.
The overbid percentage has remained the same from 100% last September 2024, to 100% a year later
Condos & Townhomes
The overbid percentage has decreased from 100% last September 2024, to 98.7% a year later.


ntory
16 Sold Listings
$2.3M Median Sale Price
1% s List
22 Avg Days on Market
from InfoSparks, includes all single-family homes, condos and California Area above from September 2024 to September 2025. This preliminary data, and may vary from the time the data was gathered. All reliable but not guaranteed. DRE# 01995149. Copyright KW Advisors San Francisco | Napa Valley 2025. Each office is independently owned and operated.
Condo & To
New Listings
1.2 Months of Inventory $ M
111.4%
Median Sale vs List Av

SEPTEMBER 2024 - SEPTEMBER 2025
Single-Family Homes
The median sale price has decreased from $2 5m last September 2024, to $2 3m as of September 2025
Condos & Townhomes
The median sale price has increased from $1 1m last September 2024, to $1 3m as of September 2025
Single-Family Homes
The average time spent on the market went up from 21 days last September 2024, to 22 days as of September 2025
Condos & Townhomes
The average time spent on the market went down from 23 days in September 2024, to 18 days as of September 2025.
Single-Family Homes
The overbid percentage has increased from 104 1% last September 2024, to 109 1% a year later
Condos & Townhomes
The overbid percentage has increased from 104.8% last September 2024, to 111.4% a year later.

Sunset & Parkside (Inner, Central, Outer), Golden Gate Heights
There were 32 single-family homes for sale, providing 0.9 months of inventory. There were 57 new listings, and 32 homes sold at a median price of $1.6m. The median overbid percentage was at 123.4%, with an average of 15 days on the market.
There were 9 condo and townhome units for sale, providing 2.8 months of inventory. There were 7 new listings and 4 units sold at a median sale price of $1.6m. The median overbid percentage was at 101.9%, with an average of 22 days on the market.
57 New Listings
32 Sold Listings
0.9 Months of Inventory
$1.6M Median Sale Price
123.4%
Median Sale vs List
15 Avg Days on Market
The data, sourced from InfoSparks, includes all single-family homes, condos and townhomes in the California Area above from September 2024 to September 2025. This may include preliminary data, and may vary from the time the data was gathered. All data is deemed reliable but not guaranteed. DRE# 01995149. Copyright KW Advisors San Francisco | Napa Valley 2025. Each office is independently owned and operated.
7
New Listings
4
Sold Listings
2.8
Months of Inventory
$1.6M
Median Sale Price
101.9%
Median Sale vs List
22 Avg Days on Market

SEPTEMBER 2024 - SEPTEMBER 2025
Single-Family Homes
Last 12 months, year-over-year.
Condos & Townhomes
Last 12 months, year-over-year
Single-Family Homes
The median sale price has increased from $1 5m last September 2024, to $1 6m as of September 2025
Condos & Townhomes
The median sale price has increased from $989k last September 2024, to $1 6m as of September 2025
The average time spent on the market went down from 19 days last September 2024, to 15 days as of September 2025
Condos & Townhomes
The average time spent on the market went down from 41 days in September 2024, to 22 days as of September 2025.
Single-Family Homes
The overbid percentage has increased from 119 2% last September 2024, to 123 4% a year later
Condos & Townhomes
The overbid percentage has increased from 100% last September 2024, to 101.9% a year later.

Lake Shore, Lakeside, Merced Manor, Merced Heights, Ingleside, Ingleside Heights, Oceanview
There were 15 single-family homes for sale, providing 1.3 months of inventory. There were 18 new listings, and 2 homes sold at a median price of $1.2m. The median overbid percentage was at 129 2%, with an average of 13 days on the market
There were 3 condo and townhome units for sale, providing 1.4 months of inventory. There were 2 new listings and 2 units sold at a median sale price of $499k. The median overbid percentage was at 107.9%, with an average of 16 days on the market.
18 New Listings
2 Sold Listings
1.3 Months of Inventory
$1.2M Median Sale Price
129.2%
Median Sale vs List
13 Avg Days on Market
The data, sourced from InfoSparks, includes all single-family homes, condos and townhomes in the California Area above from September 2024 to September 2025. This may include preliminary data, and may vary from the time the data was gathered. All data is deemed reliable but not guaranteed. DRE# 01995149. Copyright KW Advisors San Francisco | Napa Valley 2025. Each office is independently owned and operated.

SEPTEMBER 2024 - SEPTEMBER 2025
amily Homes months, year-over-year. & Townhomes
months, year-over-year
Single-Family Homes
The median sale price has decreased from $1 3m last September 2024, to $1 2m as of September 2025
Condos & Townhomes
The median sale price has decreased from $788k last September 2024, to $499k as of September 2025
The average time spent on the market went down from 41 days last September 2024, to 13 days as of September 2025
Condos & Townhomes
The average time spent on the market went down from 78 days in September 2024, to 16 days as of September 2025.
Single-Family Homes
The overbid percentage has increased from 107 3% last September 2024, to 129 2% a year later
Condos & Townhomes
The overbid percentage has increased from 98.7% last September 2024, to 107.9% a year later.
St. Francis Wood, Forest Hill, West Portal, Forest Knolls, Diamond Heights, Midtown Terrace, Miraloma Park, Sunnyside, Balboa Terrace, Ingleside Terrace, Mt Davidson Manor, Sherwood Forest, Monterey Heights, Westwood Highlands
There were 23 single-family homes for sale, providing 0.8 months of inventory. There were 36 new listings, and 19 homes sold at a median price of $1.7m. The median overbid percentage was at 111.3%, with an average of 22 days on the market.
There were 12 condo and townhome units for sale, providing 2.8 months of inventory. There were 8 new listings and 5 units sold at a median sale price of $650k. The median overbid percentage was at 100%, with an average of 60 days on the market.

36 New Listings
19 Sold Listings
0.8 Months of Inventory
$1.7M Median Sale Price
111.3%
Median Sale vs List
22 Avg Days on Market
The data, sourced from InfoSparks, includes all single-family homes, condos and townhomes in the California Area above from September 2024 to September 2025. This may include preliminary data, and may vary from the time the data was gathered. All data is deemed reliable but not guaranteed. DRE# 01995149. Copyright KW Advisors San Francisco | Napa Valley 2025. Each office is independently owned and operated.
8
New Listings
2.8
Months of Inventory
$650K
Median Sale Price 100%
Median Sale vs List 60 Avg Days on Market 5 Sold Listings

SEPTEMBER 2024 - SEPTEMBER 2025
Single-Family Homes
Last 12 months, year-over-year.
Condos & Townhomes
Last 12 months, year-over-year
Single-Family Homes
The median sale price has decreased from $1 9m last September 2024, to $1 7m as of September 2025
Condos & Townhomes
The median sale price has decreased from $686k last September 2024, to $650k as of September 2025
The average time spent on the market went down from 29 days last September 2024, to 22 days as of September 2025
Condos & Townhomes
The average time spent on the market went down from 104 days in September 2024, to 60 days as of September 2025.
Single-Family Homes
The overbid percentage has increased from 110 9% last September 2024, to 111 3% a year later
Condos & Townhomes
The overbid percentage has decreased from 102.6% last September 2024, to 100% a year later.

Noe Valley, Eureka Valley/Dolores Heights (Castro, Liberty Hill), Cole Valley, Glen Park, Corona Heights, Clarendon Heights, Ashbury Heights, Buena Vista Park, Haight Ashbury, Duboce Triangle, Twin Peaks, Mission Dolores, Parnassus Heights
There were 46 single-family homes for sale, providing 1.7 months of inventory. There were 65 new listings, and 27 homes sold at a median price of $2.8m. The median overbid percentage was at 109.1%, with an average of 28 days on the market.
There were 47 condo and townhome units for sale, providing 1.8 months of inventory. There were 56 new listings and 28 units sold at a median sale price of $1.1m. The median overbid percentage was at 102.3%, with an average of 29 days on the market.

65 New Listings
27 Sold Listings
1.7 Months of Inventory
$2.8M Median Sale Price
109.1%
Median Sale vs List
28 Avg Days on Market
The data, sourced from InfoSparks, includes all single-family homes, condos and townhomes in the California Area above from September 2024 to September 2025. This may include preliminary data, and may vary from the time the data was gathered. All data is deemed reliable but not guaranteed. DRE# 01995149. Copyright KW Advisors San Francisco | Napa Valley 2025. Each office is independently owned and operated.
SEPTEMBER 2024 - SEPTEMBER 2025
mes
year-over-year.
omes year-over-year
Single-Family Homes
The median sale price has increased from $2 2m last September 2024, to $2 8m as of September 2025
Condos & Townhomes
The median sale price has decreased from $1 5m last September 2024, to $1 1m as of September 2025
The average time spent on the market remained the same from 28 days last September 2024, to 28 days as of September 2025
Condos & Townhomes
The average time spent on the market went down from 33 days in September 2024, to 29 days as of September 2025.
Single-Family Homes
The overbid percentage has decreased from 116 9% last September 2024, to 109 1% a year later
Condos & Townhomes
The overbid percentage has decreased from 110% last September 2024, to 102.3% a year later.

Hayes Valley, North of Panhandle (NOPA), Alamo Square, Western Addition, Anza Vista, Lower Pacific Heights
There were 4 single-family homes for sale, providing 1.3 months of inventory. There were 6 new listings, and 4 homes sold at a median price of $2.7m. The median overbid percentage was at 106%, with an average of 70 days on the market
There were 34 condo and townhome units for sale, providing 1.8 months of inventory. There were 43 new listings and 22 units sold at a median sale price of $1.1m. The median overbid percentage was at 101.2%, with an average of 48 days on the market.

6 ew Listings
4 Sold Listings
1.3 Months of Inventory
$2.7M Median Sale Price
106% Median Sale vs List
70 Avg Days on Market
The data, sourced from InfoSparks, includes all single-family homes, condos and townhomes in the California Area above from September 2024 to September 2025. This may include preliminary data, and may vary from the time the data was gathered. All data is deemed reliable but not guaranteed. DRE# 01995149. Copyright KW Advisors San Francisco | Napa Valley 2025. Each office is independently owned and operated.
43
New Listings
22
Sold Listings
1.8
Months of Inventory
$1.1M
Median Sale Price
101.2%
Median Sale vs List
48 Avg Days on Market
SEPTEMBER 2024 - SEPTEMBER 2025
Single-Family Homes
Last 12 months, year-over-year.
Condos & Townhomes
Last 12 months, year-over-year
Single-Family Homes
The median sale price has increased from $2 5m last September 2024, to $2 7m as of September 2025
Condos & Townhomes
The median sale price has decreased from $1 3m last September 2024, to $1 1m as of September 2025
The average time spent on the market went up from 18 days last September 2024, to 70 days as of September 2025
Condos & Townhomes
The average time spent on the market went down from 59 days in September 2024, to 48 days as of September 2025.
Single-Family Homes
The overbid percentage has decreased from 114% last September 2024, to 106% a year later
Condos & Townhomes
The overbid percentage has increased from 98.5% last September 2024, to 101.2% a year later.

Pacific Heights, Presidio H Hollow, Marina
There were 27 single-family providing 2.7 months of inve new listings, and 11 homes s of $4.7m. The median overb 107%, with an average of 18
There were 40 condo and tow sale, providing 1.7 months o were 48 new listings and 24 sale price of $1.9m. The med percentage was at 102.4%, w days on the market.
homes, condos and September 2025. This data was gathered. All Copyright KW Advisors San Francisco | Napa Valley 2025. Each office is independently owned and operated.
New Listings
1.7
Months of Inventory
102.4%
Median Sale vs List
Single-Family Homes
The median sale price has increased from $3 8m last September 2024, to $4 7m as of September 2025
Condos & Townhomes
The median sale price has increased from $1 4m last September 2024, to $1 9m as of September 2025
The average time spent on the market went down from 38 days last September 2024, to 18 days as of September 2025
Condos & Townhomes
The average time spent on the market went down from 53 days in September 2024, to 38 days as of September 2025.
Single-Family Homes
The overbid percentage has increased from 100% last September 2024, to 107% a year later
Condos & Townhomes
The overbid percentage has increased from 100% last September 2024, to 102.4% a year later.
Russian Hill, Nob Hill, Telegraph Hill, North Beach, Financial District, North Waterfront, Downtown, Van Ness/Civic Center, Tenderloin
There were 4 single-family homes for sale, providing 1.6 months of inventory. There were 5 new listings, and 4 homes sold at a median price of $2.9m. The median overbid percentage was at 101 3%, with an average of 62 days on the market
There were 128 condo and townhome units for sale, providing 4 months of inventory. There were 80 new listings and 33 units sold at a median sale price of $940k. The median overbid percentage was at 100%, with an average of 62 days on the market.
4
Months of Inventor 100%
Median Sale vs Lis
The median sale price has increased from $0 last September 2024, to $2 9m as of September 2025
The median sale price has increased from $880k last September 2024, to $940k as of September 2025
The average time spent on the market went up from 0 days last September 2024, to 62 days as of September 2025
The average time spent on the market went down from 69 days in September 2024, to 62 days as of September 2025.
The overbid percentage has increased from 0% last September 2024, to 101 3% a year later
The overbid percentage has remained the same from 100% last September 2024, to 100% a year later.
SoMa, South Beach, Mission Bay, Potrero Hill, Dogpatch, Bernal Heights, Inner Mission, Yerba Buena
What's in the District 9 - East data?
There were 30 single-family homes for sale, providing 1.4 months of inventory. There were 42 new listings, and 22 homes sold at a median price of $1.6m. The median overbid percentage was at 117.5%, with an average of 27 days on the market.
There were 255 condo and townhome units for sale, providing 3.7 months of inventory. There were 151 new listings and 72 units sold at a median sale price of $961k. The median overbid percentage was at 98.3%, with an average of 59 days on the market.
42 New Listings
22 Sold Listings
1.4 Months of Inventory
$1.6M Median Sale Price
117.5%
Median Sale vs List
27 Avg Days on Market
The data, sourced from InfoSparks, includes all single-family homes, condos and townhomes in the California Area above from September 2024 to September 2025. This may include preliminary data, and may vary from the time the data was gathered. All data is deemed reliable but not guaranteed. DRE# 01995149. Copyright KW Advisors San Francisco | Napa Valley 2025. Each office is independently owned and operated.
New Listings
3.7
Months of Inventory 98.3%
Median Sale vs List
The median sale price has decreased from $1 7m last September 2024, to $1 6m as of September 2025
Condos & Townhomes
The median sale price has decreased from $975k last September 2024, to $961k as of September 2025
The average time spent on the market went up from 13 days last September 2024, to 27 days as of September 2025
Condos & Townhomes
The average time spent on the market went down from 65 days in September 2024, to 59 days as of September 2025.
Single-Family Homes
The overbid percentage has increased from 114 7% last September 2024, to 117 5% a year later
Condos & Townhomes
The overbid percentage has decreased from 98.9% last September 2024, to 98.3% a year later.
Bayview, Bayview Heights
Portola, Visitacion Valley,
Mission Terrace, Crocker
Mission
There were 70 single-family h providing 1.8 months of inve new listings, and 35 homes s of $999k. The median overbi 105 1%, with an average of 3
There were 38 condo and tow sale, providing 6.2 months of were 14 new listings and 4 u sale price of $675k. The med percentage was at 99.6%, wi days on the market.
homes, condos and September 2025. This data was gathered. All Copyright KW Advisors San Francisco | Napa Valley 2025. Each office is independently owned and operated.
New Listings 6.2
Months of Inventory 99.6%
Median Sale vs List
The median sale price has decreased from $1 1m last September 2024, to $999k as of September 2025
Condos & Townhomes
The median sale price has decreased from $795k last September 2024, to $675k as of September 2025
The average time spent on the market remained the same from 36 days last September 2024, to 36 days as of September 2025
Condos & Townhomes
The average time spent on the market went down from 53 days in September 2024, to 42 days as of September 2025.
The overbid percentage has decreased from 108 6% last September 2024, to 105 1% a year later
Condos & Townhomes
The overbid percentage has increased from 99.5% last September 2024, to 99.6% a year later.