


Palo Alto Los Altos
Jump to Palo Alto Report
Jump to Redwood City Report
Portola Valley
Jump to Portola Valley Report
Menlo Park
Jump to Menlo Park Report
Jump to Atherton Report
Jump to Los Altos Report
Jump to San Jose Report
Mountain View
Jump to Mountain View Report
San Mateo County
Jump to San Mateo County Report
Santa Clara County
Jump to Santa Clara County Report
Jump to Monterey County Report
Jump to Santa Cruz County Report
Jump to East Palo Alto Report
Jump to Sunnyvale Report

Santa Clara City
Jump to Santa Clara City Report
Saratoga
Jump to Saratoga Report
That's the question you should be asking yourself.
Our market is incredibly diverse and rapidly changing. Values vary not just by neighborhood but by street. Your home isn't necessarily worth what your neighbors' home is. It's the current market that sets the value of your home.
So, do you know what your home is worth in today's market?
Icanhelp...
Contact me for a confidential, no obligation assessment of your home's value.

Momentum is quietly building in the housing market. New data from NerdWallet shows more Americans are starting to think about buying a home again. Last year, 15% of respondents said they planned to buy a home in the next 12 months. This year, that number rose to 17%.
That 2% increase might not sound like a big jump, but in a market where buyer demand has been cooling for the past few years, it’s a sign things are starting to shift. More people are feeling ready (or at least closer to ready) to take the leap and buy a home in 2026.
And if you’re in that camp and buying a home is on your goal sheet this year, this is your nudge to connect with a local agent and a trusted lender to start laying the groundwork now.


Secure Your Dream Home Today

Navigating the mortgage application process can be a breeze with a little preparation. To ensure a successful application and closing, consider these helpful tips for what to avoid.


3
4 5 6 1 2
Avoid major purchases like furniture, cars, or vacations to keep your credit profile stable. Maintain your current employment to show financial stability. Always consult your mortgage professional before making large financial moves.
Avoid paying off debts or collections without professional advice.
Use verified funds for deposits to prevent closing delays.
Don't have your credit report pulled too many times - this can hurt your credit score.


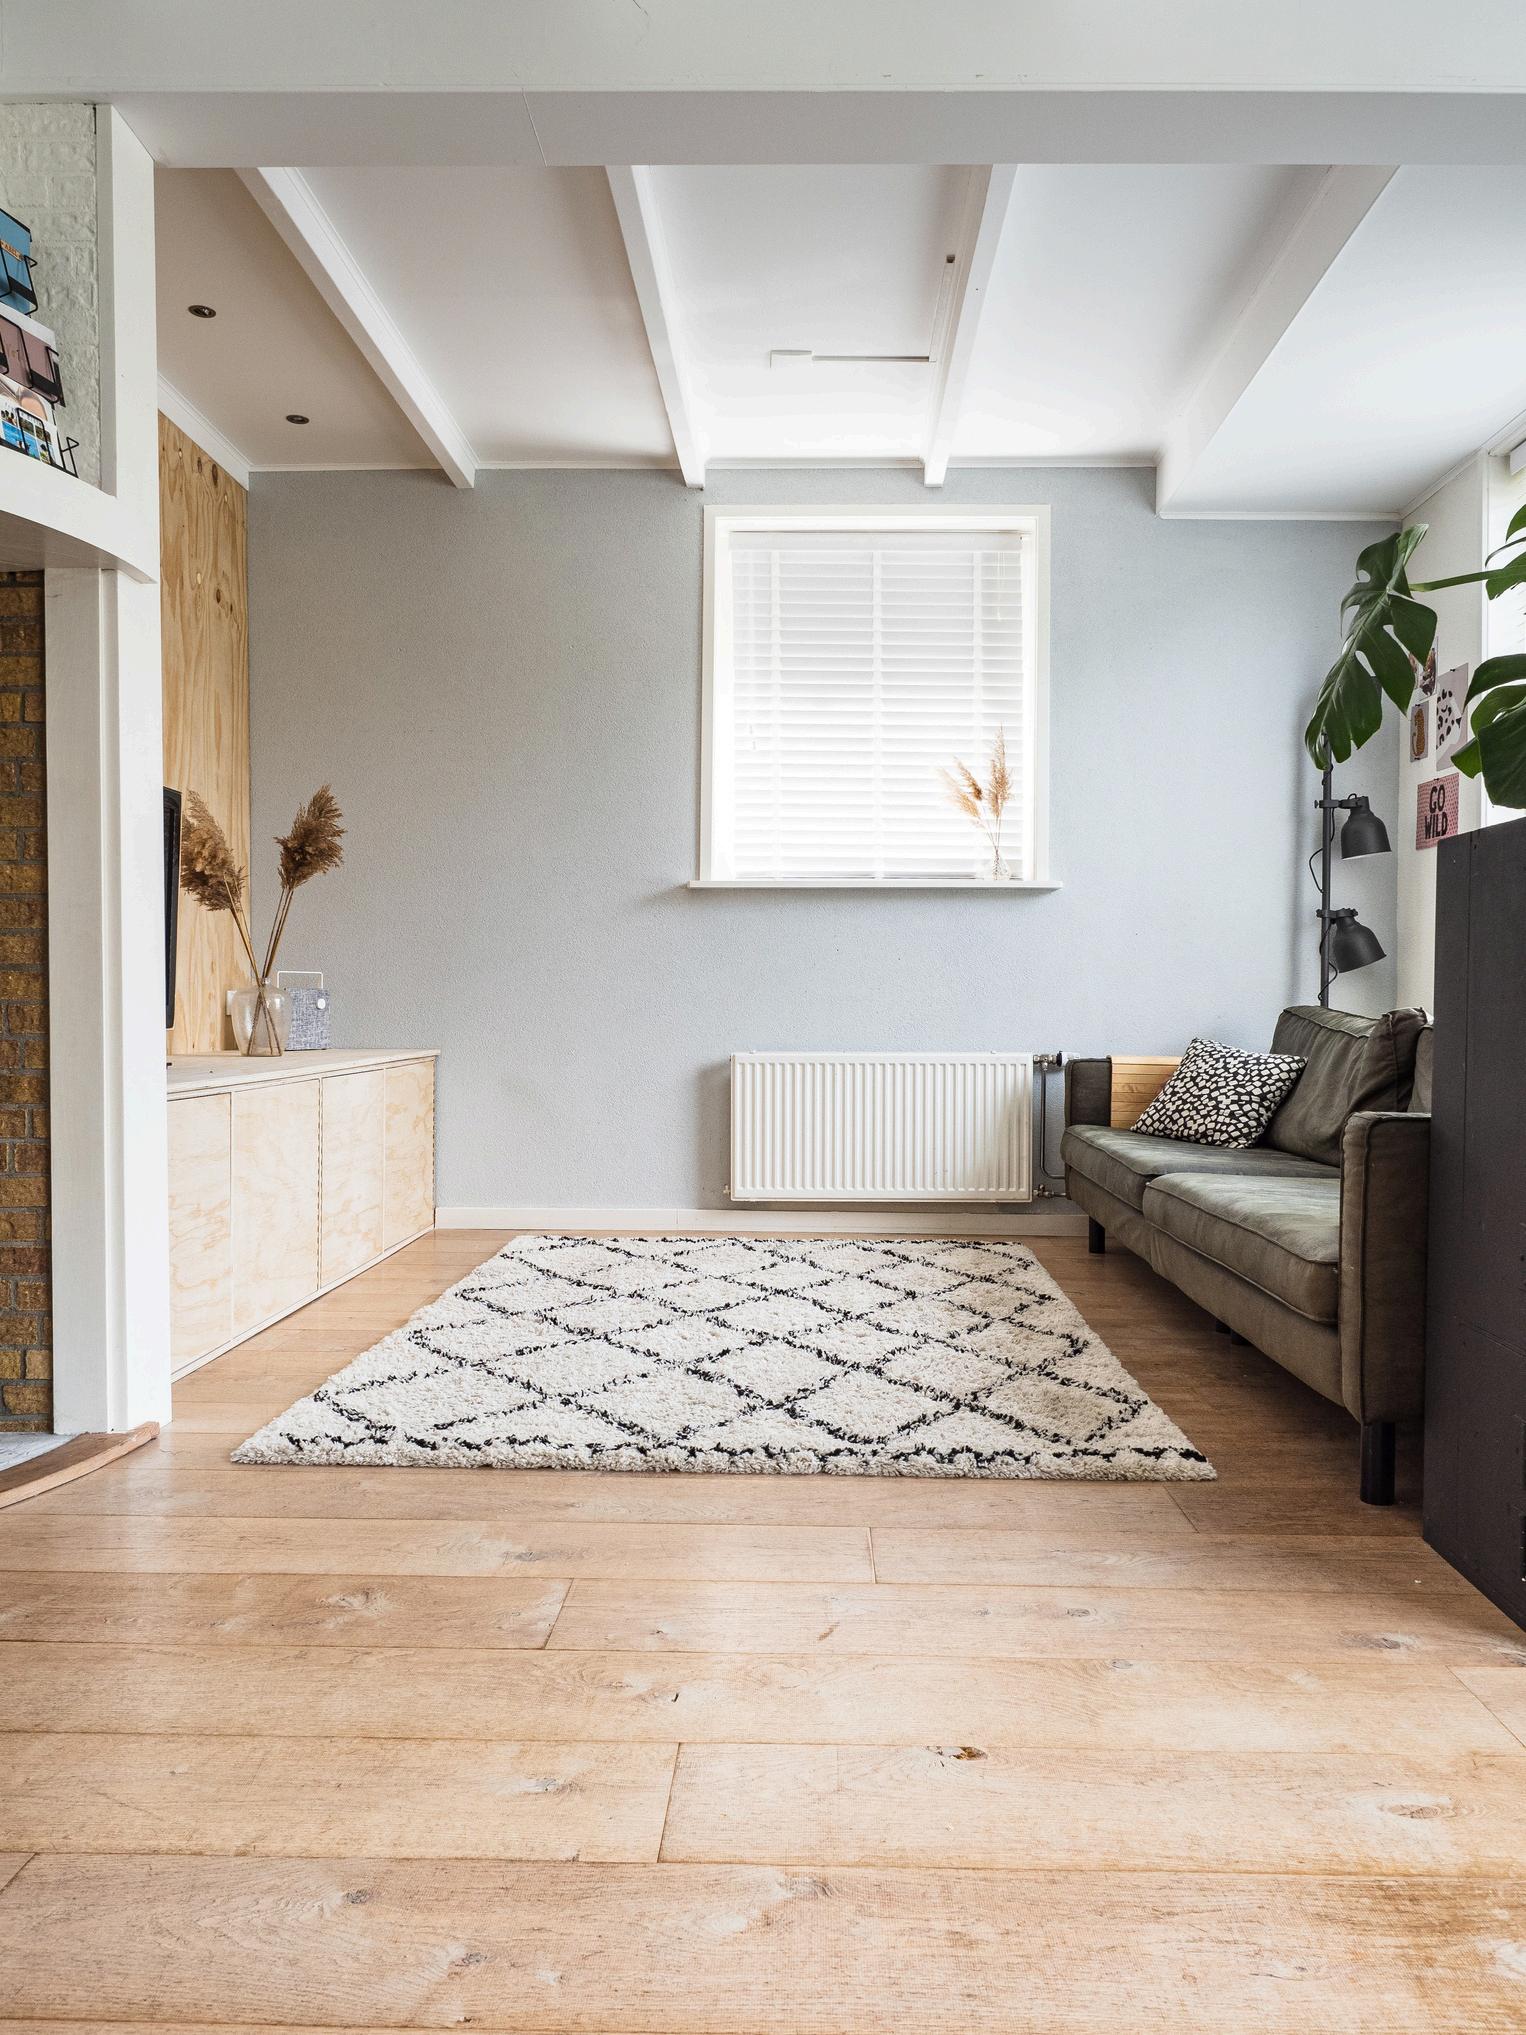
In2024,thehomebuyingmarketfacessignificantchallenges highprices, steepinterestrates,andlimitedhousinginventory Formany,renovatingtheir currenthomeisamoreattractiveoptionthanpurchasinganewone.Whilethe LIRAreportpredictsadeclineinrenovationspending,expertsemphasizethat small-scaleupdatesortargetedlargerprojectscanstilldelivermajorbenefits.
Beforedivingintoarenovation,it’sessentialtoplan carefullyandbudgetwisely.Workingwithreputable professionalsiskey,especiallythoseoffering financingoptionsandtransferablewarranties.Sharing yourbudgetwithcontractorsupfrontandinvolving designersearlyensuresthatyourrenovationruns smoothlyandachievesbothfinancialandfunctional success Adetailedplanwillkeeptheprojectontrack andhelpavoidcostlysurprises


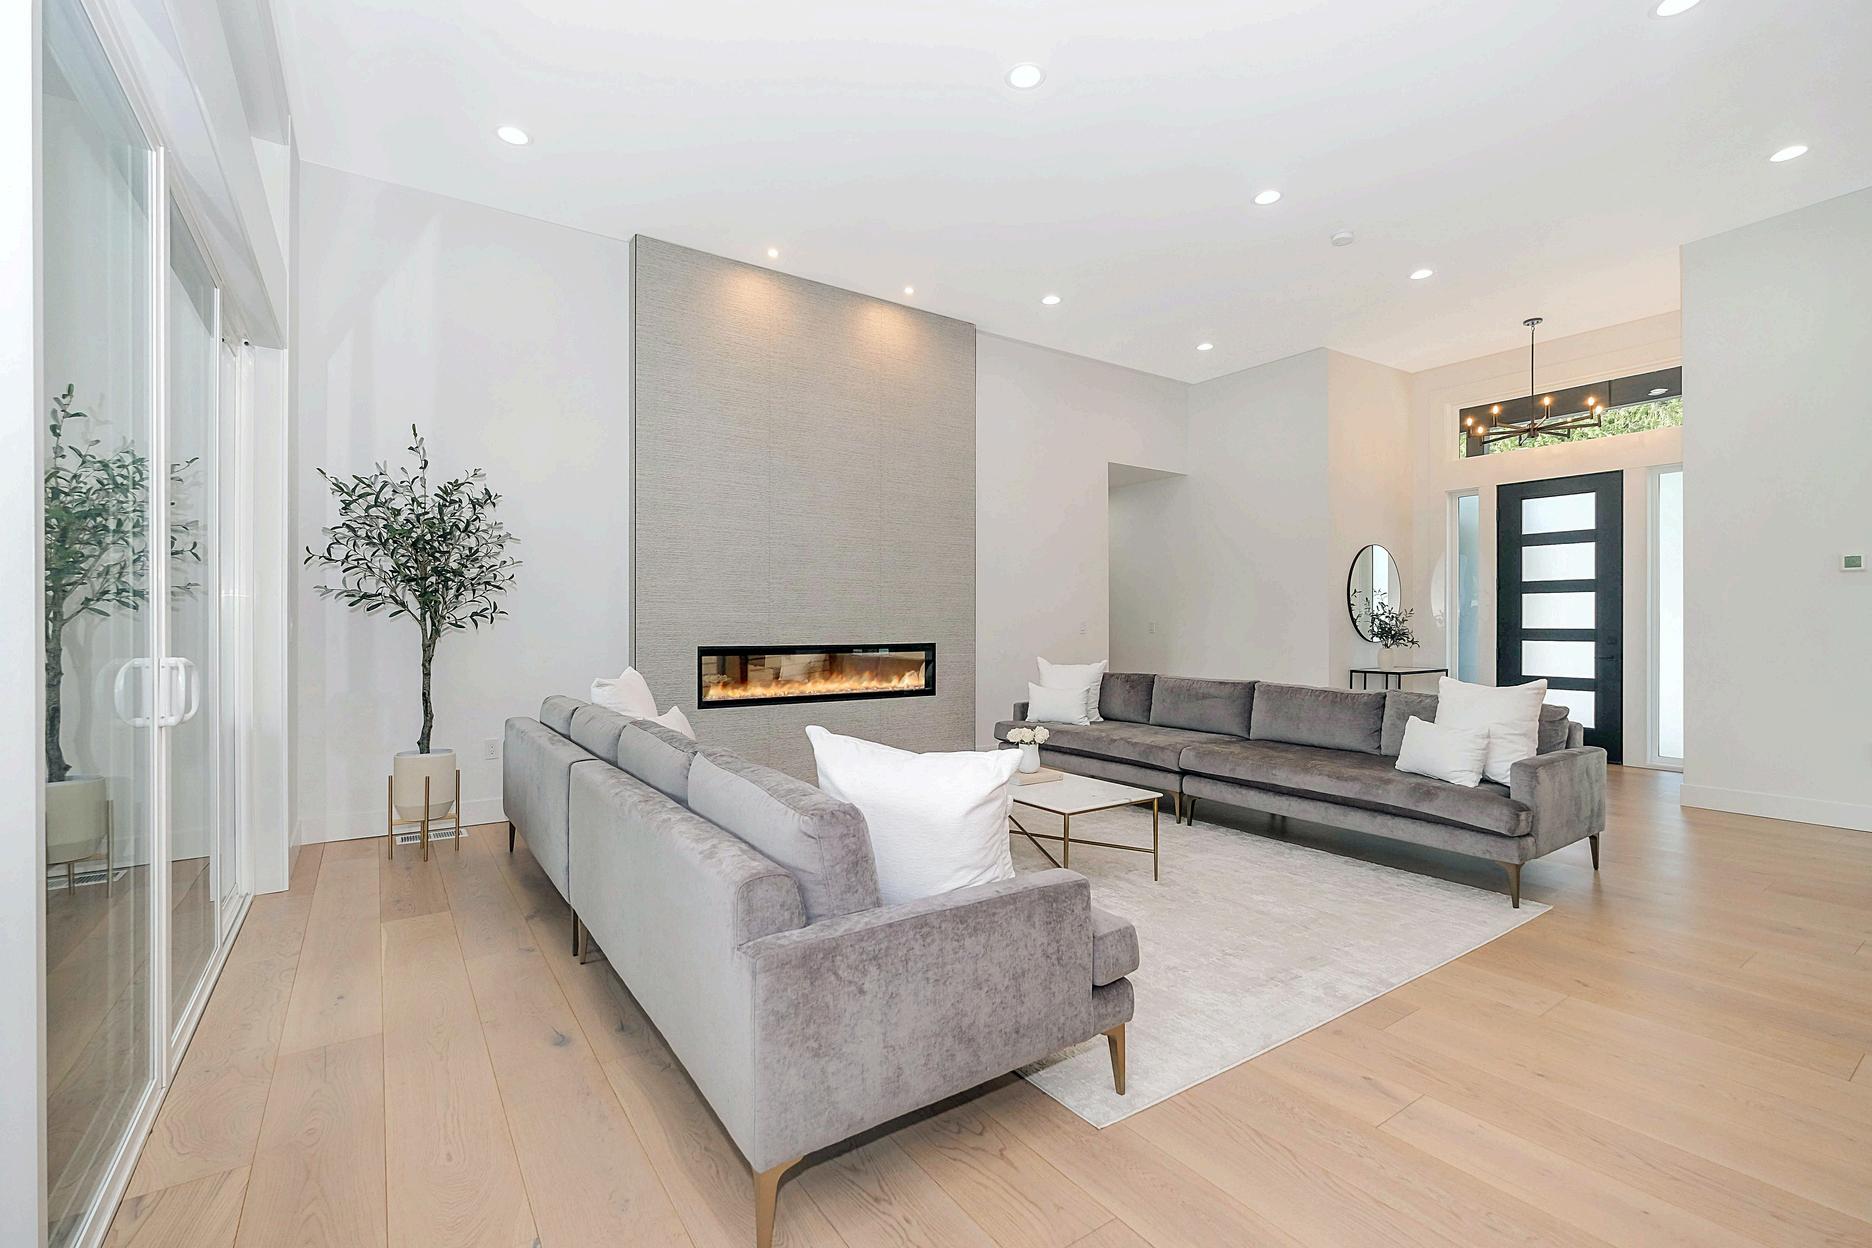
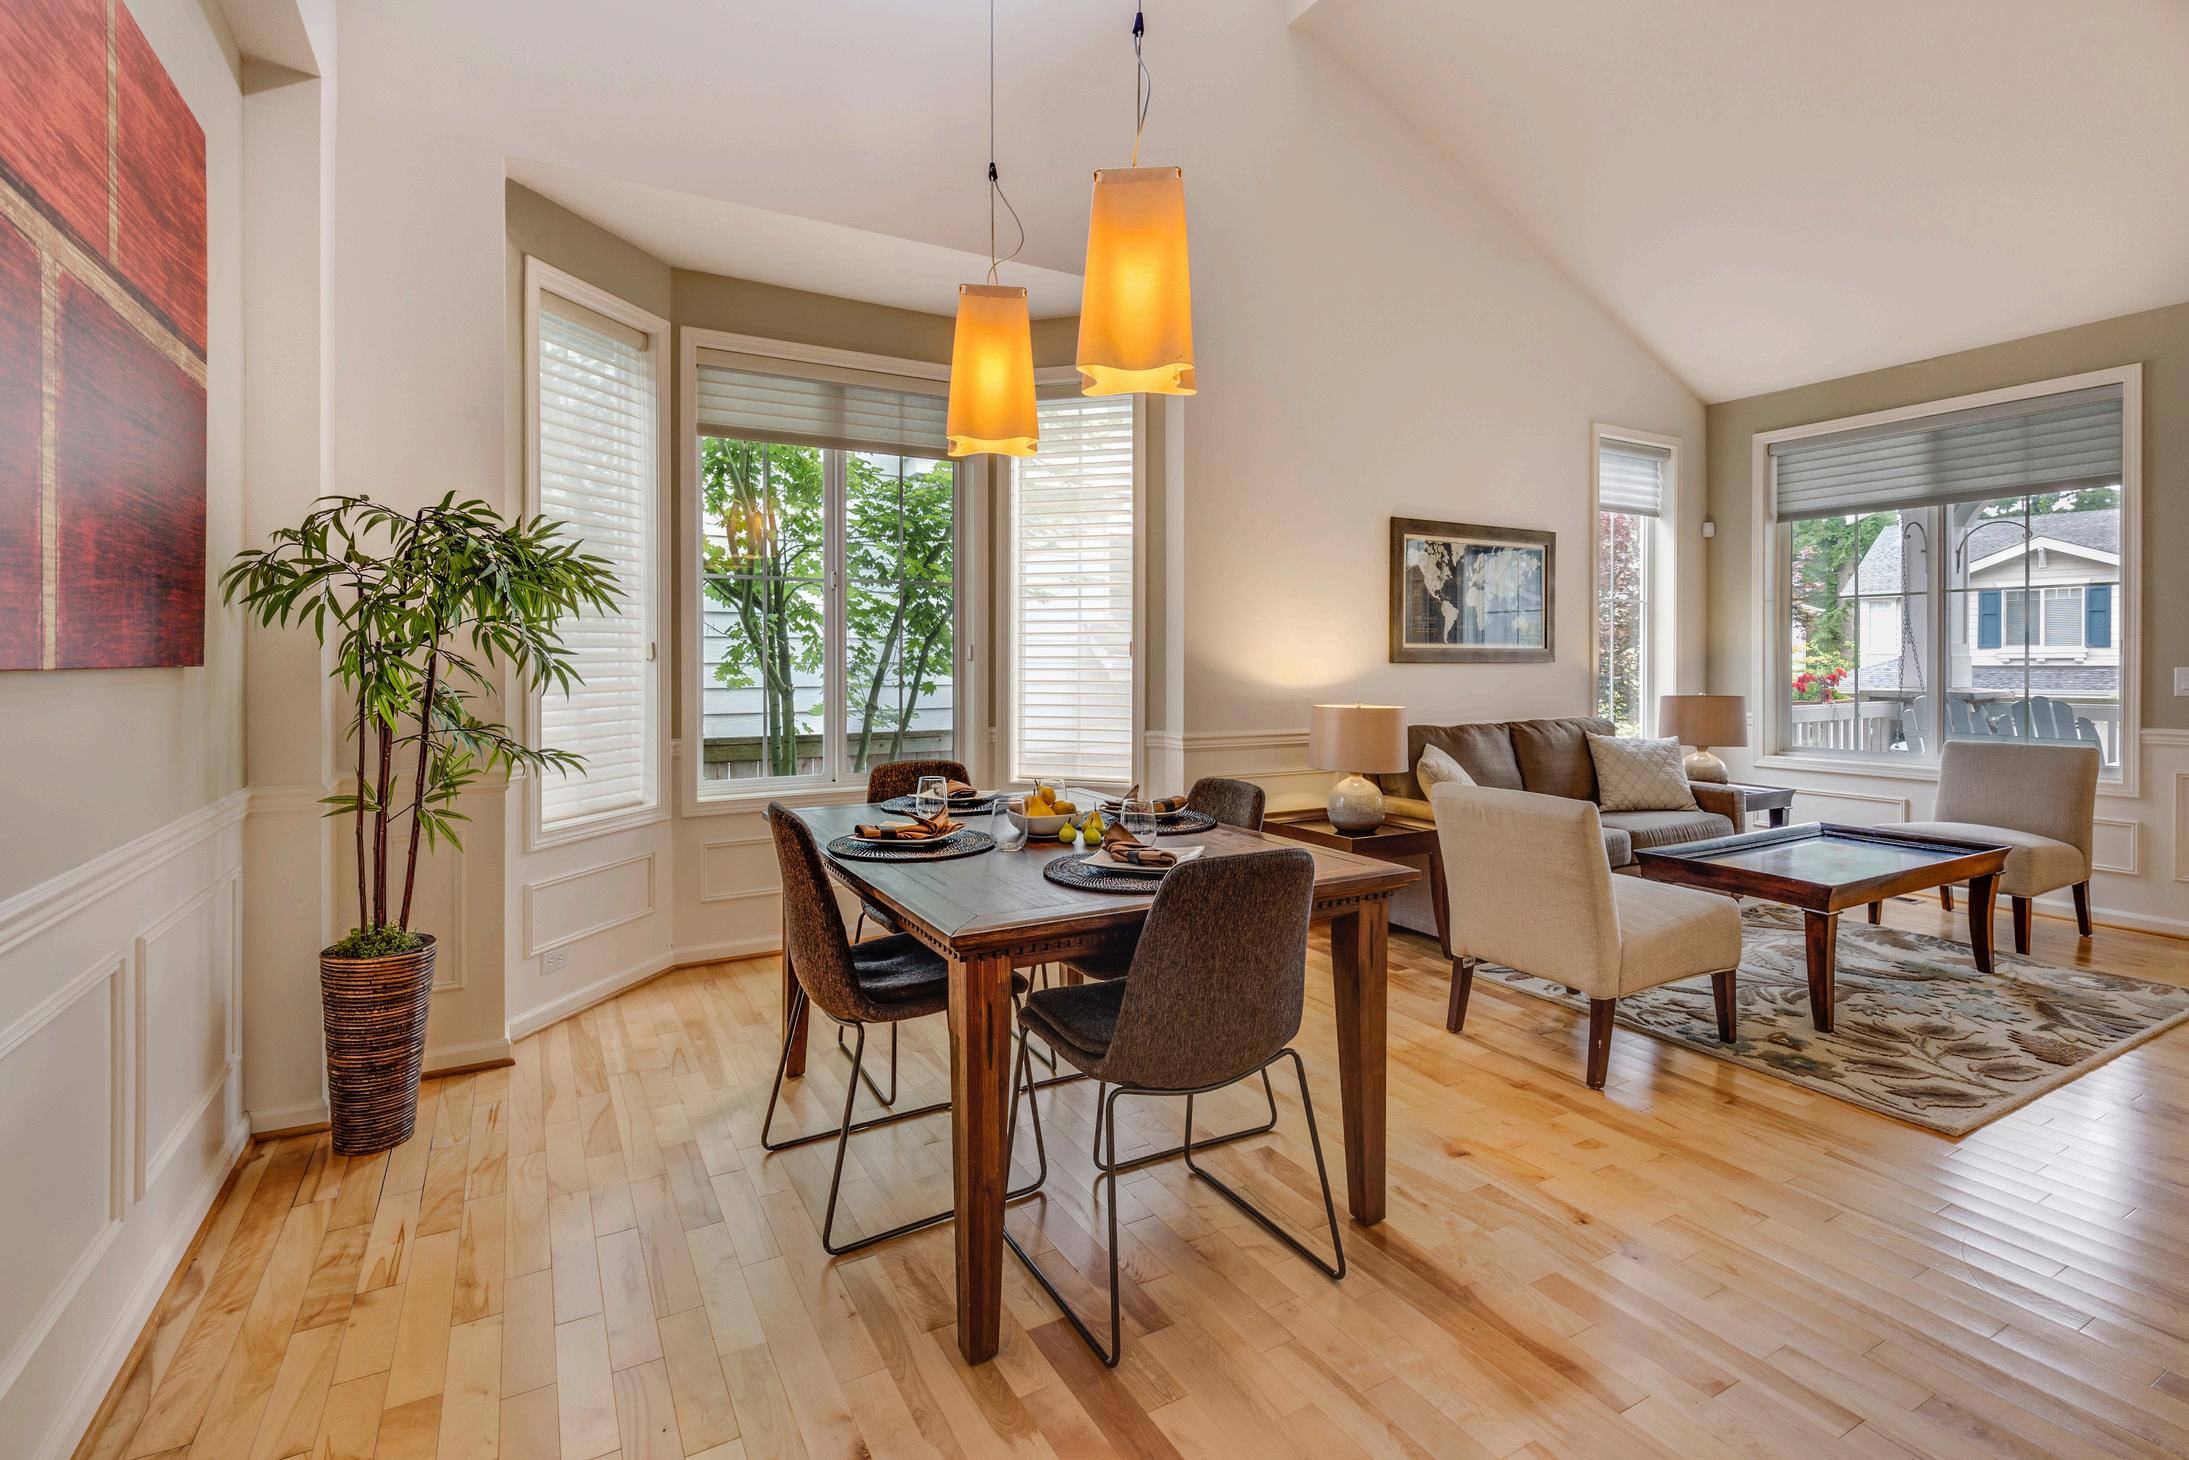
Bathrooms are a safe investment. Simple changes like a new vanity, upgraded flooring, or fresh lighting can completely transform the space. For a luxurious touch, consider adding a freestanding tub for a spa-like experience


The kitchen is a crucial space for resale value. Opening up the space or adding functional features can make a big difference Smaller updates, like upgrading appliances, cabinets, or flooring, can give your kitchen a fresh, modern feel


Bold design choices, such as statement wallpaper, unique lighting, or striking color palettes, can refresh any room. Layering textiles or mixing traditional and modern styles creates a space that feels cohesive and impactful


Renovations focusing on health are becoming increasingly popular. Use non-toxic materials free from Red List chemicals like BPA and VOCs. Consider adding air purifiers, water filtration systems, and better ventilation to create a healthier living environment


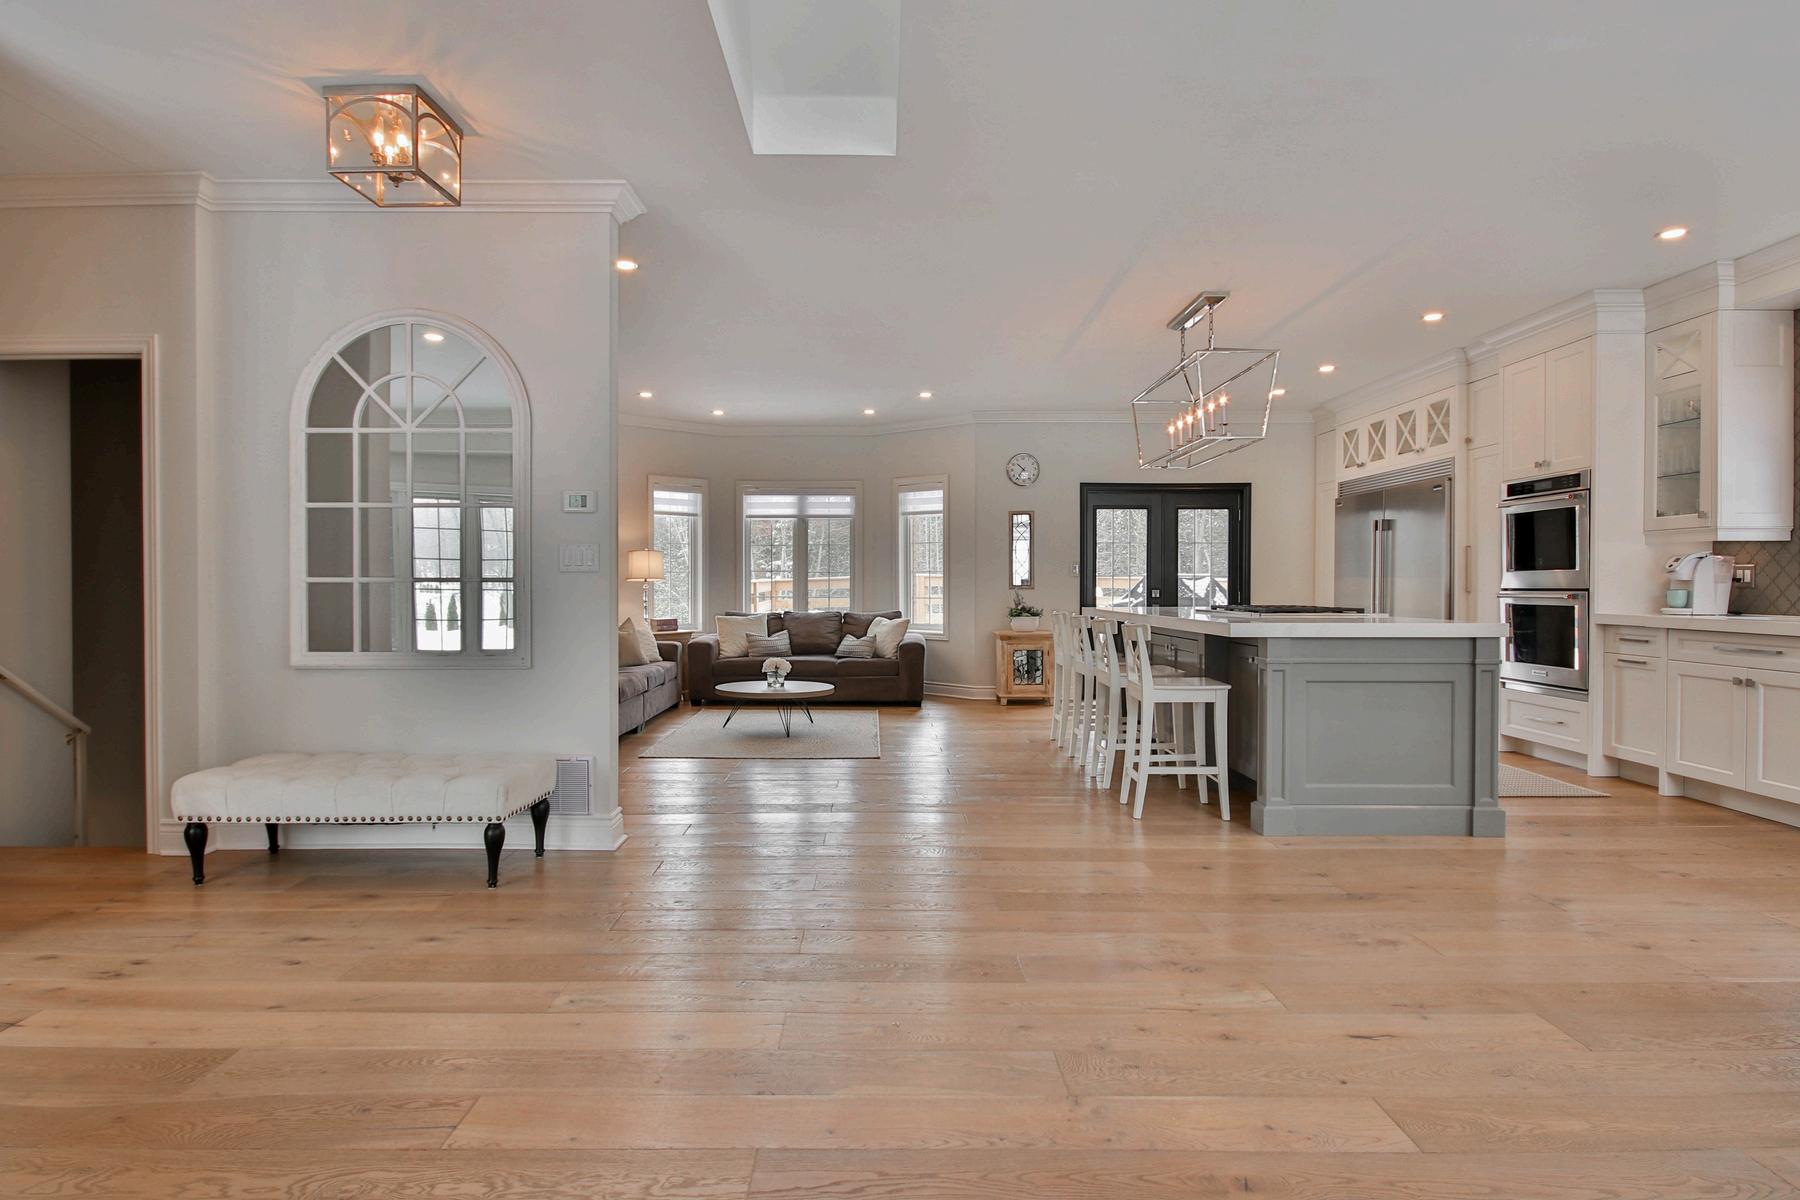
First impressions matter, and curb appeal can greatly impact your home's value. Exterior upgrades like siding, roofing, and landscaping enhance both aesthetics and security. Adding outdoor living spaces, such as a garden or entertainment area, boosts appeal even more.


Tailor renovations to your family’s lifestyle. Flexible spaces that accommodate workfrom-home needs, growing children, or future buyers will add lasting value. Think about both how your family uses the space and how it will appeal to future buyers.

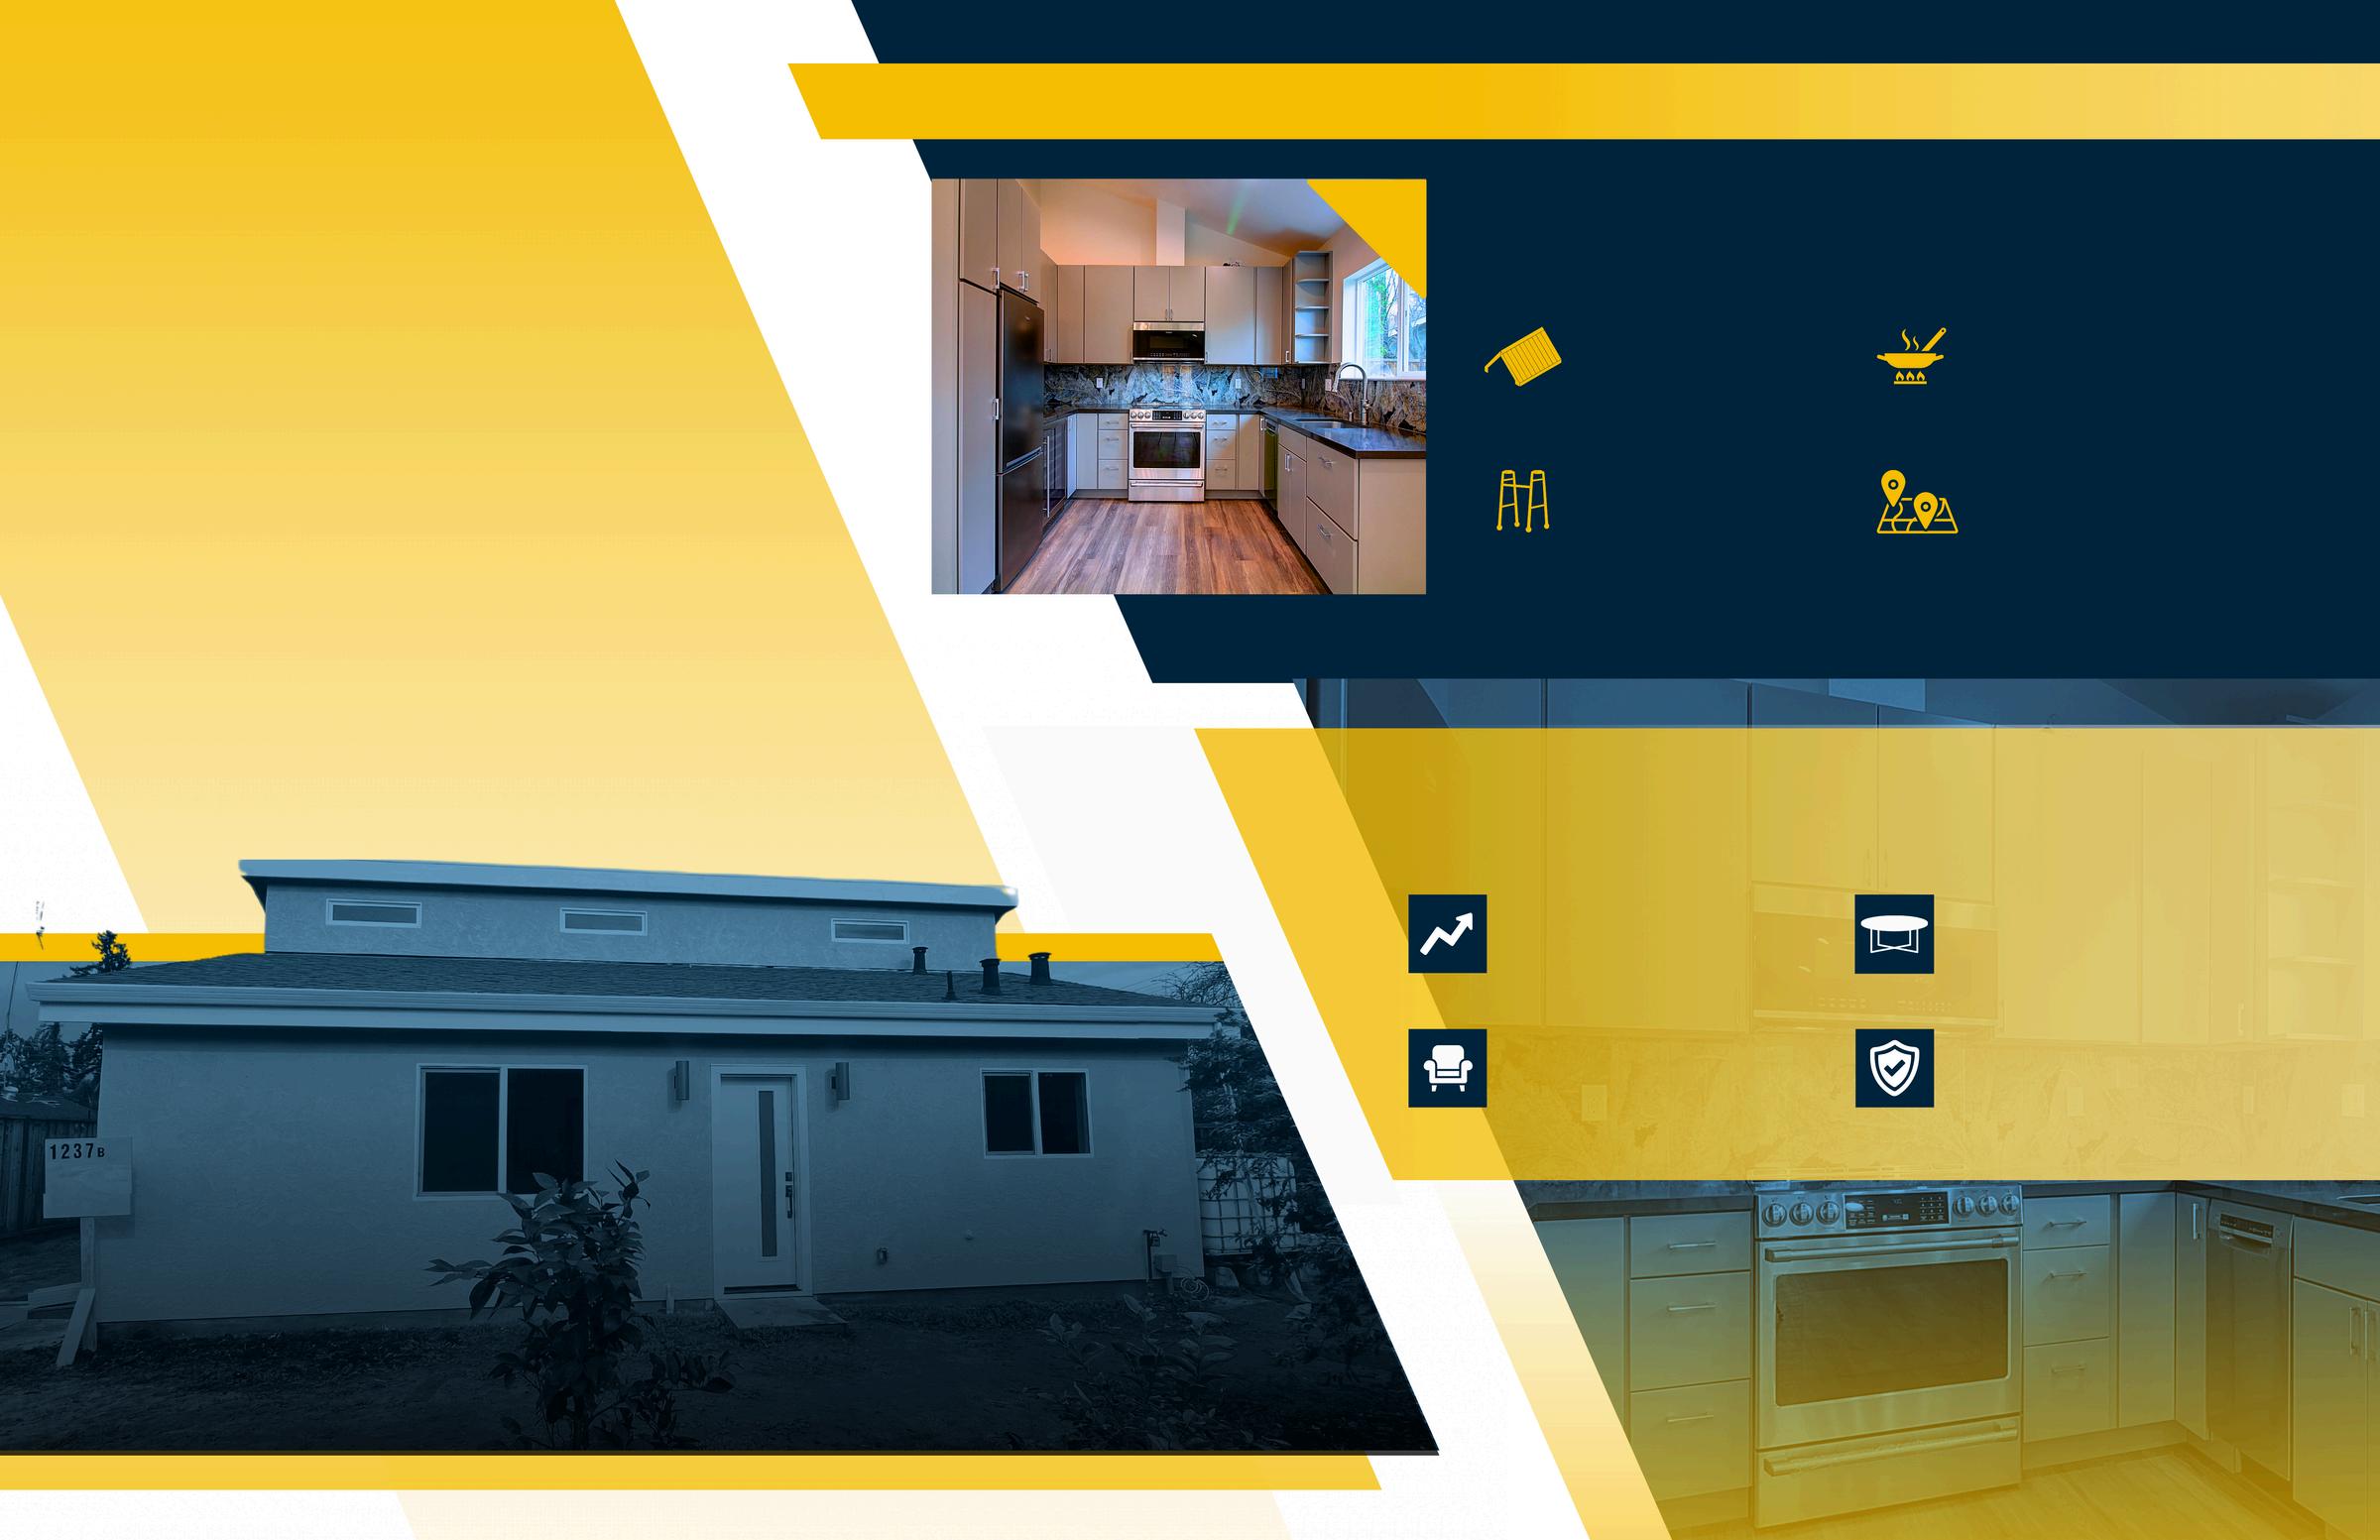

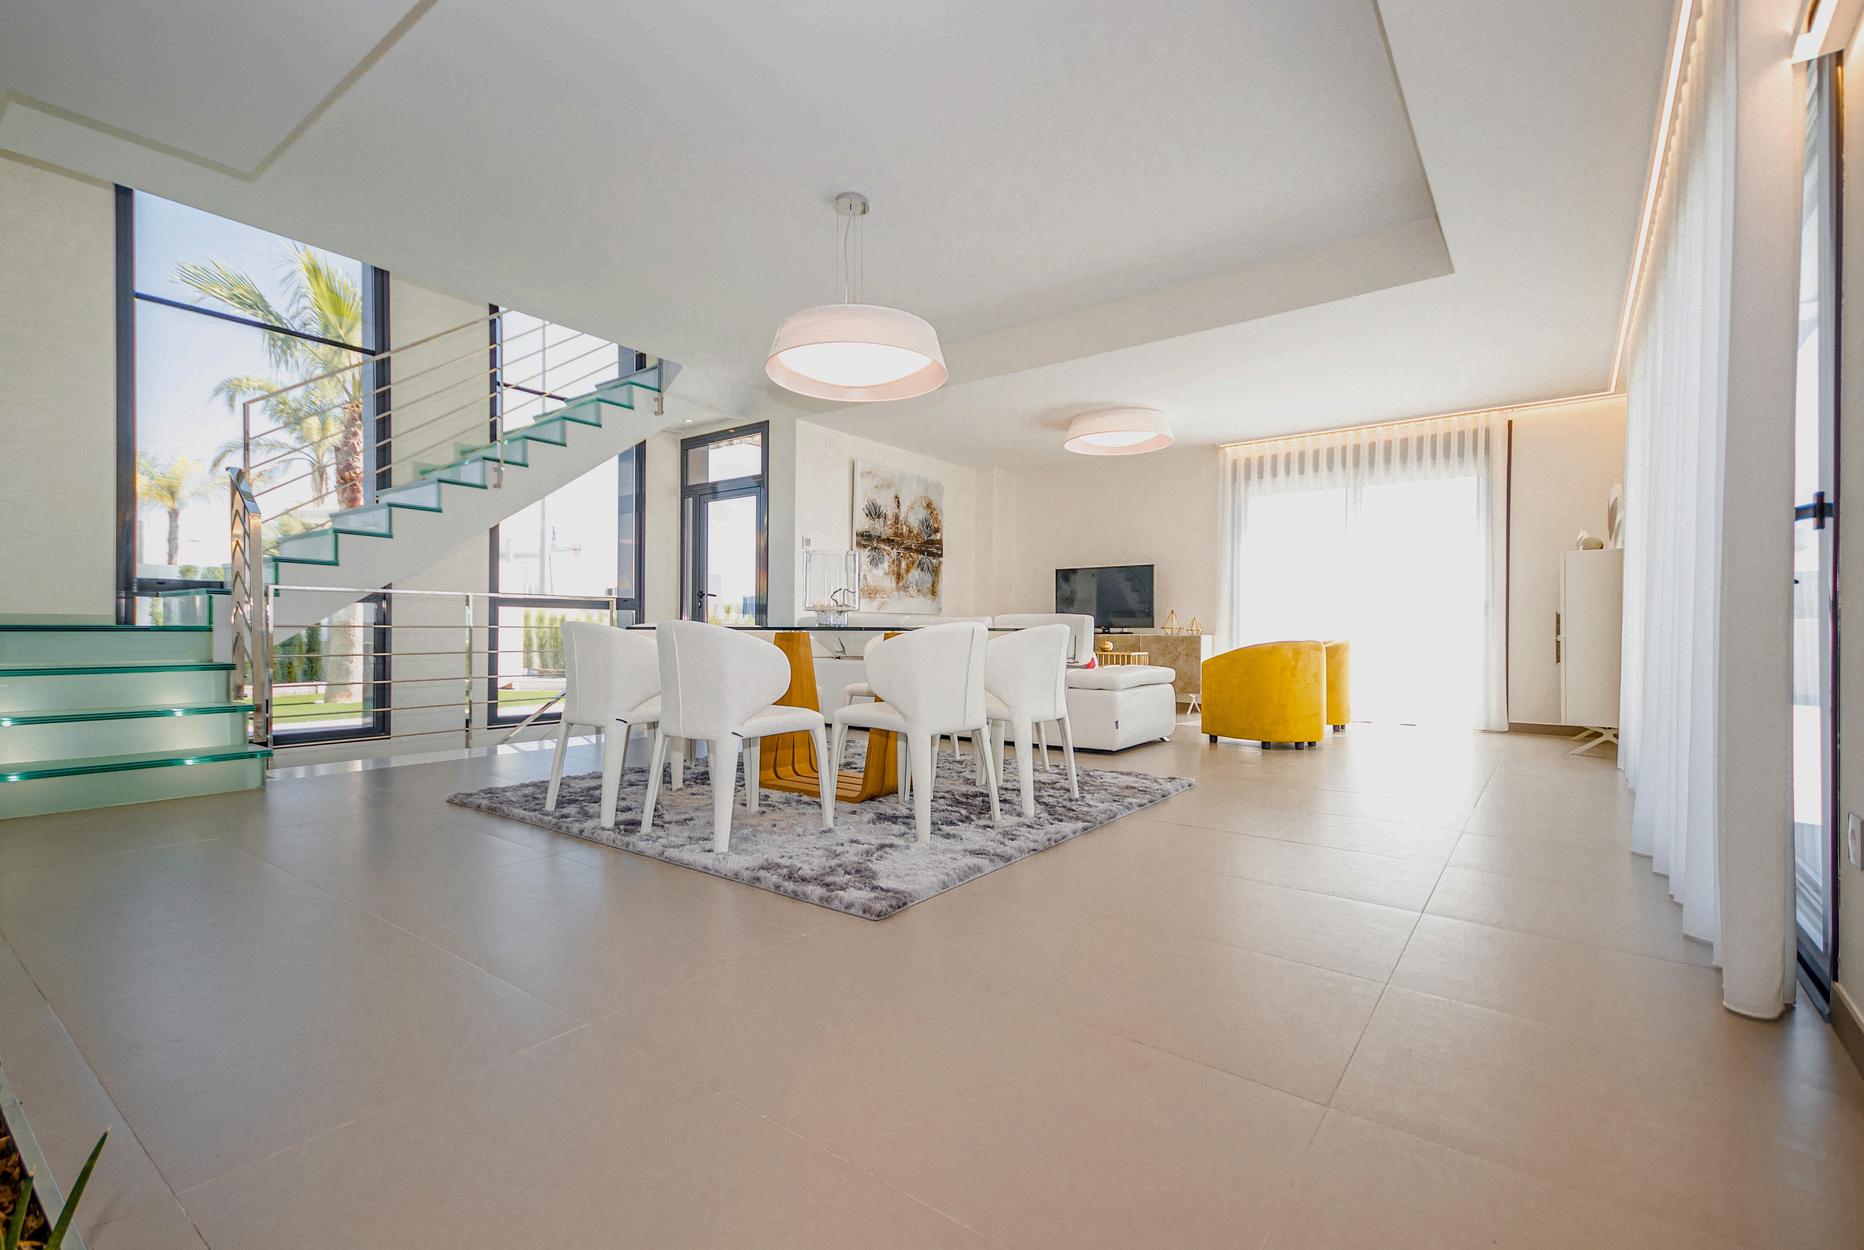
The Anenberg-Essert family in Campbell collaborated with Acton ADU to create a versatile, comfortable, and valuable addition to their property. This ADU project is a shining example of how a well-designed accessory dwelling unit can increase property value and serve a family’s unique needs.
The family envisioned an ADU that would function as an independent living space for family members, enhance their property’s worth, and provide seamless integration with the main home They wanted a space that balanced privacy with connectivity, feeling like a natural extension of their residence
Constructed at 747 square feet, this ADU was designed with modern, high-quality finishes to serve both aesthetic and practical needs. Key features include:
Vaulted Ceilings
Creates a spacious, open atmosphere
Senior-Friendly Living
Safe, independent space for elderly family members
Fully Equipped Kitchen
Modern amenities for everyday convenience
Open Living Area
Multipurpose area for relaxation and entertainment
The completion of the Anenberg-Essert ADU led to several valuable outcomes:
Increased Property Value
The ADU addition significantly boosted property value
Flexible Living Space
A versatile space for family, guests, or as a rental
Modern Comforts
High-end finishes and amenities enhance both function and style.
Enhanced Family Living
The ADU enriches the AnenbergEssert family’s home with both privacy and connection

Thinking about how an ADU could fit into your family’s lifestyle or property investment strategy?
Trust Acton ADU to guide you every step of the way.

When it comes to home ownership, knowing who you can trust is crucial. That's why we've curated a select list of trusted vendors who are ready to help with your home goals.


There were 0 single-family homes for sale, providing 0 months of inventory. There were 0 new listings, and 0 homes sold at a median price of $0. The median overbid percentage was at 0%, with an average of 0 days on the market.
There were 0 condo and townhome units for sale, providing 0 months of inventory. There were 0 new listings and 0 units sold at a median sale price of $0. The median overbid percentage was at 0%, with an average of 0 days on the market.

0 New Listings
0 Sold Listings
0 Months of Inventory
$0 Median Sale Price
0%
Median Sale vs List
0 Avg Days on Market
The data, sourced from Courted.io, includes all single-family homes, condos and townhomes in the California Area above from January 2025 to January 2026. This may include preliminary data, and may vary from the time the data was gathered. All data is deemed reliable but not guaranteed. DRE# 01511642. Copyright KW Advisors Palo Alto 2026. Each office is independently owned and operated.
New Listings
Months of Inventory
Median Sale vs List
The median sale price has increased from $0 last January 2025, to $0 as of January 2026
Condos & Townhomes
The median sale price has increased from $0 last January 2025, to $0 as of January 2026
No data to display
No data to display
The average time spent on the market went up from 0 days in January 2025, to 0 days as of January 2026
The average time spent on the market went up from 0 days in January 2025, to 0 days as of January 2026.
Single-Family Homes
The overbid percentage has increased from 0% last January 2025, to 0% a year later
Condos & Townhomes
The overbid percentage has increased from 0% last January 2025, to 0% a year later.
No data to display
There were 0 single-family homes for sale, providing 0 months of inventory. There were 0 new listings, and 0 homes sold at a median price of $0. The median overbid percentage was at 0%, with an average of 0 days on the market
There were 0 condo and townhome units for sale, providing 0 months of inventory. There were 0 new listings and 0 units sold at a median sale price of $0. The median overbid percentage was at 0%, with an average of 0 days on the market.

0 New Listings
0 Sold Listings
0 Months of Inventory
$0 Median Sale Price
0%
Median Sale vs List
0 Avg Days on Market
The data, sourced from Courted.io, includes all single-family homes, condos and townhomes in the California Area above from January 2025 to January 2026. This may include preliminary data, and may vary from the time the data was gathered. All data is deemed reliable but not guaranteed. DRE# 01511642. Copyright KW Advisors Palo Alto 2026. Each office is independently owned and operated.
New Listings
Sold Listings
Months of Inventory
Median Sale Price 0%
Median Sale vs List
Avg Days on Market

JANUARY 2025 TO JANUARY 2026
Nodatatodisplay
Single-Family Homes
Last 12 months, year-over-year.
Condos & Townhomes
Nodatatodisplay
Last 12 months, year-over-year
The median sale price has increased from $0 last January 2025, to $0 as of January 2026
Condos & Townhomes
The median sale price has increased from $0 last January 2025, to $0 as of January 2026
No data to display
No data to display
The average time spent on the market went up from 0 days in January 2025, to 0 days as of January 2026
The average time spent on the market went up from 0 days in January 2025, to 0 days as of January 2026.
Single-Family Homes
The overbid percentage has increased from 0% last January 2025, to 0% a year later
Condos & Townhomes
The overbid percentage has increased from 0% last January 2025, to 0% a year later.
No data to display

There were 0 single-family ho providing 0 months of invent new listings, and 0 homes so of $0. The median overbid pe with an average of 0 days on
There were 0 condo and tow providing 0 months of invent new listings and 0 units sold price of $0. The median over at 0%, with an average of 0 d
single-family homes, condos and January 2026. This may was gathered. All data is KW Advisors Palo Alto

LISTINGS ay ay h.
The median sale price has increased from $0 last January 2025, to $0 as of January 2026
Condos & Townhomes
The median sale price has increased from $0 last January 2025, to $0 as of January 2026
No data to display
No data to display
The average time spent on the market went up from 0 days in January 2025, to 0 days as of January 2026
The average time spent on the market went up from 0 days in January 2025, to 0 days as of January 2026.
Single-Family Homes
The overbid percentage has increased from 0% last January 2025, to 0% a year later
Condos & Townhomes
The overbid percentage has increased from 0% last January 2025, to 0% a year later.
No data to display

There were 0 single-family ho providing 0 months of invent new listings, and 0 homes so of $0. The median overbid pe with an average of 0 days on
There were 0 condo and tow providing 0 months of invent new listings and 0 units sold price of $0. The median over at 0%, with an average of 0 d

single-family homes, condos and January 2026. This may was gathered. All data is KW Advisors Palo Alto
New Listings
Sold Listings
Months of Inventory
Median Sale Price
Median Sale vs List
Avg Days on Market

JANUARY 2025 TO JANUARY 2026
Nodatatodisplay
Family Homes
2 months, year-over-year.
s & Townhomes
Nodatatodisplay
2 months, year-over-year
The median sale price has increased from $0 last January 2025, to $0 as of January 2026
Condos & Townhomes
The median sale price has increased from $0 last January 2025, to $0 as of January 2026
No data to display
No data to display
The average time spent on the market went up from 0 days in January 2025, to 0 days as of January 2026
The average time spent on the market went up from 0 days in January 2025, to 0 days as of January 2026.
Single-Family Homes
The overbid percentage has increased from 0% last January 2025, to 0% a year later
Condos & Townhomes
The overbid percentage has increased from 0% last January 2025, to 0% a year later.
No data to display

There were 0 single-family homes for sale, providing 0 months of inventory. There were new listings, and 0 homes sold at a median p of $0. The median overbid percentage was a with an average of 0 days on the market.
There were 0 condo and townhome units for providing 0 months of inventory. There were new listings and 0 units sold at a median sale price of $0. The median overbid percentage w at 0%, with an average of 0 days on the mark

New Listings
Sold Listings
Months of Inventory
Median Sale Price
Median Sale vs List
Avg Days on Market

JANUARY 2025 TO JANUARY 2026
Nodatatodisplay
Single-Family Homes
Last 12 months, year-over-year.
Nodatatodisplay
Condos & Townhomes
Last 12 months, year-over-year
The median sale price has increased from $0 last January 2025, to $0 as of January 2026
Condos & Townhomes
The median sale price has increased from $0 last January 2025, to $0 as of January 2026
No data to display
No data to display
The average time spent on the market went up from 0 days in January 2025, to 0 days as of January 2026
The average time spent on the market went up from 0 days in January 2025, to 0 days as of January 2026.
Single-Family Homes
The overbid percentage has increased from 0% last January 2025, to 0% a year later
Condos & Townhomes
The overbid percentage has increased from 0% last January 2025, to 0% a year later.
No data to display

There were 0 single-family homes for sale, providing 0 months of inventory. There were 0 new listings, and 0 homes sold at a median price of $0. The median overbid percentage was at 0%, with an average of 0 days on the market.
There were 0 condo and townhome units for sale, providing 0 months of inventory. There were 0 new listings and 0 units sold at a median sale price of $0. The median overbid percentage was at 0%, with an average of 0 days on the market.

0 ew Listings
0 Sold Listings
0 Months of Inventory
$0 Median Sale Price
0%
Median Sale vs List
0 Avg Days on Market
The data, sourced from Courted.io, includes all single-family homes, condos and townhomes in the California Area above from January 2025 to January 2026. This may include preliminary data, and may vary from the time the data was gathered. All data is deemed reliable but not guaranteed. DRE# 01511642. Copyright KW Advisors Palo Alto 2026. Each office is independently owned and operated.
New Listings
Sold Listings
Months of Inventory
Median Sale Price 0%
Median Sale vs List
Avg Days on Market

JANUARY 2025 TO JANUARY 2026
Nodatatodisplay
Single-Family Homes
Last 12 months, year-over-year.
Condos & Townhomes
Nodatatodisplay
Last 12 months, year-over-year
The median sale price has increased from $0 last January 2025, to $0 as of January 2026
Condos & Townhomes
The median sale price has increased from $0 last January 2025, to $0 as of January 2026
No data to display
No data to display
The average time spent on the market went up from 0 days in January 2025, to 0 days as of January 2026
The average time spent on the market went up from 0 days in January 2025, to 0 days as of January 2026.
Single-Family Homes
The overbid percentage has increased from 0% last January 2025, to 0% a year later
Condos & Townhomes
The overbid percentage has increased from 0% last January 2025, to 0% a year later.
No data to display

There were 0 single-family homes for sale, providing 0 months of inventory. There were 0 new listings, and 0 homes sold at a median price of $0. The median overbid percentage was at 0%, with an average of 0 days on the market.
There were 0 condo and townhome units for sale, providing 0 months of inventory. There were 0 new listings and 0 units sold at a median sale price of $0. The median overbid percentage was at 0%, with an average of 0 days on the market.

0 New Listings
0 Sold Listings
0 Months of Inventory
$0 Median Sale Price
0%
Median Sale vs List
0 Avg Days on Market
The data, sourced from Courted.io, includes all single-family homes, condos and townhomes in the California Area above from January 2025 to January 2026. This may include preliminary data, and may vary from the time the data was gathered. All data is deemed reliable but not guaranteed. DRE# 01511642. Copyright KW Advisors Palo Alto 2026. Each office is independently owned and operated.
New Listings
Sold Listings
Months of Inventory
Median Sale Price 0%
Median Sale vs List
Avg Days on Market

JANUARY 2025 TO JANUARY 2026
Nodatatodisplay
Single-Family Homes
Last 12 months, year-over-year.
Condos & Townhomes
Nodatatodisplay
Last 12 months, year-over-year
The median sale price has increased from $0 last January 2025, to $0 as of January 2026
Condos & Townhomes
The median sale price has increased from $0 last January 2025, to $0 as of January 2026
No data to display
No data to display
The average time spent on the market went up from 0 days in January 2025, to 0 days as of January 2026
The average time spent on the market went up from 0 days in January 2025, to 0 days as of January 2026.
Single-Family Homes
The overbid percentage has increased from 0% last January 2025, to 0% a year later
Condos & Townhomes
The overbid percentage has increased from 0% last January 2025, to 0% a year later.
No data to display

There were 0 single-family homes for sale, providing 0 months of inventory. There were 0 new listings, and 0 homes sold at a median price of $0. The median overbid percentage was at 0%, with an average of 0 days on the market
There were 0 condo and townhome units for sale, providing 0 months of inventory. There were 0 new listings and 0 units sold at a median sale price of $0. The median overbid percentage was at 0%, with an average of 0 days on the market.

0 New Listings
0 Sold Listings
0 Months of Inventory
$0 Median Sale Price
0%
Median Sale vs List
0 Avg Days on Market
The data, sourced from Courted.io, includes all single-family homes, condos and townhomes in the California Area above from January 2025 to January 2026. This may include preliminary data, and may vary from the time the data was gathered. All data is deemed reliable but not guaranteed. DRE# 01511642. Copyright KW Advisors Palo Alto 2026. Each office is independently owned and operated.
New Listings
Sold Listings
Months of Inventory
Median Sale Price
Median Sale vs List
Avg Days on Market

JANUARY 2025 TO JANUARY 2026
Nodatatodisplay
Family Homes
2 months, year-over-year.
s & Townhomes
Nodatatodisplay
2 months, year-over-year
The median sale price has increased from $0 last January 2025, to $0 as of January 2026
Condos & Townhomes
The median sale price has increased from $0 last January 2025, to $0 as of January 2026
No data to display
No data to display
The average time spent on the market went up from 0 days in January 2025, to 0 days as of January 2026
The average time spent on the market went up from 0 days in January 2025, to 0 days as of January 2026.
Single-Family Homes
The overbid percentage has increased from 0% last January 2025, to 0% a year later
Condos & Townhomes
The overbid percentage has increased from 0% last January 2025, to 0% a year later.
No data to display

There were 0 single-family homes for sale, providing 0 months of inventory. There were 0 new listings, and 0 homes sold at a median price of $0. The median overbid percentage was at 0%, with an average of 0 days on the market
There were 0 condo and townhome units for sale, providing 0 months of inventory. There were 0 new listings and 0 units sold at a median sale price of $0. The median overbid percentage was at 0%, with an average of 0 days on the market.

of Inventory
0 Sold Listings
$0 Median Sale Price % Sale vs List
0 Avg Days on Market
sourced from Courted.io, includes all single-family homes, condos and in the California Area above from January 2025 to January 2026. This may preliminary data, and may vary from the time the data was gathered. All data is reliable but not guaranteed. DRE# 01511642. Copyright KW Advisors Palo Alto 2026. Each office is independently owned and operated.
New Listings
Sold Listings
Months of Inventory
Median Sale Price 0%
Median Sale vs List
Avg Days on Market

JANUARY 2025 TO JANUARY 2026
Nodatatodisplay
Single-Family Homes
Last 12 months, year-over-year.
Condos & Townhomes
Nodatatodisplay
Last 12 months, year-over-year
The median sale price has increased from $0 last January 2025, to $0 as of January 2026
Condos & Townhomes
The median sale price has increased from $0 last January 2025, to $0 as of January 2026
No data to display
No data to display
The average time spent on the market went up from 0 days in January 2025, to 0 days as of January 2026
The average time spent on the market went up from 0 days in January 2025, to 0 days as of January 2026.
Single-Family Homes
The overbid percentage has increased from 0% last January 2025, to 0% a year later
Condos & Townhomes
The overbid percentage has increased from 0% last January 2025, to 0% a year later.
No data to display

There were 0 sin providing 0 mon new listings, and of $0. The media with an average There were 0 co providing 0 mon new listings and price of $0. The at 0%, with an av


The median sale price has increased from $0 last January 2025, to $0 as of January 2026
Condos & Townhomes
The median sale price has increased from $0 last January 2025, to $0 as of January 2026
No data to display
No data to display
The average time spent on the market went up from 0 days in January 2025, to 0 days as of January 2026
The average time spent on the market went up from 0 days in January 2025, to 0 days as of January 2026.
Single-Family Homes
The overbid percentage has increased from 0% last January 2025, to 0% a year later
Condos & Townhomes
The overbid percentage has increased from 0% last January 2025, to 0% a year later.
No data to display

There were 0 single-family ho providing 0 months of invent new listings, and 0 homes so of $0. The median overbid pe with an average of 0 days on
There were 0 condo and tow providing 0 months of invent new listings and 0 units sold price of $0. The median over at 0%, with an average of 0 d

single-family homes, condos and January 2026. This may was gathered. All data is KW Advisors Palo Alto
New Listings
Months of Inventory
Median Sale vs List

The median sale price has increased from $0 last January 2025, to $0 as of January 2026
Condos & Townhomes
The median sale price has increased from $0 last January 2025, to $0 as of January 2026
No data to display
No data to display
The average time spent on the market went up from 0 days in January 2025, to 0 days as of January 2026
The average time spent on the market went up from 0 days in January 2025, to 0 days as of January 2026.
Single-Family Homes
The overbid percentage has increased from 0% last January 2025, to 0% a year later
Condos & Townhomes
The overbid percentage has increased from 0% last January 2025, to 0% a year later.
No data to display

There were 0 single-family ho providing 0 months of invent new listings, and 0 homes so of $0. The median overbid pe with an average of 0 days on
There were 0 condo and tow providing 0 months of invent new listings and 0 units sold price of $0. The median over at 0%, with an average of 0 d
single-family homes, condos and January 2026. This may was gathered. All data is KW Advisors Palo Alto
New Listings
Months of Inventory
Median Sale vs List
The median sale price has increased from $0 last January 2025, to $0 as of January 2026
Condos & Townhomes
The median sale price has increased from $0 last January 2025, to $0 as of January 2026
No data to display
No data to display
The average time spent on the market went up from 0 days in January 2025, to 0 days as of January 2026
The average time spent on the market went up from 0 days in January 2025, to 0 days as of January 2026.
Single-Family Homes
The overbid percentage has increased from 0% last January 2025, to 0% a year later
Condos & Townhomes
The overbid percentage has increased from 0% last January 2025, to 0% a year later.
No data to display

There were 0 single-family homes for sale, providing 0 months of inventory. There were 0 new listings, and 0 homes sold at a median price of $0. The median overbid percentage was at 0%, with an average of 0 days on the market
There were 0 condo and townhome units for sale, providing 0 months of inventory. There were 0 new listings and 0 units sold at a median sale price of $0. The median overbid percentage was at 0%, with an average of 0 days on the market.
New Listings
Months of Inventory
Median Sale vs List

The median sale price has increased from $0 last January 2025, to $0 as of January 2026
Condos & Townhomes
The median sale price has increased from $0 last January 2025, to $0 as of January 2026
No data to display
No data to display
The average time spent on the market went up from 0 days in January 2025, to 0 days as of January 2026
The average time spent on the market went up from 0 days in January 2025, to 0 days as of January 2026.
Single-Family Homes
The overbid percentage has increased from 0% last January 2025, to 0% a year later
Condos & Townhomes
The overbid percentage has increased from 0% last January 2025, to 0% a year later.
No data to display

There were 0 single-family homes for sale, providing 0 months of inventory. There were 0 new listings, and 0 homes sold at a median price of $0. The median overbid percentage was at 0%, with an average of 0 days on the market.
There were 0 condo and townhome units for sale, providing 0 months of inventory. There were 0 new listings and 0 units sold at a median sale price of $0. The median overbid percentage was at 0%, with an average of 0 days on the market.

0 New Listings
0 Sold Listings
0 Months of Inventory
$0 Median Sale Price
0%
Median Sale vs List
0 Avg Days on Market
The data, sourced from Courted.io, includes all single-family homes, condos and townhomes in the California Area above from January 2025 to January 2026. This may include preliminary data, and may vary from the time the data was gathered. All data is deemed reliable but not guaranteed. DRE# 01511642. Copyright KW Advisors Palo Alto 2026. Each office is independently owned and operated.
New Listings
Sold Listings
Months of Inventory
Median Sale Price 0%
Median Sale vs List
Avg Days on Market

JANUARY 2025 TO JANUARY 2026
Nodatatodisplay
Single-Family Homes
Last 12 months, year-over-year.
Condos & Townhomes
Nodatatodisplay
Last 12 months, year-over-year
The median sale price has increased from $0 last January 2025, to $0 as of January 2026
Condos & Townhomes
The median sale price has increased from $0 last January 2025, to $0 as of January 2026
No data to display
No data to display
The average time spent on the market went up from 0 days in January 2025, to 0 days as of January 2026
The average time spent on the market went up from 0 days in January 2025, to 0 days as of January 2026.
Single-Family Homes
The overbid percentage has increased from 0% last January 2025, to 0% a year later
Condos & Townhomes
The overbid percentage has increased from 0% last January 2025, to 0% a year later.
No data to display

There were 0 single-family homes for sale, providing 0 months of inventory. There were 0 new listings, and 0 homes sold at a median price of $0. The median overbid percentage was at 0%, with an average of 0 days on the market
There were 0 condo and townhome units for sale, providing 0 months of inventory. There were 0 new listings and 0 units sold at a median sale price of $0. The median overbid percentage was at 0%, with an average of 0 days on the market.

0 New Listings
0 Sold Listings
0 Months of Inventory
$0 Median Sale Price
0%
Median Sale vs List
0 Avg Days on Market
The data, sourced from Courted.io, includes all single-family homes, condos and townhomes in the California Area above from January 2025 to January 2026. This may include preliminary data, and may vary from the time the data was gathered. All data is deemed reliable but not guaranteed. DRE# 01511642. Copyright KW Advisors Palo Alto 2026. Each office is independently owned and operated.
New Listings
Sold Listings
Months of Inventory
Median Sale Price 0%
Median Sale vs List
Avg Days on Market

JANUARY 2025 TO JANUARY 2026
Nodatatodisplay
ngle-Family Homes st 12 months, year-over-year.
Nodatatodisplay
ondos & Townhomes st 12 months, year-over-year
The median sale price has increased from $0 last January 2025, to $0 as of January 2026
Condos & Townhomes
The median sale price has increased from $0 last January 2025, to $0 as of January 2026
No data to display
No data to display
The average time spent on the market went up from 0 days in January 2025, to 0 days as of January 2026
The average time spent on the market went up from 0 days in January 2025, to 0 days as of January 2026.
Single-Family Homes
The overbid percentage has increased from 0% last January 2025, to 0% a year later
Condos & Townhomes
The overbid percentage has increased from 0% last January 2025, to 0% a year later.
No data to display

There were 0 single-family homes for sale, providing 0 months of inventory. There we new listings, and 0 homes sold at a media of $0. The median overbid percentage was with an average of 0 days on the market.
There were 0 condo and townhome units f providing 0 months of inventory. There we new listings and 0 units sold at a median s price of $0. The median overbid percentag at 0%, with an average of 0 days on the ma

$0 Median Sale Price 0 Sold Listings
0 Avg Days on Market
includes all single-family homes, condos and from January 2025 to January 2026. This may from the time the data was gathered. All data is DRE# 01511642. Copyright KW Advisors Palo Alto 2026. Each office is independently owned and operated.
New Listings
Sold Listings
Months of Inventory
Median Sale Price
Median Sale vs List
Avg Days on Market

JANUARY 2025 TO JANUARY 2026
Nodatatodisplay
y Homes
ths, year-over-year.
ownhomes
Nodatatodisplay
ths, year-over-year
The median sale price has increased from $0 last January 2025, to $0 as of January 2026
Condos & Townhomes
The median sale price has increased from $0 last January 2025, to $0 as of January 2026
No data to display
No data to display
The average time spent on the market went up from 0 days in January 2025, to 0 days as of January 2026
The average time spent on the market went up from 0 days in January 2025, to 0 days as of January 2026.
Single-Family Homes
The overbid percentage has increased from 0% last January 2025, to 0% a year later
Condos & Townhomes
The overbid percentage has increased from 0% last January 2025, to 0% a year later.
No data to display