
International Research Journal of Engineering and Technology (IRJET) e-ISSN: 2395-0056
Volume: 12 Issue: 02 | Feb 2025 www.irjet.net p-ISSN: 2395-0072


International Research Journal of Engineering and Technology (IRJET) e-ISSN: 2395-0056
Volume: 12 Issue: 02 | Feb 2025 www.irjet.net p-ISSN: 2395-0072
Achala Harsha¹, Chethan Nazre S², Chethana M³, Hithaishi M´, Nithin Kµ
¹ Department of Information Science, Malnad College of Engineering, Hassan, Karnataka, India
² Department of Information Science, Malnad College of Engineering, Hassan, Karnataka, India
³ Department of Information Science, Malnad College of Engineering, Hassan, Karnataka, India
⁴ Department of Information Science, Malnad College of Engineering, Hassan, Karnataka, India
⁵Assistant Professor, Department of Information Science, Malnad College of Engineering, Hassan, Karnataka, India
Abstract Hospital readmissions among diabetic patients pose serious health risks and financial burdens. This studyuses machine learning to predict 30-day readmissions, with XGBoost achieving the highest accuracy (94%). Key factors like inpatient visits, hospital stay duration, and diagnoses play a crucial role in readmission risk. These insights can help improve patient care and reduce unnecessary hospital visits.
Keywords Hospital readmission, diabetes, machine learning, XGBoost, predictive modeling, inpatient visits, hospital stay duration, medication changes, healthcare analytics.
1.
Inthepastdecades,readmissionstothehospitalshave become an aspect of the retrospectives and prospective researchthatsoughttoeliminateitfromthehospitals[1].A patientwhogetsreadmittedinahospitalwithinaspecified periodafterheorshewasdischargedfromthesamehospital isreferredtoasahospital readmission.Theoccurrenceof readmission to the hospital for some selected diseases in particularshowsthestandardofthehospital.Inotherword, itshowsthatthefirstadmissiondidnotgiveadequatecareto the patient and hence the life of the patient is at risk. Furthermore, the cost of care is negatively affected by the increasedrateofhospitalrevisits.Morespecifically,30-day hospitalreadmissionrateswererelativelyhighamongolder and higher risk patients [2]. It stated that venting factors wouldcosttheAmericanhospitalsmorethan$26billionon averageoneachpatient.InsteadofAmericans,patientswith diabetes,theyhaveagreaterriskofincurringmorecosts.Out ofalltheexpensestheUShadondiabeticpatientsin2011, $41billionwasincurredbypatientswhowerereadmitted within 30 days 4. Advocating for higher standards and minimizingunnecessaryexpenses,theUnitedStatescongress enacted the Hospital Readmission Reduction Program (HRRP). Consequently, beginning in October 2012, the CentersforMedicare,andMedicaidServices(CMS)initiated policies that financially minimize repayment incapability hospitals.
Addressingthiscriticalissueinvolvestheintensivedata analysis throughout the research process. This study is a secondaryanalysisusingmachinelearningmethods.Ourgoal oftheanalysisisto findthedeterminingfactorsthatleadto higherreadmissionandcorrespondinglybeingabletopredict whichpatientswillgetreadmitted.Therefore,weproposed tworesearchquestions:
1)Whatapproachescanweutilizetoeffectivelypredict hospitalreadmissionwithinthisdataset?
2) Which factors are the most significant indicators of hospitalreadmissionamongdiabeticpatients?
Theremainderofthispaperisstructuredasfollows:In Section 2, we provide a concise summary of previous research and highlight the existing gaps in the literature. Section3willdetailthemethodologyemployedinthisstudy, encompassing the description of the dataset and the analytical procedures. This entails data processing, exploratoryanalysis,featureengineering,aswellasmodeling andevaluation.Section4presentstheresultsanddiscussion in relation to each research question, followed by the conclusionandrecommendationsforfutureworkinSection 5.
Numerous prior investigations have examined the risk factors associated with readmission rates across various diseasetypes.Forinstance,onestudy[6]conductedabroad analysisaimedatpredictinghospitalreadmissionswithout concentratingonaspecificillness.
Inthecontextofdiabeticpatients,otherresearchefforts [7] [8] [9] have concentrated on subsets of the diabetic population and utilized smaller datasets. When assessing readmissionrates,certainstudieshaveemphasizedtherole ofdemographicandsocioeconomicvariablesthatmayaffect theserates[10].Forexample,researchby[11]highlighted age as a significant factor, revealing that both acute and chronic glycemic control impacted readmission risk for individuals aged 65 and older, based on data from 29,000 patients. Additionally, [12] investigated the correlation

International Research Journal of Engineering and Technology (IRJET) e-ISSN: 2395-0056
Volume: 12 Issue: 02 | Feb 2025 www.irjet.net p-ISSN: 2395-0072
between the likelihood of readmission and the primary diagnosisbymeasuringHbA1clevels.
Amongtherecentstudies,[13] predicteddiabetes with high risk of readmission through modeling multivariate patient medical records using machine learning classifiers such as Naïve Bayes, Bayesian Networks, Random Forest, Adaboost and Neural Networks. To contribute to the implementationofworkintotherealworld,acostanalysisis usedtodeterminetheeffectivecost.
Similarly,[Mingle]addressedthepreviousresearchgap that no typical performance metrics of machine learning classifies is documented. This research contributes to the fieldinseveralsignificantways:
1) It advances the identification and validation of risk factors associated with readmission rates. Previous literaturesuggeststhatunderstandingthesefactorscan be instrumental in formulating protocols aimed at enhancinginpatientcare.
2) It investigates previouslyunexplored machine learning algorithms to enhance the precision of predictive performance
In this section, we will provide a description of the dataset, theexploratory dataanalysis,featureengineering, modeling,andevaluation.
3.1
To explore this problem, we used a secondary dataset from UCI machine learning repository [14] dataset. The dataset includes 101,766 instances, representing 10 years (1999- 2008) of clinical care at 130 US hospitals and integrated delivery networks across the Midwest (18 hospitals),Northeast(58),South(28),andWest(16).Mostof the hospitals(78) have bed size between 100and 499,38 hospitals have bed size less than 100, and bed size of 14 hospitalsisgreaterthan 500. Thefeaturescollected inthe dataset are related to patient’s demographic information suchasrace,gender,age,weight;theinformationrelatedto their hospital diagnosis and treatment, such as num_lab_procedures, num_medications, num_outpatient, diagnosis,andmedicationprescription.Thedatasetisjustan extractedsubsetsetofHealthfactdataset.Giventhisisan opendatasetthatincludethelongitudinalandcross-sectional data,andwithrelativelycompleteattributes(55attributes), andreleasedintherecentyear(2014),wechosethedataset forexploringthequestions.
Before undertakingany formal analysis, weengaged in exploratory data analysis to examine the data types,
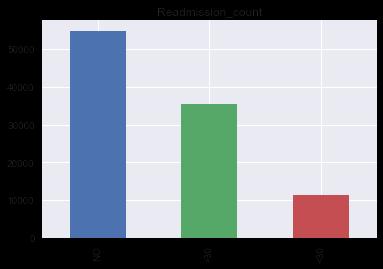
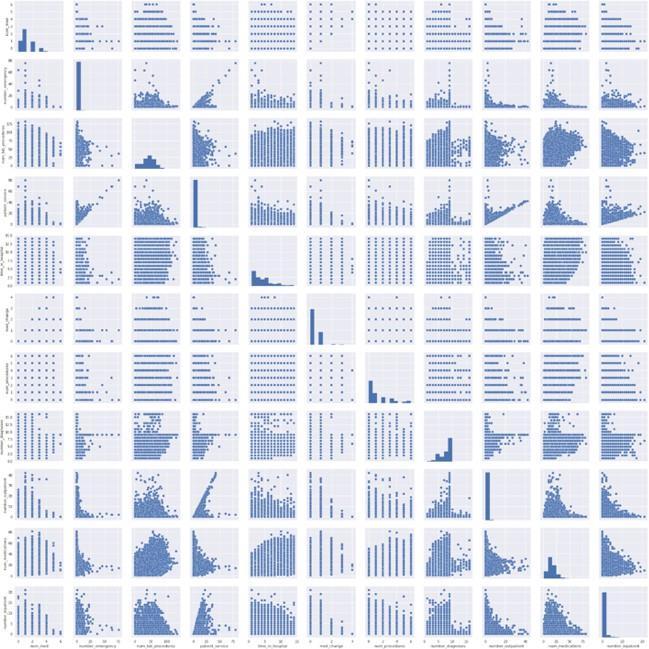
attributes, and overarching patterns present within the dataset. Our primary focus was on the class label "Readmitted"(refertoFig1),promptingustoinvestigatethe distribution of readmissions alongside various categorical variables. To explore the relationships among numerical variables, we employed scatter plots to illustrate their interconnectionsanddistributions(refertoFig2).
Followingtheexploratoryanalysis,weidentifiedmultiple challengespresentintheoriginaldataset.Consequently,itis essential to undertake various data wrangling tasks, including data cleaning, addressing missing values, generating new variables, and performing data transformationpriortomodeling.Thetoolsemployedforthis purpose include Python packages such as Numpy, Pandas,

International Research Journal of Engineering and Technology (IRJET) e-ISSN: 2395-0056
Volume: 12 Issue: 02 | Feb 2025 www.irjet.net p-ISSN: 2395-0072
Matplotlib, and Seaborn. We executed several pre-data processingprocedures.
3.3.1
Wediscoveredmanymissingvaluescodedas“?”across nominal variables. As Table 1 shows, this dataset has 8 variables which contain missing values. Since weight, medical_specialty,andpayer_codecontainsover35%values, andbecauseoftheirrelevancytowardourstudy,wedecideto dropallofthem.Raceonlyincludes2.23%missingvalues,so weonlydropthemissingvaluesandkeeptherest.Primary (diag_1), secondary (diag_2) and additional. (diag_3) diagnoseseachhaslessthan2%missingvalues,butcompared tothetotalnumberofinstances,westillneedtocleanthem. Technically,ourgoalistomaintainthemostinformationof thedataset,especiallythediagnosisisanimportantvariable related to the diabetes patients. Therefore, we adopted a strategytodropthemissingvalueswhenallthreediagnoses were missing. We then only drop 3 unknown and invalid instancesinourdataset.
Thisfeatureisthesumoforiginalvariablesfornumberof inpatientvisits,emergencyroomvisits,andoutpatientvisits. We did not apply weighting for these three variables. The reasonforthecreationistolowerthedimensionofourdata andtrytomakethedatasetsimpler.
2) med_change:Thedatasetcontains23medicationsofthe medicineuseforapatentduringthestayinhospital.Eachof thetuplerecordswhenachangewasmadeinthismedication ornotduringthecurrentstayasNo-fornomedication,Upforincreasingthedose,Down-fordecreasingthedoseand Steady-for keeping the current dose. Instead of counting changesforeachmedication,wedecidetocombinethemand countchangesforallofthem.
3) WedefineNoandSteadyasnochange,whileupanddown forchange.Doingthisstep will simplifythe model and we can try to find out if the readmission is related with medicationchanges.
4) num_med:Notonlymedicationchangescanberelated withreadmission,thetotalnumberofmedicationsusedcan also be a key feature, since the number of the medicine reflected the severity of certain disease. And thus, we createdavariablecallednum_medtostorethetotalnumber ofmedicationsapatientusedduringthestayofhospital.
3.3.2
After a quick view of the current dataset, we found some patientsdiedduringthehospitaladmissionwhodonothave anyprobabilityofbeingreadmitted,soweremovedthose tuples,asthedischarge_disposition_id=11.Wealsodroptwo variables(drugsnamedcitogliptonandexamide)inwhich allrecordshavetheexactlysamevalue.Bynoticingthattwo variables called encounter_id and patient_nbr has no relevancewiththeclasslabelreadmission,sowealsodrop thosetwovariables
3.3.3 Creation of New Features
1) patient_service: We created a new feature called patient_service, which measures the total number of hospital/clinician services a patient used in the past year.
1)RecodeDiagnoses:Thedatasetincludesthreediagnostic variables(`diag_1`,`diag_2`,and`diag_3`)thatwereencoded usingtheICD-9system,whichistheInternationalStatistical ClassificationofDiseasesandRelatedHealthProblems.This system is designed to map health conditions to corresponding generic categories together with specific variations,assigningfortheseadesignatedcode,up to six characters long This classification organizes diseases, symptoms, and external factors contributing to injury or illnessintospecificdiagnosticcodes,whichcanbeuptosix charactersinlength.First,wereplacedtheunknownvalue “?”into1.WethenrecodethediagnosesintoCirculatory-1, Respiratory-2, Digestive-3, Diabetes-4, Injury-5, Musculoskeletal-6, Genitourinary-7, Neoplasms-8, and Others-0.IfICDcodeisbetween390and460,oritequalsto 785, it belongs to category 1 (circulatory). If ICD code is between 460 and 520 or it equals to 786, it belongs to category2(respiratory).IfICDcodeisbetween520and580 oritequalsto787,itbelongstocategory3(digestive).IfICD codeequalsto250,itbelongstocategory4(diabetes).IfICD code is between 800 and 1000, it belongs to category 5 (injury).IfICDcodeisbetween710and740,itbelongsto category6(musculoskeletal).IfICDcodeisbetween580and 630 or it equals to 788, it belongs to category 7 (genitourinary). If ICD code is between 140 and 240, it belongs to category 8 (neoplasms). Others belong to category 0 (others). Appendix A shows the details of the

Volume: 12 Issue: 02 | Feb 2025 www.irjet.net p-ISSN: 2395-0072
recodingprocess
2) RecodeAge:Toanalyzethecorrelationbetweenageand readmission rates, age categories were transformed into numerical values by assigning the midpoint of each age range. For example, the age range of 10-20 years was represented by the value of 15 years. This conversion facilitatedamorequantitativeexaminationoftheimpactof ageonreadmissionrates.
3) Recode Readmission: The research concentrated on readmissionsoccurringwithina30-dayperiod,recognized asaclinicallyrelevanttimeframe.Patientswhoexperienced readmissionswithinthisperiodwereassignedacodeof`1`, whereas those with no readmission or readmissions occurring after 30 days were coded as `0`. This binary categorizationwasconsistentwiththestudy'sobjectives
4)RecodeOtherVariables: Forthreevariableswhichrelated with admission type, discharge disposition and admission source,wedecidedtoencodethedummyvariablesforthese categories.Forvariable“change”,werecodedchangeinto1 andnochangeinto0.Forgender,werecodedmaleinto1and femaleinto0.Fordiabetes_Med,werecodedyesinto1andno into 0. For race, we recoded the categorical variables into dummyvariables:Caucasian-1,AfricanAmerican-2,Hispanic3,Asian-4,andothers-0.ForA1Cresult,werecoded>7and>8 into1,Norminto0,andNoneinto99.Formax_glu_serum,we usedthesimilarmethod,namely,werecoded>200and>300 into1,Norminto0,andNoneinto99.
3.4 Feature Engineering
3.4.1 Data Type Conversion
Fornominalfeatures,weconvertedthemintoobjecttype, forthelaternumericalvariablesprocessing.
3.4.2 Log Transformation, Standardization, and Correlation
The scatter plot of the distributions, as illustrated in Figure 1, reveals that most numerical features exhibit significantskewnessandelevatedkurtosis.Accordingtothe establishedcriterionofskewnessfornormaldistribution,a value exceeding +1 or falling below -1 indicates a highly skeweddistribution.Conversely,iftheskewnessliesbetween -1and-0.5orbetween0.5and1,thedistributionisclassified asmoderatelyskewed.Askewnessvaluewithintherangeof0.5 to 0.5 suggests that the distribution is approximately symmetric.Regardingkurtosis,athresholdof3isindicative ofanormaldistribution.Toaddresstheseissues,weapplied log transformation to the numerical variables, thereby facilitating their normalization to achieve a Gaussian-like distribution.Giventhatthenumericalvariablesdonotshare acommonscale,wesubsequentlyemployedstandardization methodstorescalethedatausingtheappropriateformula.:

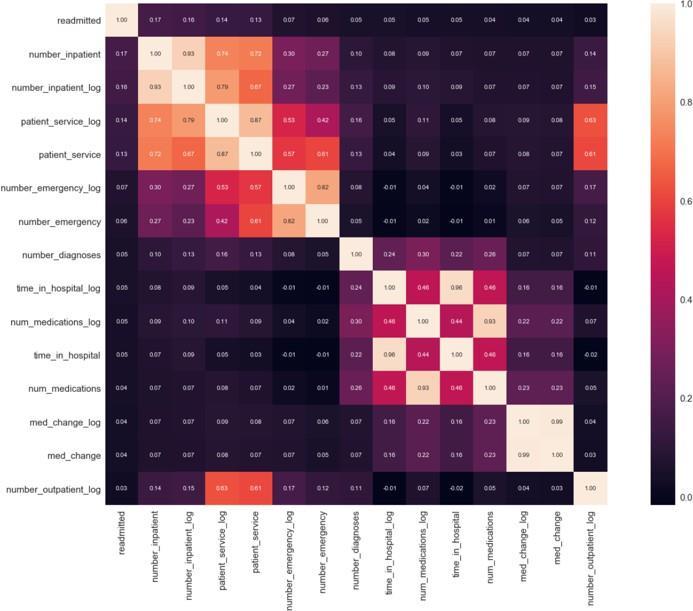
Afteralldataarestandardized,wecheckedthecorrelation between the variables using a heat map to find top 15 correlatedvariablesasFig.3shows.Thereisnottoomuch correlationbetweenthevariablesandthecorrelationlisted areself-explainable.
3.4.3 Outliers.
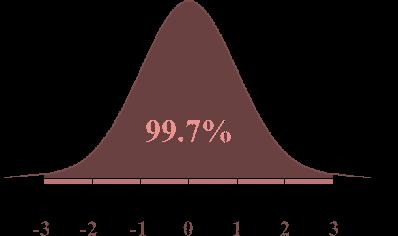
For detecting and processing the outliers, we used the coveragerulefornormaldistributiontodealwithoutliers.As Fig.4shows,theremaining0.3%ofthedataaretreatedas outliersforthisproject.Andthus,weremovedtheoutliers.
3.4.4
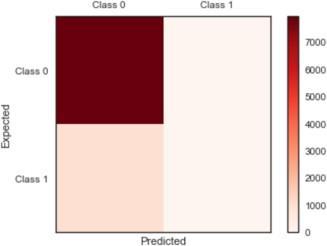
Priortothemodelingphase,weconductedananalysisto assess the balance of class labels within the dataset. The findingsrevealedthatthereare79,512instancesclassifiedas class 0, which corresponds to patients with no need for admission or those experiencing readmissions beyond 30 days.Incontrast,only9,607patientsfallintothecategoryof readmissions within 30 days. This results in a disproportionate ratio exceeding 8:1, with the proportion thresholdsetbetween10-20%.Suchanimbalanceindicates thatourdatasetissignificantlyskewed,whichmayenhance accuracy in subsequent modeling efforts. To evaluate the

2395-0056
Volume: 12 Issue: 02 | Feb 2025 www.irjet.net p-ISSN: 2395-0072
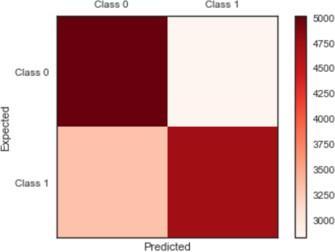
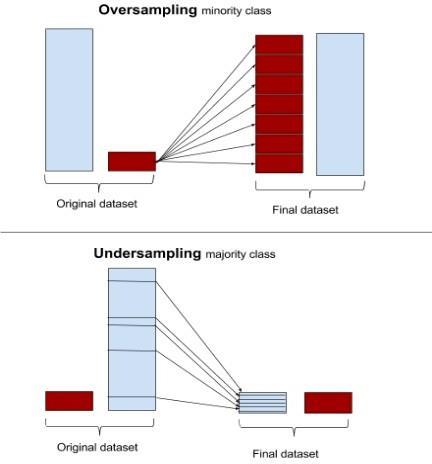
balanceofclasslabels,weemployedaconfusionmatrix,as illustratedinFigure5.Ourinitialbenchmarkmodel,utilizing logistic regression,achievedan accuracy of 89%, although both precision and recall rates were recorded as zero. To address the imbalance, weimplemented an over-sampling techniqueknownasSMOTE,targetingtheunderrepresented class of readmissions. Figure 6 provides a visual representation of the mechanisms of over-sampling and under-sampling. Following the application of SMOTE, the datasetwillconsistof79,512patientsinbothcategory0and category 1. Additionally, Figure 5 presents the confusion matrixbeforeandafterthedatabalancingprocess.
4. EXPERIMENT
Ourobjectiveinthismodelingexperimentistoidentify thefactorsassociatedwithhigh-riskdiabeticpatients.Thisis framedasaclassificationproblem,specificallydetermining whether a patient will be readmitted within 30 days of discharge, after 30 days, or not at all. To address this, we employedvariousclassificationalgorithmstoascertainthe
mosteffectivemethodforachievingthehighestaccuracy.We selectedandcomparedfourdistinctclassificationalgorithms. Beforetrainingthesealgorithms,wedividedourdatasetinto two separate subsets: the training set and the test set, comprising 90% and 10% of the data, respectively. The parametersforeachalgorithmwereselectedbasedontheir classificationperformance,whichwasassessedusing10-fold cross-validationonthetrainingset.Theperformanceofall algorithmswassubsequentlyevaluatedonthetestset.The methodsweimplementedinclude
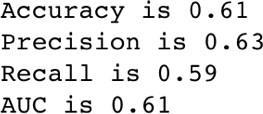
Logisticregressionisusedasabenchmarkmodelforour analysis.Sinceweassumethatourdatacanbemodeledasa log likelihood of outcome for the binary class label readmission,logisticregressioncanhelpustounderstand therelativeimpactandsignificanceofeachattribute.Wetest thismodelbyusing90%trainingand10%testingdataand 10-foldcross-validation.Weachievedacross-validationscore: 61.29% and test set score 61.35%. By looking into the confusion matrix, we can calculate several measures of accuracy:
Decisiontreesisapopulartree-basedmodelthatiseasily tointerpretthelogicforsplitting.Decisiontreesclassifythe databysortingthemdownthetreefromtheroottosomeleaf node, with theleafnode providingtheclassification tothe data.Duetotheinteractionsbetweenvariablesinherently, weremovedtheinteractionvariablesfromthefeaturesetwe did for logistic regression. Similarly, we did 10- fold cross validationscorefordecisiontreestoo.Thescoreequalsto 88.97% and the dev set score is 89.43%, so decision trees look good for this dataset. After checking the score, we analyzed the confusion matrix for decision trees for both entropyandginimethods.Asaresult,bothyieldedthesame resultsofmeasurements:
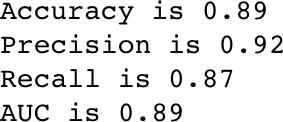
The result turned out that decision trees performed better than logistic regression based on its accuracy. The following graph showed the splitting process of the tree node.Wevisualizedthetreesinfirsttwolevels(Fig7).

International Research Journal of Engineering and Technology (IRJET) e-ISSN: 2395-0056
Volume: 12 Issue: 02 | Feb 2025 www.irjet.net p-ISSN: 2395-0072
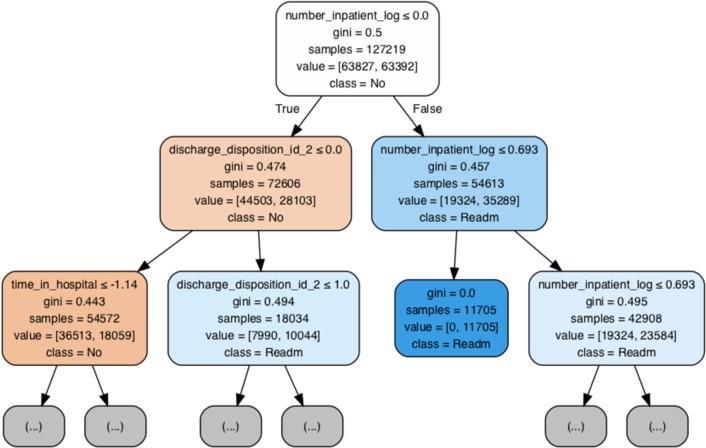
From the graph, it indicated inpatient visits is the first featurethisdecisiontreeusedindecidingwhetherapatient willgetreadmitted.
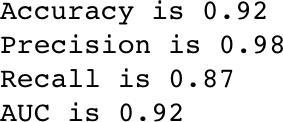
Random Forest is composed of a set of decision trees. Eachdecisiontreeactsasaweakclassifierandpoolingthe responses from multiple decision trees leads to a strong classifier.Each decision tree is trained independently and determines the class of an input by evaluating a series of greedily learned binary questions. The random forest consistingof10trees,withthemax_depthofas25nodeswas used,asitwasfoundtobeoptimalfromtheexperimentwith varying number of trees and depth in the forest. After implementingRandomForest,weachievedsimilarresultsof measurementsforusingginiandentropymethods.Random Forestshowedbetterresultsthandecisiontreeasregardsto predictionaccuracy.
Followingtheexecutionoftherandomforestalgorithm, we opted to enhance our model by employing a boosting techniqueutilizingtherelativelynovelalgorithmXGBoost. Boostingservesasanensembleapproachthatconstructsa robust classifier from a series of weaker classifiers, contingent upon the degree of correlation between the learners and the actual target variable. Each subsequent
predictorrectifiestheerrorsmadebytheprecedingmodel, iteratively stacking models until the training data is accuratelypredictedorapredeterminedmaximumnumber ofmodelsisreached.
EXtreme Gradient Boosting (XGBoost) is an ensemble machine learning technique that has gained significant tractionsinceitsinceptionin2014.Itrepresentsascalable andpreciseimplementationofgradientboostingmachines, demonstrating remarkable capabilities in maximizing computational efficiency for boosted tree algorithms. XGBoost is designed specifically to enhance model performance and computational speed, accommodating a variety of generic loss functions, and offering a range of customizableparameters.

We applied and tuned the algorithm for better performance.Wetunedthefollowingthreeparameters
1. eta: learning rate to prevents overfitting (eta=0.01, 0.02,0.05).
2. max_depth: the max depth of the tree (max_depth=3,4,5,6,7,8,9).
3. cols_sample: the percentage of features can be chosen (cols_sample=0.6,0.7,0.8,0.9,1.0).
Wetunedthethreeparametersonebyoneanditeratethe valuestofindtheleasttesterrorandhighestaccuracy.The bestiterationwefoundiswithaccuracy0.94,precision1.0, recall0.88andAUCis0.94.
Inthissection,wewilldiscusstheevaluationofclassifier performanceandanswerthesecondquestionofidentifying themostimportfactors.
4.5.1
Eachalgorithmunderwentevaluationthrougha10-fold stratifiedcross-validationprocess.Thistechniqueinvolves partitioning the dataset into several folds in a random yet balancedmanner.Stratifiedcross-validationspecificallyaims tomaintaintheclassdistributionacrossthefolds,ensuring thateachfoldaccuratelyreflectstheoveralldataset.Inthis method,thelearningalgorithmistrainedonnineofthefolds whilebeingtestedontheremainingfold.Byrepeatingthis cross-validation procedure, we mitigate the risk of bias introducedbyanyrandominitialization,therebyenhancing thereliabilityoftheresults.

International Research Journal of Engineering and Technology (IRJET) e-ISSN: 2395-0056
Volume: 12 Issue: 02 | Feb 2025 www.irjet.net p-ISSN: 2395-0072
Theperformanceofallalgorithmsisassessedusingthe area under the curve (AUC), which corresponds to the cstatisticinthecontextofbinaryclassification.TheAUC-ROC curveservesasaperformancemetricforclassificationtasks acrossvariousthresholdsettings.TheROCcurverepresentsa probabilitycurve,whiletheAUCquantifiesthemodel'sability todifferentiatebetweenclasses.Specifically,itindicatesthe likelihoodthatapositiveinstance,definedas“<30”codedas 1, is ranked higher than a negative instance coded as 0. A higherAUCvaluesignifiesasuperiormodelperformancein accuratelypredicting0sas0sand1sas1s.Priorstudiesin thedomainofreadmissionhavereportedAUCvaluesranging from0.5to0.7.
In the evaluation of four predictive models, Table 2 indicatesthatXGBoostoutperformstheothersinforecasting theadmissionrate,attainingthehighestaccuracyof0.94and an AUC of 0.61. The random forest model follows as the secondmosteffective,achievinganaccuracyof0.92andan AUCof0.94.Additionally,Figure8illustratesthecomparative performanceofthemodelsoverall.
Classifier Accuracy Precision Recall AUC
Forthesecondquestionwhatthestrongpredictorsare contributingtopredictingreadmission,differentalgorithms provided different results. Specifically, Fig. 9 illustrated showedthemostimportantvariablesaftertheclassification for decision tree. We plotted those features whose importanceisbiggerthan0.01.Themostimportantvariables are number_inpatient and time_in hospital, and discharge_disposition_id_2, number_procedures and num_medicationsareamongthetop5strongestpredictors
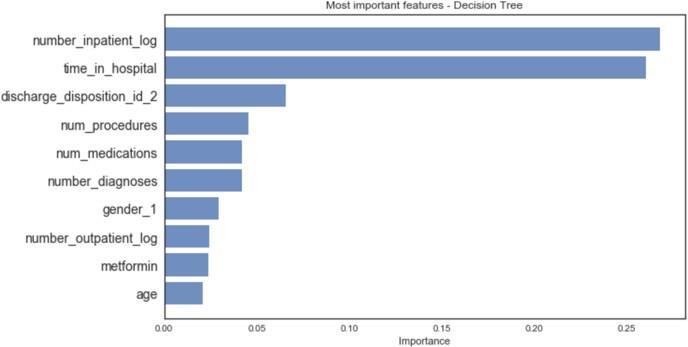
Fig.10showedtheimportantfeaturesforrandomforests, which are different from the decision trees, with number_inpatient, time_in _hospital, number_diagnosis, discharge_id_2andmetforminareamongthetop5important predictors.
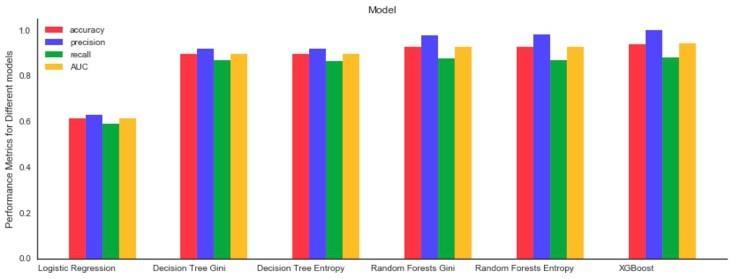
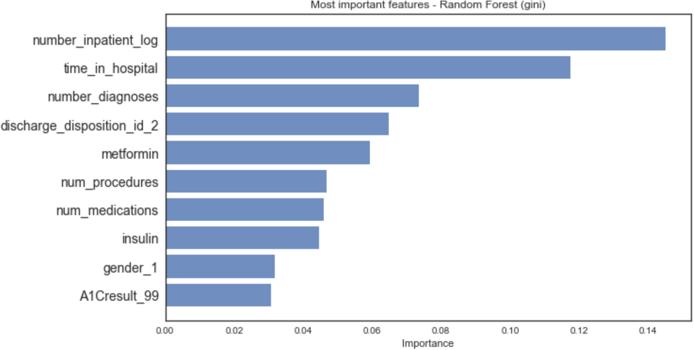
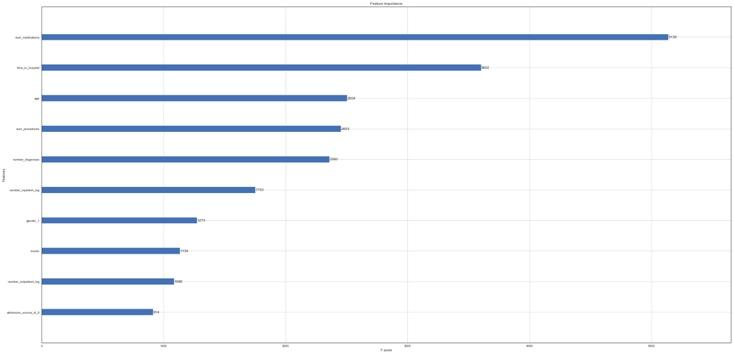
Fig. 11 indicated the important features for XGBoost which are slightly different than previous with number_medications, time_in_hospital, age, number_procedures, num_diagnosis are among the top 5 importantpredictors. Theresultsarequiteinteresting.

International Research Journal of Engineering and Technology (IRJET) e-ISSN: 2395-0056
Volume: 12 Issue: 02 | Feb 2025 www.irjet.net p-ISSN: 2395-0072
In this work we adopted machine learning methods to identifyhighriskpatientsandevaluateddifferentmachine learningalgorithms.Comparedtothepreviousanalysis,our studyachievedhighaccuracyduetothesophisticatedpreprocessingprocedure.TheXGBoostmethodisreportedtobe the best method for prediction of the readmission rate for diabetespatients.
We identified the most important factors as the time_in_hospital and number of inpatients, number of diagnoses,whichappearstoassociatewiththeseverityofthe disease. Further studies could conduct more exploration whenanalyzingthesefactorsindividually.
[1]Benbassat,J.Taragin,M.2000.Hospitalreadmissionsasa measure of quality of health care advantages and limitations. Arch Intern Med. 160(8):1074–1081.
[2]Leppin,A.L.,Gionfriddo,M.R.,Kessler,M.,Brito,J.P.,Mair, F.S., Gallacher,K., Wang, Z., Erwin, P.J.,Sylvester, T., Boehmer, K. and Ting, H.H., 2014.Preventing 30-day hospital readmissions: a systematic review and metaanalysis of randomized trials. JAMA internal medicine, 174(7),1095-1107.Hines, A.L.,Barrett,M.L.,Jiang,H.J. and Steiner, C.A., 2006. Conditions with the largest number of adult hospital readmissions by payer, Statistical Brief. 172(2011).
[3]Salerno,A.M.,Horwitz,L.I.,Kwon,J.Y.,Herrin,J.,Grady, J.N.,Lin,Z.,Ross,J.S.andBernheim,S.M.,2017.Trendsin readmission rates for safety net hospitalsandnon-safetynethospitalsintheeraoftheUS Hospital Readmission Reduction Program: a retrospective time series analysis using Medicare administrativeclaimsdatafrom2008to2015. BMJ open, 7(7) Dungan, K. M. The effect of diabetes on hospital readmissions.,2012. Journal of diabetes science and technology, 6(5),1045–1052.
[4]Eby,E.,Hardwick,C.,Yu,M.,Gelwicks,S.,Deschamps,K., Xie,J.andGeorge, T.,2015.Predictorsof30-dayhospital readmission in patients with type 2 diabetes: a retrospective, case–control, database study. Current medical research and opinion,31(1),107-114.
[5]Howell, S., Coory, M., Martin, J. and Duckett, S., 2009. Usingroutineinpatient datatoidentifypatientsatriskof hospitalreadmission. BMC Health Services Research,9(1), 96.
[6]Jiang, H.J., Stroyer, D., Friedman, B. and Andrews, R., 2003. Multiple hospitalizations for patients with diabetes. Diabetes Care, 26(5),1421-1426.
[7]Hosseinzadeh,A.,Izadi,M.T.,Verma,A.,Precup,D.,and Buckeridge, D.L., 2013. Assessing the predictability of hospitalreadmissionusingmachine learning.IAAI.
[8]Strack,B.,DeShazo,J.P.,Gennings,C.,Olmo,J.L.,Ventura, S., CIS, K.J. and Clore, J.N., 2014. Impact of HbA1c measurementonhospitalreadmissionrates: analysisof 70,000 clinical database patient records. BioMed Research International
[9]Bhuvan,M.S.,Kumar,A.,Zafar,A.andKishore,V.,2016. Identifying diabetic patients with high risk of readmission arid preprint arXiv:1602.04257.
[10] https://archive.ics.uci.edu/ml/datasets/diabetes+1 30 us+hospitals+for+years+1999-2008
[11] https://freedium.cfd/how-to-use-machine-learningto-predict-hospital-readmissions-part-2-616a0c920
[12] DamianM.PredictingDiabeticReadmissionRates: Moving Beyond Hba1c. Curr Trends Biomedical Eng & Biosci. 2017; 7(3): 555707. DOI: 10.19080/CTBEB.2017.07.555715.