
International Research Journal of Engineering and Technology (IRJET) e-ISSN: 2395-0056
Volume: 12 Issue: 02 | Feb 2025 www.irjet.net p-ISSN: 2395-0072


International Research Journal of Engineering and Technology (IRJET) e-ISSN: 2395-0056
Volume: 12 Issue: 02 | Feb 2025 www.irjet.net p-ISSN: 2395-0072
1Ebrahim Abdul Monem Ayoub
Master Student at Syrian Virtual University Homs, Syria ebrahim_210362@svuonline.org
Abstract - Artificial intelligence has become a pivotal tool in enhancing healthcare, significantly contributing to the advancement of diagnostic methods and medical decisionmaking. Traditionally, medicine relied primarily on the expertise ofphysicians. However, with the massive increase in medical data, the need for AI applications has grown, making machine learning more prevalent in the medical field.
Diabetes is one of the most common chronic diseases and presents a significant challenge due to its impact on various bodily functions. Irregular blood glucose levels can lead to severe complications, such as heart disease or eye diseases (diabetic retinopathy). Therefore, early detection of this condition is a crucial step in preventing complications and reducing health risks for patients.
In this research, we apply machine learning algorithms to predict diabetes while focusing on the impact of data balancingusingthe SMOTEtechnique on modelperformance. Several algorithms were tested, including Support Vector Machine (SVM) and Random Forest (RF), where the results showed a significant improvement in classification accuracy after addressing data imbalance. Additionally, an interactive web-based model was developed, allowing doctors and patients to input their health data and receive reliable diabetes riskpredictions. This studyhighlightstheimportance of feature analysis and the use of hyperparameter tuning techniques to ensure better accuracy, with recommendations to expand research to include reinforcement learning and the Internet ofThings (IoT) for enhanceddiabetesmonitoringand diagnosis.
Key Words: Machine Learning Algorithms, Data Analysis, Diabetes Mellitus, Classification, Feature Selection, Data Balancing.
The spread of diseases threatens health, economy, and security,whichrequiresustogivediseasesofallkindsalot of time and effort to avoid their risks. There are many diseases that deserve to be at the forefront of studies for theirdiagnosisandtreatment.Inthisresearch,wewillfocus ondiabetes.Diabetesisamajorpublichealthproblemthatis increasing significantly. According to the International DiabetesFederation[1],in2021,about537millionadults (20-79years)arelivingwithdiabetes.Thetotalnumberof people with diabetes is expected to rise to 643 million by
2030and783millionby2045.Diabetescausedthedeathof 6.7millionpeople,anddiabetesistheseventhleadingcause ofdeathintheUnitedStates.
Inthefaceofthisincreasingchallenge,theurgentneedhas emergedtodevelopeffectivemethodsfortheearlydetection of diabetes. Herein lies the importance of using artificial intelligenceandmachinelearningtechniquesasadvanced toolsindiagnosis.Thesetechnologiesenabletheanalysisof medical data with high accuracy, facilitating early disease detection and aiding in taking appropriate preventive measuresinatimelymanner.
This research seeks to provide a scientific contribution in this field by leveraging machine learning techniques to analyzehealthdataanddevelopaccuratemodelsforearly diagnosis.
Itoccurseitherwhenthepancreasdoesnotproduceenough insulin(insulinisahormonethatregulatesbloodsugar)or whenthebodycannoteffectivelyusetheinsulinitproduces, leadingtodamage,dysfunction,andfailureofvariousorgans [2].
Machine learning is a branch of artificial intelligence that enables computer systems to learn automatically without humanintervention.Itfocusesonusingdataandalgorithms rather than relying on human skills and abilities, which providesgreateraccuracyandspeed.
Dr.NasreenSuleiman[3]presentedamodelforpredicting type 2 diabetes using machine learning algorithms. Two modelsweredevelopedbasedonExtremeGradientBoosting (XGBoost) andLogistic Regression(LR).The modelswere evaluated using the Pima Indian Diabetes dataset. The results showed that XGBoost outperformed the LR model, achievinganAUROCof85%,sensitivityof71%,specificityof 81%,accuracyof77%,precisionof67%,andanF1-scoreof 69%.

International Research Journal of Engineering and Technology (IRJET) e-ISSN: 2395-0056
Volume: 12 Issue: 02 | Feb 2025 www.irjet.net p-ISSN: 2395-0072
TheresearchersI.T.EliasandM.M.T.Jawhar[4]compared several machine learning algorithms for diabetes classification using the Pima Indians Diabetes Dataset. Variousclassificationmodelsweretested,includingLogistic Regression,RandomForest,DecisionTree,SupportVector Machine (SVM), K-Nearest Neighbors (KNN), and Naïve Bayes.TheresultsshowedthattheDecisionTreeachieved thehighestclassificationaccuracyof98.66%,outperforming the other models, while KNN and Naïve Bayes recorded accuracies of 80.66% and 80%, respectively. The models wereevaluatedusingaccuracy,recall,andF1-scoremetrics, highlighting the importance of selecting the appropriate modelfordiabetesdataanalysisandimprovingearlydisease prediction.
The researchers J. J. Khanam and S. Y. Foo [5] compared sevenmachinelearningalgorithmsforpredictingdiabetes usingthePimaIndiansDiabetesDataset,whichincludes768 medical records and 9 features related to diabetes risk factors.TheappliedalgorithmsincludedLogisticRegression (LR),SupportVectorMachine(SVM),RandomForest(RF), NaïveBayes(NB),DecisionTree(DT),K-NearestNeighbors (KNN),andAdaBoost(AB).TheresultsshowedthatLRand SVMperformedbestinclassification,withSVMachievingan accuracyof77.71%andLRreaching78.85%.Additionally,a neural network (NN) with two layers was developed, achievingaclassificationaccuracyof88.6%,makingitthe most efficient model in the study. The findings emphasize theimportanceofselectingrelevantfeaturesandimproving deep learning models to enhance diabetes prediction accuracy.
Thisresearchpaperaimstoexploreamoreaccuratemodel for diabetes prediction. We experimented with various classification and clustering algorithms to enhance predictionaccuracy.Belowisabriefsummaryofthesteps followed:
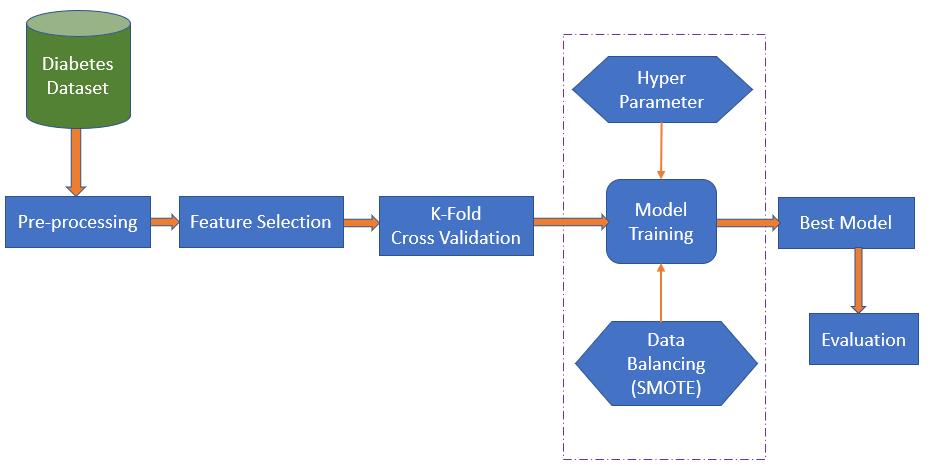
3.1 Dataset - Thedatasetusedfordiabetesdiagnosiswas obtained from Kaggle, which provides online datasets for datascientists.Thedatasetconsistsof100,000records,each representing a patient or individual with medical and demographic information related to diabetes risk factors, whether they are diabetic or non-diabetic. The dataset contains8featuresinadditiontothetargetcolumn,which indicatesdiabetesstatus.
Table -1: Dataset Description
value Description Feature
Male,Female Patientgender gender
Age Patientage age
0=No,1=Yes Does the patient have highbloodpressure? hypertension
0=No,1=Yes Does the patient have heartdisease? heart_disease
Never,Former, Current, No Info
Where normal values range between 18.5 and24.9.
Anormalvalue is less than 5.7%, and it indicates diabetes if it exceeds6.5%.
Blood glucose level (mg/dL). Normal values range between 70-140mg/dL.
The patient's smoking status smoking_history
Body Mass Index (BMI), which is an indicator of obesityorthinness. bmi
Glycated hemoglobin level(HbA1c),whichisa test used to assess average blood sugar levelsoverthepastthree months.
Blood glucose level, whichisoneofthemost important indicators used in the diagnosis of diabetes.
HbA1c_level
blood_glucose_level
0= Not Diabetic, 1=Diabetic Isthepersondiabetic? diabetes
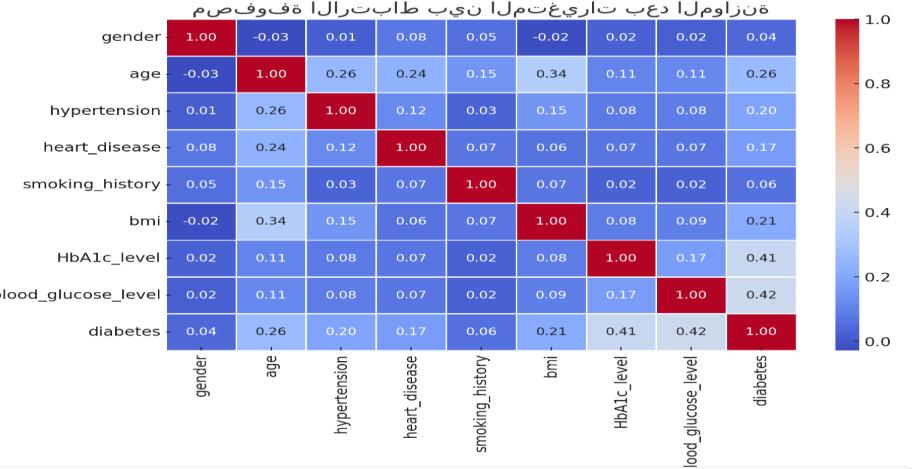
Correlationistheamountofcontextbetweenproperties.Itis a real numerical value that indicates the degree of significancebetween0and1.Anegativevalueindicatesan inverserelationship,whileadirectrelationshipisindicated byapositivevalue.Fig-2showsthecorrelationmapofthe proposedmode.

International Research Journal of Engineering and Technology (IRJET) e-ISSN: 2395-0056
Volume: 12 Issue: 02 | Feb 2025 www.irjet.net p-ISSN: 2395-0072
3.2 Data Preprocessing -
Datapreprocessingisacriticalstepinanyanalysisprocess. Healthcare-related datasets often contain missing values, outliers,duplicates,andotherinconsistenciesthatcanaffect theeffectivenessofthedata.preprocessingisessential.This stepisvitalforapplyingmachinelearningtechniquestothe dataset,ensuringaccurateresultsandsuccessfulpredictions.
1) Duplicates values: Duplicate data refers to the presence of identical or similar records in a dataset. Theseduplicationscannegativelyimpactthequalityand reliabilityofpredictivemodelsinseveralways[6]:
A. Model Bias: Thepresenceofduplicaterecordsmay biasthemodeltowardscertainpatterns,reducingits abilitytogeneralizeandmakeaccuratepredictions whendealingwithnewdata.
B. Unnecessary IncreaseinDataVolume:Duplicates inflatethesizeofthedataset,increasingthestorage requirementsandcomputationalresourcesneeded toprocessthedataandtrainthemodels.
During data analysis, we identified 3,854 duplicate records,whichaccountforapproximately3.85%ofthe data. We removed the duplicate records using the drop_duplicates()methodinPython.
2) Outliers values: Outlierscanbevalidvaluesbutare inherentlyextremeandfarfromthenormalvaluesfor that field, or they may be erroneous values resulting from human error or mechanical failure, such as a sensormalfunctioningorprovidingincorrectreadings. Inanycase,itispreferabletoeliminatethesevalues,as theycannegativelyimpacttheaccuracyoftheclassifier.
The Interquartile Range (IQR) is one of the most commonly used methods for detecting and removing outlier data. To apply this method, we need to follow thesesteps:
1. Calculate the first quartile (Q1) and the third quartile(Q3),thencomputetheIQRasIQR=Q3Q1.
2. Determinethenormaldatarangewithaminimum ofQ1-1.5*IQRandamaximumofQ3+1.5*IQR.
3. Anyvalueoutsidethisrangeisconsideredanoutlier andshouldberemoved.
TheboxplotisagraphicalapplicationoftheIQRmethod fordetectinganyoutliervalues,asshowninFigure-3.
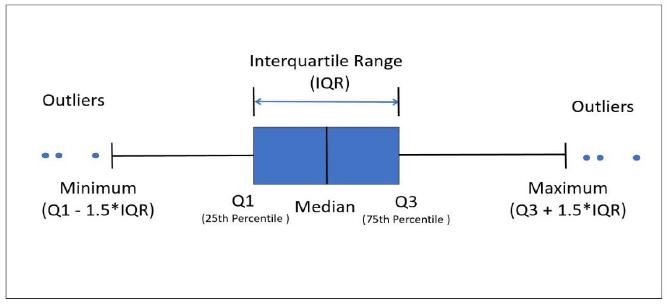
Fig -3:TheIQRmethodfordetectingoutliervalues
3.3 Feature Selection - Featureselectionaimsto:
1. Remove features that are not relevant to the target variable, especially when the number of features is large.
2. Reduce the training and testing time as well as the complexityoftheclassifier,resultinginmoreefficient andcost-effectivemodels.
3. Minimizeoverfittingandhelpcreatebettergeneralized models.
1) Chi-Square: It is a statistical test used to compare observedandexpectedresults.Itsgoalistodetermine whetherthevariationbetweenactualandexpecteddata isduetochanceoranassociationbetweenthevariables under study [7]. As a result, the chi-square test is an ideal choice for understanding and interpreting the relationshipbetweentwocategoricalvariables.
Itiscalculatedinthemannershowninequation(1)

Where:
C = degrees of freedom, O = observed value(s), E = expectedvalue(s).
Letusconsiderascenariowhereweneedtodetermine therelationshipbetweenanindependentclassfeature (predictor)andadependentclassfeature(response).In featureselection,ourgoalistoidentifythefeaturesthat

International Research Journal of Engineering and Technology (IRJET) e-ISSN: 2395-0056
Volume: 12 Issue: 02 | Feb 2025 www.irjet.net p-ISSN: 2395-0072
aremostdependentonresponse.Whentwofeaturesare independent, the observed number is close to the expectednumber,sowewillhaveasmallerChi-Square value. A high chi-square value indicates that the independencehypothesisisincorrect.Insimplewords, higher Chi-Square feature value is more response dependentandcanbeselectedfortypicaltraining
2) Pearson’s Correlation: Itisastatisticalmeasureused todeterminethestrengthoftherelationshipbetween twonumericalvariables.Itisalsoknownasthelinear correlationcoefficientandisrepresentedbythevalue r, whichrangesbetween-1and1.[8]
Itiscalculatedinthemannershowninequation(2)

Where:
A. r=1:Indicatesa perfectpositivecorrelationbetween the two variables, meaning that an increase in one variableresultsinanequalproportionalincreaseinthe other.
B. r=-1:Indicatesaperfectnegativecorrelationbetween the two variables, meaning that an increase in one variableresultsinanequalproportionaldecreaseinthe other.
C. r=0:Indicatesnolinearrelationshipbetweenthetwo variables.
3.4 SMOTE - SyntheticMinorityOver-samplingTechnique is one of the techniques used to address the issue of imbalanceddatadistribution,primarilyaimedatimproving theperformanceofpredictivemodelsthatsufferfromclass imbalance. SMOTE works by increasing the number of samplesintheunderrepresentedclassthroughthecreation ofsyntheticsamplesratherthanduplicatingexistingones. This enhances the predictive capability of models and reducesbias.[9]
Syntheticsamplesaregeneratedusingtheequationshown inequation(3)
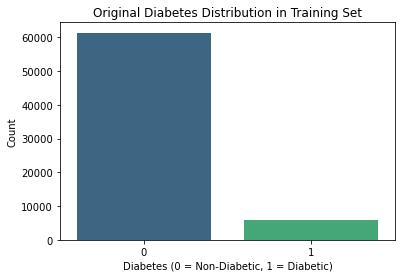
Chart -1:Originaltrainingdatadistribution
chart -1 shows that the original training data is highly imbalanced,withthenumberofsamplesclassifiedasnondiabetic (Class 0) being significantly higher than those classified as diabetic (Class 1). Class 0 (non-diabetic) accountsforapproximately95%ofthedata,whileClass1 (diabetic)representsonlyabout5%ofthedata.
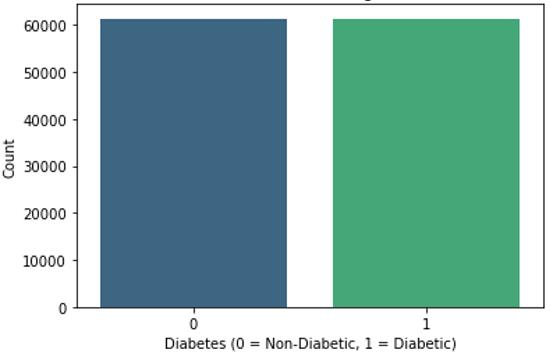
Chart -2:datadistributionafterbalancing.
chart -2 shows that the training data distribution has become balanced, with Class 0 (non-diabetic) now representing approximately 50% of the data, and Class 1 (diabetic)alsoaccountingforabout50%.Thisenhancesthe model'sabilitytodistinguishbetweenthetwoclassesand reducesbiastowardthedominantclass.
Where:λisarandomnumberbetween0and1,resultingin the generation of new points between real data without directduplication.
3.5 Cross-Fold Validation - K-Fold is one of the most commonlyusedcross-validationtechniques.InK-Foldcrossvalidation,theparameterKindicatesthatthedatasetwillbe dividedintoK sections.One section isused for validation, while the machine learning model is trained using the remaining K-1 sections. This process is repeated, with a differentsectionusedforvalidationeachtimewhiletherest areusedfortraining.Ineachiteration,accuracyiscalculated. Finally, the average accuracy across all iterations is computed,providingthefinalmodelaccuracy,asshownin Fig-4[10].

International Research Journal of Engineering and Technology (IRJET) e-ISSN: 2395-0056
Volume: 12 Issue: 02 | Feb 2025 www.irjet.net p-ISSN: 2395-0072

3.6 Model Building - Thisstageisthemostimportant,as wewillusethemachinelearningalgorithmsavailableinthe scikit-learn library, which assist us in applying machine learningalgorithmstoprocessourdata.Wewillthenselect thebestmodelbasedontheclassificationaccuracymetric. Themachinelearningalgorithmsthatwereappliedare:
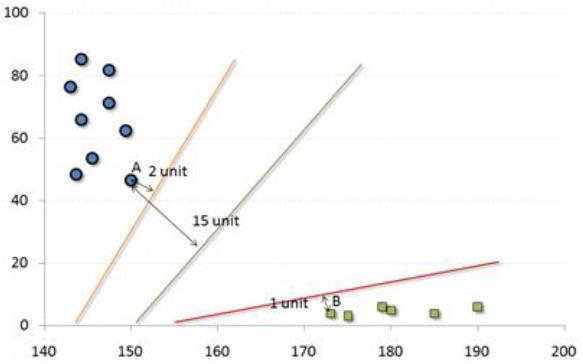
1) Support Vector Machine (SVM): It is one of the supervisedalgorithmsthatreliesonclassifyingdataby findingahyperplaneinanN-dimensionalspace,where Nrepresentsthenumberoffeaturesinthedataset.This hyperplaneseparatesthedatapointsfromeachother. Therearemanypotentialhyperplanesthatcanseparate the data into classes, but we want the one that maximizesthedistancebetweendatapointsbelonging todifferentclasses.
InFig-5,wehavetwofeaturesofthedata,soweplotted thedatapointswithinatwo-dimensionalspace.Theline that divides the data into two differently classified groupsisthelineinthemiddle,asitprovidesthebest separationbetweenthedatapointsbelongingtothetwo groups.Thislineservesasourclassifier,allowingusto classifynewdata(testdata)basedonthepositionofthe testdatapointsoneithersideoftheline.[11]
2) Random Forest (RF): Randomforestsareconsidered anensembleclassifierastheyconsistofacollectionof decisiontrees.[12]Thesensitivityofdecisiontreesto training data can lead to variability in classification resultswithminorchangesintheinputdata.Therefore, differentdecisiontreesthatmakeuptherandomforest aretrainedusing differentand randomsubsetsofthe training data. To classify a new sample, it must pass through all the decision trees in the forest, and the forest's classification is determined by taking the majorityvoteinthecaseofcategoricaldataoraveraging the outputs of all trees in the forest when classifying numericaldata.Sincetherandomforestalgorithmtakes into account the results from different decision trees, this helps to reduce the variability that arises from relying on the output of a single decision tree on the samedataset.[13]
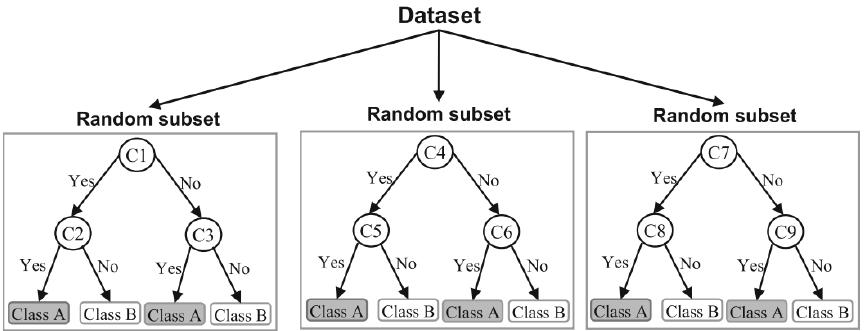
Fig -6:Thestructureoftherandomforestalgorithm.
Table-2showsthespecificationsofthecomputerusedinthe experiment.
Table -2: Specifications of the computer used in the experiment Processor
NumberofCores 8
RandomAccessMemory(RAM) DDR4–16GB OperatingSystem Windows10
1) performance metrics: Toclarifyperformancemetrics, it is essential to first explain the Confusion Matrix for binaryclassification.
Confusion Matrix for Binary Classification: Inbinaryclassification,eachinputsampleisassignedto one of two classes. Generally, these two classes are labeled as 1 and 0 or as positive and negative. The confusionmatrixhelpsvisualizewhetherthemodelis "confused"indistinguishingbetweenthetwoclasses.As showninFig-7,itisa2×2matrix.

International Research Journal of Engineering and Technology (IRJET) e-ISSN: 2395-0056
Volume: 12 Issue: 02 | Feb 2025 www.irjet.net p-ISSN: 2395-0072

WherethefourmetricsintheConfusionMatrixare:
A. Topleft(TruePositive-TP):Howmanytimesdidthe modelcorrectlyclassifyapositivesampleaspositive?
B. Topright(FalseNegative-FN):Howmanytimesdidthe modelincorrectlyclassifyapositivesampleasnegative?
C. Bottomleft(FalsePositive-FP):Howmanytimesdid the model incorrectly classify a negative sample as positive?
D. Bottomright(TrueNegative-TN):Howmanytimesdid the model correctly classify a negative sample as negative?
Based on these four metrics, other measures can be calculated to provide more insights into the model's behavior. Equations (4)-(7) refer to the definition of each metric.


2) Area Under Curve (AUC): It is one of the most important metrics used to evaluate the accuracy of a model in classifying data. It represents a measure of separability, indicating how well the model can distinguish between different classes. The higher the AUCvalue,thebetterthemodelisatpredictingclasses, meaningitismoreeffectiveatdistinguishingbetween individualswhohavethedisease(targetvariablevalue =1)andthosewhodonot(targetvariablevalue=0).
TheAUCvalueiscalculatedbasedonacurvecalledthe ReceiverOperatingCharacteristics(ROC)curve,which representstherelationshipbetweentwovariables:the False Positive Rate (FPR) and the True Positive Rate (TPR).referredtointheequations(8)and(9).


3.8 Result-
1) Before balancing the data:
The table -3 presents a comparison of classification accuracyresultsforpredictivemodelsusingevaluation metrics.
Table -3: comparisonofclassificationaccuracyresultsfor predictivemodels
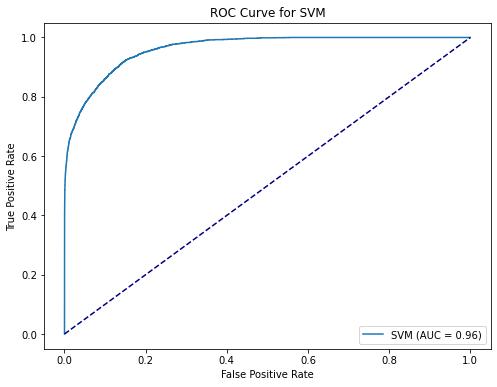
Chart -3:ROCCurvefortheSVMModel
TheROCcurvefortheSVMmodelisveryclosetotheupper left corner, indicating good performance in data classification.Theareaunderthecurve(AUC)is0.96,which isahighvalue,demonstratingthemodel'sstrongabilityto distinguishbetweencategoriesbeforebalancingthedata.

International Research Journal of Engineering and Technology (IRJET) e-ISSN: 2395-0056
Volume: 12 Issue: 02 | Feb 2025 www.irjet.net p-ISSN: 2395-0072
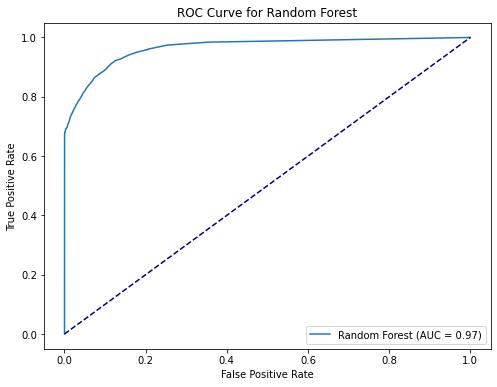
The ROC curve for the Random Forest model showed excellent performance, as it is very close to the upper left corner. The area under the curve (AUC) is 0.97, which is slightlyhigherthantheSVMmodel,indicatingthatRandom Forestmayhaveabetterclassificationperformancebefore balancingthedata.
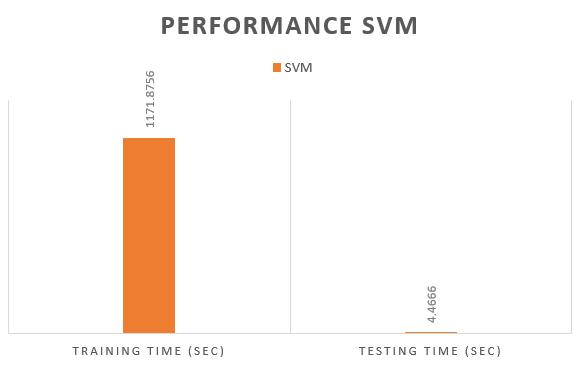
-5:Trainingandtestingtimeforthe

-6:TrainingandtestingtimefortheRFmodel
We observe that the training time for SVM is significantly longer,takingapproximately1171secondscomparedtojust
3.8secondsforRandomForest.Thislargedifferenceisdue tothenatureoftheSVMalgorithm,whichreliesonfinding the optimal separating hyperplanes between classes in a high-dimensional space. This requires intensive mathematical computations to solve an optimization problem,whichbecomesevenmorecomplexinthecaseof imbalanceddata.Whenoneclasshasveryfewsamples,SVM needs extra effort to adjust the decision boundaries accordingly.Ontheotherhand,RandomForestbuildsalarge number of decision trees in parallel, where each tree is trained on a random subset of the data. This parallel structuremakesitmoreefficientandlesstime-consuming.
Regarding the testing time, SVM remains slower, taking around4.47seconds,whereasRandomForestcompletesthe task in just 0.29 seconds. The reason for this is that SVM needs to compute the distance of each new data point relative to the decision boundaries found during training, makingitslow.Incontrast,RandomForestsimplypassesthe test point through the decision trees and aggregates the votesforthefinalprediction,whichisaveryfastprocess.
2) After balancing the data:
Table -4: comparisonofclassificationaccuracyresultsfor predictivemodelsafterbalancingthedatausingSMOTE
After applying SMOTE, the accuracy of SVM dropped significantlyfrom95.86%to88.77%,whiletheperformance ofRFremainedrelativelystableat95.42%.
Additionally, the training time for SVM increased to 2897 secondscomparedtojust9secondsforRF,indicatingthat RF is more efficient in terms of time and overall performance.
Based on these comparisons, it can be concluded that RandomForestisthemostsuitablemodelforhandlingdata balancing using SMOTE, as it demonstrated higher performanceandgreaterstabilitycomparedtoSVM.

International Research Journal of Engineering and Technology (IRJET) e-ISSN: 2395-0056
Volume: 12 Issue: 02 | Feb 2025 www.irjet.net p-ISSN: 2395-0072


-8:ROCCurvefortheRFModel
We observe that the performance of Random Forest (RF) and Support Vector Machine (SVM) remains high after applyingtheSMOTEtechniquefordatabalancing.TheAUC (AreaUndertheCurve)valueforRandomForestremained at 0.97, indicating that the model still has excellent discriminativeability,whiletheAUCvalueforSVMbecame 0.95,whichisclosetothepreviousresult.
We conclude that balancing the data using SMOTE helped improvetheclassificationaccuracyoftheunderrepresented classwithoutsignificantlynegativelyimpactingtheoverall performanceofthemodels.
Additionally, data balancing reduced the bias towards the majority class, enhancing the model’s accuracy across differentclasses.
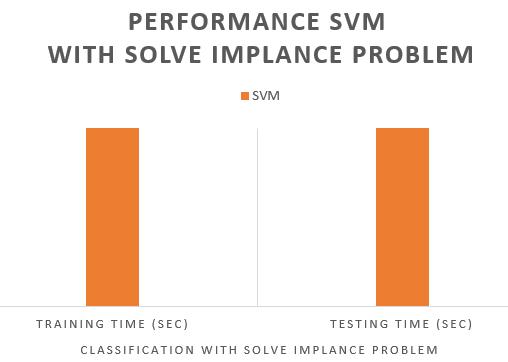
-9:Trainingandtestingtimeforthe

-10:TrainingandtestingtimefortheRFmodel
PerformanceAnalysisBetweentheTwoModelsinTermsof TimeEfficiency:
SVM: requires a longer time for training and testing, indicatingthatitismorecomputationallyexpensive.
RF: has a significantly lower testing time, making it a fasteroptionforpredictioninreal-worldapplications.
Thisstudyconcludedthatusingdifferentmachinelearning algorithmstopredictdiabetescanachievehighperformance when data is improved and balanced. The results showed that the SMOTE technique significantly contributed to enhancingmodelaccuracybyaddressingtheissueofdata imbalance,leadingtoimprovedperformanceforalgorithms such as Random Forest (RF) and Support Vector Machine (SVM).Additionally,itwasfoundthatRFoutperformedSVM inpredictionaccuracyafterdatabalancing,highlightingthe strengthofthisalgorithminhandlingimbalanceddatasets.
Whencomparingmodelperformancebeforeandafterdata balancing,itwasobservedthatConfusionMatricesandROC-

International Research Journal of Engineering and Technology (IRJET) e-ISSN: 2395-0056
Volume: 12 Issue: 02 | Feb 2025 www.irjet.net p-ISSN: 2395-0072
AUCcurvesimprovedsignificantly,indicatingthatthemodel becamemorecapableofdistinguishingbetweendiabeticand non-diabeticpatients.
Thisstudycanbeexpandedbyintegratingpredictivemodels with the Internet of Things (IoT) to develop smart health monitoringsystemscapableofcontinuouslymeasuringand analyzing diabetes indicators. Additionally, incorporating medical image analysis instead of relying solely on structureddatacancontributetothepredictionofcertain diseases, such as cancer and chronic lung diseases, which requireadvancedvisualanalysis.
Conflict of interest
Noconflictofinteresttodeclare.
[1] International Diabetes Federation. Diabetes facts & figures,2021.Available: https://www.idf.org/aboutdiabetes/what-isdiabetes/facts-fiures.html
[2] Mir A, Dhage SN. Diabetes disease prediction using machine learning on big data of healthcare. In2018 fourth international conference on computing communication control and automation (ICCUBEA) 2018Aug16(pp.1-6).IEEE.
[3] N.Sulayman,"PredictingType2DiabetesMellitususing MachineLearningAlgorithms,"InternationalJournalof DataScienceandAnalytics,vol.5,no.3,pp.45-62,2020. [Online]. Available: https://www.researchgate.net/publication/366634353.
[4] I.T.EliasandM.M.T.Jawhar,"ClassificationofDiabetes Using Machine Learning Technics," International Research Journal of Innovations in Engineering and Technology(IRJIET),vol.8,no.1,pp.113-118,Jan.2024. [Online].Available: https://doi.org/10.47001/IRJIET/2024.801015.
[5] J. J. Khanam and S. Y. Foo, "A Comparison of Machine LearningAlgorithmsforDiabetesPrediction,"Heliyon, vol. 7, no. 2, pp. e06394, 2021. [Online]. Available: https://www.sciencedirect.com/science/article/pii/S24 05959521000205
[6] S. B. Kotsiantis, D. Kanellopoulos, and P. E. Pintelas, "Data Preprocessing for Supervised Leaning," International Journal of Computer and Information EngineeringVol1,No12,2007.
[7] E. Algeldawi, A. Sayed, A. R. Galal and A. M. Zaki, "Hyperparameter Tuning for Machine Learning
AlgorithmsUsedforArabicSentimentAnalysis,"2021, [Online].Available:
https://doi.org/10.3390/informatics8040079.
[8] PhilipM.Sedgwick,"Pearson'scorrelationcoefficient”, July,2012,[Online].Available:
https://www.researchgate.net/publication/275470782
[9] N. V. Chawla, K. W. Bowyer, L. O. Hall, and W. P. Kegelmeyer, "SMOTE:SyntheticMinorityOver-sampling Technique," Journal ofArtificial IntelligenceResearch, vol. 16, pp. 321–357, 2002. [Online]. Available: https://doi.org/10.1613/jair.953.
[10] E. Algeldawi, A. Sayed, A. R. Galal and A. M. Zaki, "Hyperparameter Tuning for Machine Learning AlgorithmsUsedforArabicSentimentAnalysis,"2021, [Online].Available: https://doi.org/10.3390/informatics8040079.
[11] A.Abdi,"ThreetypesofMachineLearningAlgorithms," ResearchGate,2016,[Online].Available:
https://www.researchgate.net/publication/310674228
[12] H. Silva and J. Bernardino, " Machine Learning Algorithms: An Experimental Evaluation for Decision Support Systems,", 2022, [Online]. Available: https://doi.org/10.3390/a15040130
[13] S. Uddin, A. Khan, Md. E. Hossain and M. A. Moni, "Comparing different supervised machine learning algorithms for disease prediction," BMC Medical Informatics and Decision Making, 2019, [Online]. Available:https://doi.org/10.1186/s12911-019-10048
[14] H. Silva and J. Bernardino, " Machine Learning Algorithms: An Experimental Evaluation for Decision Support Systems,", 2022, [Online]. Available: https://doi.org/10.3390/a15040130
[15] L. Chaurasia, A. Borse, "Optimization Algorithms for MachineLearningModels,"GlobalLogic,India.
[16] P.B.Chand,M.L.Kavya,G.S.Sushmitha,M.K.Sri,andM. Indira, "Diagnosis of Diabetes Mellitus Using Machine LearningTechniques," InternationalResearch Journalof Engineering and Technology (IRJET),vol.10, no. 1, pp. 729-734, Jan. 2023. [Online]. Available: https://www.irjet.net/archives/V10/i1/IRJETV10I1121.pdf