
International Research Journal of Engineering and Technology (IRJET) e-ISSN:2395-0056
Volume: 12 Issue: 02 | Feb 2025 www.irjet.net p-ISSN:2395-0072


International Research Journal of Engineering and Technology (IRJET) e-ISSN:2395-0056
Volume: 12 Issue: 02 | Feb 2025 www.irjet.net p-ISSN:2395-0072
aKunal, aManju,aRupin, bDr. Abdul Rehman
aB.Tech. Civil Engineering Student, Lingaya's Vidyapeeth, Faridabad, Haryana, India
bAssistant Professor, Department of Civil Engineering, Lingaya's Vidyapeeth, Faridabad, Haryana, India
Abstract - Untreated sewage, industrial effluents, and agricultural runoff all contribute to the serious pollution of the YamunaRiver,acrucialwatersourceinnorthernIndia.TheWazirabadBarrageisacruciallocationwherepollutionhasa major impact on river health, and this study assesses the water quality parameters there. To evaluate factors like pH, dissolvedoxygen(DO),chemicaloxygendemand(COD),biochemicaloxygendemand(BOD),totaldissolvedsolids(TDS), electrical conductivity (EC), turbidity, and heavy metal concentrations, a number of physicochemical and biological tests werecarriedout.Levelsofcontaminationweremeasuredusingstandardanalyticalmethods,suchas spectrophotometry and APHA. The water is deemed extremely polluted and unfit for drinking, aquatic life, or irrigation due to the results, whichshowhighBOD and COD,lowDO, and excessive TDS. The Water QualityIndex (WQI)assessment confirmsa poor water quality status, highlighting the urgent need for intervention. The findings suggest that advanced wastewater treatmenttechnologies,strictindustrialdischargeregulations,andsustainablewaterresourcemanagementare essential toimprovingriverconditions.Thisstudyprovidesvaluableinsightsforenvironmentalagenciesandpolicymakers,aiding intheformulationofstrategiestorehabilitatetheYamunaRiverandrestoreitsecologicalbalance.
Keywords WaterQualityIndex(WQI),PollutionAssessment
Clean water is essential for life, nature, and farming. It keeps people and animals healthy, prevents diseases, and supports dailyneedslikedrinkingandhygiene.Infarming, clean water helps grow crops, improves soil, and avoids harmfulchemicalsthatcanreduceproductivity.Dirtywater harms human health, wildlife, and the environment. So, protecting water sources is necessary for food security, nature,andoverallwell-being.
The Yamuna River is heavily polluted due to industrial waste, untreated sewage, and farm chemicals. Rapid urban growth has increased pollution with harmful substances like heavy metals and chemicals, making the water unsafe. Poor waste management and illegal dumping make things worse. As a result, the Water Quality Index (WQI) of the river is very low, especially in cities like Delhi. This pollution harms the environment and public health, requiringurgentaction.
Pollution in the Yamuna causes many problems. Contaminated water spreads diseases like cholera and typhoid, affecting millions who depend on the river. Toxic chemicals kill fish and other aquatic life, reducing biodiversity.Usingpollutedwaterforfarmingdamagessoil, lowers crop production, and adds harmful substances to food. The river’s toxic foam and bad smell also worsen air quality,affectingpeople’shealth.Withoutimmediateaction, thedamagemaybecomeirreversible.
ToimprovetheYamuna’swaterquality,researchersand the government are working on solutions. Scientists are
testing advanced treatment methods like bioremediation, nanotechnology, and artificial wetlands to clean the water. Government projects such as the Namami Gange ProgrammeandtheYamunaActionPlanaimtobuildmore sewage treatment plants, monitor industrial waste, and improve riverbanks in cities like Delhi, Agra, and Mathura. Publicawarenesscampaignsandstricterpollutionlawsare also being introduced. However, real change needs community involvement, better waste management, and strictlawenforcementtopreventfuturepollution.
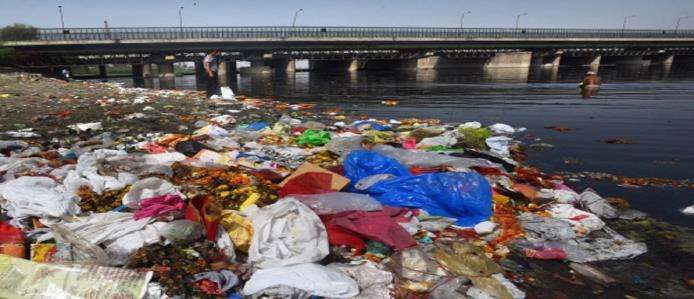
Yamuna enters Delhi state at Palla village, which is 15 kilometers upstream of the Wazirabad barrage. Yamuna travels48kilometersinDelhioutofwhich22kmstretchis severely polluted. Severe level of surface pollutants is shown in Figure1. Water quality assessment involves various physicochemical and biological tests to determine contaminationlevels-
pH Test – Measures the acidity or alkalinity of water.
Electrical Conductivity (EC) – Assesses the presenceofdissolvedsalts.
Total Dissolved Solids (TDS) – Indicates the concentrationofdissolvedsubstances.
TurbidityTest–Measurestheclarityofwater.
TemperatureTest–Affectsbiologicalandchemical processesinwater.

International Research Journal of Engineering and Technology (IRJET) e-ISSN:2395-0056
Volume: 12 Issue: 02 | Feb 2025 www.irjet.net p-ISSN:2395-0072
DissolvedOxygen(DO)–Determinestheamountof oxygenavailableforaquaticlife.
Themainobjectivesofthisresearchpaperarelistedas:
a) To assess the water quality parameters of the YamunaRiverattheWazirabadBarrage.
b) To analyse physicochemical and biological characteristics such as pH, DO, BOD, COD, TDS, EC, turbidity,andheavymetalconcentrations.
c) To evaluate the Water Quality Index (WQI) and determinethepollutionstatusoftheriver.
d) To identify major sources of contamination, including industrial discharge, sewage inflow, and agriculturalrunoff.
e) Tocompareobservedwaterqualityparameterswith nationalandinternationalstandardsforsuitabilityin drinking,irrigation,andaquaticlife.
This study employs a comprehensive methodology to assess the water quality of the Yamuna River at the Wazirabad Barrage, focusing on the 22-kilometer stretch that is severely polluted. The assessment includes a series ofphysicochemicalandbiologicaltestsdesignedtoevaluate contaminationlevelsanddeterminetheextentofpollution.
a. Study Area and Sampling
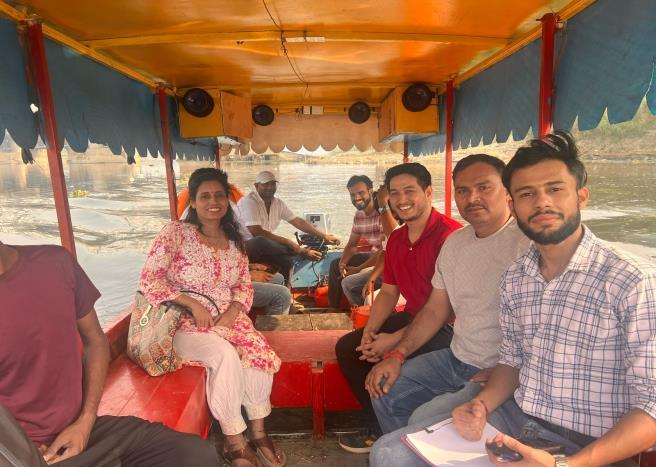
The Yamuna River enters Delhi at Palla village, approximately 15 kilometers upstream of the Wazirabad Barrage. Water samples were collected from multiple pointsalongthisstretchtoensureathoroughevaluationof pollution levels. The selection of sampling locations was based on proximity to major pollution sources, including industrial discharge points, sewage outfalls, and urban runoffareas.
b. Physicochemical Analysis
To assess the fundamental properties of water, the followingphysicochemicalparameterswereanalyzed:
pHTest:Determinestheacidityoralkalinityofthe water, which influences chemical reactions and biologicalactivity.
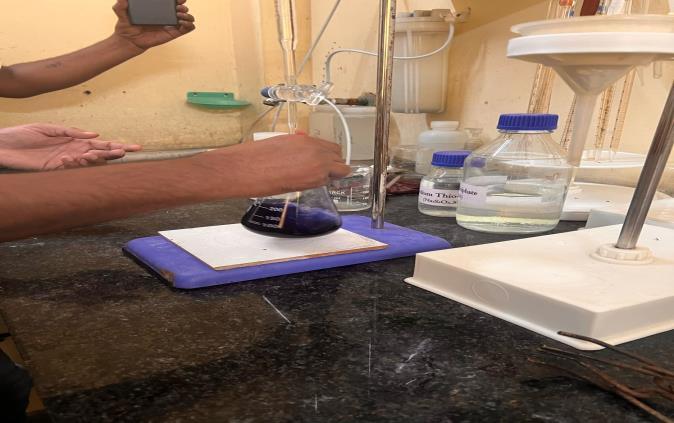
ElectricalConductivity(EC):Measurestheabilityof water to conduct electricity, indicating the presenceofdissolvedsaltsandions.
Total Dissolved Solids (TDS): Evaluates the concentration of dissolved substances, which affects water quality and suitability for consumptionandirrigation.
Turbidity Test: Assesses water clarity by measuring the presence of suspended particles, whichcanimpactaquaticlife.
TemperatureMeasurement: Monitorstemperature fluctuations, which influence chemical reactions andbiologicalprocessesinwaterbodies.

International Research Journal of Engineering and Technology (IRJET)
Volume: 12 Issue: 02 | Feb 2025 www.irjet.net p-ISSN:2395-0072
Todeterminetheleveloforganicandchemicalpollution, oxygendemandtestswereconducted:
Dissolved Oxygen (DO): Quantifies the amount of oxygen available in water, which is crucial for sustaining aquatic life. Low DO levels indicate severepollutionandpoorwaterquality.
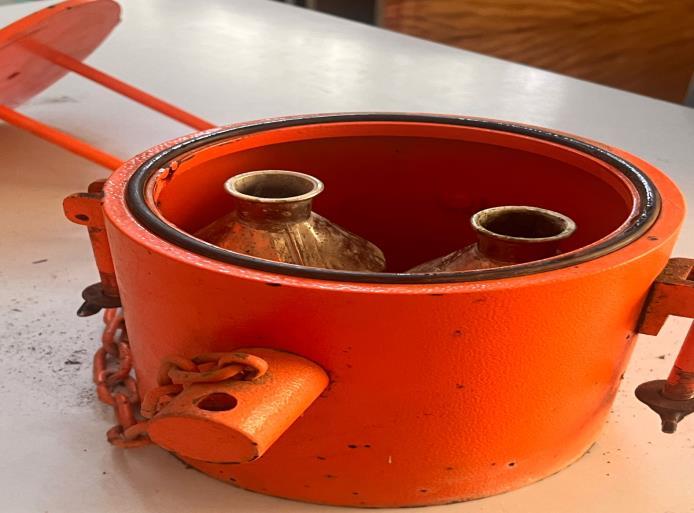
Biochemical Oxygen Demand (BOD): Measures the amountofoxygenconsumedbymicroorganisms indecomposingorganicmatter.HighBODlevels signify excessive organic pollution from untreated sewage and industrial waste. The Biochemical Oxygen Demand (BOD) test is conducted to determine the amount of oxygen consumed by microorganisms while decomposing organic matter in a water sample over a specific period. The procedure begins with sample collection in a BOD bottle (300 mL capacity), ensuring no air bubbles to prevent oxygen contamination. If immediate testing is not possible, the sample is stored at 4°C in the dark. The initial dissolved oxygen (DO) level is then measured using a DO meter or Winkler’s method,andthevalueisrecorded as DO_initial
Chemical Oxygen Demand (COD): Determines the presence of chemically oxidizable pollutants, whichincludeindustrialandchemicalwastethat canseverelyimpactaquaticecosystems.
This methodological approach ensures a comprehensive evaluation of water quality parameters, providing crucial insights into the degradation of the Yamuna River at the WazirabadBarrage.Thefindingshelpidentifykeypollution sourcesandofferascientificbasisfordevelopingstrategies toimproveriverhealth.

International Research Journal of Engineering and Technology (IRJET) e-ISSN:2395-0056
Volume: 12 Issue: 02 | Feb 2025 www.irjet.net p-ISSN:2395-0072
IV.CONCLUSION
In conclusion, the assessment of water quality at the Wazirabad Barrage confirms that the Yamuna River is in a severely degraded state due to excessive pollution from untreated sewage, industrial effluents, and agricultural runoff. The high levels of BOD, COD, and TDS, along with critically low DO, indicate that the river water is unfit for drinking, aquatic life, and irrigation. The Water Quality Index (WQI) further reinforces the urgent need for intervention. Addressing this crisis requires immediate action, including the implementation of advanced wastewater treatment technologies, stringent regulatory measures for industrial discharge, and effective water resource management strategies. Without proactive measures, the deteriorating water quality will continue to pose serious environmental and public health risks. This study underscores the necessity for coordinated efforts by policymakers, environmental agencies, and local communities to restore the river’s ecological balance and ensureitssustainabilityforfuturegenerations.
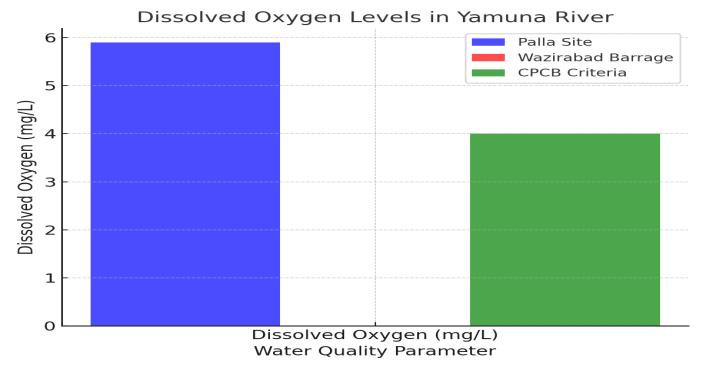
a) SevereOxygenDepletionatWazirabad
o Dissolved Oxygen (DO) at Wazirabad is 0 mg/L, significantly lower than the CPCB standardof4mg/L.
o This indicates extreme pollution, making the water unfit for aquatic life and drinkingpurposes.
b) Increased Electrical Conductivity (EC) Signifying Pollution
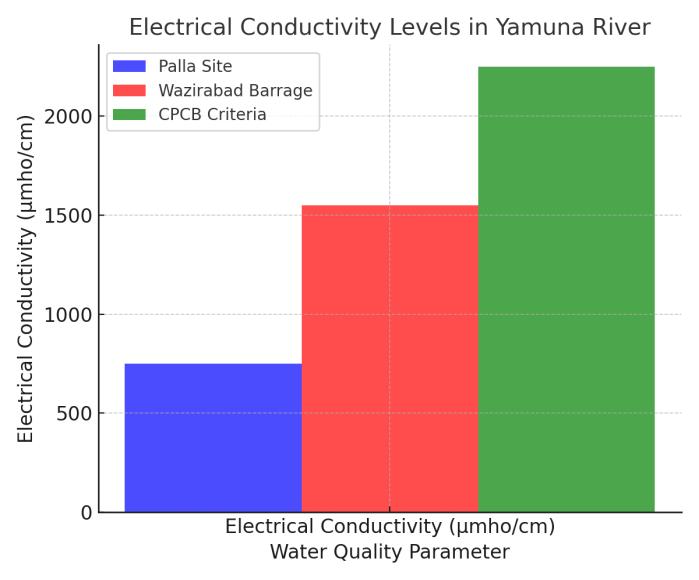
o The electrical conductivity at Wazirabad (1550 µmho/cm) is more than double the valueatPalla(750µmho/cm),indicatinga higher concentration of dissolved solids andpollutants.
o Although it remains within the CPCB limit (2250 µmho/cm), the increase suggests contaminationfromindustrial andsewage discharge.
c) pHImbalanceAffectingWaterQuality
o The pH at Wazirabad (8.4) is at the upper limit of the CPCB’s acceptable range (6.5–8.5).
o A higher pH can lead to water toxicity, affecting aquatic organisms and human usage.
d) Deterioration in Water Aesthetics and Sensory Quality
o Water at Palla is clear and odorless, whereas at Wazirabad, it becomes light brown with a foul smell, indicating heavy organicandchemicalcontamination.
o This degrades the visual and olfactory quality, making it unsuitable for domestic andrecreationaluse.
e) RisingTemperatureContributingtoPollution
o Water temperature increases from 17.4°C at Palla to 19.8°C at Wazirabad, nearing theCPCBlimitofbelow20°C.
o A higher temperature can accelerate biological and chemical reactions, worseningoxygendepletionandmicrobial activity.
f) UrgentNeedforPollutionControlMeasures
o The rapid degradation of water quality at Wazirabad highlights the severe impact of untreatedsewage,industrialeffluents,and agriculturalrunoff.

International Research Journal of Engineering and Technology (IRJET) e-ISSN:2395-0056
o Immediate intervention is required, includingadvancedwastewatertreatment, stricter industrial regulations, and sustainablerivermanagementpractices.
This analysis underscores critical pollution levels at Wazirabad and the urgent need for corrective measures to restoretheYamunaRiver'secologicalbalance.
1. Bhardwaj, V. M., Singh, D. S., & Singh, A. K. (2017). WaterqualityoftheChhotiGandakRiver,GangaPlain, India: Multivariate statistical approach. Journal of the GeologicalSocietyofIndia,89(4),453-462.
2. Chaudhary, S., & Banerjee, D. K. (2007). Metal phase association of Delhi urban pond sediments. Environmental Monitoring and Assessment, 130(1-3), 301-314.
3. Dutta,V.,Dubey,D.,&Kumar,S.(2018).Assessmentof physico-chemical characteristics of Yamuna River in Agra City. Journal of Industrial Pollution Control, 34(1),1-7.
4. Chen, W., & Wu, Y. (2019). Assessment of the environmental and economic benefits of rainwater harvesting. Water Resources Management, 33(6), 2095-2105. https://doi.org/10.1007/s11269-01902259-w
5. Garg, V. K., Suthar, S., Singh, S., & Sheoran, A. (2009). Drinking water quality in villages of southwestern Haryana, India: assessing human health risks associated with hydrochemistry. Environmental Geology,58(6),1329-1340.
6. Gautam, S. K., Sharma, D., Tripathi, J. K., & Singh, S. K. (2013). A study of the effectiveness of sewage treatment plants in Delhi region. Applied Water Science,3(1),57-65.
7. Gupta, N., Pandey, P., & Hussain, J. (2017). Effect of physicochemical and biological parameters on the quality of river water of Narmada, Madhya Pradesh, India.WaterScience,31(1),11-23.
8. Jain,C.K.,&Sharma,M.K.(2001).Distributionoftrace metals in the Hindon River system, India. Journal of Hydrology,253(1-4),81-90.
9. Kaur, H., & Mehra, P. (2012). Assessment of heavy metals in summer & winter seasons in River Yamuna segment flowing through Delhi, India. Journal of EnvironmentandEcology,3(1),149-165.
11. Kumar, M., & Puri, A. (2012). A review of permissible limits of drinking water. Indian Journal of Occupational Error! Hyperlink reference not valid.and EnvironmentalMedicine,16(1),40-44.
12. Kumar, V., & Chopra, A. K. (2012). Monitoring of physicochemicalandmicrobiologicalcharacteristicsof municipal wastewater at treatment plant, Haridwar city (Uttarakhand) India. Journal of Environmental ScienceandTechnology,5(2),109-118.
13. Chen, H., & Franklin, M. (2023). Spatio-temporal modeling of surface water quality distribution in California(1956–2023).
14. Biswas, A. K., & Tortajada, C. (2019). Water quality management:Agloballyneglectedissue.International JournalofWaterResourcesDevelopment,36(5),759–776. https://doi.org/10.1080/07900627.2019.1670506
15. Xu, Q., Chen, J., Peart, M. R., Ng, C. N., Hau, B. C. H., & Law, W. W. Y. (2018). Exploration of severities of rainfall and runoff extremes in ungauged catchments: A case study of Lai Chi Wo in Hong Kong, China. Science of the Total Environment, 634, 640–649. https://doi.org/10.1016/j.scitotenv.2018.04.024
16. Xie,Y.,Yu,X.,Ng,C.N.,&Fang,L.(2018).Exploringthe dynamic correlation of landscape composition and habitat fragmentation with surface water quality in the Shenzhen River and Deep Bay cross-border watershed, China. Ecological Indicators, 90, 231–246. https://doi.org/10.1016/j.ecolind.2017.11.051
https://doi.org/10.1016/j.apgeog.2017.12.009
17. Qi,X.,Fu,Y.,Wang,R.Y.,Ng,C.N.,Dang,H.,&He, Error! Hyperlink reference not valid.Y. (2018). Improving the sustainability of agricultural land use: An integrated framework for the conflict between food security and environmental deterioration. Applied Geography, 90, 214–223.
18. Wang,R.Y.,Ng,C.N.,LenzerJr,J.H.,Dang,H.P.,Liu,T., & Yao, S. J. (2016). Unpacking water conflicts: A reinterpretation of coordination problems in China's water governance system. International Journal of Water Resources Development, 33(4), 553–569. https://doi.org/10.1080/07900627.2016.1197824
Volume: 12 Issue: 02 | Feb 2025 www.irjet.net p-ISSN:2395-0072 © 2025, IRJET | Impact Factor value: 8.315 | ISO 9001:2008 Certified Journal | Page443
10. Kumar, A., & Dua, A. (2009). Water quality index for assessmentofwaterqualityofriverRaviatMadhopur (India).GlobalJournalofEnvironmentalSciences,8(1), 49-57.
Wang, R. Y., Si, Z., Ng, C. N., & Scott, S. (2015). The transformation of trust in China's alternative food networks: Disruption, reconstruction, and development. Ecology and Society, 20(2), 19. https://doi.org/10.5751/ES-07536-200219