
International Research Journal of Engineering and Technology (IRJET) e-ISSN: 2395-0056
Volume: 12 Issue: 01 | Jan 2025 www.irjet.net p-ISSN: 2395-0072


International Research Journal of Engineering and Technology (IRJET) e-ISSN: 2395-0056
Volume: 12 Issue: 01 | Jan 2025 www.irjet.net p-ISSN: 2395-0072
Hemangi Patil1 , Harshal Patil2 Gaurav Acharya3, Roshan Verma4
1Independent Researcher, Mumbai, India
2Independent Researcher, Mumbai, India
3Department of master’s in computer science, IIT Chicago, Illinois
4Department of master’s in information technology management, IIT Chicago, Illinois
Abstract - Diabetes is a growing global health issue, and early detection can prevent its severe effects. This paper presents a machine learning-based approach to predict whether a person has diabetes or not using clinical data such as Glucose levels, Insulin, BMI, and Age. The Pima Indians Diabetes dataset is used for training and testing the model. A Support Vector Classifier (SVC) with a linear kernel is employed, achieving an accuracy of approximately 73.38%. The results demonstrate the potential of machine learning in facilitating early diagnosis and intervention for diabetes.
Key Words: Diabetes Prediction, Machine Learning, SVC, Pima Indians Dataset, Model Evaluation, Early Diagnosis
Diabetes mellitus is a chronic condition that impairs the body's ability to regulate blood sugar levels. With the increasing prevalence of this disease, early diagnosis is crucial to prevent complications such as heart disease, kidney failure, and nerve damage. According to the World Health Organization, the global prevalence of diabetes has nearly quadrupled since 1980, underscoring the importance of timely diagnosis and intervention. Traditional diagnostic methods require medical tests such as blood glucose measurement, which can be both costly andtime-consuming.
Machinelearningoffersaninnovativealternative,enabling the development of predictive models that can classify individuals as diabetic or non-diabetic based on clinical data. The Pima Indians Diabetes dataset, which includes records of female individuals, provides a rich source of clinical features such as age, BMI, glucose levels, and insulin concentrations. These features are known to be highly correlated with diabetes risk. This study investigates the application of Support Vector Classifier (SVC)inpredictingdiabetesandcomparestheresultswith othercommonlyusedmachinelearningmodels.
The major goal of this study is to develop an effective machine learning model for predicting diabetes using the PimaIndiansDiabetesdataset.Thestudy'sparticularaims are:
To create a machine learning model with the SupportVectorClassifier(SVC)technique.
To evaluate the model's performance using measures such as accuracy, precision, recall, and F1-score.
To determine the significance of feature selection, data preprocessing, and feature scaling in enhancingmodelperformance.
To compare SVC's prediction accuracy and generalizationtothatofotherclassificationmodels (for example, logistic regression and decision trees).
To investigate the prediction model's potential for real-world applications in healthcare, specifically earlydiabetesidentification.
Different papers and articles have been reviewed for this project. Also, their conclusions are summarized in this section. The section present documents that were studied prior and post project development. The mentionedarticlesprovidewithabetterunderstanding about structure of the system and how various algorithmscouldbecombinedtogethersoastobuilda systemwithhigherefficiency.
Table -1: PublicationsCited:
Title Year Author Summary
DiabetesCare andItsRisk Factors
Machine Learningfor Diabetes Prediction
2010,Journal ofDiabetes Research Smithet al Examineskey factors influencing diabetes prevalenceand progression.
2015, International JournalofAI Research
Johnson etal. Exploresvarious MLalgorithms fordiabetes predictionusing medicaldata.

International Research Journal of Engineering and Technology (IRJET) e-ISSN: 2395-0056
PimaIndians Dataset Analysis 2017, Data Scienceand Applications Journal
SupportVector Machinesin Healthcare 2018, Healthcare Informatics Review
Data Preprocessing Techniquesin ML 2019, Machine Learning andData Analytics
AIforChronic Disease Detection 2021, International Journalof MedicalAI
Kumar etal. UtilizesthePima Indiansdataset toidentify significant predictors.
Leeand Gupta Demonstrates theapplication ofSVMsin healthcare diagnostics.
Brown etal. Reviews preprocessing methodssuchas handlingmissing dataandscaling.
Patelet al. Discussesthe roleofAIin identifying chronicdiseases likediabetes.
3.1
Machine Learning is a field of Artificial Intelligence (AI) thatenablessystemstolearnfromdata andimprovetheir performance without explicit programming. It is classified intothreemaintypes:
Supervised Learning: Uses labeled data for prediction taskslikeclassificationorregression.
Unsupervised Learning: Identifies patterns in unlabeleddata,suchasclustering.
Reinforcement Learning: Optimizes decision-making byinteractingwithanenvironment.
3.2
SVC is a supervised learning algorithm that finds a hyperplanetoseparateclassesinthefeaturespace.Ituses kernel functions to handle both linear and non-linear classification. The key parameters in SVC are C (penalizes misclassification) and gamma (controls the influence of individual data points). SVC is effective for classification taskswhereclearclassboundariesexist.Inthisproject,we used a linear kernel to classify whether a person has diabetes
based on features like glucose level, insulin, BMI, and age.
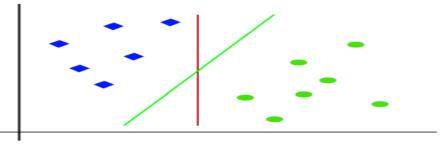
Fig.31SupportvectorClassifier
4.
Thesolutionfollowsastructuredapproachtopredict diabetesusingmachinelearning:
DataPreprocessing:Cleanthedatasetbyreplacing zeros with NaN and imputing missing values with the mean of respective columns. Apply MinMaxScaler to normalize the data for better modelperformance.
Feature Selection: Choose key features such as Glucose, Insulin, BMI, and Age, which exhibit the highest correlation with the outcome variable, to enhancemodelaccuracy.
Model Development: Train a Support Vector Classifier(SVC)withalinearkernelonthetraining set and validate it on the test set to build the predictivemodel.
ModelEvaluation:Assessthemodel's performance using metrics like accuracy, confusion matrix, precision,recall,andF1-score.
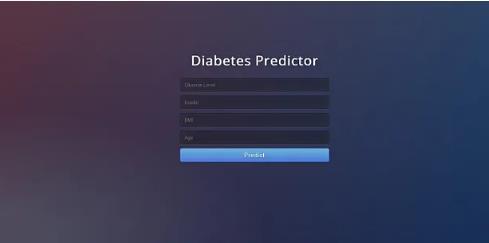
Deployment: Develop a Flask-based web application that allows users to input their data andreceivereal-timediabetespredictions.
5. 1.1 HARDWARE REQUIREMENT
Processor:Inteli5orequivalent(minimum)
RAM:4GBorhigher
Storage:10GBfreespaceormoreforthedataset andmodelfiles
Python3.7orabove
Libraries: Pandas, Numpy, Matplotlib, Seaborn, Scikit-learn,Flask
Volume: 12 Issue: 01 | Jan 2025 www.irjet.net p-ISSN: 2395-0072 © 2025, IRJET | Impact Factor value: 8.315 |

International Research Journal of Engineering and Technology (IRJET) e-ISSN: 2395-0056
Volume: 12 Issue: 01 | Jan 2025 www.irjet.net p-ISSN: 2395-0072
IDE: Jupyter Notebook or any Python IDE (e.g., PyCharm,VSCode)
OperatingSystem:Windows,macOS,orLinux
6. SYSTEM FLOW DIAGRAM:
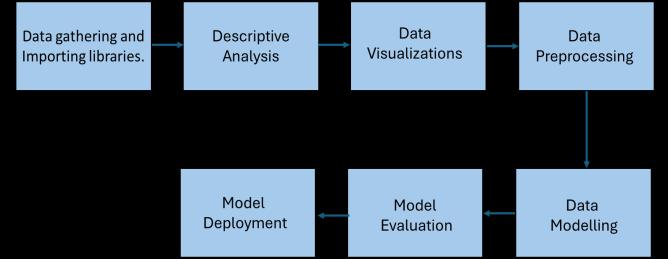
Fig.6-SystemFlowDiagram
Theworkflowforthediabetespredictionprojectisdivided into several key steps, starting from data collection to model deployment. Each step has its importance in ensuringarobustandefficientmachinelearningmodel:
6.1 DATA COLLECTION AND IMPORTING:
The Pima Indians Diabetes Dataset is collected from the UCIMachineLearningRepository.Thedatasetisimported usingthepandasread_csv()method.Thisdatasetcontains 768 records with 9 features, including Glucose, BMI, Age, Insulin,andothers.
6.2 ANALYSIS:
In this step, weconduct a basic exploration of the dataset, including:
Viewing the first few records to understand the structure.
Checkingthedataset'sshapetoconfirmthenumberof recordsandfeatures.
Generating descriptive statistics and checking for missingvalues.
6.3 DATA VISUALIZATION:
Visualizations help in understanding the distribution of dataandrelationshipsbetweenfeatures:
Countplot: Displays the distribution of the target variable(Outcome).
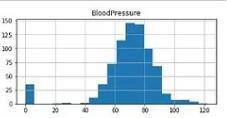
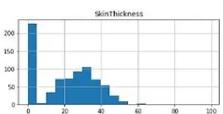
Histograms: Visualizes the distribution of individual features.
Pairplot: Displays pairwise relationships between featurescoloredbythetargetvariable.
Heatmap: Shows the correlation between features toidentifysignificantpredictorsfordiabetes.
6.4 DATA PREPROCESSING:
Preprocessing is an essential step for cleaning and preparingthedata:
Replacezerovalues(representingmissingdata)in certainfeatureswithNaN.
Impute missing values with the mean of each columntohandlenullvalues.
Perform Feature Scaling using MinMaxScaler to normalize the features, ensuring the values lie between0and1forbettermodelperformance.
Select relevant features (Glucose, Insulin, BMI, Age)basedoncorrelationanddomainknowledge.
6.5
The dataset is split into training and testing sets using an 80:20 ratio, ensuring that the model has sufficient data for training and evaluation. The split is stratified basedonthetargetvariabletoensurethatbothclasses (diabetes-positive and diabetes-negative) are represented proportionally in both the training and testingsets.
6.6
The Support Vector Classifier (SVC) algorithm is used for classification. The model is trained on the training dataset, with the linear kernel used to separate the classes.
Model Evaluation:
After training the model, predictions are made on the test dataset, and the model's performance is evaluatedusing:
Accuracy: Measures the proportion of correct predictions.
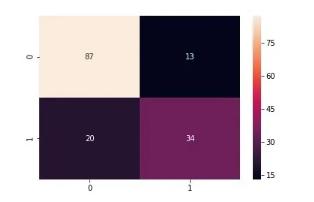
Confusion Matrix: Shows the true positives, false positives,truenegatives,andfalsenegatives.
Classification Report:
Provides detailed performance metrics like precision,recall,andF1-score.

International Research Journal of Engineering and Technology (IRJET) e-ISSN: 2395-0056
Volume: 12 Issue: 01 | Jan 2025 www.irjet.net p-ISSN: 2395-0072
The trained model can be deployed in a web application usingFlask,whereuserscaninputtheirdata(e.g.,Glucose, Insulin, BMI, Age), and the model will predict whether the userisdiabeticornot.
7.1
The dataset used in this research is the Pima Indians Diabetes dataset from the UCI Machine Learning Repository. It contains 768 records with 8 features (Glucose, Blood Pressure, Skin Thickness, Insulin, BMI, Diabetes Pedigree Function, Age) and a target variable "Outcome" indicating the presence (1) or absence (0) of diabetes.

Fig.7,1DataPreview
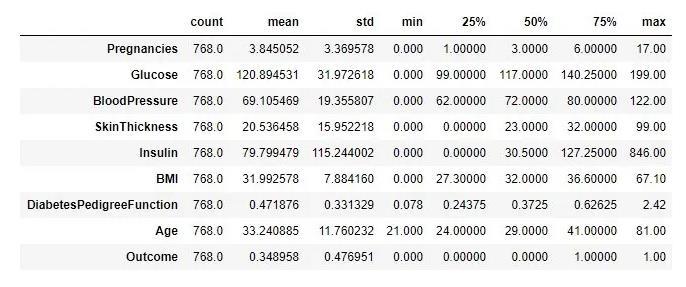
Fig7.2StatisticalSummary
7.2 DATA EXPLORATION:
Before entering into data preprocessing, it is critical to understandthedata'sstructureanddistribution.
DataOverview:The.head()functionwasusedtohavea brief look at the first few rows and comprehend the featurevalues.
Dataset dimensions: The form of the dataset was examinedtoensurethattherewere768samplesand9 characteristics.
Feature Data Types: The info() function was used to determine the data type of the features. This phase ensures that all features are of the correct type (integerorfloat)andhelpstofindanyirregularitiesin thedataset.
Missing Data Check: The isnull().sum() function was used to detect any missing values. This check ensures the dataset is complete and identifies which features might require attention during preprocessing.
After knowing the dataset's structure, the next step is to visually explore it. This aids in identifying trends, linkages,andpotentialproblemsinthedata.
OutcomeDistribution:Acountplotwasusedto display the distribution of the Outcome variable, which assisted in determining if the dataset was imbalanced (i.e., more diabetesnegativeordiabetes-positivesamples).
Feature Histograms: Histograms for each feature (e.g., glucose, insulin, BMI, age) were displayed to determine their distributions, skewness,andanyoutliersinthedata.
Pairplot: A pairplot was utilized to visually represent the relationships between each pair of features, assisting in the identification of patterns and correlations, notably with the Outcomevariable.
Correlation Heatmap: A correlation heatmap was created to visually see which features are strongly connected with one another and the Outcome.Thisiscriticalforfeatureselectionin thefollowingsteps.
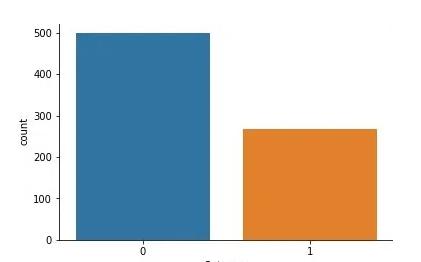
Fig.7.3OutcomeCountplot

International Research Journal of Engineering and Technology (IRJET) e-ISSN: 2395-0056
Volume: 12 Issue: 01 | Jan 2025 www.irjet.net p-ISSN: 2395-0072



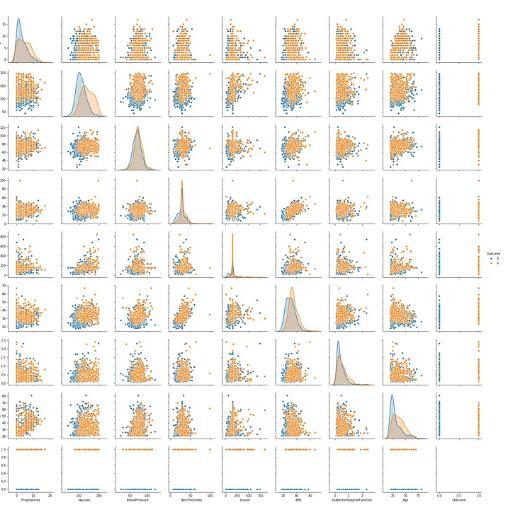
–Pairplotforallfeatures
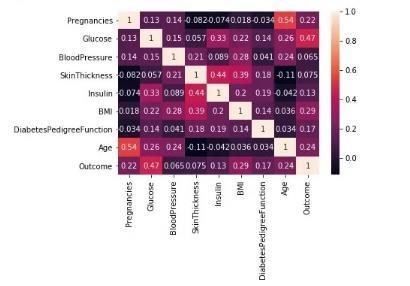
Fig.7.6HeatmapofFeatureCorrelation
7.4
Handling Missing Values: Zeros in features such as Glucose, Insulin, BMI, and Blood Pressure were identified as placeholders for missing data and replacedwithNaN.
Imputation: The missing values were imputed by replacingthemwiththemeanoftherespectivecolumn to ensure there was no loss of data during the preprocessingphase.
Feature Scaling: MinMaxScalerwasappliedtoscaleall featurestoarangeof0to1,ensuringthatthemachine learningmodeltreatsallfeaturesequallyandimproves convergenceduringtraining.
7.5
Key characteristics that had substantial associations with the outcome variable, including age, BMI, insulin, and glucose, were chosen for model training based on theinsightsgainedfromdatavisualization.
7.6
A Support Vector Classifier (SVC) with a linear kernel wasusedtocreatethemodel.Thedatasetwasdivided into subgroups for testing (20%) and training (80%). Thetestingdatawasusedtovalidatethemodelafterit hadbeentrainedonthetrainingdata.
Metrics including accuracy, precision, recall, confusion matrix,andF1-scorewereusedtoevaluatethemodel's capacitytoreliablypredictdiabetes.

International Research Journal of Engineering and Technology (IRJET) e-ISSN: 2395-0056
Volume: 12 Issue: 01 | Jan 2025 www.irjet.net p-ISSN: 2395-0072
7.8 MODEL DEPLOYMENT:
Finally, the trained model was deployed using Flask, creating a web application that allows users to input their dataandreceivereal-timepredictionsabouttheirdiabetes risk.
8. CONCLUSIONS:
This study effectively applies machine learning to predict diabetes using the Pima Indians Diabetes dataset. A Support Vector Classifier (SVC) with a linear kernel was used, yielding an accuracy of about 73%. The initiative emphasizes the importance of features such as glucose, insulin, BMI, and age in predicting diabetes, particularly their involvement in early identification. A systematic technique was used to preprocess the dataset to resolve missingvaluesandscaleittoimprovemodelperformance. The successful implementation of a web application using Flaskprovesthemodel'spracticalapplicabilitybyoffering a user-friendly platform for real-time diabetes risk assessment.
9. FUTURE SCOPE:
Model Improvement: Utilize advanced machine learning models (e.g., Random Forest, XGBoost, or neural networks) and optimize hyperparameters for betteraccuracy.
Data Expansion: Incorporate larger, more diverse datasetsandaddressclassimbalanceusingtechniques likeSMOTE.
Feature Exploration: Add relevant features like genetics, lifestyle, and family history to enhance predictions and apply dimensionality reduction methodsforefficiency.
Integration: Deploy the model in clinical settings and integrate with EHR systems for real-time decisionsupport.
Technological Advancement: Expand the application to mobile or cloud platforms and integrate wearable device data for continuous monitoring.
Extended Applications: Adapt the model for other chronic diseases like cardiovascular conditions or kidneydisease.
Collaborations: Work with healthcare professionals to validate and refine the model for practicaluse.
1. Dua,D.,&Graff,C.(2019).UCIMachineLearning Repository:PimaIndiansDiabetesDataset. Retrievedfrom https://archive.ics.uci.edu/ml/datasets/diabetes.
2. Pedregosa, F., Varoquaux, G., Gramfort, A., Michel, V.,Thirion,B.,Grisel,O.,...&Duchesnay,E.(2011). Scikit-learn: Machine Learning in Python. Journal ofMachineLearningResearch,12,2825-2830.
3. Brownlee, J. (2016). Master Machine Learning Algorithms: Discover How They Work and Implement Them From Scratch. MachineLearning Mastery.
4. Kuhn,M.,&Johnson, K.(2013).AppliedPredictive Modeling.Springer.
5. FlaskDocumentation.Flask:AWebFrameworkfor Python. Retrieved from https://flask.palletsprojects.com/.
6. Chris Albon. (n.d.). Machine Learning with Python Tutorials.Retrievedfromhttps://chrisalbon.com/.
7. Seaborn Documentation. (n.d.). Python Visualization Library. Retrieved from https://seaborn.pydata.org/.
8. Hastie,T.,Tibshirani,R.,&Friedman,J.(2009).The Elements of Statistical Learning: Data Mining, Inference, and Prediction. Springer Series in Statistics.

International Research Journal of Engineering and Technology (IRJET) e-ISSN: 2395-0056
9. Kelleher, J. D., Mac Namee, B., & D’Arcy, A. (2015). FundamentalsofMachineLearningforPredictiveData Analytics: Algorithms, Worked Examples, and Case Studies.MITPress.
Volume: 12 Issue: 01 | Jan 2025 www.irjet.net p-ISSN: 2395-0072 © 2025, IRJET | Impact Factor value: 8.315 | ISO 9001:2008 Certified
|