
3 minute read
International Journal for Research in Applied Science & Engineering Technology (IJRASET)

from Effective Utilization of Available PEV Battery Capacity for Mitigation of Solar PV Impact
by IJRASET

ISSN: 2321-9653; IC Value: 45.98; SJ Impact Factor: 7.538
Volume 11 Issue III Mar 2023- Available at www.ijraset.com
Advertisement
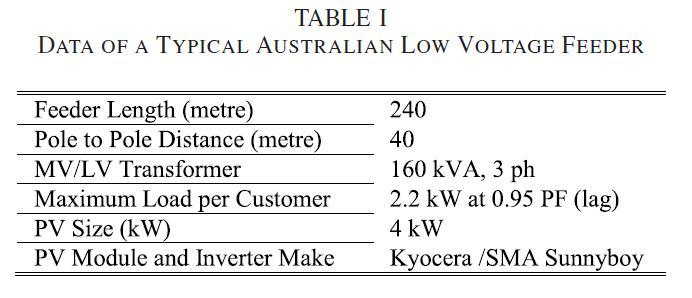
It is a 0.4 kV 3 phase LV feeder constructed using a 7×3 00 mm all aluminum conductor (7/3.00 AAC) with R/X ratio of 2.5 (typically Australian LV networks have R/X ratio over 1.0 and can be higher than 4.5 with LV aerial bundled conductor). The feeder supplies power to 18 customers, 6 customers per phase. Although, a balanced customer distribution has been considered in this paper, unbalanced customer distribution is observed in LV feeders in Australia and this can pose new challenges for balancing in the presence of PV and PEV.
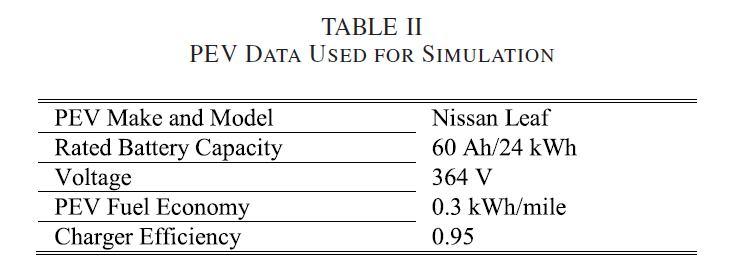
Specifications of the LV feeder used for simulation are presented in Table I. For the analysis of PV and PEV impacts, the LV feeders connected to bus 29, 30, and 31 have considered forming a cluster where all the customers have rooftop PV and PEV. The load profile data is obtained from a real load demand curve captured by an Australian distribution utility and the PV data corresponds to a PV output profile captured by the Commonwealth Scientific and Industrial Research Organisation (CSIRO) on the February 5, 2011. The PV system sizes at the residential households were limited within 4 kW and operated at unity power factor. PEVs are simulated using specifications given in Table II, based on a Nissan Leaf [23]. PEV batteries are modeled by mapping the nonlinear relationship between SoC and battery voltage incorporating the effect of internal resistance [22] to account for the roundtrip efficiency of the battery, which is 77%–81% for a typical lead-acid battery [24]. The 0.95 charger efficiency [25] is considered for the on-board charger of the PEV which is used normally for home charging and it does not include battery losses. The user specified minimum SoC of the PEV battery is determined using (6) based on a 30 km per day travel and an incidental 10 km travel. The 30 km per day travel assumption is based on the driving habit statistics reported in [26]. Several simulation scenarios have been set up for the analysis of the PV impact mitigation and grid support by PEV. To mitigate the voltage rise impact using the battery storage device of the PEV battery, the PEV needs to be parked at home.
According to the statistics presented in [18], the probability of a PEV to stay at home during the daytime of a weekday is over 0.5. Based on this, 50% of the PEVs, i.e., 27 out of 54 PEVs in the entire PV–PEV cluster are assumed to be parked and plugged in at home to be charged from the surplus PV power.
At first, a scenario is considered where none of the 50% of PEVs staying at home go for a travel during the daytime charging period, and therefore all the PEVs can be charged without any intervention. The load and PV output profile for a customer in the PV–PEV cluster is shown in Fig. 7(a), where the periods of charging and discharging are identified using TChg and TDsch, respectively. Using the PEV charging pattern in (1), obtained from the parameters based on (2) and (3), the power consumption profile for PEV battery charging is shown in Fig. 7(b).
The power consumed by the PEV battery increases from zero at the start of the reverse power flow period, reaches the peak level at the midday and decreases to zero at the end of the reverse power flow period. If the PEV battery is charged using a constant rate, then the power consumed by the PEV battery would be either a constant (based on the charging rate and battery voltage), or equal to the surplus PV power available at the PCC.
Fig. 7(b) shows the power profile of the PEV battery based on a constant charging rate and based on the proposed charging strategy. It is observed that at midday when surplus power is at its maximum and the PV impact is most significant, then the charging power with the proposed charging strategy (approximately 1.6 kW) is higher than that from the constant charging rate (approximately 1.0 kW). During the evening peak demand period, the load support using the proposed strategy is also higher than that from the constant discharge strategy.

