

Dementia Risk Factors Project
A systematic evaluation of exposure and impact of 12 drivers of disease in the United States, overall and by state
Final Report
Prepared by IHME Client Services
July 31, 2025
5.6.1
5.9.7
1 Executive Summary
Dementia ranks among the 5 leading causes of health loss and death for individuals over 60 years of age in the United States (US). Dementia currently has no cure, underscoring the urgent need to understand its modifiable risk factors that individuals and policymakers can target to avoid or slow cognitive decline. Through this project, with financial support from AARP and the AD Data Initiative, we completed the most comprehensive assessment to date of key drivers of dementia in the US. We compared the magnitude of association and consistency of the evidence for 12 risk factors and used these results combined with estimates of risk factor exposure to quantify the percentage and total amount of dementia health loss attributed to each risk factor by sex and age and over time in the US and each individual state.
A general overview of project goals is listed below.
• This project looks at 12 lifestyle and health-related risks identified by the 2020 Lancet Commission on Dementia that may increase the chances of developing dementia and how these risks vary by state across the US.
• This project involved a state-by-state analysis to identify where dementia risk reduction strategies could have the greatest impact, helping to tailor interventions to local populations.
• The goal is to help people and policymakers understand which risks matter most, and where changes can make the biggest difference in preventing dementia.
• Visualizing burden attribution across states enables smarter allocation of resources to interventions that will yield the greatest cognitive health benefits.
• States with higher exposure to top-ranked risk factors can prioritize targeted public health strategies e.g., diabetes prevention programs or urban air quality reforms.
• This analysis aligns with AARP’s Six Pillars of Brain Health, creating a bridge between scientific evidence and public-facing guidance for healthier aging.
• Many of the risks for dementia are things we can do something about. Small changes like getting your hearing checked, controlling blood sugar, or joining a club may make a real difference.
2 Project Background
This project was funded by AARP and the AD Data Initiative and ran from August 2023 through July 2025. The project goal was to evaluate the impact of dementia drivers in the US and each of the 50 states and the District of Columbia.
At the Institute for Health Metrics and Evaluation, we produce the world’s most granular estimates of health loss due to dementia by US state, by sex and age, and over time as part of the ongoing Global Burden of Disease (GBD) study 1,2 We also produce estimates of exposure to disease risk factors and have developed a model to quantitatively assess the relationship between risk factors and disease and rank the strength of the evidence between disparate risk factors.3,4 In 2020, the Lancet published a Commission report on the impact of 12 modifiable risk factors on dementia.5 These risk factors include education, hearing loss, high blood pressure, diabetes, smoking, alcohol, high body mass index, low physical activity, depression, social isolation, air pollution, and traumatic brain injury. Using the risk factors identified in the Lancet Commission, we have produced US national-level and US state-specific analyses of the relative importance of each risk factor and its impact on dementia health loss.
Through this work, we have produced over 9.5 million rows of data. These results will be uploaded to the AD Workbench, a data sharing platform developed by the AD Data Initiative to enable use by other researchers seeking to advance dementia research. Results will also be used by AARP to inform AARP members of the best next action they can take to decrease their risk of dementia, and to inform state and national policymakers of the key drivers of dementia that impact their communities that could be targets for intervention.
3 Methods
3.1 Analytic Framework
To calculate the attributable burden of dementia due to each risk factor in the US and by state, we needed four inputs: exposure level within the population to each risk factor, the strength of the association between each risk factor and dementia, the ideal exposure level, and total dementia health loss within the population. With these four inputs, we produced population attributable fractions, or the fraction of dementia health loss due to each risk factor, and attributable disease burden, or the amount of dementia health loss attributed to each risk factor (Figure 1).
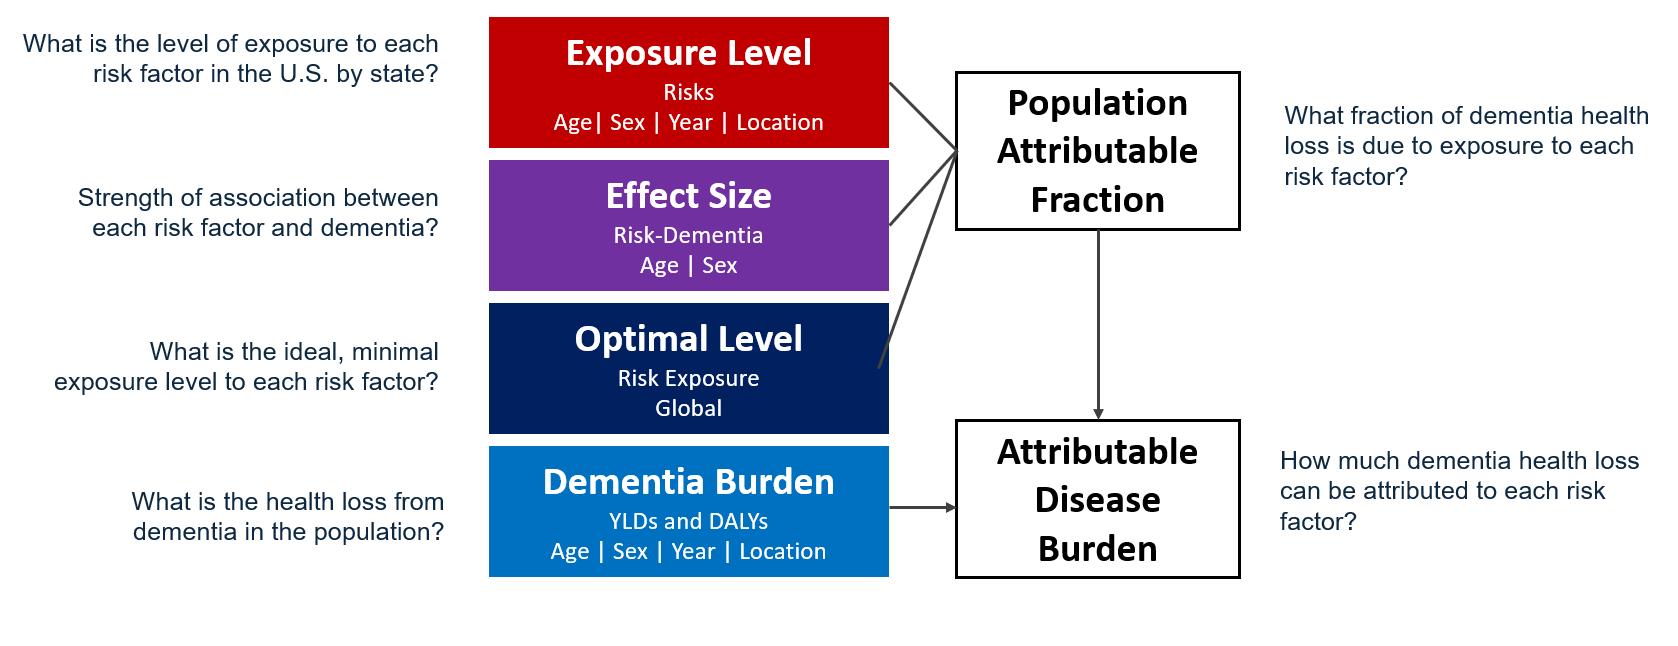
Figure 1. Components of project used to assess dementia health loss attributed to each risk factor in the United States.
In this section, we will review methods for these components, focusing on methods to estimate effect size (Figure 1, purple box), where we performed novel data seeking and methods to assess the relationship between each risk factor and dementia.
3.2 Risk Exposure
Table 1 summarizes risk factor exposure definitions, units of measurement, and the theoretical minimum risk exposure levels (TMRELs) used to quantify excess risk for each of the 12 risk factors evaluated as part of this project.
Table 1. Risk factor exposure definitions, units, and Theoretical Minimum Risk Exposure Levels.
Risk
Air pollution
The population weighted annual average mass concentration of particles with an aerodynamic diameter less than 2.5 micrometers (PM2.5) in a cubic meter of air
Alcohol Average consumption of pure alcohol in grams per day among individuals who have consumed any amount of alcohol over the past 12 months
Body mass index
The ratio of an individual's weight to height squared measured in units of kilograms divided by meters squared
Depression Diagnosed mood disorders characterized by persistent sadness and loss of interest, comprised of major depressive disorder (MDD) and dysthymia
Education Years of educational attainment, defined using numeric ranges specified in studies or through country-specific mappings from the International Standard Classification of Education (ISCED)
Fasting plasma glucose (FPG)
Micrograms per cubic meter annual average 2.4-5.9 ug/m3
grams/day Varies by region and sex (range: 0.1-1.9)
kg/m2 20-23 kg/m2 for adults
Prevalence of depression No diagnosed depression
Years 18 years
The amount of glucose measured in a person’s blood after fasting overnight mmol/L 4.9-5.3 mmol/L
Hearing loss Any mild or worse hearing loss based on pure ton audiometry, defined as hearing loss below a 20 decibel threshold averaged across frequencies
Physical activity
Physical activity across all domains of life (leisure/recreation, work, household and transport); frequency, duration and intensity of activity are used to calculate total metabolic equivalent (MET)-minutes per week which is the ratio of the working metabolic rate to the resting metabolic rate
Smoking Current usage of any smoked tobacco process, at least within the last six months
Social isolation Limited contact with others, proxied by living alone
Systolic blood pressure (SBP)
Traumatic brain injury (TBI)
The pressure exerted on the walls of the arteries when the heart contracts and pumps blood into the circulatory system.
Damage to the brain from an external force ranging from mild concussion to severe with prolonged loss of consciousness and long-term cognitive or physical effects
Prevalence of mild or worse hearing loss No hearing loss (better than 20dB threshold)
METs/week Varies by age and sex (range: 1955-4400)
Cigarettes per day 0 cigarettes per day
Percent living alone Does not live alone
mmHg 105-115 mmHg
Prevalence of moderate or worse TBI with long-term consequences
No history of moderate or worse TBI
3.3 Dementia Burden
Dementia is a progressive, degenerative, and chronic neurological disorder typified by memory impairment and other neurological dysfunctions. We use the Diagnostic and Statistical Manual of Mental Disorders III, IV or V, or ICD case definitions as the reference definition.2,6 The DSM-IV definition is:
• Multiple cognitive deficits manifested by both memory impairment and one of the following: aphasia, apraxia, agnosia, disturbance in executive functioning
• Must cause significant impairment in occupational functioning and represent a significant decline.
• Course is characterized by gradual onset and continuing cognitive decline
• Cognitive deficits are not due to other psychiatric conditions
• Deficits do not occur exclusively during the course of a delirium
A wide array of diagnostic and screening instruments exists, including Clinical Dementia Rating scale (CDR), Mini Mental State Examination (MMSE), and the Geriatric Mental State (GMS).
For the ongoing Global Burden of Disease study, we estimate dementia incidence, prevalence, and deaths. We use these measures to also produce specialized summary measures of health loss, Years Lived with Disability (YLDs), Years of Life Lost (YLLs), and Disability-Adjusted LifeYears (DALYs). These measures are described in Table 2. For this project, we leveraged the most up-to-date estimates of dementia burden available from the Global Burden of Disease study, by age, sex, location, and calendar year (2000-2023). We produce estimates for dementia starting at age 40.
Table 2. Descriptive measures of dementia health loss estimated in the Global Burden of Disease study
Measure
Incidence
Prevalence
Deaths
Years Lived with Disability (YLDs)
Years of Life Lost (YLLs)
Disability-Adjusted Life-Years (DALYs)
Description
New cases of dementia within a year period
The total number of cases of dementia, regardless of clinical subtype
Deaths directly attributed to dementia
Prevalence multiplied by a disability weight; accounts for both the commonality and severity of the disease
For a given death due to dementia, the difference between age of death and expected life expectancy; accounts for number of deaths and loss of expected life years
Addition of YLDs and YLLs; an overall summary measure of health loss (disease burden) from dementia
3.4 Data Landscaping to Inform Relative Risk Models
We conducted a systematic review of available global relative risk data for all 12 dementia risks reported in the Lancet Commission 2020. The systematic review sought to identify all published
longitudinal cohort studies reporting effect measures (relative risks, hazard ratios, odds ratios) with dementia as the outcome and the exposure as one of the 12 risks.
3.4.1 Systematic literature review methods
The same general methodology was applied for each of the risk-specific systematic reviews, summarized here:
1. Search string development
2. Identification of PRISMA compliant and recently published systematic review and metaanalysis with shared inclusion/exclusion criteria.
3. Run search strings from either 1) 1980 to present or 2) from last search string of relevant systematic review identified
a. Databases: PubMed, Web of Science, Embase (PsycINFO for Depression and Social Isolation)
b. Citations: From the identified systematic review/meta-analysis
4. Add to DistillerSR Software, a systematic review tool with artificial intelligence capacity to increase screening efficiency.7,8 Deduplicate references across databases.
5. Dual title abstract screen 15% references. Assess conflicts and resolve them in discussion.
a. Kappa, concordance report, at least 0.80, indicates strong agreement across dual screeners.
6. DistillerSR AI score exclusion.
a. Within the 15% screened run threshold tests to assess distribution of scores, and any "false negatives" (manually included references) at the relative score distribution.
b. Allows us to project how many potentially relevant references we might lose against the number of references AI screens out for us.
c. We select the score cutoff at or below 15% false negatives across our test sets.
d. Run AI screen at selected score cutoff (excludes any references below score cutoff)
e. Human screen any remaining references not screened out by DistillerSR
7. Full text screening, across two reviewers. Track questions and answers from topic and modeling experts.
8. Deduplicate extractions across included cohorts.
9. Extract data from included references.
a. Bias covariates for study design, exposure and outcome flagged in extraction process
b. Initial batch of extractions shared with modelers to identify any systematic errors. Re-do initial extractions with feedback.
c. Track questions and answers throughout the extractions.
3.4.2 Dementia case definition
We included studies which met the GBD case definition of dementia (described in Section 3.3: Dementia Burden). Such studies captured information about risk factor exposure among people living with dementia according to DSM or ICD criteria, such as in population-based surveys with adjudication of diagnosis by a physician or consensus meeting of physicians.
Where possible, we extracted relative risk estimates for specific subtypes of dementia: Alzheimer’s disease, vascular dementia, and unspecified.
3.4.3
Study quality and bias assessment
Quality of studies was assessed via several study-level variables:
• Representativeness of general population
• Exposure quality (individual level, objective measurement, multiple prospective measurements)
• Outcome quality (objective report (death record/medical record/physician diagnosis), blinded)
• Confounder quality (controls for age, sex, tobacco, income and education and risk-outcome specific major confounders)
• Low risk of reverse causation (study reports greater than 10 years of follow-up)
• Low selection bias (percentage of population retained in follow up greater than 95%)
Studies were included for our models if they measured the accepted case definition for any of the 12 exposures of interest at baseline, met the GBD case definition of dementia, and exposure quality standards. Nearly 27,000 studies were screened and nearly 600 newlyidentified sources were extracted (Figure 2).
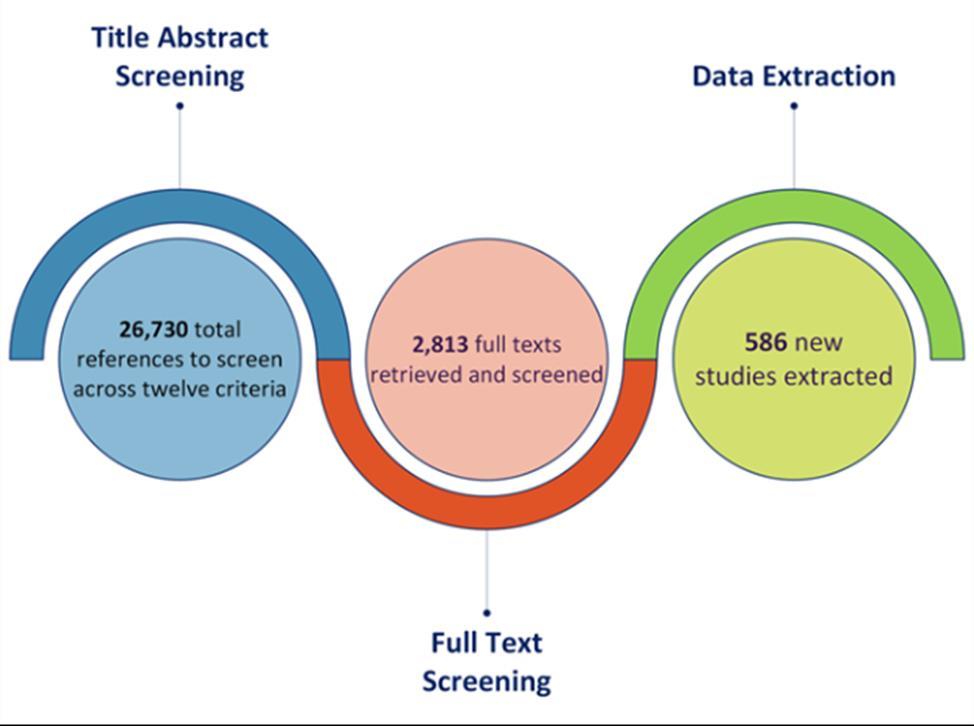
Figure 2. Summary of systematic reviews and data seeking across all risk factors. More than 25,000 sources were identified for title and abstract screening, with close to 10% undergoing full text screening, and ultimately 586 articles flagged for use in analyses.
3.5 Burden of Proof Risk Function
IHME has developed a new data-driven quantitative approach to assess strength of evidence between multiple health risks and disease outcomes, called the Burden of Proof Risk Function (BoPRF).3 The BoPRF framework uses a consistent methodology applied to human studies to estimate the presence and magnitude of association between a risk and health outcome and provides a quantitative assessment of the evidence strength. Relevant sources are identified through a systematic review of the existing literature in three databases and use a scientifically rigorous study design appropriate for each specific risk factor and health outcome by evaluating case-control, prospective and retrospective cohorts, or randomized controlled trials. The methodology is unique in that it allows for quantitative comparisons of the strength of evidence between diverse risk factors (e.g., depression, pollution, physical inactivity, smoking) with a consistent approach. To date this has been applied to more than 200 dietary, metabolic, behavioral, and environmental risk factor–outcome pairs within the GBD.9–11
The BoPRF is defined as the smallest level of excess risk (closest to no relationship) that is consistent with the data. It summarizes all available information from human studies to quantify the mean relationship between a risk factor exposure (e.g., PM2.5 air pollution) and a specific health outcome (e.g., dementia). This approach also describes the variation in the data, reflected in the uncertainty range that incorporates unexplained between-study heterogeneity, that is the remaining variation in studies after accounting for known study design characteristics. To aid interpretation, we mapped the risk-outcome score (ROS) to a star rating on a scale of one to five with one-star indicating a lack of significant association and two-star through five-star indicating weak, moderate, strong, and very strong evidence for an association, respectively.
The BoPRF approach offers several advantages over classic meta-analysis methods. For example, the classic meta-analysis largely ignores variation in estimates of effects between studies. As studies accumulate in the literature, the confidence intervals decrease even if the new studies contradict each other. This gives a false sense of precision. The BoPRF also provides a mechanism to account for differences between study-level characteristics, to the extent that such differences are known and can be encoded. Any remaining unexplained between-study heterogeneity suggests uncertainty in the relationship and contributes to the overall rating of effect size and evidence strength. Further, the BoPRF allows for flexibility where risk functions can be nonlinear to better fit the data.
Underlying the framework is a Bayesian meta-regression model that improves upon prior approaches through use of robust data-driven methods and innovative developments. The method enables flexible, nonlinear fit to the data via basis splines, standardizes the assessment of outliers using least trimmed squares, explicitly handles the full exposure range in both the numerator and denominator of a relative risk, tests for systematic bias as a function of study characteristics using automatic covariate selection with the Lasso approach, and incorporates between-study heterogeneity into the uncertainty of mean risk estimates. We estimated the burden of proof risk function (BPRF), a key innovation, which is defined as either the 5th (for harmful exposures) or 95th (for protective exposures) quantile of the risk curve (with between-
study heterogeneity) closest to the null line. The BPRF can be interpreted as the most conservative estimate of harmful or protective effect at each level of exposure consistent with the available data. We converted the BPRF to a risk-outcome score (ROS), a summary measure of both the strength of evidence and association that can be compared across risk-outcome pairs. Further details are provided in Zheng et al.3
We used the Burden of Proof approach to synthesize the evidence for each risk factor’s impact on dementia risk. The approach consists of six steps: 1) conduct systematic search and extraction of data from published studies; 2) determine the general shape of exposure and outcome relationship (Figure 3); 3) test and adjust for observable biases across study design and characteristics; 4) quantify and incorporate remaining unexplained between-study heterogeneity in uncertainty estimates; 5) evaluate and report potential for publication or reporting biases ; and 6) calculate the burden of proof risk function – a conservative estimate of the harmful or protective effect supported by – and use this function to calculate the ROS and star rating on a scale of one to five (Figure 4, Table 3). We used all data in our primary analysis and explored results stratified by mean age groups and by dementia subtypes (Alzheimer’s disease and vascular dementia) in sub-analyses for many of the risk exposures.
Table 3. Star rating system to describe the strength of the evidence for association between a risk factor and a disease outcome.
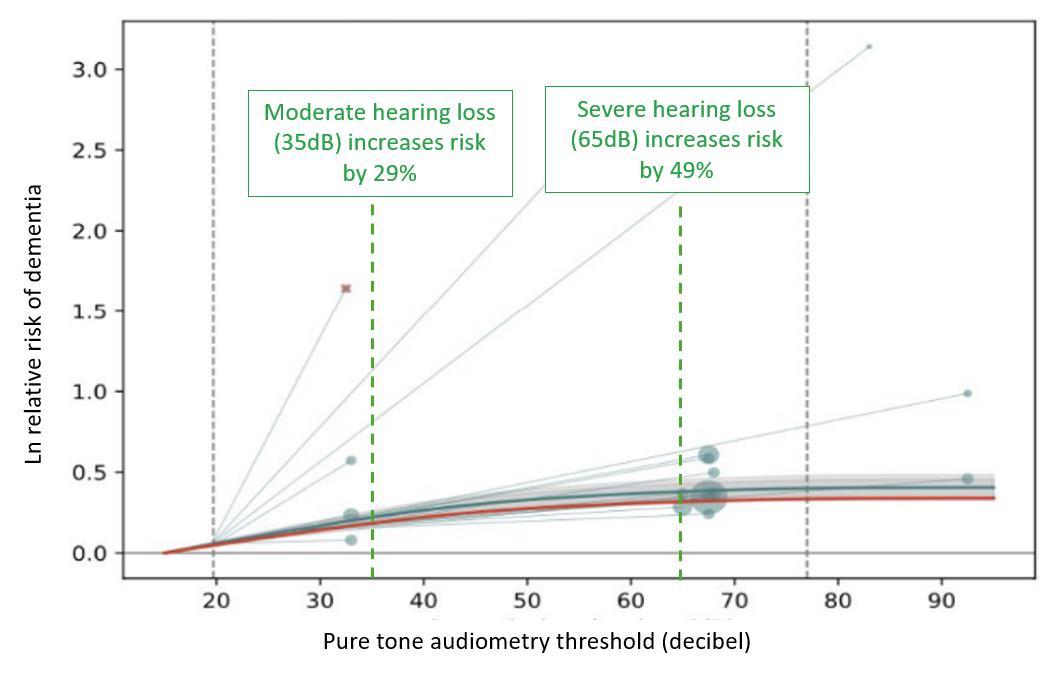
Figure 3. Example model showing the relationship between increasing levels of hearing loss and risk of dementia. Higher decibel thresholds (x-axis) signify higher degrees of hearing loss. Grey circles signify data included in the model where larger circles mean more weight in the model. Circle location shows the hearing threshold of the exposed group and the line connects to the hearing threshold of the unexposed group. The dark teal line depicts the estimate of risk (y-axis) over the exposure continuum and the grey area represents the uncertainty. The red line depicts a conservative estimate of the effect and is used in Burden of Proof calculation.
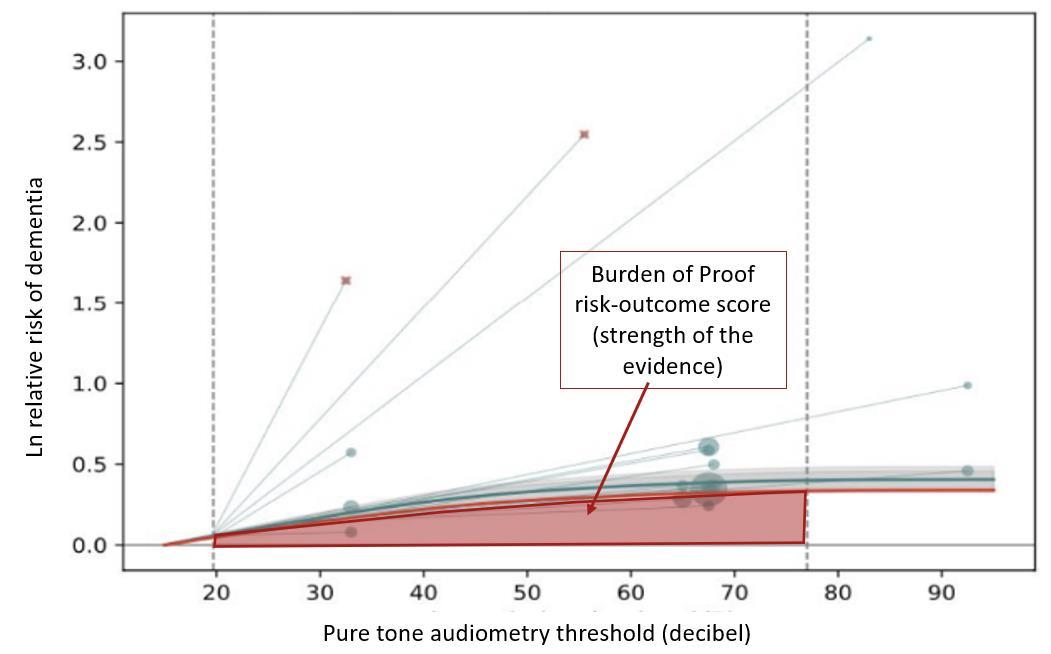
Figure 4. Example model showing the relationship between increasing levels of hearing loss and risk of dementia. The red area under the curve represents the area used to calculate the Burden of Proof risk-outcome score, which is a measure of the strength of the evidence for association based on magnitude of effect size and consistency of the underlying data. The larger the area, the higher the score. The red area is defined conservatively by the uncertainty bound closest to the null (no effect).
3.6 Population Attributable Fraction and Attributable Burden
The population attributable fraction (PAF) is the proportion of all cases of a particular disease, in this case dementia, in a population that is attributable to a specific exposure. PAFs were produced combining results from the risk assessment, the theoretical minimum exposure level to the risk factor, and estimated levels of actual risk factor exposure by year, age, and sex for the United States and individual states.
The general formula to calculate a PAF is:

When exposure is measured on a continuous scale (e.g. systolic blood pressure level), continuous PAFs are calculated with continuous exposure models that include both a mean and distribution in the population. Finally, PAFs can be combined with estimates of dementia burden to calculate risk attributable burden. This is accomplished by multiplying the PAF by dementia burden.
4 Key Takeaways
Based on the Burden of Proof risk-outcome score (ROS), which accounts for both the strength of association and the certainty of the evidence, we grouped the 12 dementia risk factors into three tiers of evidence (Table 4). High fasting plasma glucose, hearing loss, and low education formed the top tier, reflecting the strongest and most consistent evidence for a harmful association with dementia. The middle tier included air pollution, depression, low physical activity, traumatic brain injury, smoking, high systolic blood pressure, and social isolation – risk factors with moderate strength of evidence and generally consistent but more variable findings across studies. Alcohol use and high body mass index comprised the low tier and presented the most inconsistent relationship with dementia risk. These tiered classifications of risk can help in prioritizing potential intervention targets based on both the magnitude and reliability of their observed impact on dementia.
Table 4. Strength of the evidence of association between each risk factor and dementia, by tier
High fasting plasma glucose
Hearing loss
Low education Air pollution Depression
Low physical inactivity
Traumatic brain injury
Smoking
High systolic blood pressure
Social isolation
Alcohol use
High body mass index
The change in risk of dementia varied by risk factor as summarized below.
• Fasting plasma glucose: Of all risk factors included in this list, the evidence for high blood sugar elevating the risk of dementia is the strongest. Elevated blood sugar even at prediabetic levels can increase the likelihood of dementia and suggests that regular monitoring of blood sugar irrespective of diabetes status is a great way to identify and address elevated blood sugar as early as possible.
• Hearing loss: Both moderate and severe hearing loss increases risk of dementia. Most cases of hearing loss can be addressed with hearing aids, highlighting the importance of regular hearing tests.
• Education: Low educational attainment has the third highest strength of the evidence for increased risk of dementia of the 12 studied risk factors. Individuals who received only two years of schooling facing over double the risk of developing dementia compared to those with 18 years of education, providing more support for the importance of education.
• Air pollution: High levels of ambient PM2.5 air pollution relative to low levels increases dementia risk, particularly Alzheimer’s disease.
• Depression: Individuals with a diagnosed depressive disorder were found to have a significantly higher risk of developing dementia compared to those without depression. These findings highlight the benefit of incorporating mental health screening and treatment into dementia prevention.
• Low physical activity: Engaging in 150 minutes a week of moderate to vigorous physical activity is associated with a 22% reduced risk of dementia.
• Traumatic brain injury: Moderate to severe TBI that results in hospitalization is associated with increased risk of later dementia. Evidence that mild or repeat TBI increase dementia risk is less consistent.
• Smoking: Compared with non-smokers, current smokers with five cigarettes per day consumption have, on average, a 16% increased risk of dementia —underscoring the brain health benefits of smoking cessation.
• High blood pressure: Compared to a systolic blood pressure level of 100mmHg, there is 13% increased risk in dementia at 140mmHg, a systolic blood pressure level that indicates hypertension.
• Social isolation: Social isolation, measured as a combination of low social network (number of contacts) and low social activity (participation in activities with others) increases risk of dementia by approximately 28%.
• Alcohol and high body mass index: There is the least evidence for the role of alcohol consumption and high body mass index in increasing dementia risk. When prioritizing intervention targets, these are not the key risk factors to address to impact dementia risk.
As shown in Figure 5, high fasting plasma glucose, low educational attainment, and hearing loss were associated with the largest attributable burden, indicating they account for the highest share of dementia burden in the US. These rankings may differ from the Burden of Proof star tiers, which reflect the strength and consistency of evidence, not the prevalence of the risk factor in the population. For example, physical inactivity may show a larger impact on population-level burden due to its widespread prevalence, even if the strength of evidence is more moderate.
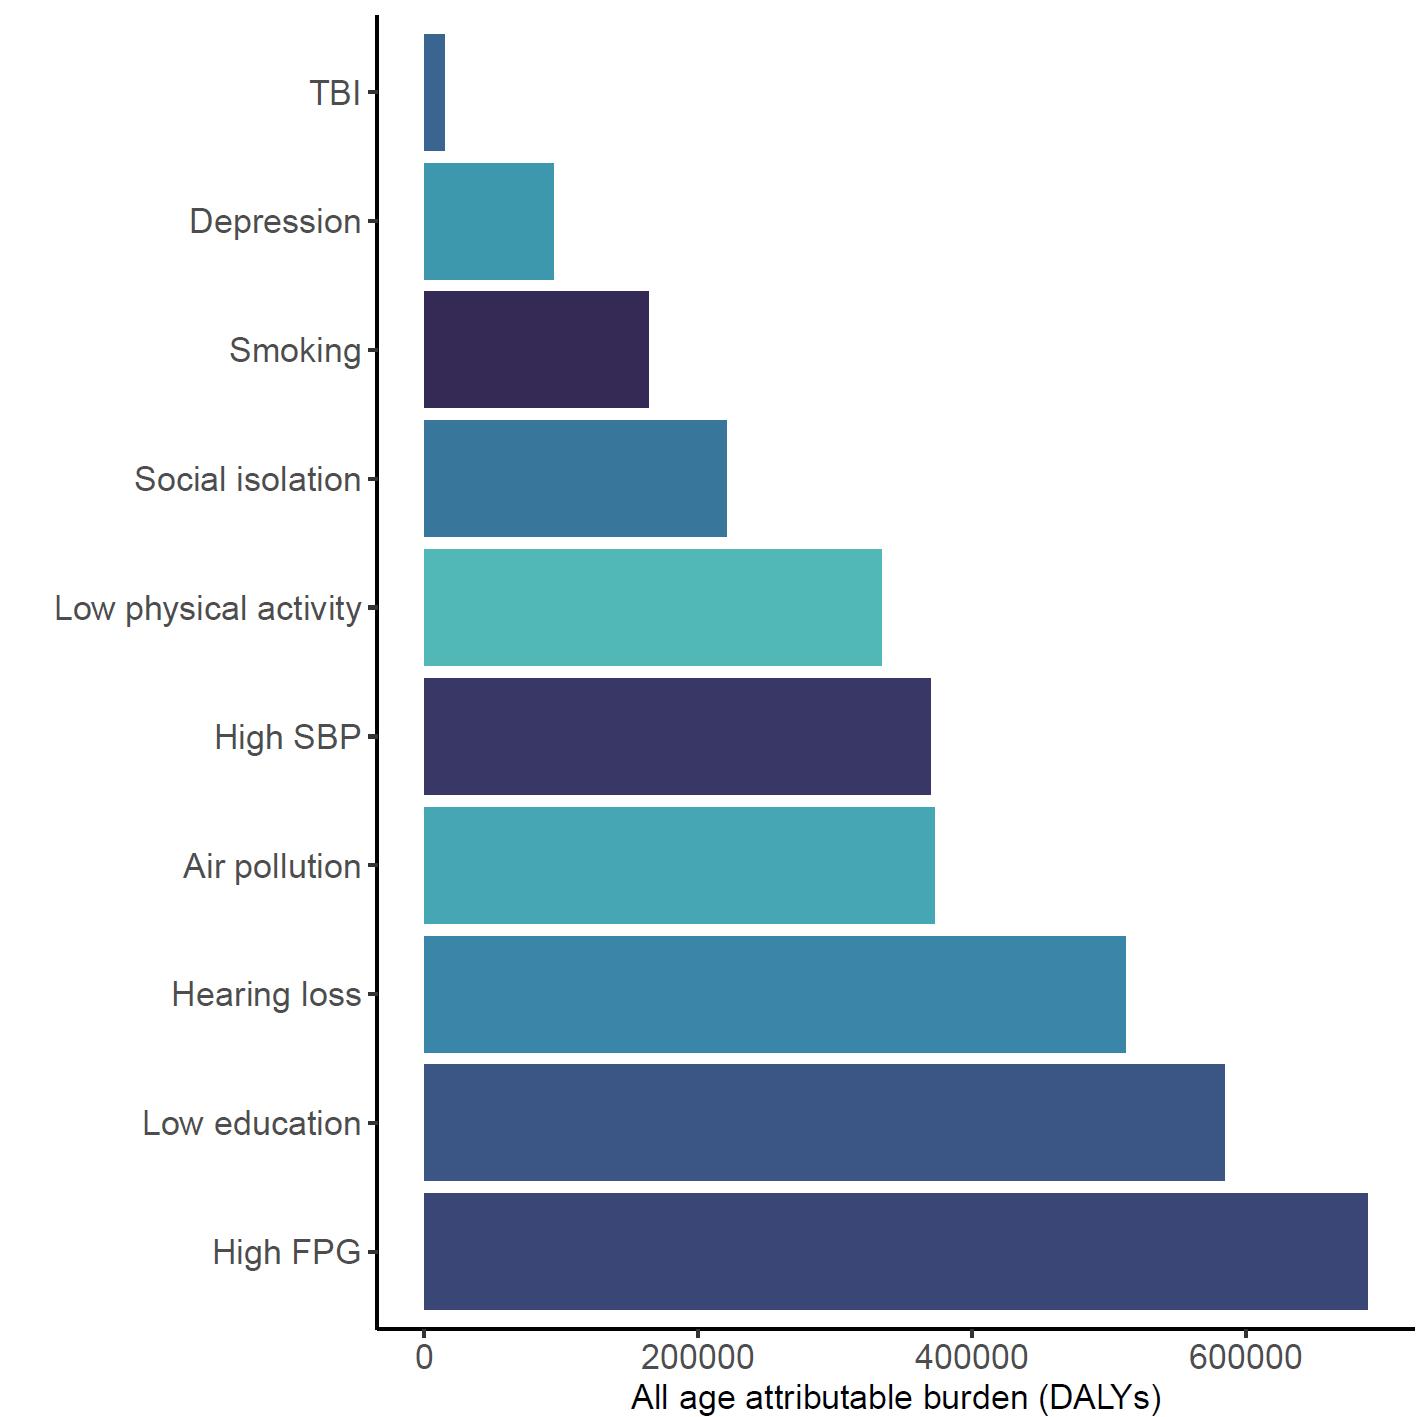
Figure 5. Total dementia DALYs attributed to each risk factor in the United States in 2023. The largest number of DALYs were attributed to high fasting plasma glucose levels, low educational attainment, and hearing loss. Alcohol and high body mass index are excluded from this figure because analysis did not demonstrate increased risk of dementia from typical levels of exposure. TBI = traumatic brain injury; SBP = systolic blood pressure; FPG = fasting plasma glucose.
Rankings of risk attributable burden for each risk factor were relatively consistent across states (Figure 6). For example, high fasting plasma glucose was ranked first nationally and in all states except California, where air pollution was the top ranked contributor. Attributable burden combines the increased risk of dementia from risk factor exposure, the level of exposure in the population, and the amount of dementia in the population. The U.S. is ranked 30th in the world for prevalence of type 2 diabetes (indicative of high blood sugar levels) and fasting plasma
glucose levels at the threshold for diabetes leads to an increased dementia risk of 77%.
Combined, this means that FPG is an important driver in the U.S. of dementia burden. TBI is consistently ranked last even though it increases dementia risk because very few people in the population experience moderate-to-severe TBI with long-term effects.
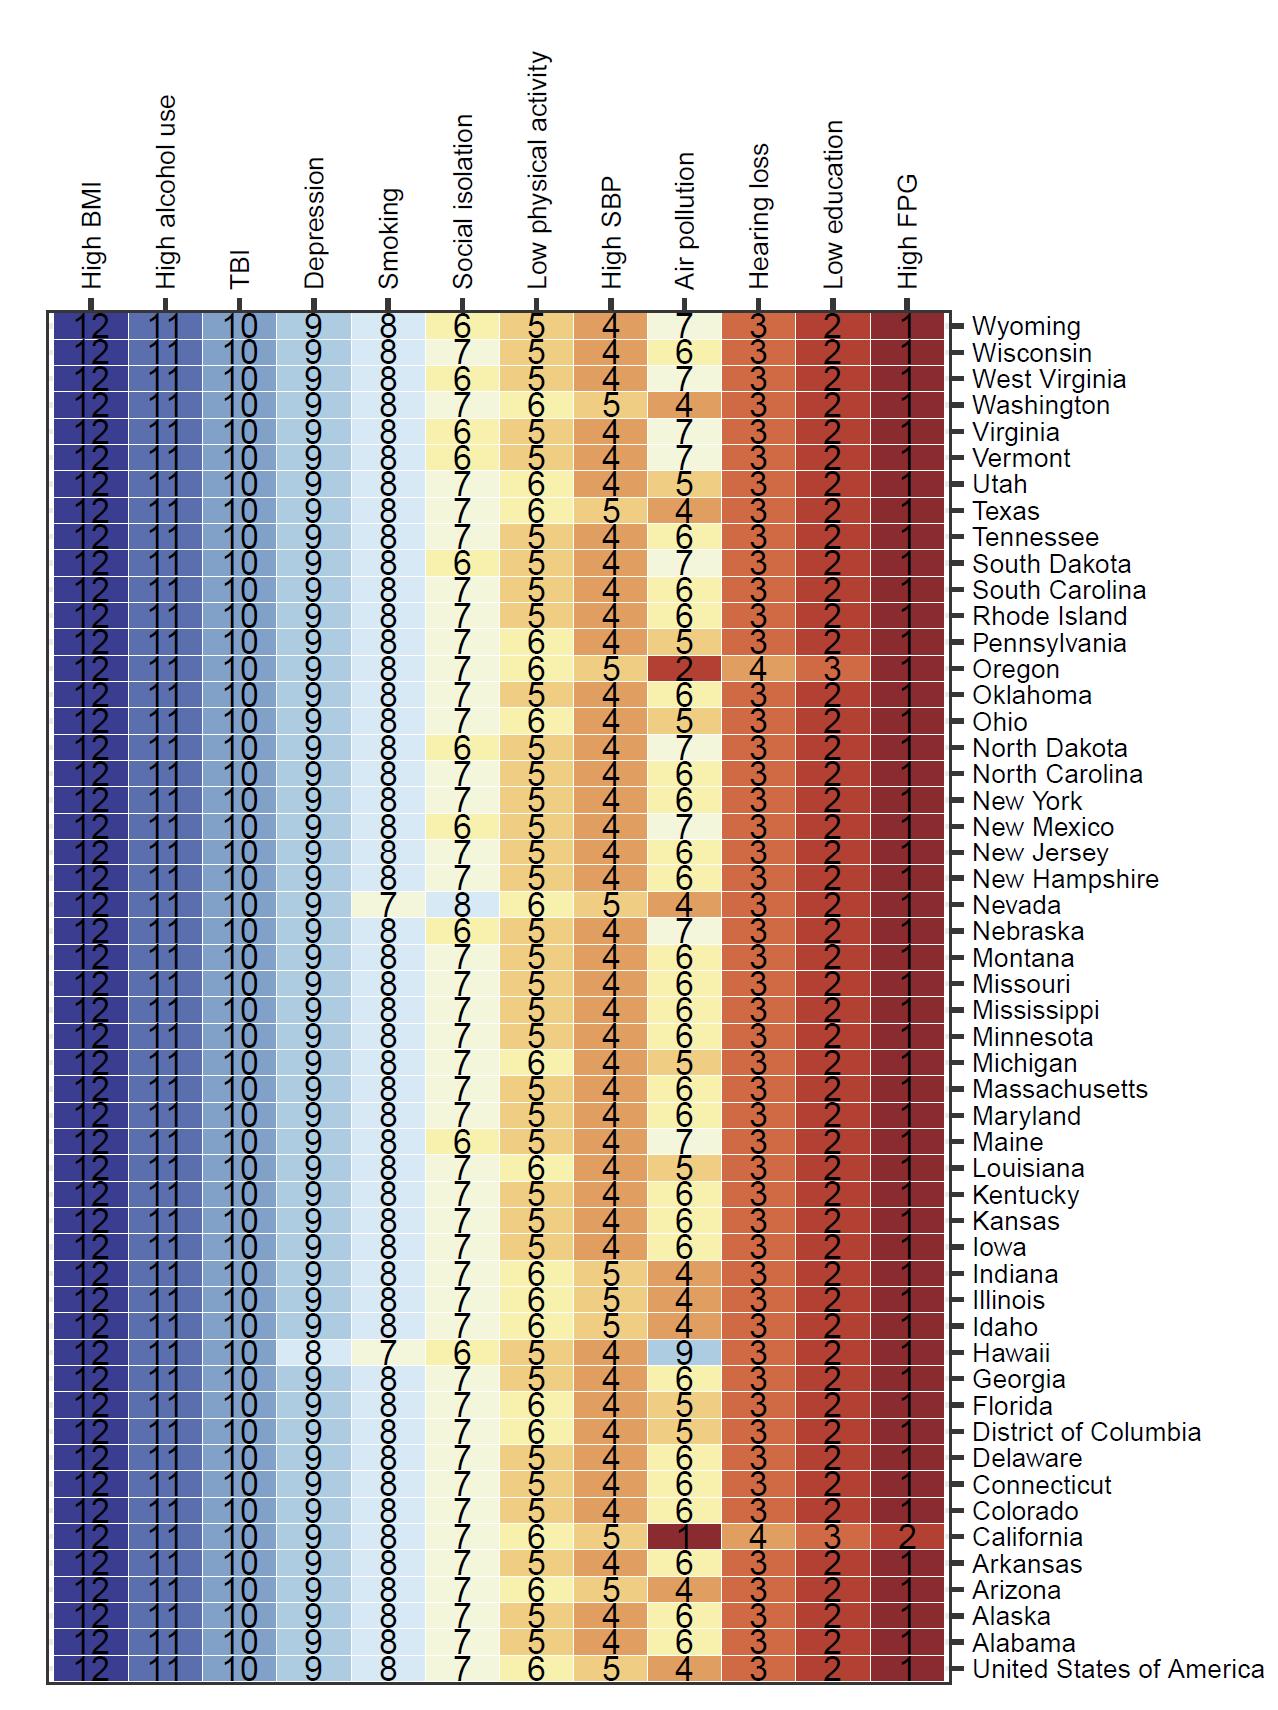
Figure 6. National and state ranking of attributable burden (age-standardized DALYs) for each risk factor. Alcohol and body mass index are included to illustrate that there was no significant increase in risk of dementia observed. In almost all locations, attributable burden was highest for high fasting plasma glucose levels. TBI = traumatic brain injury; SBP = systolic blood pressure; FPG = fasting plasma glucose.
In contrast, state ranking by risk factor was highly variable – in other words, for a given risk factor, the states with the highest and lowest attributable burdens (Figure 7). For example, although absolute attributable burden for TBI is ranked last for each state, the state with the highest attributable burden due to TBI is Montana and the lowest attributable burden due to TBI is Delaware.
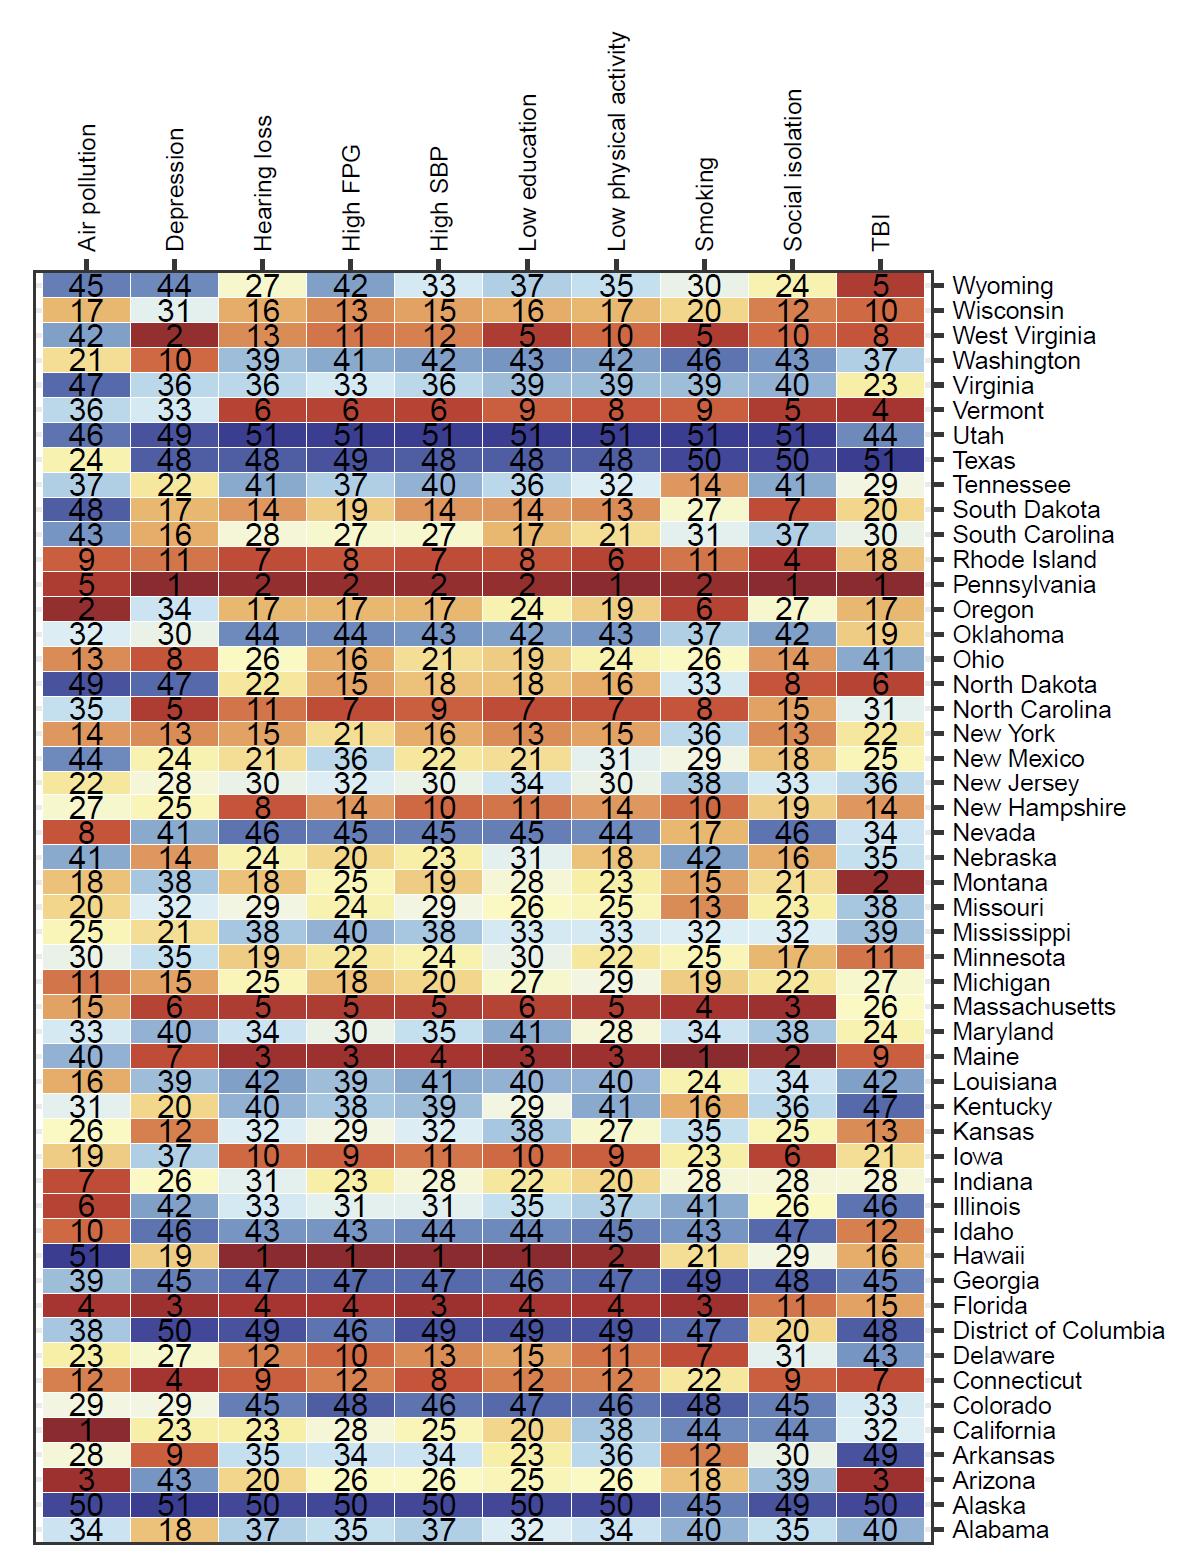
Figure 7. State attributable burden ranked from highest attributable burden to lowest attributable burden for each risk factor. For example, for air pollution, the highest attributable burden was in California, and the lowest in Hawaii. Alcohol and high body mass index are excluded from this figure because analysis did not demonstrate increased risk of dementia from typical levels of exposure. TBI = traumatic brain injury; SBP = systolic blood pressure; FPG = fasting plasma glucose.
Compared to other countries, the United States has high levels of exposure (ranked in the top 50 compared to 204 other countries and territories) for high body mass index (ranked 17th) and depression (ranked 21st). The United States has low levels of exposure (ranked in the bottom 50 compared to 204 other countries and territories) for high systolic blood pressure (ranked 200th), air pollution (ranked 175th), and low education (ranked 183rd). The United States is ranked 69th for high fasting plasma glucose level, but 30th for prevalence of diabetes. Since high fasting plasma glucose has the highest burden of proof score for increase dementia risk across all identified risk factors, and levels of diabetes are high in the United States, this should be an area of focus.
5 Results by Risk Factor
5.1 Air Pollution
5.1.1 Exposure definition
Exposure to ambient particulate matter pollution is defined as the population weighted annual average mass concentration of particles with an aerodynamic diameter less than 2.5 micrometers (PM2.5) in a cubic meter of air. This measurement is reported in µg/m3 and is assessed as ambient PM2.5 exposure, excluding source-specific PM2.5. Long-term exposure is considered over a period of a year or more.
Exposure to outdoor air pollution does not vary noticeably over age or by sex since it is ambient.
5.1.2 National-level and state-level exposure and disparities
Exposure to air pollution, as defined above, varied significantly across the globe (Table 5) with a gap of 111.3 µg/m3 between Qatar, with the highest exposure, and Greenland, with the lowest exposure. The United States, placing 175th in exposure, generally experiences relatively low air pollution exposure on the global scale. Within the United States, California is a notable outlier, with a mean PM2.5 exposure 1.9 µg/m3 higher than the national average (Figure 8, Table 6).
Table 5. National ranking of exposure levels, 2022*
Countries with highest PM2.5 exposure (µg/m3)
1. Qatar, 113.0
2. Saudi Arabia, 77.8
3. Niger, 74.5
4. Kuwait, 73.9
5. Nigeria, 70.3
6. United Arab Emirates, 67.8
7. Bahrain, 63.8
8. Bangladesh, 63.1
9. Iraq, 59.6
10. Pakistan, 58.1
Countries with lowest PM2.5 exposure (µg/m3)
195. Marshall Islands, 4.79
196. Bermuda, 4.76
197. Cook Islands, 4.55
198. Niue, 4.44
199. Nauru, 4.23
200. Micronesia, 4.09
201. Kiribati, 3.84
202. Guam, 3.68
203. Northern Mariana Islands, 2.86
204. Greenland, 1.70
Countries with PM2.5 exposure similar to the United States
174. Brunei Darussalam, 7.44
175. United States, 7.43
176. Fiji, 7.35
*Exposure estimates for air pollution only produced through 2022
Table 6. State ranking of exposure levels, 2022
States with highest PM2.5 exposure (µg/m3)
1. California, 9.33
2. Illinois, 8.48
3. Indiana, 8.32
4. Arizona, 8.26
5. Louisiana, 8.21
States with lowest PM2.5 exposure (µg/m3)
47. Vermont, 5.31
48. North Dakota, 5.31
49. Wyoming, 4.94
50. Maine, 4.64
51. Hawaii, 3.53
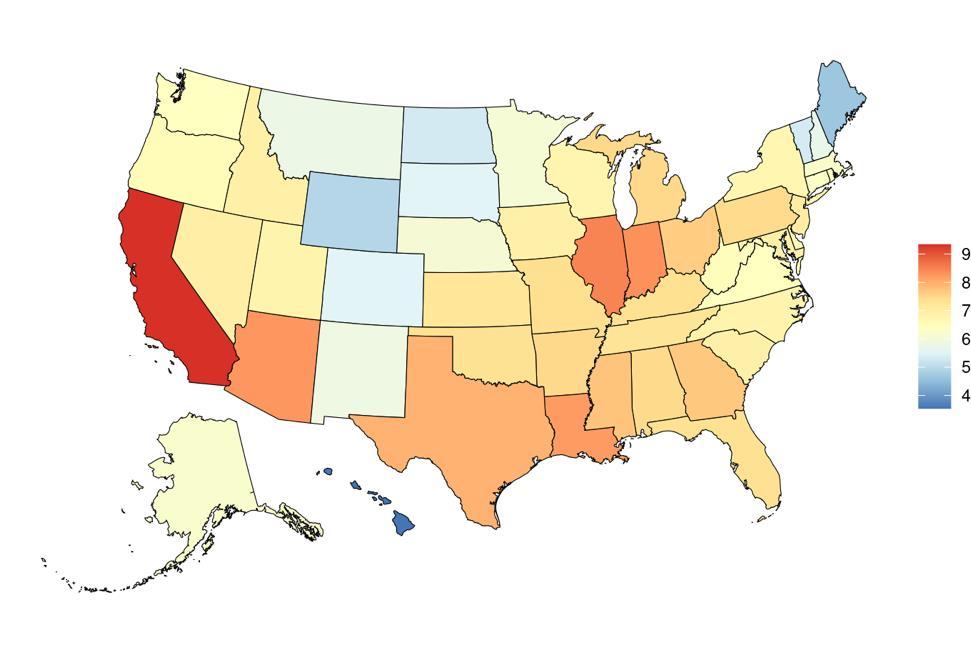
Figure 8. State-level PM2.5 exposure (µg/m3) in the United States, 2022
Overall exposure to air pollution in the United States has decreased over time (Figure 9), a trend that started in the 1970s after the passage of the Clean Air Act 12

Figure 9. Temporal trends in PM2.5 exposure (µg/m3) in the United States, 2000-2022
5.1.3 Data landscape
We included studies in which:
• Quantitative measurement of risk associated with a range of PM2.5 exposure change. Only studies reporting an explicit exposure range were included.
• Only studies on long-term exposures, which are mostly evaluated by annual (rather than shorter-term) PM2.5 exposures.
• Only studies on continuous PM2.5 exposure
We excluded studies in which air pollution was measured as:
• Occupational exposure (which does not reflect the exposure levels of the general population)
• Categorized exposure levels
• Had no exposure of interest: does not report any specific PM2.5 exposure range (median/median/min/max/SD/IQR), or categorical (or binary) PM2.5 exposure, or studies focuses on coarse particulate matter (PM10) and total suspended particulate (TSP)
Using the criteria above, we identified 541 studies, and after screening included a total of 28 studies with relevant relative risk data for our analyses (Figure 10).
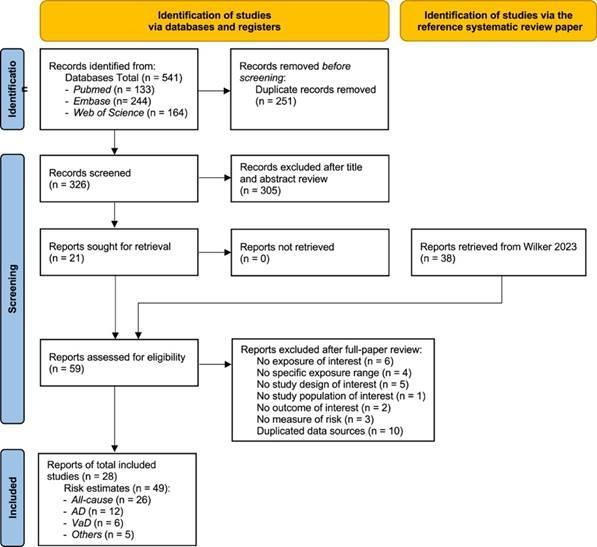
Figure 10. PRISMA diagram for air pollution systematic review showing inclusion and exclusion of studies at each systematic review stage.
Table 7 (next page) describes the studies among US populations included from the systematic review. Eight of the 28 studies identified by the systematic review were from the US. The majority used physician diagnosis to identify cases of dementia, with follow-up times ranging from 9-25 years. Seven of the studies assessed the impact of air pollution on all-cause dementia, two on Alzheimer’s disease, and two on vascular dementia. The remaining 19 non-US studies included in this analysis are described in the appendix.
Table 7. United States studies included from the systematic review
Grande, 2019 US
Shaffer, 2021
Younan, 2021
2021
2021
Semmens, 2022
2022
2023
• = dementia subtype is an outcome available in study.
5.1.4 Evidence score summaries
We specifically looked at the impact of outdoor air pollution fine particulate matter with a diameter of 2.5um or less (PM2.5). The World Health Organization air quality guidelines recommend exposure to no more than 5ug/m3, which is exceed by 90% of the world’s population.13 We used data from 28 cohort studies and found that even PM2.5 levels of 4.5ug/m3 could increase dementia risk relative to lower levels. Our results demonstrate that long-term PM2.5 exposure increases the risk of dementia by at least 14% if exposed to PM2.5 levels ranging from 4.5 to 26.9ug/m3 compared to a reference level of 2.0ug/m3. Risk increases steeply until PM2.5 levels reached 15ug/m3 and then only modestly for higher exposure levels (Figure 11).

Figure 11. Air pollution fine particulate matter and dementia risk. a, Relative-risk (RR)function. The solid green line represents the mean RR at each exposure level. The dark green shaded area indicates the 95% UI without accounting for between-study heterogeneity, while the light green shaded area represents the 95% UI accounting for between-study heterogeneity. The size of the data point is proportional to the inverse of the s.d. of the effect estimates, where larger points indicate higher precision in the effect estimates. b, A modified funnel plot showing the residuals (relative to zero) on the x axis and the estimated s.d. (inclusive of between-study heterogeneity) on the y axis.
5.1.5
Sub-analyses
Results from the main analysis show the relationship between air pollution and any type of dementia. We also performed sub-analyses to look at the impact of air pollution on vascular dementia using data from six studies and Alzheimer’s disease using data from 12 studies. We found a significant association between elevated levels of PM2.5 and Alzheimer’s disease (Figure 12) but not vascular dementia (Figure 13). However, less data were available for typespecific dementia than all-cause dementia, with the least data available for vascular dementia. There is some evidence that air pollution increases levels of amyloid beta in the brain,14 and that air pollution impacts cardiovascular and cerebrovascular health.15

Figure 12. Air pollution fine particulate matter and Alzheimer’s disease risk. a, Relative-risk (RR)function. The solid green line represents the mean RR at each exposure level. The dark green shaded area indicates the 95% UI without accounting for between-study heterogeneity, while the light green shaded area represents the 95% UI accounting for between-study heterogeneity. The size of the data point is proportional to the inverse of the s.d. of the effect estimates, where larger points indicate higher precision in the effect estimates. b, A modified funnel plot showing the residuals (relative to zero) on the x axis and the estimated s.d. (inclusive of between-study heterogeneity) on the y axis.

Figure 13. Air pollution fine particulate matter and vascular dementia risk. a, Relative-risk (RR)function. The solid green line represents the mean RR at each exposure level. The dark green shaded area indicates the 95% UI without accounting for between-study heterogeneity, while the light green shaded area represents the 95% UI accounting for between-study heterogeneity. The size of the data point is proportional to the inverse of the s.d. of the effect estimates, where larger points indicate higher precision in the effect estimates. b, A modified funnel plot showing the residuals (relative to zero) on the x axis and the estimated s.d. (inclusive of between-study heterogeneity) on the y axis.
5.1.6 Population attributable fraction
The fraction of dementia health loss that can be attributed to air pollution in 2023 by state ranges from 1.5% in Hawaii to 20.2% in California. In general, PAFs are higher in western states (Figure 14).
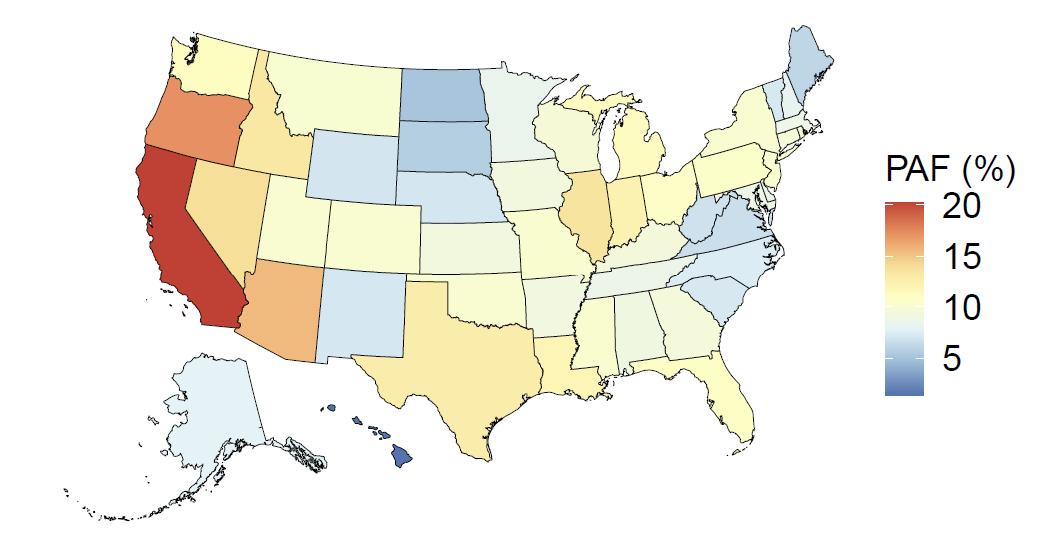
Figure 14. State-level population attributable fractions for dementia burden due to air pollution, 2023, both sex, all-age.
Attributable fraction of dementia health loss due to air pollution overall in the US has decreased over the last three decades from an average of 27.3% in 1990 down to an average of 11.5% in 2023 (Figure 15). In the 1970s, the passage of the Clean Air Act instigated the decreasing trend in exposure to outdoor air pollution 12 However, the frequency of wildfires is increasing in North America, which can lead to high levels of small-diameter ambient air pollution in affected areas 16
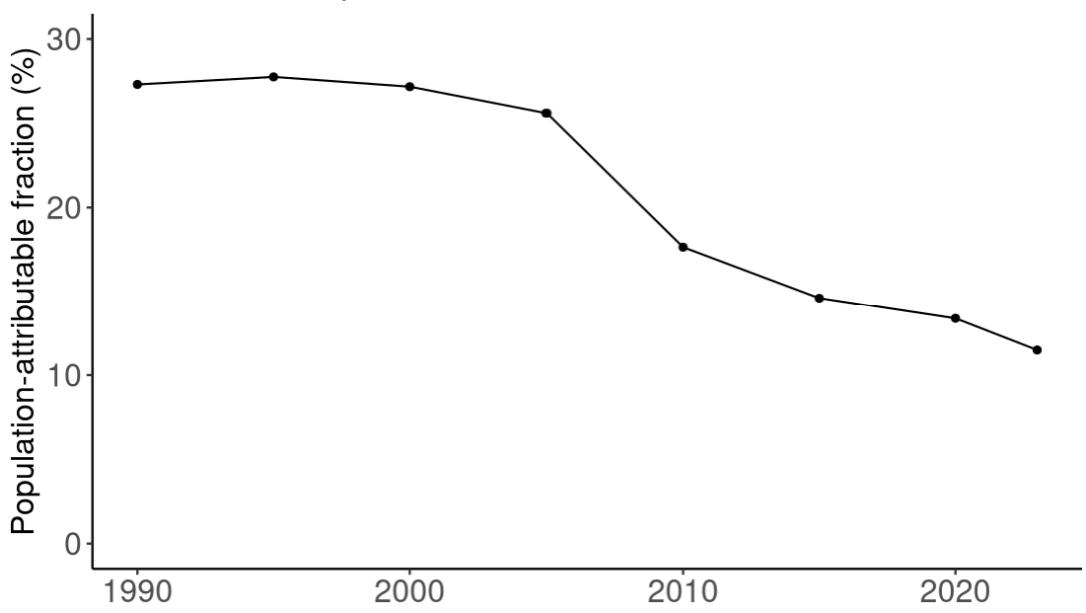
Figure 15. Temporal trends in population attributable fractions for dementia burden due to air pollution, 1990-2023.
5.1.7 Attributable burden
Attributable burden represents the amount of dementia health loss that could be avoided if outdoor air pollution was decreased to a theoretical minimum level. It combines information about the relationship between air pollution and dementia, the number of people living with or dying from dementia and the exposure to air pollution in a given geography. In 2023, 375,000 dementia disability-adjusted life years were attributed to outdoor air pollution, 242,000 for females and 133,000 for males (Figure 16).
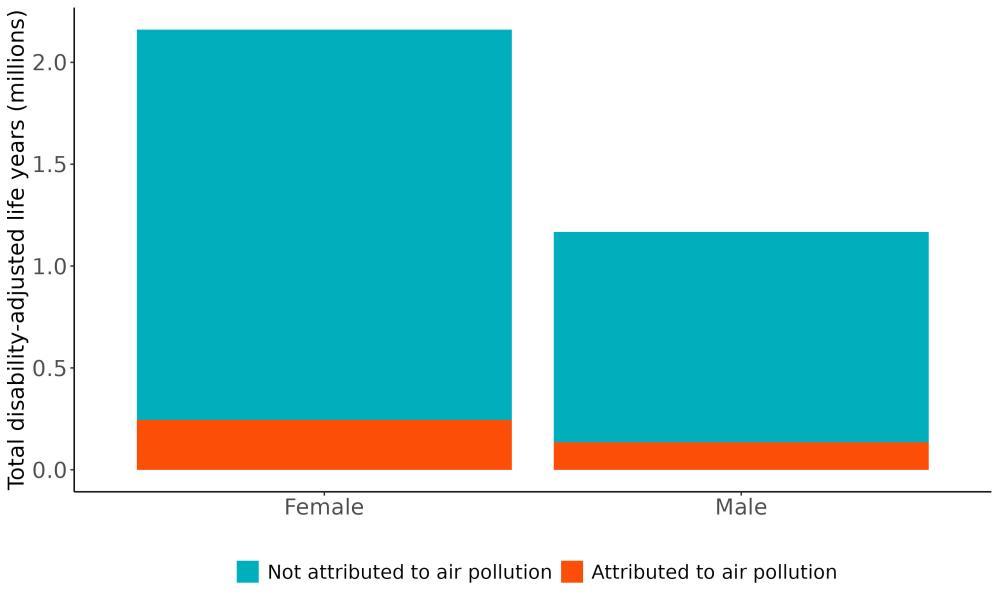
Figure 16. Proportion of dementia burden attributed to air pollution by sex, 2023.
The rate of dementia health loss attributed to outdoor air pollution varied by state, generally reflecting patterns of exposure to outdoor air pollution (Figure 17). The highest rate of health
loss in 2023 was in California followed by Oregon, and the lowest rates in Hawaii and North Dakota.

Figure 17. State-level dementia disability-adjusted life-years attributable to air pollution, 2023, both sex, all-age.
The total number of disability-adjusted life-years attributed to outdoor air pollution peaks for individuals in the US who are 75-85 years old and is higher for females (Figure 18; top plot). The higher number for females is because dementia is more common in females and because females live to older ages than males even though exposure to ambient outdoor air pollution is similar. Although total health loss is highest for individuals in their 70s and 80s, rates of dementia health loss attributed to air pollution increase over age (Figure 18; bottom plot).
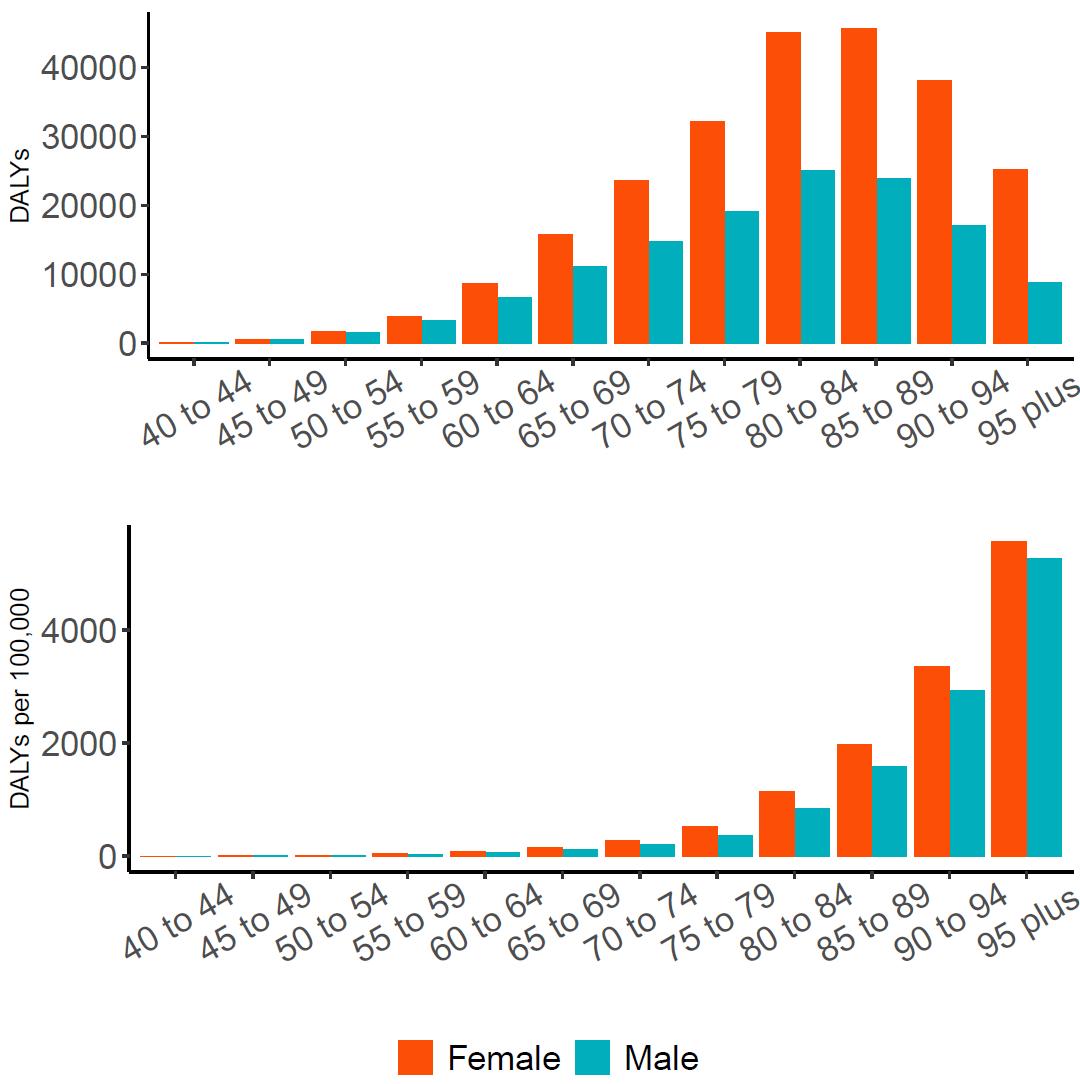
Figure 18. Dementia disability-adjusted life-years attributable to [risk factor] by age and sex, 2023.
5.1.8 Major takeaways
• Average ambient PM2.5 outdoor air pollution exposure in the United States has decreased between 1990 and 2023.
• Levels of exposure to PM2.5 in 2023 were highest in California and lowest in Hawaii. Exposure was similar across age groups and sexes because the exposure was to ambient pollution.
• Long-term PM2.5 exposure increases the risk of dementia by at least 14% if exposed to PM2.5 levels ranging from 4.5 to 26.9ug/m3 compared to a reference level of 2.0ug/m3 Risk increases steeply until PM2.5 levels reached 15ug/m3 and then only modestly for higher exposure levels.
• The fraction of dementia health loss that can be attributed to PM2.5 outdoor air pollution in 2023 by state ranged from 1.5% in Hawaii to 20.2% in California. In general, population attributable fractions were higher in western states.
• In 2023, 375,000 dementia disability-adjusted life years were attributed to PM2.5 outdoor air pollution in the United States, 242,000 for females and 133,000 for males.
• Although overall exposure to PM2.5 outdoor air pollution has decreased over time, some communities are more impacted than others, and average levels in US states still exceed the WHO recommendation of levels no higher than no more than 5ug/m3 .
• States should continue to support policies to reduce exposure to air pollution, and as possible, individuals should avoid prolonged exposure by staying indoors, using filtration systems, or wearing masks during periods of high air pollution such as from wildfires. If possible, individuals should choose walking or running routes farther from highways.
5.2 Alcohol
5.2.1 Exposure definition
Alcohol exposure is standardized into average consumption of pure alcohol in grams per day among individuals who have consumed any amount of alcohol over the past 12 months.
5.2.2 National-level and state-level exposure and disparities
Exposure to alcohol consumption, as defined above, varied significantly across the globe (Table 8) with a gap of 24.74 mean grams alcohol/day between Japan, with the highest exposure, and Tonga, with the lowest exposure. The United States, placing 80th in exposure, generally experiences relatively high alcohol exposure on the global scale. Within the United States Hawaii is a notable outlier, with a mean alcohol consumption 1.39 grams/day higher than the national average (Figure 19, Table 9). Alcohol consumption is higher in men than women (Figure 19).
Table 8. National ranking of exposure levels, 2023
Countries with highest alcohol consumption (grams/day)
1. Japan, 25.78
2. Republic of Korea, 21.28
3. Singapore 19.90
4. Chad 18.58
5. Pakistan, 17.44
6. India, 16.62
7. Burkina Faso, 16.61
8. Liberia, 16.35
9. Sao Tome and Principe, 15.30
10. Guinea-Bissau, 15.25
Countries with lowest alcohol consumption (grams/day)
195. Iran, 2.79
196. Iraq, 2.80
197. Yemen, 2.80
198. Afghanistan, 2.80
199. Azerbaijan, 2.62
200. Türkiye, 2.53
201. Bolivia, 1.91
202. Turkmenistan, 1.78
203. Syria, 1.17
204. Tonga, 1.04
Countries with alcohol consumption similar to the United States
79. Kenya, 7.78
80. United States, 7.73
81. Nauru, 7.73
Table 9. State ranking of exposure levels, 2023
Highest mean alcohol consumption (grams/day) Lowest mean alcohol consumption (grams/day)
1. Hawaii, 9.12
2. Nevada, 8.53
3. Vermont, 8.48
4. South Carolina, 8.45
5. Florida, 8.44
47. South Dakota, 7.20
48. Oklahoma, 7.16
49. New York, 7.07
50. New Jersey, 6.99
51. Maryland, 6.82
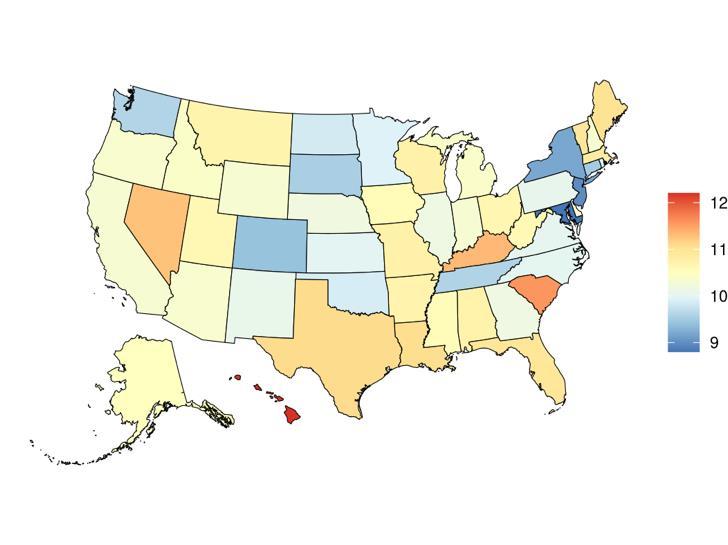
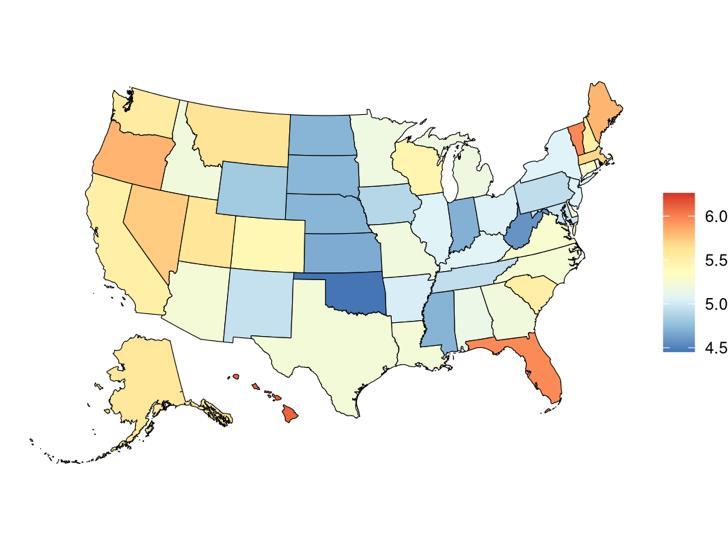
19. State-level mean alcohol consumption (g/day) in the United States, 2023 (males top, females bottom)
Temporal trends in alcohol consumption have remained relatively stable over the last two decades (Figure 20).
Figure
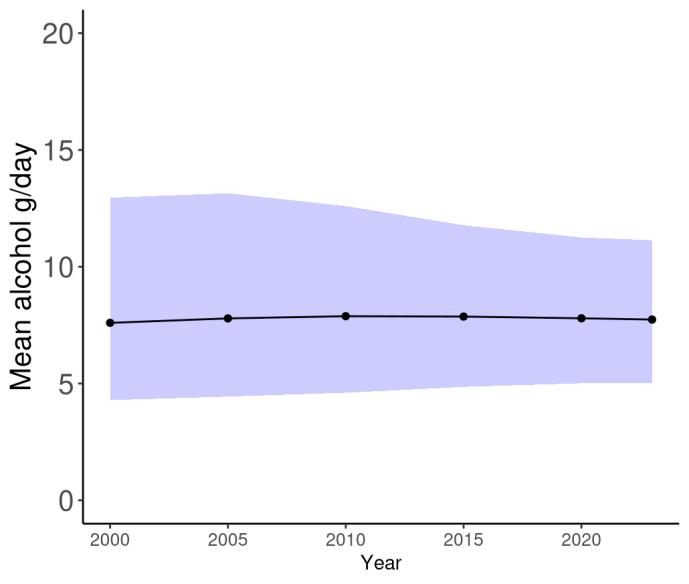
Figure 20. Temporal trends in alcohol consumption (g/day) in the United States, 2000-2023. Purple shading depicts 95% uncertainty intervals.
5.2.3 Data landscape
We included studies in which:
• Exposure is alcohol consumption, reported in dose-response
Drinks per day/week available to translate into grams of alcohol/day
We excluded studies in which:
▪ Exposure is a composite measure of beverages that can't be teased apart
▪ Study adjusts for alcohol and dementia; therefore, a direct relationship was not possible to ascertain
Using the criteria above, we identified 737 studies, and after screening included a total of 17 studies with relevant relative risk data for our analyses (Figure 21).

Figure 21. PRISMA diagram for alcohol systematic review showing inclusion and exclusion of studies at each systematic review stage.
Table 10 (next page) describes the studies among US populations included from the systematic review. Of the 17 studies identified for inclusion from the systematic review, four were conducted in the US. Studies mostly used self-reported alcohol consumption and subsequent dementia identification via physician diagnosis or medical records. Follow-up time ranged from 5-27 years. All studies estimated the relationship between alcohol consumption and all-cause dementia, with only one study also assessing the relationship with Alzheimer’s disease or vascular dementia. The remaining 13 non-US studies included in this analysis are described in the appendix.
Table 10. United States studies included from the systematic review
First author, year Study
Whitmer, 2005 Kaiser Permanente Dementia Study California, USA
Hwang, 2023 Framingham Heart Study Massachusetts, USA
Gao, 2011 IndianapolisIbadan Dementia Project
Bowen, 2012 Aging, Demographics, and Memory Study (ADAMS) (of the Health and Retirement Study (HRS)) United States
• = dementia subtype is an outcome available in the study.
5.2.4
Evidence score summaries
Using data from 17 studies, we did not find evidence of an association between alcohol consumption and increased risk of dementia. If anything, results show a slight protective effect of alcohol across the range of alcohol consumption identified in underlying studies (Figure 22). In Figure 22a, the solid blue line is below a relative risk of 1 for alcohol consumption greater than 0 grams/day but less than approximately 80 grams/day, which suggests a protective effect. At very high levels of consumption, equivalent to almost six standard drinks in the US (e.g., six 12-ounce beers) per day, risk of dementia starts to increase from our analysis. However, there is virtually no data available at this high level of exposure (gray dots in the plot). Because these results do not support increased dementia risk from alcohol consumption in the exposure range that would represent much of the population and has available data, we will not show population attributable fractions or attributable burden for dementia.
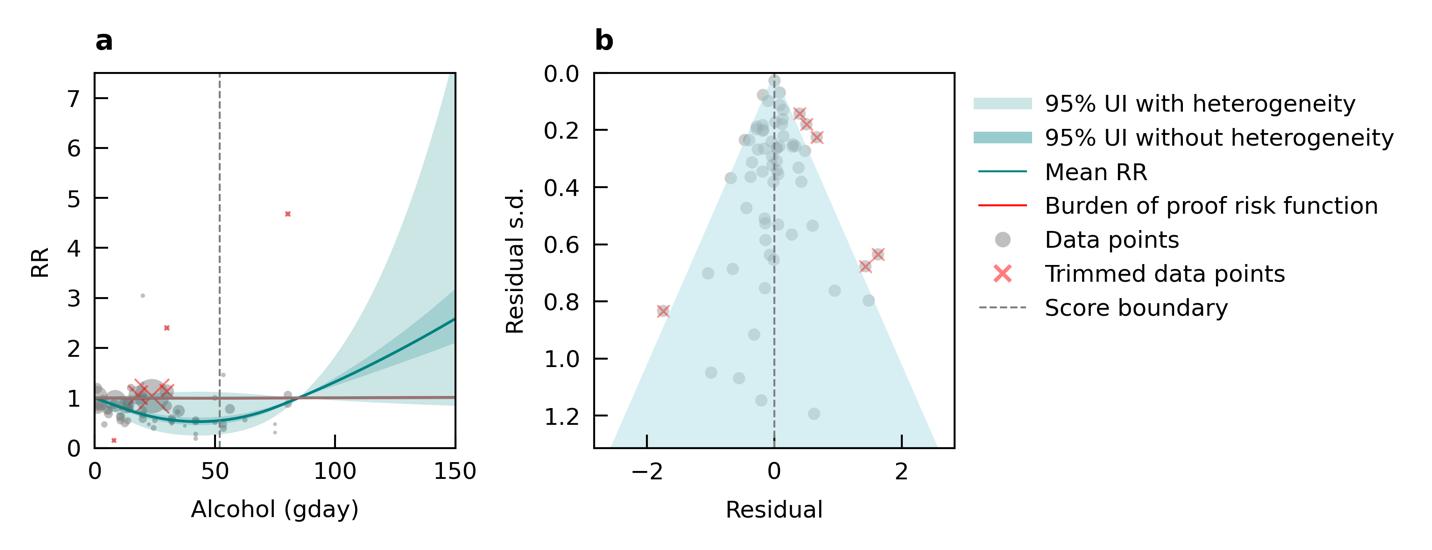
Figure 22. Alcohol use (grams/day) and dementia risk. a, Relative-risk (RR)function. The solid green line represents the mean RR at each exposure level. The dark green shaded area indicates the 95% UI without accounting for between-study heterogeneity, while the light green shaded area represents the 95% UI accounting for between-study heterogeneity. The size of the data point is proportional to the inverse of the s.d. of the effect estimates, where larger points indicate higher precision in the effect estimates. b, A modified funnel plot showing the residuals (relative to zero) on the x axis and the estimated s.d. (inclusive of between-study heterogeneity) on the y axis.
5.2.5 Population attributable fraction
We did not produce population attributable fractions because there was not an association between alcohol exposure and increased risk of dementia
5.2.6 Attributable burden
We did not produce attributable burden because there was not an association between alcohol exposure and increased risk of dementia.
5.2.7 Major takeaways
The main takeaway from this analysis is that there is not clear evidence for alcohol consumption as a risk factor for dementia. This aligns with results from the COSMIC consortium, a large consortium of dementia cohort studies that tracks exposure to different risk factors and dementia status. A 2022 analysis of 15 COSMIC cohorts found that complete abstinence from alcohol increased risk of dementia relative to alcohol consumption up to 60+ grams of pure alcohol per day, and no level of alcohol consumption up to 80 grams per day showed evidence of increasing dementia risk.17 However, the COSMIC study and our own analysis do not consider individuals with alcohol use disorder or even higher levels of drinking.
5.3 Body Mass Index
5.3.1 Exposure definition
Body mass index (BMI) is defined as the ratio of an individual's weight to height squared and is measured in units of kilograms divided by meters squared (kg/m2). The risk measured in the GBD is "high body-mass index". We model BMI as a continuous exposure. For reference, normal weight is defined as BMI between 18.5 to 24.9 kg/m2, overweight is BMI ≥ 25 kg/m2, and obese is BMI ≥ 30 kg/m2 .
5.3.2 National-level and state-level exposure and disparities
Exposure to BMI, as defined above, varied significantly across 204 countries and territories (Table 11) with a gap of 16.19kg/m2 between Puerto Rico, with the highest exposure, and Niger, with the lowest exposure. The United States, placing 17th in exposure, generally experiences high exposure on the global scale. Within the United States, West Virginia is a notable high outlier, with a mean BMI exposure 1.49 kg/m2 higher than the national average (Table 12) Utah is a low outlier, with a mean BMI exposure 2.16 kg/m2 lower than the national average.
Table 11. National ranking of exposure levels, 2023
Countries with highest mean BMI (kg/m2)
1. Puerto Rico, 24.70
2. Qatar, 24.00
3. Kuwait, 23.98
4. United Arab Emirates, 23.93
5. Monaco, 23.54
6. United States Virgin Islands, 23.51
7. Malta, 23.09
8. Greece, 23.04
9. Andorra, 22.83
10. Bermuda, 22.79
Countries with BMI similar to the United States
16. Cook Islands, 22.62
17. United States, 22.47
18. Moldova, 22.42
Table 12. State ranking of exposure levels, 2023
States with highest mean BMI (kg/m2)
1. West Virginia, 23.96
2. Maine, 23.53
3. New Hampshire, 23.37
4. Delaware, 23.12
5. Rhode Island, 23.08
Countries with lowest mean BMI (kg/m2)
195. Ethiopia, 10.31
196. Mali, 10.29
197. Burkina Faso, 10.25
198. South Sudan, 10.12
199. Uganda, 10.12
200. Mozambique, 10.12
201. Burundi, 10.03
202. Chad, 9.15
203. Somalia, 9.08
204. Niger, 8.51
States with lowest mean BMI (kg/m2)
47. Colorado, 21.84
48. Hawaii, 21.72
49. Alaska, 21.67
50. Idaho, 21.66
51. Utah, 20.31


23. State-level mean body mass index (kg/m2) in the United States, 2023 (males top, females bottom)
Figure
Body mass index levels in the United States have been steadily increasing (Figure 24) in the United States over the past three decades.

Figure 24. Both sex, all age, mean body mass index levels (kg/m2) in the United States (19902023). Purple shading denotes 95% uncertainty intervals.
5.3.3 Data landscape
We included studies in which:
• We included studies that used objective BMI measurements and those that used selfreported weight and height.
• We required studies to report at least three BMI categories, thus at least two risk estimates for dementia are reported (e.g. overweight vs normal weight and obese vs normal weight).
• More than 1 BMI category provided for effect measure
• Underweight, normal weight, overweight and obese exposure groups
We excluded studies in which:
• No dose-response BMI provided
• Only linear effect sizes
• We also exclude specific relative risk estimates that compare underweight to normal weight.
Using the criteria above, we identified 2,458 studies, and after screening included a total of 91 studies with relevant relative risk data for our analyses.
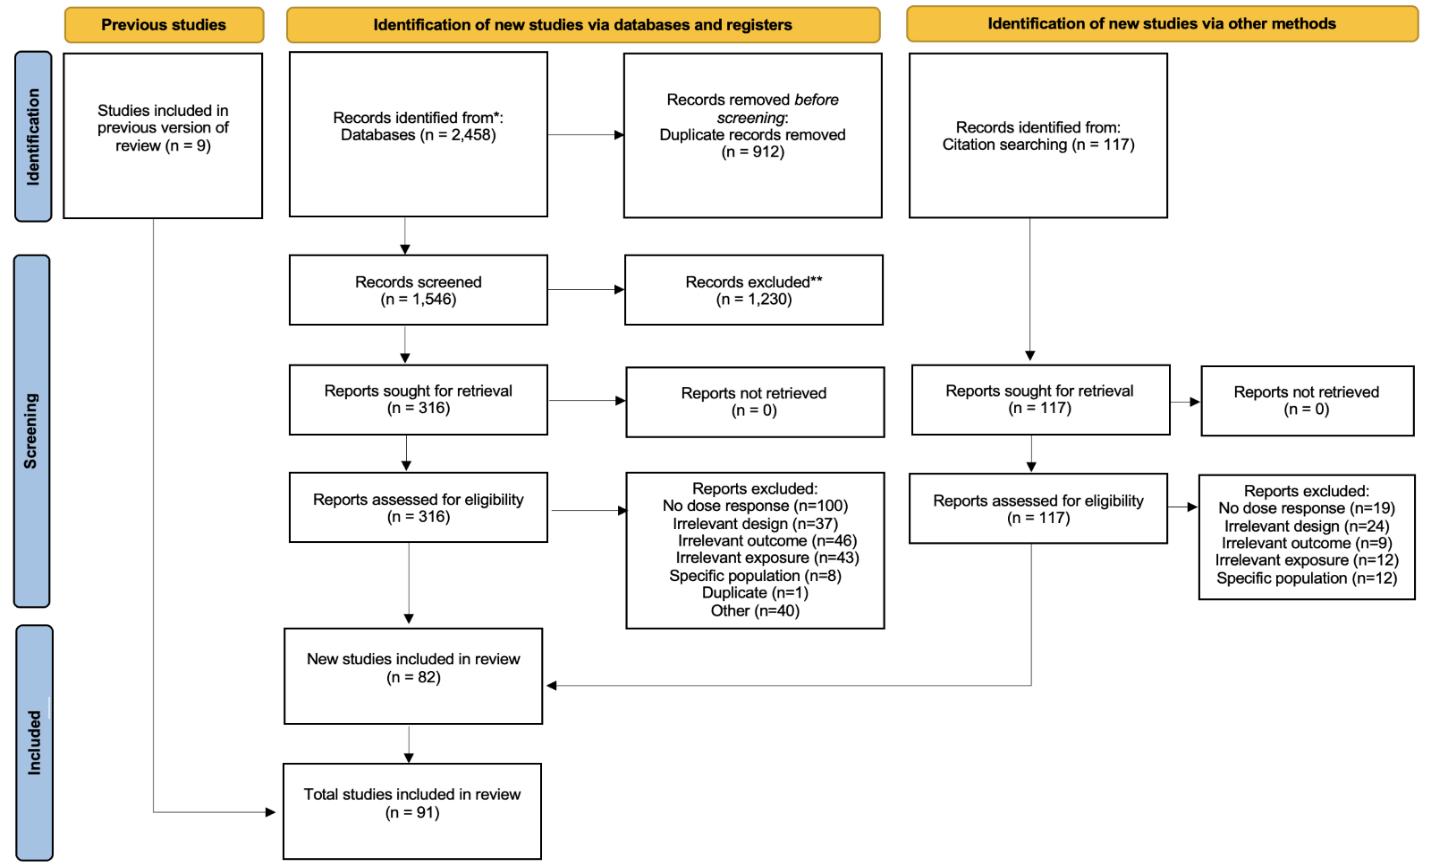
Figure 25. PRISMA diagram for body mass index systematic review showing inclusion and exclusion of studies at each systematic review stage.
Table 13 (next page) describes the studies among US populations included from the systematic review. Of the 91 studies identified for inclusion from the systematic review, 10 were conducted in the US. Studies mostly used physical measurements of height and weight and subsequent dementia identification via physician diagnosis or medical records. Follow-up time ranged from 4-36 years. Nearly all studies estimated the relationship between BMI and allcause dementia, with only two studies also assessing the relationship with Alzheimer’s disease. The remaining 81 non-US studies included in this analysis are described in the appendix.
Table 13. United States studies included from the systematic review
First author, year Study
Li, 2021 Framingham Offspring Cohort United States 3,632 ≥ 40 38
Whitmer, 2007 NA California, USA N/A ≥ 40 (36)
Li, 2018
Physical measurement Physician diagnosis
Physical measurement Medical records
Framingham Heart Study (FHS) Massachusetts, USA 2,383 ≥ 60 (30) Physical measurement Physician diagnosis
Beydoun, 2008 Baltimore Longitudinal Study of Aging Maryland, USA 2,322 ≥ 30 [23.4] Physical measurement Medical records
Alonso, 2009 ARIC United States 11,151 ≥ 47 (12.8) Physical measurement Medical records
Smagula, 2020
Monongahela–Youghiogheny Healthy Aging Team (MYHAT) United States 1,951 ≥ 65 10 Physical measurement Physician diagnosis
Fitzpatrick, 2009 Cardiovascular Health Study (CHS) United States 2,798 ≥ 50 (5.4) Physical measurement and selfreport Physician diagnosis
Luchsinger, 2007 The Washington HeightsInwood community of New York City New York, USA 893 (65.6) (5.1) Physical measurement Physician diagnosis
First author, year Study
West, 2009
Bell, 2017
Sacramento Area Latino Study on Aging (SALSA)
National Alzheimer's Coordinating Center (NACC) Uniform Data Set (UDS)
• = dementia subtype is an outcome available in study.
Of the included studies, the majority directly measured the BMI exposure via physical measurements of height and weight. Fewer studies gathered BMI from self-report or from disease registries (Table 14).
Table 14. Methods of exposure ascertainment used within included studies.
Method Exposure ascertainment
Physical measurement
Self-report
Disease registry
Calculated from measured height and weight
Calculated from self-reported height and weight in questionnaire
BMI recorded in a disease registry
5.3.4 Evidence score summaries
We did not find consistent evidence of an association between high body mass index and increased risk of dementia. Results indicate a non-significant U-shaped relationship, where the lowest risk occurred in the overweight BMI range (Figure 26). Because these results were not significant and did not increase dementia risk, we do not show population attributable fractions or attributable burden for dementia. In exploratory age-stratified analyses, an increased risk associated with high BMI (specifically, when BMI was above the severely obese threshold of 35 kg/m2) compared to normal weight was observed only in studies involving participants with a mean age under 55 years.
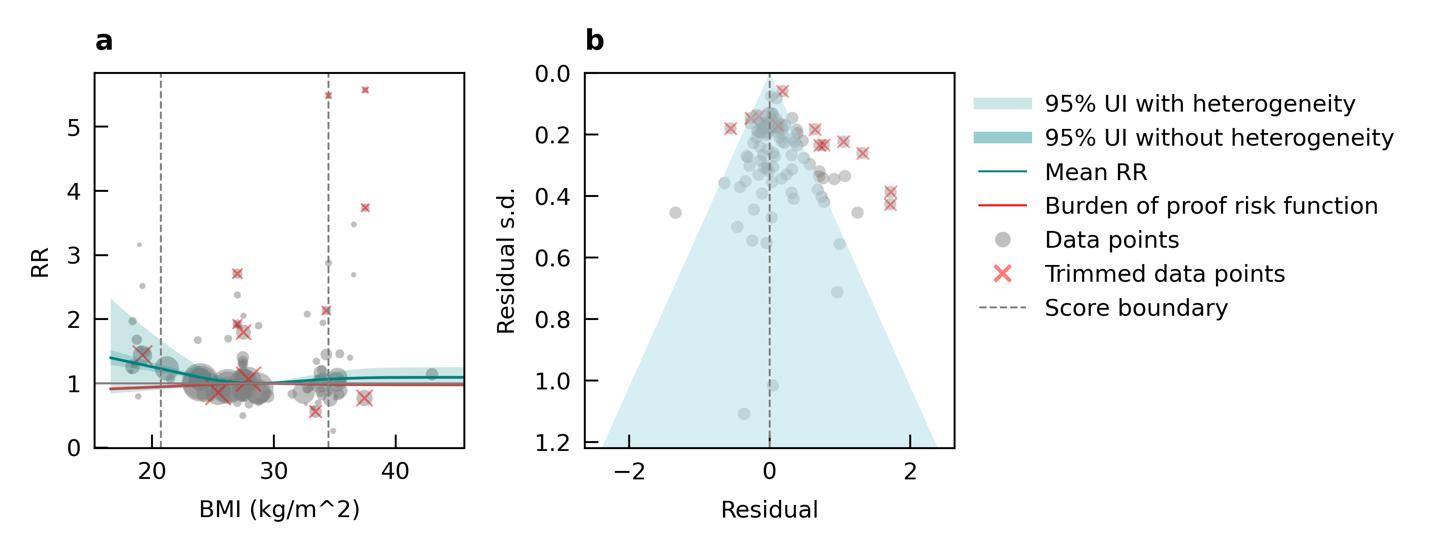
Figure 26. Body mass index (BMI) and dementia risk. a, Relative-risk (RR) function. The solid green line represents the mean RR at each exposure level. The dark green shaded area indicates the 95% UI without accounting for between-study heterogeneity, while the light green shaded area represents the 95% UI accounting for between-study heterogeneity. The size of the data point is proportional to the inverse of the s.d. of the effect estimates, where larger points indicate higher precision in the effect estimates. b, A modified funnel plot showing the residuals (relative to zero) on the x axis and the estimated s.d. (inclusive of between-study heterogeneity) on the y axis.
5.3.5 Population attributable fraction
We did not produce population attributable fractions because there was not a significant association between high BMI and increased risk of dementia.
5.3.6 Attributable burden
We did not produce population attributable fractions because there was not a significant association between high BMI and increased risk of dementia.
5.3.7 Major takeaways
Our analysis shows that there is not clear evidence that high BMI increases the risk of dementia, aligning with prior commentary on the controversial nature of this relationship.18 In a pooled analysis of 39 cohorts, higher BMI was associated with a decreased risk of dementia when the follow-up period was less than 20 years, but with an increased risk when follow-up exceeded 20 years.19 Higher BMI may negatively affect cognition, but this effect becomes evident only over long follow-up periods typically when BMI is measured in midlife. In contrast, the apparent protective effect observed in late life with shorter follow-ups may reflect reverse causation in which individuals with preclinical dementia experience weight loss and declining health. One limitation of our analysis is that we did not account for BMI trajectories or fluctuations across the lifespan, which may offer a more accurate prediction of dementia risk.
5.4 Depression
5.4.1 Exposure definition
Depression is a mood disorder marked by persistent sadness, diminished interest or pleasure in activities, and other symptoms that impair daily functioning. In the GBD study, depression includes both major depressive disorder (MDD) and dysthymia, a chronic but less severe form of depression.
5.4.2 National-level and state-level exposure and disparities
Depression prevalence, as defined above, varied significantly across the globe (Table 15) with a 4.31x higher prevalence in Syria with the highest depression prevalence, and Singapore, with the lowest depression prevalence. The United States, placing 21st in exposure, generally experiences relatively high levels of depression on the global scale. Within the United States, West Virginia is a notable outlier, with depression prevalence 1.26x higher than the national average (Figure 27, Table 16). For women, depression prevalence is highest in Washington state (Figure 27).
Table 15. National ranking of exposure levels, 2023
Countries with highest depression prevalence, all age, both sex
1. Syria, 0.082
2. United Kingdom, 0.070
3. Netherlands, 0.069
4. Ukraine, 0.065
5. Tunisia, 0.061
6. Lebanon, 0.058
7. Greece, 0.058
8. Switzerland, 0.057
9. Türkiye, 0.054
10. Mauritius, 0.053
Countries with lowest depression prevalence, all age, both sex
195. Mali, 0.027
196. Colombia, 0.026
197. Niger, 0.026
198. Cambodia, 0.026
199. Vietnam, 0.026
200. Romania, 0.026
201. Indonesia, 0.025
202. Laos, 0.024
203. Timor-Leste, 0.024
204. Singapore, 0.019
Countries with depression prevalence similar to the United States
20. Sweden, 0.050
21. United States, 0.049
22. Morocco, 0.049
Table 16. State ranking of exposure levels, 2023
Highest depression prevalence, all age, both sex Lowest depression prevalence, all age, both sex
1. West Virginia, 0.063
2. Washington, 0.060
3. Arkansas, 0.059
4. Colorado, 0.058
5. Tennessee, 0.057
47. Vermont, 0.0398
48. Iowa, 0.039
49. Alaska, 0.038
50. Hawaii, 0.037
51. North Dakota, 0.035
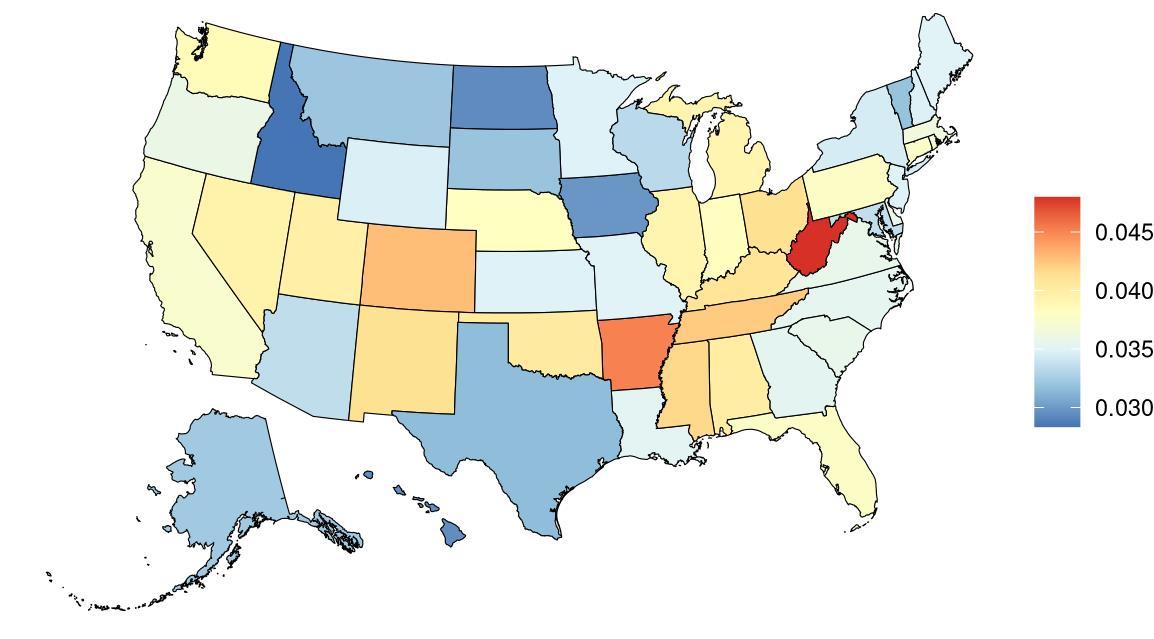
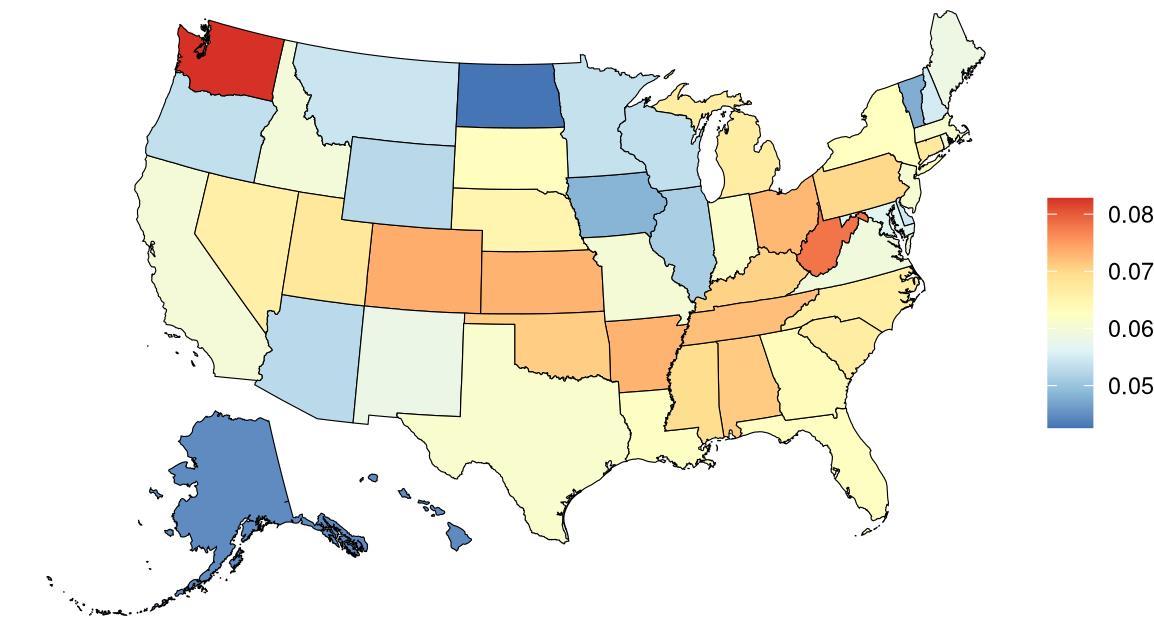
Figure 27. State-level depression prevalence in the United States, all ages, 2023 (males top, females bottom).
Prevalence of depression in the United States has been steadily increasing over the past few decades, with notable increases after 2010 (Figure 28).

Figure 28. Temporal trends in depression prevalence in the United States, 1990-2023. Purple shading depicts 95% uncertainty intervals.
5.4.3 Data landscape
We included studies in which depression is measured via:
• Standardized diagnostic tools (i.e. DSM- or ICD-based instruments), as considered eligible by the GBD mental disorders team
We excluded studies in which depression is:
• Self-reported depression or sadness on a survey
• Symptom screening scales not recognized as eligible diagnostic tools, as recommended by the GBD mental disorders team
• Registry data, which may overestimate case counts
• Non-representative samples (e.g., inpatient psychiatric case-control studies)
Using the criteria above, we identified 9,652 unique studies, and after screening included a total of 63 studies with relevant relative risk data for our analyses.

Figure 29. PRISMA diagram for depression systematic review showing inclusion and exclusion of studies at each systematic review stage.
Table 17 (next page) describes the studies among US populations included from the systematic review. Of the 63 studies identified for inclusion from the systematic review, 10 were conducted in the US. Studies mostly used self-reported diagnoses or physician reported diagnoses and subsequent dementia identification via physician diagnosis or medical records. Follow-up time ranged from 4.6-41 years. Nearly all studies estimated the relationship between depression and all-cause dementia, with only two studies also assessing the relationship with Alzheimer’s disease. The remaining 53 non-US studies included in this analysis are described in the appendix.
Table 17. United States studies included from the systematic review.
Of the studies included from the systematic review, the modelling process tested various case definitions of depression to be used in the main model. The most common depression cases excluded from the main model were registry data cases due to their potential for overestimation of depressive disorder cases (Table 18).
Table 18. Depression ascertainment methods in input studies and reasons for inclusion or exclusion in final analysis.
Type of depression cases
Cases ascertained from registry data
Cases from overlapping cohorts included elsewhere in the systematic review
Cases ascertained through self-report
Cases ascertained through symptombased scales
Number of studies captured Included in main model?
33 No
Reason
Cases identified through ICD codes in registry data are not included due to potential overestimation of true depressive disorder cases and lack of detail on how diagnoses were made or how rigorous the method was.
18 No Including studies with overlapping cohorts would duplicate their effect. When overlap was found, we selected the study with the longest follow-up, largest sample size, and/or most rigorous case ascertainment method.
11 No
10 No
Cases capturing other mood disorders
4 No
Major depressive disorder and/or dysthymia cases diagnosed through clinical assessment
11 Yes
Self-reported depression can introduce bias and is therefore excluded from GBD depression estimates and from this project.
Symptom-based scales are less rigorous than assessments by trained professionals and may overestimate case counts while underestimating severity, potentially distorting the link between depression and dementia.
Studies capturing both depression and other mood disorders (e.g., bipolar, psychotic depression) may confound the specific relationship between depression and dementia risk.
These studies use diagnostic assessments accepted by GBD and are considered most likely to identify true cases of depression. This is the rigorous approach used for this project.
5.4.4 Evidence score summaries
We identified a statistically significant association between depression diagnosis and dementia risk across 11 studies (Figure 30). Compared to individuals without a diagnosed depressive disorder (including major depressive disorder or dysthymia), those with a diagnosis had a 60% higher risk of developing dementia. Under the most conservative estimate of excess risk, individuals with a depression diagnosis experienced an average 26% increase in dementia risk. The associated ROS was 0.12, reflecting a two-star relationship. As shown in the funnel plot below (Figure 30), substantial heterogeneity was found across studies, leading to wide
confidence intervals and considerable uncertainty in the exact magnitude of the effect of depression on dementia.

Figure 30. Depression and dementia risk. The figure shows a funnel plot with the relative risks (RR) on the x axis and standard error of the log(RR) on the y axis. The solid green line represents the mean RR. The dark green shaded area indicates the 95% UI without accounting for betweenstudy heterogeneity, while the light green shaded area represents the 95% UI accounting for between-study heterogeneity.
5.4.5 Sub-analyses
When we separately analyzed six studies which exclusively examined the effect of major depressive disorder (MDD) diagnosis, excluding those interested in dysthymia and combined depressive disorders (Figure 31), a lower and non-significant average risk was found (RR = 1.43, 95% CI: 0.91-2.26; ROS = -0.01), corresponding to a one-star relationship. This is likely due to the substantial heterogeneity across included studies, paired with reduced statistical power due to the inclusion of fewer studies. There was insufficient data to run additional sub-analyses by age group, sex, or dementia subtype.
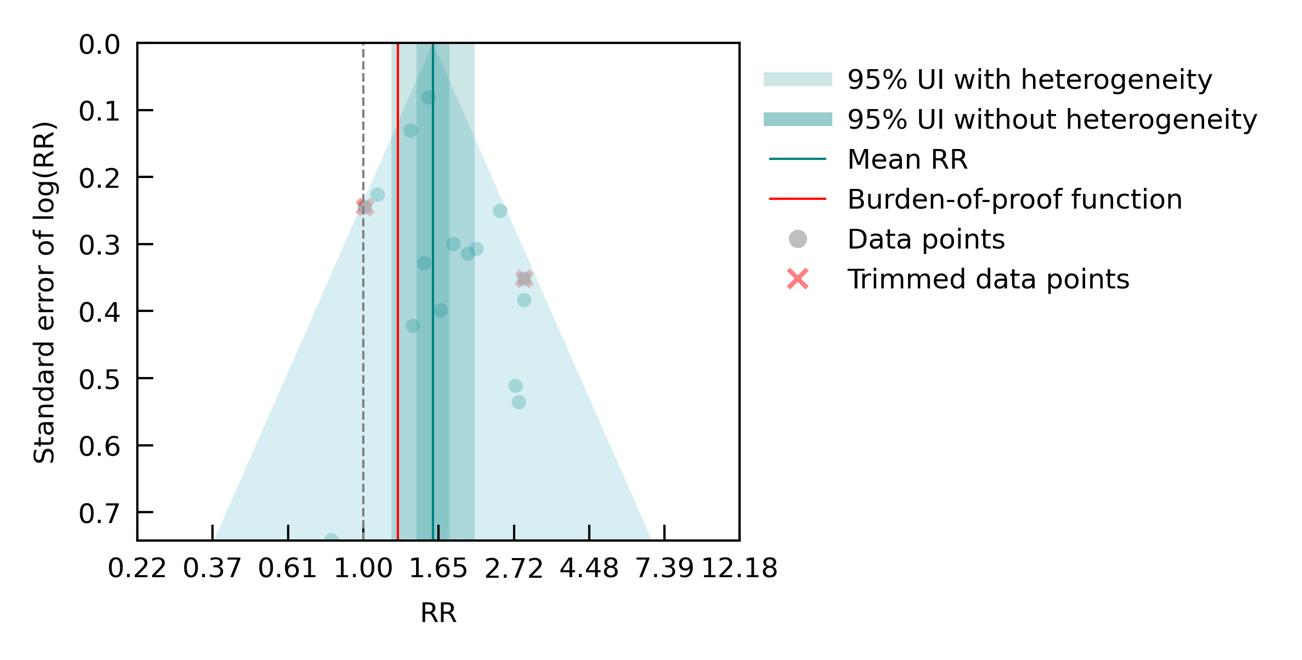
Figure 31. Major depression disorder (MDD) and dementia risk. The figure shows a funnel plot with the relative risks (RR) on the x axis and standard error of the log(RR) on the y axis. The solid green line represents the mean RR. The dark green shaded area indicates the 95% UI without accounting for between-study heterogeneity, while the light green shaded area represents the 95% UI accounting for between-study heterogeneity.
5.4.6 Population attributable fraction
The fraction of dementia health loss that can be attributed to depression ranges from 2% in North Dakota to 3.3% in Washington and West Virginia. States in the Appalachian region and parts of the rural West generally show higher dementia burden attributable to depression. This may reflect higher prevalence of untreated or chronic depression, limited access to mental health care, and overlapping social determinants such as poverty, isolation, and lower educational attainment in these areas.

Figure 32. State-level population attributable fractions for dementia burden due to depression, 2023, both sex, all age
Attributable fraction of dementia health loss due to depression overall in the US has remained relatively stable in the US from 1990 to 2023, with a slight upward shift starting around 2015.
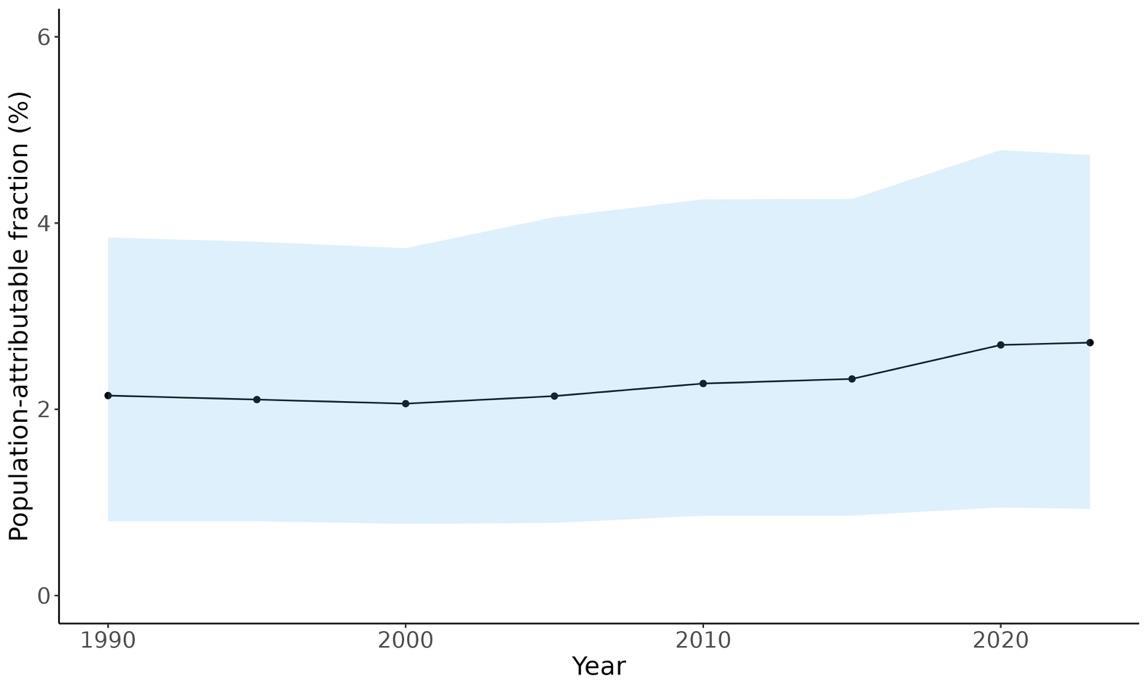
Figure 33. Temporal trends in population attributable fractions for dementia burden due to depression, 1990-2023.
In 2023, the attributable fraction of dementia health loss due to depression was consistently higher among females than males across all age groups. The highest PAFs were observed in younger age groups, with a gradual decline through older ages. This pattern suggests that
depression in midlife may have a more pronounced role in later-life dementia burden, particularly for women.
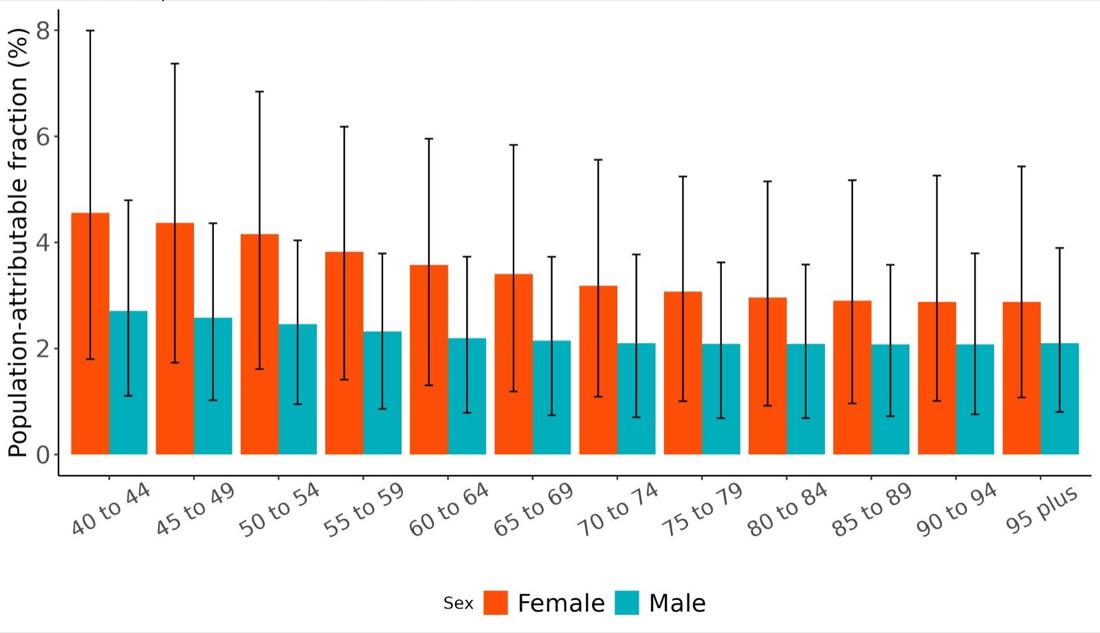
Figure 34. Population attributable fractions for dementia burden due to depression by age and sex, 2023.
5.4.7 Attributable burden
Attributable burden represents the amount of dementia health loss that could be avoided if no one in the population had clinical depression. It combines information about the relationship between depression and dementia, the number of people living with or dying from dementia, and the exposure to depression in a given geography. In 2023, approximately 94,386 dementia disability-adjusted life years were attributed to depression, 68,655 for females and 25,731 for males (Figure 35).
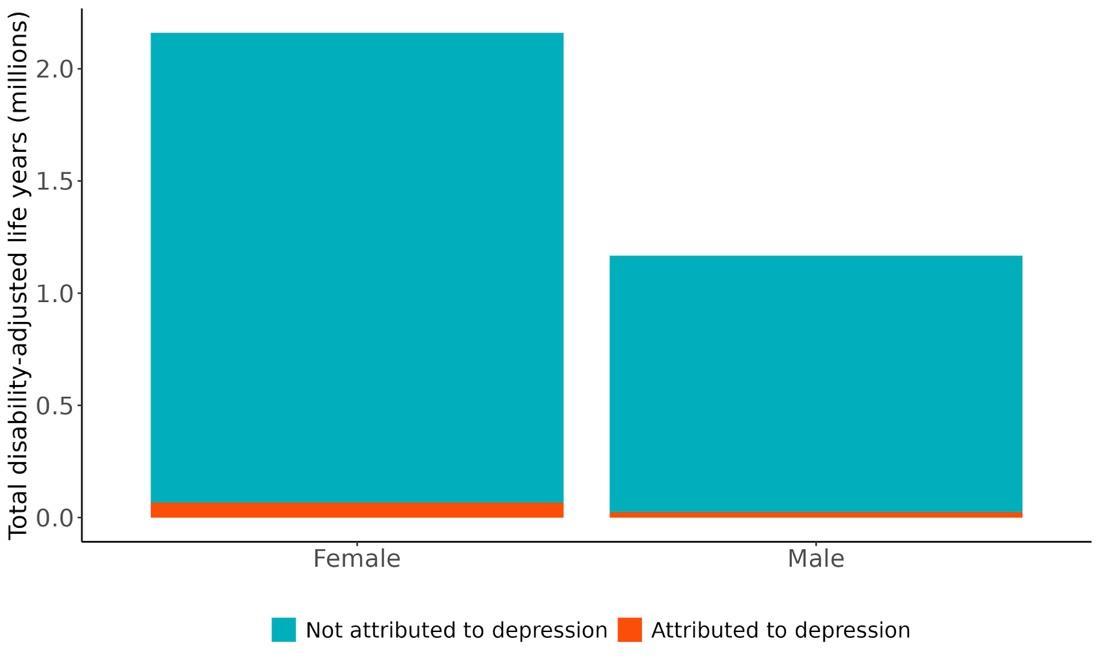
Figure 35. Proportion of dementia burden attributed to depression by sex, 2023.
The rate of dementia-related health loss attributable to depression varied by state, with the highest rates observed in Pennsylvania (approximately 38.4 DALYs per 100,000 people), followed by West Virginia and Florida (Figure 36). These states tend to have a higher prevalence of depressive disorders. In contrast, the lowest rates were seen in Alaska (15 DALYs per 100,000 people), the District of Columbia, and Utah. These patterns reflect differences in underlying depression prevalence and may also be informed by differences in socioeconomic factors and access to mental health care across states, as well as differences in population age structure.
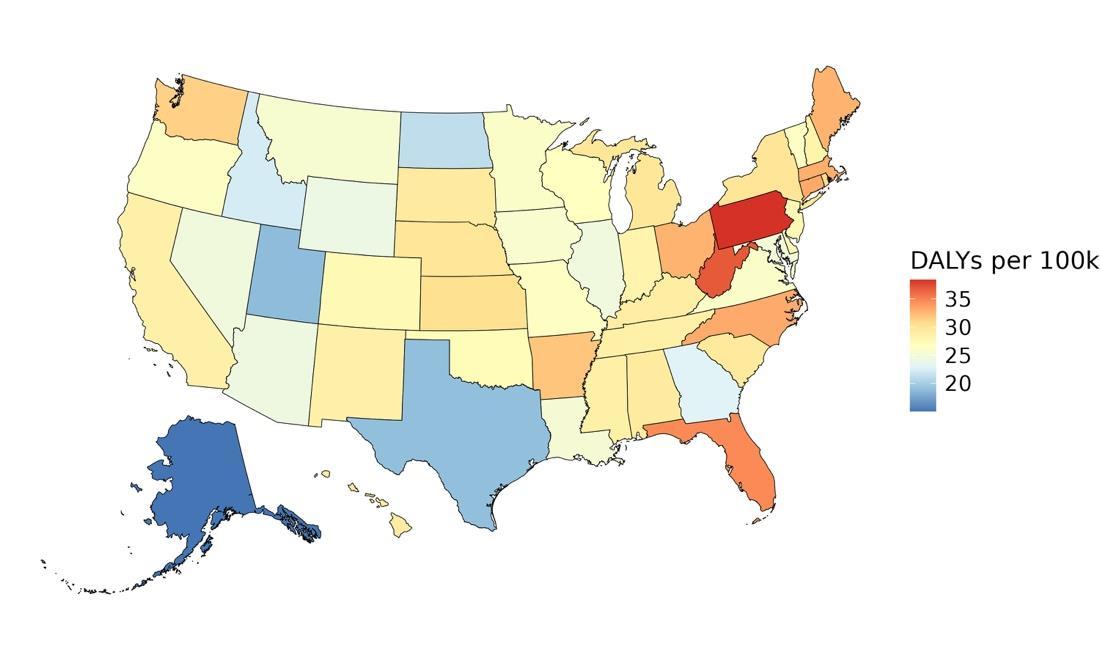
Figure 36. State-level dementia disability-adjusted life-years lost attributable to depression, 2023, both sex, all age.
As reflected in PAF trends, the number of disability-adjusted life years (DALYs) due to dementia attributable to depression was significantly higher among females than males across all age groups in 2023 (Figure 37). Unlike PAFs, the highest number of DALYs attributable to depression was observed in older age groups, peaking among 80-84-year-olds with approximately 12,852 DALYs for females and 4,956 for males, followed by a gradual decline in the oldest age groups. This likely reflects the combined effects of higher dementia burden in late life and shrinking population size at oldest ages.
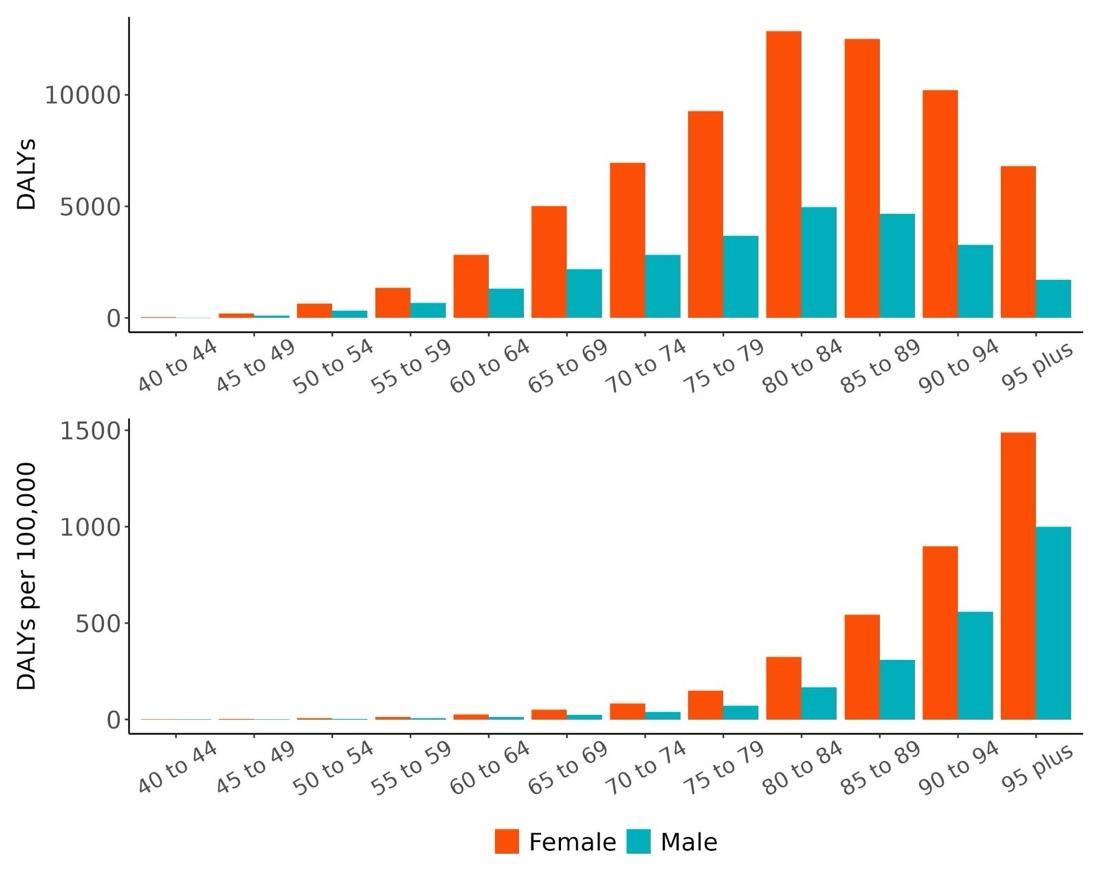
Figure 37. Dementia disability-adjusted life-years lost attributable to depression by age and sex, 2023.
5.4.8
Major takeaways
• Depression is a significant and consistent risk factor for dementia, with individuals diagnosed with depressive disorders experiencing up to a 60% higher risk of developing dementia compared to those without a diagnosis.
• The most conservative estimate still indicates a 27% increased risk of dementia among individuals diagnosed with a depressive disorder, corresponding to a two-star strength of evidence.
• When sub-setting to studies of major depressive disorder (MDD) alone, the average risk was lower and not statistically significant.
• The fraction of dementia health loss attributable to depression in 2023 ranged from 2% in North Dakota to 3.3% in Washington and West Virginia. States with high PAFs were
concentrated in the Appalachian region and the rural West, likely reflecting higher depression prevalence and reduced access to mental health care.
• In 2023, approximately 94,000 dementia disability-adjusted life years were attributed to depression in the United States – 69,000 among females and 25,000 among males.
• Although attributable fractions were highest in younger age groups, the total number of dementia DALYs attributable to depression peaked in the 80-84 age group and was consistently higher among females across all age groups.
5.5 Education
5.5.1 Exposure definition
Education is defined based on the number of years of formal schooling completed. Because educational categories (e.g., primary, secondary, or high school) can represent different durations across countries, we use the International Standard Classification of Education (ISCED)20 framework to harmonize these categories and enable cross-country comparisons based on comparable years of education.
5.5.2 National-level and state-level exposure and disparities
Exposure to education, as defined above, varied significantly across the globe (Table 19) with a gap of 13.27 mean years between Switzerland, with the highest mean education, and Niger, with the lowest mean levels. The United States, placing 21st in mean education years, experiences relatively high mean years education on the global scale. Within the United States the District of Columbia is a notable outlier, with an additional 1.44 years of education compared to the national average (Figure 38, Table 20).
Table 19. National ranking of exposure levels, 2023.
Countries with highest mean years of education, all age, both sex
1. Switzerland, 15.12
2. Denmark, 14.21
3. Sweden, 14.18
4. Monaco, 14.10
5. Norway, 13.92
6. Finland, 13.91
7. Netherlands, 13.91
8. Iceland, 13.81
9. Ireland, 13.73
10. United Kingdom, 13.68
Countries with education years similar to the United States
20. Belgium, 13.20
21. United States, 13.18
22. Estonia, 13.17
Table 20. State ranking of exposure levels, 2023.
Highest mean years of education, all age, both sex
1. District of Columbia 14.62
2. Massachusetts, 13.87
3. Minnesota, 13.68
4. Connecticut, 13.68
5. Vermont, 13.66
Countries with lowest mean years of education, all age, both sex
195. Guinea-Bissau, 4.03
196. Senegal, 3.94
197. Ethiopia, 3.83
198. Somalia, 3.73
199. Guinea, 3.56
200. Afghanistan, 2.94
201. Mali, 2.82
202. Burkina Faso, 2.64
203. Chad, 2.64
204. Niger, 1.84
Lowest mean years of education, all age, both sex
47. Arkansas, 12.80
48. Texas, 12.80
49. Mississippi, 12.80
50. Nevada, 12.78
51. West Virginia, 12.71

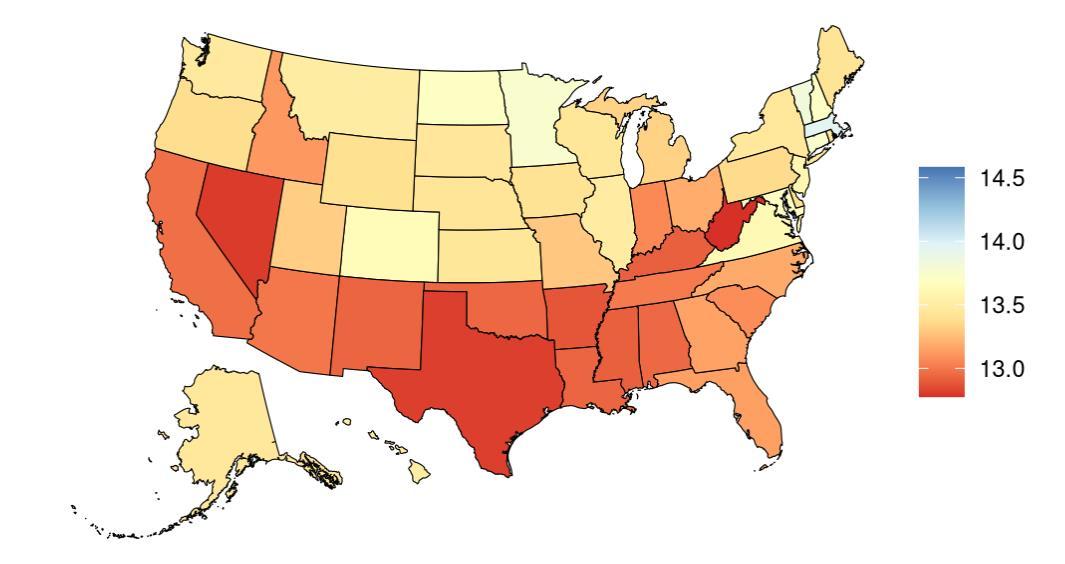
Figure 38. State-level mean education years in the United States, all age, 2023 (males top, females bottom). Note that it is difficult to see the location (D.C.) with the highest mean years of education (dark blue color).
Overall years of educational attainment years in the United States has increased over time (Figure 39).

Figure 39. Temporal trends in mean education years in the United States, 1990-2023. Purple shading depicts 95% uncertainty intervals.
5.5.3 Data landscape
We included studies which reported education as:
• Years of education (>10, 1-5, etc.)
• Level of education (primary completed, some secondary, graduate degree)
• If the study uses illiteracy and literacy (rare) we use 0 years for illiterate, and a range of 1-18 for literate.
We excluded studies which reported education as:
• Different education exposures (e.g. general vs. vocational) with the same number of years
• Education exposures with overlapping years of education.
• A highly specific population with known dementia-related risk (e.g., cohorts treated for hypertension)
• A continuous measure reporting the effect per additional year of education (i.e., not categorical dose-response)
Using the criteria above, we identified 4,747 unique studies, and after screening included a total of 60 studies with relevant relative risk data for our analyses.
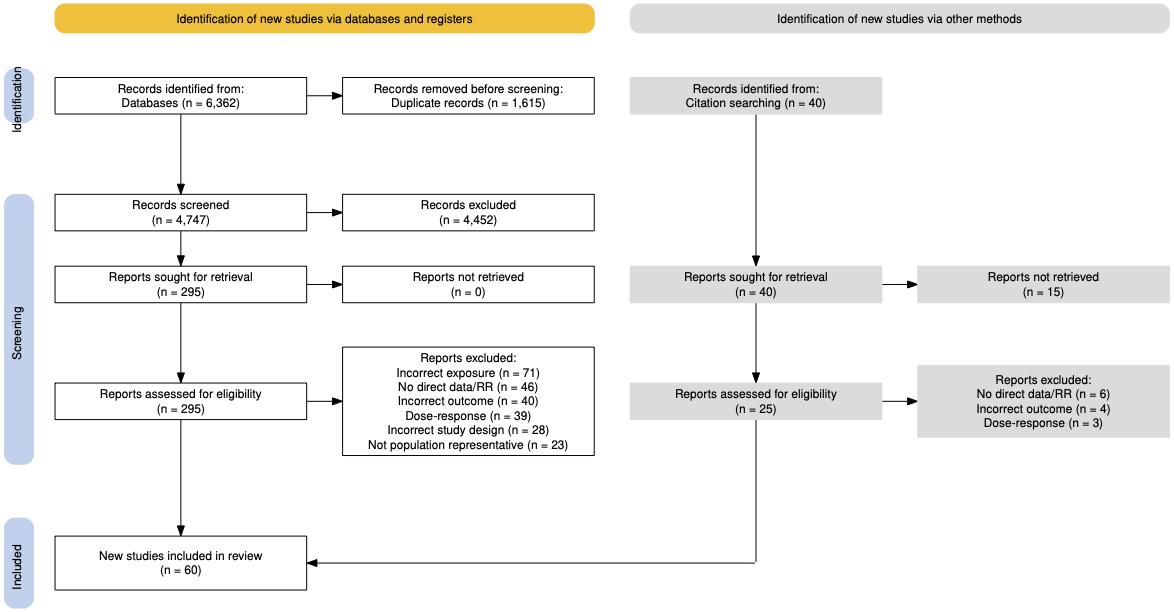
Figure 40. PRISMA diagram for education systematic review showing inclusion and exclusion of studies at each systematic review stage.
Table 21 (next page) describes the studies among US populations included from the systematic review. Of the 60 studies identified for inclusion from the systematic review, 9 were conducted in the US. All studies ascertained education via questionnaire and subsequent dementia identification via physician diagnosis or medical records. Follow-up time ranged from 6-21 years. Six studies estimated the relationship between education and all-cause dementia, while three studies assessed the relationship with Alzheimer’s disease.
Table 21. United States studies included from the systematic review.
First author, year
Kaup, 2013 Health ABC
Jack Jr, 2021 Mayo Clinic Study of Aging
Du, 2022
Antihypertensive and Lipid-Lowering Treatment to Prevent Heart Attack Trial (ALLHAT)
Gilsanz, 2021 Kaiser Permanente Northern California (KPNC)
Cobb, 1995
Liu, 2023
Chunyu, 2020
Kuller, 2003
2019
Atherosclerosis
Framingham Offspring Cohort Study
Cardiovascular Health Cognition Study
Memory and Aging Project
= dementia subtype is an outcome available in study.
Of the 61 included studies, 23 studies used ISCED20 (United States example in Figure 41) to translate and extract years of education exposure. Five of the 23 ISCED studies were translated from the United States and the remainder were from Finland, France, China, Sweden, Indonesia, Singapore, Denmark and Spain (Table 22).
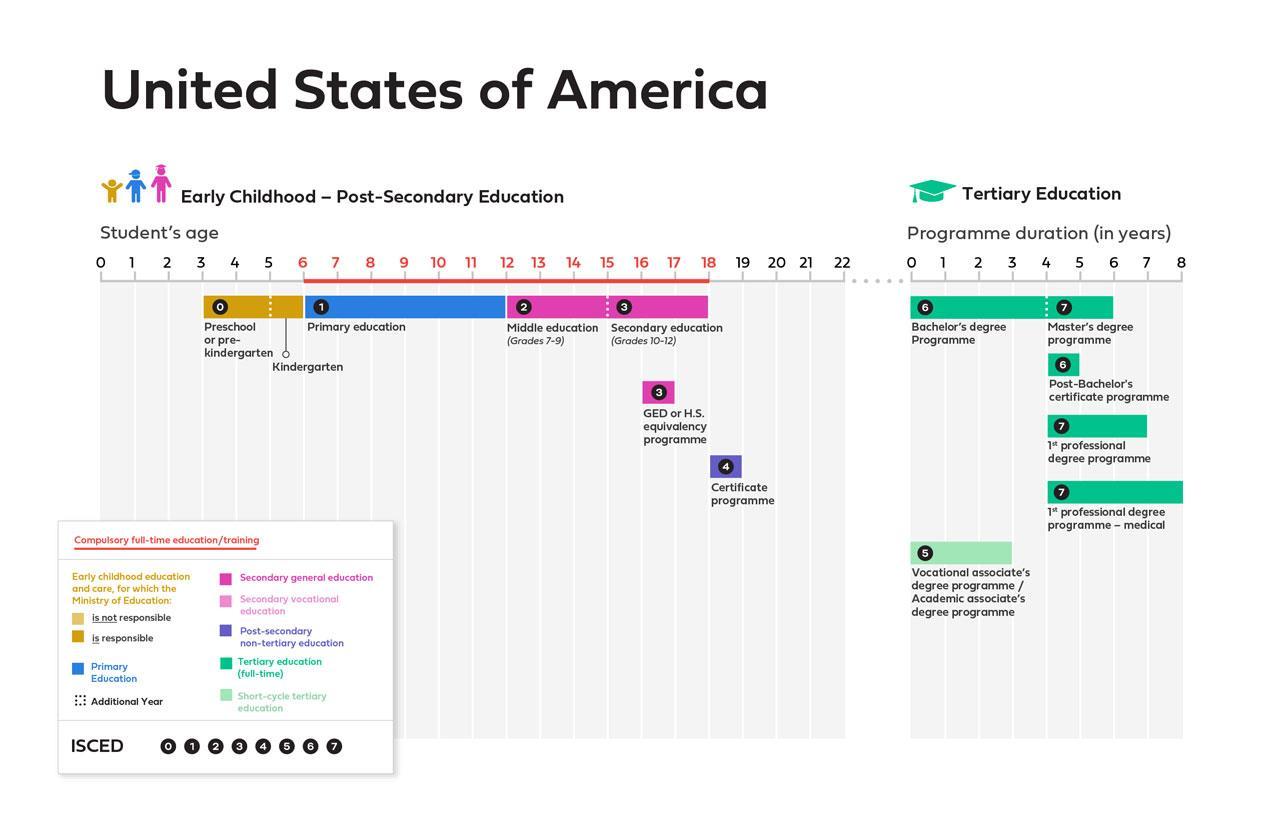
Figure 41. United States example of ISCED diagram used to map number of years of education, based on reported education years
Table 22. ISCED location coverage within included studies
First author, year
ISCED location mapped in extracted data
Kivimäki, 2020 Finland
Letellier, 2021 France
Kaup, 2013 United States
Xu, 2015 China
Dekhtyar, 2015 Sweden
Du, 2022 United States
Ren, 2021 China
Azwar, 2021 Indonesia
Xu, 2022 China
Hasselgren, 2018 Sweden
Ho, 2015 Singapore
Gilsanz, 2021 United States
Cobb, 1995
Liu, 2023
Rusmaully, 2017
United States
United States
United Kingdom
Chunyu, 2020 United States
Boo, 2021 Republic of Korea
Tomata, 2020 Sweden
First author, year
Ng, 2021
Qi, 2022
Hegelund, 2021
Seblova, 2021
Bermejo-Parejo, 2008
5.5.4
ISCED location mapped in extracted data
Singapore
United Kingdom
Denmark
Sweden
Spain
Evidence score summaries
We identified a statistically significant association between educational attainment and dementia risk across 48 studies, with the highest risk observed among individuals with little or no formal education (Figure 42). Relative to individuals with 18 years of education, those with 12, 6, and 2 years of education had, on average, a 23%, 46%, and 111% higher risk of developing dementia, respectively. Using a conservative estimate, individuals with education levels between the 15th and 85th percentiles (2.6-16.05 years) experienced an average 22% increase in dementia risk. The associated ROS was 0.19, reflecting a three-star relationship.
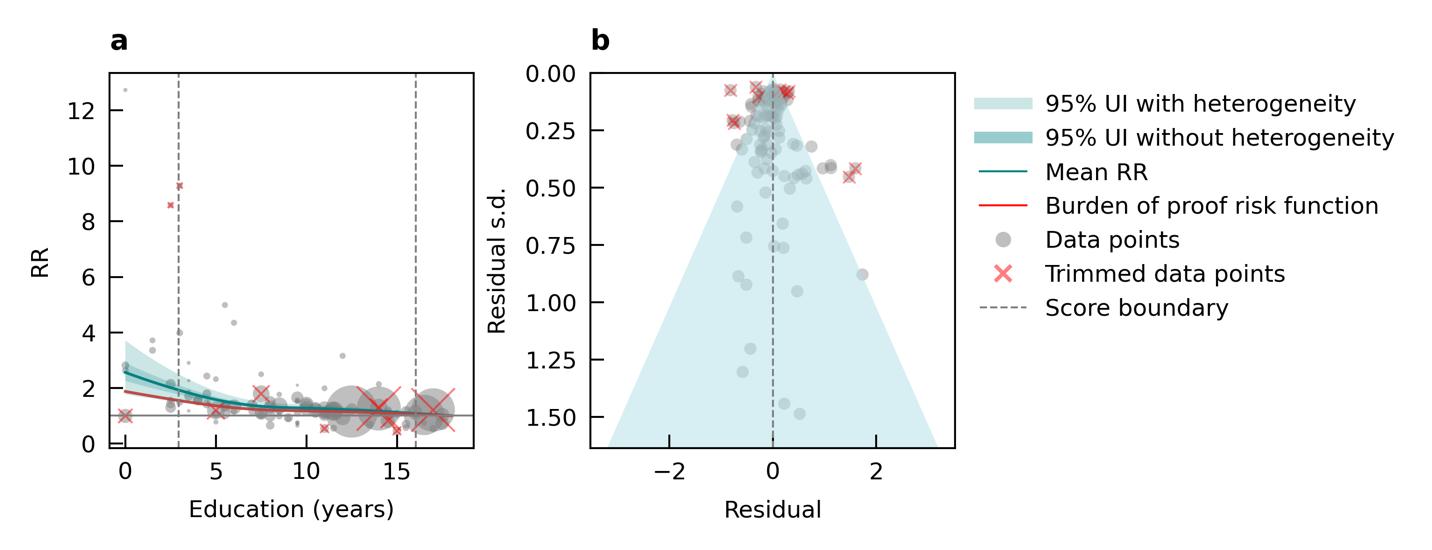
Figure 42. Education and dementia risk. a, Relative-risk (RR)function. The solid green line represents the mean RR at each exposure level. The dark green shaded area indicates the 95% UI without accounting for between-study heterogeneity, while the light green shaded area represents the 95% UI accounting for between-study heterogeneity. The size of the data point is proportional to the inverse of the s.d. of the effect estimates, where larger points indicate higher precision in the effect estimates. b, A modified funnel plot showing the residuals (relative to zero) on the x axis and the estimated s.d. (inclusive of between-study heterogeneity) on the y axis.
5.5.5 Sub- analyses
Sub-analyses revealed a consistent protective association between higher educational attainment and reduced dementia risk across key population subgroups and dementia types (Table 23). Among sex-specific models, both males and females with higher education
experienced an average 19% reduction in dementia risk, with corresponding ROS of 0.13 and 0.20, respectively. The strongest protective association was observed in studies where participants were aged 65 or older at baseline, with a 45% average risk reduction and an ROS of 0.17. In contrast, studies recruiting participants with a mean age less than 65 years at baseline showed no significant association (ROS: -0.08). Dementia subtype-specific analyses indicated a meaningful protective effect for Alzheimer’s disease (18% average reduction; ROS: 0.23) but a more uncertain relationship for vascular dementia, where the average risk reduction was 7% and the ROS was 0.02. These results reinforce the main finding that higher education is associated with lower dementia risk, particularly for Alzheimer’s disease and among women.
Table 23. Summary of sub-analyses conducted assessing the relationship between education and dementia incidence.
Conversative.
5.5.6 Population attributable fractions
The fraction of dementia health loss attributable to low educational attainment ranges from 16.5% in Colorado to 19.3% in Kentucky (Figure 43). States with the highest attributable fractions are concentrated in the southeastern and south-central US, particularly Kentucky, West Virginia, and Mississippi. These elevated burdens likely reflect persistent regional disparities in educational access and attainment. In contrast, lower fractions are seen in western and northeastern states such as Colorado, Utah, and Washington, where higher average education levels and better access to resources may offer some protective effect. The consistently high percentage of dementia burden linked to low education across states
highlights the powerful role education and connected social determinants play in shaping cognitive health outcomes in the United States.

Figure 43. State-level population attributable fractions for dementia burden due to low education, 2023, both sex, all age.
The attributable fraction of dementia health loss due to low educational attainment overall in the US has decreased consistently over time in the US, from approximately 21% in 1990 to 17.7% in 2023 (Figure 44). This steady decline reflects generational improvements in educational access and attainment. As younger, more educated cohorts age into higher dementia-risk groups, the national burden attributable to low education has decreased.

Figure 44. Temporal trends in population attributable fractions for dementia burden due to low education, 1990-2023.
In 2023, the population-attributable fraction of dementia health loss attributable to low educational attainment was relatively consistent across age groups, with a slight upward trend in older ages (Figure 45). Slightly lower PAFs among younger groups suggest generational improvements in education, as more recent cohorts have benefited from expanded access to schooling. In addition, females were found to have slightly lower PAFs than males in younger age groups but slightly higher PAFs in older ages, starting in the 65-69 age group. This shift likely reflects historical gender disparities in educational access, with older female cohorts having had fewer opportunities, while younger cohorts appear to have largely closed this gap.
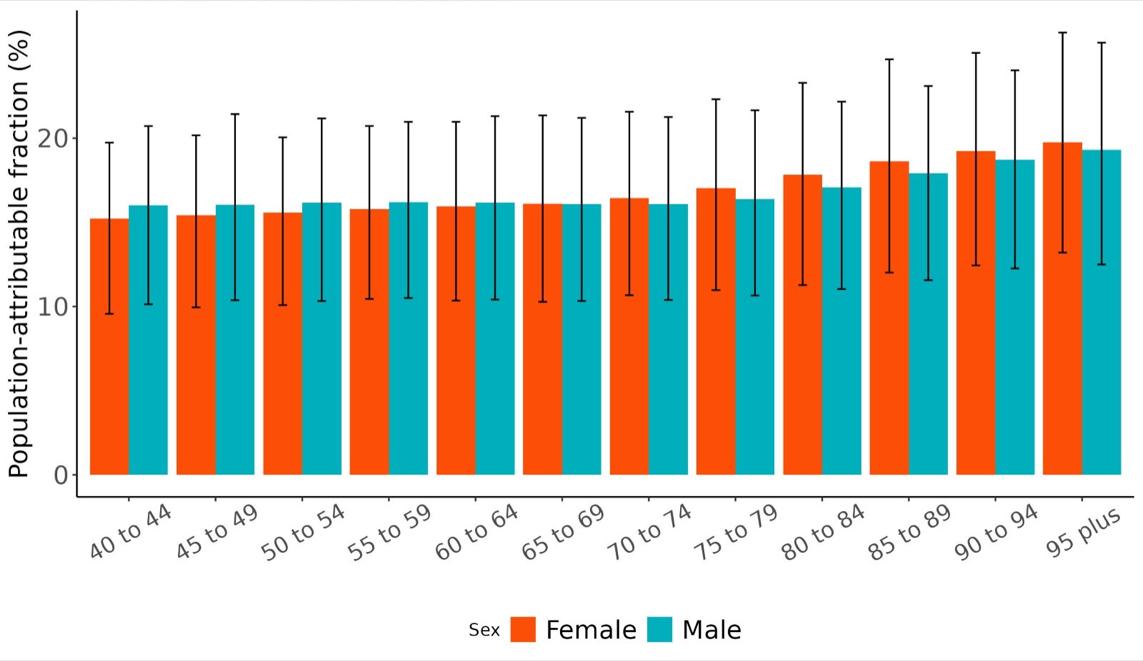
45. Population attributable fractions for dementia burden due to low education by age and sex, 2023.
5.5.7 Attributable burden
Attributable burden represents the amount of dementia health loss that could be avoided if low education was decreased to a theoretical minimum level – in GBD standards, this means if everyone in the population had 18 years of education. Attributable burden combines information about the relationship between low education and dementia risk, the number of people living with or dying from dementia, and the exposure to low education in a given geography. In 2023, approximately 584,720 dementia disability-adjusted life years were attributed to low education, 385,602 for females and 199,118 for males (Figure 46).
Figure
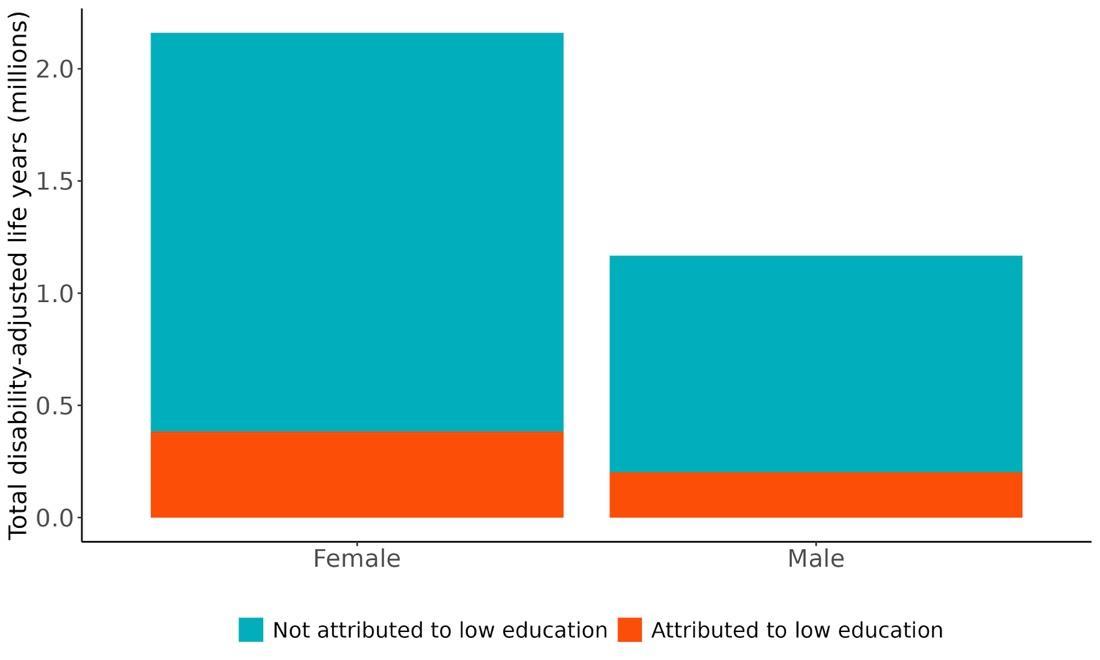
Figure 46. Proportion of dementia burden attributed to education by sex, 2023.
The rate of dementia-related health loss attributable to low education varied by state, with the highest rates observed in Hawaii (approximately 229.5 DALYs per 100,000 people), followed by Pennsylvania and Maine (Figure 47). These high rates may reflect both a substantial PAF and a high underlying burden of dementia in these states. In contrast, the lowest rates were seen in Utah (98.9 DALYs per 100k), Alaska, and the District of Columbia. This suggests a combination of lower dementia prevalence and/or lower prevalence of low education in these populations, as well as differences in population age structure.
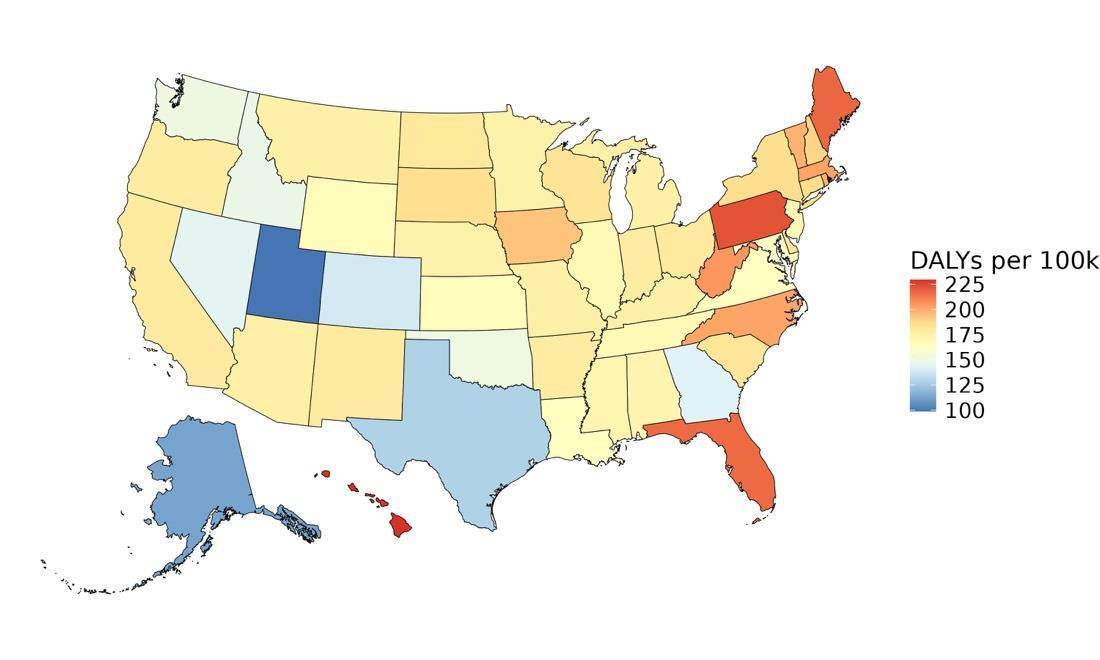
Figure 47. State-level dementia disability-adjusted life-years lost attributable to low education, 2023, both sex, all age.
The number of disability-adjusted life years (DALYs) lost due to dementia attributable to low education reflect a larger age and sex disparity than PAF trends did (Figure 48). Unlike trends in PAFs, where PAFs stayed relatively consistent across age and sex, the number of DALYs raises significantly in older ages. Unlike PAFs, the highest number of DALYs attributable to depression was observed in older age groups, peaking at 85-89 for females and 80-84 for males, with approximately 76,280 DALYs for females and 38,471 for males, followed by a gradual decline in the oldest age groups. This likely reflects the combined effects of higher dementia burden in late life and shrinking population size at oldest ages.
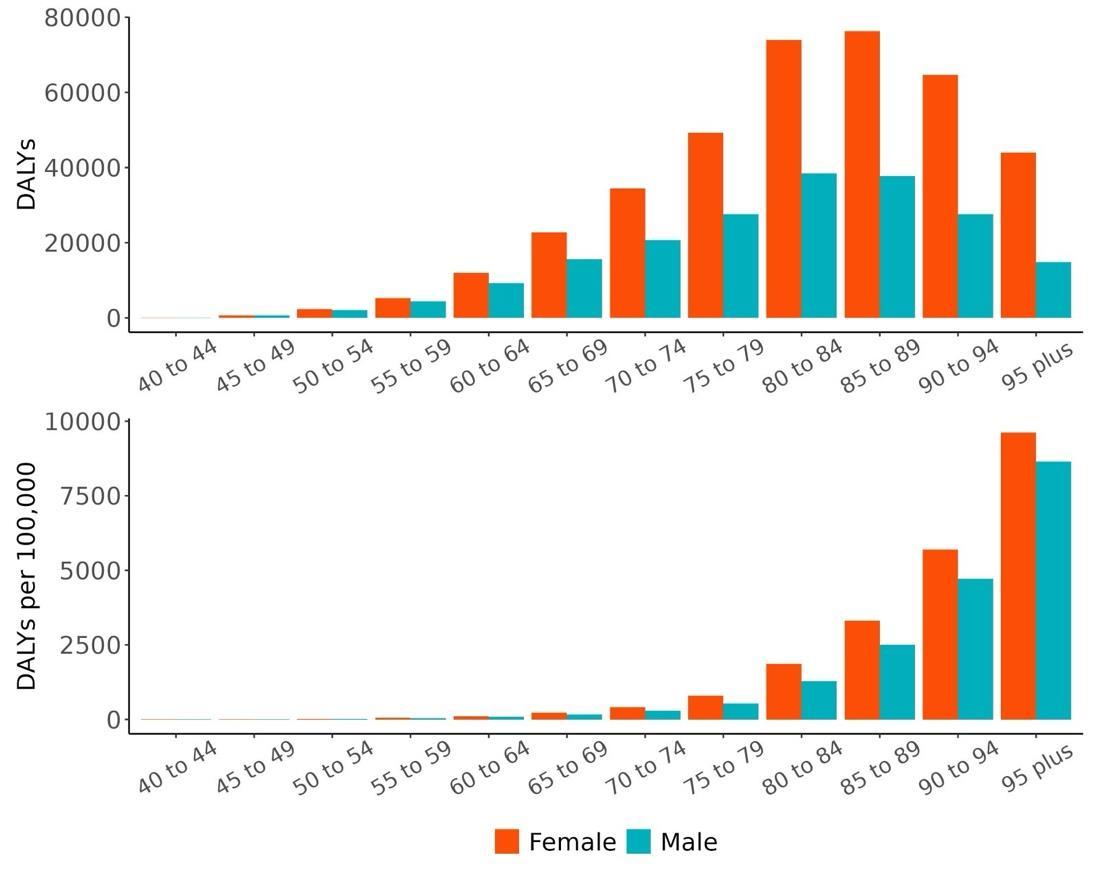
Figure 48. Dementia disability-adjusted life-years lost attributable to low education by age and sex, 2023.
5.5.8 Major takeaways
• Low educational attainment is a strong and consistent risk factor for dementia, with individuals who received only two years of schooling facing over double the risk of developing dementia compared to those with 18 years of education.
• Even within a conservative exposure range (2.6 to 16.05 years of schooling), individuals experienced an average 8% increase in dementia risk. This corresponds to a three-star strength of evidence (ROS: 0.19).
• Most studies assessed education in early life or young adulthood, but the evidence supports long-term protective effects of education and suggests possible benefits across the lifespan.
• The fraction of dementia health loss attributable to low education in 2023 ranged from 16.5% in Colorado to 19.3% in Kentucky. States with the highest PAFs were concentrated in the southeastern and south-central US, reflecting persistent regional disparities in educational access.
• Nationally, the PAF has declined over time, from approximately 21% in 1990 to 17.7% in 2023. This is likely driven by generational improvements in educational attainment.
• PAFs in 2023 were relatively consistent across age groups, with a slight increase in older adults. Females had slightly lower PAFs than males in younger age groups but slightly higher PAFs starting at age 65-69, likely due to historical gender disparities in education.
• In 2023, approximately 584,700 dementia disability-adjusted life years (DALYs) were attributable to low education – 385,600 among females and 199,100 among males.
• The highest rates of dementia-related health loss due to low education were observed in North Carolina, Pennsylvania, and California. The lowest rates were seen in Utah, Alaska, and the District of Columbia.
• Unlike PAFs, the number of dementia DALYs attributable to low education increased substantially with age, peaking at ages 85-89 for females and 80-84 for males, and was consistently higher among females across all age groups.
5.6 Fasting Plasma Glucose
5.6.1 Exposure definition
Fasting plasma glucose is a person’s plasma glucose level measured in mmol/L after fasting usually overnight for at least 8 hours or more. It is an indication of glucose regulation particularly in a fasting state.
5.6.2 National-level and state-level exposure and disparities
Exposure to fasting plasma glucose (FPG), as defined above, varied significantly across the globe (Table 24) with a gap of 3.59 mean mmol/L between Marshall Islands, with the highest exposure, and Rwanda, with the lowest exposure. The United States, placing 69th in exposure, generally experiences relatively high FPG exposure on the global scale. Within the United States, Hawaii is a notable outlier, with a mean FPG exposure 0.27 mmol/L higher than the national average (Table 25, Figure 49) FPG is a biomarker commonly used to indicate and diagnose type 2 diabetes. On a global scale the United States is ranked 30th in type 2 diabetes prevalence across all age Within the United States, West Viriginia maintains the the highest diabetes prevalence, while Colorado and Utah share the lowest prevalence amongst the states.
Table 24. National ranking of exposure levels, 2023
Countries with highest mean FPG (mmol/L), all age, both sex
1. Marshall Islands, 7.73
2. Tokelau, 7.31
3. Samoa, 7.25
4. Niue, 6.96
5. United Arab Emirates, 6.70
6. Northern Mariana Islands, 6.66
7. Cook Islands, 6.65
8. Micronesia, 6.60
9. Samoa, 6.60
10. Puerto Rico, 6.60
Countries with FPG levels similar to the United States
68. North Macedonia, 5.81
69. United States, 5.81
70. Ecuador, 5.79
Table 25. State ranking of exposure levels, 2023.
Highest mean FPG (mmol/L), all age, both sex
1. Hawaii, 6.08
2. West Virginia, 5.97
3. Mississippi, 5.96
4. Arkansas, 5.93
5. Alabama, 5.92
Countries with lowest mean FPG (mmol/L), all age, both sex
195. Uganda, 4.59
196. Ethiopia, 4.56
197. Burundi, 4.54
198. Djibouti, 4.54
199. South Sudan, 4.53
200. Cambodia, 4.45
201. Burkina Faso, 4.36
202. Eritrea, 4.30
203. Mozambique, 4.14
204. Rwanda, 4.14
Lowest mean FPG (mmol/L), all age, both sex
47. New York, 5.71
48. California, 5.70
49. Massachusetts, 5.69
50. District of Columbia, 5.67
51. Colorado, 5.63
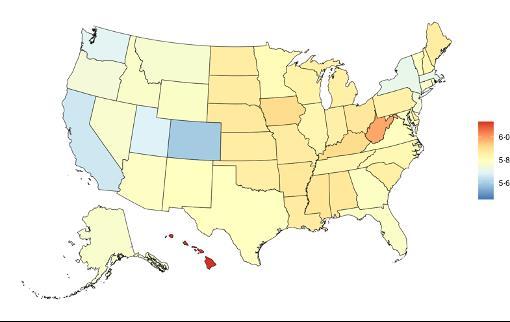
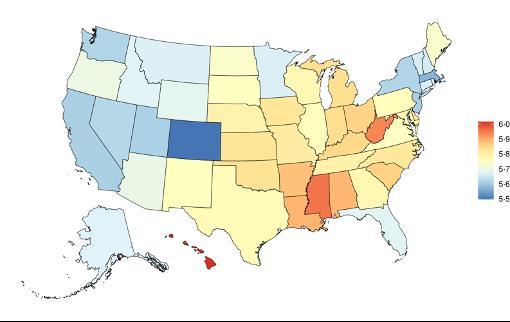
Figure 49. State-level mean fasting plasma glucose levels (mmol/L) in the United States, all age, 2023 (males top, females bottom).
FPG levels in the United States have moderately increased in the past three decades (Figure 50). Type 2 diabetes mellitus, which is indicative of high fasting plasma glucose levels, has increased more dramatically from a prevalence of approximately 5,300 individuals per 100,000 population in the US up to 12,100 individuals per 100,000 population.
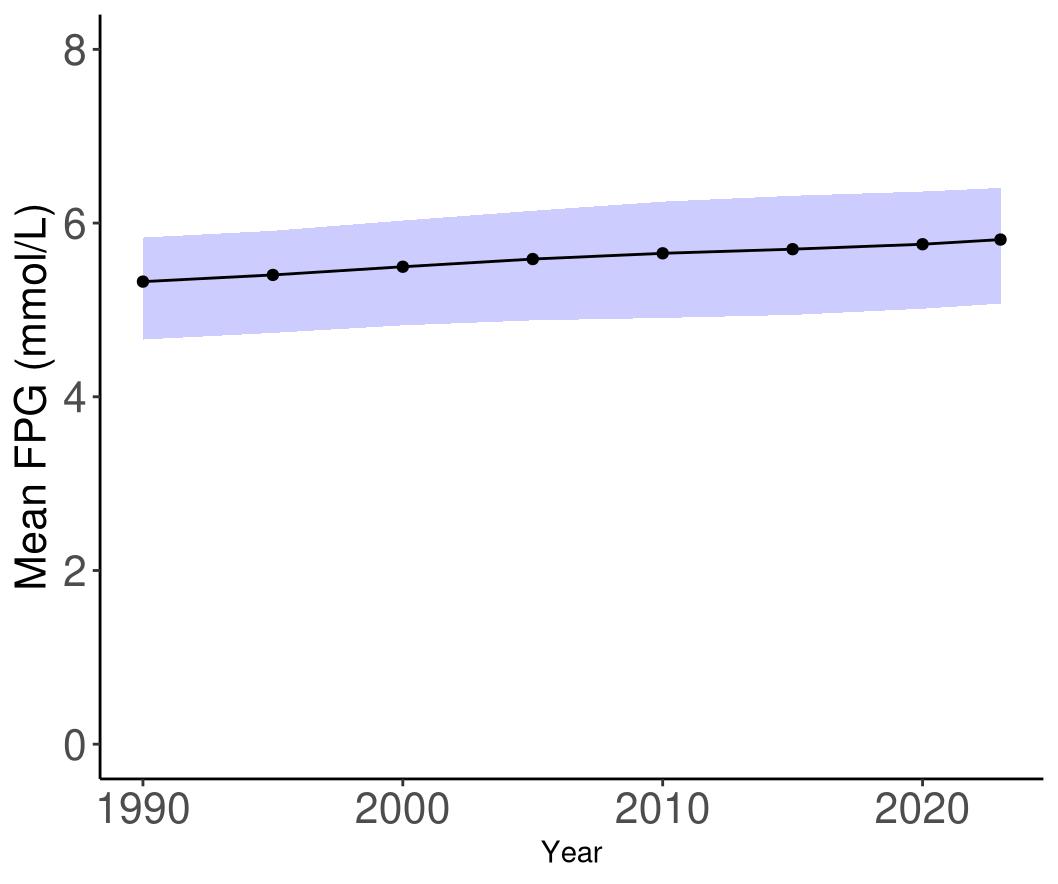
Figure 50. Temporal trends in fasting plasma glucose levels (mmol/L) in the United States, 19902023. Purple shading depicts 95% uncertainty intervals.
5.6.3 Data landscape
We accepted studies that assess dementia risk by:
• FPG levels
• Hba1c levels or oral glucose tolerance test levels
• Diagnosed diabetes status based on diabetes diagnostic guidelines, administrative records or self-reported diabetes diagnosis
Studies reporting the following definitions and ascertainment methods were excluded:
• Type 1 diabetes only
• Self-reported diabetes with no evidence of doctor diagnosis defined by only selfreported (i.e “Do you have diabetes”)
• Use of glucose/diabetes drug (e.g. metformin) as proxy for diabetes diagnosis.
Using the criteria above, we identified 1,545 unique studies, and after screening included a total of 51 studies with relevant relative risk data for our analyses.
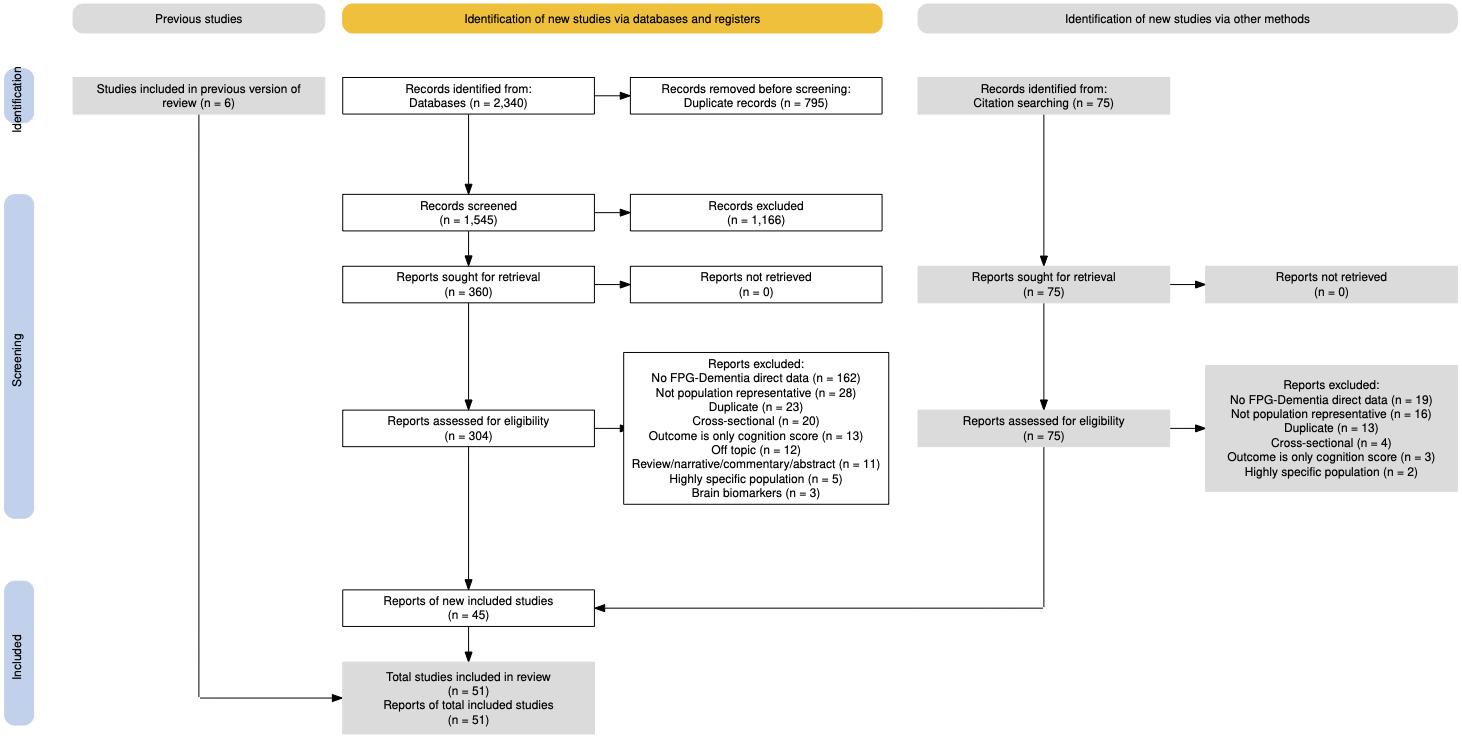
Figure 51. PRISMA diagram for fasting plasma glucose systematic review showing inclusion and exclusion of studies at each systematic review stage.
Table 26 (next page) describes the studies among US populations included from the systematic review. Of the 51 studies identified for inclusion from the systematic review, 12 were conducted in the US. Half of the studies measured exposure data via diabetes cases, and half measured biomarkers for FPG levels. Subsequent dementia identification via physician diagnosis or medical records. Follow-up time ranged from 5-48 years. Nearly all studies estimated the relationship between FPG and all-cause dementia, with only two studies also assessing the relationship with Alzheimer’s disease and vascular dementia
Table 26. United States studies included from the systematic review.
First author, year
Hayden, 2006
Akomolafe, 2006
Peila, 2002
Ogunmoroti, 2016
Cache County Study of Memory Health and Aging
2023
Moran, 2023 Kaiser Permanente Northern California
2023
Gottesman, 2022
Positron Emission Tomography study
First author, year
Rawlings, 2019
Irie, 2008
Ganguli, 2013
2023
• = dementia subtype is an outcome available in the study. T2DM: Type 2 Diabetes Mellitus diagnosis. If a self-report is indicated, it is a self-reported physician diagnosis of diabetes.
Across all included studies, FPG was ascertained primarily via biomarkers, followed by administrative medical records, self-reports of a physician diagnosis of type 2 diabetes or finally, the study has a physician assess diagnose within the study population (Table 27).
Table 27. Fasting plasma glucose level ascertainment in the included studies.
Primary FPG ascertainment method: Study count Example
Biomarkers: 24
“Collected FPG levels for all participants and stratified individuals by FPG levels of <5.6, 5.6-6.0, 6.1-6.9, >7mmol/L”
Physician diagnosed T2DM 3
Administrative medical records (ICD codes*, FPG measurements) 14
Self-reported physician diagnosis
10
5.6.4 Evidence score summaries
“Physician and geriatrician, WHO Expert Committee on Diabetes defined: self-reported diagnosis or a FPG ≥ 7.8 mmol/L on at least 2 separate days” (Solfrizzi, 2004).
“Diabetes ICD codes: 250.x (ICD-9), E08, E10, E11, E13 (ICD-10)” (Boivin-Proulx, 2023)
“The presence of diabetes was exclusively assessed based on self-reports and not based upon clinical screenings or medical records. Participants were asked whether they had ever been diagnosed by a physician with diabetes”
We observed a positive, 3-star relationship (ROS=0.34) between FPG and dementia among 48 studies (Figure 52). Compared to the reference FPG value of 4.2 mmol/L, the risk of dementia at the WHO prediabetes threshold of 6.1 mmol/L is 53% [20-94%] higher, increasing to 79% [29-148%] higher at the diabetes threshold of 7.0 mmol/L. Under our conservative estimate of excess risk, FPG exposure between the 15th and 85th percentile is associated with an average increase in dementia risk of 41%.

Figure 52. Fasting plasma glucose (FPG) and dementia risk. a, Relative-risk (RR)function. The solid green line represents the mean RR at each exposure level. The dark green shaded area indicates the 95% UI without accounting for between-study heterogeneity, while the light green
shaded area represents the 95% UI accounting for between-study heterogeneity. The size of the data point is proportional to the inverse of the s.d. of the effect estimates, where larger points indicate higher precision in the effect estimates. b, A modified funnel plot showing the residuals (relative to zero) on the x axis and the estimated s.d. (inclusive of between-study heterogeneity) on the y axis.
5.6.5 Sub-analyses
The shape of the dose-response curve and strength of evidence was similar across age-groups.
Analyses by dementia subtype revealed positive, 2-star relationships for both Alzheimer’s disease (ROS=1.06, 25 studies, Figure 53) and vascular dementia (ROS=0.01, 21 studies, Figure 54).
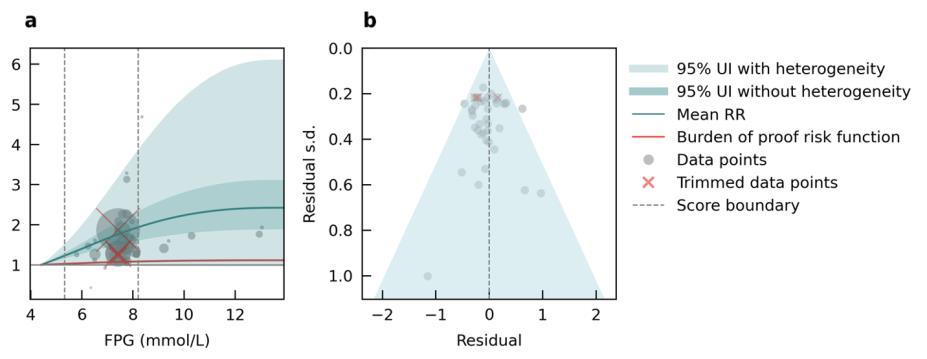
Figure 53. Fasting plasma glucose (FPG) and Alzheimer’s disease risk. a, Relative-risk (RR)function. The solid green line represents the mean RR at each exposure level. The dark green shaded area indicates the 95% UI without accounting for between-study heterogeneity, while the light green shaded area represents the 95% UI accounting for between-study heterogeneity. The size of the data point sis proportional to the inverse of the s.d. of the effect estimates, where larger points indicate higher precision in the effect
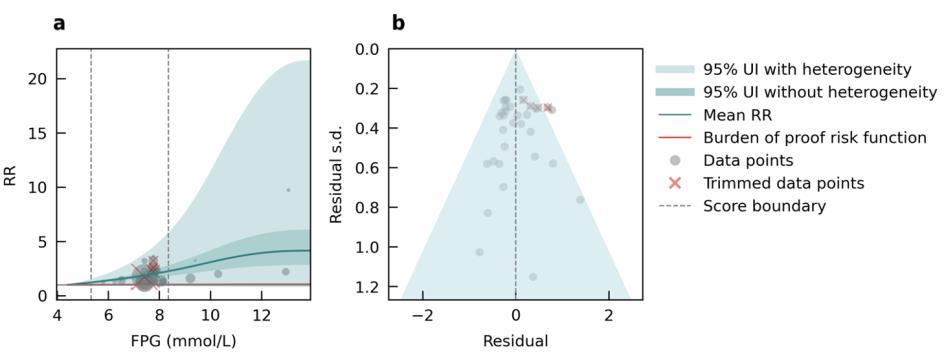
Figure 54. Fasting plasma glucose (FPG) and vascular dementia risk. a, Relative-risk (RR)function. The solid green line represents the mean RR at each exposure level. The dark green shaded area indicates the 95% UI without accounting for between-study heterogeneity, while the light green shaded area represents the 95% UI accounting for between-study heterogeneity. The size of the data point sis proportional to the inverse of the s.d. of the effect estimates, where larger points indicate higher precision in the effect
5.6.6 Population attributable fraction
The proportion of dementia health loss due to high fasting plasma glucose increases from over 10% in ages 40-44 years to stabilizing around 20% after 65 years (Figure 55). This proportion is marginally higher in males compared to females across all age groups, reflecting the increased prevalence of diabetes in males.
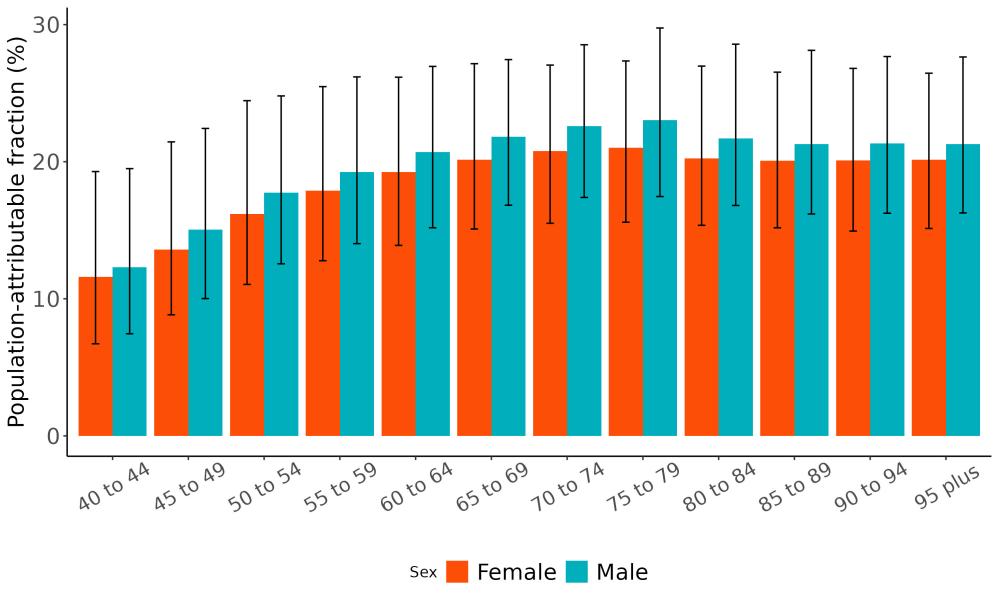
Figure 55. Population attributable fractions for dementia burden due to high fasting plasma glucose by age and sex, 2023.
The proportion of dementia health loss due to high fasting plasma glucose has risen from 16% in 1990 to 21% in 2023 (Figure 56), also reflecting trends towards increasing prevalence of type 2 diabetes mellitus over time
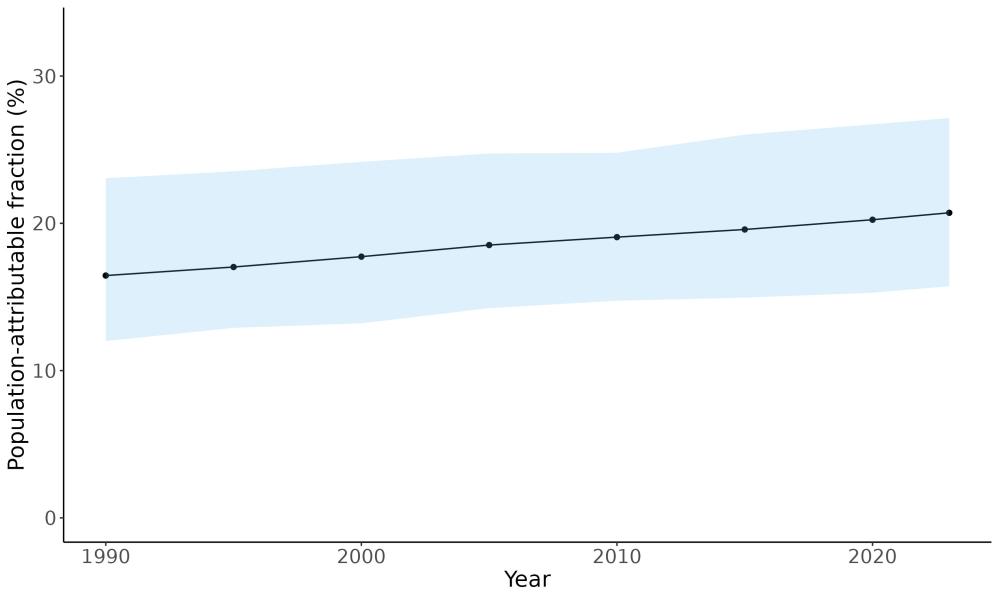
Figure 56. Temporal trends in population attributable fractions for dementia burden due to fasting plasma glucose, 1990-2023. Blue shading indicates 95% uncertainty intervals.
The proportion of dementia health loss attributable to high fasting plasma glucose tends to be higher in southeastern states, though overall variation across states is modest ranging from 19% in Colorado to 22% in West Virginia (Figure 57).

Figure 57. State-level population attributable fractions for dementia burden due to high fasting plasma glucose, 2023, both sex, all-age.
5.6.7 Attributable burden
In 2023, an estimated 689,000 DALYs due to dementia could have been prevented by reducing fasting plasma glucose levels to the theoretical minimum. The burden was greater among females, accounting for 436,000 DALYs, compared to 253,000 among males (Figure 58).

Figure 58. Proportion of dementia burden attributed to high fasting plasma glucose by sex, 2023.
Age-stratified analysis revealed that the highest avoidable burden occurred in individuals aged 75–84 years, followed by a gradual decline in the oldest age groups (Figure 59). DALYs attributed to high fasting plasma glucose were higher in females than males even though the exposure is generally higher in males. This likely reflects the combined effects of higher dementia burden in late life and in females, and shrinking population size at oldest ages.

59. Dementia disability-adjusted life-years attributable to high fasting plasma glucose by age and sex, 2023.
Figure
Hawaii recorded the highest (290 DALYs per 100K) rate of dementia-related health loss attributable to high fasting plasma glucose, followed by Pennsylvania (266 DALYs per 100K). In contrast, Utah (127 DALYs per 100K) and Alaska (135 DALYs per 100K) has the lowest rates (Figure 60).

Figure 60. State-level dementia disability-adjusted life-years attributable to high fasting plasma glucose, 2023, both sex, all-age
5.6.8 Major takeaways
• Mean fasting plasma glucose is higher in the central and eastern United States and has increased over time, particularly in older adults.
• High fasting plasma glucose has the strongest evidence for association with dementia among the 12 risk factors assessed. Elevated risk for dementia occurred even prior to the fasting plasma glucose threshold for diabetes diagnosis.
• The proportion of dementia health loss due to high fasting plasma glucose is high at around 20% after age 65. It has also risen over time from 16% in 1990 to 21% in 2023.
• In 2023, an estimated 689,000 dementia DALYs was due to high fasting plasma glucose in the United States, 436,000 for women and 253,000 for men.
• Policies and programs to support prevention and intervention of high blood sugar is urgently needed considering the strong evidence for an association with dementia and high and increasing attributable burden.
5.7 Hearing Loss
5.7.1
Exposure definition
Hearing loss is impairment in the ability to perceive sound. It occurs when any part of the hearing system from the outer ear to the brain’s auditory centers is disrupted. Our gold standard case definition for mild or worse hearing impairment is less than a 20 decibel threshold in the better ear as measured by audiometry, in which decibel-specific tones are played at various frequencies. Prevalence of hearing loss accounts for estimated hearing aid usage.
5.7.2 National-level and state-level exposure and disparities
Exposure to hearing loss, as defined above, varied significantly across the globe (Table 28) with the highest hearing loss prevalence in China at 34,860 individuals per 100,000 population, and with the lowest hearing loss prevalence in Afghanistan at 8,840 individuals per 100,000 population with mild or worse hearing loss. The United States, placing 56th in exposure, generally experiences relatively high hearing loss exposure on the global scale. Within the United States, Maine has the highest prevalence of hearing loss of all US states, with a hearing loss prevalence 1.17x higher than the national average (Table 29, Figure 61).
Table 28. National ranking of exposure levels, 2023.
Countries with highest hearing loss prevalence, all age, both sex
1. China, 0.348
2. Japan, 0.342
3. Puerto Rico, 0.338
4. Thailand, 0.334
5. Taiwan, 0.333
6. Bulgaria, 0.322
7. United States Virgin Islands, 0.320
8. Croatia, 0.318
9. Bermuda, 0.318
10. Ukraine, 0.309
Countries with lowest hearing loss prevalence, all age, both sex
195. Sudan, 0.122
196. Zambia, 0.122
197. Iraq, 0.120
198. Niger, 0.117
199. Chad, 0.116
200. Oman, 0.114
201. Palestine, 0.112
202. Uganda, 0.108
203. Yemen, 0.101
204. Afghanistan, 0.088
Countries with hearing loss prevalence similar to the United States
55. Northern Mariana Islands, 0.236
56. United States, 0.232
57. Spain, 0.232
Table 29. State ranking of exposure levels, 2023.
1. Maine, 0.273
2. Vermont, 0.266
3. Florida, 0.263
4. New Hampshire, 0.261
5. West Virginia, 0.260
47. Georgia, 0.214
48. Alaska, 0.210
49. Texas, 0.198
50. District of Columbia, 0.195
51. Utah, 0.179

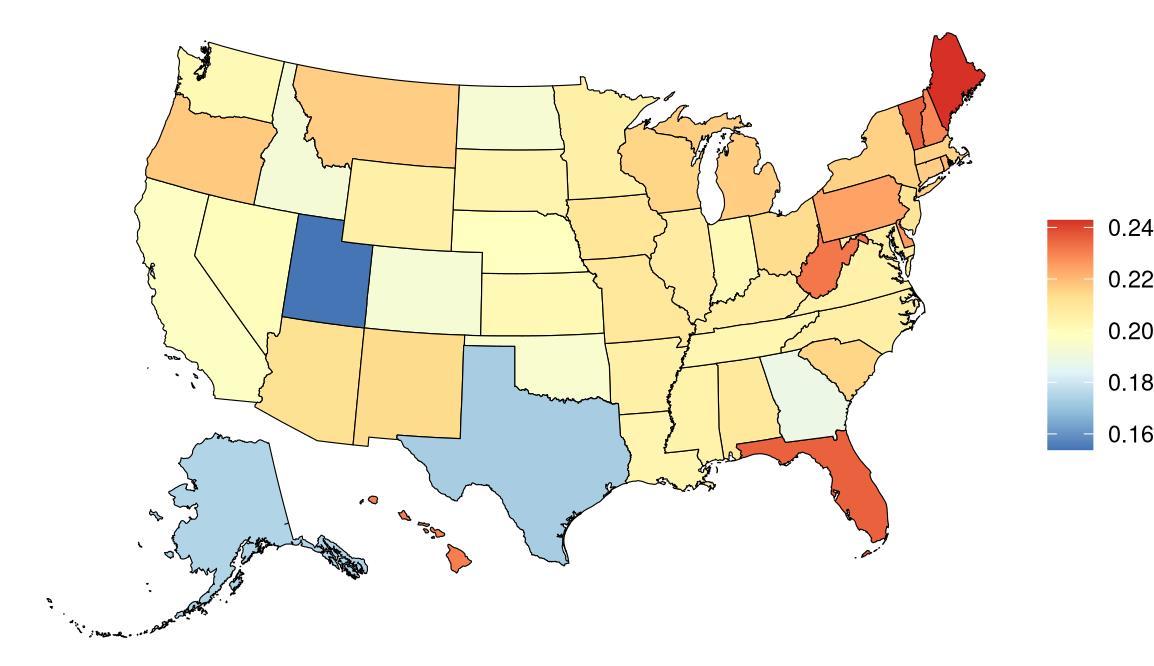
Figure 61. State-level hearing loss prevalence in the United States, all age, 2023 (males top, females bottom).
Hearing loss prevalence in the United States has moderately increased over a three-decade period, likely reflecting changing demographics since hearing loss prevalence increases with age (Figure 62).
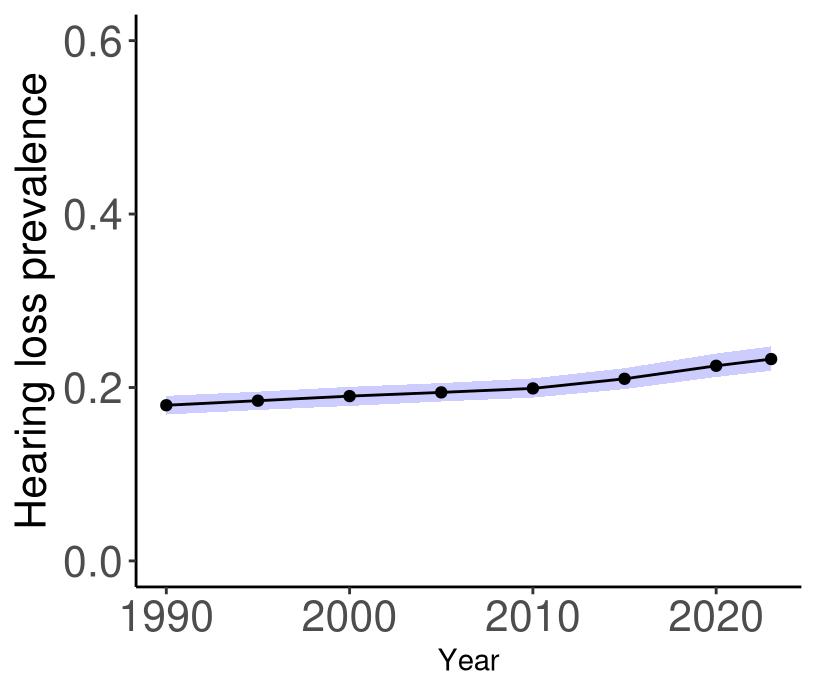
Figure 62. Temporal trends in hearing loss prevalence in the United States, 1990-2023. Purple shading depicts 95% uncertainty intervals.
5.7.3 Data landscape
Studies in which hearing loss was measured:
• We initially accepted studies that assess hearing loss by a variety of measures including self-report, administrative records, and audiometry as part of an effort to assess the type of data available for hearing loss.
• Our gold standard assessment method for hearing loss is audiometry, in which decibel-specific tones are played at various frequencies.
Studies with:
• No diagnostic examination: The source does not include indication that an accepted test was used to diagnose hearing loss. Exclude if no diagnostic audiological evaluation was performed.
• Not accepted tests:
Otoacoustic Emissions (OAE, TEOAE, DPOAE)
Automated OAE
Automated ABR
Tympanometry
ABR not specific to be diagnostic
• No dB threshold: Source does not give a definitive dB threshold for reported hearing loss, specify source of HL definition being used, or clearly use a standard classification (IHME, WHO, ASHA).
• No bilateral hearing loss: Does not report bilateral (better-ear) hearing loss. For example, article reports only worse ear or unilateral hearing loss or only reports by ear.
Using the criteria above, we identified 808 unique studies, and after screening included a total of 45 studies with relevant relative risk data for our analyses (Figure 63).

Figure 63. PRISMA diagram for hearing loss systematic review showing inclusion and exclusion of studies at each systematic review stage.
Table 30 (next page) describes the studies among US populations included from the systematic review. Of the 45 studies identified for inclusion from the systematic review, seven were conducted in the US. All studies, with the exception of one, ascertained hearing loss via audiometry and subsequent dementia identification via physician diagnosis or medical records. Follow-up time ranged from 6-17 years. All studies estimated the relationship between hearing loss and all-cause dementia.
Table 30. United States studies included from the systematic review.
Lin, 2011
Longitudinal Study of Aging Maryland, USA
Marinelli, 2022 Mayo Clinic Study of Aging (MCSA) Minnesota,
Fischer, 2016
Powell, 2022
• = dementia subtype is an outcome available in the study.
Across all included studies, the majority of hearing loss exposure was captured via ICD coded hearing loss, followed by audiometry tests, self-reported hearing loss, and finally miscellaneous tests (Table 31).
Table 31. Hearing loss ascertainment methods in included studies.
5.7.4 Evidence score summaries
Our primary analysis included 10 studies that used audiometry to assess hearing loss and reported dementia risk estimates across various decibel levels, allowing us to model hearing loss as a continuous exposure (Figure 64). We found that dementia risk is increased by 29% [2335%] for moderate hearing loss (35 decibels) and 49% [39 – 61%] for severe hearing loss (65 decibels), compared to normal hearing (15 decibel). This model had an ROS value of 0.30, corresponding to a 3-star rating. We also defined hearing loss as yes or no using the most conservative estimate from the same 10 studies and found that the average increase in dementia risk was 23% (15-31%, 2-star, ROS=0.08, Figure 65). When all methods of hearing assessment were analyzed, the average increase in dementia risk was 31% [-4 – 80], although the estimate was not statistically significant due to high between-study variability.
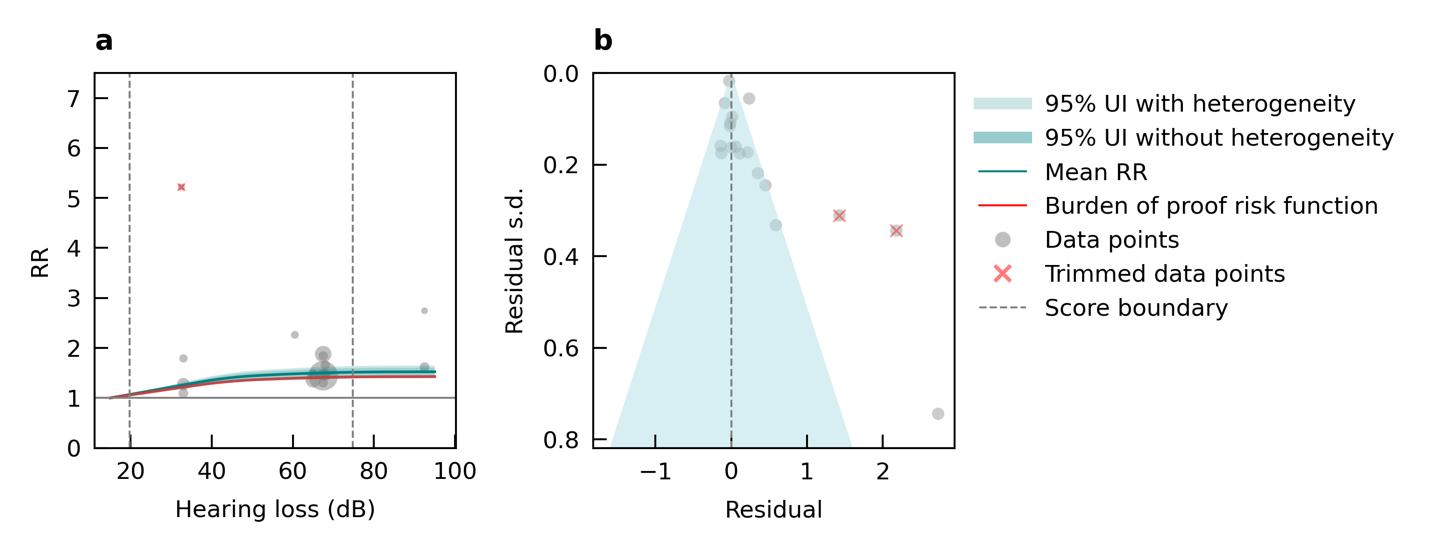
Figure 64. Hearing loss decibel level and dementia risk. a, Relative-risk (RR)function. The solid green line represents the mean RR at each exposure level. The dark green shaded area indicates the 95% UI without accounting for between-study heterogeneity, while the light green shaded area represents the 95% UI accounting for between-study heterogeneity. The size of the data point is proportional to the inverse of the s.d. of the effect estimates, where larger points indicate higher precision in the effect estimates. b, A modified funnel plot showing the residuals
(relative to zero) on the x axis and the estimated s.d. (inclusive of between-study heterogeneity) on the y axis.
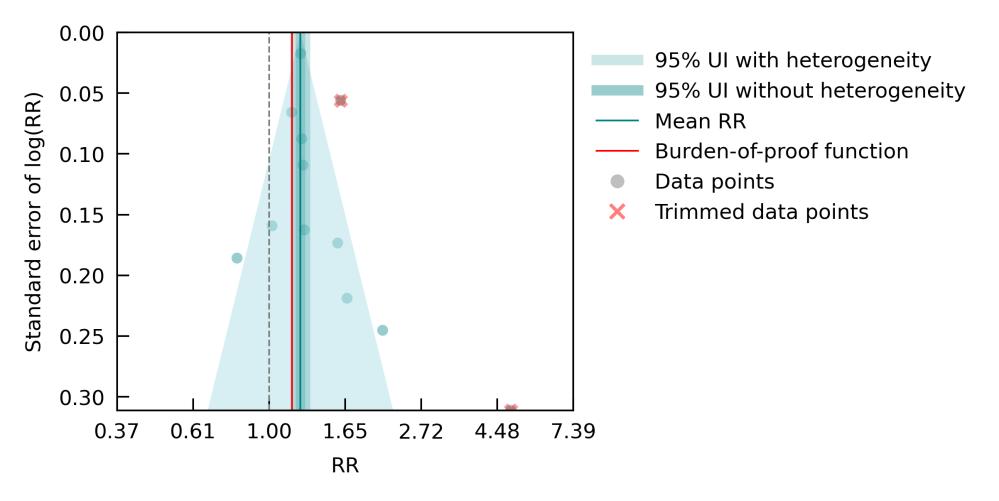
Figure 65. Hearing loss and dementia risk among studies with audiometry assessment. The figure shows a funnel plot with the relative risks (RR) on the x axis and standard error of the log(RR) on the y axis. The solid green line represents the mean RR. The dark green shaded area indicates the 95% UI without accounting for between-study heterogeneity, while the light green shaded area represents the 95% UI accounting for between-study heterogeneity.
5.7.5 Sub-analyses
We observed stronger evidence for a relationship between hearing loss and dementia in studies with mean age under 65 years (5-star, ROS=0.83, 3 studies) compared to over 65 (3-star, ROS=0.20, 9 studies), although the results should be interpreted with caution due to the limited number of studies and high variance in the younger age group (Table 32). Analysis stratified by dementia subtype was not performed due to insufficient number of studies.
Table 32. Sub-analyses to assess the relationship between hearing loss and dementia risk by mean age of the measurement of hearing loss exposure.
< 65 years
(1.72, 71.6)
(1.83, 115.98) 12.31 (1.76, 86.05) 0.83
3 Age ≥ 65 years Reference 1.2 (1.15, 1.25) 1.32 (1.24, 1.41) 1.39 (1.29, 1.5) 0.2 ⭐⭐⭐ 9
5.7.6 Population attributable fraction
The proportion of dementia health loss due to hearing loss is higher in males compared to females, with more pronounced differences below 75 years of age (Figure 66)
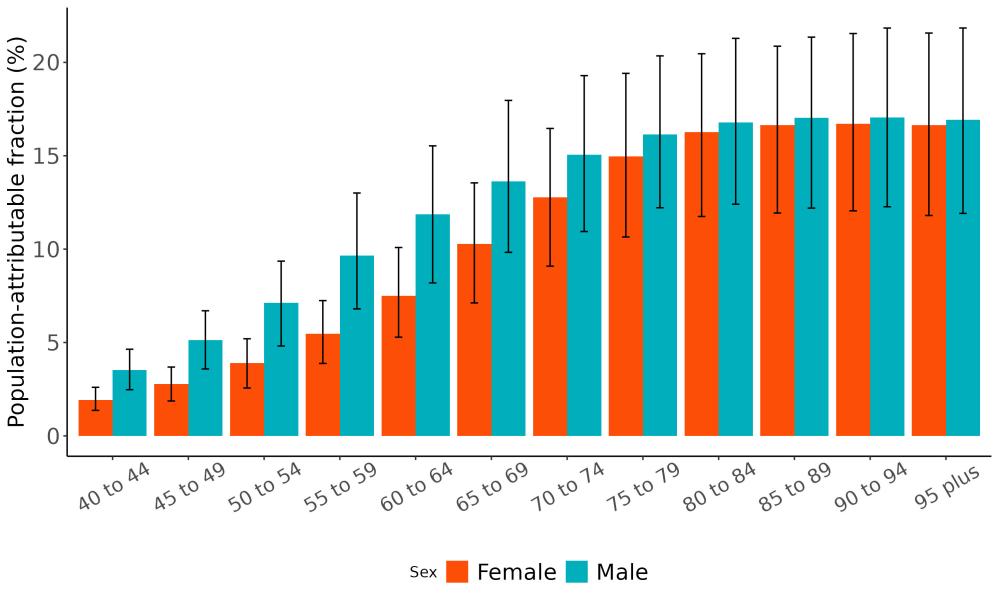
Figure 66. Population attributable fractions for dementia burden due to hearing loss by age and sex, 2023.
Temporal analysis shows that the proportion of dementia health loss due to hearing loss has remained consistent at around 15% from 1990 to 2023 (Figure 67). Variation across states was also negligible and ranged from 14.8% in Alaska to 15.4% in North Dakota (Figure 68).
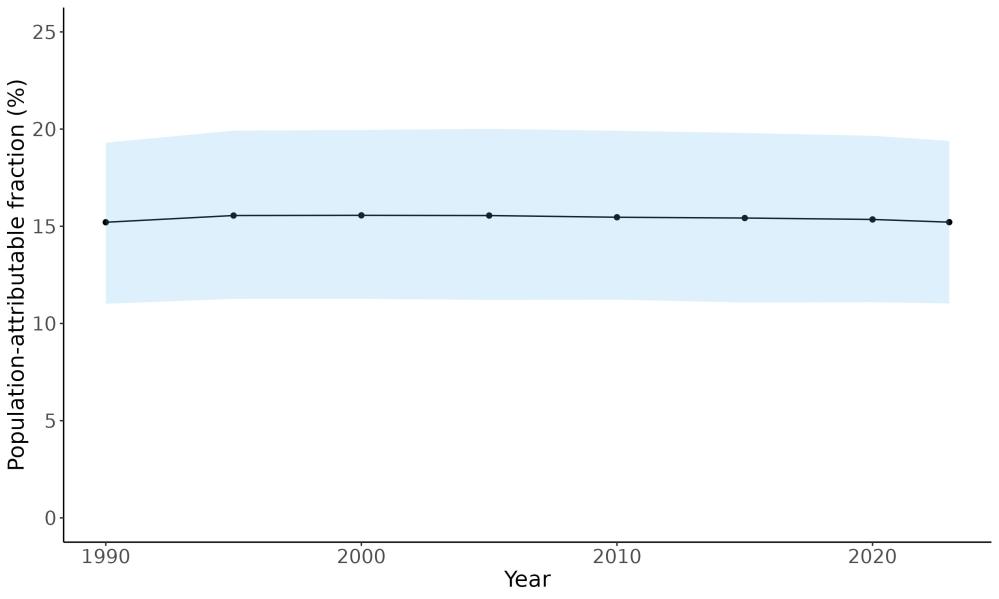
Figure 67. Temporal trends in population attributable fraction for dementia burden due to hearing loss, 1990-2023
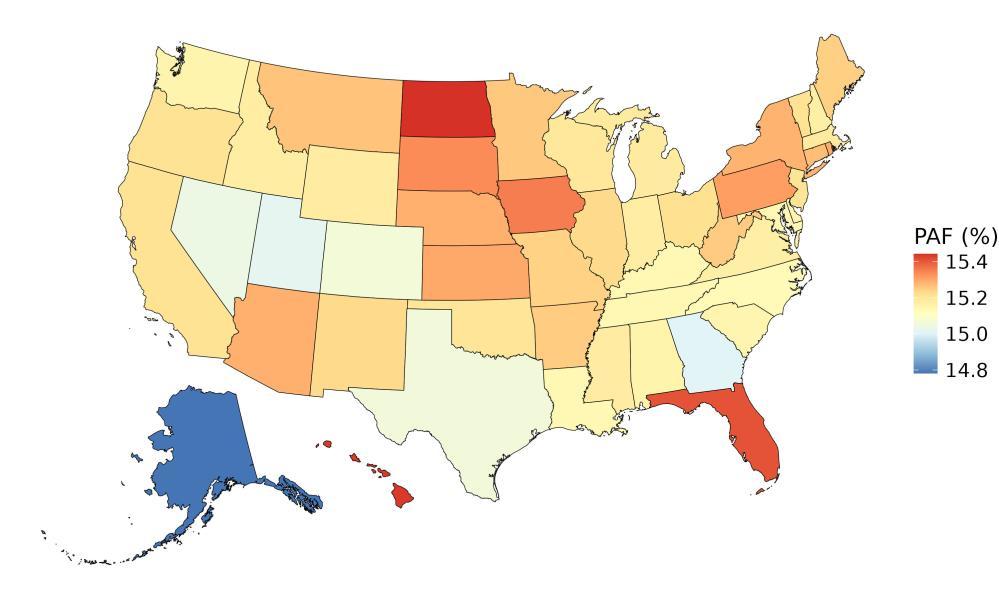
Figure 68. State-level dementia disability-adjusted life-years attributable to hearing loss, 2023, both sex, all-age.
5.7.7 Attributable burden
In 2023, an estimated 512,000 dementia DALYs could have been prevented if hearing loss was eliminated. The burden was greater among females, accounting for 327,000 DALYs, compared to 185,000 among males (Figure 69)
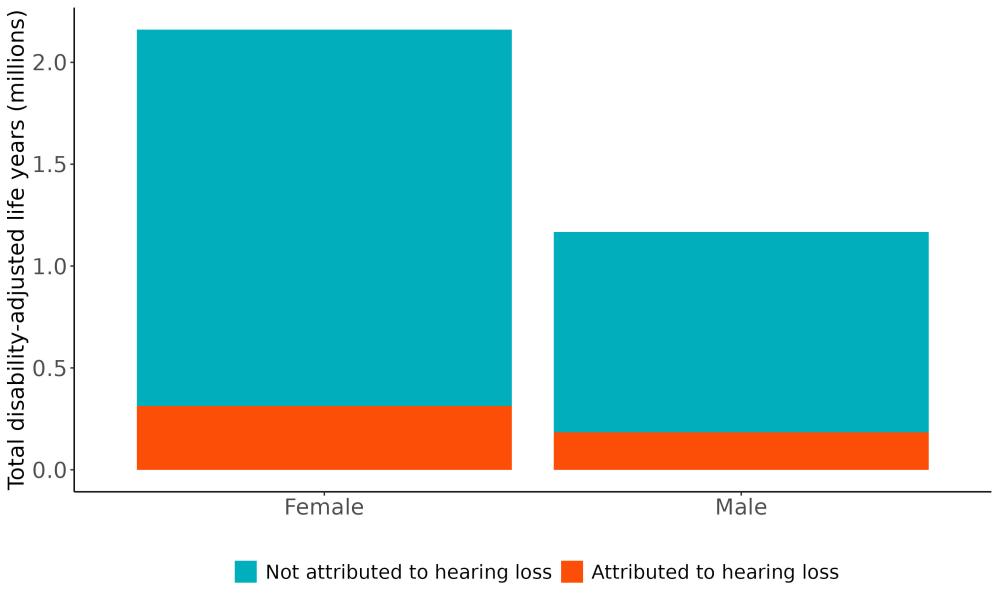
Figure 69. Proportion of dementia burden attributed to hearing loss by sex, 2023
Age-stratified analyses revealed that among individuals under 65, males experienced slightly higher dementia-related DALYs due to hearing loss. In contrast, among those over 65 particularly above age 75 females had significantly higher DALYs, exceeding male values by more than 1.5 times (Figure 70)
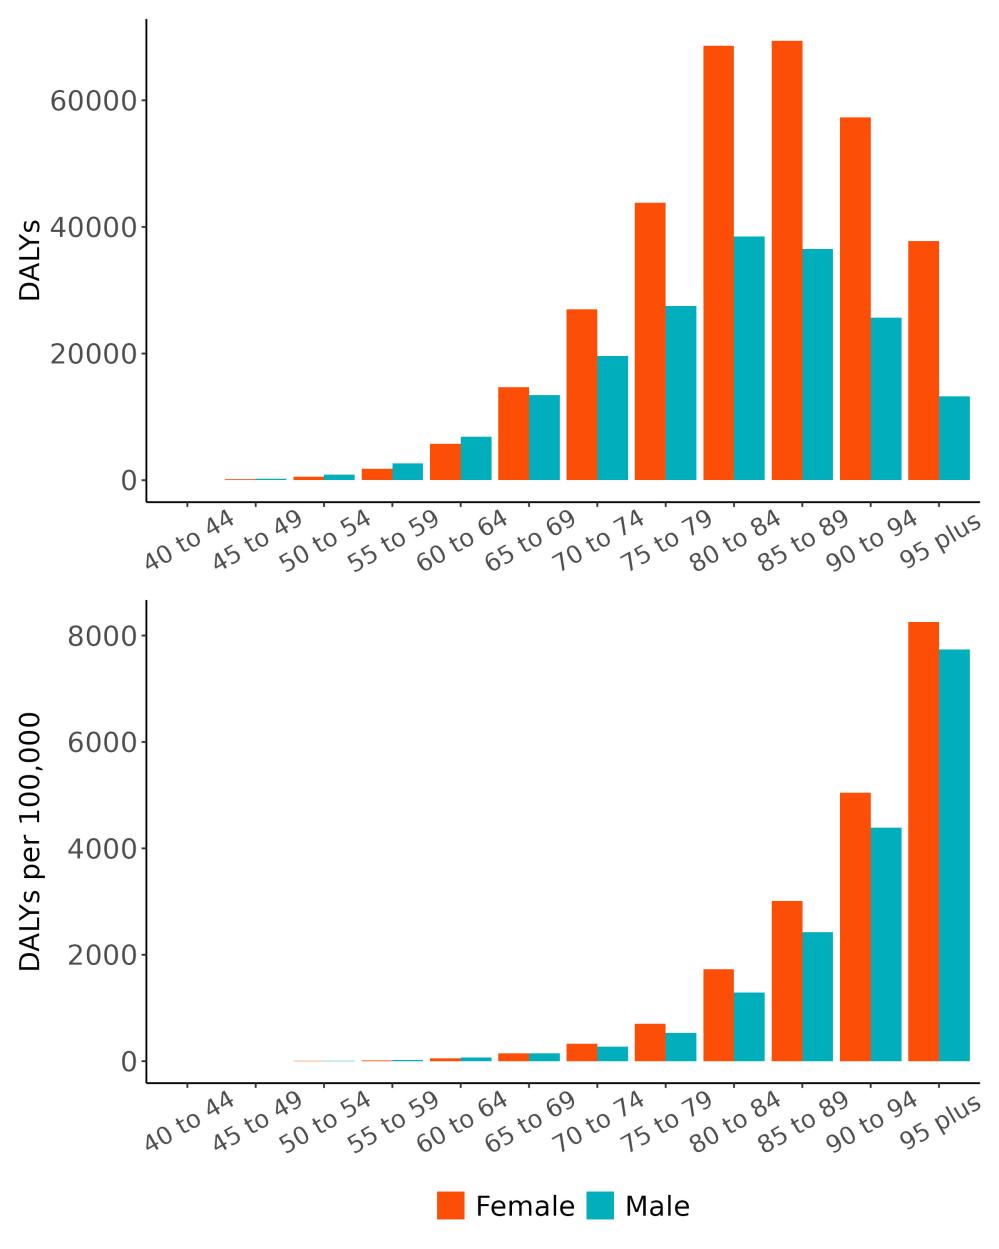
Figure 70. Dementia disability-adjusted life-years attributable to hearing loss by age and sex, 2023.
The rate of attributable burden due to hearing loss varies by state and ranges from 91 to 209 DALYs/100,000 . The highest rates are observed in Hawaii followed by Pennsylvania. The lowest rates are in Utah and Alaska (Figure 71).
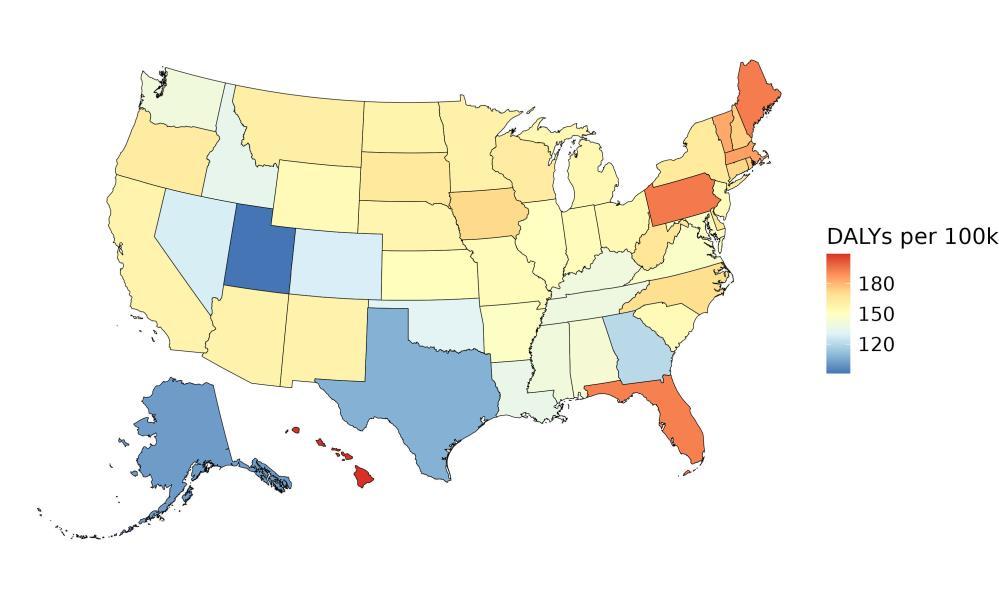
Figure 71. State-level dementia disability-adjusted life-years attributable to hearing loss, 2023, all-age.
5.7.8 Major takeaways
• Prevalence of hearing loss has increased over time and is higher in males compared to females. Occupational noise exposure can explain some of the gender difference as males are more likely to work in industries with high noise levels such as construction and manufacturing.21
• High-quality studies using audiometric assessments – the gold standard for measuring hearing - consistently show an increased risk of dementia, even at moderate levels of hearing loss.
• The proportion of dementia health loss due to hearing impairment is higher among males compared to females with more pronounced difference in younger age groups.
• In 2023, an estimated 512,000 dementia DALYs was due to hearing loss in the United States, 327,000 for women and 185,000 for men. While prevalence of hearing loss is higher in males, females have higher dementia DALYs due to hearing loss because dementia is more common in females.
• Expanding access to hearing aids is a critical strategy for reducing the burden of dementia, as the seminal ACHIEVE trail demonstrated a 48% reduction in cognitive decline in high-risk older adults receiving hearing interventions.22
5.8 Physical Inactivity
5.8.1 Exposure definition
We assess physical activity across all domains of life (leisure/recreation, work, household and transport). We use frequency, duration and intensity of activity to calculate total metabolic equivalent (MET)-minutes per week. MET is the ratio of the working metabolic rate to the resting metabolic rate. One MET is equivalent to 1 kcal/kg/hour and is equal to the energy cost of sitting quietly. A MET is also defined as the oxygen uptake in ml/kg/min with one MET equal to the oxygen cost of sitting quietly, around 3.5 ml/kg/min.
Our definition of low physical activity (LPA) in terms of MET-minutes per week varies by age and sex. Between 20 to 39 years of age, LPA is defined for both males and females as total physical activity less than 3600 to 4400 MET-minutes per week. This range is reduced to 2041 to 2495 MET-minutes per week for females and 1955 to 2390 MET-minutes per week for males aged 80 and above. The reduction factor is based on the 50th percentile of peak METs achieved during treadmill testing by age and sex.23
5.8.2 National-level and state-level exposure and disparities
Exposure to physical activity, as defined above, varied significantly across the globe (Table 33) with a gap of 2351 mean METs between Ukraine, with the highest exposure, and Sudan, with the lowest physical activity levels. The United States, placing 66th in physical activity levels, experiences relatively mid exposure levels on the global scale. Within the United States, the District of Columbia is a notable outlier, with a mean physical activity levels exposure 1.17x higher than the national average (Figure 72, Table 34).
Table 33. National ranking of exposure levels, 2022*
Countries with highest physical activity (METs), all age, both sex
1. Ukraine, 2586.7
2. Russian Federation, 2473.7
3. Uzbekistan, 2393.6
4. Myanmar, 2341.0
5. Cambodia, 2336.4
6. Moldova, 2319.4
7. India 2296.2
8. Armenia, 2296.1
9. Azerbaijan, 2274.3
10. Mongolia, 2165.9
Countries with lowest physical activity (METs), all age, both sex
195. Kiribati, 681.5
196. Kuwait, 652.7
197. Afghanistan, 631.8
198. Samoa, 630.0
199. Bhutan, 613.3
200. Mauritania, 609.2
201. American Samoa, 489.3
202. Micronesia, 435.5
203. Marshall Islands, 418.9
204. Sudan, 235.4
Countries with physical activity similar to the United States
65. Costa Rica, 1634.0
66. United States, 1629.7
67. Guam, 1616.9
*Exposure estimates for low physical activity only produced through 2022
Table 34. State ranking of exposure levels, 2022*
Highest physical activity (METs), all age, both sex
1. District of Columbia, 1911.5 (1520-2302)
2. Alaska, 1810.6 (1385.9-2235.4)
3. Vermont, 1808.6 (1398.2-2219.1)
4. Massachusetts, 1786.2 (1404.2- 2168.4)
5. Hawaii, 1776.8 (1348.0-2205.6)
Lowest physical activity (METs), all age, both sex
47. Iowa, 1467.1 (1146.5-1787.6)
48. Mississippi, 1464.3 (1121.9-1806.7)
49. Oklahoma, 1463.9 (1161.3-1766.4)
50. South Dakota, 1440.5 (1156.4-1724.6)
51. Tennessee 1391.4 (1100.6-1682.2)
*Exposure estimates for low physical activity only produced through 2022

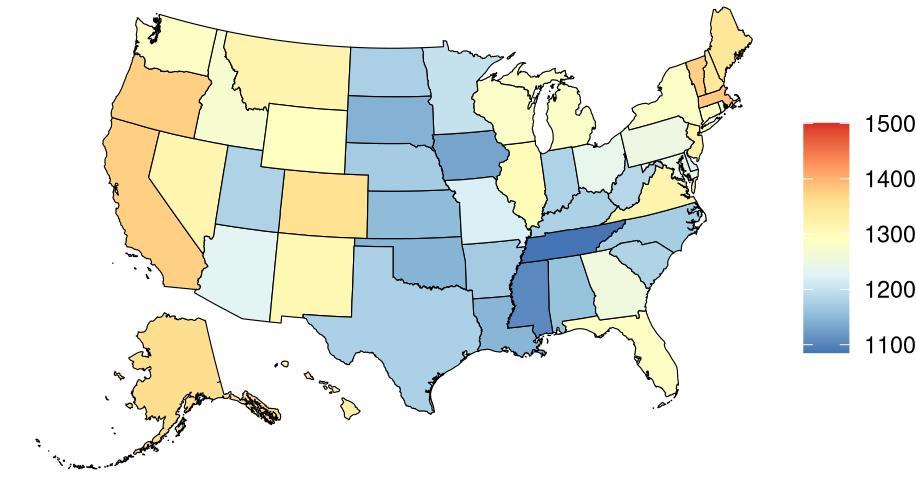
Figure 72. State-level mean physical activity (METs) in the United States, all age, 2022 (males top, females bottom).
Physical activity levels in the United States have remained relatively steady over time (Figure 73).

Figure 73. Temporal trends in physical activity (METs) in the United States, all age, both sex, 1990-2022. Purple shading depicts 95% uncertainty intervals.
5.8.3 Data landscape
We included studies in which physical activity:
• Is surveyed via the Global Physical Activity Questionnaire (GPAQ) and International Physical Activity Questionnaire (IPAQ)
• Provides information on different dimensions of the activity:
Frequency (e.g., times per week)
Duration (e.g., minutes)
Intensity (e.g., moderate intensity)
We excluded studies in which:
• Conducted in subgroups identified by convenience sampling or via a shared characteristic that is likely related to risk of exposure to inactivity
• Reports only an aggregate measure of physical activity, and/or those missing essential data
Using the criteria above, we identified 2,778 studies, and after screening included a total of 61 studies with relevant relative risk data for our analyses (Figure 74)
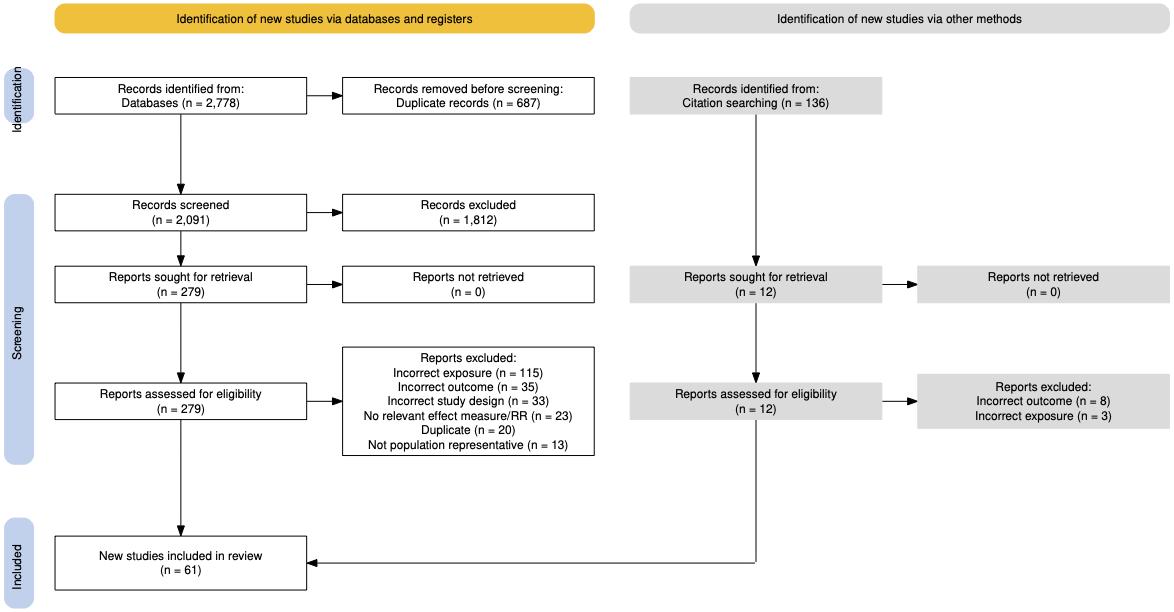
Figure 74. PRISMA diagram for physical activity systematic review showing inclusion and exclusion of studies at each systematic review stage.
Table 35 (next page) describes the studies among US populations included from the systematic review. Of the 61 studies identified for inclusion from the systematic review, four were conducted in the US. All studies used a self-reported questionnaire and subsequent dementia identification via medical records. Follow-up time ranged from 1-14 years. Nearly all studies estimated the relationship between physical activity and all-cause dementia, with only one study assessing the relationship with Alzheimer’s disease.
Table 35. United States studies included from the systematic review.
First author, year Study
Yang, 2022 Southern Community Cohort Study (SCCS) United States 17,209 ≥ 40 14 Self-report questionnaire Medical records
Verghese, 2003 Bronx Aging Study New York, USA 469 (79.3) 3 Self-report questionnaire
PaganiniHill, 2016 NA California, USA NA (93) 3
questionnaire
Shih, 2018 NA California, USA NA (69.7) 1 Self-report questionnaire
• = dementia subtype is an outcome available in the study.
Across all the included studies, physical activity was measured via provided METs or via physical activity categories which were translated into METs for the relative risk model. The most common categories were moderate physical activity, light physical activity, vigorous physical activity, regular exerciser and a non-exerciser (Table 36).
Table 36. Physical activity ascertainment methods in included studies
5.8.4 Evidence score summaries
We observed a 2-star relationship (ROS=0.12) between low physical activity and dementia risk using data from 32 studies (Figure 75). Engaging in at least 150 minutes a week of moderate intensity physical activity (approximately 500 MET-minutes/week) is associated with a 19% [828%] reduced risk of dementia. At the 1640 MET-minutes/week (85th percentile) the risk of dementia is reduced by 24% [12-38%].
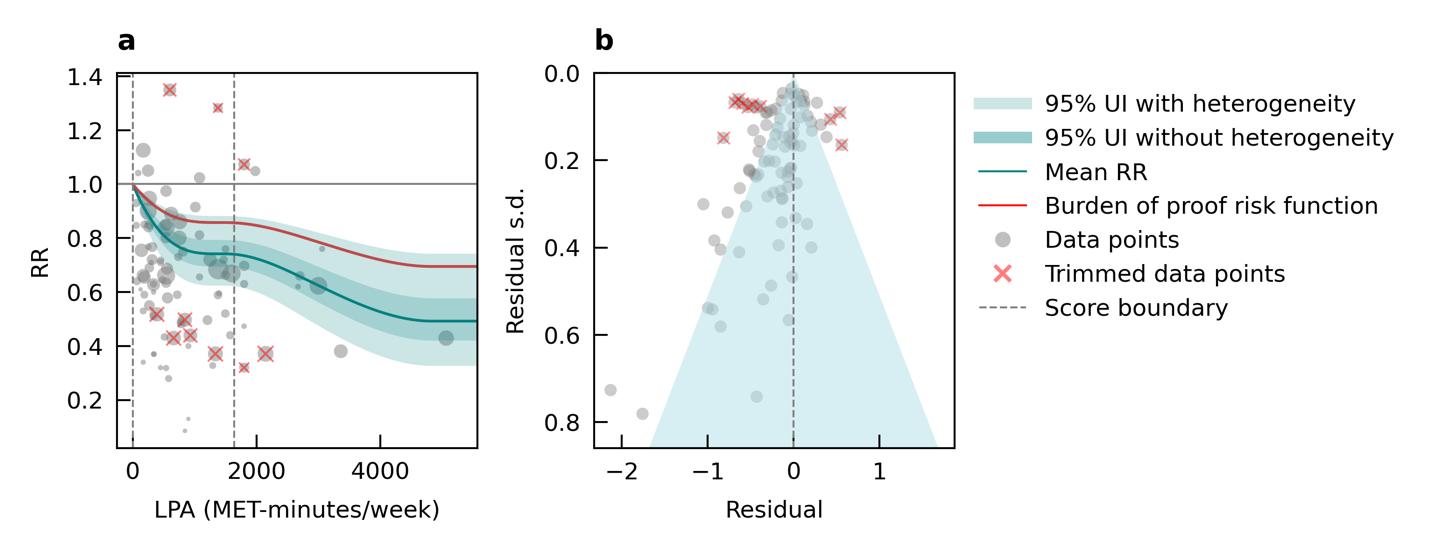
Figure 75. Low physical activity and dementia risk. a, Relative-risk (RR) function. The solid green line represents the mean RR at each exposure level. The dark green shaded area indicates the 95% UI without accounting for between-study heterogeneity, while the light green shaded area represents the 95% UI accounting for between-study heterogeneity. The size of the data point is proportional to the inverse of the s.d. of the effect estimates, where larger points indicate higher precision in the effect estimates. b, A modified funnel plot showing the residuals (relative to zero) on the x axis and the estimated s.d. (inclusive of between-study heterogeneity) on the y axis.
5.8.5 Sub-analyses
We observed a 3-star relationship (ROS=0.30) using data from 18 studies with mean age above 65 years and a 2-star relationship (ROS=0.05) using data from 15 studies with mean age below 65 years between physical activity and dementia (Table 37). Engaging in moderate intensity physical activity of 500 MET-minutes/week was associated with a 32% [16-45%] reduction in dementia risk among individuals over 65 years of age, and a 14% [3-25%] reduction among those under 65.
A 2-star relationship (ROS=0.003) was identified for physical activity and Alzheimer’s dementia, although only 3 studies were identified. Studies assessing physical activity and vascular dementia were not identified to conduct subgroup analysis (Table 37)
Table 37. Sub-analyses assessing the relationship between physical activity and risk of dementia by age and clinical subtype of dementia. Subgroup
5.8.6 Population attributable fraction
Low physical activity contributes to 10% of dementia-related health loss, with variation by age and sex. Among females, the mean proportion reduces from 19% at ages 40–44 to 11% at age 80 and above (Figure 76). In males, it reduces from 13% to 7% across the same age range. These variations, however, are not statistically significant when accounting for uncertainty in the estimates. They also reflect our age and sex specific definitions for the theoretical optimum level of physical activity.

Figure 76. Population attributable fractions for dementia burden due to low physical activity by age and sex, 2023. Error bars denote 95% uncertainty intervals.
Temporal analysis shows that the proportion of dementia health loss due to low physical activity has remained consistent at around 10% from 1990 to 2023 (Figure 77).

Figure 77. Temporal trends in population attributable fraction for dementia burden due to low physical activity, 1990-2023. Blue shading depicts 95% uncertainty intervals.
The proportion of dementia health loss attributable to low physical activity tends to be slightly higher in southeastern states, though overall variation across states is modest, ranging from 9.5% in California to 11% in Tennessee (Figure 78).

Figure 78. State-level dementia disability-adjusted life-years attributable to low physical activity, 2023, both sex, all-age.
5.8.7 Attributable burden
In 2023, an estimated 334,000 dementia DALYs was attributable to low physical activity. The burden was greater among females, accounting for 243,000 DALYs, compared to 91,000 among males (Figure 79)

Figure 79. Proportion of dementia burden attributed to low physical activity by sex, 2023
Total DALYs peak in the 75–84 age group. Across all age groups, females experience a higher burden of health loss, with more than twice the number of DALYs compared to males among those aged 65 and older (Figure 80).
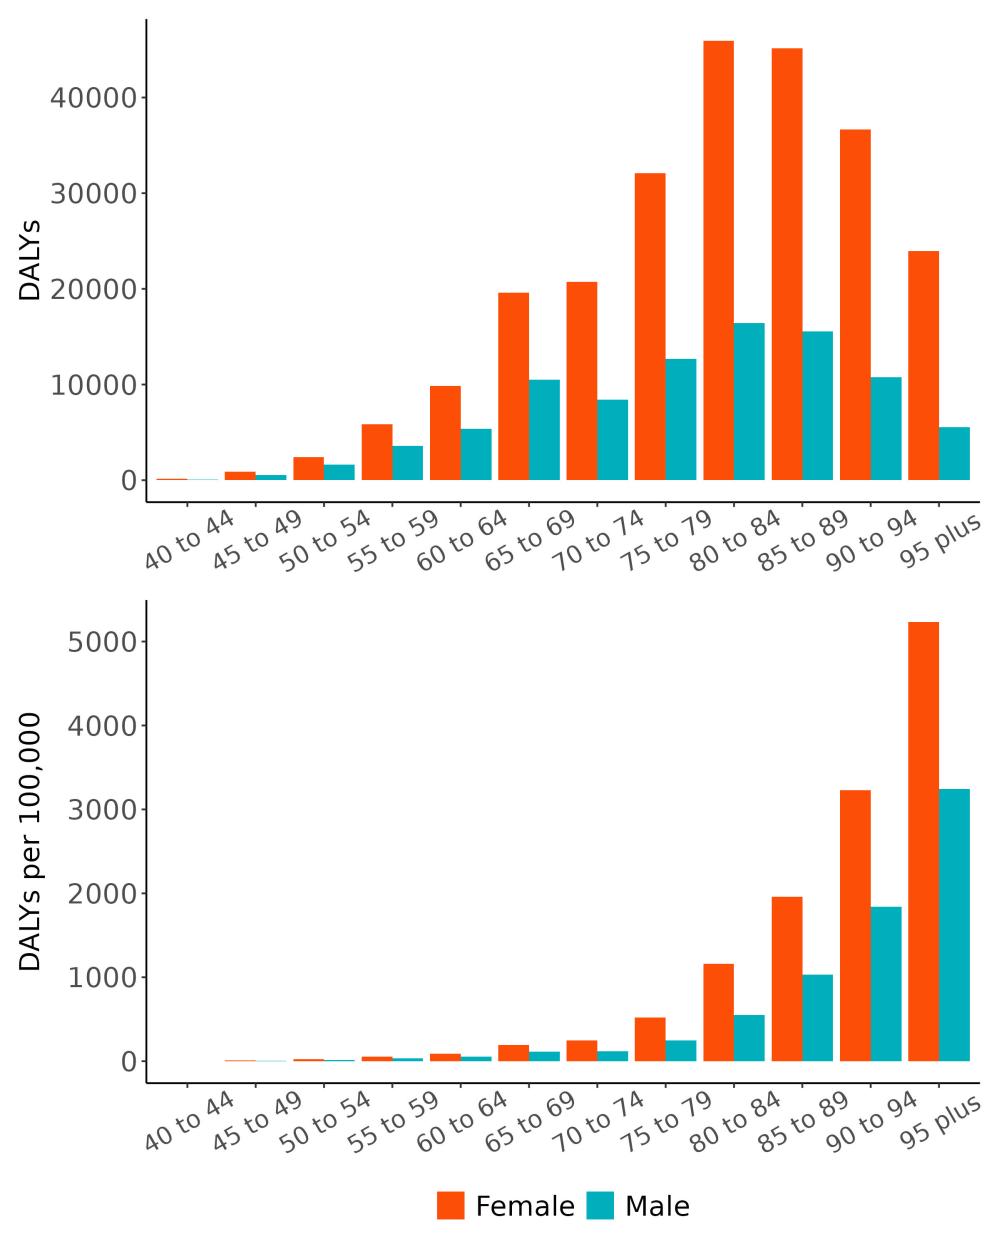
Figure 80. Disability-adjusted life-years lost due to dementia attributable to low physical activity by age and sex, 2023.
The rate of attributable burden due to low physical activity varies by state and ranges from 59 DALYs/100,000 to 128 DALYs/100,000. The highest rates are observed in Pennsylvania followed by Hawaii. The lowest rates are in the Utah and Alaksa (Figure 81)

Figure 81. State-level dementia disability-adjusted life-years attributable to low physical activity, 2023, all-age.
5.8.8 Major takeaways
• Physical activity levels have declined over the past decades, which may be attributed to technological innovations that make daily tasks more convenient but also more sedentary.
• Increasing physical activity is associated with a reduced risk of dementia. Notably, achieving the recommended minimum of 150 minutes a week of moderate-intensity exercise24 is associated with an approximately 20% reduction in dementia risk.
• The proportion of dementia health loss attributable to low physical activity is higher in females than males, reflecting the significantly lower physical activity levels typically observed among women.
• In 2023, an estimated 334,000 dementia DALYs was due to low physical activity in the United States, 243,000 for women and 91,000 for men.
• Physical activity should remain a cornerstone of dementia prevention strategies as it influences key risk factors such as blood pressure, blood glucose levels, and mental health.
• Thoughtfully designed urban environments and supportive workplace policies can play a vital role in encouraging individuals to incorporate more physical activity into both their daily routines at home and throughout the workday.
5.9 Smoking
5.9.1 Exposure definition
Current usage of any smoked tobacco process, at least within the last six months. Exposure to smoking is measured as the number of cigarettes consumed per day.
5.9.2 National-level and state-level exposure and disparities
Exposure to smoking, as defined above, varied across the globe (Table 38) with the highest exposure in Bulgaria, and the lowest exposure in Nigeria. The United States, placing 113th in exposure, generally experiences relatively low smoking exposure on the global scale. Within the United States West Virginia has the highest number of cigarettes consumed per day, with a mean 1.71x higher than the national average (Table 39, Figure 82).
Table 38. National ranking of exposure levels, 2023.
Countries with highest smoking prevalence, all age, both sex
1. Bulgaria, 0.287
2. Tokelau, 0.276
3. Greenland, 0.275
4. Kiribati, 0.268
5. North Macedonia, 0.260
6. Maldives, 0.255
7. Micronesia, 0.255
8. Andorra, 0.253
9. Montenegro, 0.248
10. Greece, 0.244
Countries with lowest smoking prevalence, all age, both sex
195. Togo, 0.027
196. Cameroon, 0.025
197. Ecuador, 0.025
198. Guinea-Bissau, 0.023
199. Peru, 0.02
200. Ethiopia, 0.023
201. Ghana, 0.021
202. Sao Tome and Principe, 0.020
203. Benin, 0.019
204. Nigeria, 0.011
Countries with smoking prevalence similar to the United States
112. Australia, 0.096
113. United States, 0.095
114. Dominica, 0.094
Table 39. State ranking of exposure levels, 2023.
Highest smoking prevalence, all age, both sex
1. West Virginia, 0.162
2. Kentucky, 0.151
3. Arkansas, 0.150
4. Tennessee, 0.134
5. Mississippi, 0.132
Lowest smoking prevalence, all age, both sex
47. Connecticut, 0.075
48. Maryland, 0.074
49. Hawaii, 0.072
50. California, 0.061
51. Utah, 0.052
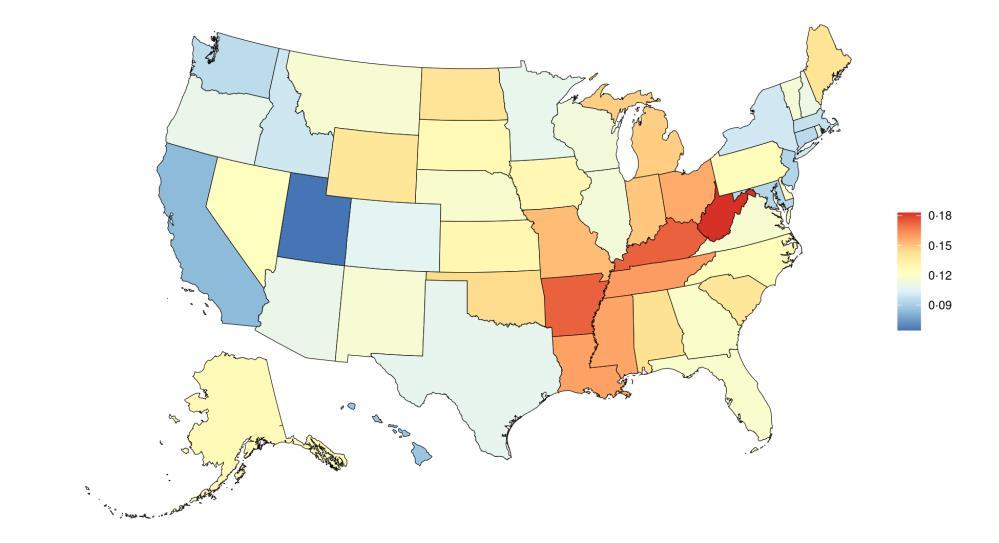
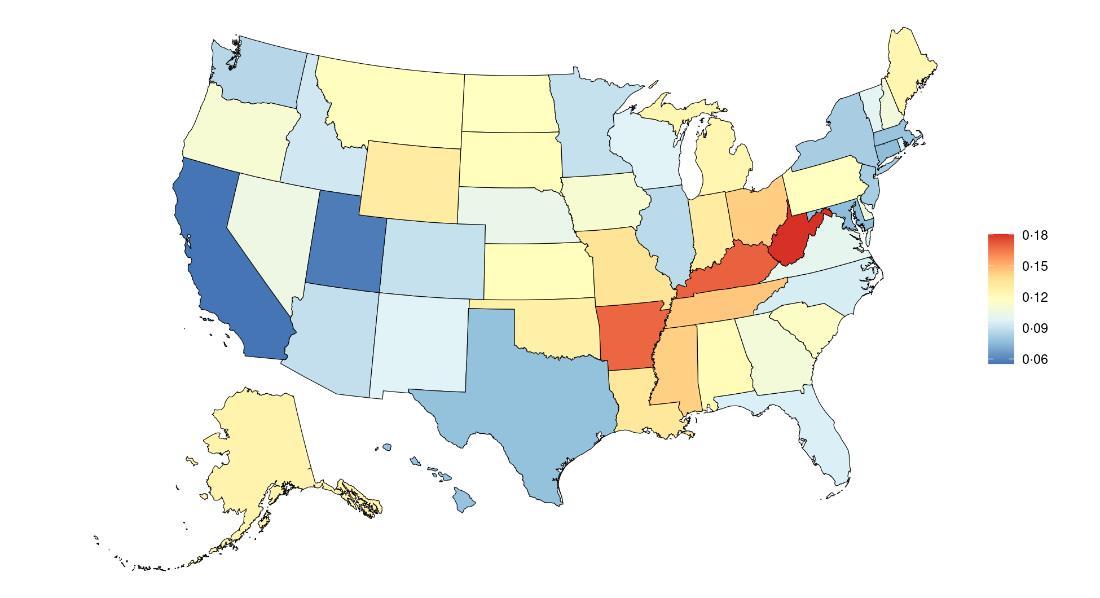
Figure 82. State-level smoking prevalence in the United States, all age, 2023 (males top, females bottom).
Smoking prevalence in the United States has decreased over time, with the introduction of effective public health campaigns and policy interventions (Figure 83).25,26
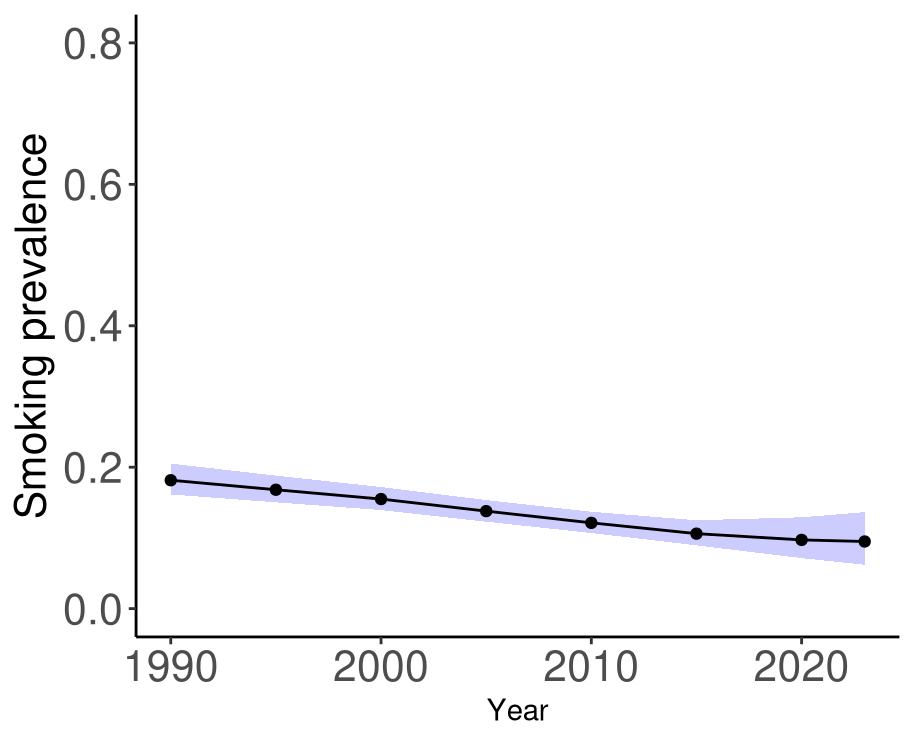
Figure 83. Temporal trends in smoking prevalence in the United States, 1990-2023. Purple shading depicts 95% uncertainty intervals.
5.9.3 Data landscape
We included studies which reported:
• Association between a continuous or categorical dose for smoked tobacco consumption
• Cigarettes/day exposure for current tobacco smokers
• Current smokers vs never smokers
• Years since quitting exposure for former tobacco smokers
We excluded studies in which:
• No dose-response smoking data were available
Using the criteria above, we identified 294 studies, and after screening included a total of 8 studies with relevant relative risk data for our analyses (Figure 84)

Figure 84. PRISMA diagram for smoking systematic review showing inclusion and exclusion of studies at each systematic review stage.
Table 40 (next page) describes the studies among US populations included from the systematic review. Of the 8 studies identified for inclusion from the systematic reviews, two were conducted in the US. Studies mostly used questionnaires and subsequent dementia identification via physician diagnosis or medical records. Follow-up time ranged to 23 years. One study estimated the relationship between smoking and all-cause dementia and Alzheimer’s disease, while one focused only on the relationship with Alzheimer’s disease.
Table 40. United States studies included from the systematic review
First author, year
Shalat, 1987
Geriatric Research, Education, and Clinical Center Massachusetts, USA 10,276 ≥ 40 NA
Self-report questionnaire Physician diagnosis
Rusanen, 2011 Kaiser Permanente California, USA 21,123 ≥ 50 23 Self-report questionnaire
• = dementia subtype is an outcome available in study.
5.9.4
Evidence score summaries
Risk of dementia increases as the average number of cigarettes consumed each day increases (Figure 85). Using data from eight studies, we found that smoking five cigarettes per day is associated with a 16% increased risk of dementia, ten cigarettes per day with a 29% increased risk of dementia, and twenty cigarettes per day with a 49% increased risk of dementia compared to no cigarette consumption. Only three of the studies included information specific to Alzheimer’s disease and none that were specific to vascular dementia, so we did not estimate the relationship for these separately.
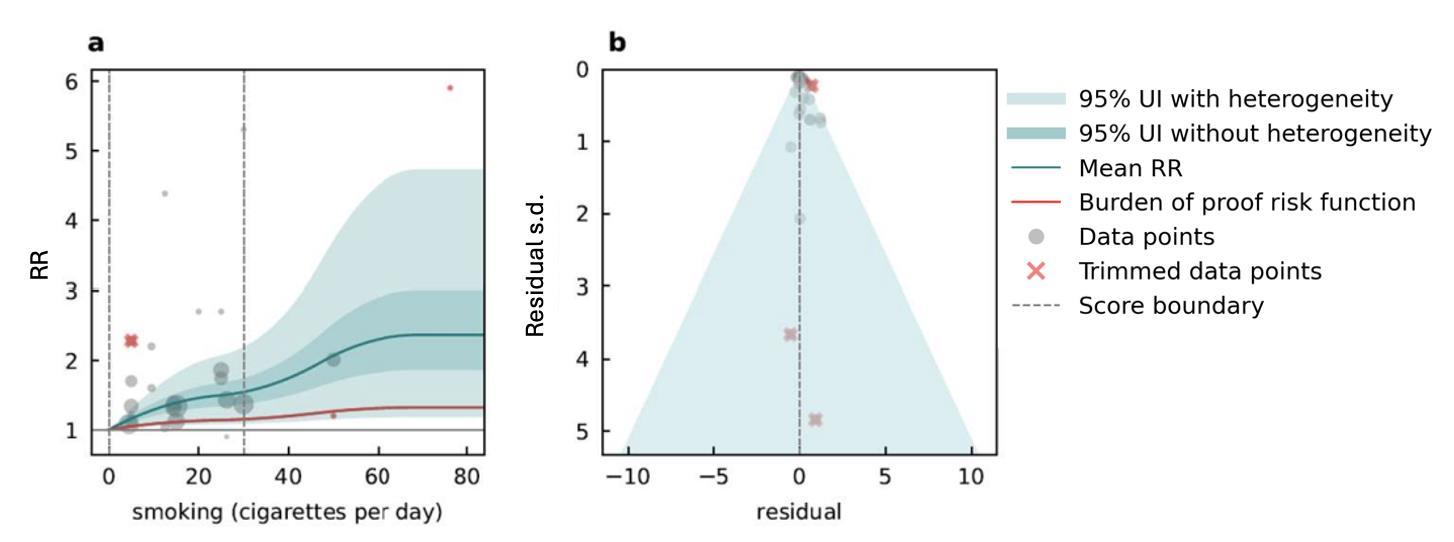
Figure 85. Smoking (cigarettes per day) and dementia risk. a, Relative-risk (RR) function. The solid green line represents the mean RR at each exposure level. The dark green shaded area indicates the 95% UI without accounting for between-study heterogeneity, while the light green shaded area represents the 95% UI accounting for between-study heterogeneity. The size of the data point is proportional to the inverse of the s.d. of the effect estimates, where larger points indicate higher precision in the effect estimates. b, A modified funnel plot showing the residuals (relative to zero) on the x axis and the estimated s.d. (inclusive of between-study heterogeneity) on the y axis.
5.9.5
Population attributable fraction
The fraction of dementia health loss that can be attributed to smoking in 2023 by state is highest in Alaska and Nevada, and lowest in Utah (Figure 86).
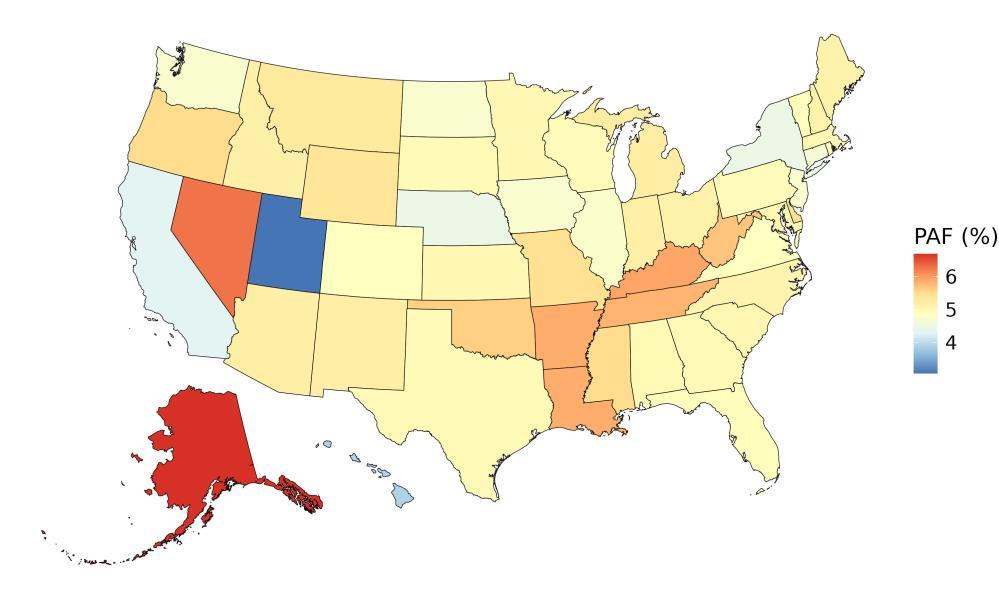
Figure 86. State-level population attributable fractions for dementia burden due to smoking, 2023, both sex, all age.
Population-attributable fractions are higher in men than women in the US. For example, at age 44 to 44 years, the PAF for men is 12.6% and for women is 9.9%. The attributable fraction of dementia health loss for smoking decreases over age (Figure 87).
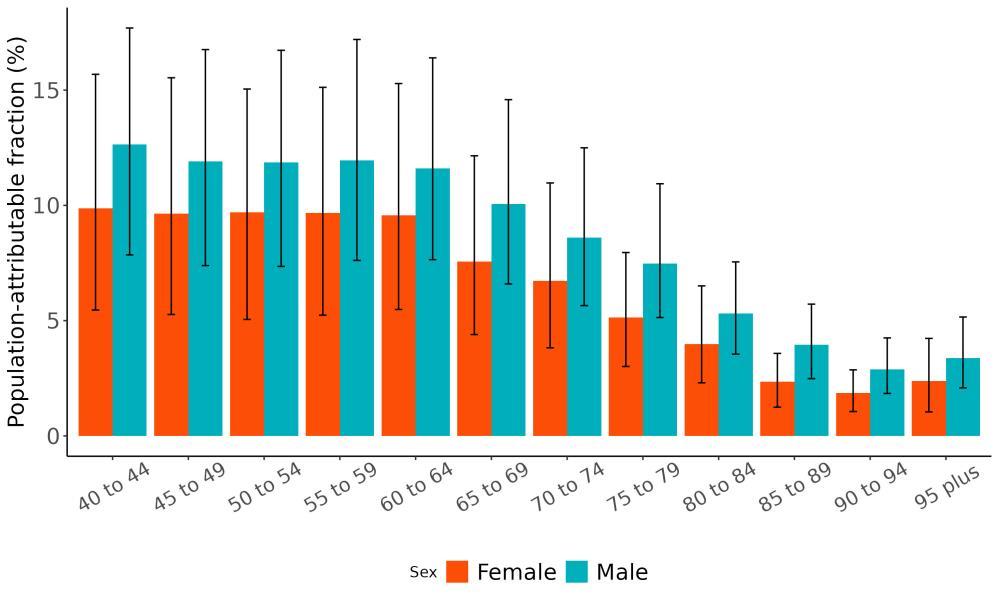
Figure 87. Population attributable fractions for dementia burden due to smoking by age and sex, 2023.
The average attributable fraction has shown only small declines over three decades (Figure 88). This reflects temporal trends in exposure to smoking in older age groups in the US, where there were modest declines over time that are smaller in magnitude than younger age groups.
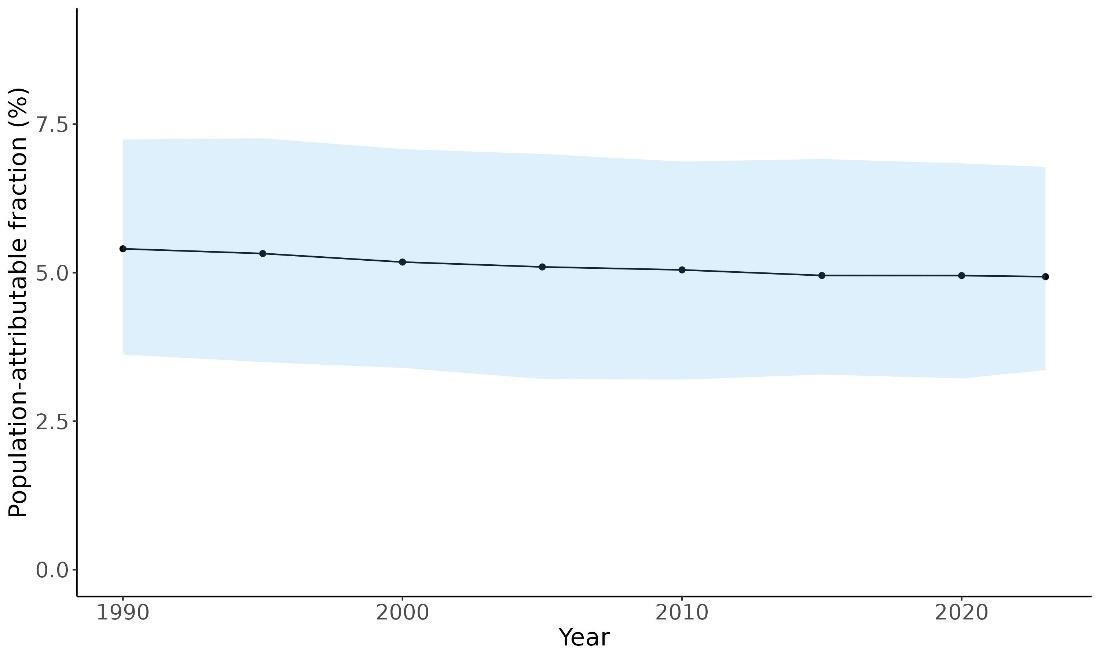
Figure 88. Temporal trends in population attributable fractions for dementia burden due to smoking, 1990-2023.
5.9.6 Attributable burden
Of all dementia health loss in the US in 2023, 90 thousand of 2.1 million disability-adjusted lifeyears for women and 74 thousand of 1.1 million disability-adjusted life-years for men were attributable to smoking and could have been averted if smoking were eliminated (Figure 89)

Figure 89. Proportion of dementia burden attributed to smoking by sex, 2023.
The total number of disability-adjusted life-years attributed to smoking peaks for individuals in the US who are 65-80 years old and is modestly higher for women (Figure 90). The higher number for females is because dementia is more common in females and because women live
to older ages than men even though smoking is more common in men. Rates increase over age, with higher rates in men reflecting higher exposure to smoking.
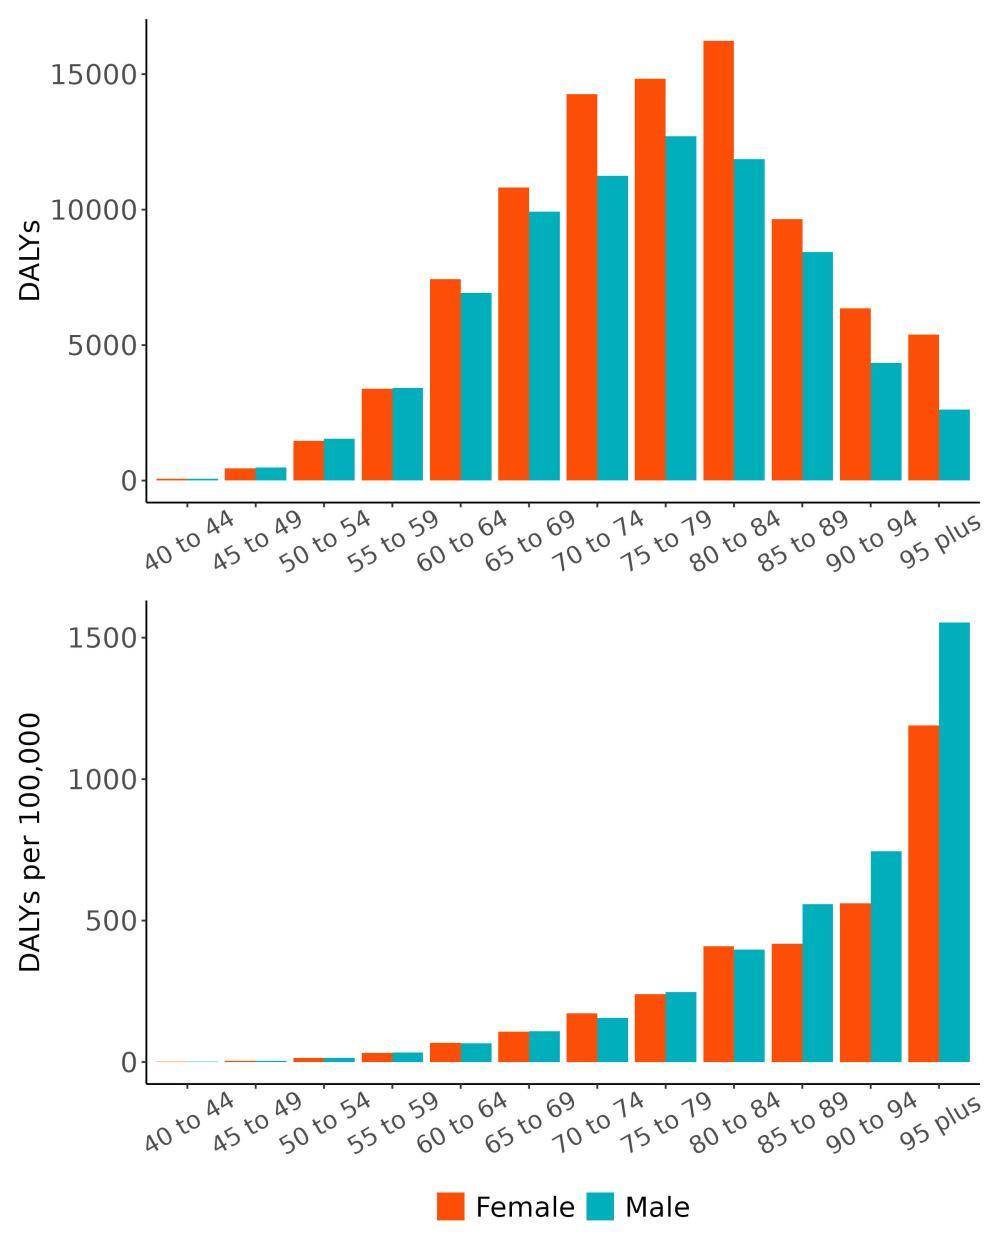
Figure 90. Dementia disability-adjusted life-years attributable to smoking by age and sex, 2023. Rates of dementia health loss attributed to smoking ranged from the least attributable health loss in Utah and Texas to the most attributable health loss in Main and Pennsylvania (Figure 91). This reflects the combined effects of the relationship between smoking and dementia risk, the rates of smoking in each state, and the rates of dementia in each state.
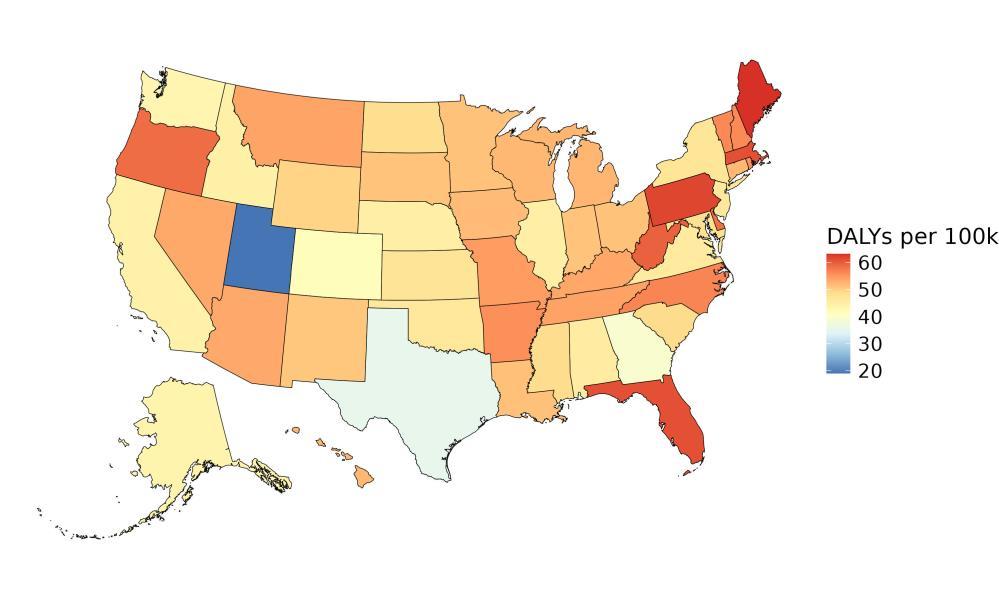
Figure 91. State-level dementia disability-adjusted life-years attributable to smoking, 2023, both sex, all age.
5.9.7 Major takeaways
• Smoking prevalence in the United States has decreased between 1990 and 2023, but the decrease was smaller in older age groups compared to young adults.
• Smoking prevalence in 2023 was highest in West Virginia and lowest in Utah, more common in males than females, and more common in ages 15-40 than for adults over age 40.
• Smoking five or more cigarettes per day increases the risk of dementia by at least 14%.
• The fraction of dementia health loss that can be attributed to smoking in 2023 by state ranged from 3.0% in Utah to 6.1% in Alaska.
• In 2023, 164,000 dementia disability-adjusted life years were attributed to smoking in the United States, 90,000 for females and 74,000 for males.
• Although overall smoking prevalence has decreased over time it is still the leading cause of preventable death in the United States according to the CDC and work from our institute has demonstrated that even a conservative estimate shows strong evidence for risk of conditions including laryngeal cancer, aortic aneurysm, peripheral artery disease, lung cancer, and other pharynx cancer.9
• States should continue to support policies to promote awareness about the dangers of smoking, including warning labels on tobacco products, support insurance coverage of cessation programs, and prohibit smoking in public spaces.
5.10 Social Isolation
5.10.1 Exposure definition
Social isolation refers to a state of minimal or complete lack of social contact with others. It is considered an objective measure that focuses on the actual absence of social interactions or connections, rather than subjective experiences like loneliness, perceived lack of support, or relationship quality. Studies assess social isolation in a wide variety of ways, often falling into two distinct components: social network measures, which assess the size, frequency, and proximity of an individual’s social ties (e.g., number of close friends or family members); and social activity measures, which capture participation in social events or group activities (e.g., attending religious services, clubs, or community gatherings). Gold-standard measures, such as the Lubben Social Network Scale and the Berkman-Syme Social Network Index, often determine levels of social isolation using combined scores from both social network and social activity domains.
5.10.2
National-level and state-level exposure and disparities
Social isolation is not currently estimated by the GBD, so national-level estimates are unavailable. To model exposure to social isolation, we used state-specific data from the American Community Survey (ACS)27 for the years 2015 through 2023 (excluding 2020). The ACS is a nationally representative, ongoing survey conducted by the US Census Bureau, which surveys approximately 3.5 million households annually. We used the proportion of individuals living alone in each state as a proxy measure for social isolation. From these data, we estimated that social isolation was highest in D.C. and lowest in Utah (Table 41, Figure 93). Because these estimates are limited to the United States, we were unable to produce national rankings for this risk factor.
Table 41. State ranking of exposure levels, 2023.
Highest social isolation, all ages above 45*, both sex
1. District of Columbia, 0.323
2. North Dakota, 0.221
3. Ohio, 0.211
4. Louisiana, 0.208
5. South Dakota, 0.208
Lowest social isolation, all ages above 45*, both sex
47. Idaho, 0.159
48. Texas, 0.158
49. California, 0.145
50. Hawaii, 0.141
51. Utah, 0.130
*Estimates only available in age groups 45 and above, given limitations from the ACS dataset.


Figure 92. State-level social isolation prevalence in the United States, ages 45 and above, 2023 (males top, females bottom).
Social isolation prevalence, defined as living alone versus not, has remained steady in the United States (Figure 93).
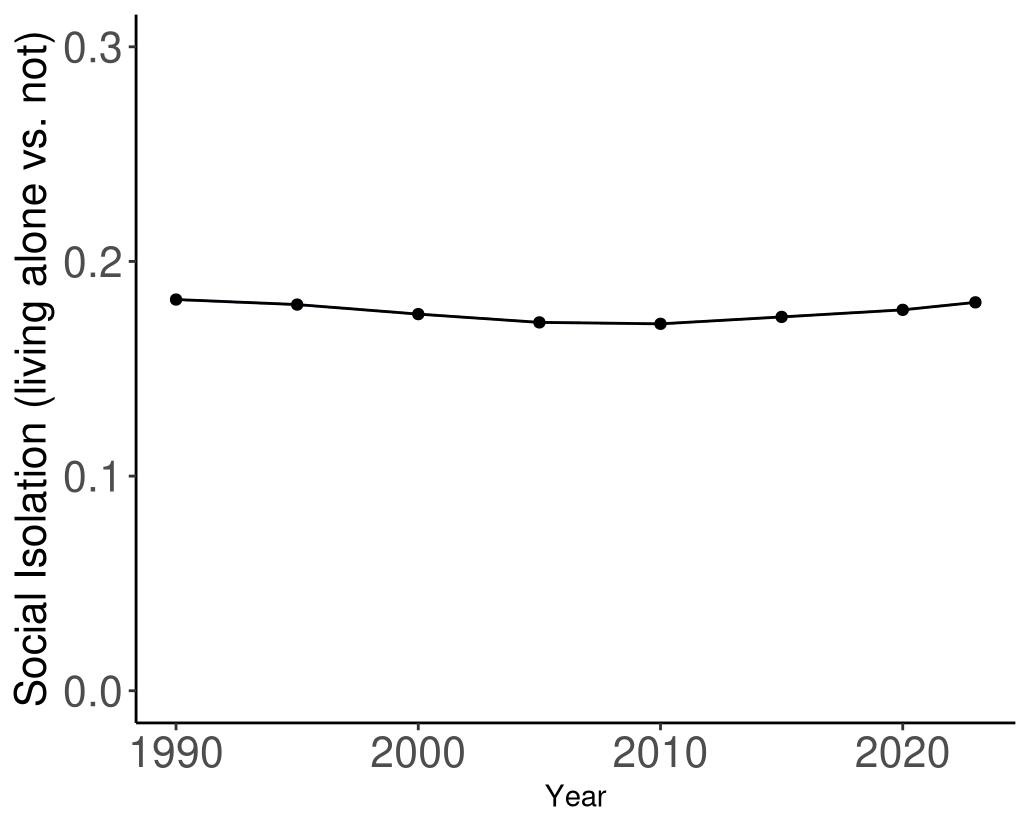
Figure 93. Temporal trends in social isolation prevalence (living alone) in the United States, 1990-2023.
5.10.3
Data landscape
We included studies in which social isolation was measured via:
• Objective and/or subjective measures*
• Metrics of social network, social activity, or social support
• Dichotomous or categorical measures of social isolation
We excluded studies in which:
• Exposure was only a measure of loneliness
• No clear definition provided
• Continuous measures of social isolation (e.g., studies reporting the effect per additional point of severity in social isolation)
* While subjective isolation measures, such as perceived loneliness or social support, were not included in the project's definition of social isolation, they were used for exploratory analyses.
Using the criteria above, we identified 1,225 unique studies, and after screening included a total of 61 studies with relevant relative risk data for our analyses (Figure 94).

Figure 94. PRISMA diagram for social isolation systematic review showing inclusion and exclusion of studies at each systematic review stage.
Table 42 (next page) describes the studies among US populations included from the systematic review. Of the 61 studies identified for inclusion from the systematic review, five were conducted in the US. The majority of studies used the Berkman Syme Index to capture social isolation and subsequent dementia identification via physician diagnosis or one via medical records. Follow-up time ranged from 5-13.8 years. All studies estimated the relationship between social isolation and all-cause dementia
Table 42. United States studies included from the systematic review
First author, year
Huang, 2023
National Health and Aging Trends Study (NHATS) United States 5,022
Salinas, 2017 Framingham Study (Cohort and Offspring) Massachusetts, USA 1,834 ≥65 [11]
Xiang, 2021
National Health and Aging Trends Study
Crooks, 2008
Tan, 2019
States 7,609 ≥65
Kaiser Permanente Southern California California, USA 2,249 ≥75 5
US National Health Insurance Survey (NHIS) United States
• = dementia subtype is an outcome available in study.
Berkman Syme Network Index Physician diagnosis
BerkmanSyme Social Network Index (SNI) Physician diagnosis
Berkman Syme Network Index Physician diagnosis
Lubben Social Network Scale Physician diagnosis
Social isolation case definitions in the literature are very heterogeneous, and we closely tracked case definitions for further tests in the modelling process. Of the studies included from the systematic review, the most common social isolation case definition excluded from the main model, were social network definitions, given they only capture one aspect of isolation (Table 43).
Table 43. Social isolation ascertainment methods in input studies.
Social network
Social activity
Composite measures with both social network and activity components
12 Yes
Loneliness 11 No
Measures exclusively focused on social networks, such as number of social contacts or living alone vs. with others, capture only one aspect of social isolation and do not reflect a full picture.
Measures focused solely on social activity, like group attendance or volunteering, capture only one aspect of social isolation and do not provide a comprehensive view.
Measures that include both network and activity components, such as the Berkman Syme Network Index or Lubben Social Network Scale, are considered gold-standard tools for assessing overall social isolation.
Measures using questions like “How often do you feel lonely?” reflect a subjective experience of social isolation and are distinct from objective measures of social contact.
Social support
Measures asking about perceived support (e.g., “How supported do you feel by friends?”) assess a subjective aspect of social isolation and are considered distinct from objective social contact.
5.10.4 Evidence score summaries
We identified a statistically significant association between social isolation and dementia risk across 11 studies (Figure 95). Individuals classified as socially isolated, based on each study’s chosen cutoff, had a 28% higher risk of developing dementia compared to those who were not isolated. Using the most conservative estimate of excess risk, social isolation was associated with a 15% average increase in dementia risk. The corresponding ROS was 0.07, reflecting a two-star relationship.
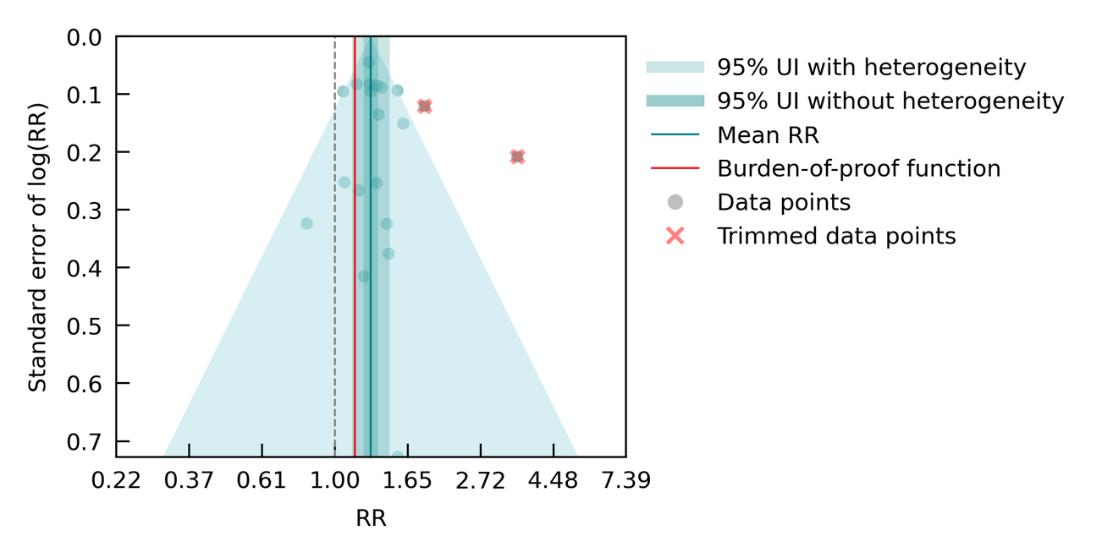
Figure 95. Social isolation and dementia risk. The figure shows a funnel plot with the relative risks (RR) on the x axis and standard error of the log(RR) on the y axis. The solid green line represents the mean RR. The dark green shaded area indicates the 95% UI without accounting for between-study heterogeneity, while the light green shaded area represents the 95% UI accounting for between-study heterogeneity.
5.10.5 Sub- analyses
Sub-analyses showed variation in the strength of association between social isolation and dementia risk depending on how isolation was measured. Models based on exclusive social activity measures and exclusive social network measures, both of which captured only one dimension of isolation, showed elevated but less consistent associations. Specifically, social activity measures were associated with a 27% increased risk (RR: 1.27 [0.97–1.67]) and received a two-star rating, while social network measures showed a similar point estimate (RR: 1.33 [0.81–2.15]) but with wider uncertainty, leading to a one-star rating. Neither model used measures which aligned with the gold-standard definition used in the main model, which required a composite scale incorporating both activity and network components.
Age-stratified models showed modest but consistent associations. Studies with a mean baseline age over 65 reported a 30% increased risk (RR: 1.30 [1.02–1.64]; two stars), while studies with a mean age of 65 or younger showed a 26% increased risk (RR: 1.26 [1.07–1.50]; two stars), suggesting the association holds across age groups.
Studies using loneliness measures were excluded from the main model due to being a subjective measure, rather than objectively measuring social disconnect. However, when they were included in a model for exploratory context, it showed the strongest association overall (RR: 1.53 [1.35–1.73]; three stars). While conceptually distinct from social isolation, these findings suggest that perceived social disconnect may play an important role in dementia risk. This highlights a potential direction for future work to explore the way subjective and objective social factors potentially interact or operate through shared pathways. Results from subanalyses are summarized in Table 44
Table 44. Sub-analyses assessing the relationship between different types of social isolation, loneliness, or age and dementia risk.
(95% CI with
Sub-analysis
5.10.6 Population attributable fraction
The fraction of dementia health loss that can be attributed to social isolation ranges from 10.3% in the District of Columbia and 7.7% in North Dakota to 5.2% in Hawaii (Figure 96). Higher population-attributable fractions were concentrated in parts of the Mid-Atlantic and upper Midwest, while lower fractions were observed in several Western and Southern states. These patterns likely reflect differences in the prevalence of social isolation (defined here as the percentage of the population living alone), as well as underlying demographic and social factors such as urbanicity, age structure, and community connectedness.
Importantly, this analysis used state-level data from the American Community Survey on the percentage of the population living alone as a proxy for social isolation prevalence. While this measure has been used in prior research as an indicator of social isolation,28 it does not directly capture the gold-standard definition of social isolation used in this project – namely, using measures that capture both a deprivation of social network and social activity.
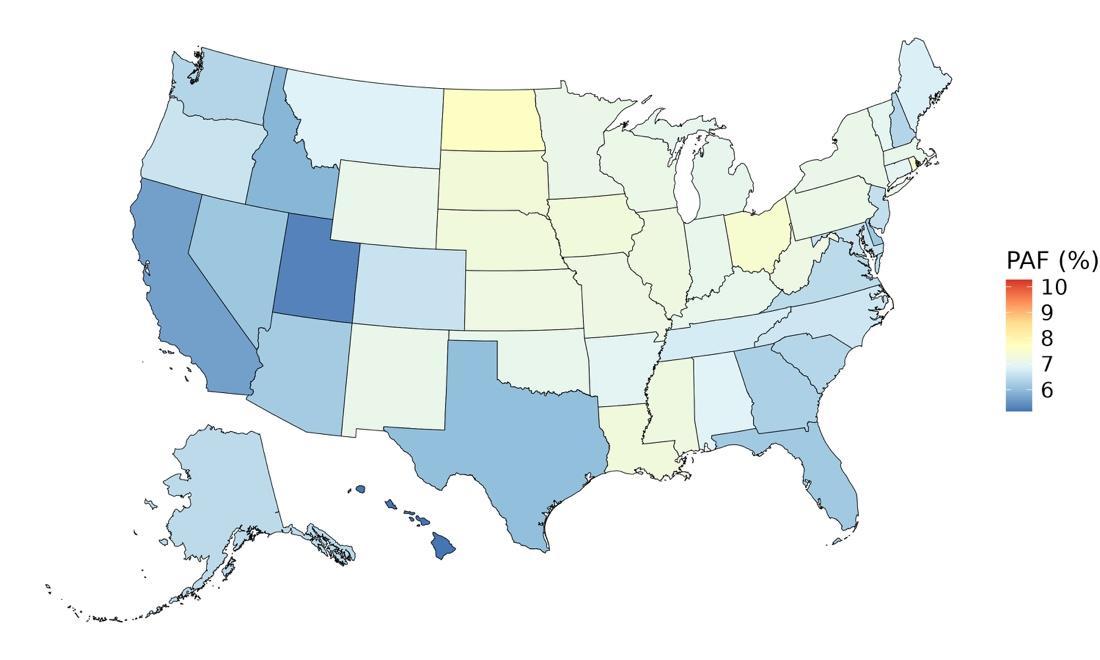
Figure 96. State-level population attributable fractions for dementia burden due to social isolation, 2023, both sex, all age
The attributable fraction of dementia health loss due to social isolation in the US was found to remain relatively stable from 1990 to 2023 (Figure 97). This would typically suggest that the contribution of social isolation to dementia burden has been consistent over time. However, this interpretation is limited by data availability: current estimates are based on the percentage of people living alone, drawn from the American Community Survey (ACS), which only provides data from 2015-2023 (excluding 2020). As a result, earlier years are extrapolated from more recent data and may not reflect actual trends over time.
Although our own analysis is limited by lack of availability of state-specific, time-varying, and multi-dimensional point-prevalence measures of social isolation, external sources suggest that social disconnection may be increasing. The US Surgeon General’s 2023 Advisory highlights a steady rise in average time spent alone – from 2003 to 2020, individuals spent an additional 24 hours per month alone, on average. Social engagement also declined, with people spending 20 fewer hours per month with friends. The most dramatic declines were observed among young adults aged 15-24, whose in-person time with friends dropped nearly 70%, from about 150 minutes per day in 2003 to 40 minutes per day in 2020 (US Department of Health and Human Services, 2023). Together, these findings suggest that while the modeled estimates appear stable, they may underestimate the true rise in social isolation over recent decades.
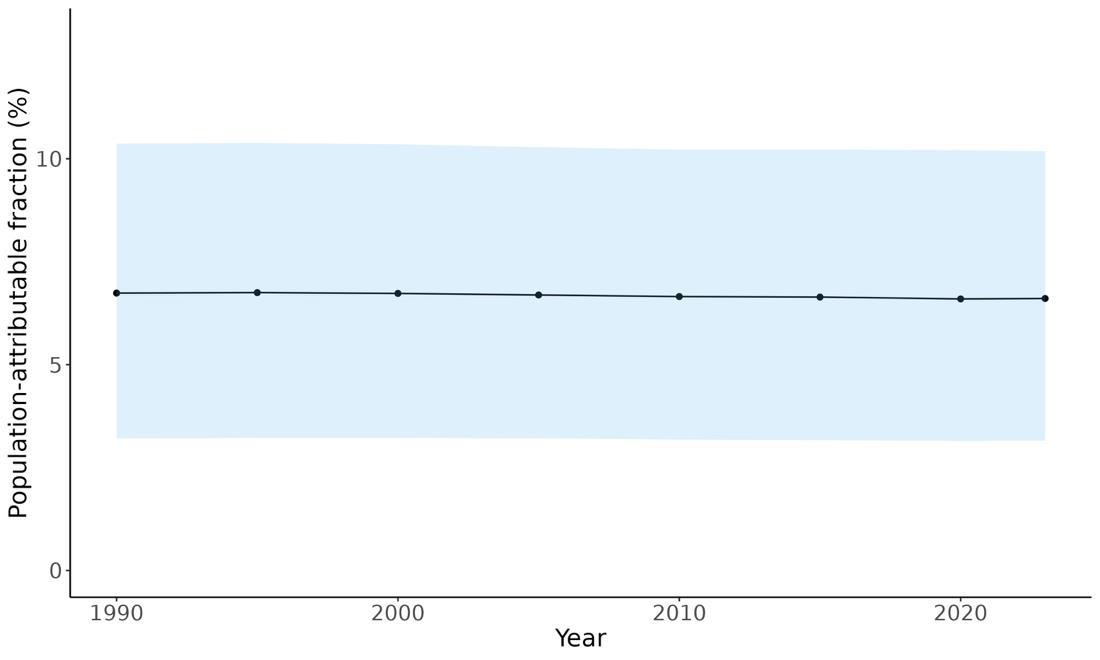
Figure 97. Temporal trends in population attributable fractions for dementia burden due to social isolation, 1990-2023.
In 2023, the fraction of dementia health loss attributable to social isolation was notably higher among older adults compared to younger age groups (Figure 98). However, interpretation of these findings is limited by constraints in the input data – specifically, only having ACS data in broad age categories (45-64 and 65+) and not having these data split by sex. To account for this, ACS data were applied equally across all smaller age groups and to both males and females, preventing any evaluation of sex-specific trends or more granular age group variation in social isolation-related dementia burden.
A study by Umberson and colleagues found that men experienced significantly higher levels of social isolation than women across most of the life course, particularly among those who were never married or had experienced disrupted relationship histories.29 Their analysis also reported that social isolation steadily increased with age for both men and women, beginning in adolescence. These patterns are consistent with our findings, which demonstrate the link between elevated levels of social isolation and increased dementia burden in later life.
Given recent evidence from the US Surgeon General’s advisory showing sharp declines in social engagement among young adults, these patterns raise concern that younger cohorts may face growing risks of cognitive decline related to social isolation in the future.28 Together, these findings emphasize the importance of addressing social isolation as a modifiable risk factor for dementia across the lifespan – not only in older populations, but increasingly among younger generations.

Figure 98. Population attributable fractions for dementia burden due to social isolation by age and sex, 2023.
5.10.7 Attributable burden
Attributable burden represents the amount of dementia health loss that could be avoided if no one in the population was socially isolated. It combines information about the relationship between social isolation and dementia, the number of people living with or dying from dementia, and the exposure to social isolation in a given geography. In 2023, approximately 220,417 dementia disability-adjusted life years were attributed to social isolation, 144,364 for females and 76,054 for males (Figure 99). As noted, this analysis could not capture sex differences in exposure to social isolation. Therefore, the higher number of dementia DALYs among females reflects the higher prevalence of dementia in women and their longer life expectancy compared to men.
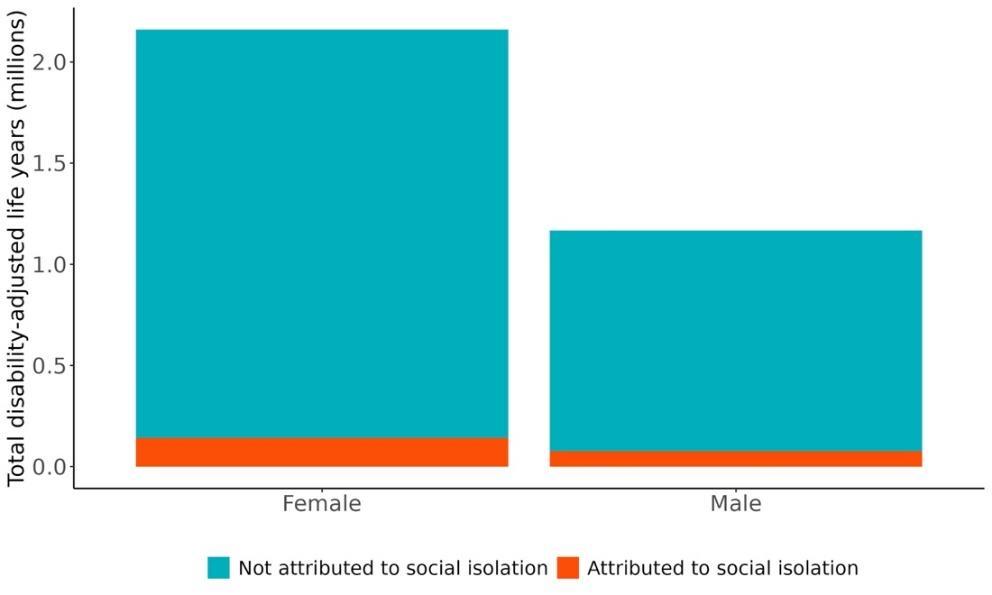
99. Proportion of dementia burden attributed to social isolation by sex, 2023.
Figure
The highest rate of dementia-related health loss attributable to social isolation was found in Pennsylvania, with approximately 89.4 DALYs per 100,000 people, followed by Maine (85.6 DALYs per 100k) and Massachusetts (85.3 DALYs per 100k). These states tended to have a higher prevalence of social isolation and a greater burden of dementia. In contrast, the lowest rates were seen in Utah (31.2 DALYs per 100k), Texas, and Alaska (Figure 100). These patterns reflect differences in underlying dementia and social isolation prevalence and may also be informed by differences in demographic factors and social connectivity dynamics and opportunities across states, as well as differences in population age structure.

Figure 100. State-level disability-adjusted life-years lost due to dementia attributable to social isolation, 2023, both sex, all age.
The number of disability-adjusted life years (DALYs) lost to dementia attributable to social isolation was significantly higher among females than males across all age groups in 2023. The burden peaked in the 80–84 age group, with approximately 28,736 DALYs for females and 15,551 for males, followed by a gradual decline in the oldest age groups (Figure 101). This likely reflects the combined effects of higher dementia burden in late life and shrinking population size at oldest ages.

Figure 101. Disability-adjusted life-years lost due to dementia attributable to social isolation by age and sex.
5.10.8 Major takeaways
• Individuals classified as socially isolated had a 28% higher risk of developing dementia compared to those who were not isolated.
• Using a conservative estimate, social isolation was associated with a 15% average increase in dementia risk, corresponding to a two-star strength of evidence (ROS: 0.07).
• In sub-analyses, stronger effects were observed for lack of social activity than for limited social network size, highlighting the importance of regular social engagement.
• The fraction of dementia health loss attributable to social isolation in 2023 ranged from 10.3% in the District of Columbia and 7.7% in North Dakota to 5.2% in Hawaii
• Higher PAFs were concentrated in the Mid-Atlantic and upper Midwest, while lower PAFs were seen in parts of the West and South. These patterns likely reflect geographic variation in social isolation prevalence and broader demographic and social factors.
• In 2023, social isolation-attributable dementia burden was higher among older age groups than younger ones.
• Approximately 220,400 dementia DALYs in 2023 were attributable to social isolation –144,400 among females and 76,000 among males.
• The highest rates of dementia-related DALYs attributable to social isolation was found in Pennsylvania, Maine, and Massachusetts; the lowest rates were found in Utah, Texas, and Alaska.
• The burden of dementia DALYs attributable to social isolation peaked in the 80-84 age group, with 28,736 DALYs for females and 15,551 for males at this age, and was consistently higher among females across all age groups.
5.11 Systolic Blood Pressure
5.11.1 Exposure definition
Systolic blood pressure (SBP) is the pressure exerted on the walls of the arteries when the heart contracts and pumps blood into the circulatory system. Our gold standard assessment of systolic blood pressure is an average of at least two measurements while sitting. We model mean SBP in millimeters of mercury (mmHg).
We define high systolic blood pressure as pressure above the theoretical minimum range of 105 to 115 mmHg. We include studies that measure SBP as the average of at least two measurements while sitting and make adjustments for exposure quality where this was not explicitly stated. We excluded studies that did not clinically assess SBP and studies that focused on secondary hypertension.
5.11.2 National-level and state-level exposure and disparities
Exposure to high systolic blood pressure (SBP) as defined above, varied significantly across the globe (Table 45) with a gap of 23.03 mmHg between Tajikistan, with the highest mean systolic blood pressure, and Greenland, with the lowest mean systolic blood pressure. The United States, placing 200th in exposure, generally experiences relatively low SBP exposure on the global scale. Within the United States, West Virginia is a notable outlier, with a mean systolic blood pressure higher than the national average (Figure 102, Table 46).
Table 45. National ranking of exposure levels, 2023
Countries with highest mean systolic blood (mmHg) pressure, all age, both sex
1. Tajikistan, 146.5
2. Moldova, 146.3
3. Tuvalu, 145.3
4. Belarus, 145.2
5. Libya, 144.9
6. Liberia, 144.5
7. Slovenia, 144.4
8. Kazakhstan, 144.2
9. Cote d’Ivoire, 144.1
10. Armenia, 144.0
Table 46. State ranking of exposure levels, 2023
Highest mean systolic blood pressure (mmHg), all age, both sex
1. West Virginia, 128.1
2. Mississippi, 127.9
3. Louisiana, 127.9
4. Kentucky, 127.8
5. Alabama, 127.7
Countries with lowest mean systolic blood pressure (mmHg), all age, both sex
195. Canada, 129.6
196. Eritrea, 129.4
197. Cuba, 129.2
198. Taiwan, 128.2
199. Papua New Guinea, 127.9
200. United States, 127.1
201. Singapore, 125.2
202. Bolivia, 125.2
203. Republic of Korea, 123.7
204. Greenland, 123.4
Lowest mean systolic blood pressure (mmHg), all age, both sex
47. Hawaii, 126.6
48. Vermont, 126.5
49. Washington, 126.5
50. Massachusetts, 126.4
51. Colorado, 126.2
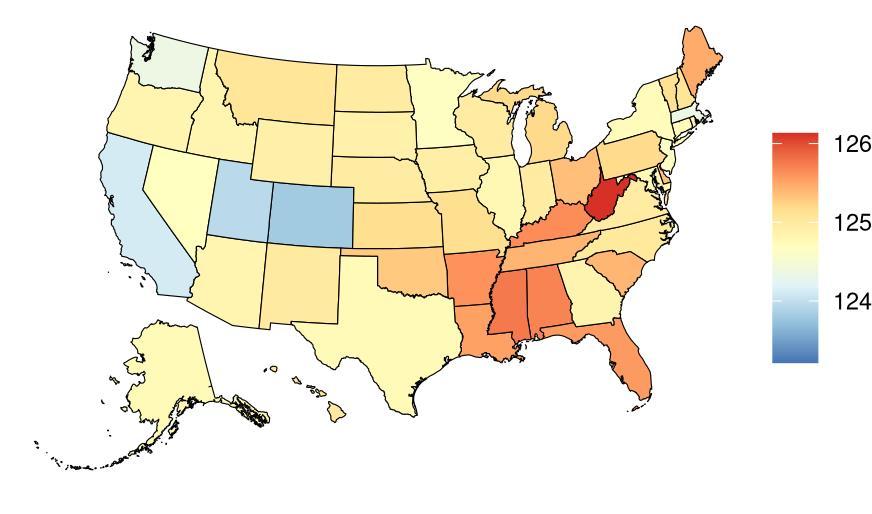

Figure 102. State-level mean systolic blood pressure (mmHg) in the United States, all age, 2023 (males top, females bottom)
Mean systolic blood pressure levels in the United States have remained stable over time (Figure 103).
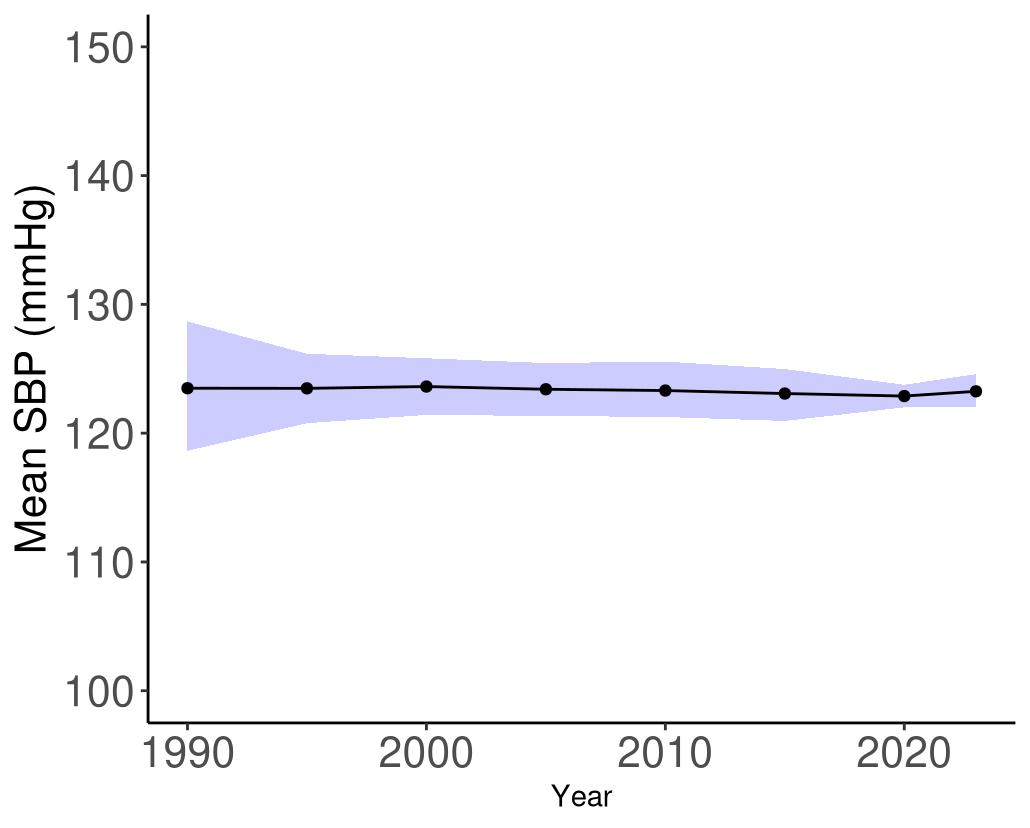
Figure 103. Temporal trends in systolic blood pressure (mmol/L) in the United States, 19902023. Purple shading depicts 95% uncertainty intervals.
5.11.3 Data landscape
We included studies with SBP categories and hypertension:
• SBP is reported as the average of at least 2 measurements (ideally, it would be the average of the last 2 measurements of 3 readings) measured while sitting.
• RCTs are included if SBP reported for each group after the intervention (i.e., use intervention arm as a surrogate for SBP). SBP (e.g., 120-130 mm Hg vs 131-140 mm Hg).
• We include studies that measure SBP as the average of at least two measurements while sitting and make adjustments for exposure quality where this was not explicitly stated.
We excluded studies in which:
• Blood pressure was not clinically assessed while sitting (e.g., orthostatic [standing] or while in a supine position), or SBP is from a single measurement.
• Studies that focused on secondary hypertension.
Using the criteria above, we identified 2,224 unique studies, and after screening included a total of 79 studies with relevant relative risk data for our analyses.

Figure 104. PRISMA diagram for systolic blood pressure systematic review showing inclusion and exclusion of studies at each systematic review stage.
Table 47 (next page) describes the studies among US populations included from the systematic review. Of the 79 studies identified for inclusion from the systematic review, 18 were conducted in the US. All studies used self-reported diagnosed hypertension and subsequent dementia identification via physician diagnosis or medical records. Follow-up time ranged from 4-27 years. Nearly all studies estimated the relationship between systolic blood pressure and all-cause dementia, with four studies also assessing the relationship with Alzheimer’s disease.
Table 47. United States studies included from the systematic review.
First author, year
Lin, 2011
Liu, 2022
Baltimore Longitudinal Study of Aging
Women's Health Initiative Memory Study (WHIMS)
Smagula, 2020
Li, 2007
MonongahelaYoughiogheny Health Aging Team (MYHAT)
The Adult Changes in Thought Study
Biffi, 2019 N/A
Cui, 2018
Cardiovascular Health Study (CHS)
Gilsanz, 2017
Corrada, 2017
Kaiser Permanente Northern California (KPNC)
The 90+ Study (survivors from the Leisure World Cohort Study, LWCS)
First author, year Study
Tosto, 2016
National Institute on Aging LateOnset Alzheimer Disease (NIALOAD)
Launer, 2010 Honolulu-Aging Study
Williams on, 2019
Systolic Blood Pressure Intervention Trial (SPRINT)
Rajan, 2018 Chicago Health and Aging Project (CHAP)
Morris, 2001
East Boston Established Populations for Epidemiologic Studies of the Elderly (EPESE)
Verghese , 2003 Bronx Aging Study
Posner, 2002
Park, 2020
The Washington Heights-Inwood Columbia Aging Project (WHICAP)
Ginkgo Evaluation of Memory Study (GEMS)
McGrath , 2017 Framingham Offspring Study
First author, year
Smith, 2023
• = dementia subtype is an outcome available in study
The majority of included studies measured systolic blood pressure via physical measurement, followed by self-reported hypertension, and ICD-coded hypertension in medical recorded hypertension in ICD-codes.
5.11.4 Evidence score summaries
We observed a statistically significant, non-linear association between SBP and dementia risk using data from 45 studies (Figure 105). Compared to a baseline SBP level of 100 mmHg, SBP levels at the American Heart Association’s threshold for stage I hypertension (130 mmHg), stage II hypertension (140 mmHg), and at hypertensive crisis (180 mmHg) were associated with an average increase in dementia risk of 17%, 22%, and 46%, respectively. Under our most conservative estimate of excess risk, SBP levels between the 15th and 85th percentiles (113-160 mmHg) are associated with an average increase in dementia risk of 7%. The corresponding ROS value is 0.07, reflecting a 2-star relationship.

Figure 105. Systolic blood pressure and dementia risk. a, Relative-risk (RR)function. The solid green line represents the mean RR at each exposure level. The dark green shaded area indicates the 95% UI without accounting for between-study heterogeneity, while the light green shaded area represents the 95% UI accounting for between-study heterogeneity. The size of the data point is proportional to the inverse of the s.d. of the effect estimates, where larger points indicate higher precision in the effect estimates. b, A modified funnel plot showing the residuals (relative to zero) on the x axis and the estimated s.d. (inclusive of between-study heterogeneity) on the y axis.
5.11.5 Sub-analyses
We found that increasing SBP was associated with increased dementia risk for age groups under 75. The SBP threshold for elevated dementia risk increased with age and occurred around 120mmHg for age <55, 140 mmHg for age 55-65, and 160 mmHg for age 65-75.
We observed increasing mean risk for Alzheimer’s disease with increasing SBP using data from 17 studies (Figure 106), although the association was not significant when accounting for
between-study heterogeneity (2-star, ROS=-0.15). For vascular dementia (Figure 107), we observed a positive, non-linear, 2-star relationship among 11 studies (ROS=0.08).
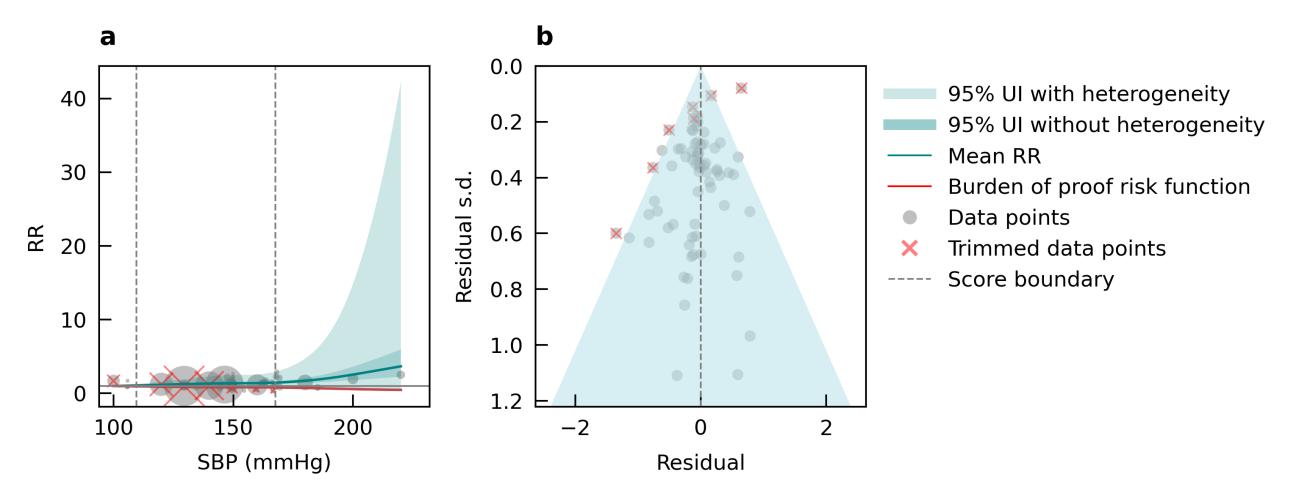
Figure 106. Systolic blood pressure and Alzheimer’s disease risk. a, Relative-risk (RR)function. The solid green line represents the mean RR at each exposure level. The dark green shaded area indicates the 95% UI without accounting for between-study heterogeneity, while the light green shaded area represents the 95% UI accounting for between-study heterogeneity. The size of the data point is proportional to the inverse of the s.d. of the effect estimates, where larger points indicate higher precision in the effect estimates. b, A modified funnel plot showing the residuals (relative to zero) on the x axis and the estimated s.d. (inclusive of between-study heterogeneity) on the y axis.

Figure 107. Systolic blood pressure and vascular dementia risk. a, Relative-risk (RR)function. The solid green line represents the mean RR at each exposure level. The dark green shaded area indicates the 95% UI without accounting for between-study heterogeneity, while the light green shaded area represents the 95% UI accounting for between-study heterogeneity. The size of the data point is proportional to the inverse of the s.d. of the effect estimates, where larger points indicate higher precision in the effect estimates. b, A modified funnel plot showing the residuals
(relative to zero) on the x axis and the estimated s.d. (inclusive of between-study heterogeneity) on the y axis.
5.11.6 Population attributable fraction
The impact of elevated systolic blood pressure on dementia-related health loss increases with age rising from 3.8% among females aged 40–44 to over 12% in those over 80, and from 6% to more than 10% for males in the same age groups (Figure 108). Initially, this proportion of dementia health loss due to SBP is higher in males compared to females, but after age 65, females exhibit a higher proportion. This trend is consistent with previous research indicating that hypertension is more prevalent in younger men than women, with a reversal occurring between the ages of 60 and 70 years.30
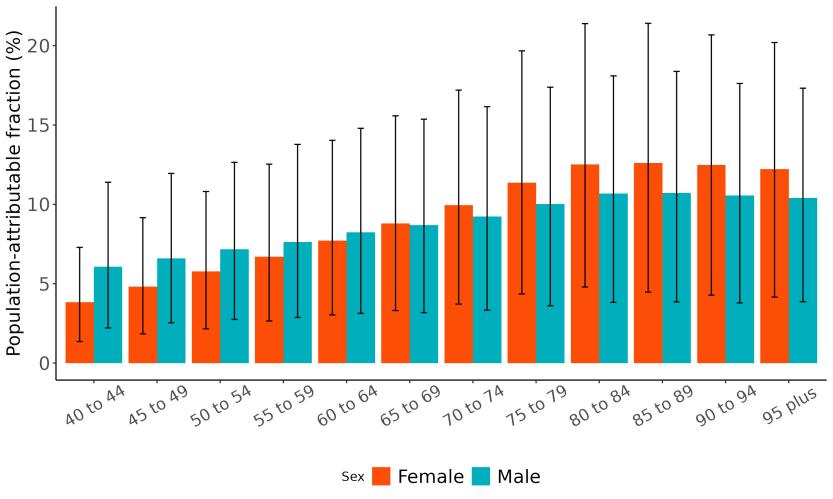
Figure 108. Population attributable fractions for dementia burden due to high systolic blood pressure by age and sex, 2023.
Temporal trends indicate a 2% decline in the proportion of dementia health loss attributable to systolic blood pressure, decreasing from 13% in 1990 to 11% in 2023 (Figure 109).
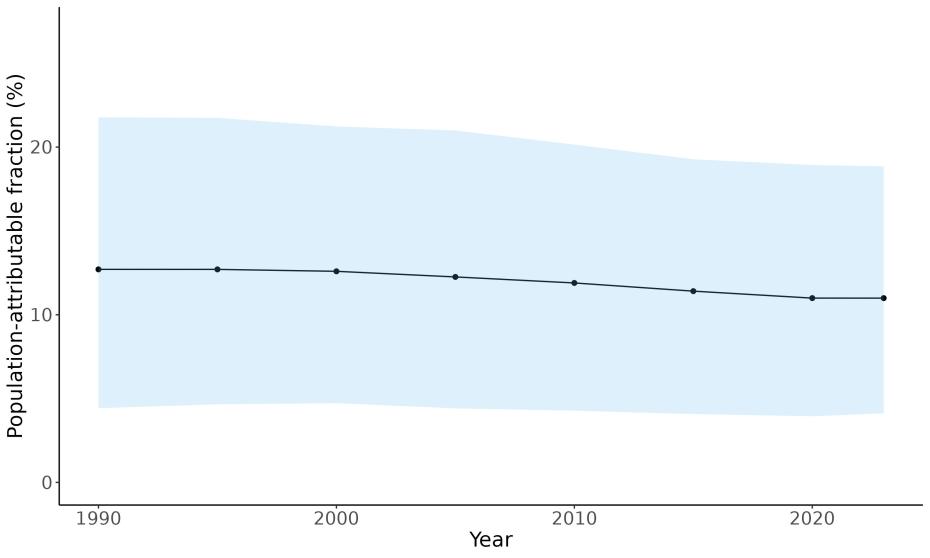
Figure 109. Temporal trends in population attributable fractions for dementia burden due to high systolic blood pressure, 19902-2023.
Geographic patterns reveal that the proportion of dementia health loss due to systolic blood pressure is higher in southeastern states, although the overall variation between states is low, aligning with the exposure distribution (Figure 110). The population attributable fraction estimates range from 10.6% in Colorado with 11.3% in Louisiana.
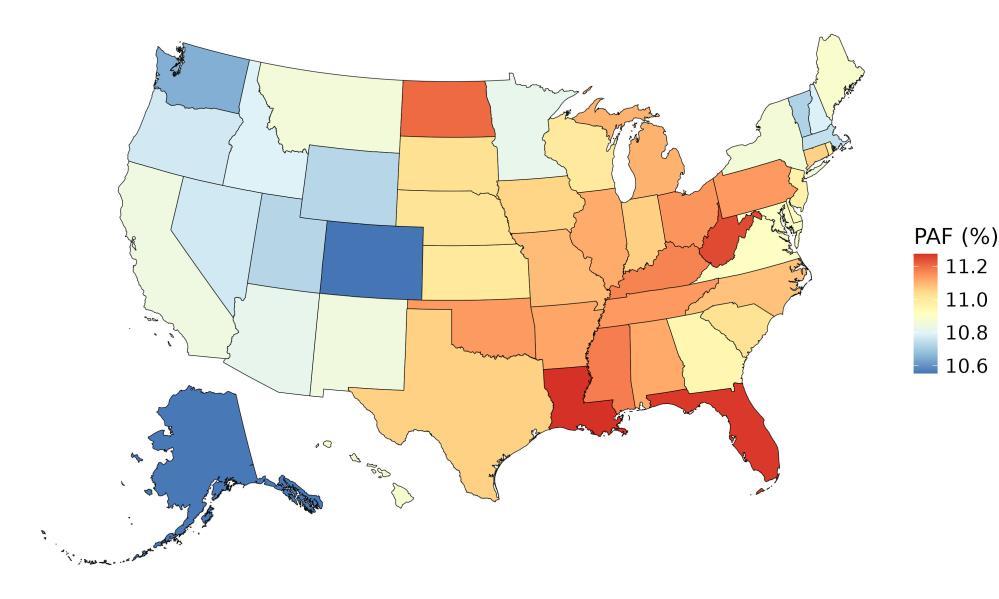
Figure 110. State-level population attributable fractions for dementia burden due to high systolic blood pressure, 2023, both sex, all age.
5.11.7 Attributable burden
In 2023, the total amount of dementia health loss that could be avoided if systolic blood pressure levels were reduced to the theoretical minimum was 370,000 disability-adjusted life years, 252,000 for females and 118,000 for males (Figure 111).
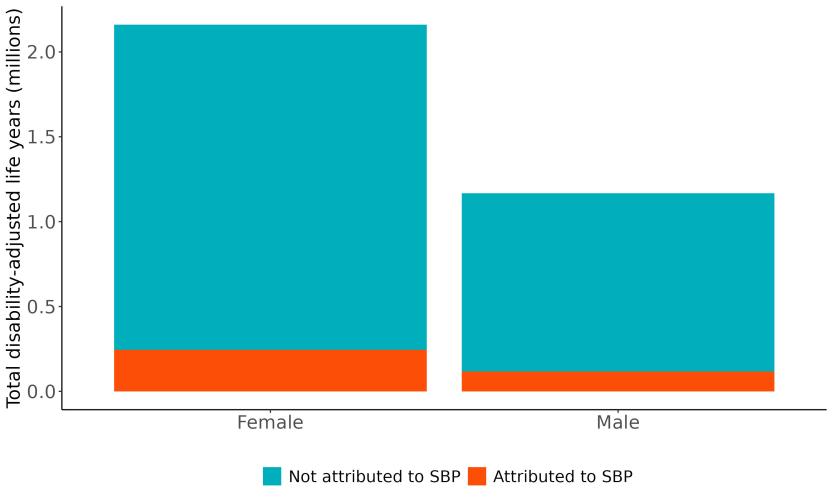
Figure 111. Proportion of dementia burden attributed to high systolic blood pressure by sex, 2023
Age patterns show the total amount of dementia health loss due to high systolic blood pressure peaked between 75 to 79 years, followed by a gradual decline in the oldest age groups (Figure 112). This likely reflects the combined effects of higher dementia burden in late life and shrinking population size at oldest ages.
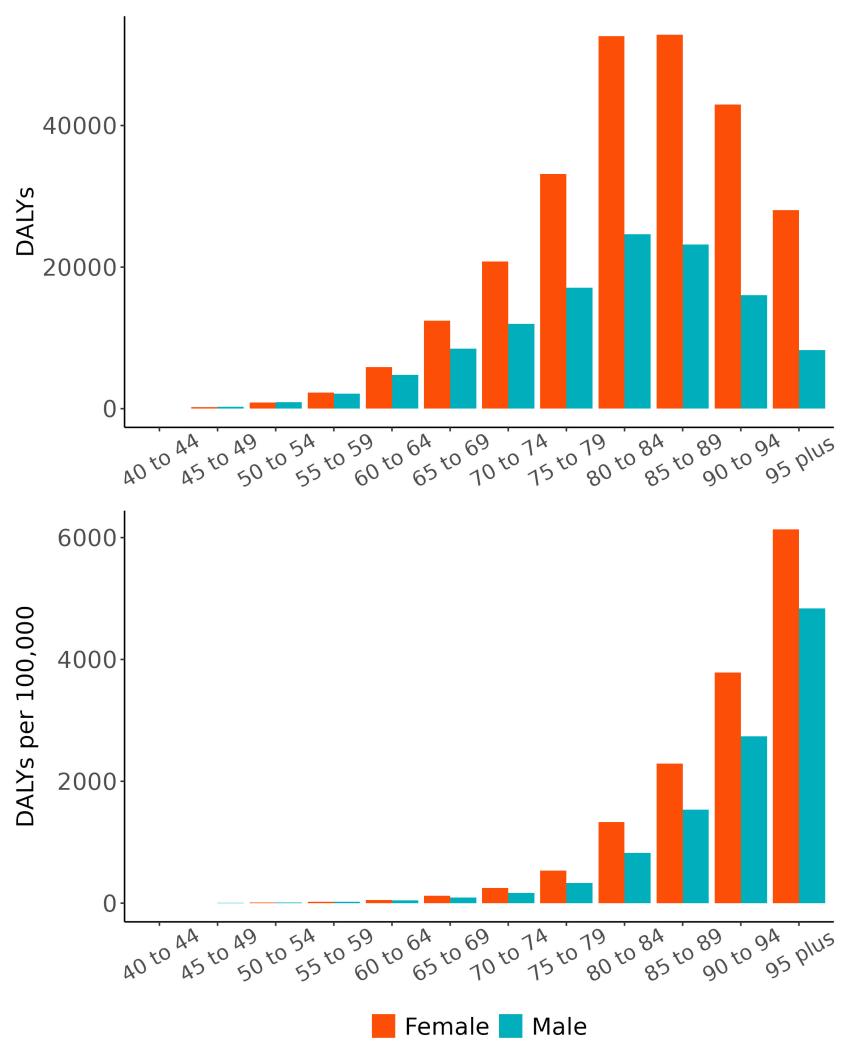
Figure 112. Dementia disability-adjusted life-years attributable to high systolic blood pressure by age and sex, 2023.
The rate of dementia health loss attributed to systolic blood pressure varied by state (Figure 113) with highest rates observed in Hawaii (147 DALYs/100K) and Pennsylvania (141 DALYs/100K), and the lowest rates in the Utah (65 DALYs/100K) and Alaska (73 DALYs/100K).

Figure 113. State-level dementia disability-adjusted life-years attributable to high systolic blood pressure 2023, both sex, all-age.
5.11.8 Major takeaways
• Mean systolic blood pressure in the US has remained relatively stable since 1990 and variation between states are low, although the southeastern states tend to have higher values.
• Rising systolic blood pressure is significantly associated with an increased risk of dementia, with individuals experiencing a 17% higher risk at stage 1 hypertension levels, escalating to a 46% increased risk at 180 mmHg.
• There is low variation across states in the proportion of dementia health loss due to high systolic blood pressure, aligning with the distribution of mean systolic blood pressure in the United States
• In 2023, an estimated 370,000 dementia DALYs was due to high systolic blood pressure in the United States, 252,000 for women and 118,000 for men.
• The proportion of dementia health loss attributable to high systolic blood pressure has declined only marginally over time, highlighting the continued need for effective policies and programs to prevent and manage high blood pressure.
5.12 Traumatic Brain Injury
5.12.1 Exposure definition
Traumatic brain injury is damage to the brain from an external force. Brain injury can range from mild concussion to severe with prolonged loss of consciousness and long-term cognitive or physical effects. Here, the exposure is defined as moderate to severe traumatic brain injury with long-term consequences.
5.12.2 National-level and state-level exposure and disparities
Exposure to traumatic brain injury, as defined above, varied significantly across the globe (Table 48) with a 3.68x TBI prevalence between Slovenia, with the highest exposure, and Madagascar, with the lowest exposure. The United States, placing 70th in exposure, generally experiences relatively high TBI exposure on the global scale. Within the United States, Montana is a notable outlier, with a TBI prevalence 1.42x higher than the national average (Table 49, Figure 114)
Table 48. National ranking of exposure levels, 2023.
Countries with highest TBI prevalence, all age, both sex
1. Slovenia, 0.0166
2. Croatia, 0.0135
3. Taiwan, 0.0132
4. Lithuania, 0.0119
5. Czechia, 0.0118
6. China, 0.0117
7. Slovakia, 0.0115
8. Estonia, 0.0109
9. Belarus, 0.0108
10. Latvia, 0.0107
Countries with TBI prevalence similar to the United States
69. Grenada, 0.0046
70. United States, 0.0045
71. Barbados, 0.0044
Table 49. State ranking of exposure levels, 2023
Highest TBI prevalence, all age, both sex
1. Montana, 0.0064
2. West Virginia, 0.0059
3. Arizona, 0.0057
4. Wyoming, 0.0057
5. Vermont, 0.0055
Countries with lowest TBI prevalence, all age, both sex
195. Guinea, 0.0014
196. Chad, 0.0013
197. United Republic of Tanzania, 0.0013
198. Benin, 0.0013
199. Equatorial Guinea, 0.0013
200. Nigeria, 0.0013
201. Niger, 0.0012
202. Gambia, 0.0012
203. Senegal, 0.0012
204. Madagascar, 0.0011
Lowest TBI prevalence, all age, both sex
47. Massachusetts, 0.0040
48. Nebraska, 0.0040
49. Utah, 0.0040
50. Illinois, 0.0037
51. Texas, 0.0036
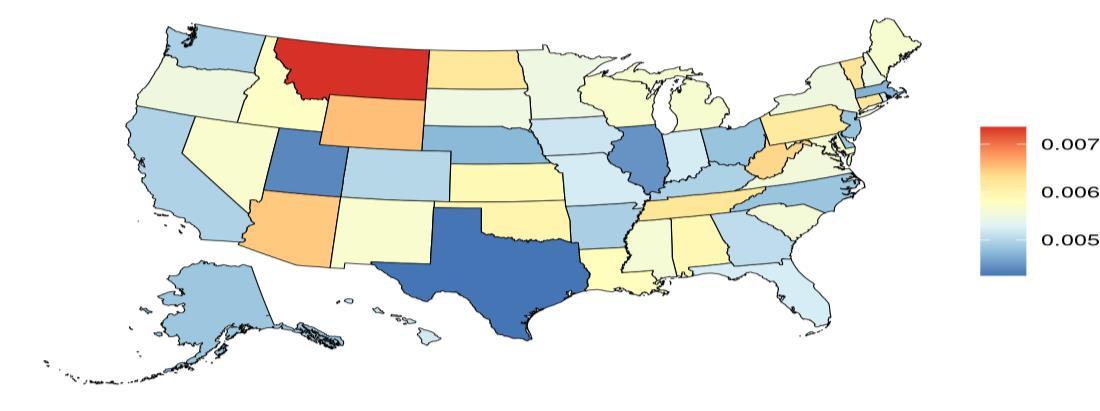

Figure 114. State-level TBI prevalence in the United States, all ages, 2023 (males top, females bottom). Unit is out of of 1, where 0.005 = 500 prevalent cases of moderate/severe TBI with long term consequences out of 100,000 individuals in the population.
The prevalence of moderate/severe TBIs with long-term consequences in the United States trends upward over time (Figure 115).
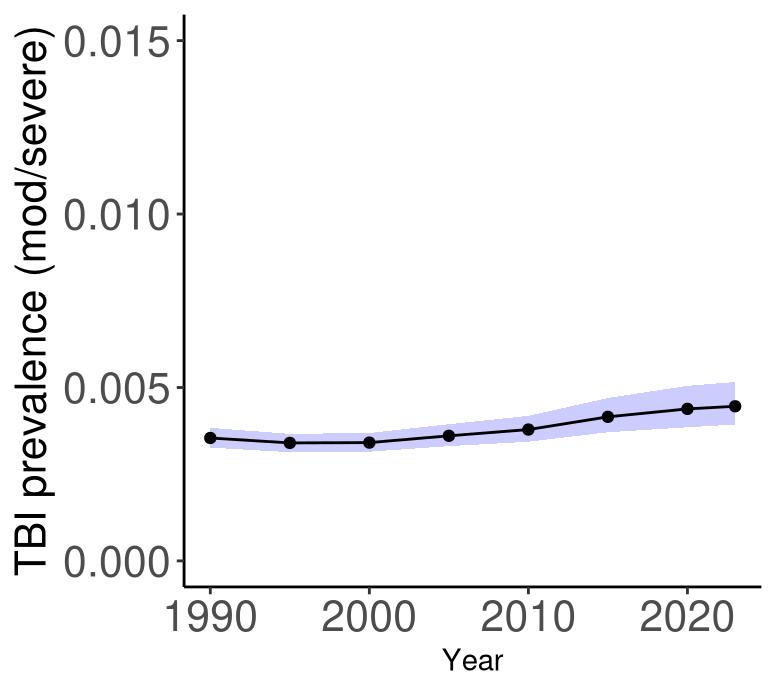
Figure 115. Temporal trends in prevalence of moderate/severe TBI in the United States, all age, 1990-2023. Purple shading depicts 95% uncertainty intervals.
5.12.3
Data landscape
Studies reporting and measuring:
• TBI severity (mild, moderate and severe)
• Veteran populations and cohorts from databases
• TBI defined via length and presence of Loss of Consciousness (LOC)
• TBI defined via Glasgow Coma Scale (GCS)
Studies reporting unspecified TBI definitions or ascertainment methods.
• We flagged studies amongst TBI high-risk population (e.g. Athletes), but did not extract those data for the final model.
Using the criteria above, we identified 1,042 unique studies, and after screening included a total of 23 studies with relevant relative risk data for our analyses (Figure 116).
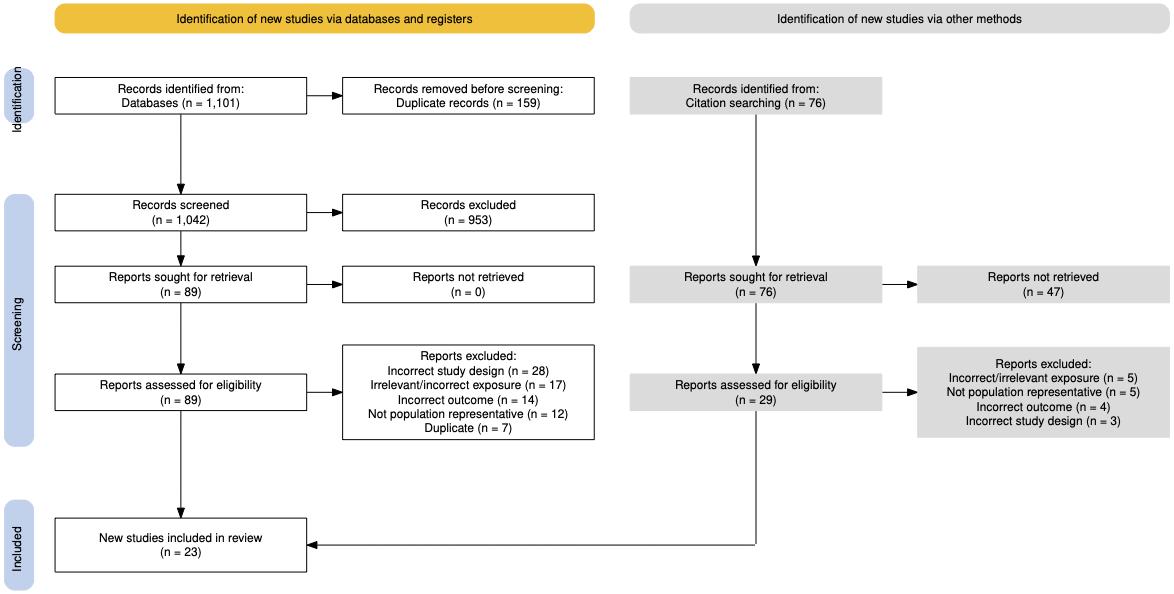
Figure 116. PRISMA diagram for traumatic brain injury systematic review showing inclusion and exclusion of studies at each systematic review stage.
Table 50 (next page) describes the studies among US populations included from the systematic review. Of the 23 studies identified for inclusion from the systematic review, five were conducted in the US. Studies used self-reported cases of TBI and ICD coded injury. Subsequent dementia identification was via physician diagnosis or medical records. Follow-up time ranged from 5-18 years. Nearly all studies estimated the relationship between TBI and all-cause
dementia, with one study also assessing the relationship with Alzheimer’s disease, and one focusing only on Alzheimer’s disease and vascular dementia.
Table 50. United States studies included from the systematic review.
First author, year Study
Power, 2021
Yashkin, 2023
2023
Akushevic h, 2023
DamsO'Connor, 2023
• = dementia subtype is an outcome available in study. LOC: loss of consciousness.
Traumatic brain injury is identified in several ways within scientific literature. In order to consider the most comprehensive evidence, we considered studies defining TBI in the following ways. The included studies primarily collected TBI exposure via ICD codes or some were via a self-reported TBI case in a participant. TBI severities were available in a few of the studies, and loss of consciousness (LOC) was a diagnostic characteristic in some studies (Table 51).
Table 51. Traumatic brain injury characteristics and case ascertainment in included studies
“At baseline, information on participants’ previous TBI diagnoses, and their corresponding recorded dates was obtained from the NPR. The ICD codes for TBI included the following: ICD 7 codes N800–N801, N803, and N850–N856; ICD-8 codes N800–N801, N803 N804, and N850–N854; ICD 9 codes 800–801, 803–804, and 850–854; and ICD- 10. codes S01.0–S01.9, S02.0, S02.1, S02.3, S02.7–S02.9, S04.0, S06.0–S06.9, S07.0, S07.1, S07.8, S07.9, S09.7 S09.9, T90.1, T90.2, T90.4, T90.5, T90.8, and T90.9”[1]
Self-reported TBI 8
TBI severities included (mild, moderate/severe) 9
Includes loss of consciousness (LOC) 8
5.12.4 Evidence score summaries
“TBI was assessed at baseline with the following question: ‘In your life, have you ever had a traumatic brain injury with loss of consciousness?’. The exposure was thus defined as history of TBI with LOC: yes/no.”[2]
“TBIs were classified to mild (ICD-10 code S060, ICD-9, and ICD-8 code 850) and severe (ICD-10 code S062-S069, ICD-9, and ICD-8 codes 851–854)”[3]
“Medical history interview captured history of TBI with LOC, including length of LOC. Mild LOC less than 30 min. Moderate to severe LOC greater than or equal to 30 mins.”[4]
Models that included all data regardless of method of traumatic brain injury diagnosis type or severity showed no relationship with dementia. Based on advice from a trauma surgeon, we excluded self-report data because report of past head injury can be unreliable compared to ICD-coded medical reports. We also focused on moderate or worse traumatic brain injury as opposed to concussion and included both veteran and non-veteran studies. Using data from 10 studies, we found that moderate or worse traumatic brain injury increases dementia risk by 37%. In Figure 117, the dark blue line denotes the average increased risk in (which corresponds to 37%), and shaded uncertainty around the estimate. The red line depicts the conservative estimate of the effect after accounting for uncertainty and is used to estimate the burden of proof score, which for traumatic brain injury is 0.11, corresponding to a 2-star rating.
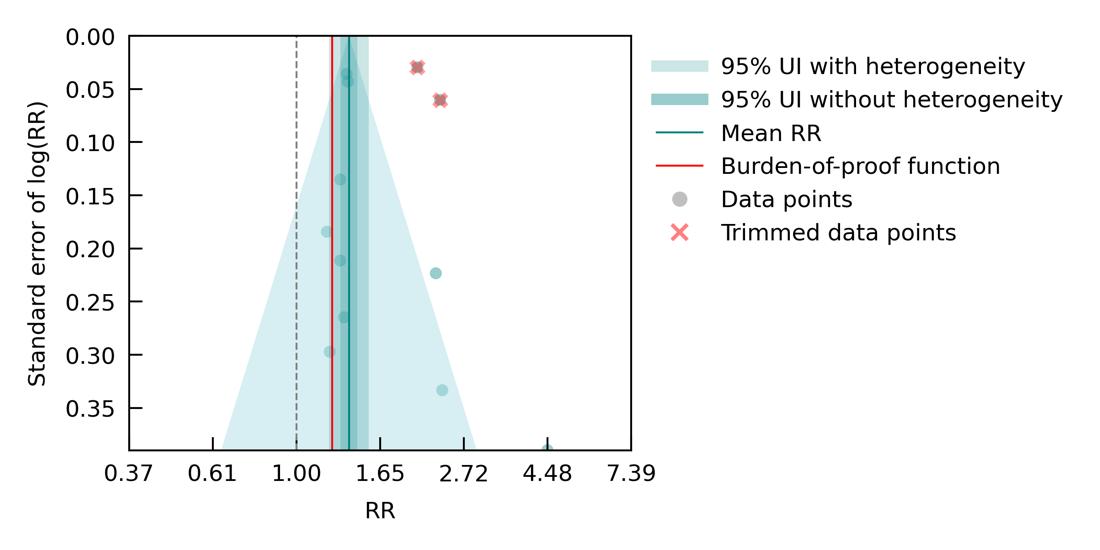
Figure 117. Traumatic brain injury and dementia risk. The figure shows a funnel plot with the relative risks (RR) on the x axis and standard error of the log(RR) on the y axis. The solid green line represents the mean RR. The dark green shaded area indicates the 95% UI without accounting for between-study heterogeneity, while the light green shaded area represents the 95% UI accounting for between-study heterogeneity.
5.12.5 Sub-analyses
We had sufficient data to assess whether repeat TBI, regardless of severity, increased dementia risk. Although the mean estimate (dark blue line) suggests a possible link between repeat traumatic brain injury and dementia risk, the uncertainty around the estimate (blue shading) is too large to draw a conclusion (Figure 118). This could be because the majority of data on repeat traumatic brain injury does not specify severity. Results suggest that further research is needed to determine whether there is a clear relationship.

Figure 118. Repeat traumatic brain injury of any severity and dementia risk. The figure shows a funnel plot with the relative risks (RR) on the x axis and standard error of the log(RR) on the y axis. The solid green line represents the mean RR. The dark green shaded area indicates the 95% UI without accounting for between-study heterogeneity, while the light green shaded area represents the 95% UI accounting for between-study heterogeneity.
We also had sufficient data to look at Alzheimer’s disease (Figure 119) and vascular dementia (Figure 120) individually. For Alzheimer’s disease, we included 8 studies where the exposure was any severity of TBI, excluding self-reported TBI. Results suggest an 18% increased risk of dementia with a smaller Burden of Proof score of 0.05 and a 2-star rating. Both the magnitude of the effect and the score were smaller than for moderate or worse all-cause dementia, but the relationship was significant.

Figure 119. Traumatic brain injury and Alzheimer’s disease risk. The figure shows a funnel plot with the relative risks (RR) on the x axis and standard error of the log(RR) on the y axis. The solid green line represents the mean RR. The dark green shaded area indicates the 95% UI without accounting for between-study heterogeneity, while the light green shaded area represents the 95% UI accounting for between-study heterogeneity.
For vascular dementia, we were able to include four studies where the exposure was any severity of TBI, excluding self-reported TBI. We did not find a significant relationship, potentially because the sample size was so small. The mean effect suggested increased risk, but the variance large and the Burden of Proof score was negative, indicative of no clear relationship.
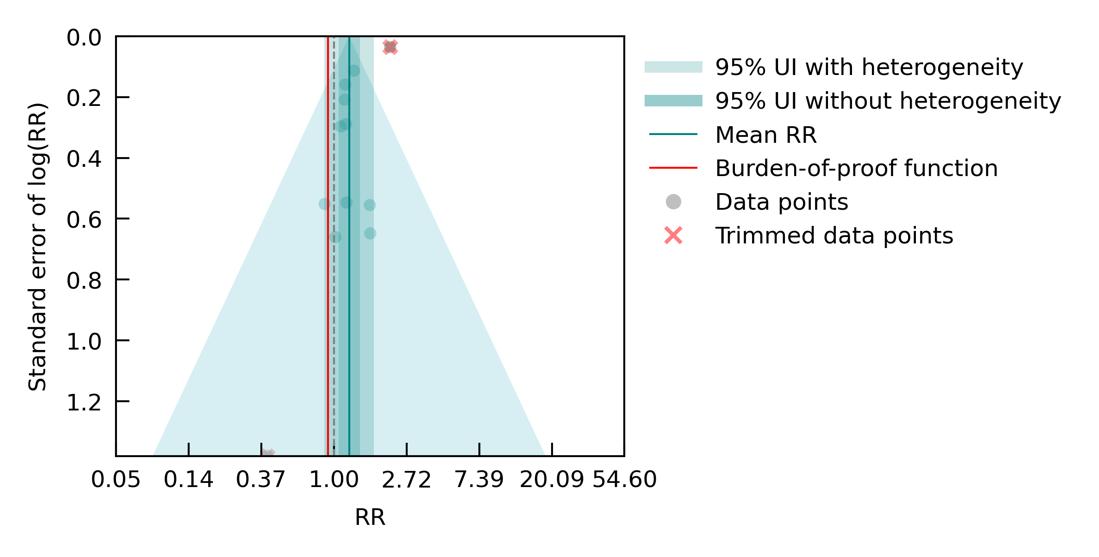
Figure 120. Traumatic brain injury and vascular dementia risk. The figure shows a funnel plot with the relative risks (RR) on the x axis and standard error of the log(RR) on the y axis. The solid green line represents the mean RR. The dark green shaded area indicates the 95% UI without accounting for between-study heterogeneity, while the light green shaded area represents the 95% UI accounting for between-study heterogeneity
5.12.6 Population attributable fraction
The fraction of dementia health loss that can be attributed to moderate or worse traumatic brain injury in 2023 by state ranges from 0.3% to 0.6%, highest in Montana, Idaho, and Utah, and lowest in Delaware, Arkansas, and Illinois (Figure 121). Attributable fractions are small because exposure to moderate or worse traumatic brain injury is low in the US population relative to other dementia risk factors.
Attributable fractions have increased slightly over time (Figure 122) and are highest in ages 7075 years. They are higher in men than women, reflecting increased frequency of traumatic brain injuries (and in general most injuries) for men versus women (Figure 123). Age and sex patterns reflect the frequency of traumatic brain injuries in the adult population; the leading cause of traumatic brain injuries over the age of 65 is falls followed by vehicle crashes.31 As part of the Global Burden of Disease study, our institute has demonstrated that the incidence of falls increases sharply starting at age 65.2

Figure 121. State-level population attributable fractions for dementia burden due to traumatic brain injury, 1990-2023.
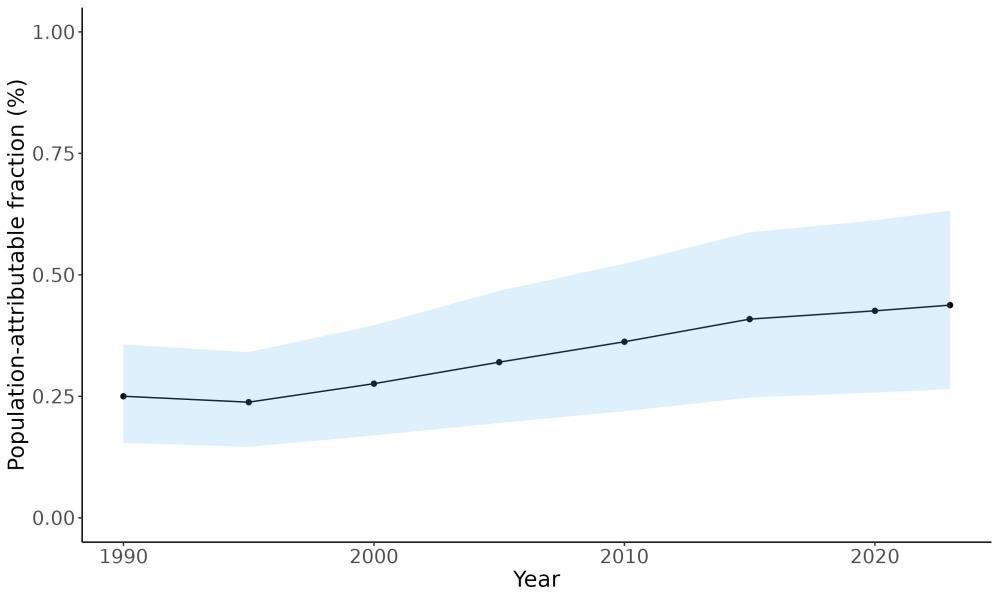
Figure 122. Temporal trends in population attributable fractions for dementia burden due to traumatic brain injury, 1990-2023.
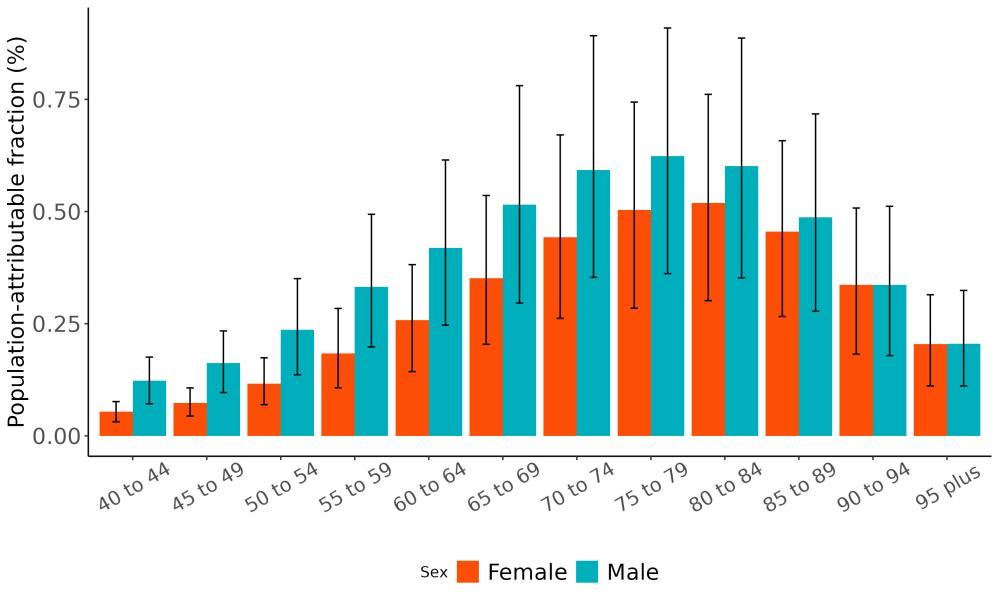
Figure 123. Population attributable fractions for dementia burden due to traumatic brain injury by age and sex, 2023.
5.12.7 Attributable burden
Of all dementia health loss in the US in 2023, 8,900 of 2.1 million disability-adjusted life-years for women and 5,800 of 1.1 million disability-adjusted life-years for men were attributable to moderate or worse traumatic brain injury and could have been averted if none of the injuries occurred (Figure 124).
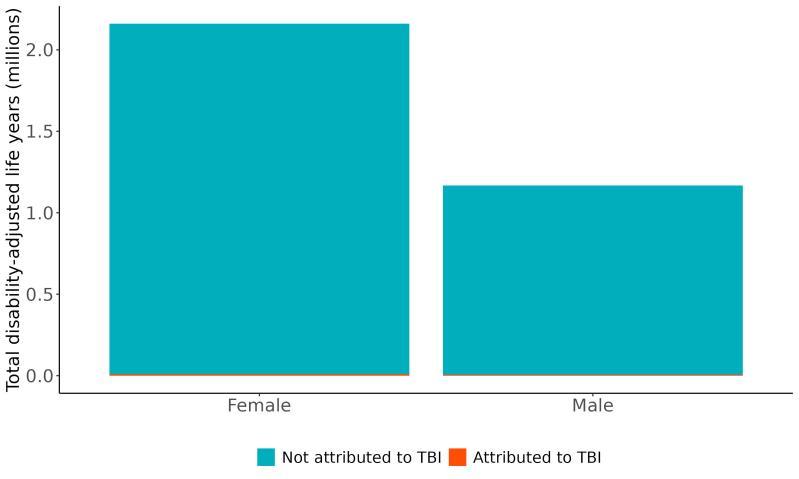
Figure 124. Proportion of dementia burden attributed to traumatic brain injury by sex, 2023. The total number of disability-adjusted life-years attributed to moderate or worse traumatic brain injury peaks for individuals in the US who are 75-85 years old and is higher for women (Figure 125). The higher number for females is because dementia is more common in females and because women live to older ages than men even though traumatic brain injury is more common in men. Rates increase over age, reflecting greater likelihood of falls and subsequent traumatic brain injuries with increasing age.

Figure 125. Dementia disability-adjusted life-years attributable to traumatic brain injury by age and sex, 2023. Top panel shows DALY counts and bottom panel shows DALY rates.
Rates of dementia health loss attributed to moderate or worse traumatic brain injury ranged from 2.7 DALYs per 100,000 to 6.5 DALYs per 100,000 with the least attributable health loss in Texas and Alaska and the most attributable health loss in Montana and Pennsylvania (Figure 126). This reflects the combined effects of the relationship between traumatic brain injury and dementia risk, the rates of moderate or worse traumatic brain injury in each state, and the rates of dementia in each state.
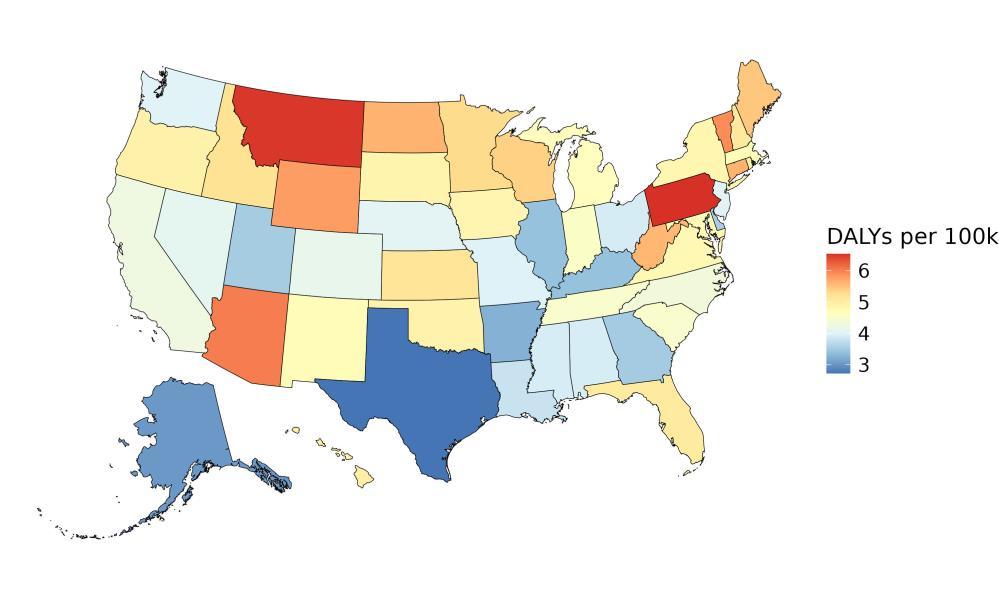
Figure 126. State-level dementia disability-adjusted life-years attributable to traumatic brain injury, 2023, both sex, all age.
5.12.8 Major takeaways
• Traumatic brain injury exposure is more common in males than females, and more common in ages 15-40 than for adults over age 40.
• Exposure to moderate or worse traumatic brain injury increases the risk of dementia on average by 37%.
• Exposure to repeat traumatic brain injury regardless of injury severity trended toward increased risk of dementia but results were not significant.
• Exposure to any severity of traumatic brain injury increases the risk of dementia on average by 18%. This aligns with research demonstrating that brain injury increases amyloid beta presence in the brain 32 The relationship with vascular dementia was not significant, possibly because the sample size was small suggesting a need for more studies examining this relationship.
• The fraction of dementia health loss that can be attributed to moderate or worse traumatic brain injury in 2023 by state ranged from 0.3% in Delaware to 0.6% in Montana.
• In 2023, 14,700 dementia disability-adjusted life years were attributed to moderate or worse traumatic brain injury in the United States, 8,900 for women and 5,800 for men
• The leading causes of traumatic brain injury in adults over 65 are falls followed by road traffic injury.
• Although repeat traumatic brain injuries of any severity show a possible relationship with dementia, underlying data are not sufficient to conclude definitively that repeated exposure increases likelihood of dementia, highlighting the need for continued research.
6 References
1 Naghavi M, Ong KL, Aali A, et al. Global burden of 288 causes of death and life expectancy decomposition in 204 countries and territories and 811 subnational locations, 1990–2021: a systematic analysis for the Global Burden of Disease Study 2021. The Lancet 2024; 403: 2100–32.
2 Ferrari AJ, Santomauro DF, Aali A, et al. Global incidence, prevalence, years lived with disability (YLDs), disability-adjusted life-years (DALYs), and healthy life expectancy (HALE) for 371 diseases and injuries in 204 countries and territories and 811 subnational locations, 1990–2021: a systematic analysis for the Global Burden of Disease Study 2021. The Lancet 2024; 403: 2133–61.
3 Zheng P, Afshin A, Biryukov S, et al. The Burden of Proof studies: assessing the evidence of risk. Nat Med 2022; 28: 2038–44.
4 Brauer M, Roth GA, Aravkin AY, et al. Global burden and strength of evidence for 88 risk factors in 204 countries and 811 subnational locations, 1990–2021: a systematic analysis for the Global Burden of Disease Study 2021. The Lancet 2024; 403: 2162–203.
5 Livingston G, Huntley J, Sommerlad A, et al. Dementia prevention, intervention, and care: 2020 report of the Lancet Commission. The Lancet 2020; 396: 413–46.
6 Nichols E, Steinmetz JD, Vollset SE, et al. Estimation of the global prevalence of dementia in 2019 and forecasted prevalence in 2050: an analysis for the Global Burden of Disease Study 2019. Lancet Public Health 2022; 7: e105–25.
7 DistillerSR | Systematic Review Software | Literature Review Software. DistillerSR. https://www.distillersr.com/products/distillersr-systematic-review-software (accessed July 30, 2025).
8 Hamel C, Kelly SE, Thavorn K, Rice DB, Wells GA, Hutton B. An evaluation of DistillerSR’s machine learning-based prioritization tool for title/abstract screening – impact on reviewerrelevant outcomes. BMC Med Res Methodol 2020; 20: 1–14.
9 Dai X, Gil GF, Reitsma MB, et al. Health effects associated with smoking: a Burden of Proof study. Nat Med 2022; 28: 2045–55.
10 Lescinsky H, Afshin A, Ashbaugh C, et al. Health effects associated with consumption of unprocessed red meat: a Burden of Proof study. Nat Med 2022; 28: 2075–82.
11 Spencer CN, Khalil M, Herbert M, et al. Health effects associated with exposure to intimate partner violence against women and childhood sexual abuse: a Burden of Proof study. Nat Med 2023; 29: 3243–58.
12 Ross K, Chmiel JF, Ferkol T. The impact of the Clean Air Act. J Pediatr 2012; 161: 781–6.
13 WHO global air quality guidelines: particulate matter (PM2.5 and PM10), ozone, nitrogen dioxide, sulfur dioxide and carbon monoxide. https://www.who.int/publications/i/item/9789240034228 (accessed July 30, 2025).
14 Shkirkova K, Lamorie-Foote K, Zhang N, et al. Neurotoxicity of Diesel Exhaust Particles. J Alzheimers Dis JAD 2022; 89: 1263–78.
15 Parra KL, Alexander GE, Raichlen DA, Klimentidis YC, Furlong MA. Exposure to air pollution and risk of incident dementia in the UK Biobank. Environ Res 2022; 209: 112895.
16 Cunningham CX, Williamson GJ, Bowman DMJS. Increasing frequency and intensity of the most extreme wildfires on Earth. Nat Ecol Evol 2024; 8: 1420–5.
17 Mewton L, Visontay R, Hoy N, et al. The relationship between alcohol use and dementia in adults aged more than 60 years: a combined analysis of prospective, individual‐participant data from 15 international studies. Addiction 2023; 118: 412–24.
18 Brenowitz WD. Invited Commentary: Body Mass Index and Risk of Dementia—Potential Explanations for Life-Course Differences in Risk Estimates and Future Research Directions. Am J Epidemiol 2021; 190: 2511–4.
19 Kivimäki M, Luukkonen R, Batty GD, et al. Body mass index and risk of dementia: Analysis of individual-level data from 1.3 million individuals. Alzheimers Dement 2018; 14: 601–9.
20 ISCED DIAGRAMS – ISCED. https://isced.uis.unesco.org/visualizations/ (accessed July 30, 2025).
21 Haile LM, Orji AU, Reavis KM, et al. Hearing Loss Prevalence, Years Lived With Disability, and Hearing Aid Use in the United States From 1990 to 2019: Findings From the Global Burden of Disease Study. Ear Hear 2024; 45: 257–67.
22 Lin FR, Pike JR, Albert MS, et al. Hearing intervention versus health education control to reduce cognitive decline in older adults with hearing loss in the USA (ACHIEVE): a multicentre, randomised controlled trial. The Lancet 2023; 402: 786–97.
23 Mandsager K, Harb S, Cremer P, Phelan D, Nissen SE, Jaber W. Association of Cardiorespiratory Fitness With Long-term Mortality Among Adults Undergoing Exercise Treadmill Testing. JAMA Netw Open 2018; 1: e183605.
24 Haskell WL, Lee I-M, Pate RR, et al. Physical Activity and Public Health: Updated Recommendation for Adults from the American College of Sports Medicine and the American Heart Association. Med Sci Sports Exerc 2007; 39: 1423.
25 Meza R, Cao P, Jeon J, Warner KE, Levy DT. Trends in US Adult Smoking Prevalence, 2011 to 2022. JAMA Health Forum 2023; 4: e234213.
26 Troost JP, Rafferty AP, Luo Z, Reeves MJ. Temporal and regional trends in the prevalence of healthy lifestyle characteristics: United States, 1994-2007. Am J Public Health 2012; 102: 1392–8.
27 Bureau UC. American Community Survey (ACS). Census.gov. https://www.census.gov/programs-surveys/acs.html (accessed July 30, 2025).
28 Our Epidemic of Loneliness and Isolation. US Surg Gen Advis Heal Eff Soc Connect Community.
29 Umberson D, Lin Z, Cha H. Gender and Social Isolation across the Life Course. J Health Soc Behav 2022; 63: 319–35.
30 Yeo, Wan-Jin, Abraham, Rahul, Schlosser P, Ballew, Shoshana H. Sex Differences in Hypertension and Its Management Throughout Life. DOI:10.1161/HYPERTENSIONAHA.124.22980.
31 Thompson HJ, McCormick WC, Kagan SH. Traumatic Brain Injury in Older Adults: Epidemiology, Outcomes, and Future Implications. J Am Geriatr Soc 2006; 54: 1590–5.
32 Bamel K, Panwar A, Kumar M, Kumar S, Sharma V, Sharma A. Traumatic brain injury as a precursor to neurodegenerative diseases: Mechanisms linking TBI to Alzheimer’s disease. Brain Disord 2025; 18: 100232.
7 Appendix
Descriptive characteristics of each study assessing risk-outcome relationships for dementia, identified via our systematic literature reviews are summarized in the following tables, by risk factor. Data extracted from these papers may inform global relative risk models such as those developed for the ongoing Global Burden of Disease study. Included studies conducted in the United States are provided in tables in the main text and studies from other parts of the world are described in this appendix.
7.1 Air Pollution
Table A1. Global Relative Risk Studies
First author, year Study
Jung, 2015 NHIRD Taiwan, China
Chen, 2017 ONPHEC study
Carey, 2018 CPRD Study
United Kingdom
Bowe, 2019 SNAC-K Study Umea, Sweden 4,522,16 ≥ 40 11
Cerza, 2019 Rome cohort Rome, Italy
Ilango, 2020 NPHS & CCHS study
2020
Ran, 2021 Hong Kong Elderly Health Services Study Hong Kong, China 59,349 ≥ 65 14
Mortamais, 2021 3C Study Dijon; Bordeaux; Montpellier, France 7,066 ≥ 65 14
Klopmaker, 2021 CBS Study Netherlands
annual average Death certificates
3-year average Medical records
First author, year Study
De Crom, 2023 Rotterdam cohort Rotterdam, Netherlands 7,551 ≥ 49 9
Chen, 2022 UK Biobank United Kingdom 459,844 ≥ 40 15
Yang, 2022 Zhejiang cohort Zhejiang, China 1,545 ≥ 60 3
Wood, 2022 ELSA cohort
Trevenen, 2022 HIMS cohort Perth, Australia 11,243 ≥ 65 24
Baseline annual average Physician diagnosis •
Fixed annual average (2010)
Zhu, 2023 Ningbo cohort Ningbo, China 29,025 ≥ 40 8
Andersson, 2023
2022 ELAPSE
records & Death certificates
Baseline 5-year average Physician diagnosis
Baseline annual average Self-reported
Baseline and timevarying annual average
Baseline annual average
records & Death certificates
records & Death certificates
7.2 Alcohol
Table A2. Global Relative Risk Studies
First author, year Study
Handing, 2015 Swedish Twin Registry Sweden 12326 ≥ 45 43
Kawakami, 2023 Murakami Cohort Study Niigata, Japan 5985 ≥ 50 10
Filippini, 2020 N/A Modena, Italy 112 ≥ 45 3
Lindsay, 2002 Canadian Study of Health and Aging Canada 3809 ≥ 70 4
Gong, 2023 COSMIC Consortium Multiple Locations 29850 ≥ 60 23
Solfrizzi, 2007 Italian Longitudinal Study on Aging (ILSA) Italy 1,445 ≥ 65 4
Huang, 2002 Kungsholmen Project Sweden 378 ≥ 75 5
Ruitenberg, 2002 Rotterdam Study Netherlands 5395 ≥ 55 10
Weyerer, 2011 N/A Germany 3180 ≥ 75 3
Heffernan, 2016 Sydney Memory and Aging Study (MAS) Australia 821 ≥ 70 5
Larrieu, 2004 PAQUID France 2950 ≥ 65 16
Self-report questionnaire Medical records
Self-report questionnaire Physician diagnosis
Self-report questionnaire Physician diagnosis
Self-report questionnaire Physician diagnosis
Self-report questionnaire Physician diagnosis
Self-report questionnaire Physician diagnosis
Self-report questionnaire Physician diagnosis
Self-report questionnaire Medical records
Self-report questionnaire Physician diagnosis
Self-report questionnaire Physician diagnosis
Self-report questionnaire Physician diagnosis
First author, year Study
Sabia, 2018 Whitehall II United Kingdom 9087 ≥ 70 32
Järvenpää, 2005 Finnish Twin Registry Finland 554 ≥ 70 26
Self-report questionnaire
Self-report questionnaire
Medical records •
Medical records •
7.3 Body Mass Index
Table A3. Global Relative Risk Studies
Allen, 2019 Whitehall I
Osler, 2020 Danish Conscription Database (DCD)
Knekt, 2020
Rosengren, 2015 Primary Prevention Study
Bhaskaran, 2018
Neergaard, 2016
Park, 2019
First author, year Study
Astell-Burt, 2021 Sax Institute’s 45 and Up Study
Atti, 2008 Kungsholmen Project
7.4 Depression
Table A4. Global Relative Risk Studies
First author, year
Johansson, 2019 10/66 Dementia Research Group
Luppa, 2013
Leipzig Longitudinal Study of the Aged (LEILA 75+)
Gerritsen, 2022 Age, Gene/Environment Susceptibility (AGES)Reykjavik Study
Wallin, 2013
Umeå 85+/GERDA (GErontologisk Regional DAtabas)
Lenoir, 2011 Three-City (3C)
Geerlings, 2000 Amsterdam Study on the Elderly (AMSTEL)
Franch, 2012
Lee, 2021
Elderly Health Centres (EHCs) of the Department of Health of the Government of Hong Kong
Palsson, 1999 Gothenburg Study
Dominican Republic, Peru, Venezuela, Mexico, Puerto Rico
7.5 Education
Table A5. Global Relative Risk Studies
First
Schmand, 1997 Longitudinal Aging Study
Pais, 2020 EPIPorto cohort study
Kivimäki, 2020
2019
Health and Social Support (HeSSup) study and the Finnish Public Sector (FPS) study
2021 3 City Study
Xu, 2015 N/A
Zhang, 2022 N/A
Dekhtyar, 2021 Uppsala Birth Cohort
Villani, 2022
InveCe.Ab (“Invecchiamento Cerebrale in Abbiategrasso” or “Brain aging in Abbiategrasso”)
Ren, 2021 Shandong Yanggu Study of Aging and Dementia (SYSAD)
Castro, 2021
2021
2018
First
Karp, 2003 Kungsholmen Project Sweden 931 75 3
Takasugi, 2019 Japan Gerontological Evaluation Study Japan 52,063 65
Questionnaire
Questionnaire
Physician diagnosis •
Administrative medical records •
7.6 Fasting Plasma Glucose
Table A6. Global Relative Risk Studies
First author, year Study
Solfrizzi, 2004 Italian Longitudinal Study on Aging
Rönnemaa, 2011
Uppsala Longitudinal Study of Adult Men (ULSAM)
Salinas, 2016 Mexico 10/66 Dementia Research Group (DRG) Study
Neergard, 2016 Prospective Epidemiologic Risk Factor (PERF I)
2009
Ohara, 2011 Hisamaya Study
2011
First author, year
2009
Haroon, 2015 Ontario Diabetes
Yokomichi, 2020
Gerontological Evaluation
Cohort Study
2021 Hisamaya Study
Primary Care
Pham, 2022
Boongird, 2020 Health Check Ubon Ratchathani
Lu, 2022
2020
2021
Dybjer, 2023
2023
2024
Proulx, 2023
2023
Hwangbo, 2023
Diet and Cancer Cohort
Wang, 2020
Zhou, 2023
National Study on Aging and Care - Kungsholmen (SNAC-K)
Thomassen, 2020
in Reducing Events in the Elderly Trial (ASPREE)
Zheng, 2021 U.K. Clinical Practice
Datalink (UK CPRD)
2015
2022
7.7 Hearing Loss
Table A7. Global Relative Risk Studies
of China)
First author, year Study
Nedelec, 2022 The Health Improvement Network
Dintica, 2023 Swedish National Study on Aging and Care in Kungsholmen
Tonelli, 2023 N/A
Lim, 2023 Korean National Health Insurance Service
Mentzel, 2023 International Residential Assessment Instrument (interRAI)
Pabst, 2021
Strutt, 2022
AgeDifferent.de platform: German LEILA75+ & AgeCoDe/ AgeQualiDe cohorts
Memory and Ageing Study
Rolandi, 2020 InveCe.Ab Lombard ia, Italy
Heywood, 2017 Singapore Longitudinal Ageing Study Singapor e
Amievad, 2018 PAQUID Study
7.8 Physical Inactivity
Table A8. Global Relative Risk Studies
First
Zheng, 2024
Gao, 2024
Lopes, 2024
Werneck, 2023
2023
2023
2023
Kunutsor, 2021
NabeNielsen, 2021
Heikkila, 2024
Hendriks, 2024
First author, year
van Gennip, 2024 Whitehall II study
NabeNielsen, 2024 CCHS
Min, 2024
Zhang, 2024
Wang, 2024
Hu, 2024
Xiong, 2023
Duan, 2023
Longitudinal Healthy Longevity Survey (CLHLS)
Wu, 2023
Tianjin Elderly Nutrition and Cognition (TENC)
ASPREE Longitudinal Study of Older Persons(ALSOP)
Wang, 2023 Chinese Longitudinal Healthy Longevity Survey (CLHLS)
Astell-Burt, 2023 45 and Up
Nemoto, 2023
Sulkava, 2022
Wang, 2022 UK Biobank
Juul Rasmussen, 2022 Copenhagen General Population Study (CGPS) and the Copenhagen City Heart Study (CCHS)
Feter, 2022 N/A
Kitamura, 2022 Murakami cohort study
2022
2022
Öhlin, 2022 SilverMONICA
Ihira, 2022 JPHC
2023
Hansdottir, 2022 Age Gene/Environment Susceptibility (AGES)Reykjavik study
Yoon, 2021
PetermannRocha, 2021
First author, year Study
Ran, 2021
Arafa, 2021
Feter, 2021
Feter, 2022
Laurin, 2001
Chinese Elderly Health Service (EHS)
Japan Gerontological Evaluation Study (JAGES)
English Longitudinal Study of Ageing (ELSA)
English Longitudinal Study of Ageing (ELSA)
Canadian Study of Health and Aging (CSHA)
Simons, 2006 Dubbo Study
Andel, 2008 N/A
Chang, 2010 AGES-Reykjavik
Gureje, 2011
Ibadan Study of Aging (ISA)
Elwood, 2013 Caerphilly cohort study
Tolppanen, 2015 CAIDE
LlamasVelasco, 2015 Neurological Disorders in Central Spain (NEDICES)
Hessler, 2016
INVADE-trial (Intervention Project on Cerebrovascular Disease and Dementia in the District of Ebersberg)
First author, year Study
Sabia, 2017 Whitehall II
Soni, 2019
English Longitudinal Study of Ageing (ELSA)
Zotcheva, 2018 Nord-Trøndelag Health Study (HUNT1)
Hansson, 2019 Swedish Vasaloppet cohort & Malmo Diet and Cancer study (MDCS)
Wu, 2020 Shanghai Aging Study
7.9 Smoking
Table A9. Global Relative Risk Studies
First author, year
Garcia, 2010 N/A
Gong, 2021 UK Biobank
Ikeda, 2008 N/A
Ohara, 2015 Hisamaya Study
Prince, 1994 Medical Research Council Study
Zhang, 2021 UK Biobank
Self-report
Self-report questionnaire
Self-report
questionnaire
7.10 Social Isolation
Table A10. Global Relative Risk Studies
First
Joyce, 2021 ASPREE Longitudinal Study of Older Persons (ALSOP)
Shen, 2022
2022
Saito, 2018
Revised Lubben Social Network Scale (LSNS)
7.11 Systolic Blood Pressure
Table A11. Global Relative Risk Studies
Raffaitin, 2009 French Three-City (3C) Cohort
2011
Prince, 1994
Rosengren, 2005
Gong, 2021
Raj, 2022
Hilkens, 2021
Regimen for Effectively avoiding Second Strokes (PRoFESS)
Halliday, 2022 The Asymptomatic Carotid Surgery
Moberg, 2022 Westmannia Cardiovascular Risk Factors Study (WICTORY)
First author, year Study
Ernst, 2021
Jung, 2021
Shang, 2021
Ma, 2020
Yoo, 2020
Aspirin in Reducing Events in the Elderly (ASPREE)
National Health Insurance Services Health Screening Cohort (NHIS-HEALS)
and
Longitudinal Study of Ageing (ELSA)
Yokomichi, 2020 Japan Gerontological Evaluation Study (JAGES)
Kotaki, 2019
Ohsaki Cohort 2006 Study
Abell, 2018 Whitehall II Cohort Study
Peng, 2017
The Health Improvement Network in United Kingdom
Miwa, 2016
Osaka Follow-up Study for Carotid Atherosclerosis, Part 2 (OSACA2)
Forti, 2010
Conselice Study of Brain Ageing (CSBA)
First author, year Study
Emdin, 2016
Seux, 1999
Practice
Datalink (CPRD)
Systolic Hypertension in Europe (Syst-Eur) trial
Kivipelto, 2002 North Karelia Project and FINMONICA
Wu, 2003 Nutritional Intervention Cohort Study in Linxian County
Lee, 2022
Elderly Health Centres of the Department of Health of the Government of Hong Kong
Qiu, 2010
Ninomiya, 2011 Hisamaya
7.12 Traumatic Brain Injury
Table A12. Global Relative Risk Studies
First
Chu, 2016
Longitudinal Health Insurance Database of Taiwan (LHID 2004/2005/2006)
Fann, 2018
Lee, 2013
Nordström, 2018
Wang, 2012
2022
2023
Jacob, 2020
Zhang, 2023
Osler, 2020
Tolppanen, 2017
Across the Lifespan Twin (SALT)
of China)
First author, year Study
Nordström, 2014
Swedish National Patient Register Conscription Database
Cations, 2018 ‘Improving Service Provision in Younger Onset Dementia’ (INSPIRED) study of YOD epidemiology, and the ‘Koori Growing Old Well Study’ (KGOWS) of urban Aboriginal Australian aging

IHME Client Services Institute for Health Metrics and Evaluation at University of Washington ihmeclientservices.org services@healthdata.org 8 billion people. 1 data set.
