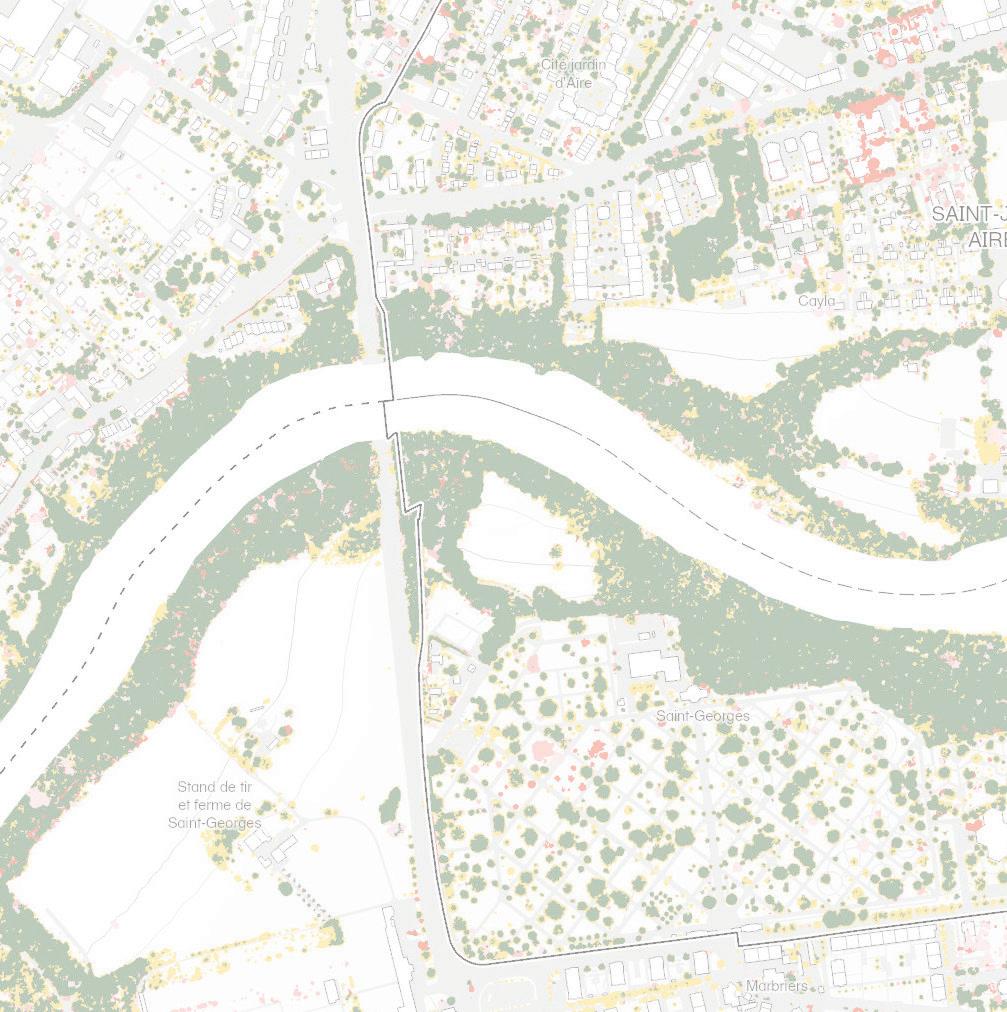
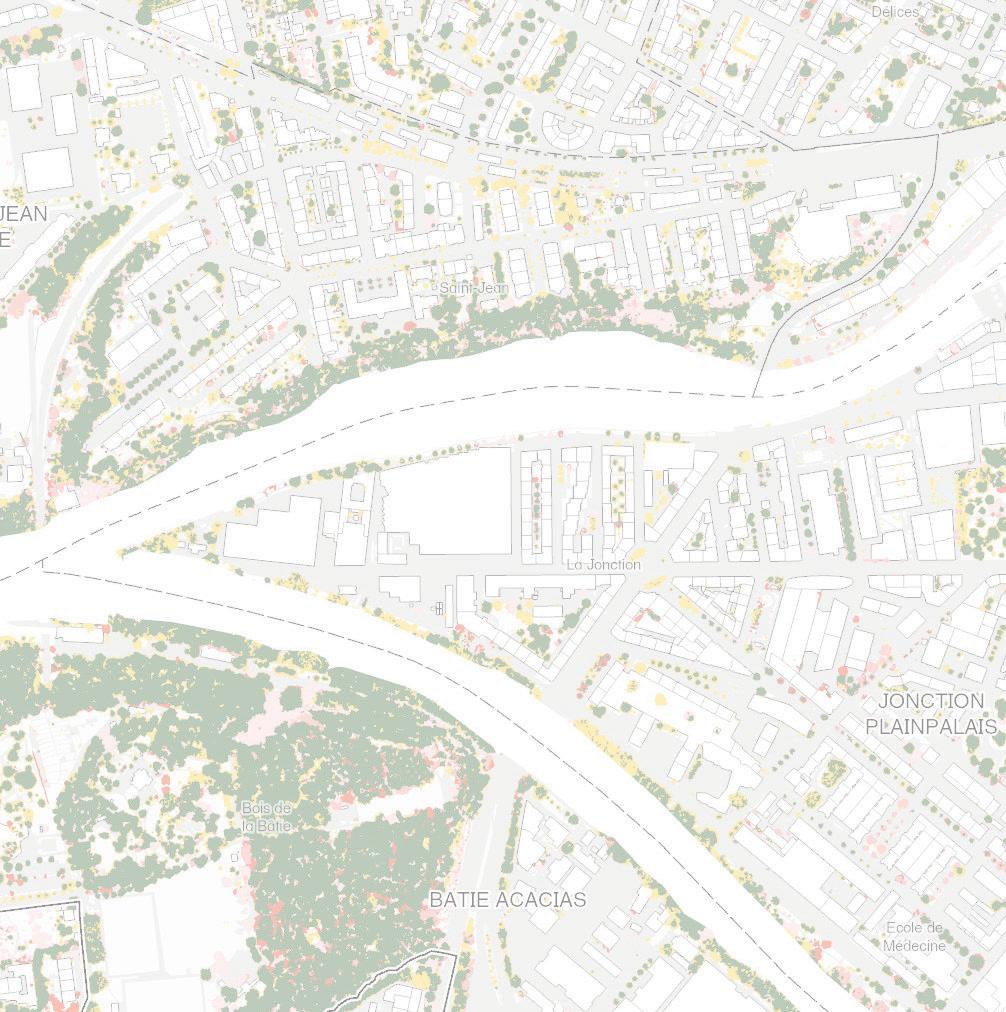
Eric Kramer
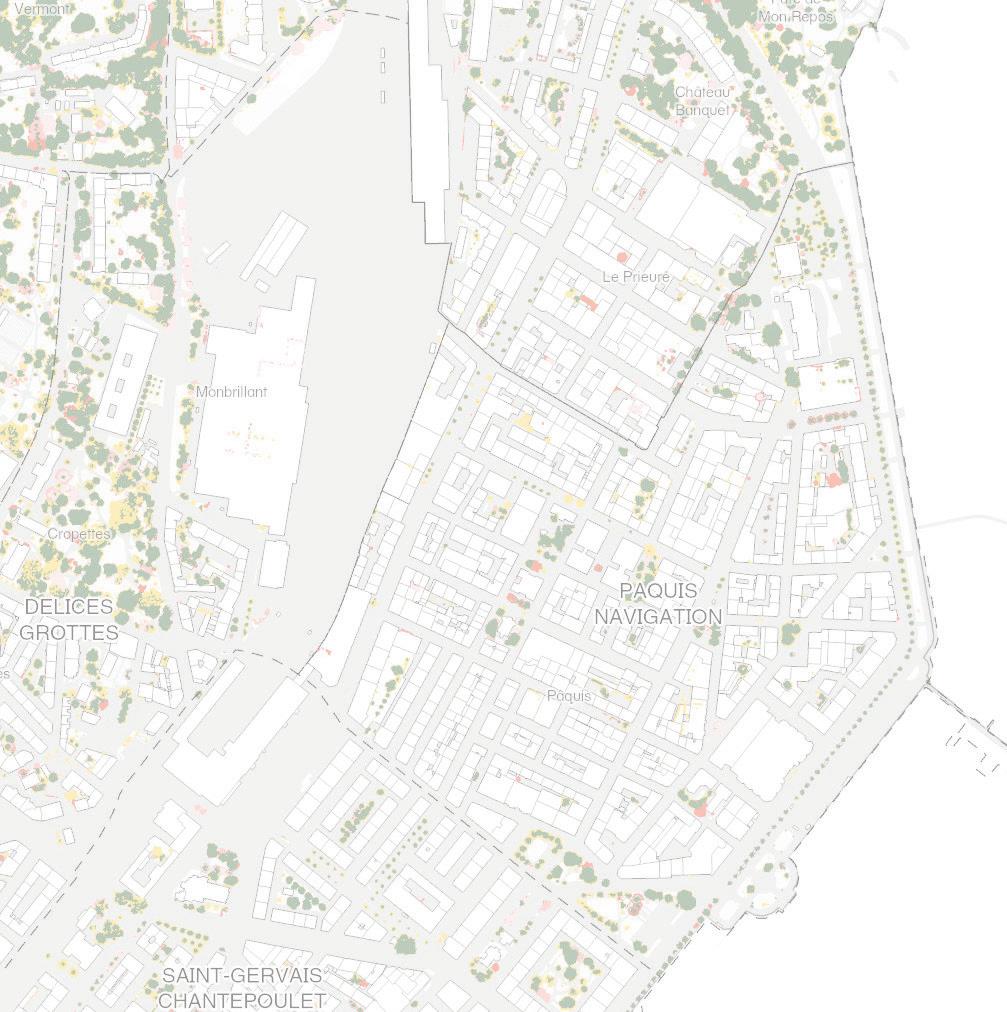


Eric Kramer


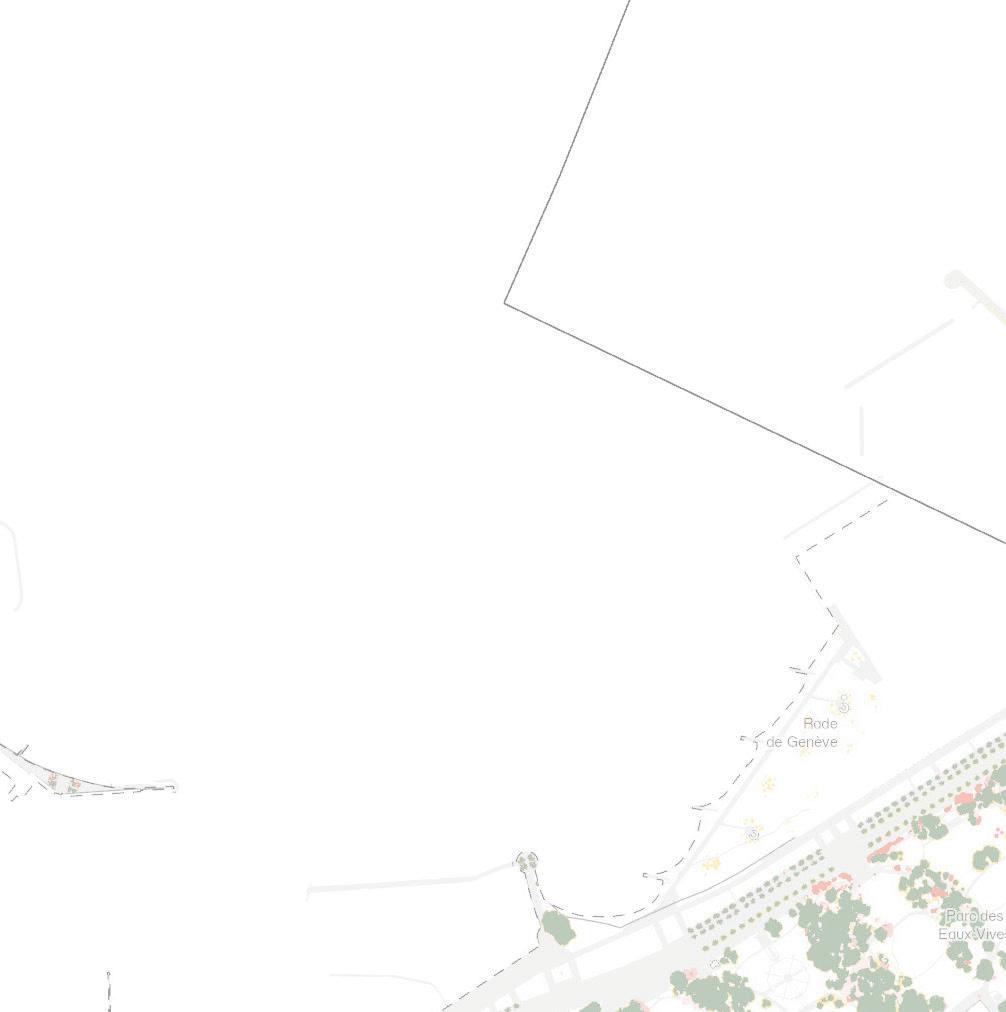
Eric Kramer
Instructor
Eric Kramer
Teaching Team
Max Piana, Slide Kelly, Melanie Louterbach, Anita Berrizbeitia
Research Assistant
Andrew Ó Murchú
Students
Caroline Brodeur, Michelle Lee, Xinying (Kiesza) Li, Oliver Oglesby, Andrew Ó Murchú, Emma Tracy, Rose Van Grinsven, Nina Zhao
Final Review Critics
Anita Berrizbeitia, Amy Whitesides
11 Foreword
Gary R. Hilderbrand
12 Preface: Cultivating Shade
Policy, Planning, and Design for Geneva’s Urban Forest
Eric Kramer
20 Urban Forest Planning as Data Driven Design
Eric Kramer, Max Piana, and Slide Kelly
36 Case Studies
Caroline Brodeur, Michelle Lee, Kiesza Li, Oliver Oglesby, Andrew Ó Murchú, Emma Tracy, Rose Van Grinsven, Nina Zhao
72 Where is the forest, and how is it Changing? A Baseline Urban Tree Canopy Assessment for Geneva
Slide Kelly Projects
Analysis of Existing Trends and Conditions
88 The State of the Regional Forest: Grand Genève’s Uneven Development
Oliver Oglesby
126 3-30-300 Rule in Geneva
Rose Van Grinsven
Locating Planting Opportunities and Enhancing Connectivity
136 Where the Water Meets the Forest: Geneva’s Urban Canopy in the Aquatic Buffer
Caroline Brodeur
204 Strengthening the Connectivity of Geneva’s Urban Forest through Easment Zones
Emma Tracy
216
236
Climate Adaptation and Risk Management
Species Diversity & Climate Risk: Is the current mix of tree species in the City of Geneva putting the urban canopy at risk in the face of rising heat and climate stress?
Andrew Ó Murchú
Prioritizing Strategies for Planting
Strategic Tree Planting for Cleaner Air: Prioritizing Tree Planting Efforts Based on Pollution Exposure and Existing Canopy Coverage Near Roadways
Michelle Lee
248
How can planting be prioritized to target key drivers of vulnerability in the most at-risk urban areas?
Kiesza Li
Where to Act and Whom to Act With: Strategies for Expanding Geneva’s Urban Forest
Nina Zhao
Closing
Takeaways & Recommendations
Eric Kramer, Max Piana, and Slide Kelly 292
Towards Design: After Data: Forest Futures for Geneva
Anita Berrizbeitia 294 Reference Maps
Slide Kelly
Gary R. Hilderbrand
As the earth warms at an unfamiliar and frankly perilous rate, our metropolitan areas are feeling the brunt of climate vulnerability. Cities worldwide break temperature records each consecutive summer season. One of the few meaningful responses to this crisis is stemming the decline of the urban tree canopy and expanding shade with diverse forms of vegetative cover. Every city has room to grow its canopy, and most now realize the urgency of doing so.
Fortunately, the tools and technical professional practices for this work of urban forestry have increased in effectiveness over the past two decades, and commensurately, community interest and activism have also blossomed. Care and human comfort stand at the heart of this work. And practice in this space is existential to environmental justice in every city on the planet.
Harvard University’s Department of Landscape Architecture is fortunate to connect deeply with partners who help us to examine wicked problems like this one. We’re especially blessed to be generously supported in this effort by the
board of Fondation La Gara in Geneva. And we are grateful to other partners and associates, including Robert Perroulaz, who has charitably guided our process in Geneva, along with Andre Baud, Sandra Spissinger, Yves Kazemi, and Peter Gallinelli, who pursue this topic with immense passion in Geneva and who have graciously received us on our visits to the city. They have helped shaped the inquiry of the seminar and the upcoming studio and we hope we’ve shed strong light on ways to expand and refine the good work they have already completed in the City and the Canton. Also, thanks are due to other participants from the city and from HEPIA (Haute École du Paysage d’Ingénierie et d’Architecture); we sincerely appreciate the interest in collaborating further. We’re especially grateful to our dear friend, Professor Michael Jacob, for introducing us to Rémy and Verena Best—bravo, Michael. Finally, thanks to the teaching team and our amazing students for getting the study under way with gusto and brilliance. And, always, thanks to Dean Sarah Whiting for her constant collaboration and support. On to the studio!

Eric Kramer
Urban forests are fingerprints for our communities. They have much to tell us about the history of city-building, of our political and social values, and of our constantly evolving ideas about the relationship between nature and culture — sometimes revealing challenging legacies of prejudice and power. They are also vital infrastructure for our future, mitigating a rapidly changing climate and supporting healthier civil societies. To respond to these challenges, new tools are required.
This is the purpose of the urban forest master plan: to organize and structure efforts to preserve, expand, and enhance our urban forests. And the urban forest master plan is the subject of this research seminar and report.
For generations the trees of our cities were planted and managed as individuals, sometimes as spatial compositions — think shady boulevards, urban bosques, and picturesque parks. In the 1970s, especially in the US and Europe, as the challenges that face our cities and their trees expanded, the urban canopy started to be analyzed, planned, and cultivated as a system — as a forest. And, through the aspirational planting goals of the early 2000s — like New York’s Million Trees NYC initiative — the field gained visibility and prominence in the public sphere.
Over the last two decades, new remote sensing technologies, advanced computer modeling and machine learning have and continue to transform the capacity and reach of the field. They enable us to better understand forests as dynamic systems, and they unlock new data that can ground and empower analysis and planning in actionable recommendations. Today, urban forest planning is a maturing and increasingly necessary field. But it is one that still does not have agreed upon standards, approaches, or best practices.
Even the term “Urban Forest” seems to be in flux and in need of formal definition. In many parts of Europe, it means a particular scale of woodland that operates as a coherent ecotype, mostly in parklike conditions. In the US, and for the purposes of this study, when we say the urban forest, we mean all trees growing in the city and often beyond city limits at the regional scale, because ecosystems and microclimates don’t obey political boundaries.
Systems that span public and private lands, designed and naturalized conditions, and urban, suburban and sometimes rural conditions, urban forests are the under the control of diverse owners and agencies. So, efforts to influence the forest rely on the broadest range of tools of planning — policy and design, engagement and education, economics and ecosystem management.
This research seminar engages the subject of the urban forest master plan as a tool for transformative change — change that is ecological as well as cultural. Taught in the department of landscape architecture it seeks to leverage the increasing availability of spatially and temporally specific data to envision sitespecific, culturally grounded, and spatially coherent design solutions that protect, enhance, and enlarge the urban forest. We are bringing design thinking to systems-scale challenges. And we are using the tools designers know best, the case study, scenario planning, and the prototype, to ground our methodology.
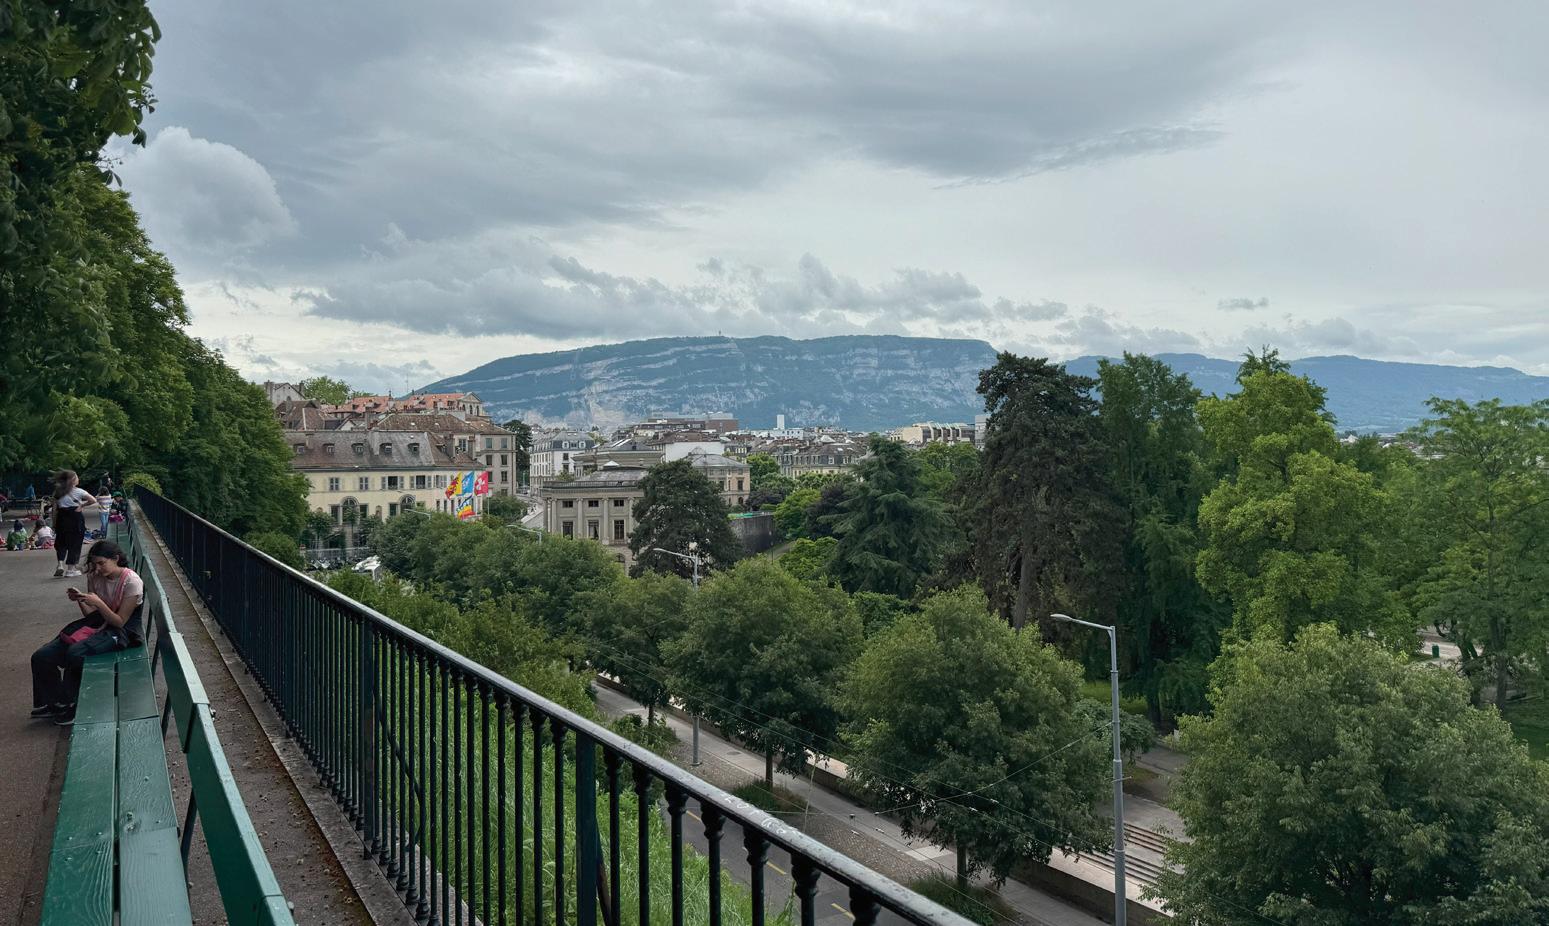
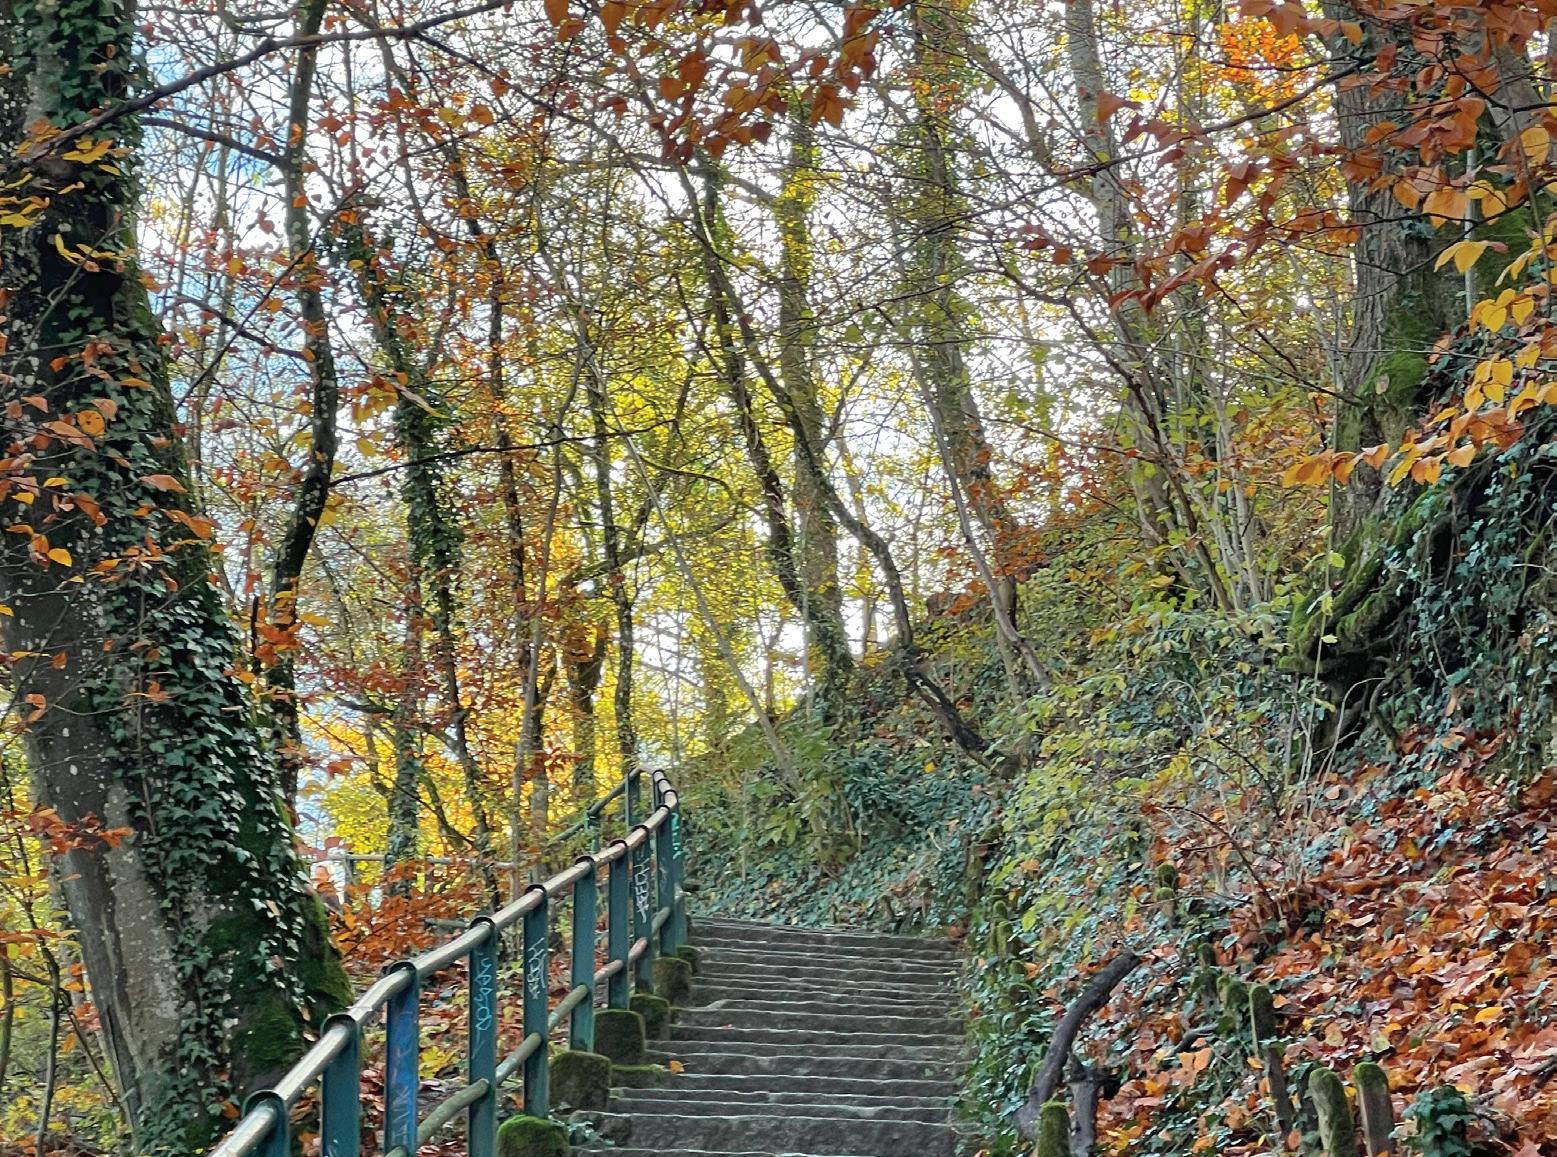
In this research seminar, students undertook a deep dive into the mechanisms of urban forest planning and design, with Geneva, Switzerland, as its primary case study. There, civic leaders are already planning for the future, aiming to leave a better city for the next generation of citizens. They have committed to activating the urban forest to improve health and civic life, adapt to climate change, enhance biodiversity, and shape economic development.
To better understand the tools of urban forest planning, the course began with a series of case study analyses, reviewing the goals, methodologies, and recommendations of cities around the globe that have undertaken datadriven urban forest planning in the last 10 years. The findings of this analysis, supplemented by additional research, are summarized in this report, to posit the key components of contemporary state-of-the-art urban forest planning.
We then focused on determining the vectors of influence that have resulted in the urban forest Geneva has today. We used data as a diagnostic device. We sought to understand the specific pathologies and underlying patterns of Geneva’s forest. And with this in hand, each student selected a strategy to project forward, proposing potential mechanisms and design concepts to shape the forest’s future. Proposals range from enhanced analytical tools for assessing canopy equity and forest health to detailed recommendations around species selection for air quality enhancement, tools to find plantable areas in dense urban environments, and strategies for enhanced connectivity that leverage existing riparian corridors. These recommendations engage planning, design, policy, engagement and education. And they act at the local and regional scale.
This research seminar is paired with a design studio taught in Fall 2025. Students in the design studio will build upon the knowledge gathered here to test specific design-based solutions for Geneva’s urban forest.
This seminar and studio are made possible thanks to the generous support of Fondation La Gara, located in Geneva.
Geneva is an ideal city for this effort. It already has an incredibly deep and rich catalog of geospatial information, it has for generations been thoughtful about its planning and has always seen landscape systems as a critical part of the city fabric, and it has many parties committed to enhancing the urban forest in the name of climate resilience and social equity. The Foundation was instrumental in connecting the seminar team with partners on the ground in the municipal and cantonal government, in academic institutions, and in commercial development. This real-world knowledge and open dialogue brought a specificity to the students’ work which would not have been possible otherwise.
We look forward to continuing the robust engagement in the upcoming studio.

Members
the
2025
Eric Kramer, Max Piana, and Slide Kelly
Data allows planning to be spatially explicit. Data can dispel myths and shape defensible arguments. Data enables testing of assumptions and refinement of results. Data helps target solutions, so they are actionable.
Because as designers, we think systematically. We bring a skeptical view to everything we do. We see beyond the now and envision the future. We test and iterate and refine. We communicate ideas in accessible ways. And, we turn information into action. We build. We make things happen.
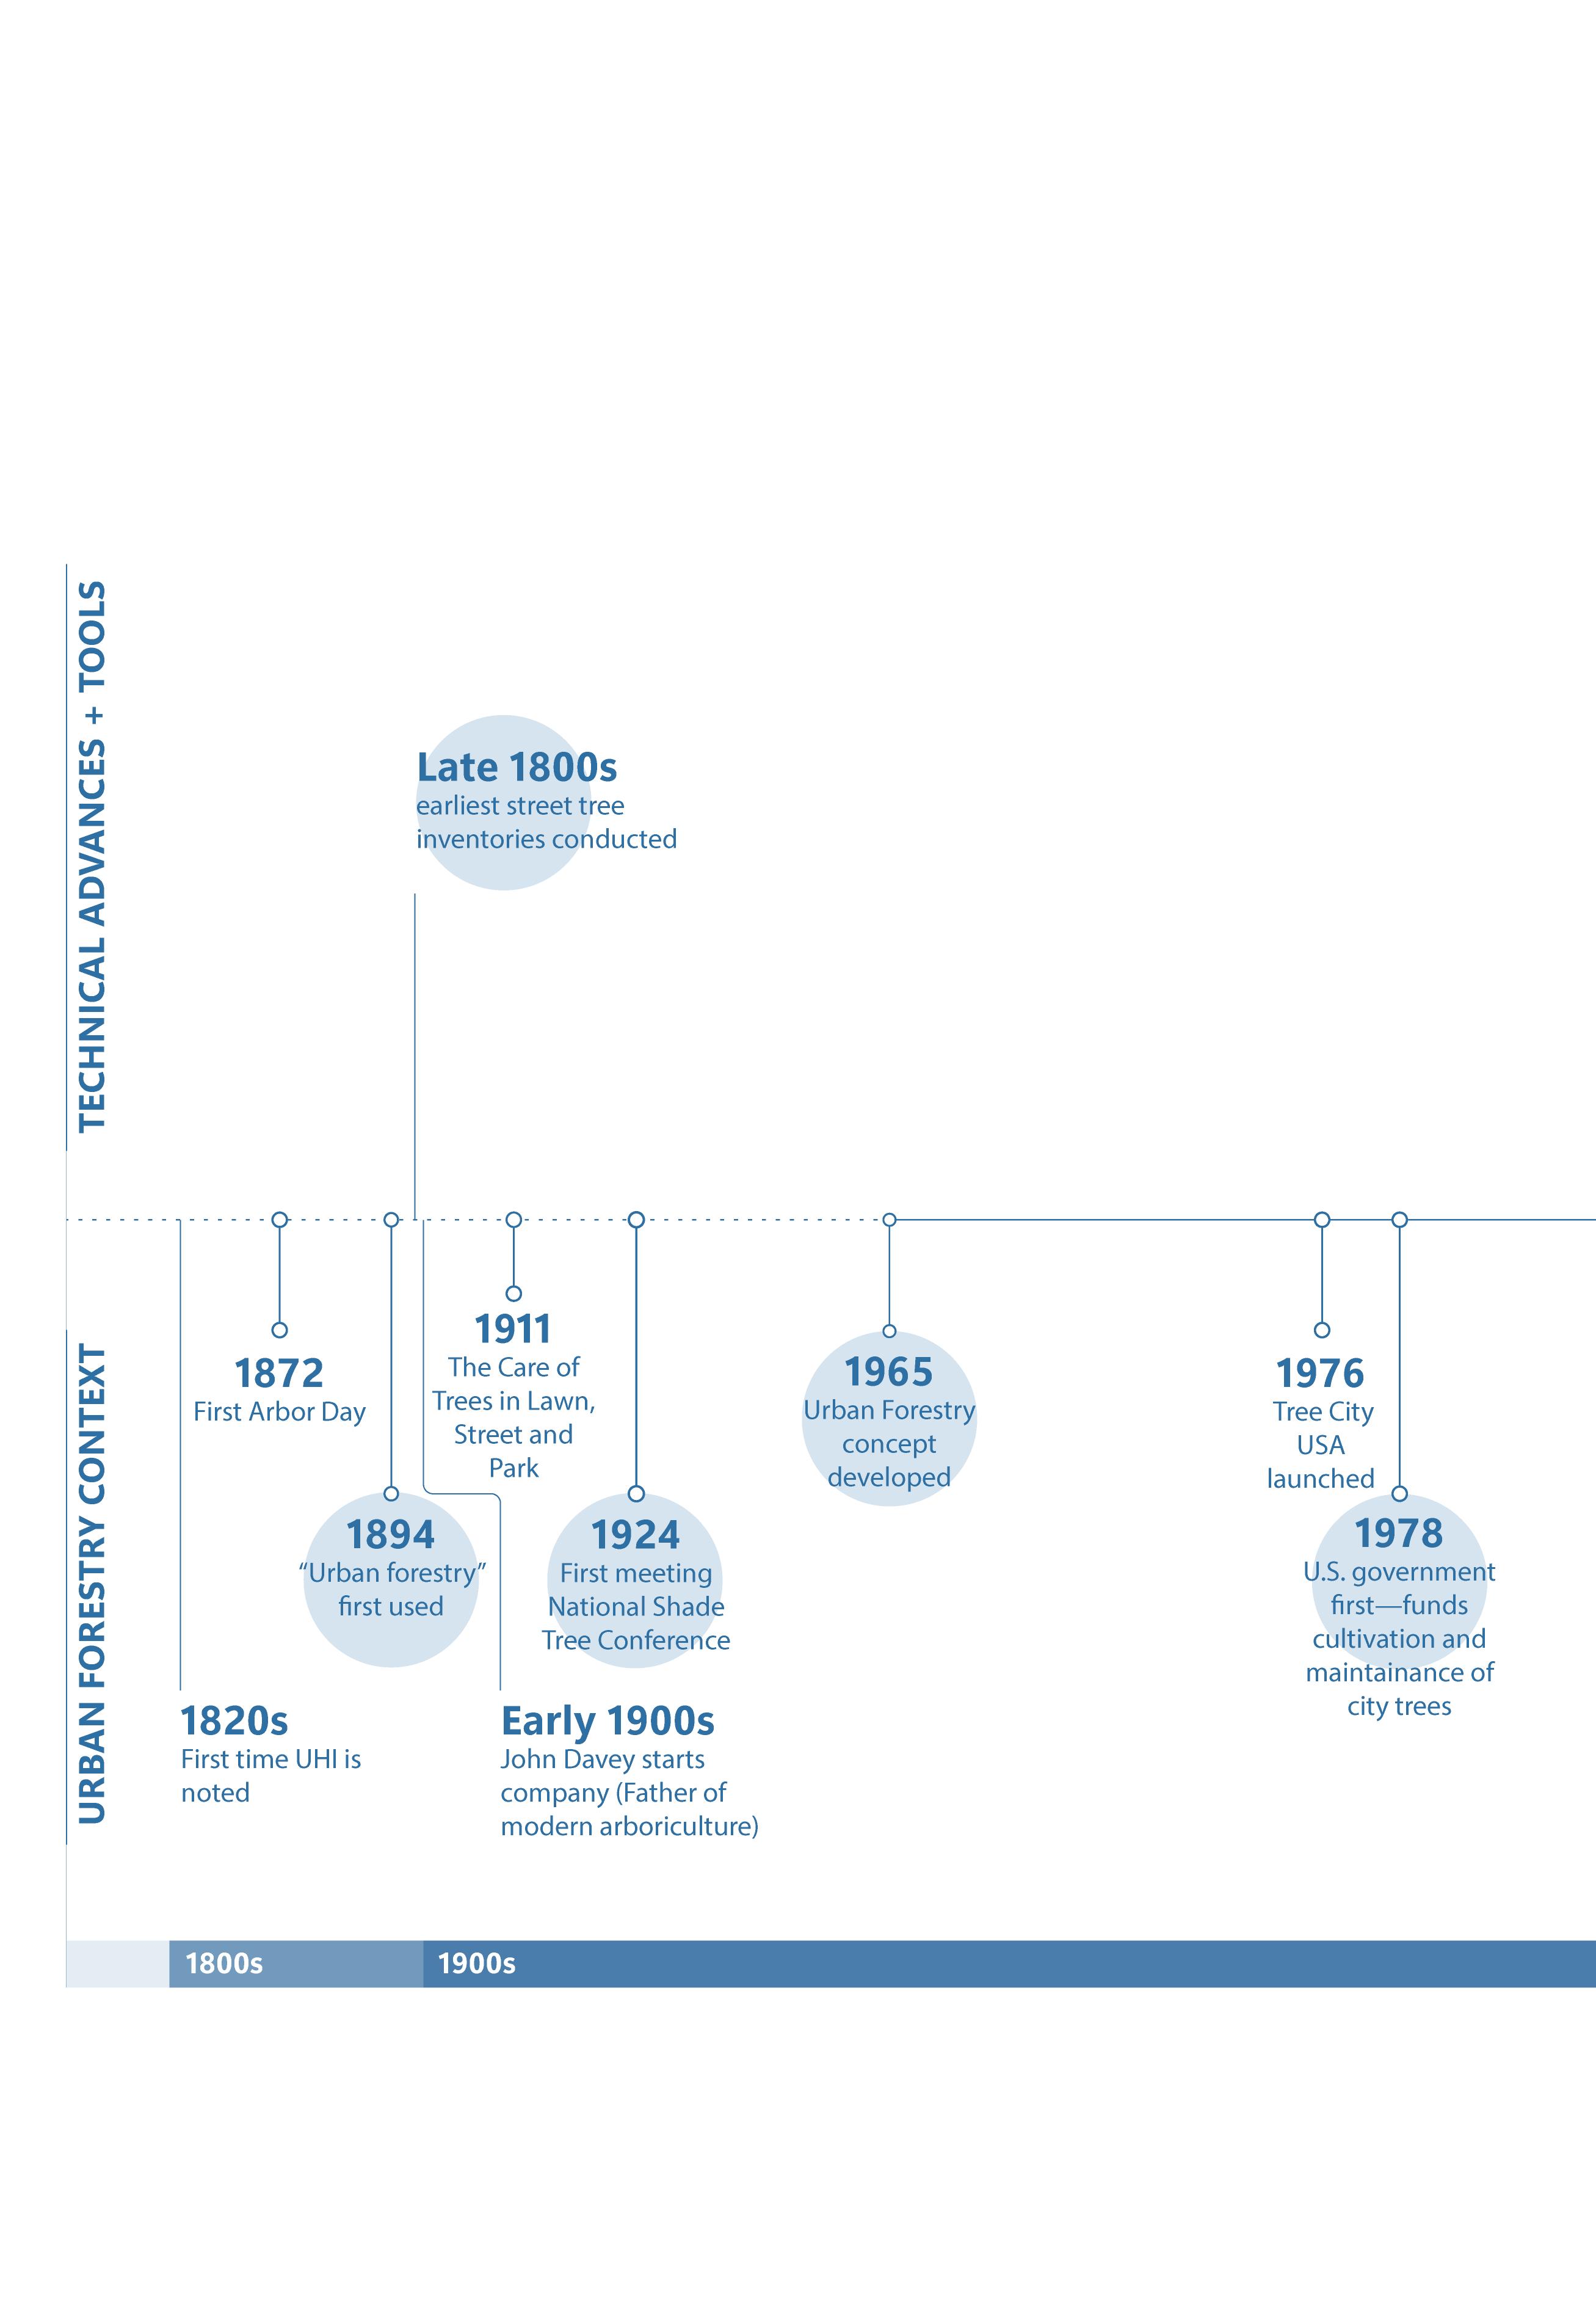
While the concept of urban forestry traces back to the 19th century, the idea of framing the urban tree population as a forest resource requiring planning and management was popularized by Canadian forester Erik Jorgensen in the mid-1960s.
Data-driven methods for assessing maintaining, and growing the urban forest take off in the early 21st cenutry, with the availability tools like USFS i-Tree, high-resolution orthoimagery, and multispectral LiDAR scanning.
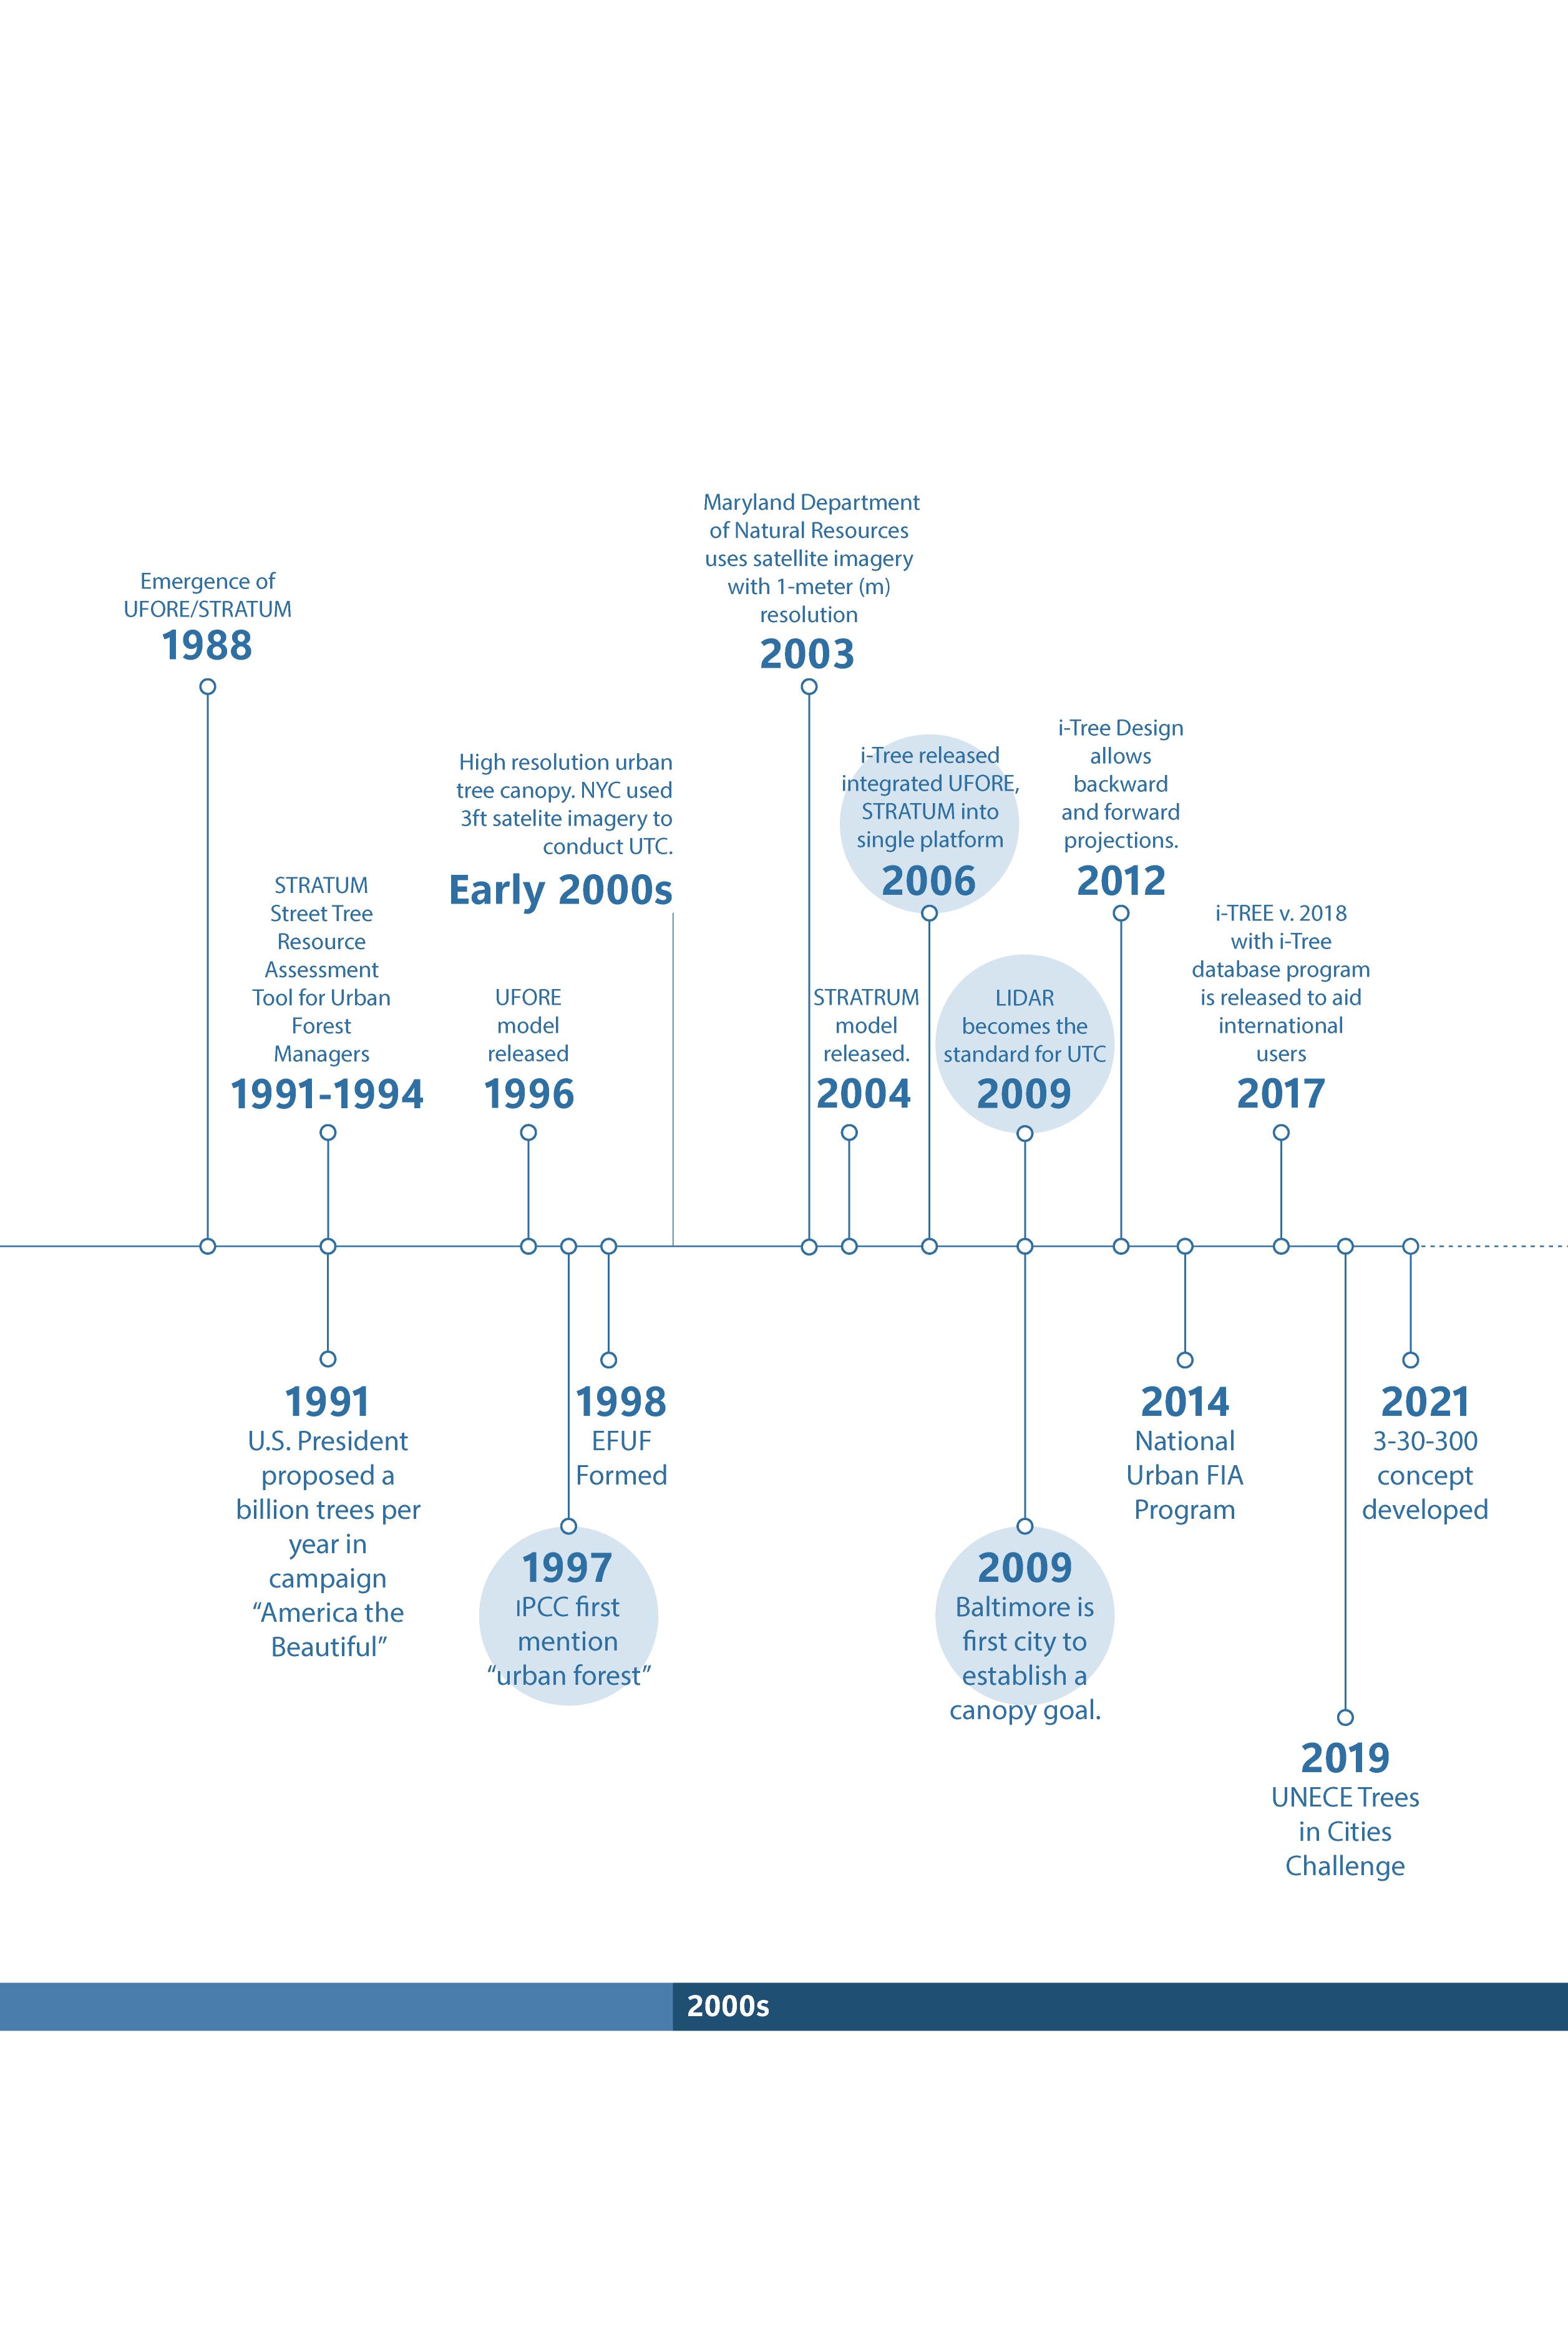
Planning and design turn knowledge into action. To do so efficiently and effectively takes practiced methodologies that have evolved over time to respond to the specific needs and conditions of each project type.
The urban forest master plan is still maturing as a methodology. While there are some evolving standards, mostly shaped by the analytical tools of the US Forest Service and the University of Vermont Spatial Analysis Lab, the cities with most robust plans are asking more complex questions of their data and they are innovating approaches on their own. The purpose of this initial phase of case study research was to catalog and understand the landscape of urban forest planning taking place around the world and define a range of best practices in the field.
Students considered case studies of leading international cities, attempting to deconstruct the planning methodologies, searching for patterns and overlaps, successful approaches and strategies, and impactful outcomes. They compared these approaches to what they learned during in-class presentations from the authors of urban forest plans for Philadelphia, Pennsylvania and Boston and Cambridge, Massachusetts.
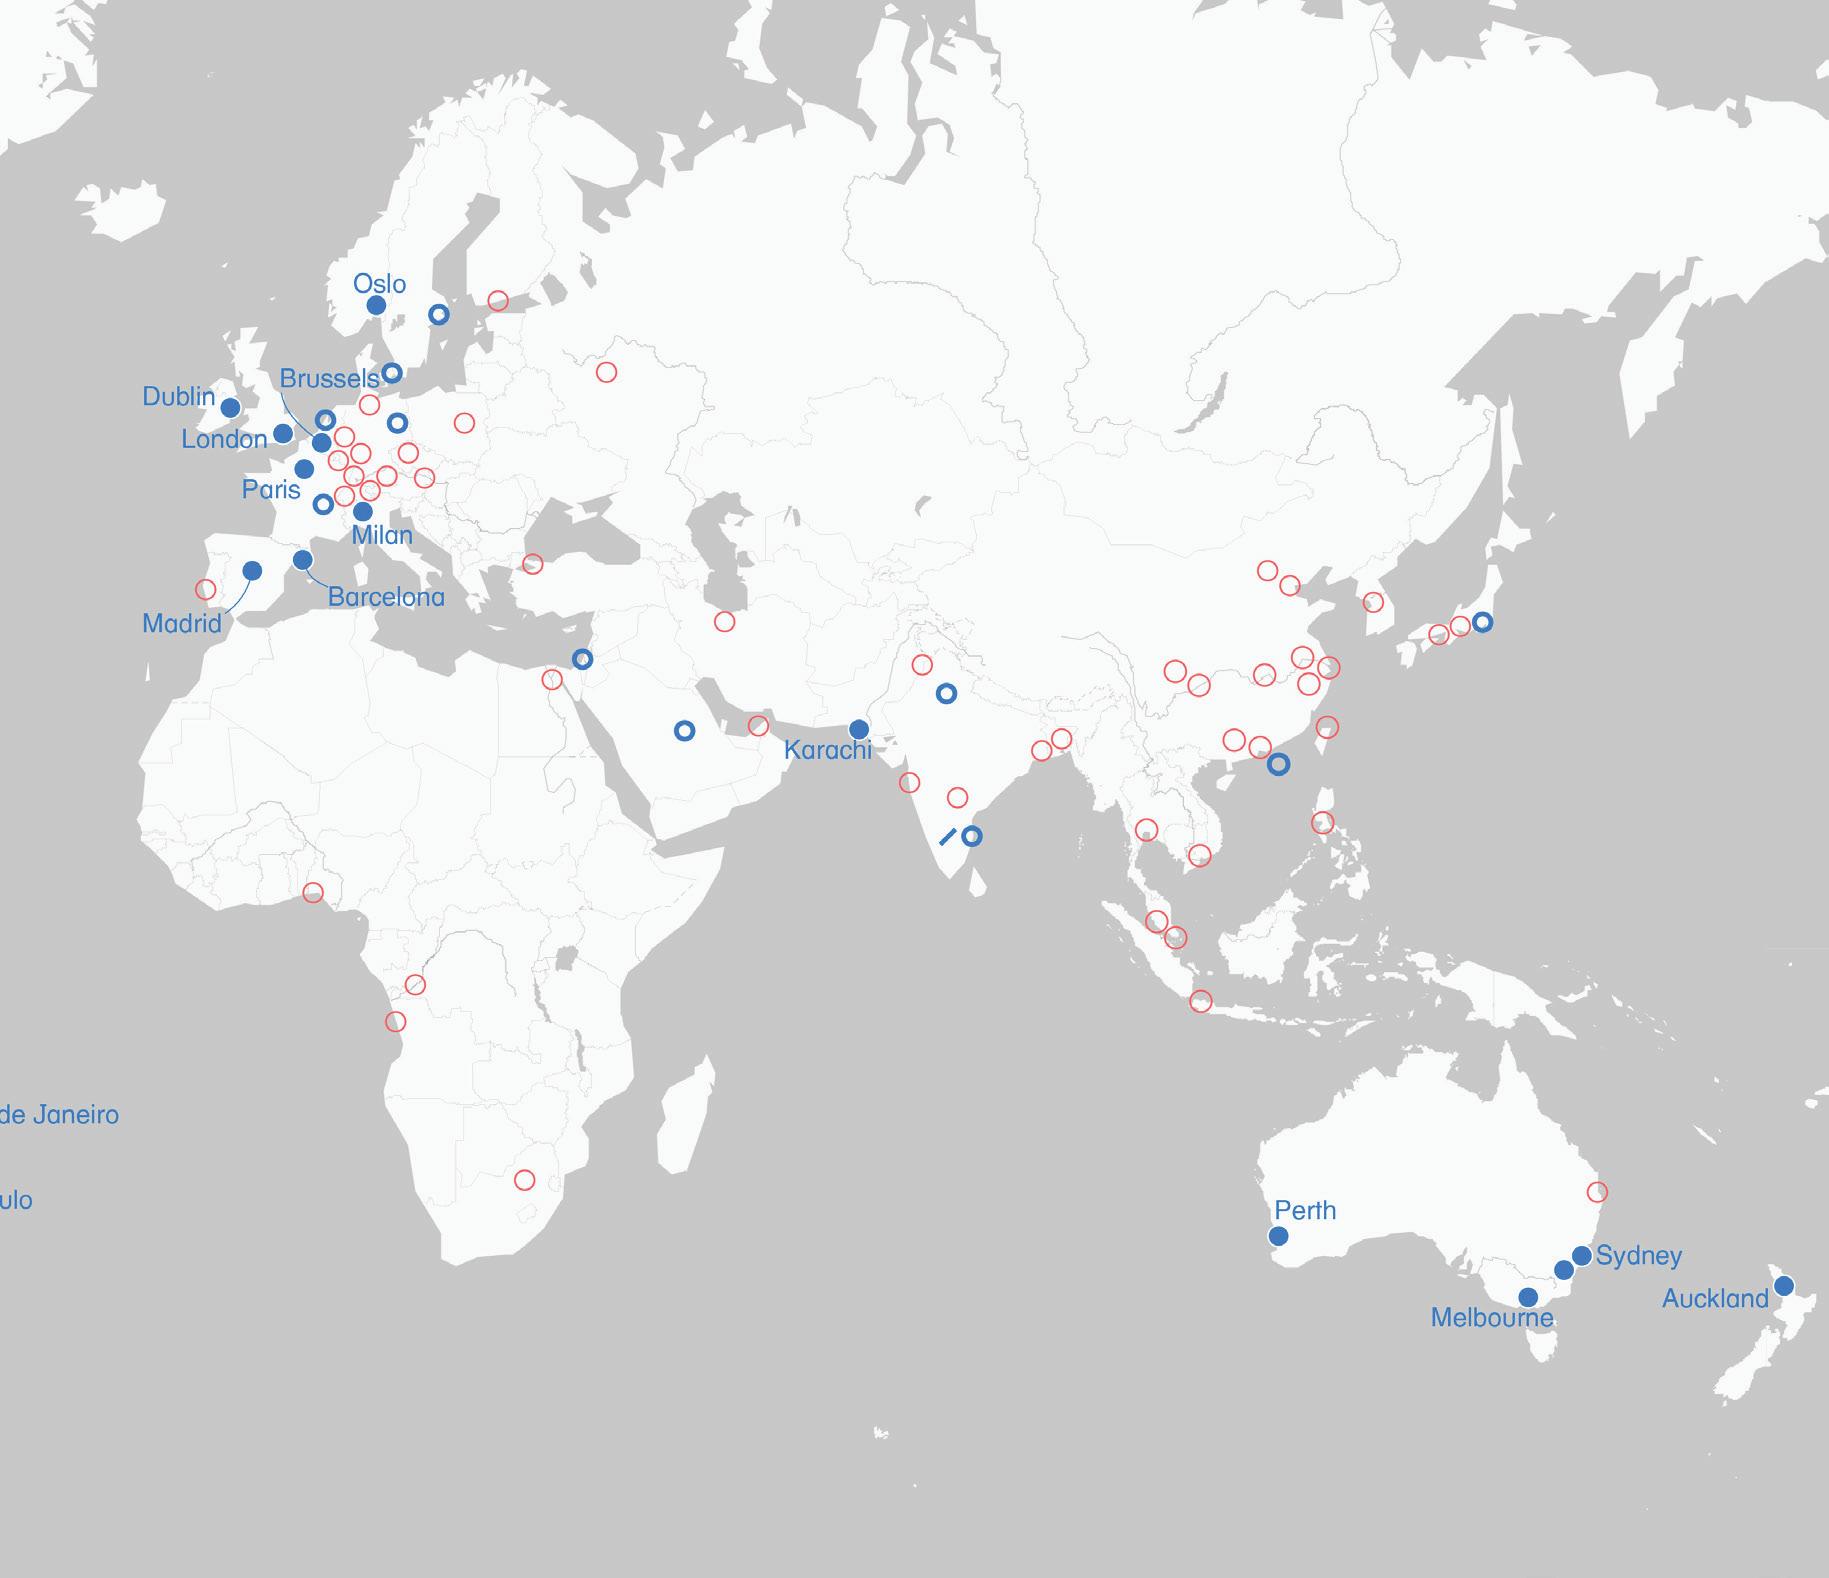
The seminar teaching team also undertook a meta-analysis of 101 global cities, based on a weighted index1 considering city population, economic significance and global connectedness. Of the 101 cities reviewed, 30 have what we consider to be comprehensive and data-driven urban forest plans. While others have canopy planting goals, urban greening plans, or other reports, we focused our analysis on plans that are focused on the urban forest, are based on the analysis of data, and which make specific recommendations.
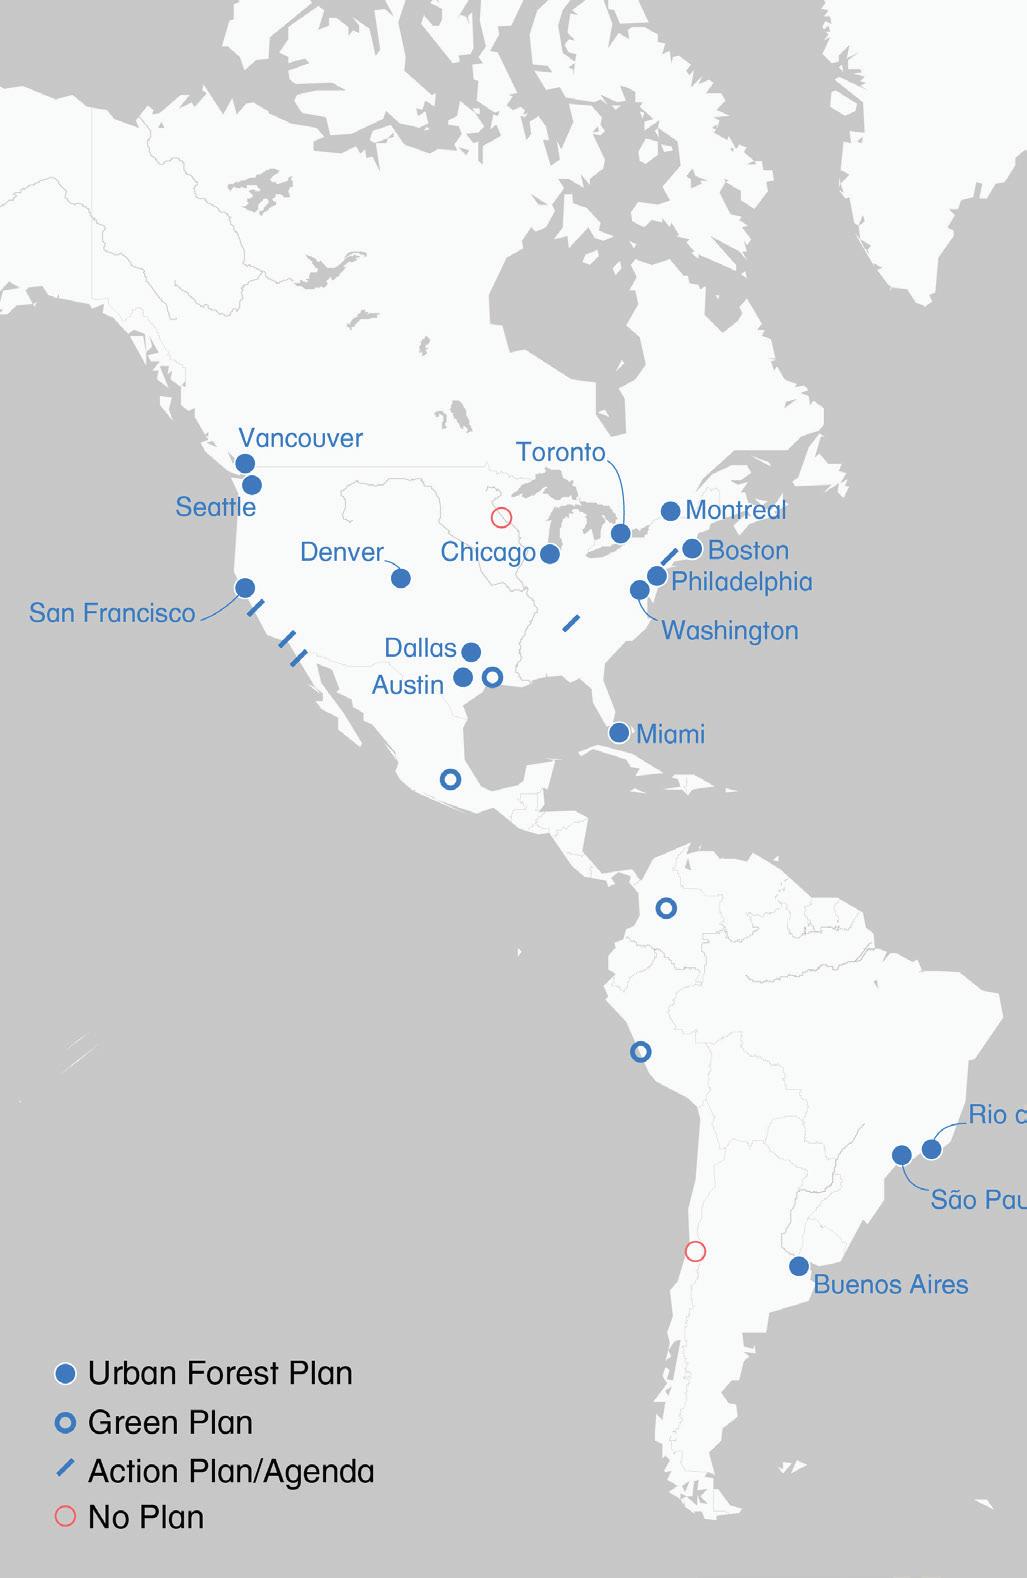
1 The weighted index for city selection compiled lists of 1) UN 2018 Urban Population Estimates, 2) Oxford Economics Global Cities Index 2025, and 3) GaWC Globalization and World Cities List 2024. Cities were ranked based upon position on each individual list weighted by number of lists on which a city was included.
Over the last few decades, the increased resolution of geospatial data and the expanding processing power of computers, including artificial intelligence, has transformed the capacity and reach of urban forest planning. These tools have enabled greater specificity and greater impact, and we think they have brought urban forest planning to an inflection point where urban forest data can more readily be translated to site-specific action.
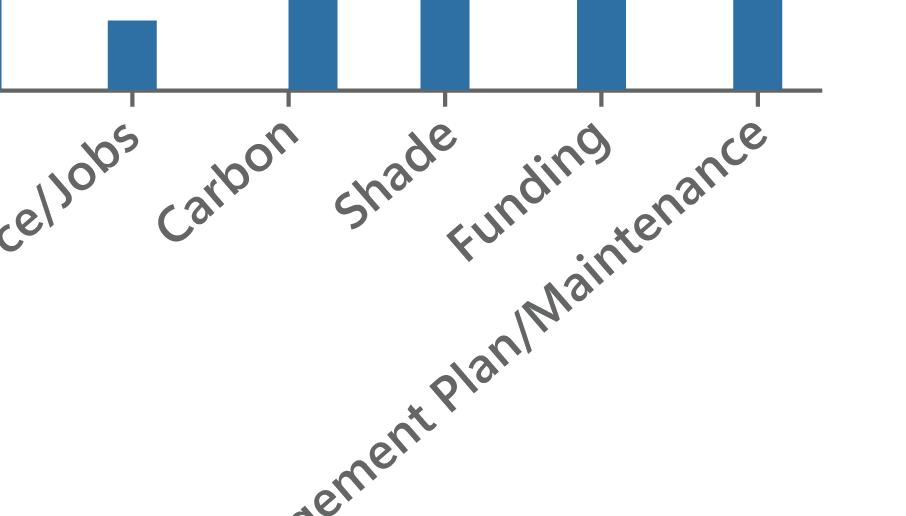
Why are cities undertaking urban forest plans? Our meta-analysis suggests a series of related themes: climate adaptation, resilience planning, development and economic pressures, and green infrastructure. Biodiversity and habitat and economic and social equity are themes of the most recent of the plans. The understanding that the urban forest provides social and cultural resilience through shade, community development and civic life, has also become an underlying rational for these efforts.
Cambridge, MA USA
Austin, TX USA
Boston, MA USA
Seattle, WA USA
Philadelphia, PA USA
Chicago, IL USA
Houston, TX USA
Miami, FL USA
Dallas, TX USA
San Francisco, CA USA
Urban forest plans have most frequently been authored by city agencies or NGOs. However, in recent years there has been an increased reliance on consultants, especially landscape architects, particularly in North America and Australia, to lead and author urban forest master plans. The complex motivations for undertaking these plans — many of which are culturally mediated — seems to indicate that landscape architects — generalists, humanists, and design thinkers — are well situated to take on this kind of work. The increasing specificity of data, which allows spatially explicit and design-oriented solutions also creates space for landscape architects to deploy their systems-based and site specific methodologies in response to real-world challenges.
Washington DC USA
Denver, CO USA
Vancouver, CA Canada
Toronto, ON Canada
Paris France
Barcelona Spain
London United Kingdom
Madrid Spain
Brussels Belgium
Dublin Ireland
Oslo Norway
Rio de Janiero Brazil
São Paolo Brazil
Buenos Aires Argentina
Karachi Pakistan
Perth Australia
Sydney Australia
Auckland New Zealand
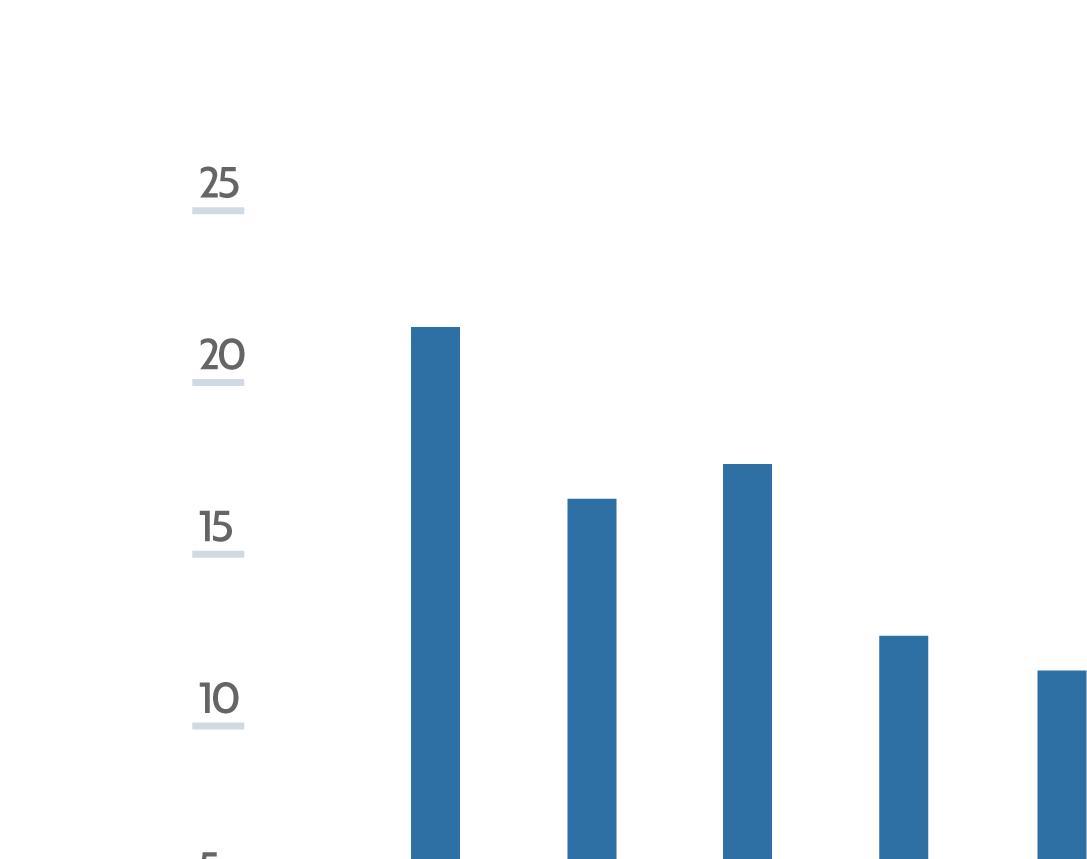
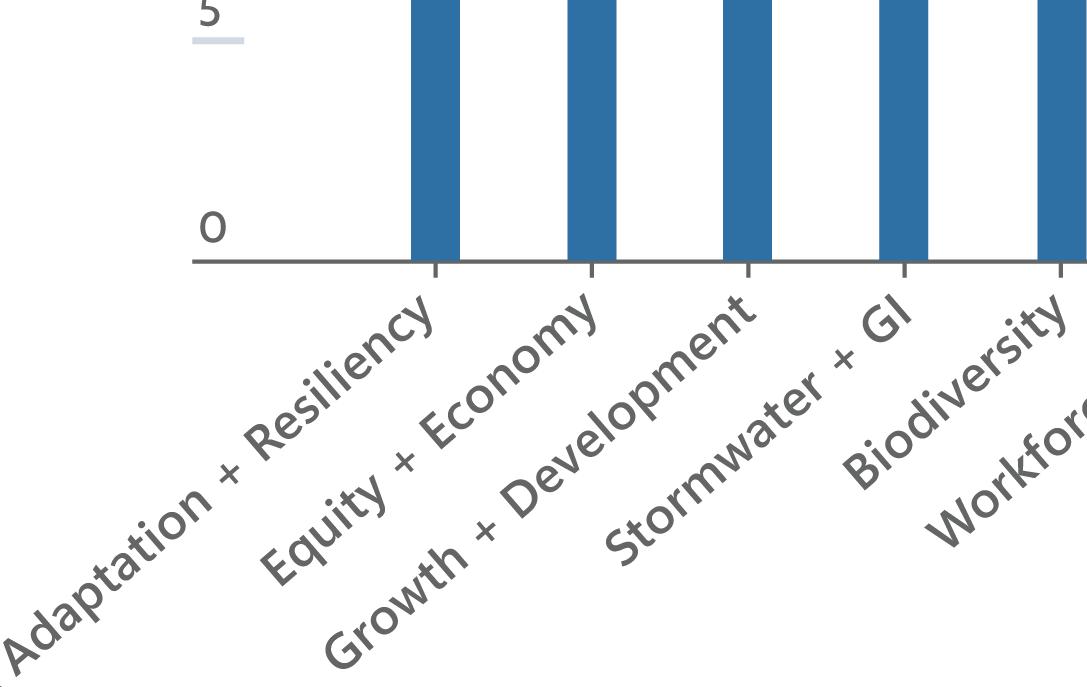

Impetus/Goals
Specified Goals by number of UFMPs

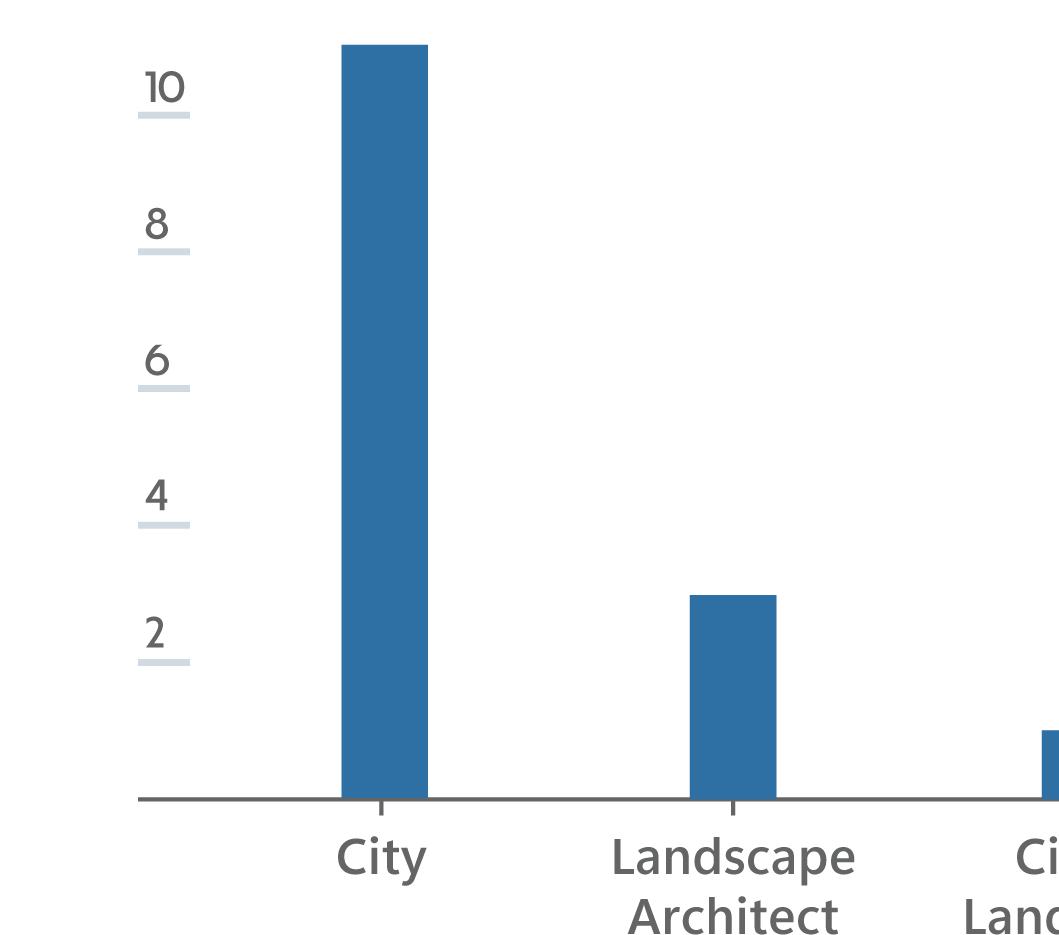

Authorship
Discipline/Agency by number of UFMPs

1. Linear: Singular scope of work with unilateral results.

2. Cyclical: Recurring scope of work where implementation of existing projects impact goals for future projects.
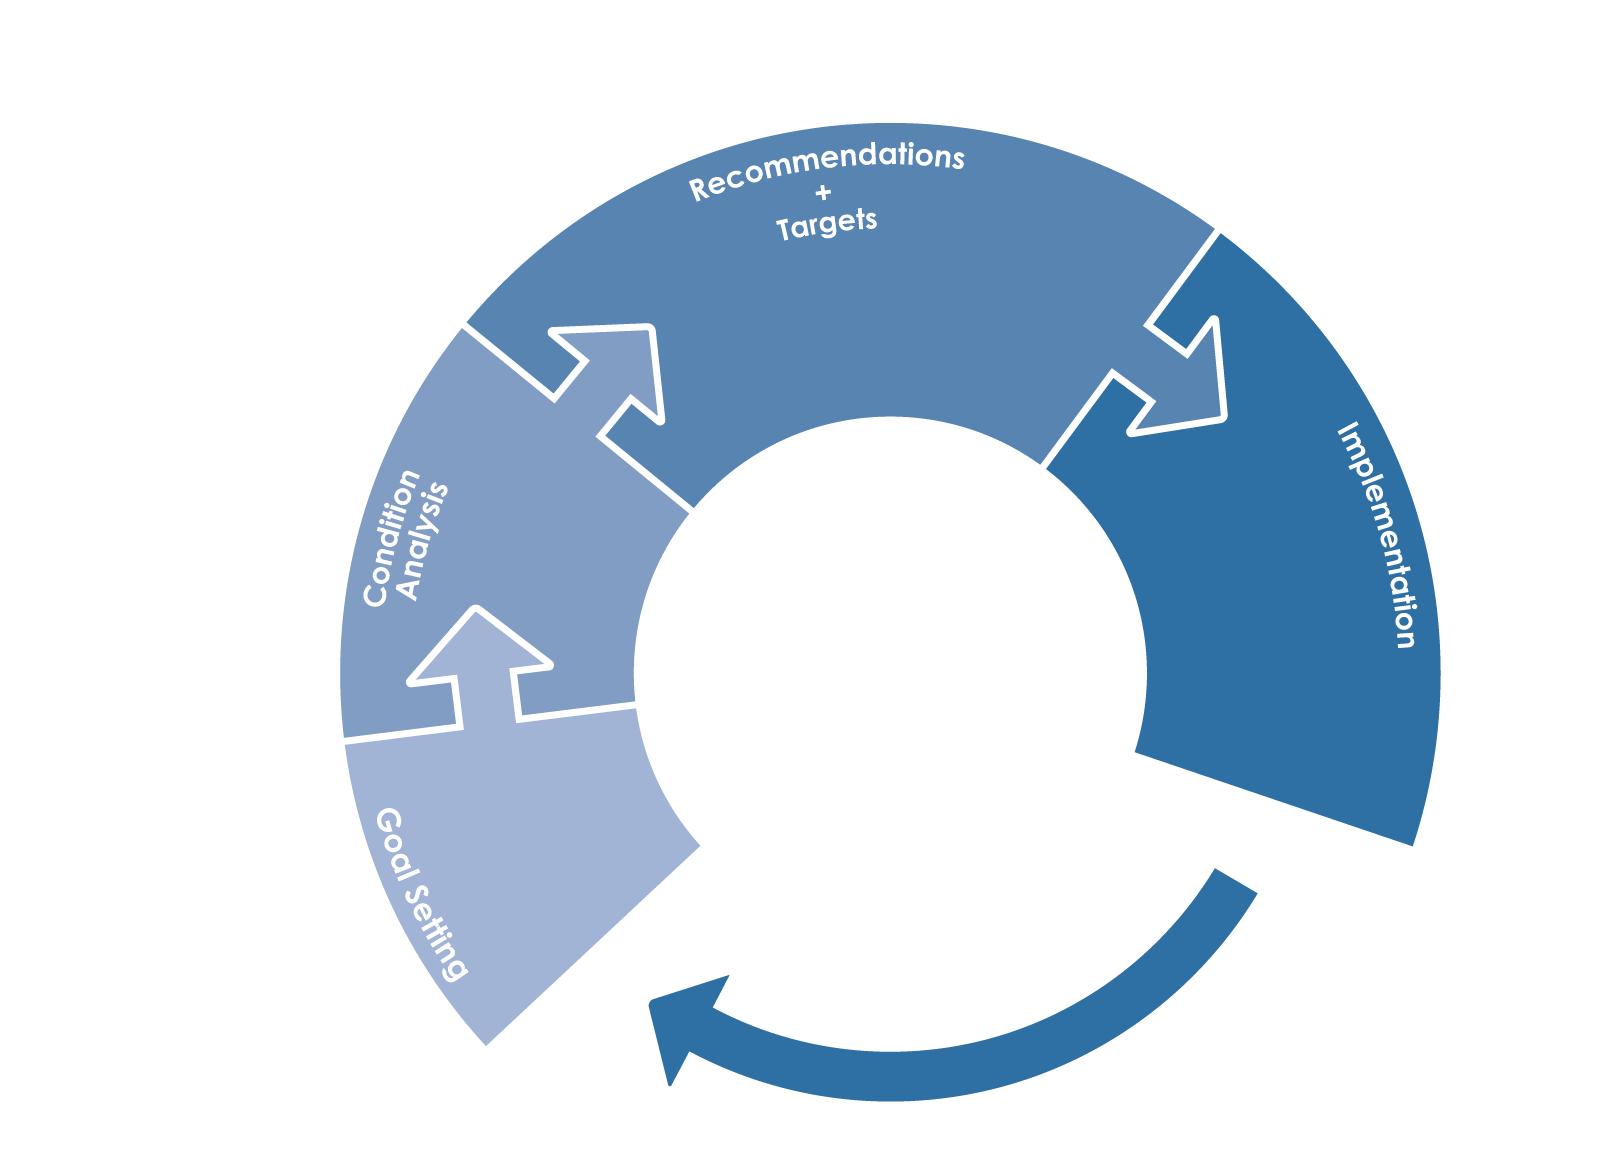
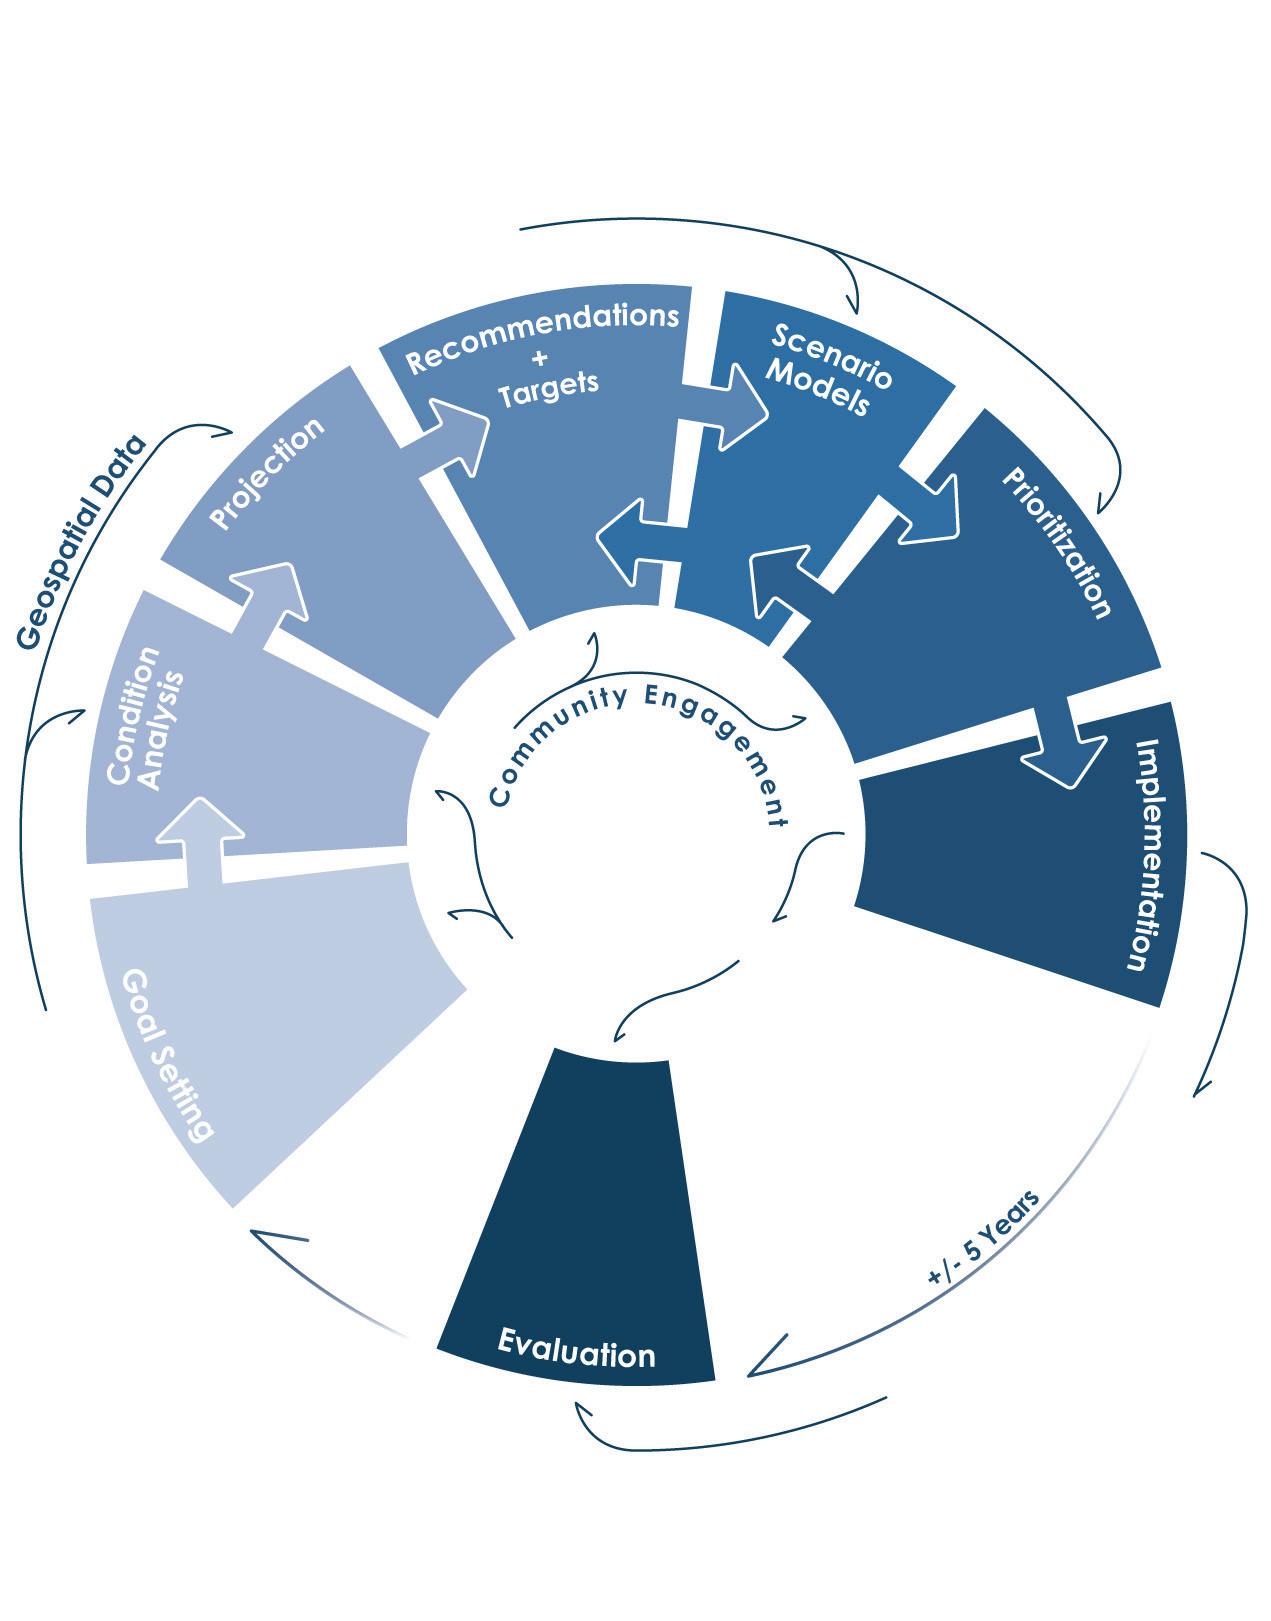
3. Continuous: Many-staged process responsive to data, design, and community engagement at every step of the way.
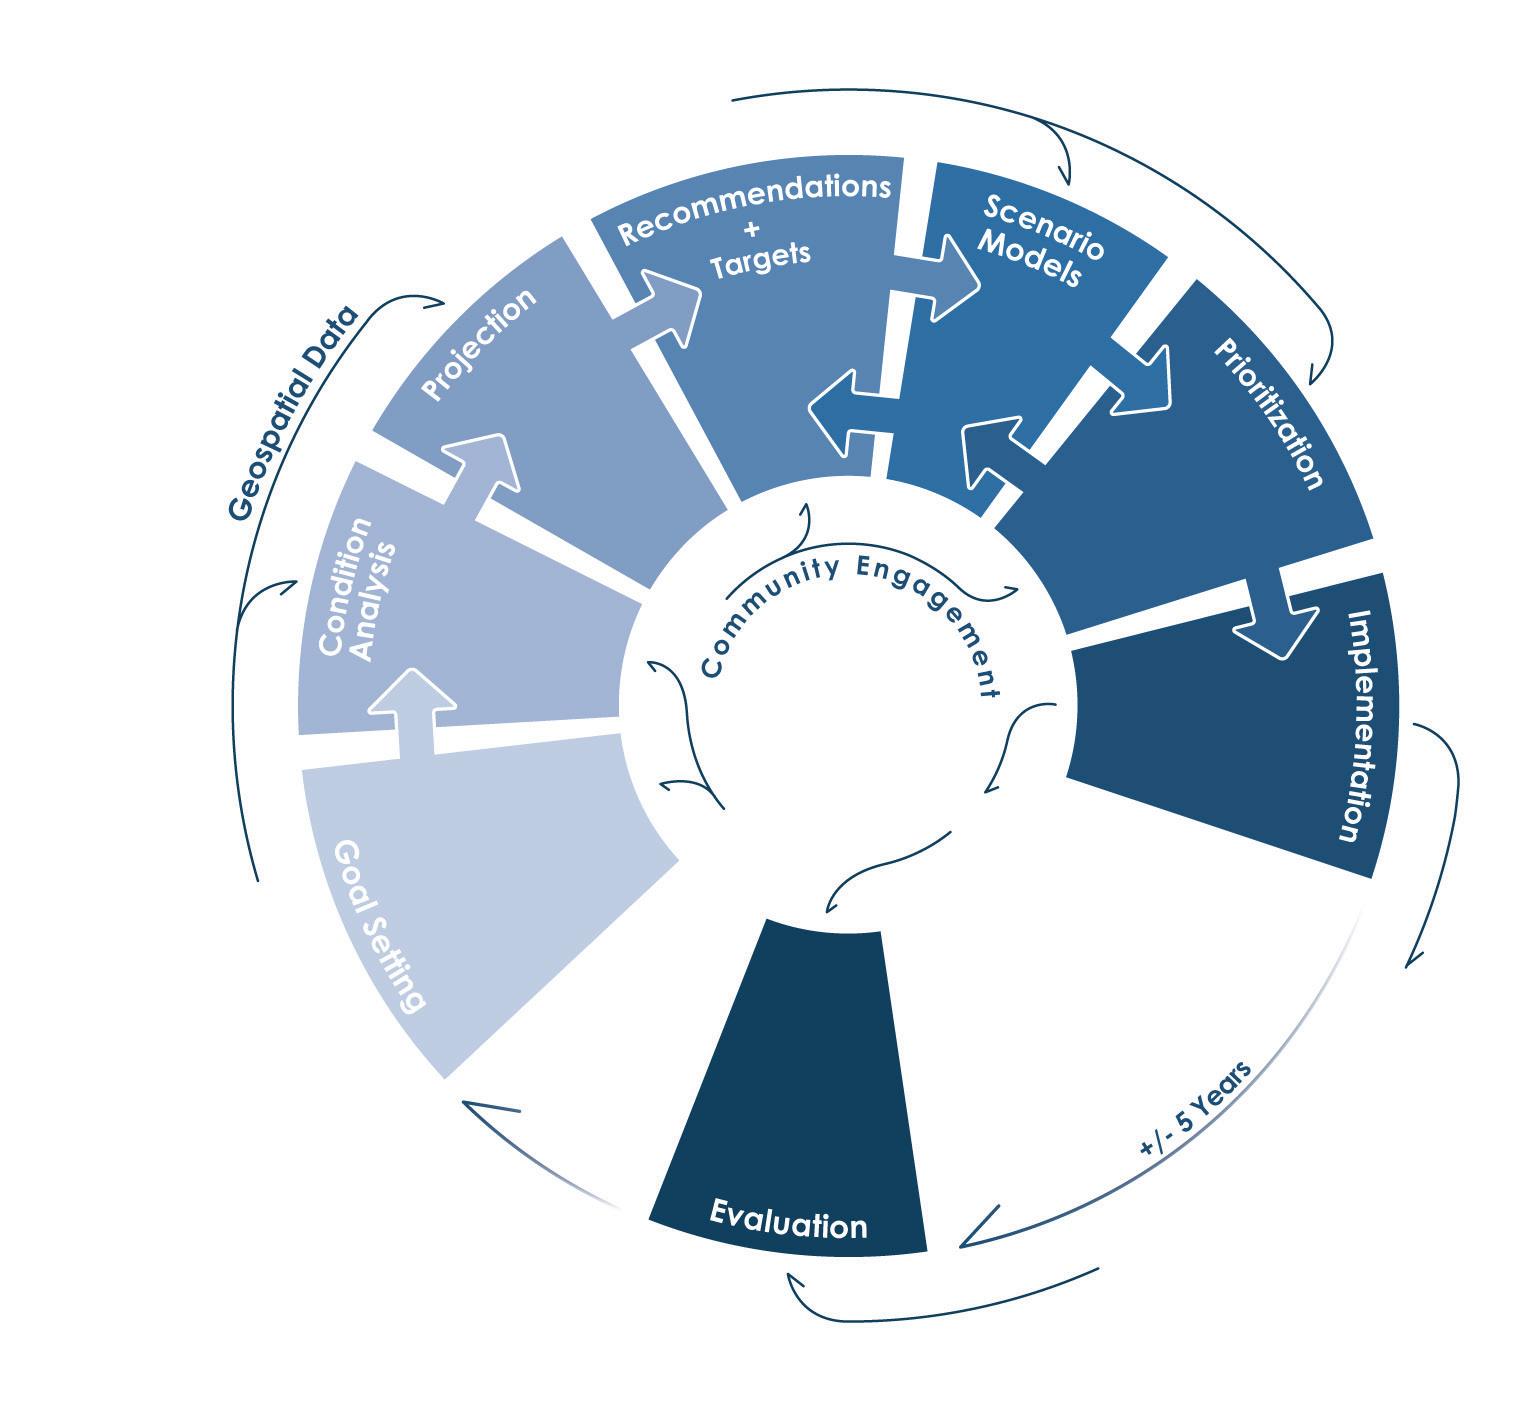
Urban forest planning has matured from a singular defined scope of work to a continuous process guided by robust geospatial data, community engagement, and internal feedback loops of evaluation and refinement.
Our research suggests that there are four key components of planning – moments where data and design overlap — that provide the greatest opportunities for impact.
1. Diagnostics / Analysis
2. Projection / Forecasting
3. Scenarios Modeling
4. Prioritization
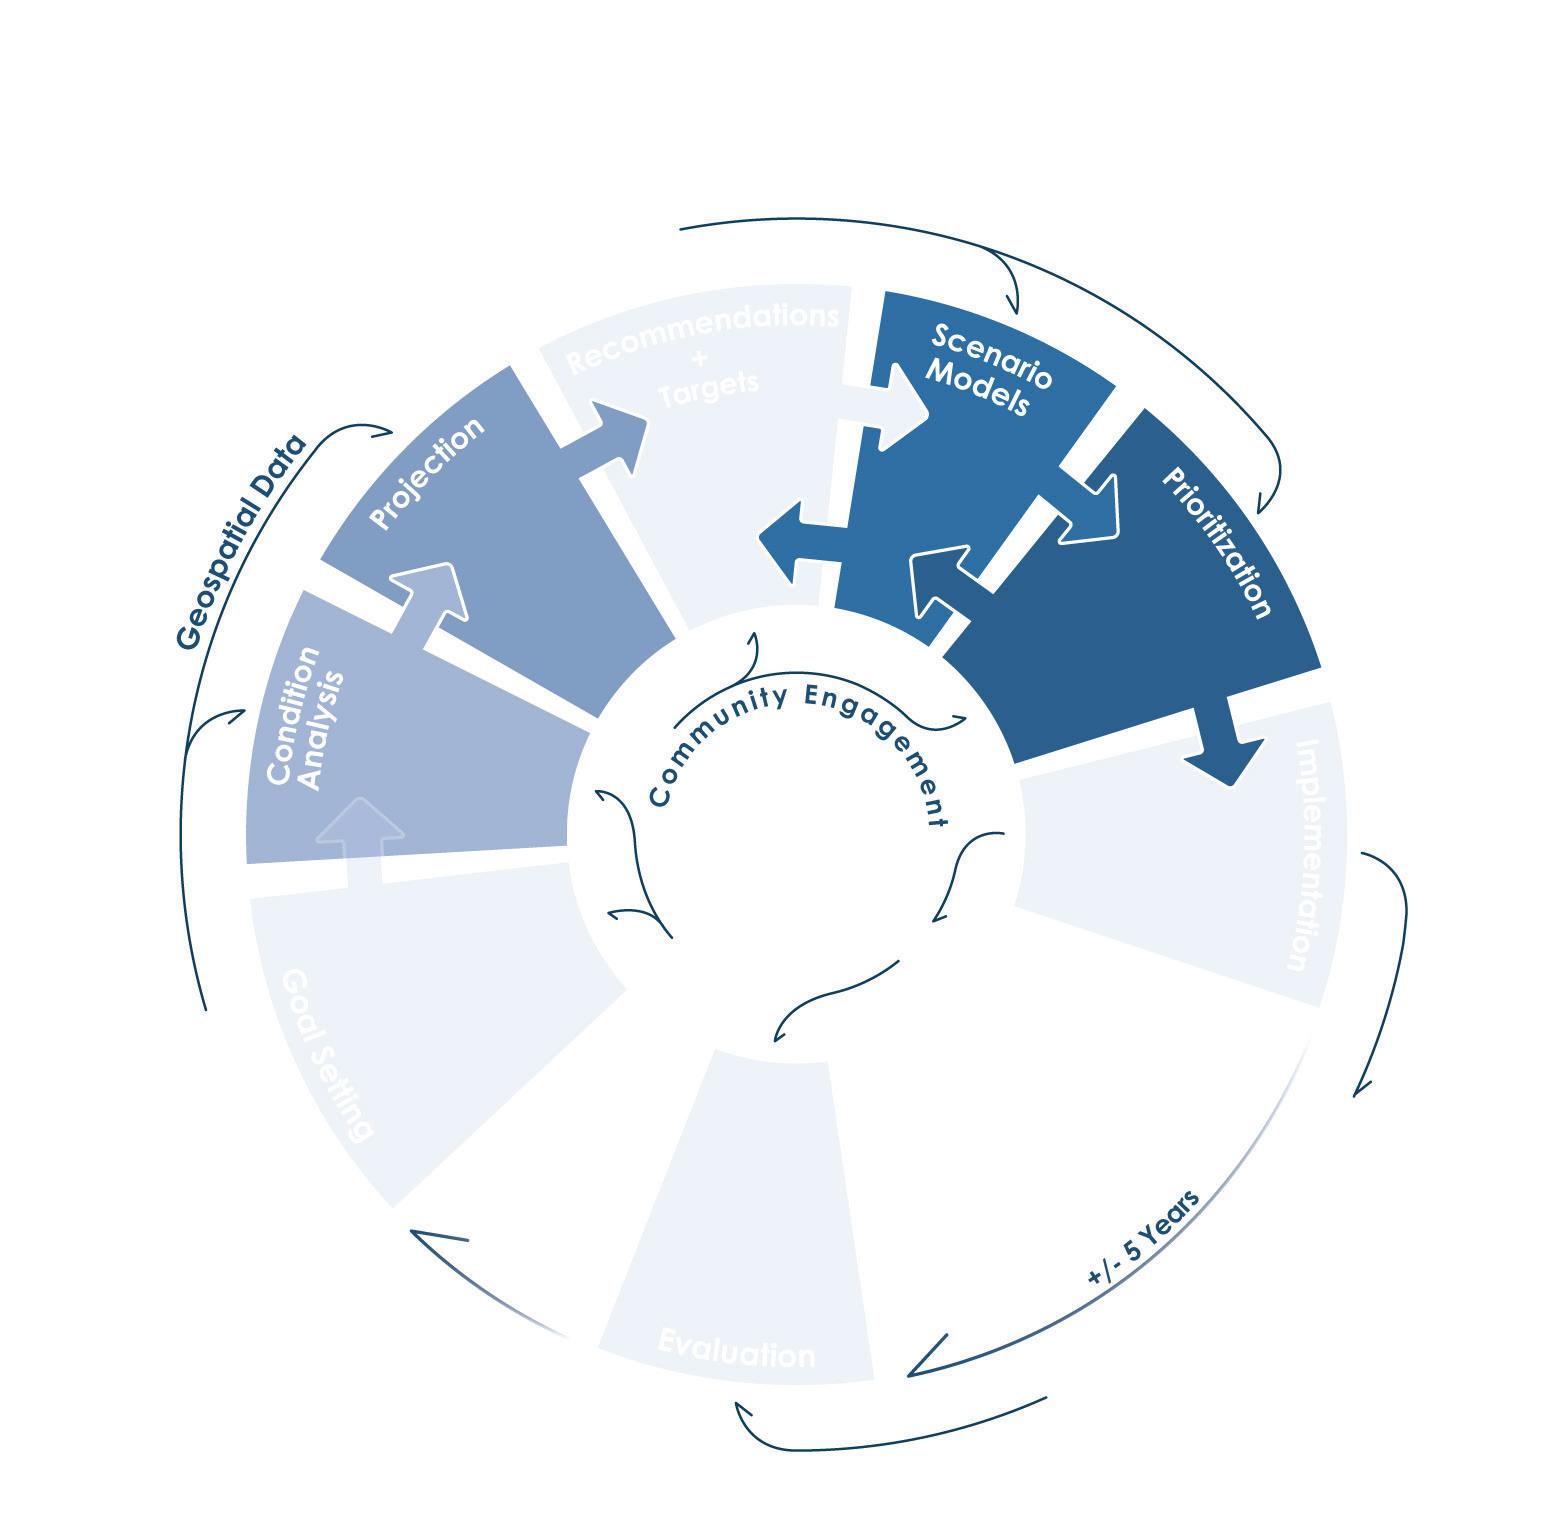
Design is diagnostic. We don’t just ask what’s happening, we want to know why and by whom? We want to get to root causes so we can transform them. We want to identify critical actors so we can engage them directly or give agency to others. Cities using data analysis to locate the root causes of canopy loss can apply limited resources more efficiently, often pointing to tools other than large-scale planting efforts as most impactful.
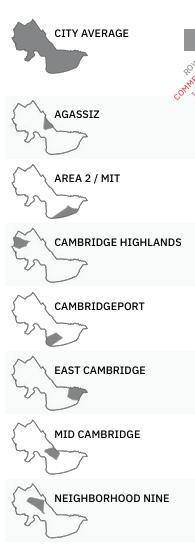
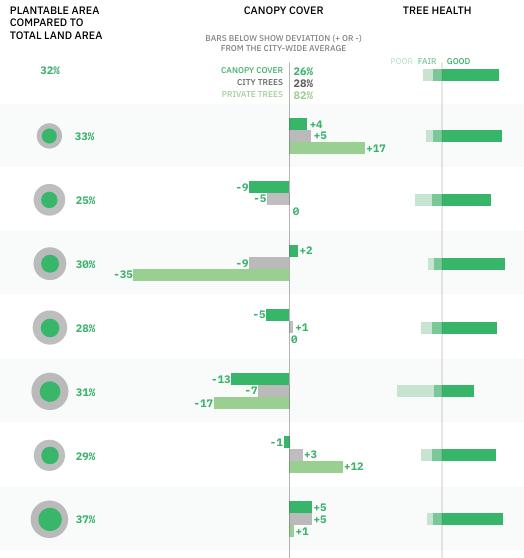
For example, in Cambridge, Massachusetts, spatially explicit data identified that the key locus of canopy loss was private residential properties. This was counter to the prevailing narratives in the city that municipal management practices and large-scale development were the key culprits. This knowledge was a wakeup call to residents about their own role in preserving canopy cover and led the city to fucus efforts on engagement and education as well as policy initiatives, including a revised tree protection ordinance and climate-positive zoning reform.
As designers, we are always looking ahead to the future. So, it’s important to have a baseline expectation of what the future might look like. In urban forest planning we ask, “What if we do nothing?” And we ask, “What is likely to happen to our forests under with increasing climate pressures, pests and diseases?”
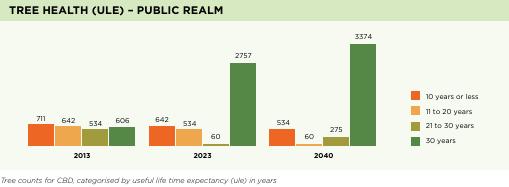
For example, in Melbourne, Australia, the Central City Urban Forest Precinct Plan (2023) calculates what they term a “Useful Life Expectancy” (ULE) to project when trees may be lost or more vulnerable to age, drought, extreme heat and other urban ecosystem or climate related stressors.
In doing so, the city determined that over 20% of the tree population would be lost or declining within 10 years and nearly 40% within 20 years. Furthermore, these projections found that trees nearing their ULE were often located in heritage areas, locations that include many of the city’s largest and oldest trees. By applying a projective model the Melbourne UFMP identified geographical vulnerabilities that will require targeted action, sooner than later.

Design is also a question of impact. We don’t just speculate, we test and evaluate. We often describe this as imagining “what if” scenarios. Creating scenarios and playing them out in spatially explicit ways enables communities to see the potential impact of investment or of changes in practices or policies. It engages people directly and creates motivation for action.
One particularly powerful and critical approach is using geospatial data to identify otherwise underappreciated areas for planting. This “plantable area” analysis, uncovers spaces in our cities which may not traditionally be understood as plantable. These include areas that can be depaved or interstitial spaces of unclear ownership.
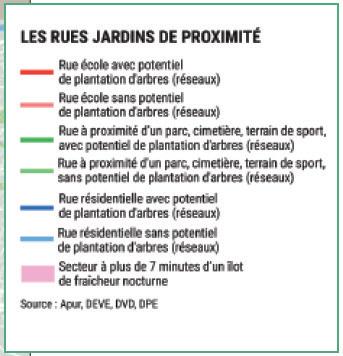
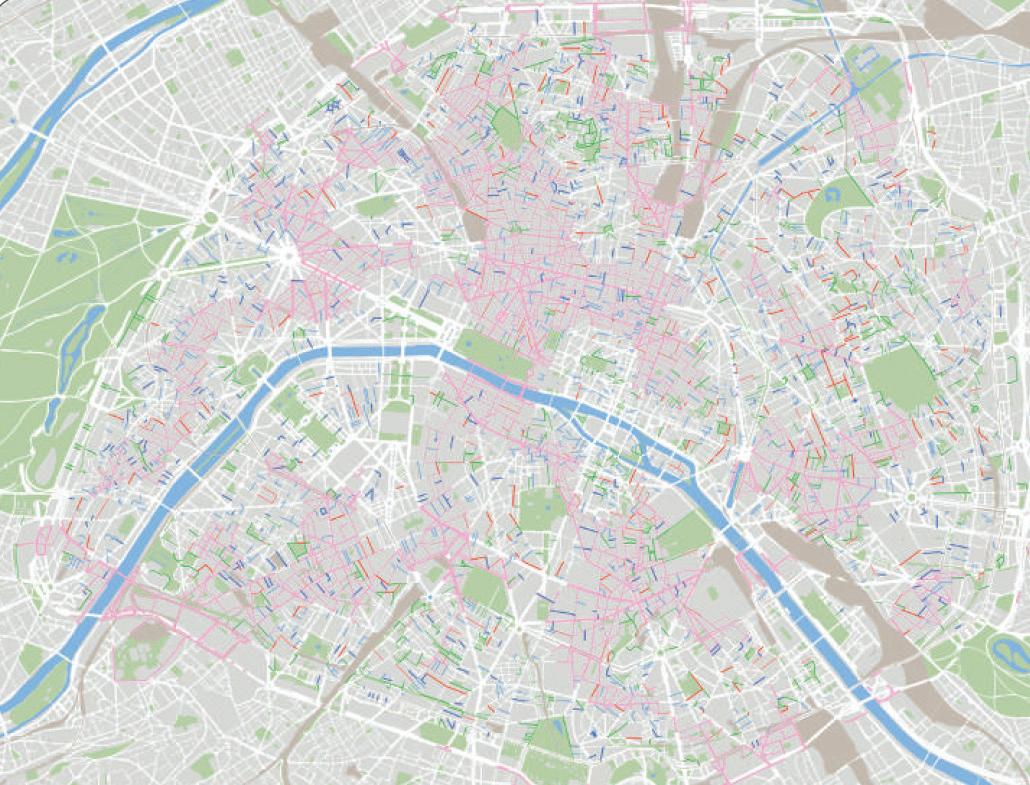
The Paris Tree Plan uses geospatial analysis to identify gaps and inequities in canopy coverage in greater Paris. The study goes on to identify locations within underserved precincts where planting could take place, suggesting significant zones of opportunity along the peripheral highway system. Modeling the capacity these corridors, the plan describes the potential for a circular forest and describes the planting of 70,000 trees. The report also identifies the potential impact of this planting with respect to connectivity, ecosystem services, and carbon sequestration.

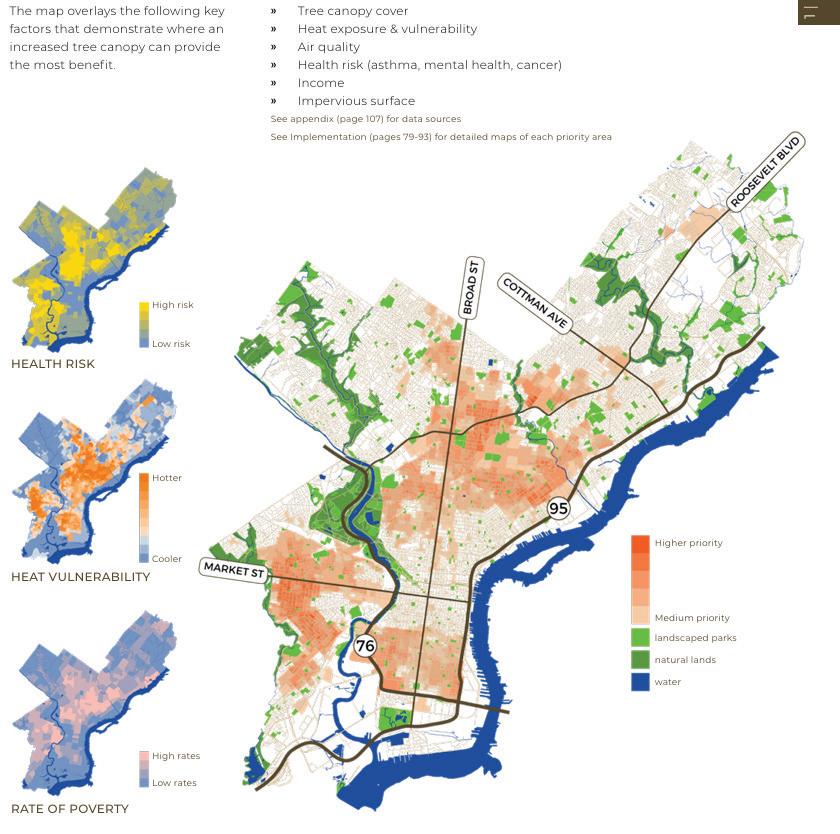
Design is also about making informed decisions and using resources wisely. Each city makes its own choices about where to prioritize investment, but when decisions are aligned with larger community-defined goals — climate adaptation or resiliency needs, urban design and development plans, or environmental justice initiatives — they are more clearly defensible, sustainable, and impactful.
The Philly Tree Plan provides a Priority Analysis map which applies a gradient across the that is the result of clearly defined environmental justice parameters: current tree canopy cover, heat vulnerability, air quality, health risk, poverty, and impermeable area. Working at the city-wide and neighborhood scale, this map directs the city and community organizations toward the most impactful places to invest in combating environmental inequity.
The final distinguishing characteristic of the modern urban forest master plan is the cyclical nature of the process. Instead of being a plan developed at a single moment in time that sets a roadmap for a set duration of time in future, plans are beginning to become frameworks for constant refinement and adjustment. We know that climate science and predictions continue to evolve, economic and social changes are entirely unpredictable, and the impacts of plan recommendations cannot be known in advance.
To respond to the unforeseen, plans are setting up systems for regular evaluation and adjustment. Every 5-years updated data is acquired and reviewed. New technologies are enabling higher resolution analysis. New science is informing knowledge bases and management strategies. And evolving priorities can be integrated into planning goals.
Within this framework, recommended actions from the previous cycle are evaluated against defined goals and the larger municipal goals. Evaluating successes and failures of recommendations guides wise resource allocation and can inform the work of other cities and towns facing similar issues.
The result usually is a revised 5-year action plan that recommends priority projects, partnerships, and policy changes that respond to both shortterm needs and long-term goals.
This process can be the work of consultant teams, or it can be accomplished by municipal staff with the right skill set. With either approach the urban forest master plan stays relevant and becomes increasingly impactful with each subsequent cycle of review.





Caroline Brodeur, Michelle Lee, Kiesza Li, Oliver Oglesby, Andrew Ó Murchú, Emma Tracy, Rose Van Grinsven, Nina Zhao


Across the globe cities are responding to climate crisis, economic inequality, and development pressures by undertaking comprehensive planning efforts, often including planning of their urban forests.
Because there are few standard methodologies, technologies that are continuing to evolve, and each city is responding to differing conditions, there is much innovation in this space, and there is much to learn by looking cross-sectionally at a series of plans through the case-study method.
Before studying Geneva’s urban forest, students in the Cultivating Shade seminar were asked to analyse urban forest masterplans from cities around the world. For each case study, student gathered basic information on city size, population, canopy cover, species distribution, and key issues. In addition, they were asked to describe each plan’s appoach to the following thematic questions:
What does Urban Forest mean in your city?
Impetus
What were the key reasons the report was developed? What has been happening in the city that would have caused them to undertake a forest plan?
Findings
What is the state of the urban forest? Is it growing, shrinking? Is it equitably distributed? Is it at risk and if so, what pressures is it under?
What were the key analytical tools used by the authors to explain what’s happening?
What were the key recommendations of the plan? Who is tasked with following through on the actions?
Reviewing the other case studies, what is one unique contribution to urban forest planning from this study?


Kramer, Max Piana, and Slide Kelly

Ile-de-France, France
Oliver Oglesby
Arbre Plan: Les actions de Paris pour l’arbre et la nature en ville (Fiches-actions 2021 – 2026)
The Paris Tree Plan is notable for conceiving of ecosystem services in an intersectional and interdisciplinary manner, achieved through interagency coordination and agenda alignment. The Plan is a critical element of a broader urban greening strategy focused on ameliorating extreme heat, enhancing flood resilience, and reducing carbon emissions, aiming to position Paris as a global leader in urban forestry. The unique actionable strategy is supported by a deep foundation of data-driven analysis, which enables ambitious target-setting, such as adding 170,000 more trees by 2026 (within five years). Within a survey of urban forest plans globally, Paris stands out for its ambitious data-driven targets coordinated as part of a broader climate resilience mission.

Scale Comparison:
Canopy Cover:

Key Issues:
Connectivity
Public Health & Wellbeing
Aesthetics &
Paris does not use the term “forêt urbaine,” but rather considers the document a “tree plan,” accompanied by a “tree charter.” The subtitle of the tree plan translates to “actions for trees and nature in the city.” The scope includes street trees, parks, gardens, wooded areas like the Bois de Boulogne and Bois de Vincennes, and newly planted micro-forests designed for climate adaptation. At a more granular level than discussing the urban forest, trees themselves are considered primary allies in enhancing climate resilience, biodiversity, and quality of life.
1. Climate Change Adaptation and Mitigation: Paris is experiencing increasingly frequent heatwaves, leaving certain areas dangerously hot in the summer. Furthermore, the Paris Climate Action Plan set a goal to reduce carbon emissions and adapt the city’s infrastructure to extreme weather events.
2. Biodiversity and Ecological Connectivity: Paris has seen a decline in biodiversity, and the Paris Biodiversity Plan (2018-2024) emphasized the need for expanding tree cover and ecological corridors to support urban wildlife.
3. Public Health and Wellbeing: Paris has struggled with high levels of air pollution, which negatively impacts respiratory health, particularly for children and the elderly; however, trees filter harmful pollutants.
4. Urban Aesthetics and Heritage Preservation: Parisians have become increasingly vocal about the need to protect existing trees and increase greenery in the city, including protests to tree removals during major construction projects.
5. Greening Infrastructure and Public Spaces. Some neighborhoods have been identified as “green deserts” with little tree cover, contributing to social inequalities in access to shade, cooling, and recreational spaces.
1. Severe urban heat island effects: Some districts of Paris are up to 10°C hotter than surrounding rural areas in summer.
2. Canopy cover significantly reduces temperatures: Shaded areas are up to 5°C cooler than non-vegetated surfaces.
3. Extreme heat is unequal: Dense urban areas with little tree cover (central and eastern Paris) suffer the most.
4. Canopy cover is unequal: The outer arrondissements (Bois de Boulogne & Bois de Vincennes) contain 60% of Paris’ trees, while the urban core has much less coverage.
5. Mature trees are irreplaceable: A mature tree provides up to 50x more benefits (shade, CO₂ absorption, biodiversity support) than a young tree.
6. Tree removal due to construction is a significant loss: Removing a large, healthy tree is a major environmental loss that takes 30-50 years to recover.
7. The ring road could become a major green corridor: The Boulevard Périphérique has 6,500 trees but significant potential for expansion with 39 hectares of embankments (reducing pollution, noise, and heat).
8. Green spaces improve mental and physical health: Studies showed that access to trees and greenery reduces stress, improves mental health, and increases physical activity (more trees means lower air pollution and treecovered schoolyards translates to better learning conditions).
9. Tree species must be adapted for climate resilience: Traditional Parisian tree species are vulnerable to pests, disease, and extreme heat, such as plane trees (which account for 40% of street trees and 20% of trees overall), linden trees (which account for 12% of trees overall), along with horse chestnut, ash, birch, oak, poplar, and maples (which account for 9% of trees overall).
10. Air pollution kills, but trees can help: Air pollution is responsible for over 2,500 premature deaths per year in Paris. Yet tree-lined streets have up to 60% less air pollution compared to areas without trees.
The Paris Tree Plan employed the following analytical tools:
1. GIS mapping & remote sensing (tree location, canopy size)
2. Tree health diagnostics (disease tracking, stress assessment)
3. Ecosystem modeling (carbon capture, air purification)
4. Urban heat analysis (cooling impact, climate adaptation)
5. Biodiversity tracking (wildlife corridors, native species support)
6. Regulatory tools (tree protection policies, development impact)
The primary recipients are current and future Parisian residents (with a focus on social housing residents), and secondarily residents of Greater Paris, visitors to Paris, and Parisian landowners who are encouraged to participate in tree planting efforts. The urban ecosystem as a whole will also benefit, prioritizing wildlife and biodiversity.
The actors are leveraging numerous tools, spanning urban planning, legal and financial, monitoring and scientific, and engagement and educational instruments. Urban planning tools include the Tree Charter, which is focused on best practices for planting and preservation, along with the Plan Local d’Urbanisme (PLU) bioclimatique, which integrates tree protection measures. Legal and financial tools include promoting public-private partnerships that encourage private actors to fund urban greening, and compensatory reforestation fund stipulating that developers must offset tree removals through planting. Monitoring and scientific tools include tree inventory databases (maintained by City agencies to check species and locations), aerial imagery (to identify canopy cover changes and planting opportunities), and tree health evaluations (using soil sensors, remote sensing, and ground surveys). Engagement and educational tools include workshops and awareness campaigns (encouraging stewardship and knowledge-sharing on tree benefits), the Beautify Your Neighborhood program (encouraging resident participation), volunteer and co-management initiatives (involving local community groups, schools, and businesses), and citizen science platforms (allowing Parisians to report tree conditions and suggest planting sites).
Ontario, Canada
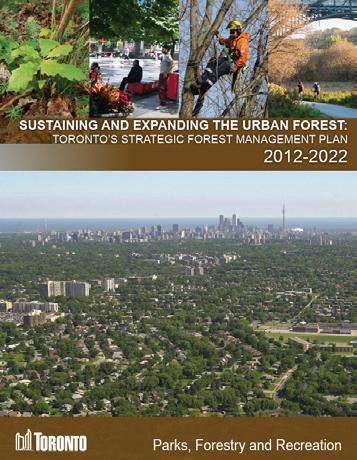
Sustaining and Expanding the Urban Forest: Toronto’s Strategic Forest Management Plan 2012-2022 (Published 2013)
Toronto’s urban forest is a testament to its ravines and the importance of concentrated natural spaces in cities for individual tree health, ecosystem function, and the provision of ecosystem services. Just 6% of the city’s 10.2M+ trees are street trees. The ability to expand the urban forest by focusing solely on street trees is limited. Preserving and enhancing large, connected natural corridors is critical to ecological health. On private land, which encompasses 60% of coverage, the urban forest is largely limited to the canopy layer. Many newer subdivision developments, constructed with complete land clearance or over former industrial land, include some of the lowest canopy coverage in the city, despite their low-density and promises of greater connection to nature.
Scale Comparison:
(City) Population:
million
million

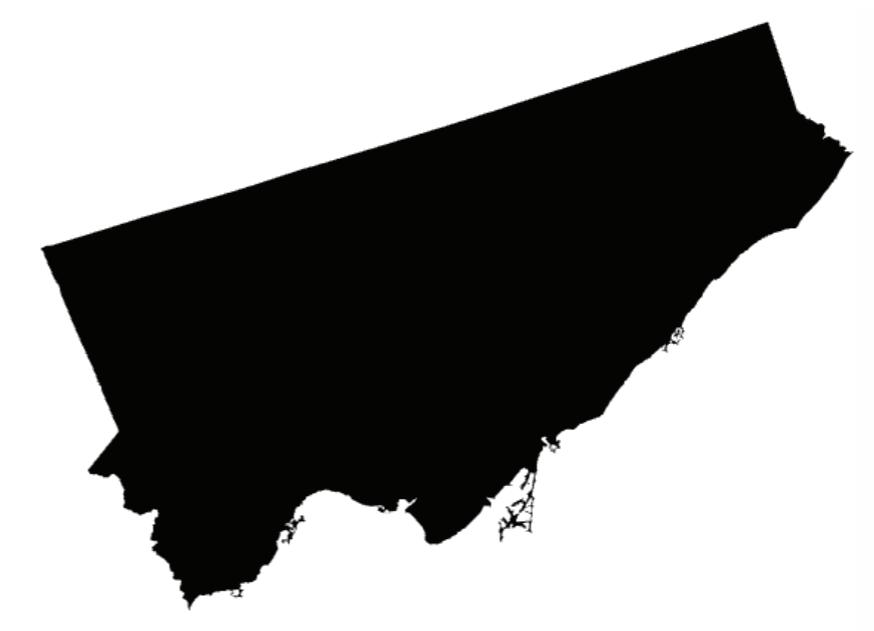
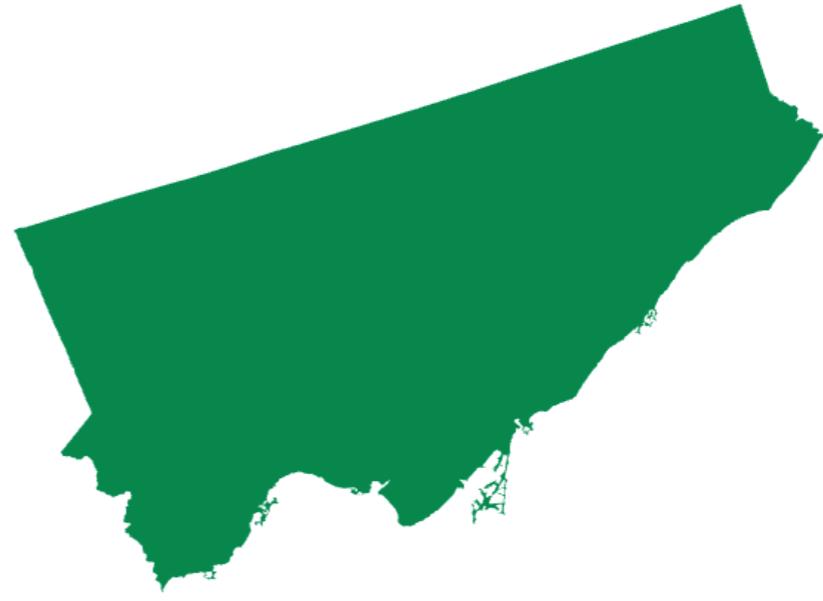
Canopy Cover:
Key Issues:
Toronto defines its urban forest as all the trees within the city’s boundaries.
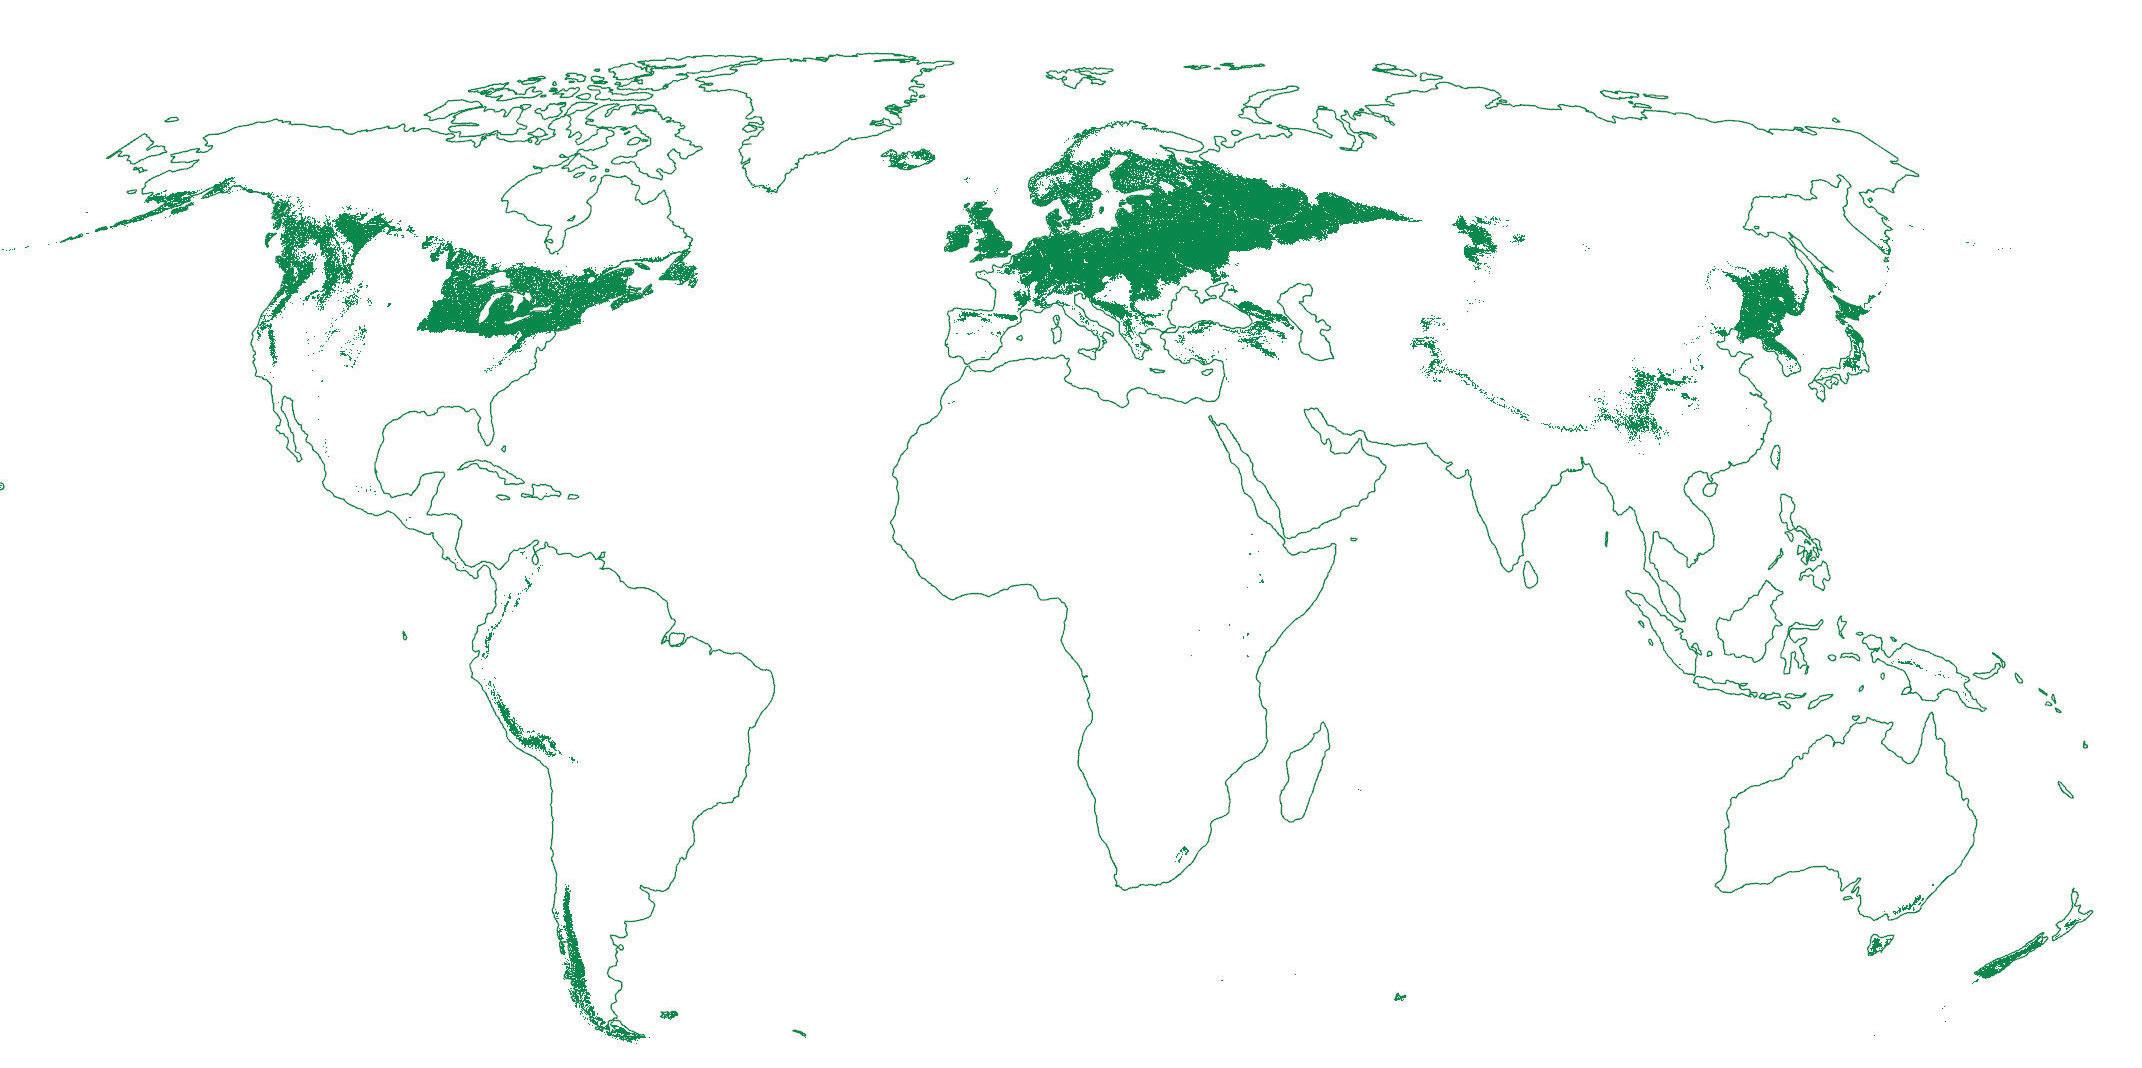
Forests figure heavily in Toronto’s urban imagination. The settler city occupies the northern edge of the Carolinian forest where it transitions to the St-Lawrence Forest region, defined by a greater representation of coniferous species. Its name is derived from the Mohawk word tkaronto, meaning “where there are trees in the water.” Its forests follow the geological forces that continue to shape the city. Glacial retreat left rivers that carved deep valleys through the soft glacial soils. This formed the ravine system that is home to roughly a third of Toronto’s urban forest and have defined the city’s image of itself as a “city within a park.”
Following a 1998 amalgamation of 6 municipalities, Toronto’s land area quadrupled, and the city re-examined itself with a new understanding of its regional systems, increasing global economic power, and high degrees of socioeconomic diversity, with half of its population born outside of Canada and 57% identifying as minorities. In 2004, in recognition of these changes, Toronto City Council under Mayor David Miller, called for the urban forests to serve as a driver of social cohesion, as a ’common ground,’ and as a central tool to improving quality of life and public health. It set the goal of increasing coverage to between 30-40% by 2050. The 2013 10-yr strategic management plan is the most concrete set of actions towards that goal.
Toronto’s urban forest is growing, with canopy increasing from 26.6% coverage in 2012 to 28.4% in 2022. The report emphasizes the economic value of the urban forest, citing its ecosystem services and carbon storage, rather than through lenses of public health or climate resilience. This is possibly due to its release at a political moment under Conservative Mayor Rob Ford that saw increased development pressures on Toronto green spaces.
Despite its expansion, the forest is not evenly distributed. 60% of the forest is on privatelyowned land with vast discrepancies related to different development patterns and eras. Neighbourhood tracts that include ravines or large natural areas such as High Park benefit from up to 62% canopy coverage, whereas others, notably the downtown core, and new suburban development are defined by coverage as low as 7%. The plan included no analysis of the socioeconomic distribution of the urban forest.
Structurally, the forest’s 10.2M+ trees are relatively diverse, with its three dominant species Eastern white cedar (Thuja occidentalis) (15.6%), Sugar maple (Acer saccharum) (10.2%), and Norway maple (Acer platanoides) (6.5%) making up roughly a third of its composition. Roughly 35% of the forest is composed of nonnative species, including Norway maple, of which the city has made concerted efforts to limit new planting. Despite its diversity and the long-term habitat of the ravines, the forest is relatively young. Approximately 45% of trees are less than 7.6cm DBH, or roughly the diameter of a standard baseball. Only a third of the forest is greater than 15.2cm DBH. This imbalance in tree age limits the habitat value and ecosystem services provided by the forest and makes it more susceptible to pests, pathogens, and climate stressors.
The report combined desktop research utilizing LiDAR analysis with standardized field data from 407 0.4ha randomly located test plots, and ecosystem service valuation. Landcover analysis included studying landcover percentages, including distribution by neighbourhood; distribution on private or public land, with further analysis on urban forest in public parks; canopy coverage changes over time. Further LiDAR-derived analysis included a study of plantable area that was determined based on existing open space not covered by paving or a building. This narrow approach to potential planting sites greatly limited the impact of this study as it excluded significant opportunity sites such as large parking lots and industrial areas. Test plots allowed analysis of species composition, representation of native vs nonnative species, DBH measurements, density and biomass estimates, and presence of pests and pathogens. Further analysis included valuation of ecosystem services, including carbon storage, air pollution removal, energy savings, and avoided carbon related to energy conservation.
The future success of Toronto’s urban forest is largely predicated on protecting existing trees. This is due to the forest’s significant existing coverage and relatively young composition. Because of this, the Plan mostly focuses on protection and maintenance with pests and pathogens, climate change, and balancing recreational and development pressure being primary concerns.
Toronto City Council is largely responsible for the protection of the forest with four primary tree protection by-laws—Street Tree, Private Tree, Ravine & Natural Feature Protection, and Parks By-laws—variably limiting impacts across the city. The Urban Forestry division of the Department of Parks, Forestry and Recreation is responsible for maintenance and management, including new planting, on city-owned land, street trees, and over 600,000 street trees located on the portion of land between the roadway and private property, known as the public road allowance. The Urban Forestry division also issues grants and funds programs to support tree planting on private property, administered through 3 partner non-profits: the Toronto Region Conservation Authority (TRCA), Local Enhancement and Appreciation of Forests (LEAF), and the Arbor Day Foundation.
Despite the Plan’s robust maintenance and management recommendations, there is limited spatial vision for how the urban forest can be strategically enhanced in target areas, by land use type, or along key corridors.
Kanto, Japan
Tokyo’s Metropolitan Government Greenery Initiatives integrates is unique in integrating urban forestry with agriculture and sustainable forestry cycles. Productive green land is preserved for food production and disaster resilience. It promotes Tama timber forestry cycles, encouraging reforestation and controlled logging for construction materials. This strategy supports carbon sequestration, economic sustainability, and biodiversity conservation.
Tokyo has also developed forested marine parks on reclaimed land, an approach rarely seen in other global urban forest initiatives. These parks provide biodiversity habitats, recreational spaces, and climate adaptation benefits.
Climate Zone: Warm Temperate Moist Climate
Reference Ecotype: Temperate Broadleaf Mixed Forest

Tokyo Population: 14.3 million Area: 2,194 km2

(City) Population: 0.2 million
(Canton) Population: 0.5 million Area: 16 km2 Area: 282 km2
In Tokyo Green Biz, the term “greenery” is used instead of “urban forest.” This broader term includes a variety of green spaces such as urban parks, street trees, green roofs, waterfronts, and agricultural land. The term reflects a holistic approach to integrating nature within Tokyo’s urban fabric, balancing development with ecological preservation.
1. Increased Awareness of Environmental and Urban Functions: The recognition of greenery is essential for climate adaptation, biodiversity conservation, and human well-being. COVID-19 reinforced the need for accessible green spaces for mental and physical health.
2. Rising Global Demand for Food and Efficient Resource Utilization: Urban agriculture is integrated into the plan to support local food security. Preservation of urban farmland ensures ecological services such as flood mitigation and biodiversity enhancement.
3. Commitment to Global Biodiversity and Climate Goals: Tokyo Green Biz aligns with the “Nature Positive” goal to reverse biodiversity loss and promote ecological restoration. Expanding conservation areas and urban ecological networks strengthens biodiversity corridors.
4. Growing Demand for Sustainable Wood Resources: The promotion of Tama timber forestry cycles supports sustainable wood production. Encourages the use of renewable materials in urban construction while managing forest regeneration.
Tokyo’s urban greenery is a critical component of the city’s sustainability strategy, with a focus on expanding, protecting, and connecting green spaces. The city’s green infrastructure includes 2,063 hectares of metropolitan parks, 878 hectares of marine parks, and 53 designated green conservation areas covering 321 hectares. Additionally, 1 million roadside trees, of which 650,000 are managed by the Tokyo Metropolitan Government (TMG), contribute to air purification, urban cooling, and improved aesthetic quality. However, despite these efforts, the distribution of green spaces remains uneven, with suburban areas like Tama benefiting from extensive natural reserves, while high-density urban districts struggle with limited greenery.
Tokyo is expanding green spaces through conservation projects, urban planning requirements, and private-sector incentives. Over 60,000 square meters of new greenery have been created through private-sector development in Takeshiba, Azabudai, and Otemachi. However, agricultural land has declined by 15.6% over ten years (2011–2021) due to urban expansion, prompting stronger conservation efforts.
Greenery is not equitably distributed. While suburban districts, particularly in western Tokyo, are rich in forested and agricultural lands, central Tokyo faces challenges in providing equitable green access. The 23 special wards have a lower percentage of parkland per capita compared to suburban municipalities. Tokyo Green Biz addresses these disparities through initiatives like rooftop gardens, vertical greening, and public-private partnerships to integrate greenery into urban development projects. Furthermore, increasing tree-lined streets in high-density districts is a priority, contributing to better shade coverage and climate adaptation.
Urban greenery in Tokyo faces several pressures:
1. Urban Development Pressure: High land values and infrastructure expansion pose ongoing threats to existing green spaces. Without strong policy enforcement, privately owned and agricultural land risk being converted for commercial use.
2. Climate Change Impacts: Rising temperatures and extreme weather events, including typhoons and heatwaves, threaten tree health and biodiversity. The aging Tama forests, which provide critical carbon sequestration and water regulation, require sustainable management strategies to prevent degradation.
3. Declining Farmland and Food Security: With a projected 1.7-fold increase in global food demand by 2050, the loss of urban farmland could exacerbate food supply challenges. Strengthening farmland preservation policies is crucial to maintaining local food production and ecological resilience.
Tokyo Green Biz employs advanced tools for planning, monitoring, and managing urban greenery:
1. Data Collection & GIS Analysis: Mapping land use, topography, hydrology, and biodiversity.
2. Digital Twin Technology: 3D urban modeling visualizes tree coverage, park distribution, and microclimate impacts. This technology has already been applied in three central wards, helping optimize tree placement for maximum cooling benefits.
3. Predictive climate models assess how increased temperatures and rainfall variability will impact Tokyo’s green spaces, leading to tree species selection adjustments to improve resilience.
1. Enhancing Legal Protections: Strengthening zoning laws and conservation policies to safeguard urban forests. Introducing stricter regulations for green space inclusion in private developments.
2. Expanding Green Networks: Creating ecological corridors connecting parks, forests, and waterfronts. Promoting vertical and rooftop greenery in high-density urban districts.
3. Supporting Sustainable Forestry and Agriculture: Encouraging the use of Tama timber in urban construction to promote sustainable forestry. Incentivizing urban farming to maintain productive green lands.
4. Public Engagement and Funding Initiatives: Strengthening resident participation through urban gardening, tree-planting programs, and educational events. Leveraging private-sector investment and fundraising campaigns for greenery projects.
Spain
Trees for Life: Master Plan for Barcelona’s Trees 2017 - 2037
Barcelona’s Master Plan for Trees 2017–2037 recognizes trees not merely as passive elements of urban infrastructure but as active agents in shaping the city. The plan aims to create an urban environment where trees thrive, not just survive, emphasizing that a healthier urban forest benefits not only residents but also the trees themselves. This is evident in efforts to improve soil quality, reduce unnecessary pruning, ensure species diversity, and create optimal growing conditions. By framing trees as active participants in the urban ecosystem, Barcelona sets a precedent for urban forest planning that goes beyond human-centered sustainability to include the well-being of the trees as living organisms.
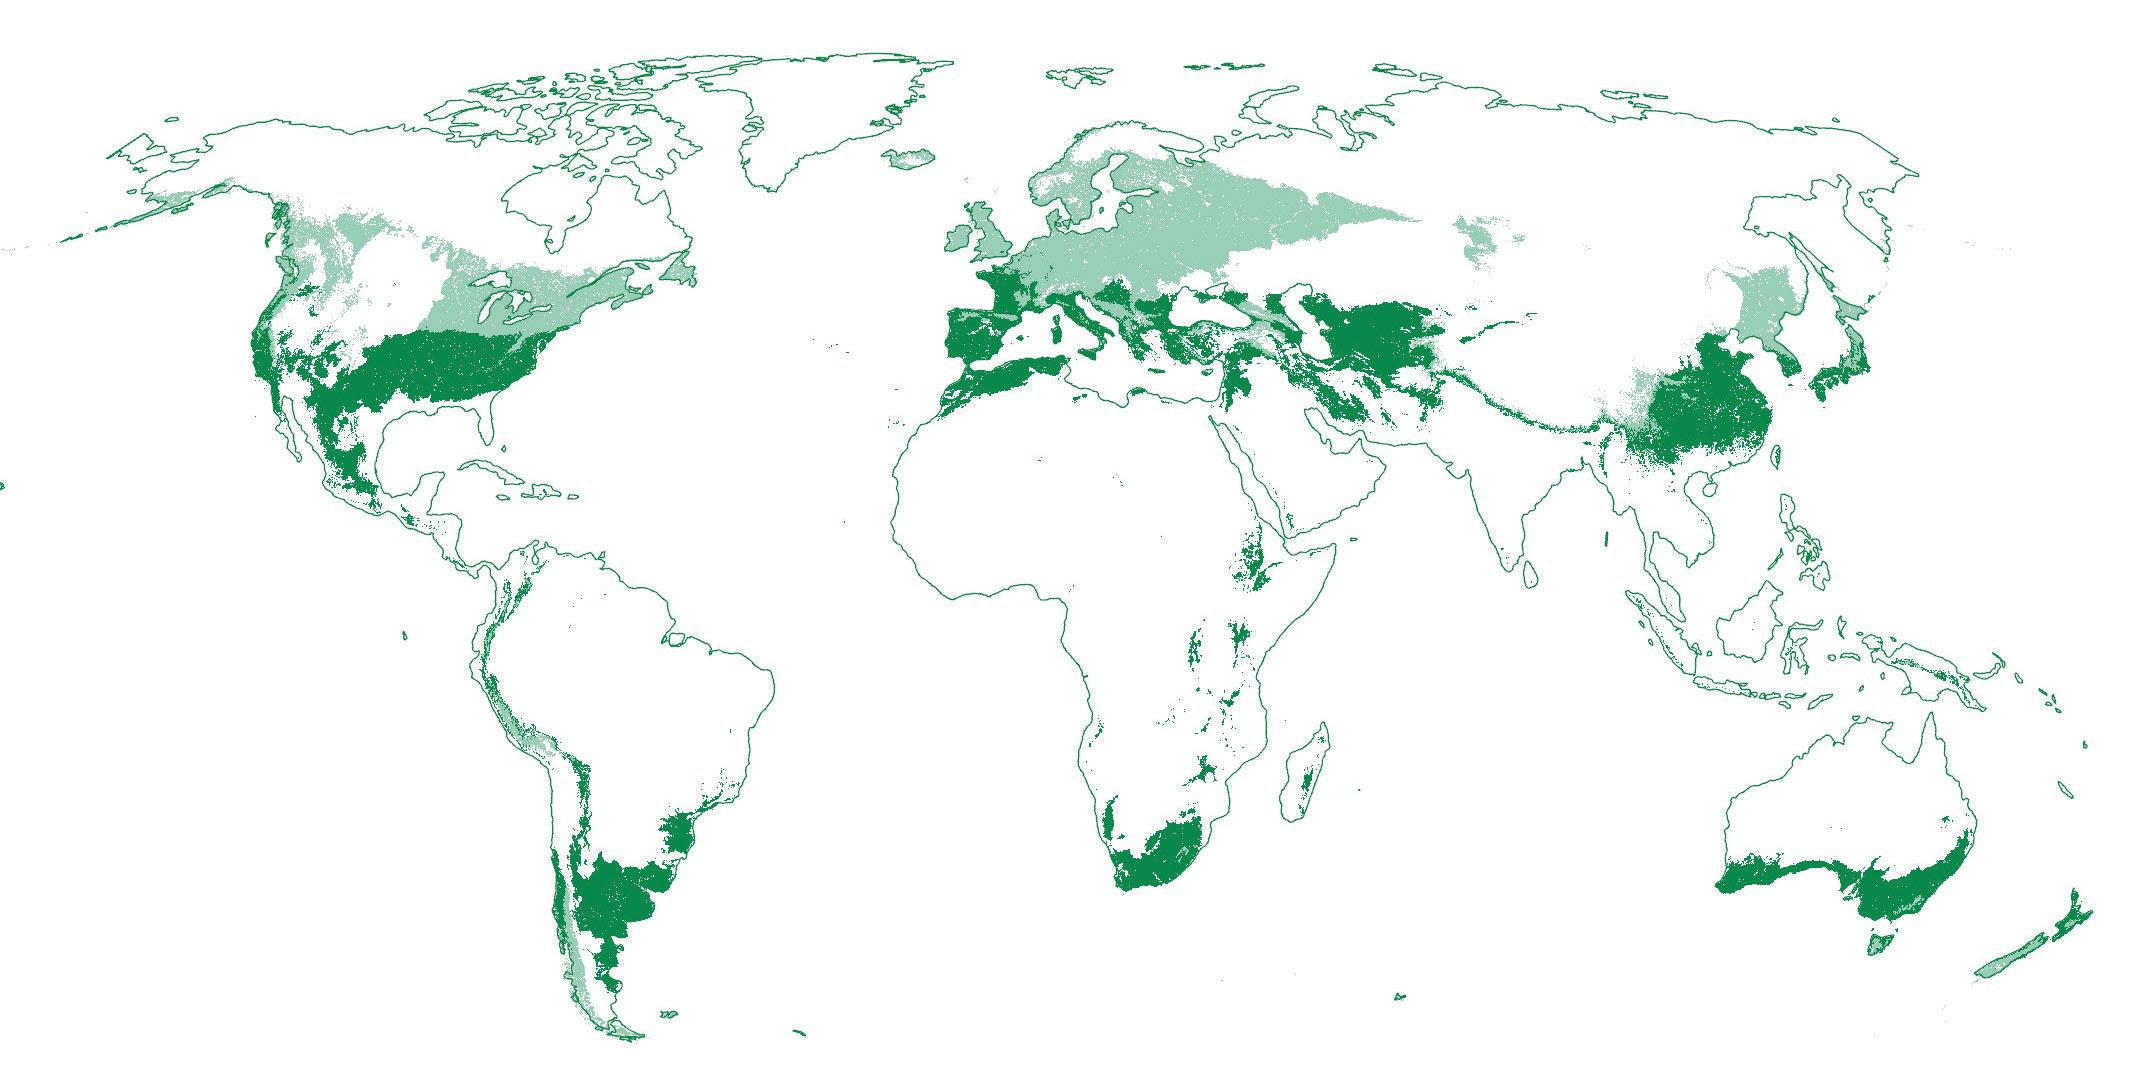
Climate Zone: Warm Temperate Dry Warm Temperate Moist
Reference Ecotype: Mediterranean pine forests, holm oak groves, and dry meadows
Scale Comparison:
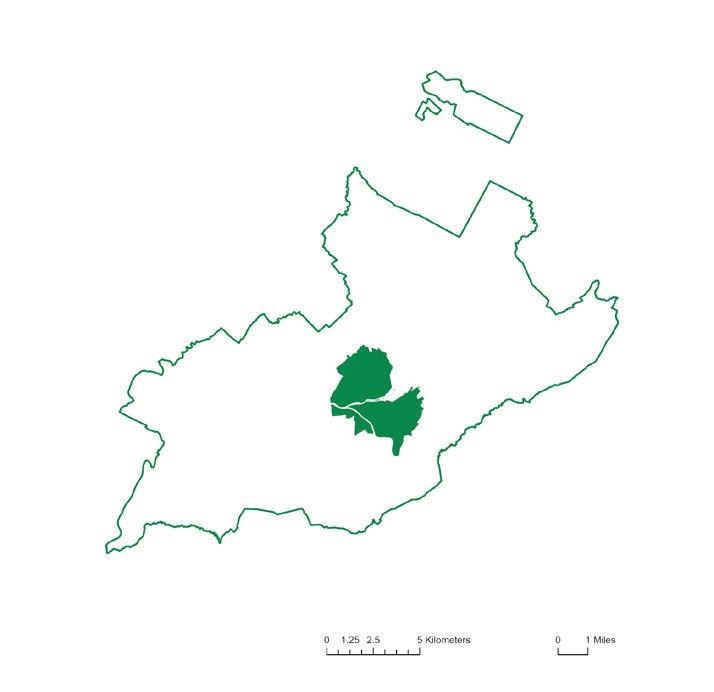
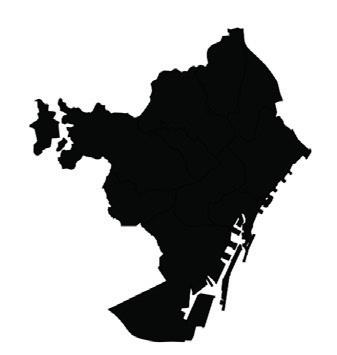
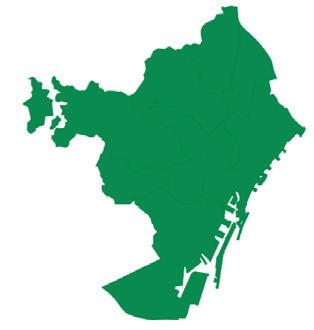
Geneva (City) Population: 0.2 million Geneva (Canton) Population: 0.5 million Area: 16 km2

Canopy Cover:
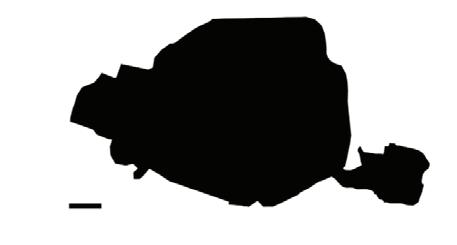
Barcelona Population: 1.6 million Area: 101 km2
Key Issues: Urban Development
How does Barcelona define Urban Forest?
In Barcelona, the term “Urban Forest” is not commonly used in everyday planning discourse. Instead, the city and the broader Barcelona Metropolitan Area (AMB) adopt the concept of “Ecosystemic Urbanism” as the key framework guiding sustainable, integrated urban development. This approach expands the understanding of urban green spaces—trees included—as essential components of a city’s ecological and social systems, rather than isolated elements of infrastructure.
Ecosystemic Urbanism is built around 15 guiding principles, several of which directly relate to urban forest planning. These include:
• Liveability in the Public Space –emphasizing comfort, accessibility, and environmental quality in urban areas;
• Greenery vs. Concrete – advocating for the prioritization of vegetation over impermeable surfaces;
• Climate Change Adaptation and Mitigation – highlighting the role of trees and green infrastructure in cooling, carbon capture, and resilience;
• Social Cohesion vs. Social Exclusion –promoting equitable distribution of green spaces and inclusive access across all communities.
The “Trees for Life: Master Plan for Barcelona’s Trees (2017–2037)” was developed as a continuation of earlier efforts, such as the Green Infrastructure and Biodiversity Plan (2013–2020), which conducted a citywide survey of green spaces and trees. This foundational work revealed the need for a more strategic, long-term approach to urban forestry. The rising urgency of climate change, with projections of 50 to 80 days over 30°C by the end of the century, highlighted the importance of trees in mitigating and adapting to extreme heat, especially in a densely built environment like Barcelona.
The Master Plan was also driven by a desire to improve public health and comfort, promote equity and inclusion, and balance the built-up areas with accessible green spaces. Trees were recognized not just as environmental assets, but as essential infrastructure for climate resilience and social well-being, forming a key part of a broader strategy that culminated in the Barcelona Nature Plan (2021–2030). Together, these plans aim to increase urban greenery, support biodiversity, and ensure that all residents benefit from a healthier, more livable urban environment.
Barcelona’s urban forest is extensive, yet under pressure. The city hosts approximately 1.4 million trees, covering 25.2% of the municipal land, including public and private areas, and natural zones like Collserola Park. However, only 310,800 trees are directly managed by the City Council, and not all neighborhoods enjoy equal tree coverage—highlighting an issue of spatial equity.
Barcelona’s urban forest faces multiple pressures:
• Urban density and lack of space make planting and maintaining trees difficult, especially in central areas.
• Climate change is a major concern, with projections of 50–80 days over 30°C annually by century’s end, stressing trees’ ability to survive.
• Pests, diseases, soil compaction, and pollution further threaten tree health.
• Species dominance poses risk: efforts are ongoing to reduce over-reliance on species like the London plane, aiming for no species to exceed 15% of the urban population for resilience.
The “Trees for Life: Master Plan for Barcelona’s Trees (2017–2037)” relied on several analytical and technical tools:
• UFORE model (Urban Forest Effects Model), developed by the U.S. Forest Service, used for a statistical inventory to estimate tree population and benefits.
• A detailed municipal tree inventory, managed by the Municipal Institute of Parks and Gardens, to assess public tree numbers and conditions.
• Ecological Services Studies (e.g., by CREAF, 2009), quantifying environmental services like pollutant absorption and temperature regulation.
• Mapping and assessment of urban canopy coverage, species diversity, and spatial distribution.
• Climate vulnerability studies to understand how species and areas are affected by rising temperatures and drought.
The “Trees for Life: Master Plan for Barcelona’s Trees (2017–2037)” lays out a vision for a healthier, more resilient, and more inclusive urban forest. Its recommendations are structured around ten strategic lines and over forty specific actions. A primary objective is to expand the city’s urban tree cover from 25% to 30% by 2037, enhancing the overall presence and connectivity of green infrastructure. Another major goal is to improve the resilience of the urban forest in the face of climate change—by 2037, at least 40% of tree species in the city should be well adapted to future climatic conditions. Additionally, the plan promotes biodiversity by ensuring that no single tree species accounts for more than 15% of the total population.
The plan emphasizes the importance of improving the soil quality available to trees, optimizing water use through smart irrigation technologies, and reducing pruning to essential interventions only, allowing trees to grow more naturally.
The plan also highlights the social value of trees and calls for greater community involvement and education, ensuring that residents— particularly schoolchildren—learn to recognize and appreciate the trees in their surroundings. Finally, trees are to be more deeply integrated into urban planning, ensuring that future city design fully accounts for the essential ecological, social, and health benefits that trees provide.
The Barcelona City Council plays a central role, primarily through its Department of Green Areas and Biodiversity (DEVB). It is responsible for managing all trees that are municipal property and for conserving the city’s broader tree heritage. The Municipal Institute of Parks and Gardens, operating under the Council, oversees the daily care and maintenance of these public trees.
Supporting the Council is the Urban Ecology Agency of Barcelona (BCNecologia), which contributes technical expertise and strategic input, especially around goals tied to sustainable urban development. This agency helps align urban forestry planning with broader environmental and ecological goals, such as improving city-wide resilience and livability.
Public and private property owners also share responsibility, particularly for trees located on land not managed by the City Council. They are expected to maintain and protect their trees in accordance with the city’s environmental regulations, which mandate conservation efforts and limit removal or replacement without proper justification and compensation.
Additionally, the Sustainability Participatory Council plays a critical role in democratic oversight and public engagement. This council includes elected representatives from the More Sustainable Barcelona (B+S) network, comprising schools, businesses, NGOs, and universities. Through this participatory model, the Council ensures that civil society is actively involved in shaping, monitoring, and sustaining the goals of the urban forest strategy.
Washington, United States
Andrew Ó Murchú
Urban Forest Management Plan, 2007; Urban Forest Stewardship Plan, 2013; Urban Forest Management Plan, 2020; City of Seattle Tree Canopy Assessment Final Report, 2021
Seattle established an Urban Forestry Commission (UFC) in 2009 by city ordinance. The Commission consists of several subject experts and community representatives. Commissioners advise the Mayor and City Council on how to achieve their 30% urban canopy coverage goal. In Seattle, the Commission appears to now have the ear of the Mayor, who recently passed a comprehensive Executive Order based on the Commission’s recommendations—including updating tree ordinances to require a “three-for-one” replacement. The Commission’s webpage suggests the UFC closely follows ongoing city activities, entering into debates and lobbying local government

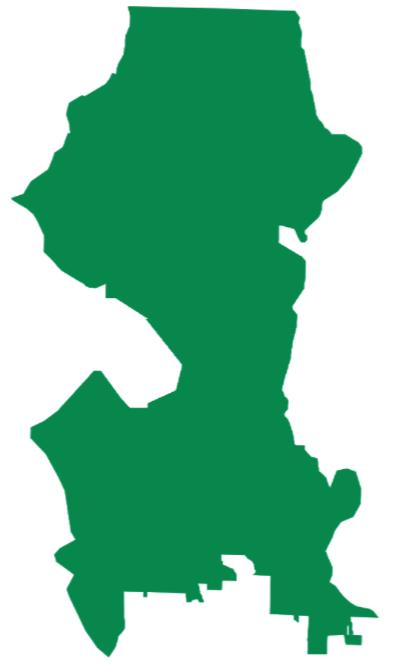
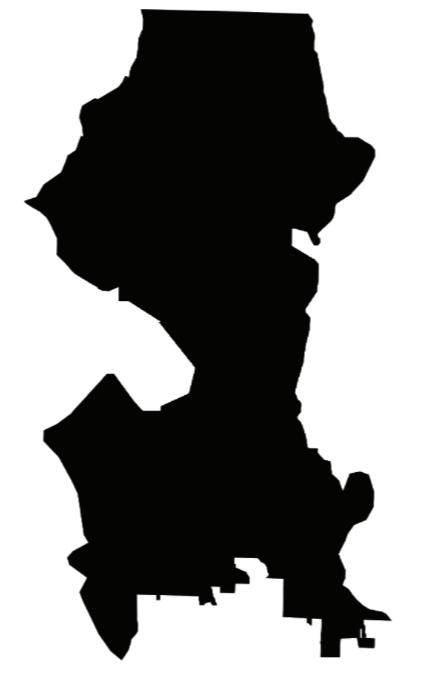
Scale Comparison:

Canopy Cover:
Key Issues:
Goals with Development
Prioritize Protection of
In Seattle “urban forestry” refers to all canopy cover across public and private land and includes trees across parks, streets, forested parklands, institutional campuses, and those on other private land. The broad conception of the term is typical of US urban forestry plans, but can also be understood within the colloquial framing of Seattle as the “Emerald City.” This imaginary is sustained by the words of Captain George Vancouver in the late eighteenth century when he described the Puget Sound region around Seattle as an “impenetrable wilderness of lofty trees.”
The City perceived the urban canopy to have “significantly declined” due to urban development. The analytical methods used in the first plan conducted in 2007 revealed canopy coverage at approximately 18%. This was later found to be an underestimate with 23% a more accurate measure. The 2007 plan should also be viewed in the regional context—Portland first completed a similar Urban Forest Management Plan in 2004, and the City of Seattle had adopted the “Seattle Green Factor” (SGF) into municipal code in 2006. The SGF required implementation of landscaping using a score-based system and varied between zones.
Between 2007 and 2016, Seattle’s urban canopy increased from 23% to 28.6%—an increase of 5.6%. However, a decrease of 0.5% occurred between 2016 and 2021, LiDAR data was collected in both periods to assess tree canopy gains and losses. City reports suggest coverage was approximately 40% in the 1970s.
Like other cities in the United States, Seattle’s urban canopy is not equitably distributed. The City defines focus “Environmental Justice (EJ) Priority Areas” to address these inequities. In 2021, EJ Priority Areas had 31% less canopy than “advantaged neighborhoods.”
The City’s initial plans recognized that technical solutions such as municipal ordinances or permitting requirements would not address the canopy gap, particularly as most of the canopy was and is on private land. Other risks and challenges identified in the plans include:
• Lack of tree care knowledge amongst private landowners.
• Invasive species threatening riparian corridors and forests.
• Four major pests.
• Soil quality—compaction, aeration and erosion.
• Variability for support of urban forestry across city in both social and physical terms
• Tree size replacement limitations.
• Change in hardiness zone of Puget Sound region in coming decade.
• Development and freight mobility.
• Viewshed maintenance.
• Utilities.
In 2021, the City of Seattle published the “Tree Canopy Assessment” based on LiDAR data gathered in both 2016 and 2021. The analysis was conducted by the University of Vermont Spatial Analysis Lab. Measured areas with respect to heat maps and EJ Priority Areas provides further analytical purchase to the numbers.
The City adopted nine “management units” for their plan to address the variability between different land and management types:
• Single-family residential
• Multi-family residential
• Commercial/mixed-use
• Industrial
• Institutional
• Downtown
• Developed Parks
• Parks’ Natural Areas
• Right-of-way
Key Recommendations
1. Tree Resource:
From the outset of the Urban Forestry Plan in 2007, the City strongly advocated for a robust understanding of the urban forest through inventory and analysis. Later outcomes of this initiative included greater accessibility to the Department of Transportation’s inventory, and a comprehensive LiDAR analysis in 2016 and 2021.
2. Management Framework:
A key outcome of the plan was an interdepartmental group—Urban Forestry Core Team—across 9 departments and centers, and one program. The group facilitated improved tree resource management, coordination, and development.
3. Community Framework:
Enhance public awareness and stewardship of the urban forest and promote “citizen-government-business partnerships.”
Who is Responsible?
The Urban Forestry Management Plan catalyzed the “Urban Forestry Commission,” a group of experts and citizens who advise the Mayor and City Council on reaching the City’s 30% overall tree canopy target. The City’s departments maintain the urban forest on public land and administer programs through “Trees for Seattle” to reach private property owners for planting and maintenance. Land development triggers city rules on “three-for-one” replacement and street and private lot planting requirements. The city also relies upon volunteer labor, particularly in more naturalized areas, to meet the urban forest’s maintenance demands.
Texas, United States
Rose Van Grinsven
Austin’s Urban Forest Plan: A Master Plan for Public Property (2013-2014)
Austin’s Urban Forest Plan includes an explicit integration of local ecoregions and natural landscape features into its urban forestry strategy. Austin’s plan highlights the importance of different ecosystems within and around the city, such as the Edwards Plateau, Balcones Canyonlands, and the Blackland Prairie, shaping its vegetation and urban forest management policies.
While many cities incorporate green infrastructure into their urban forestry plans, Austin’s plan tries to tailor its approach to the unique ecological context of its region, recognizing the role of wildfire suppression, species adaptation, and native savanna environments.
Climate Zone: Sub-Tropical Dry Climate
Reference Ecotype: Plateau Canyonlands Blackland Prairie
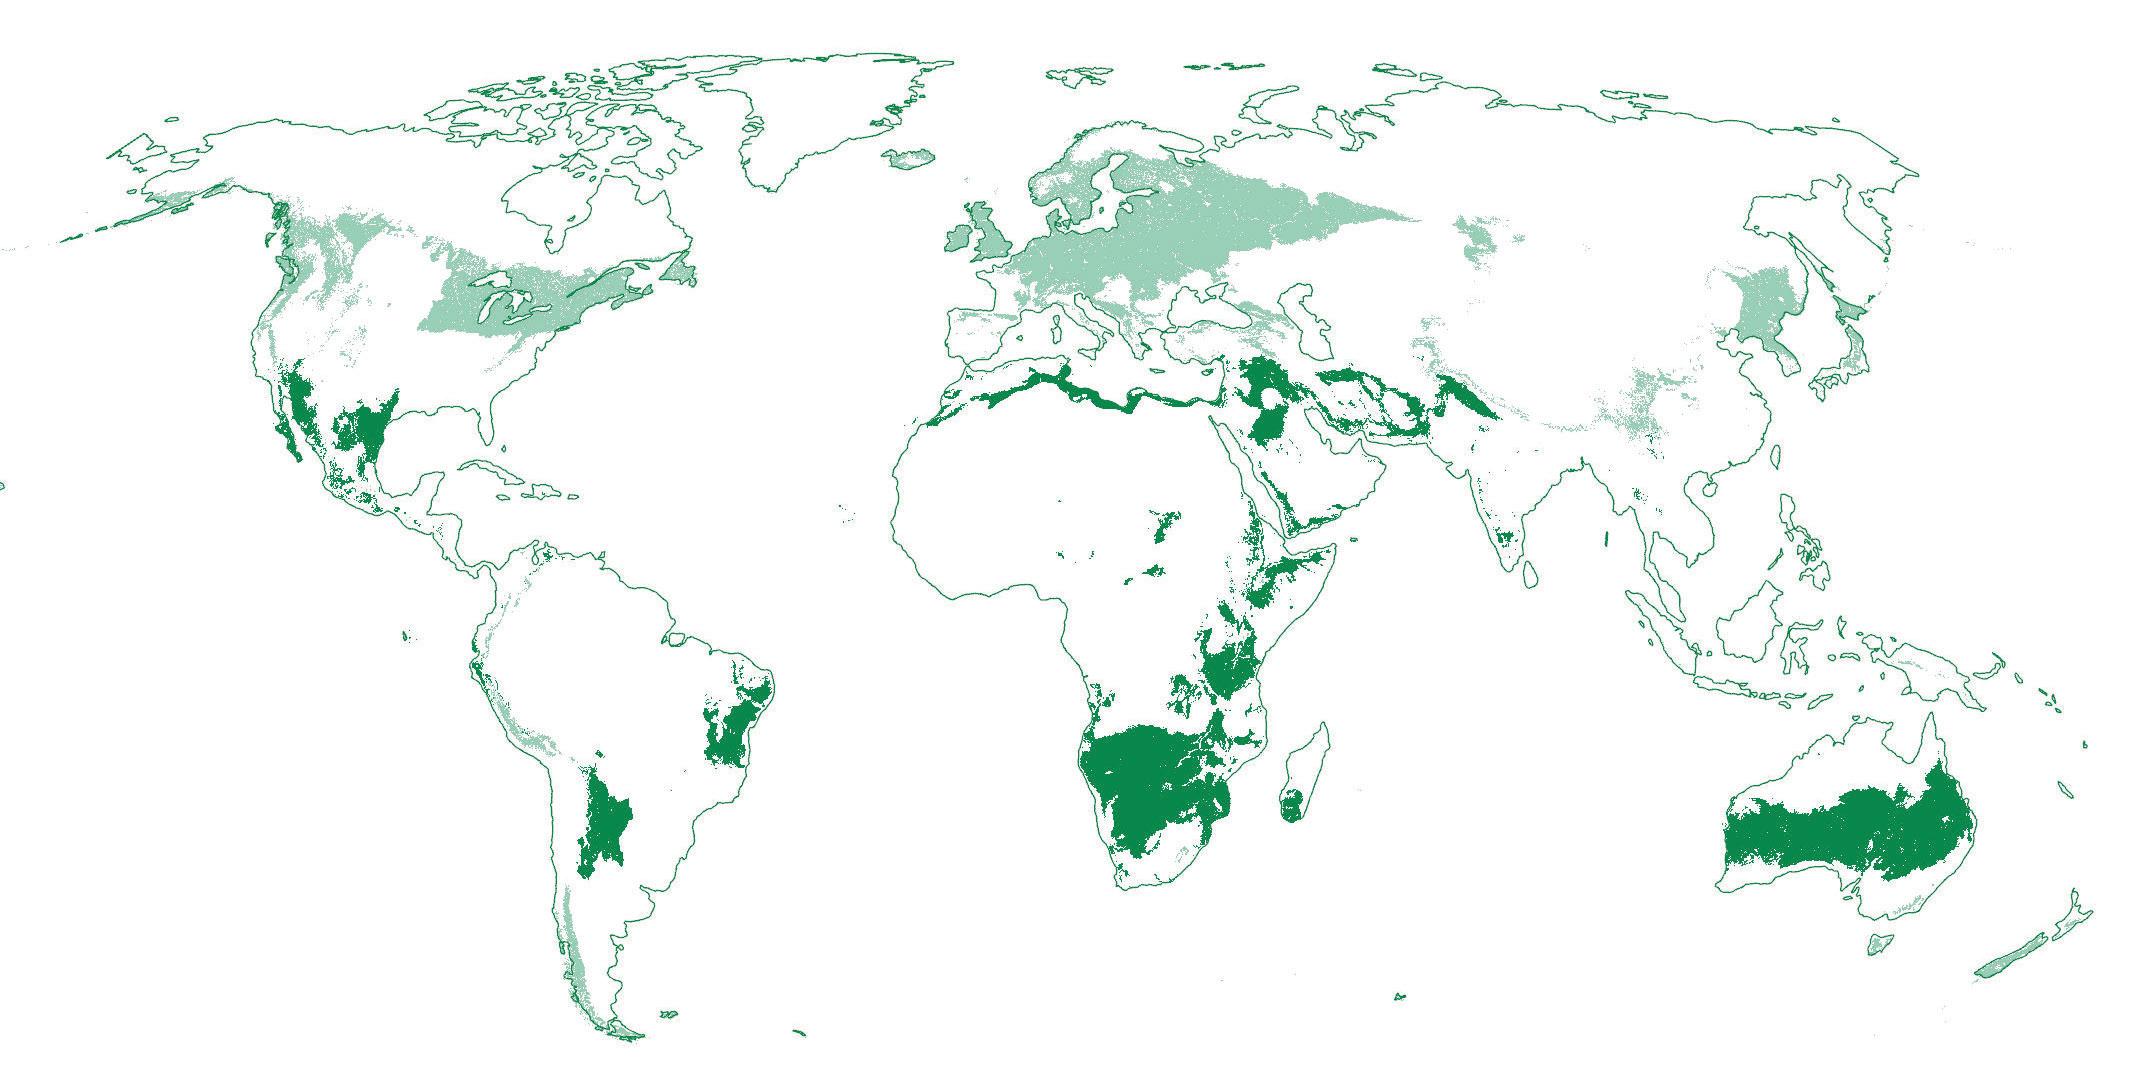
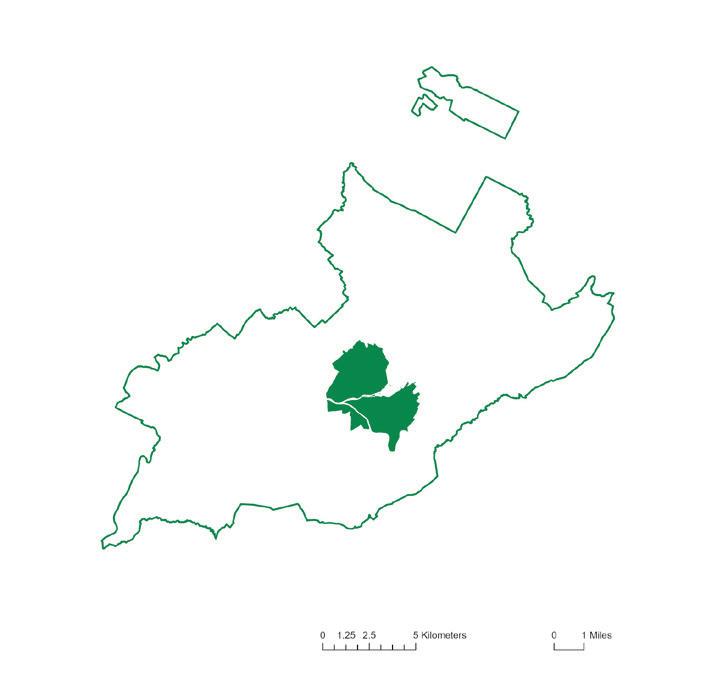
Scale Comparison:
(City) Population:
million
million

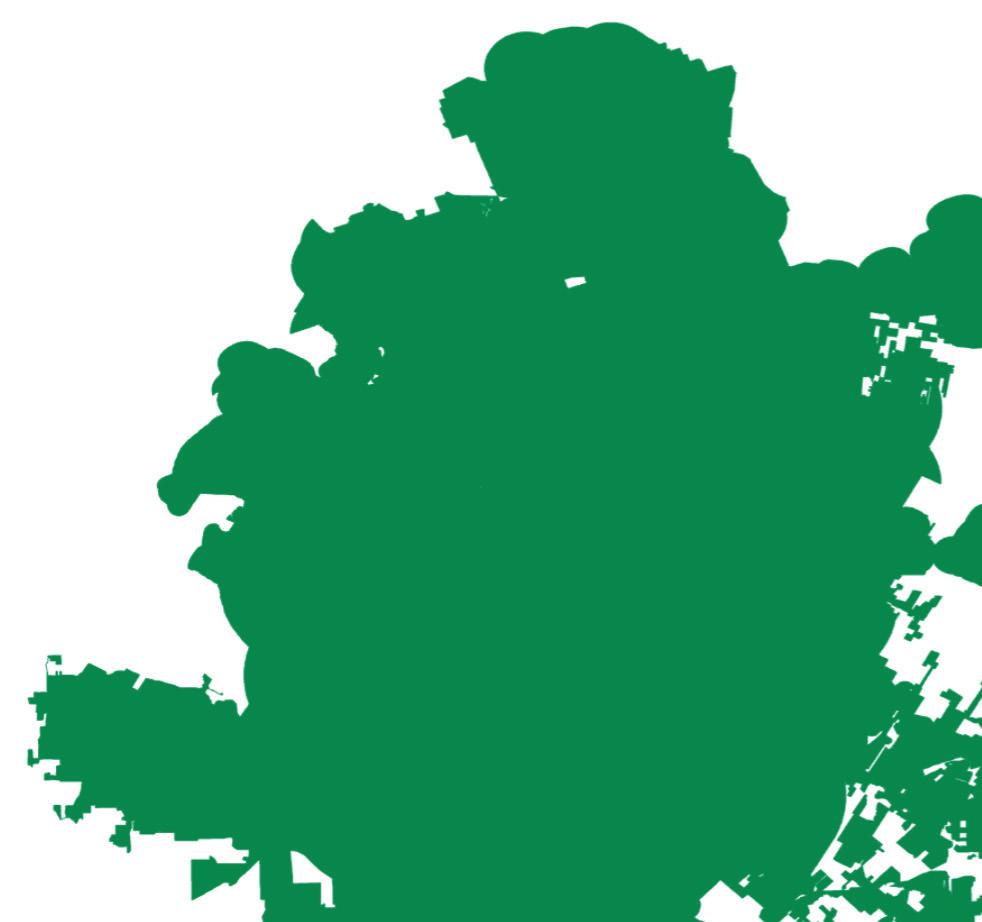
Canopy Cover:
Austin Population: 1.0 million Area: 790 km2


The City of Austin defines an urban forest as all trees and vegetation within the urban area, regardless of public or private ownership. The 2014 Urban Forest Plan describes Austin’s urban forest as a, “healthy and sustainable mix of trees, vegetation, and other components that comprise a contiguous and thriving ecosystem valued, protected, and cared for by the City and all of its citizens as an essential environmental, economic, and community asset.” Additionally, the Austin Urban Forest Report defines the urban forest as including, “all trees in the city, both within and outside forested areas, including street trees, trees on public and private lands, and trees that are planted and naturally occurring.”
The report was developed to assess and monitor Austin’s urban forest, providing baseline data for future management efforts. Austin’s trees contribute significantly to environmental and economic benefits, including air pollution removal, carbon storage, and energy cost reduction, with an estimated total value of $16 billion. The city’s rapidly growing population, which reached 865,500 in 2014 and is projected to approach 1.2 million by 2030, has increased urban development pressures that threaten tree cover and land use.
Additionally, concerns over forest health, such as the presence of invasive species, insect and disease infestations, and an aging tree population, highlight the need for strategic planning. Climate change and land cover changes further underscore the necessity of proactive management to sustain long-term ecological benefits. By undertaking this urban forest plan, Austin aims to preserve and enhance its tree canopy, ensuring resilience against urbanization and environmental challenges while maximizing the city’s economic and ecological advantages.
Austin’s urban forest consists of an estimated 33.8 million trees, covering 30.8% of the city. It is not evenly distributed, with tree cover ranging from 7.1% in highly developed areas to 74% in evergreen forest lands. While the forest is currently sustainable, with more small trees than large ones, some key species, such as pecan and Buckley oak, are underrepresented among young trees, which could lead to shifts in species composition over time.
The urban forest faces several risks, including invasive species, which account for 1.7 million trees, and insect and disease threats such as oak wilt and Dutch elm disease, which could impact millions of trees. Additionally, Austin’s rapid population growth and urban development are putting pressure on tree cover, potentially reducing canopy levels and altering the forest’s structure. Climate change, land cover changes, and infrastructure development further contribute to the challenges facing Austin’s urban forest.
The reports used a combination of field measurements, remote sensing, and modeling tools to analyze Austin’s urban forest. The Urban FIA (Forest Inventory and Analysis) framework was a key tool, providing a systematic inventory approach based on a sample of 223 plots across the city. Field crews collected data using GPS units and aerial photographs to locate sample sites, then measured tree diameter, height, species, health, and presence of damages. Additional metrics, such as crown ratio, crown class, and foliage condition, were recorded to assess tree health.
The i-Tree Eco model, developed by the U.S. Forest Service, was used to quantify forest structure, ecosystem services, and economic values, such as carbon sequestration, air pollution removal, and energy cost savings. The model calculated totals, averages, and standard errors for species composition, tree density, and other attributes. For economic valuation, tools like the Environmental Benefits Mapping and Analysis Program (BenMAP) from the U.S. EPA were used to estimate the monetary value of air pollution removal. Additionally, estimates for rainfall interception and avoided stormwater runoff were derived based on vegetation cover data. These combined methodologies provided a comprehensive assessment of Austin’s urban forest, helping inform long-term management strategies.
The key recommendations of Austin’s Urban Forest Plan focus on protecting, preserving, and sustaining the city’s urban forest while integrating it into broader city planning. The plan emphasizes establishing a long-term vision, providing a roadmap for implementation, and ensuring coordination across city departments. Specific goals include improving tree canopy cover, protecting trees during development, enhancing species diversity, implementing sustainable water and land management practices, and addressing threats such as invasive species and climate change. The plan also calls for an Austin-specific Standard of Care to ensure consistent tree maintenance, proactive management, and alignment with best practices.
The responsibility for implementing these recommendations is shared across multiple entities. The Urban Forestry Board, established by the Austin City Code, advises the City Council, City Manager, and Parks and Recreation Department. The Urban Forester, an appointed city official, oversees urban forest management, coordinates with departments, ensures tree preservation, and facilitates interdepartmental collaboration. Individual city departments must develop and follow Departmental Operational Plans aligned with the urban forest strategy, while community stakeholders, nonprofits, and residents are encouraged to participate through partnerships and advocacy.
To track progress and accountability, the plan includes the use of annual performance report cards. These report cards provide a structured assessment of how well the city is meeting its urban forest goals, measuring key metrics such as tree canopy coverage, species diversity, maintenance efforts, and sustainability initiatives. By regularly reviewing these performance indicators, city officials can adjust strategies, allocate resources effectively, and ensure the plan remains responsive to emerging challenges.
Washington, United States
Forestry Management Plan (October 2023); Urban Forest Strategy (October 2018)
Vancouver, Washington’s Urban Forestry Management Plan report implements the U.S. Forests Urban Forest Audit system to continue monitoring and evaluating the urban forest canopy on a more frequent basis. It also includes examples for monitoring in the publicly accessible report so that stakeholders and the community can continue to be involved in this process. The evaluation will be updated annually to ensure that targets are being met.

Scale Comparison:
million

Canopy Cover:
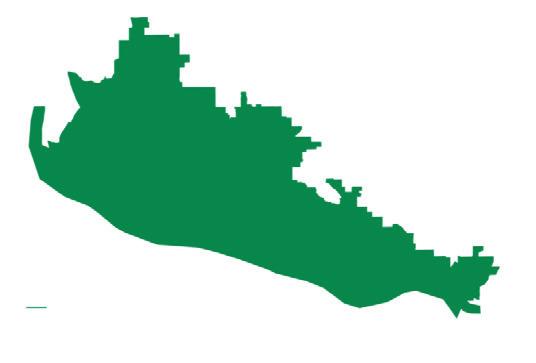
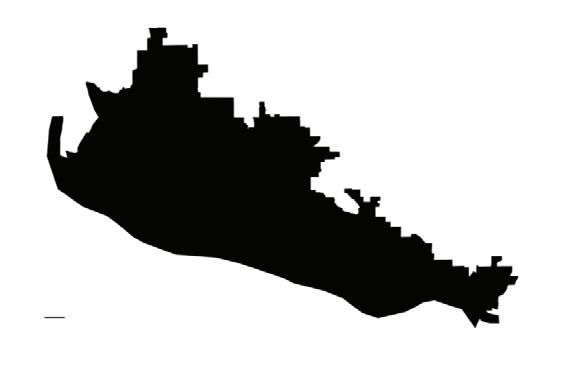
Key Issues:
In Vancouver, the term ‘Urban Forest’ more generally refers to the ecosystem services that tree canopy provides to the city. It is more focused on how trees contribute to the overall functioning of the urban realm as a piece of a larger system (that system being the city).
Vancouver’s urban forestry plans were developed to address the threats imposed on the existing canopy of the city. Climate change poses a significant threat to the health of the urban forest and there is a need to preserve the existing canopy with urban heat island effect increasing. The city of Vancouver is also concerned with the unbalanced protection of mature trees during development which has opened the conversation for policy change. Lastly, the city hopes the plan will promote and expand equitable distribution of urban tree canopy so that all neighborhoods receive equal access to associated benefits.
The overall findings of the report conclude that there is a lack of equality and biodiversity in tree canopy distribution. Of the species distribution, 39% of canopy is comprised of only ten species and 16% of the overall canopy is made up of douglas fir. In terms of canopy distribution across neighborhoods, 13 neighborhoods have 15% canopy cover or less while only two have greater than 35% canopy cover. The report also determined that the majority of public trees are privately maintained which causes complications with tree maintenance and consistency across the city.
The overall findings of the report conclude that there is a lack of equality and biodiversity in tree canopy distribution. Of the species distribution, 39% of canopy is comprised of only ten species and 16% of the overall canopy is made up of douglas fir. In terms of canopy distribution across neighborhoods, 13 neighborhoods have 15% canopy cover or less while only two have greater than 35% canopy cover. The report also determined that the majority of public trees are privately maintained which causes complications with tree maintenance and consistency across the city.
Proactive public tree maintenance and improving public tree pruning of trees that the city is responsible for. They will also improve tree maintenance by increasing funding and staff available for this initiative. The city also established a tree planting initiative that includes short- and long-term canopy goals and identifies priority planting areas. The tree stewards program expands community engagement and improves privately-owned public tree maintenance. The city also implemented preservation initiatives to reduce the number of trees lost or damaged due to improper maintenance and development.
Melbourne’s urban forest masterplan is much bigger than most of the other case studies and is also more complex with different types of regions/bioregions and governmental structures. Their planning is a region-wide, cross-jurisdictional collaboration between 32 local councils, state agencies, water authorities, and community groups, recognizing that trees, biodiversity, and climate resiliency does not adhere to political boundaries. Melbournbe has also not only focused on trees, but also other flora and fauna that make up the urban forest.
Climate Zone: Warm Temperate Dry Warm Temperate Moist
Reference Ecotype: South Australia temperate forests

Scale Comparison:
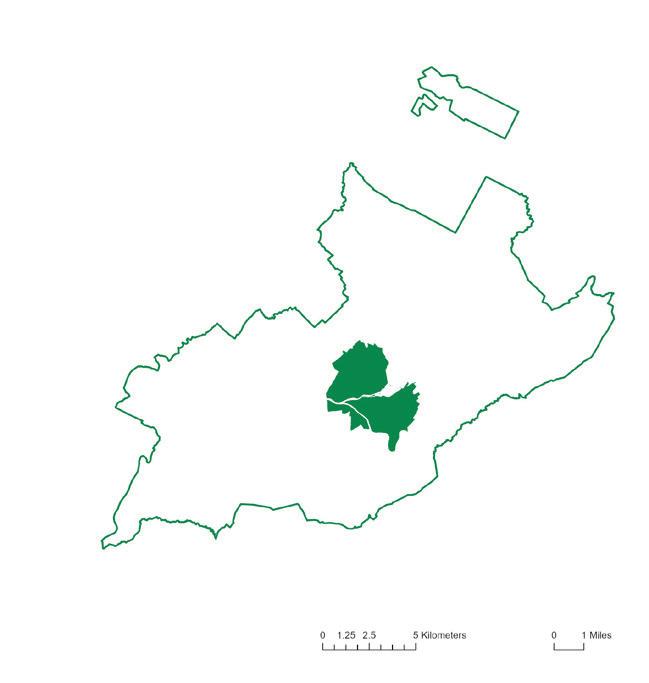
Canopy Cover:

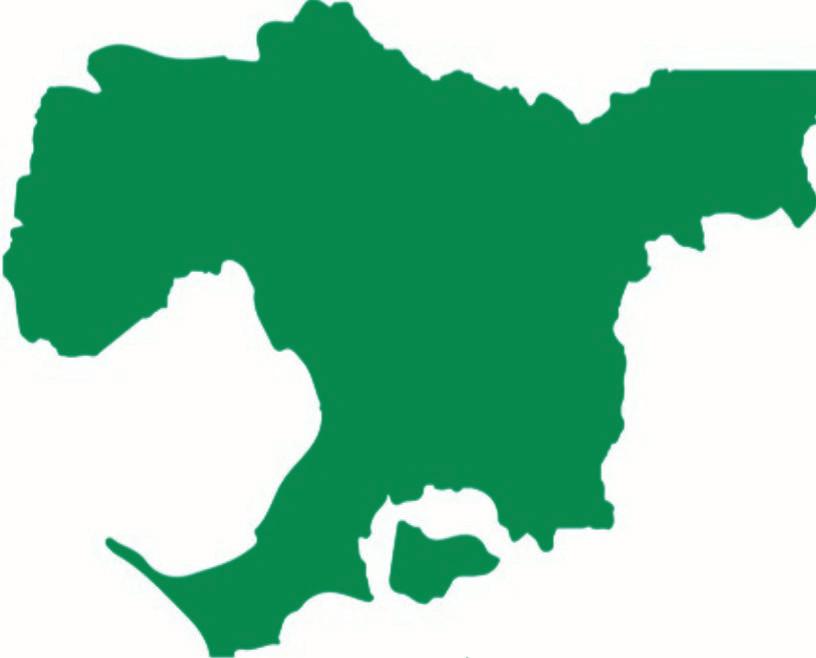
How does Melbourne define Urban Forest?
Living Melbourne defines the metropolitan Melbourne Urban Forest as, “The urban forest is made up of native and exotic trees, shrubs, grasslands and other vegetation, growing on public and private land across metropolitan Melbourne, and the soil and water that support them. This includes vegetation in parks, reserves and private gardens, along railways, waterways, main roads and local streets, and on other green infrastructure such as green walls and roofs. The urban forest encompasses all types of vegetation and ecosystems, but among the most iconic elements are its trees and shrubs. Fauna is an important component too, with complex interrelations between animals and plants helping to maintain the urban forest”.
Melbourne is currently projected to be the largest city by 2051, with a population of eight million people. They have recognized that this growth leaves its greenery vulnerable, which compromises benefits that come with it. Living Melbourne plans to shift the city from existing in conflict with nature, to extending and enhancing their urban forest.
Other specific reasons that were reported include:
1. Climate change mitigation
2. Biodiversity and ecosystem services
3. Physical, mental, social, and spiritual health and wellbeing
4. Social equity and community engagement, addressing inequities related to green spaces in underserved neighborhoods
5. Sustainability and resilience
6. Aesthetics and cultural values
Canopy cover is declining in some areas due to urban development, tree ageing, and climate stress. Between 2014 and 2018, it was reported that Melbourne lost 2,000 hectares of tree canopy cover, primarily in urban and suburban areas.
The report states that the total urban area canopy cover (for tree canopies of 3 to 15m) is 15.4%, but the percentage is not equitably distributed and different in different regions. The Eastern region has 25.2%, Inner South East 21.7%, Southern 16.4%, Inner 12.5%, Northern 12.1%, and Western 4.2%. The percentage of canopy cover above 15m is 0.1-2.9%. (The 2015 baseline and targets of canopy coverage varies due to historical development and ecological characteristics of their underlying bioregions).
The majority of the total canopy cover is in residential areas, while rural, industrial, commercial, and commonwealth areas each have less than 5%. Lower-income, western suburbs have less green cover, while affluent suburbs in the east and south-east generally have higher canopy cover. Inner-city areas are facing challenges due to densification and limited space for new trees.
Melbourne’s plan incorporated the following:
• Satellite imagery and thermal imaging
• Aerial photography
• GIS/urban forest maps
• Tree inventory and maintenance data
• Pie charts, tables, and graphs
• Tree canopy data
• Urban heat island data
• Public green space and parks data
• Health and demographic data
• Soil and water data
• The importance of biodiversity particularly in metropolitan Melbourne
• Urban land use and infrastructure data
Through geospatial data, heat mapping, and ecosystem connectivity modeling, they were able to identify priority areas for tree planting.
The report recognizes the importance of action on all levels. They have brought together 32 metropolitan councils, state government agencies, non-government and community organizations, and other partners.
They have 3 main goals:
1. Healthy people: protect and increase access to nature, green space and canopy cover, to reduce heat exposure, and improve mental and physical wellbeing
2. Abundant nature: protect and extend habitat connectivity and corridors to enhance biodiversity
3. Natural infrastructure: protect and increase vegetation on public and private land, in order to cool urban areas, retain water in the soils, reduce flood risk and increase water and air quality
With the 3 main goals, they have created six recommended actions with sub-actions:
1. Protect and restore species habitat, and improve connectivity
2. Set targets and track progress
3. Scale up greening in the private realm
4. Collaborate across sectors and regions
5. Build a toolkit of resources to underpin implementation
6. Fund the protection and enhancement of the urban forest
Local government authorities have been tasked with acting as managers and custodies of many of the parks, streetscapes and open spaces, as well as working with residents and the broader community to generate local action. The Victorian government is responsible for protecting and expanding the urban forest, while non-government, community organizations, and private landowners have been tasked with disseminating information and gathering support. Residents, ‘friends of’ groups, Landcare, and communities of practice have also been identified and tasked.
Where is the forest, and how is it changing?
A Baseline Urban Tree Canopy Assessment from Geneva’s Geospatial Data

Slide Kelly
We cannot propose to intervene in the urban forest without first identifying its current condition and the dynamics that are influencing how it is changing.
Analysis of canopy area distribution provides a vital baseline for understanding the spatial structure of a city’s urban forest and for guiding interventions to improve it. This approach is the foundation of an Urban Tree Canopy (UTC) assessment — which uses LiDAR-derived canopy models to map and quantify tree canopy cover across a city or region. The analysis of this data supports planning, planting, and long-term forest monitoring.
A UTC assessment based on static canopy area is simply a starting point for addressing issues of urban forest health, equity, and impact. When we are able to be spatially explicit in identifying where the urban forest is growing and where it is declining, we are able to identify where action is most urgently needed. For Geneva, this study established a baseline analysis of canopy area and canopy change at the city and cantonal scale, – evaluating canopy change against other data points such as neighborhood, communities, land cover type, zoning and land uses.
Geneva is well-suited to data-driven urban canopy assessments thanks to the city’s high quality geospatial resources — specifically, its several years of Canton-wide LiDAR beginning in 2005. These three-dimensional point clouds have been segmented to produce Digital Canopy Models (DCMs) as a collaboration between city agencies (OCAN, DIT, UniGE, and Ville de Geneve) to support the Cantonal Green Heritage Information System (SIPV) and the City’s Strategic Vegetation Plan.
While this work gives a comprehensive sense of where the urban forest is — specifically for the years 2017, 2019, and 2023 — it is only in comparison between DCMs that we can get a sense of how the forest has changed. With 6 years as the greatest interval between already processed DCMs, it was crucial to support the student’s work by segmenting and processing an additional year of data from the 2013 Cantonal LiDAR survey, allowing the course to examine 10 years of canopy area change.
Producing a digital canopy model for 2013 that is as close as possible in quality to subsequent years began first with rasterizing LiDAR points classified as “High Vegetation” to a 50cm grid based on the maximum point elevation per cell. From this, a triangulated raster of “Ground” points at the same resolution was subtracted from the high vegetation to produce a raster of Relative Canopy Height. Median smoothing with a 3x3 neighborhood was used on the canopy area raster to reduce the potential of gaps and holes. Then, it was resampled to eliminate cells less than 3m in height, vectorized with simplification to retain effective areas, and culled of polygons with a final area of less than 2.5m. The thresholds for minimum height, area, and cell size were taken directly from the specifications of DCMs from 2017 to 2023.
The addition of a 2013 digital canopy model that closely follows the methodology of other available canopy area data provides a valuable window into ten years of canopy change. However, it is worth noting that the quality of LiDAR data improved significantly between 2013 and 2023 — with an average increase in point cloud density of 15 to 100 points/m2. Median smoothing was used as an attempt to compensate for this difference, but the 2013 DCM may still underestimate total canopy area due to lower input point density. This is also likely true of the 2017 and 2019 models, which have an average of 25 points/m2. The process of vectorizing these data also likely introduces some error in the observation of canopy cover, as comparison of polygon area does not have the spatial precision of overlaying rasters of the same resolution.
Despite these ever-present challenges of harmonizing data for time-based analysis, the results provide a detailed picture of where trees have been lost or planted, are thriving or in poor health, over a decade across the Canton of Geneva. This information can be further enhanced with the future incorporation of multispectral LiDAR and comprehensive survey-based tree inventory data. But, for the purpose of this study, this urban tree canopy assessment lays the groundwork for an analysis of distribution of canopy area over time. To provide a baseline, the initial analysis studied distribution by:
1. Administrative Area (Municipalities/Sectors)
2. Land Surface Cover
3. Land Use Zones
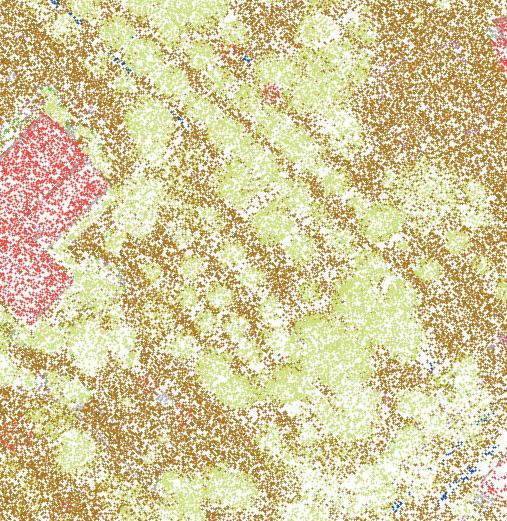
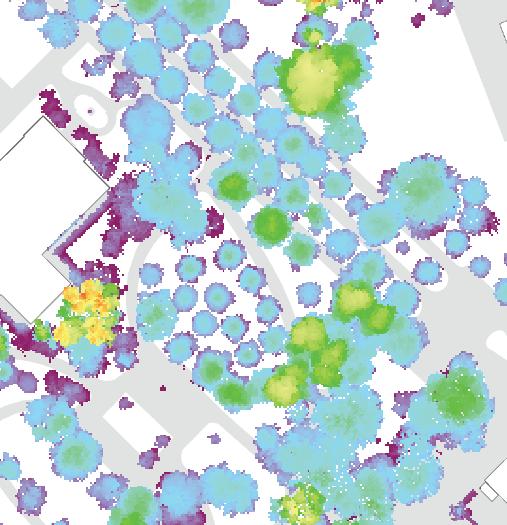
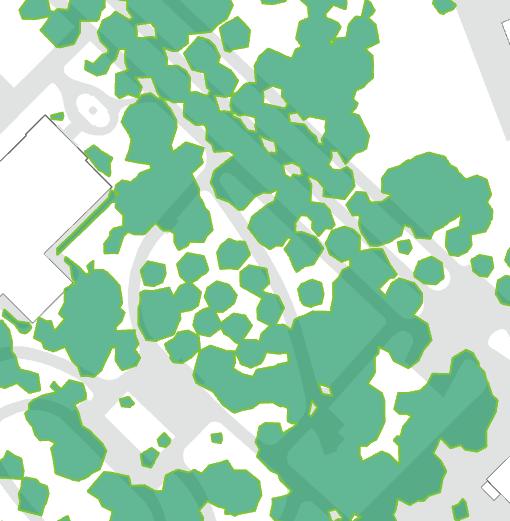
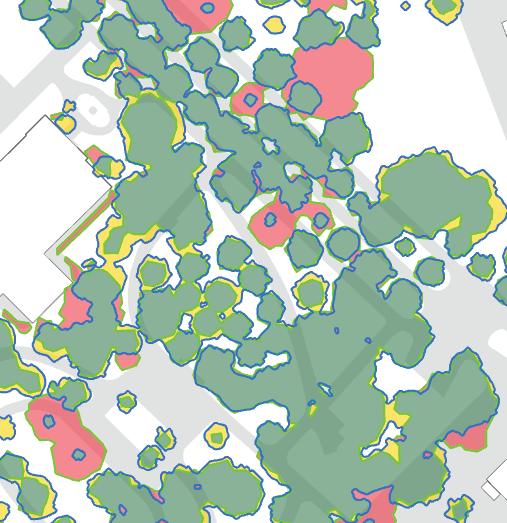
1. (Top-left) Classified Lidar Point Clouds for Geneva captured 2013. Points classified as High Vegetation (light green) represent potential tree canopy.
2. (Top-right) Relative canopy height raster generated by subtracting triangulated ground height from high vegitation.
3. (Bottom-left) Vectorized 2013 canopy area polygons, removing areas of relative height less than 3m, and median-filtering to reduce holes.
Data: Système d’information du territoire à Genève (SITG).
“Nuages De Points Lidar 2013.”
“Modèle Numérique De Surface De Canopée - État 2023”
4. (Bottom-right) Canopy change 2013-2023, created by intersecting vector digital canopy models for the two years. Green are areas of no change, Yellow areas of growth, and Red areas of loss.
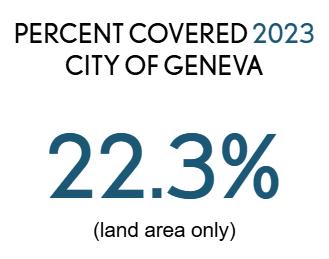

At the scale of the City of Geneva, tree canopy increased by a similar margin of 1.0% from 21.3% to 22.3% (land area only). That the coverage is so similar between the cantonal and city scales is a positive sign of balanced tree canopy performance between the urban center and periphery of Geneva.
Analysis of change by sector (a statistical combination of two neighborhoods) reveals a finer resolution of the trend observed at the municipal scale. Sectors to the west of the city exhibited the greatest degree of positive change — notably the sectors of Grand Pre-Vermont, Charmilles Chatelaine and Saint-Jean Aire. To the east, Eaux Vives-Lac exhibited the greatest
degree of canopy loss, with Cite-Centre and La Cluse-Philosophe exhibiting loss to a lesser degree.
Breaking down the analysis to the scale of a single hectare grid, we can clearly see areas in the city that are most contributing sectoral performance of canopy change. Such analysis is defined by a spatial area, not a political boundary, and can provide a robust way for analyzing localized trends. This can help pinpoint individual hectares to investigate drivers of tree canopy loss or gain and give direction to potential spaces of intervention in the city’s urban forest.
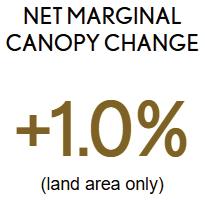
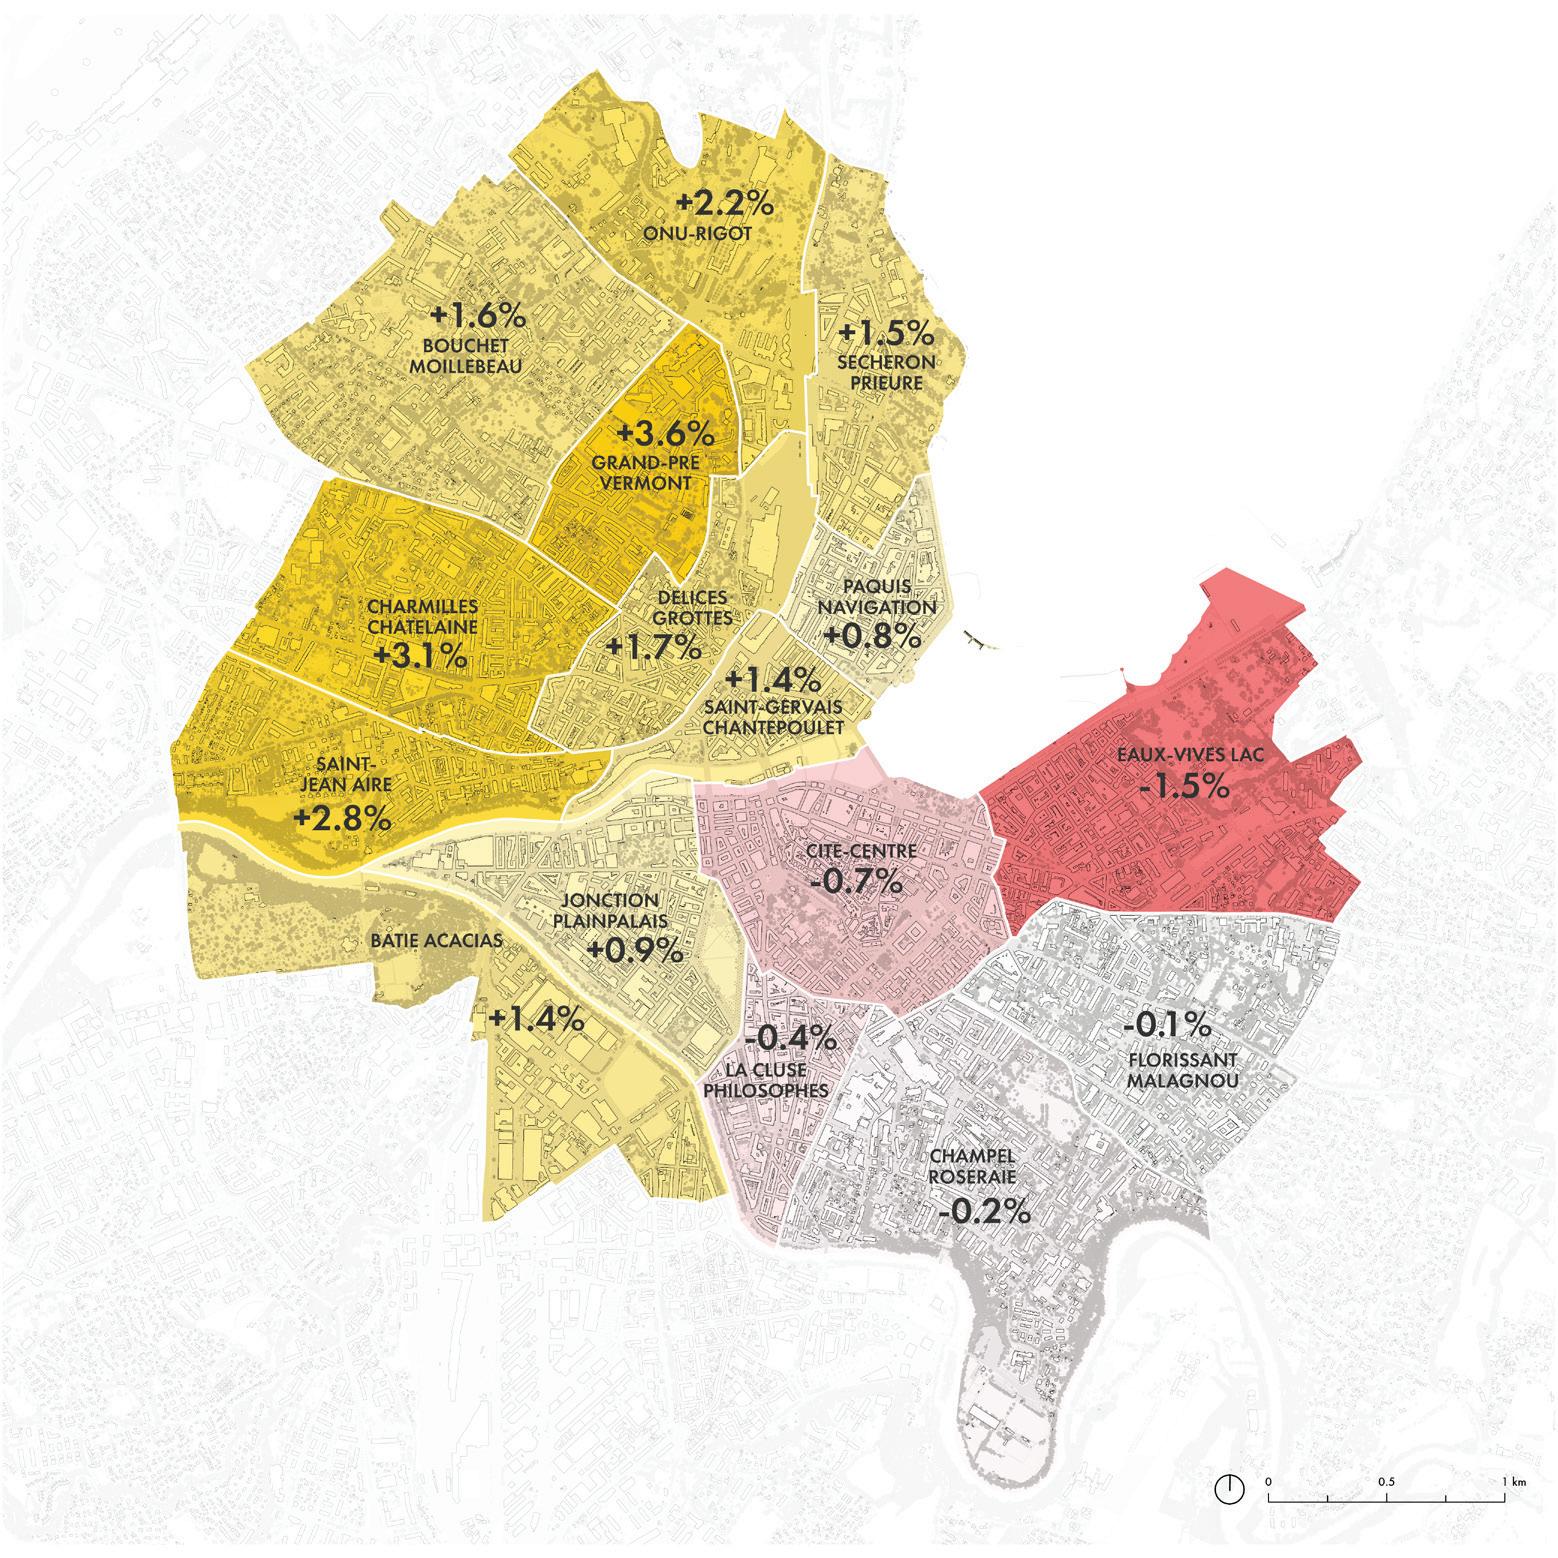

Canopy Change 2013-2023 per hectare area
Data - Système d’information du territoire à Genève (SITG): “Sous-secteurs statistiques (GIREC)” (2025).
“Nuages De Points Lidar 2013.”
“Modèle Numérique De Surface De Canopée - État 2023”
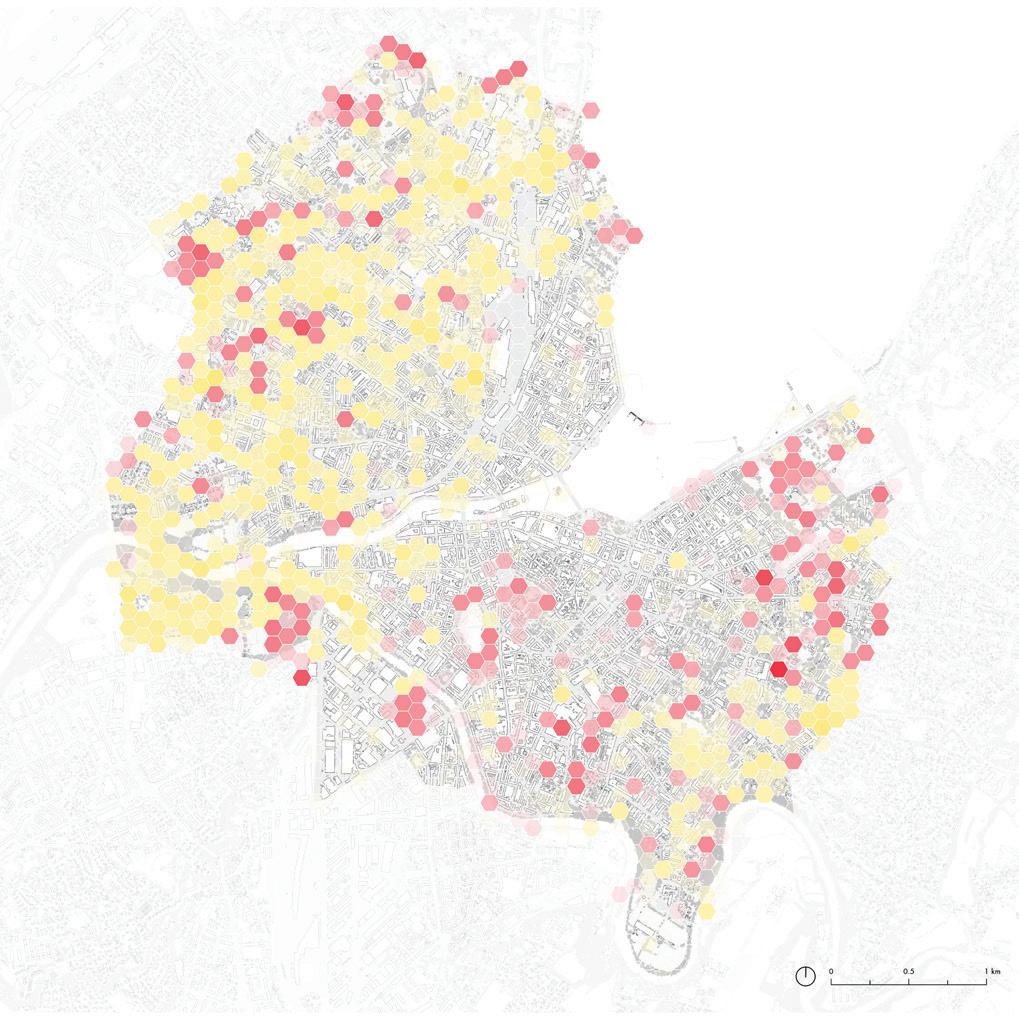
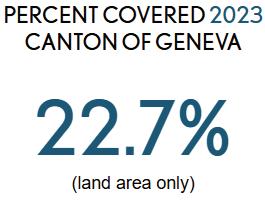
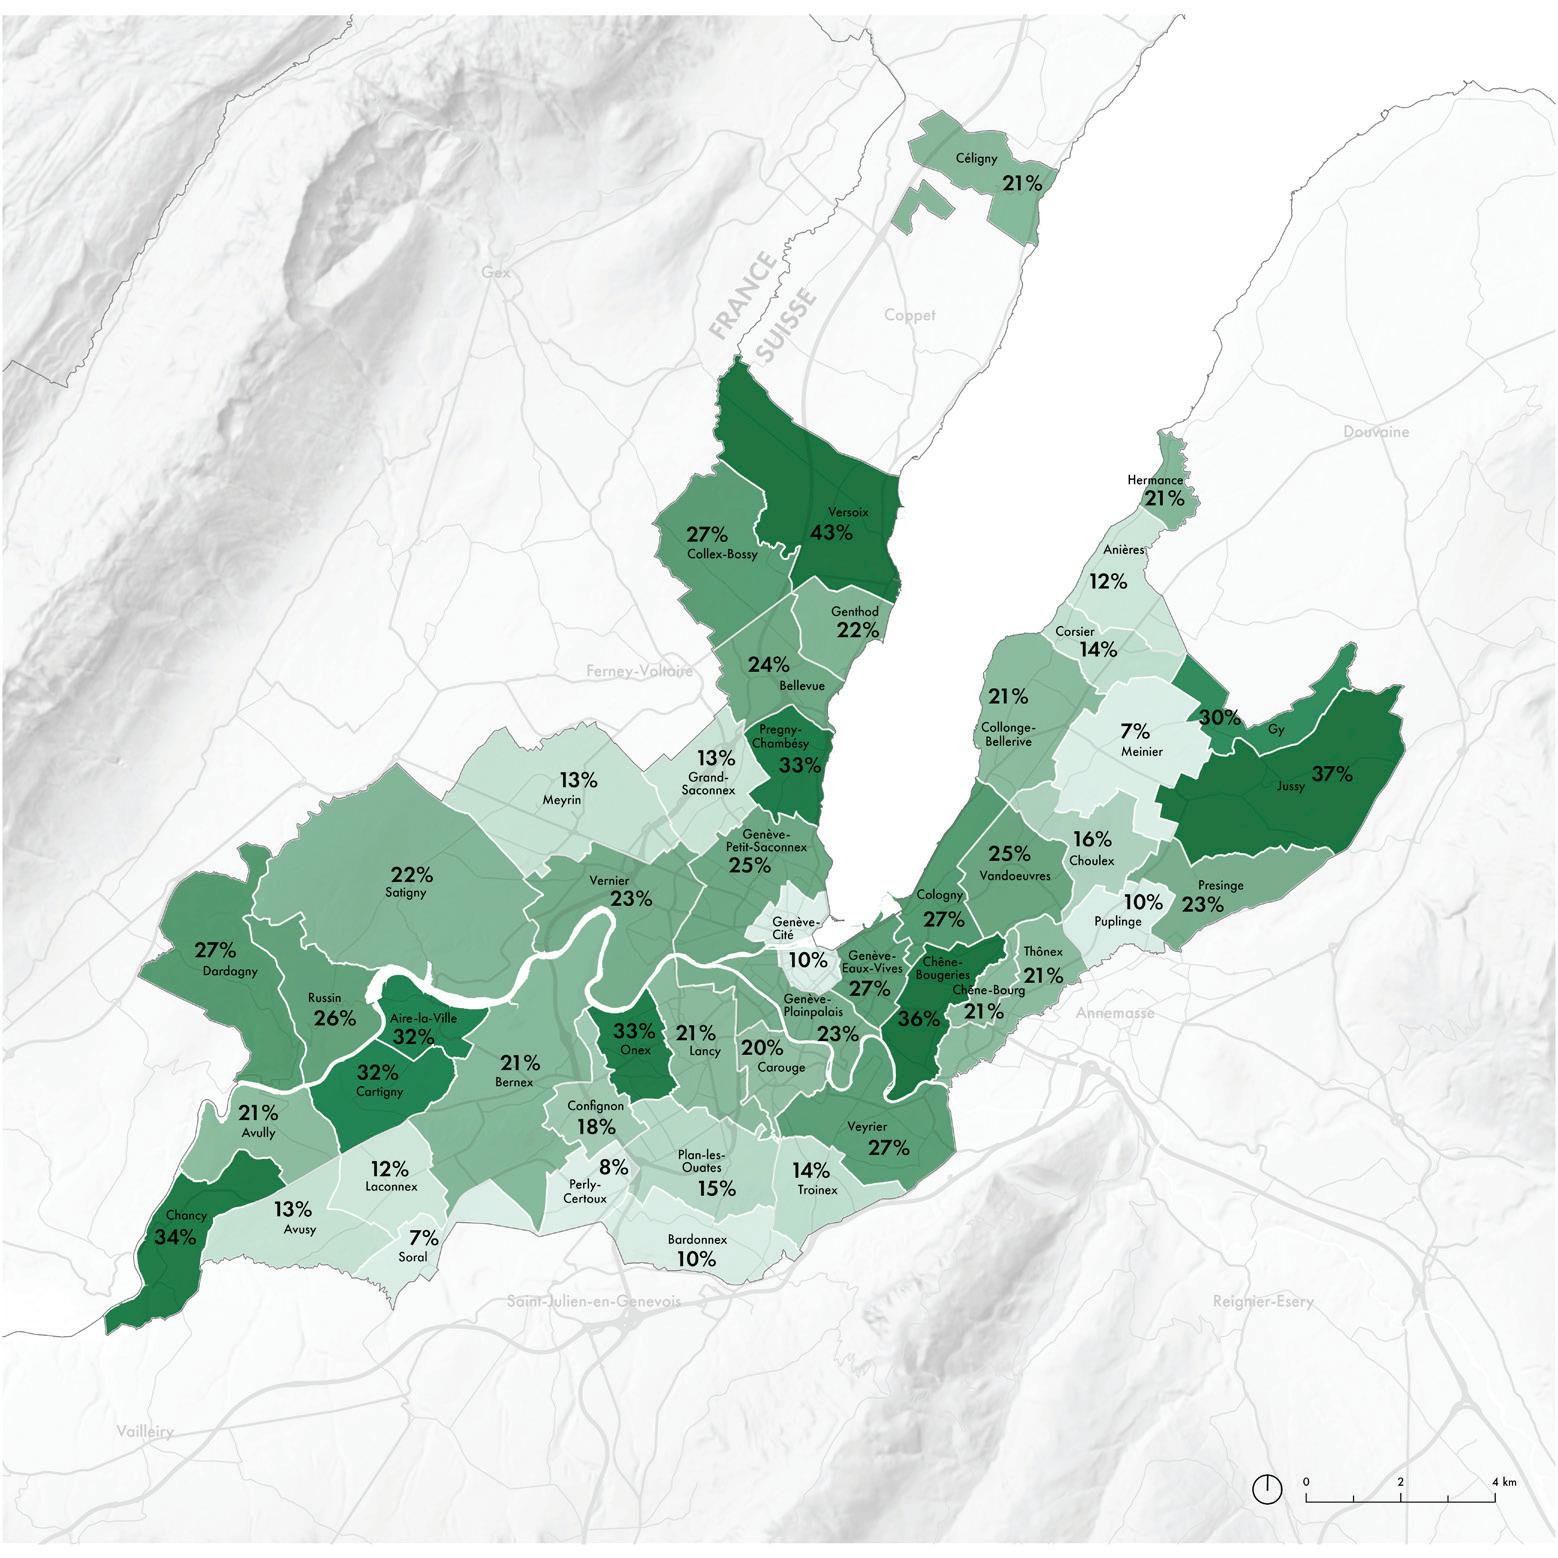
At the scale of the Canton, tree canopy increased in area by 1.0% from 21.7% to 22.7% (land area only). Most municipalities experienced relatively low degrees of canopy change, with all but 15 observing canopy change within one percentage point. Only 6 municipalities observed change greater than two percentage points — all positive.
The greatest positive change was observed in the municipality of Russin, particularly within large forestry plots. The greatest negative change was observed in the city of Geneva in Geneve-Eaux Vives, where loss of coverage is attributed mostly
to the removal of street trees and significant urban development.
Breaking down the analysis to a ten-hectare grid, it is clear that there are areas of more intense loss counteracted by areas of more intense gain within individual municipalities. The tenhectare cells with the greatest loss suggest areas for futher investigation to determine causes of tree loss, for example due to development, declining health, or other factors between 2013 and 2023.
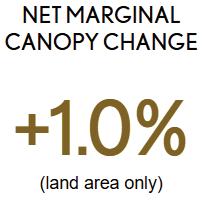
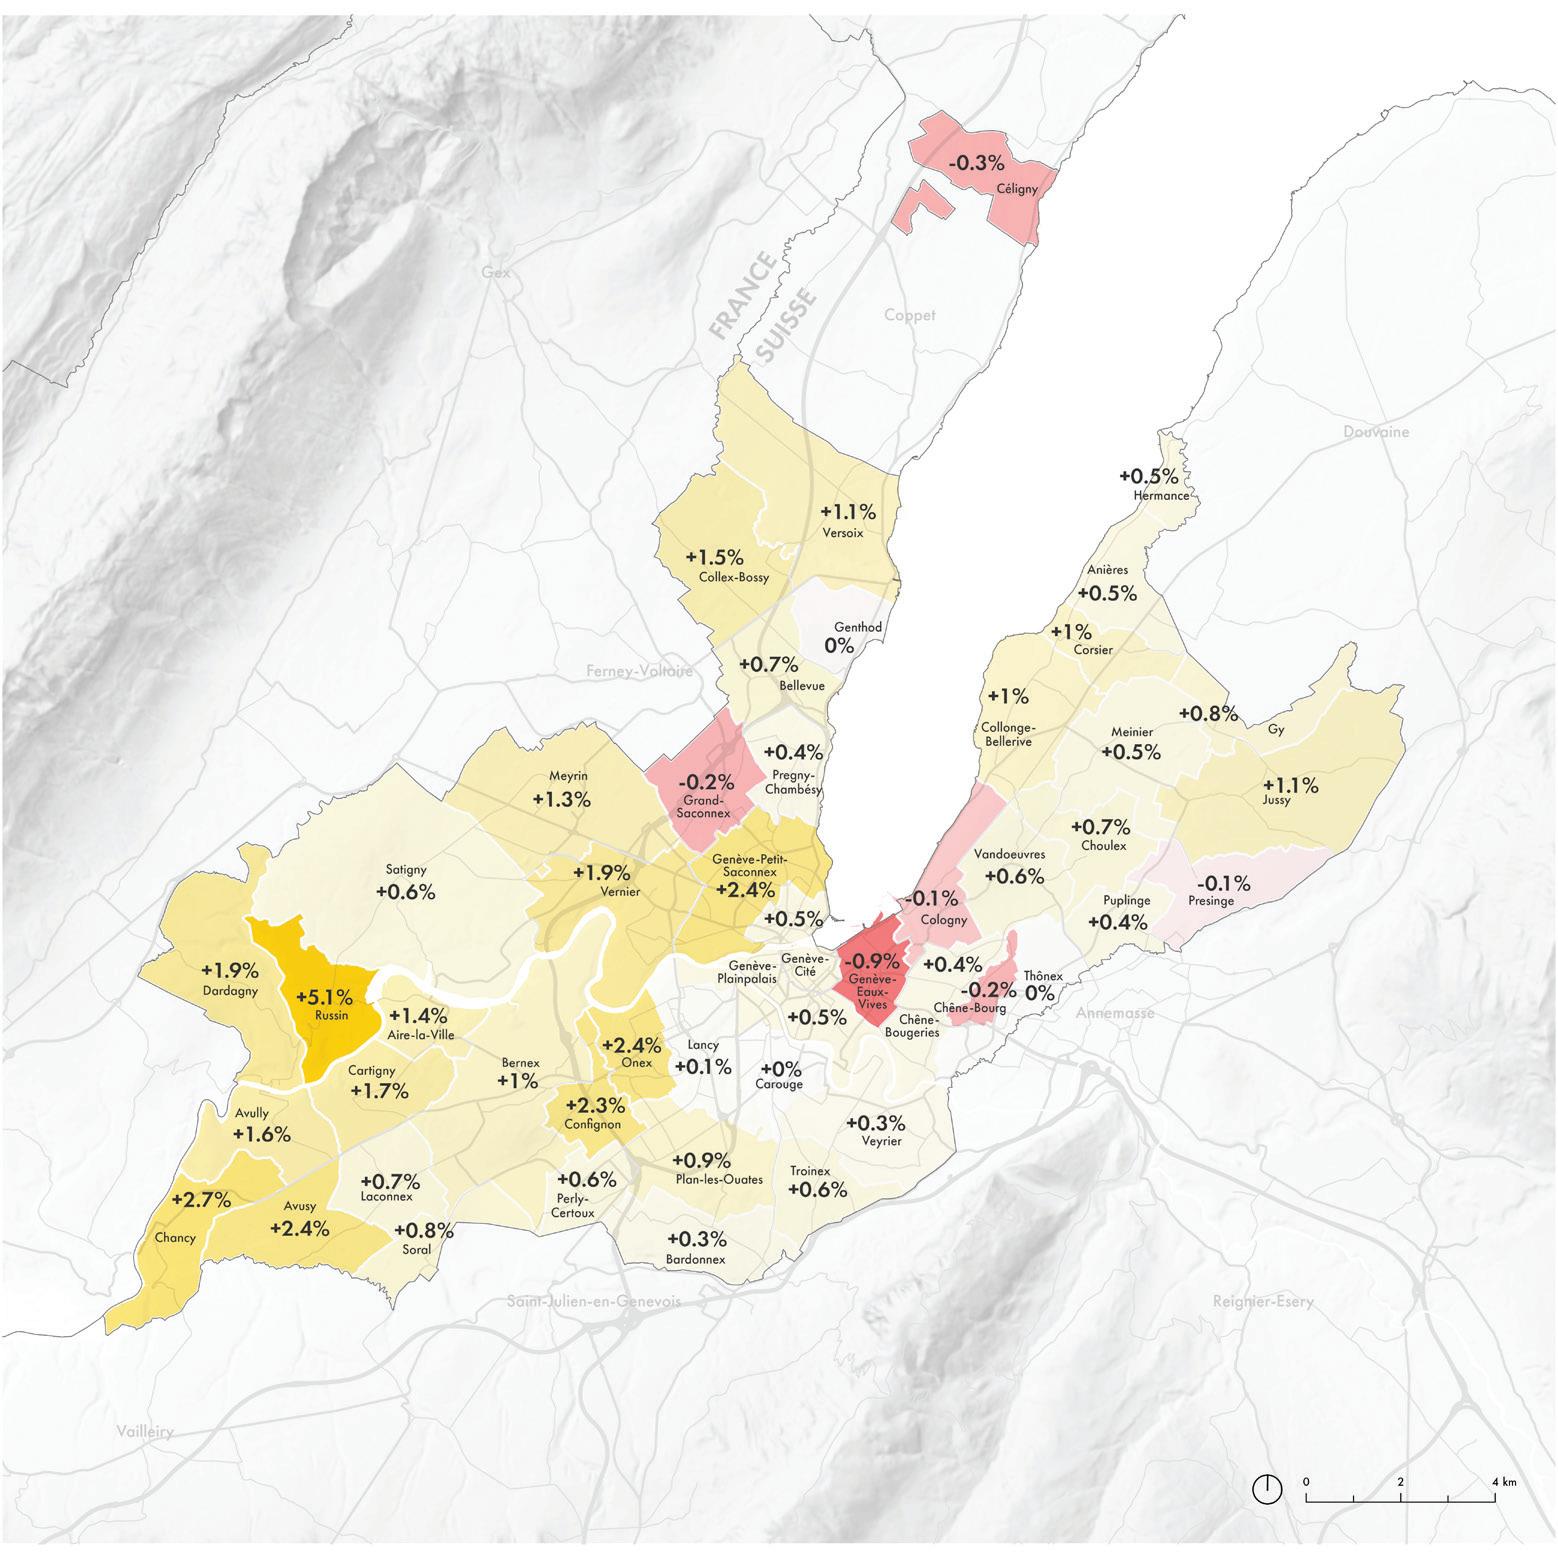

Canopy Change 2013-2023 per ten-hectare area
Data - Système d’information du territoire à Genève (SITG):
“Communes genevoises” (2025).
“Nuages De Points Lidar 2013.”
“Modèle Numérique De Surface De Canopée - État 2023”
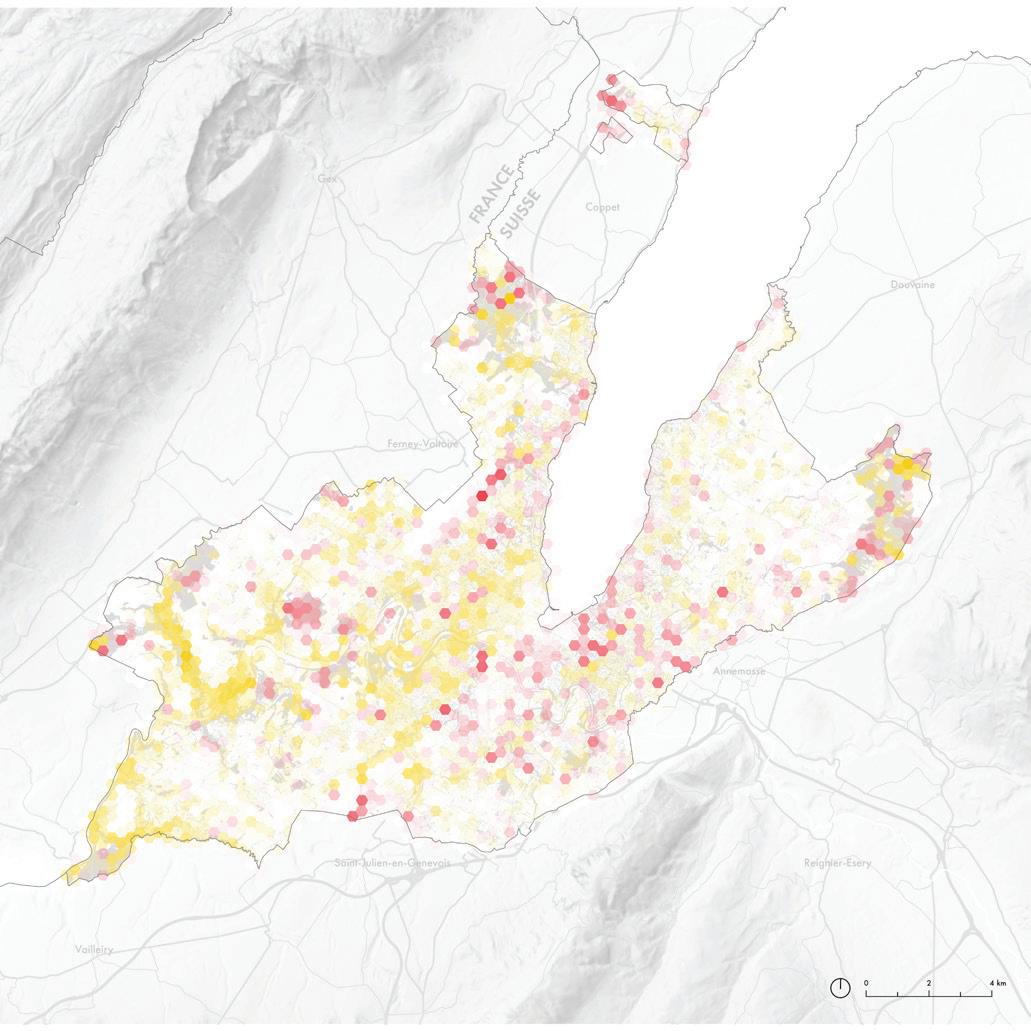
When broken down by land surface cover, canopy was observed to increase most on green surfaces and to decrease most on (non-hardscape) vegetation-free surfaces at both the city and cantonal scale. While the magnitude of loss on vegetation-free surfaces was high, those areas represent a relatively small proportion of the land area of both the city and the canton.
At the scale of the canton, it is notable that green surfaces make up more than half of the Geneva’s area, but have only 9.7% canopy cover by canopy in 2023. Meadow and pastureland make up the majority of this surface type and nearly onethird of the canton. Meadow and Pasture are only 2.2% covered. This indicates that there is an opportunity to introduce agroforestry practices into these productive landscapes to increase canopy cover across the canton.
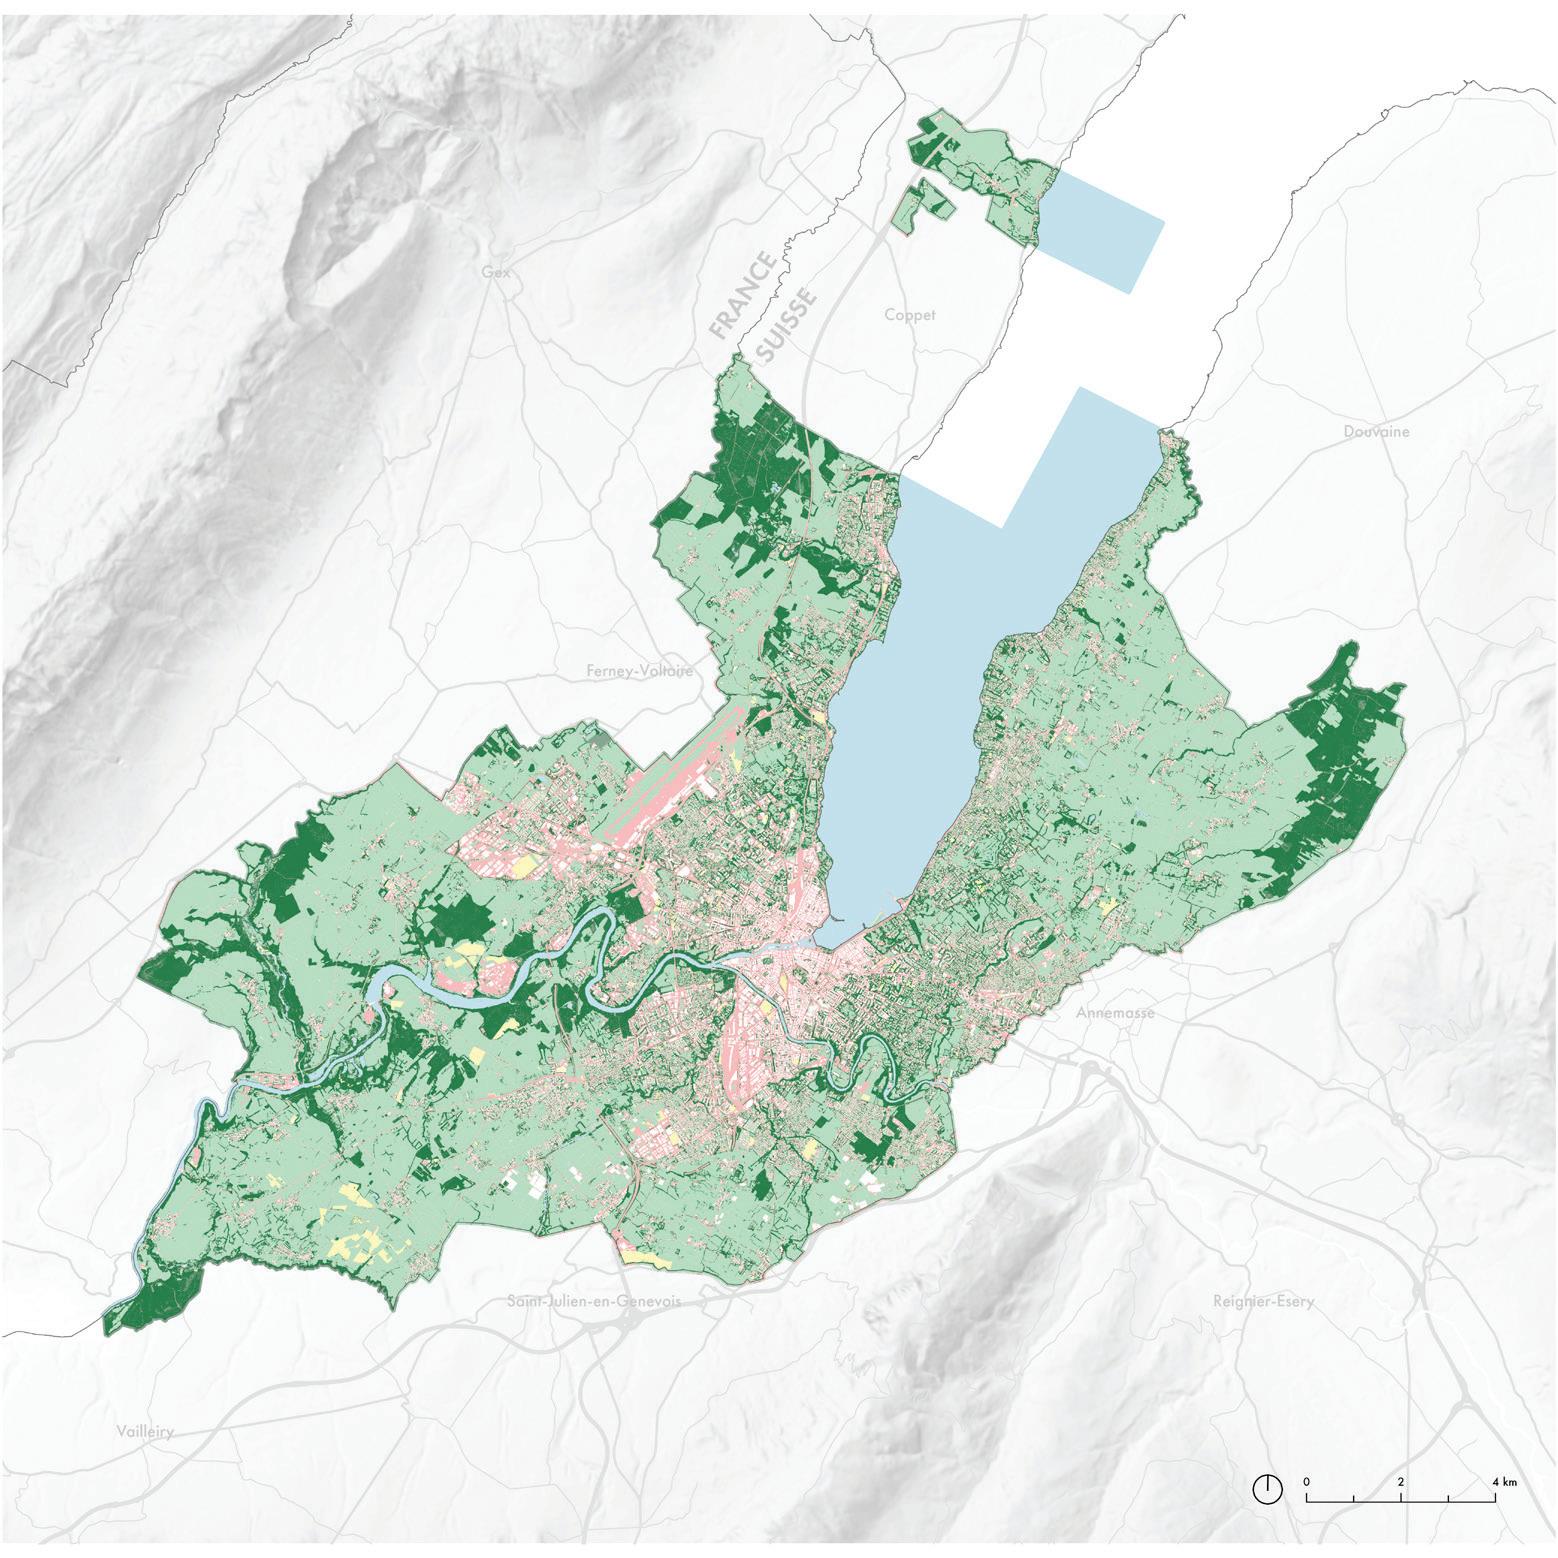
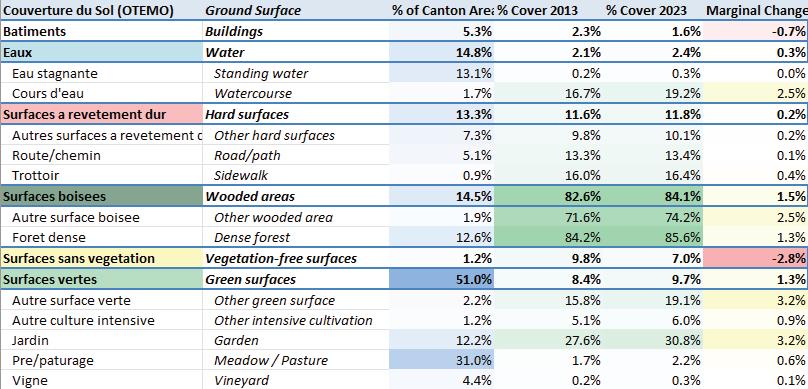
At the scale of the city, it is notable that there was no net change to canopy cover over wooded areas. Also, that net canopy cover over roads and paths grew very little between 2013 and 2023. As paved roads make up nearly one-fifth of the city’s surface cover and a larger portion of its public realm, this is an area that should be focused on for urban forest strategies that increase canopy cover.
Data: Système d’information du territoire à Genève (SITG). “Couverture du sol selon classification OTEMO” (2025) “Nuages De Points Lidar 2013.”
“Modèle Numérique De Surface De Canopée - État 2023”
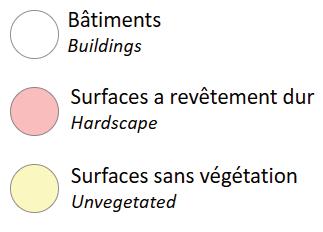
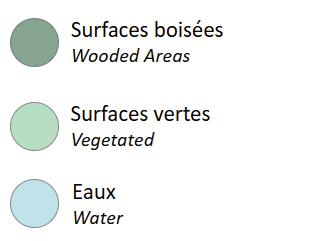
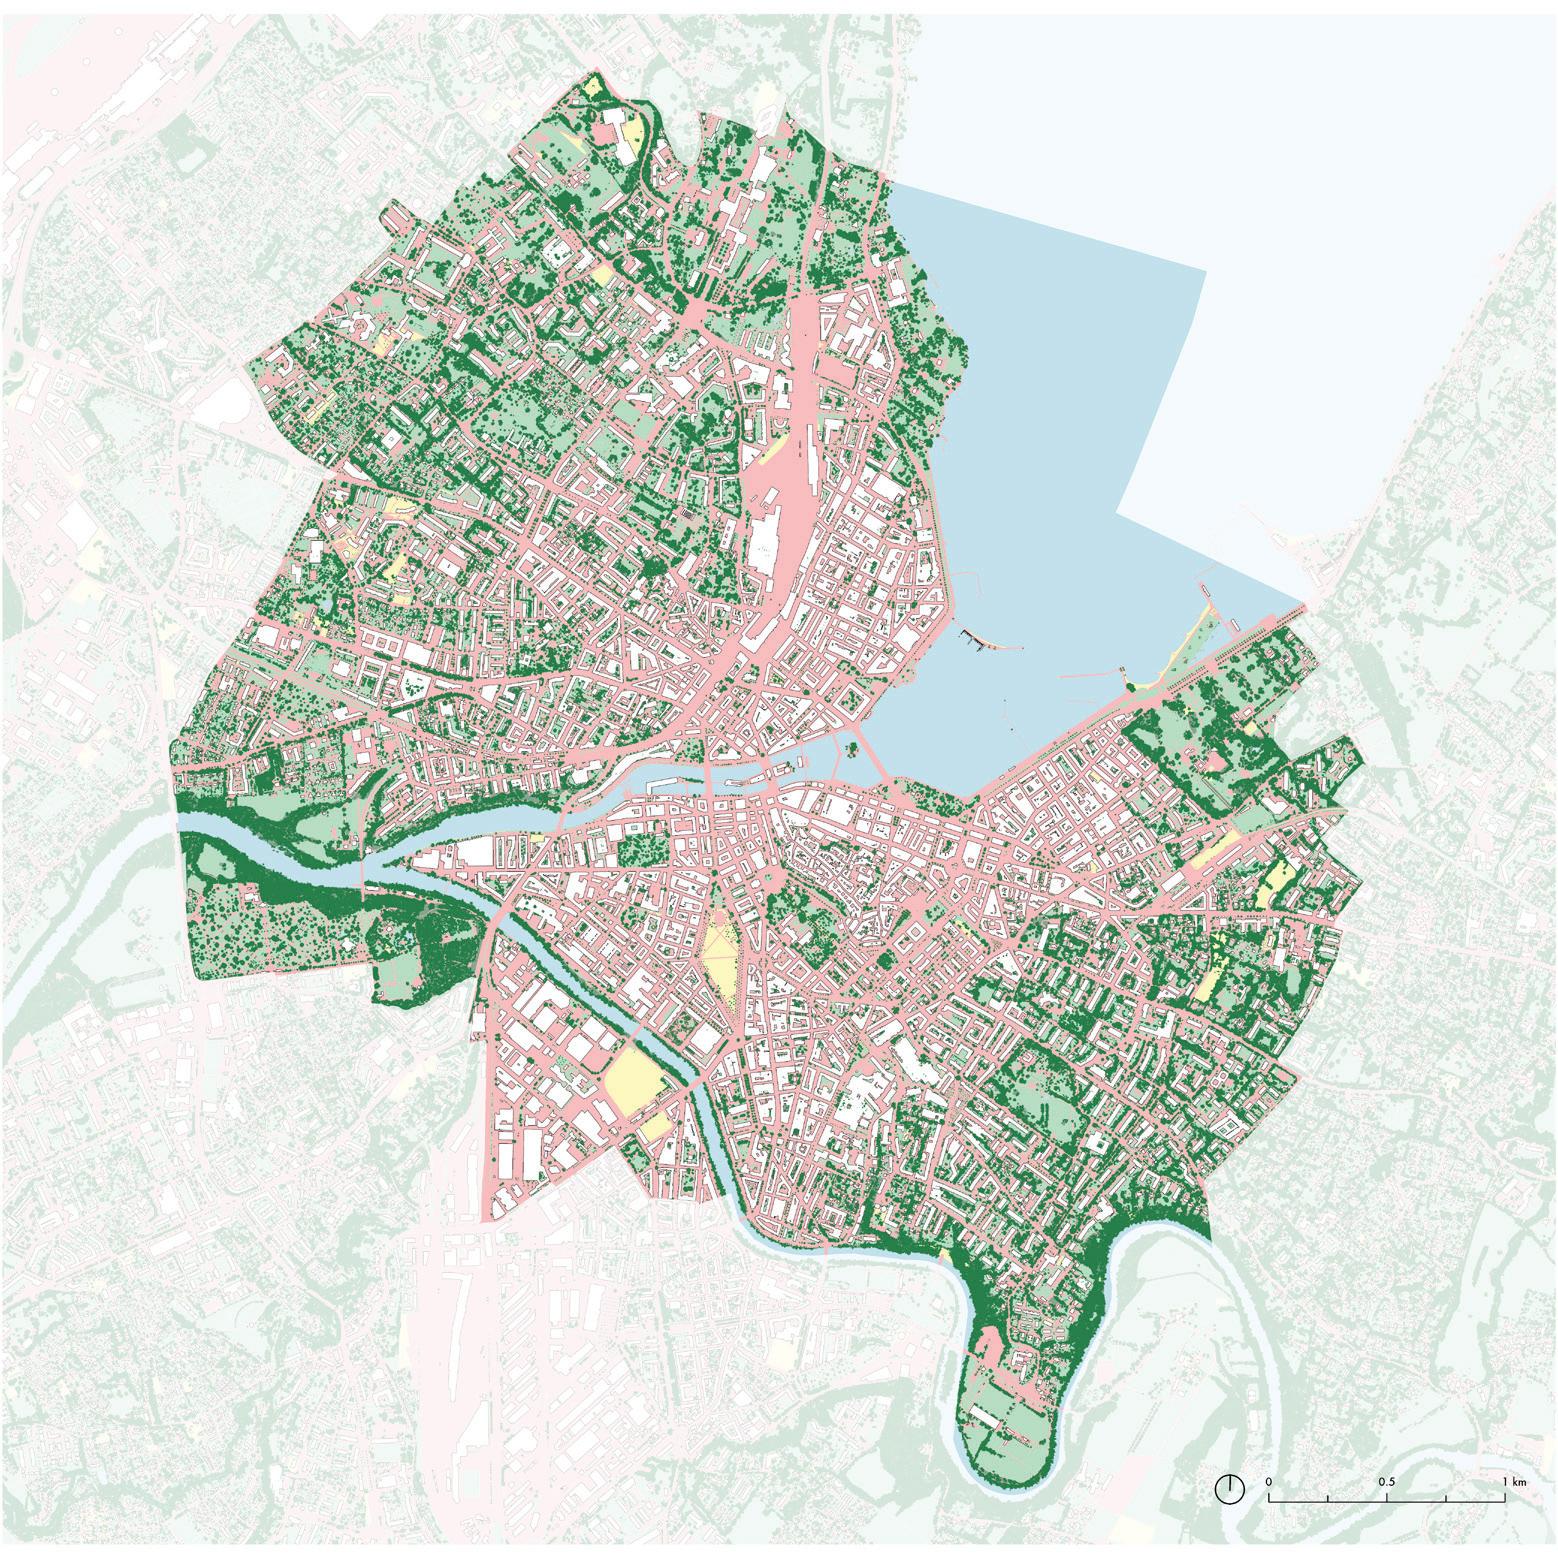
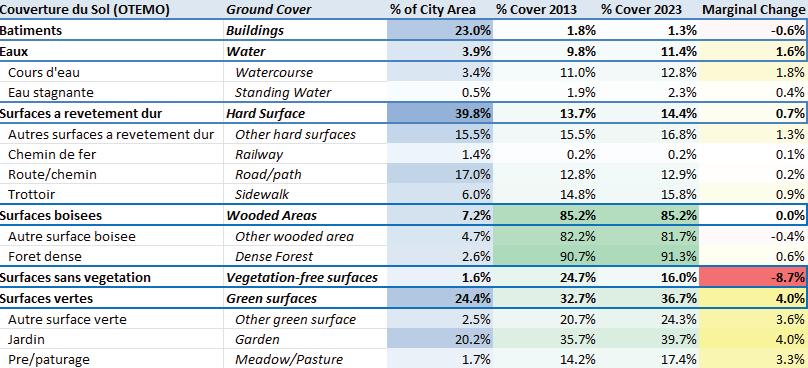
When broken down by land use zone, there were few zones that emerged at both the city and the canton scale with particularly strong association with canopy change. In both cases, zones designated as green space had strong growth, while woodlands had positive growth at the canton scale and loss at the city scale.
At both the city and canton scale, areas of opportunity can be found in urban districts with large land area and relatively slow canopy growth — such as mid-density zone 3 and low-density zone 5. And, in both cases, zones of development could be better leveraged as areas of focus for canopy growth, as development can be regulated and designed to include high-impact urban forestry projects.
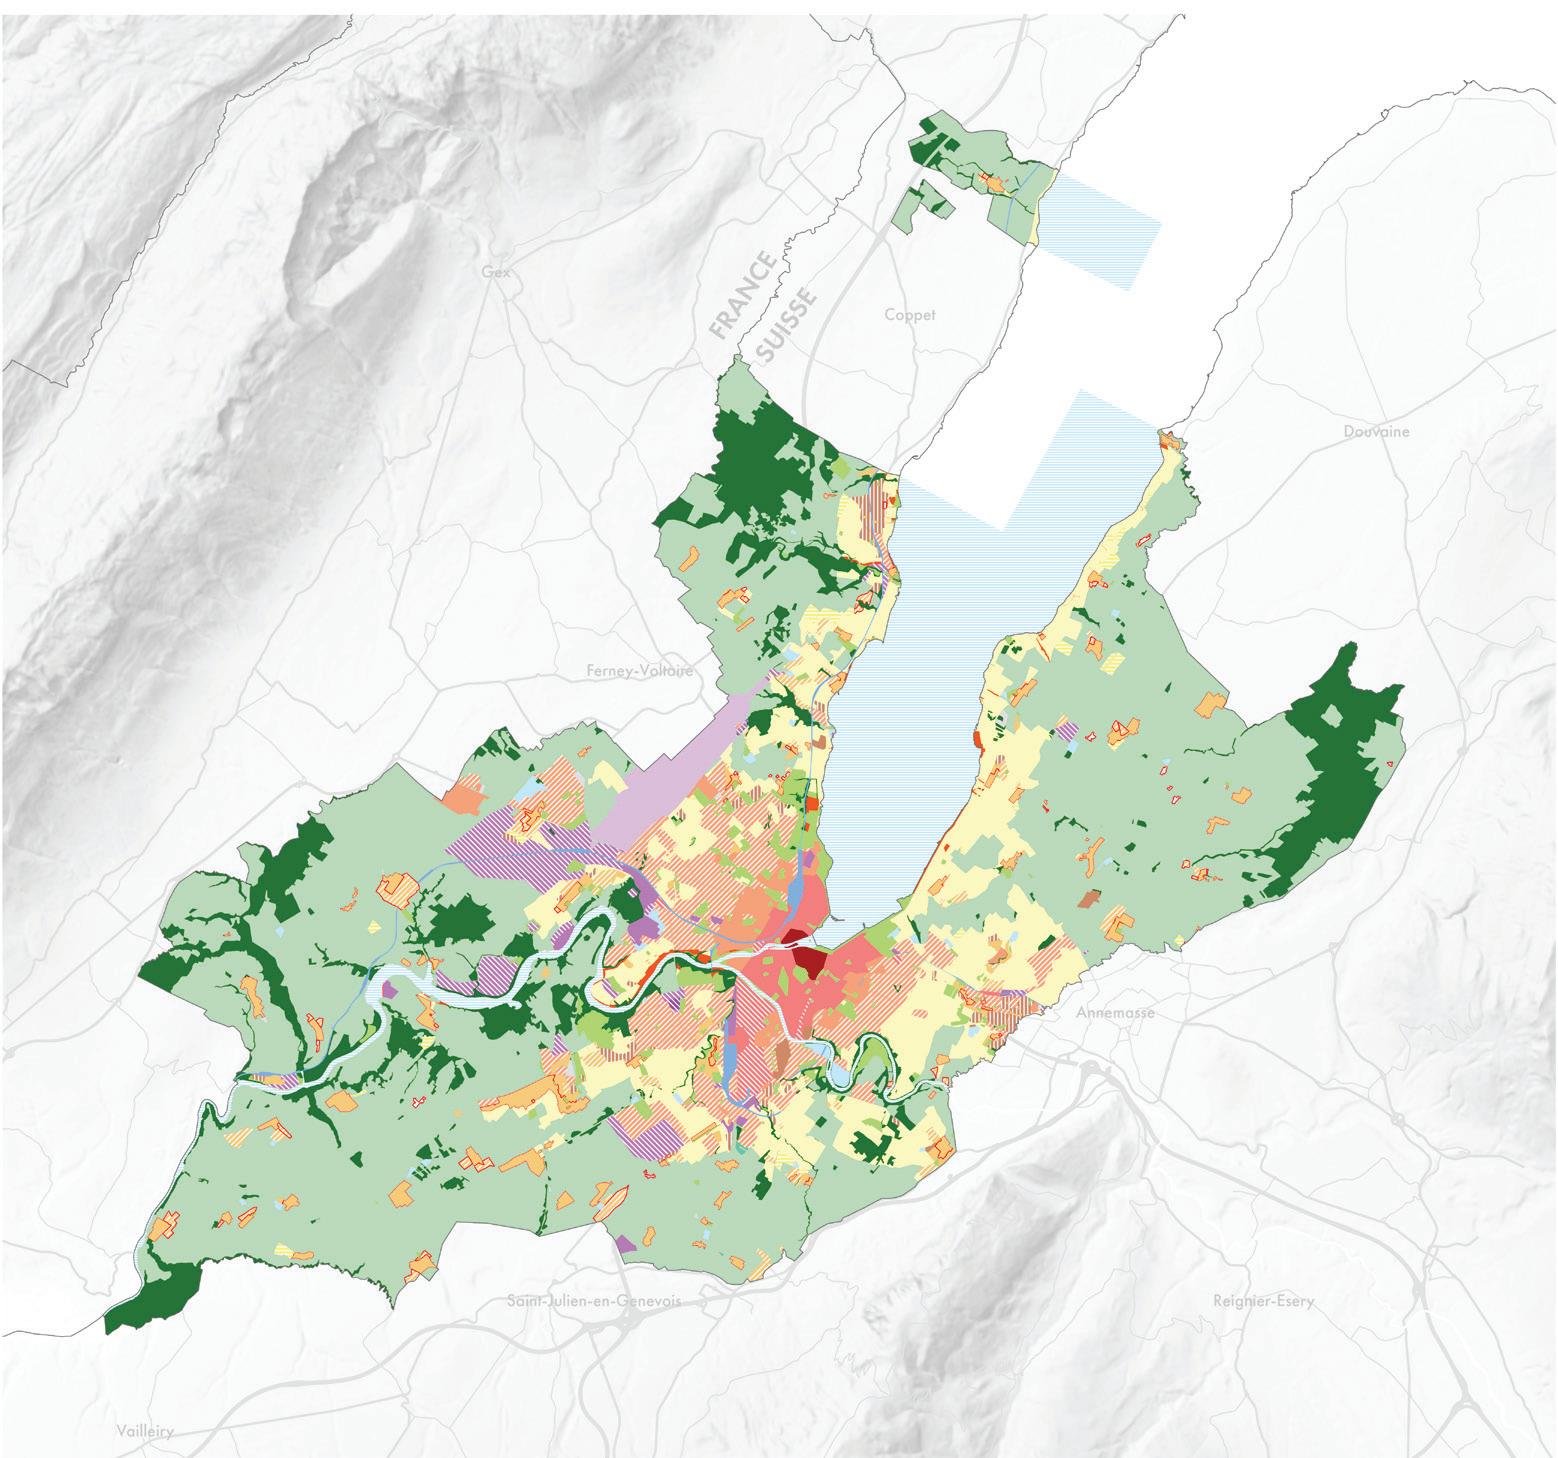
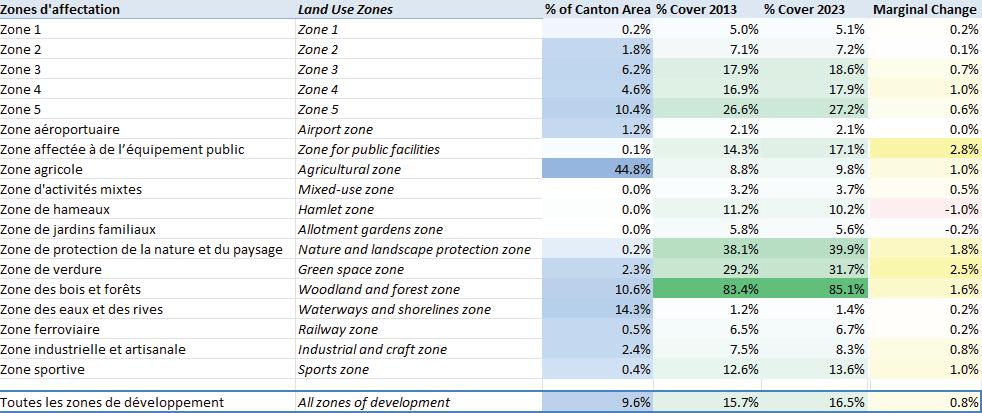
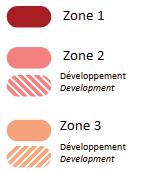

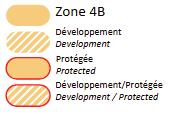
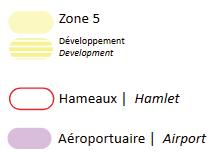


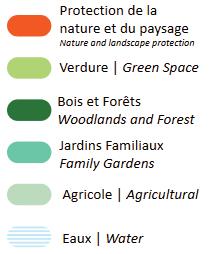


Data: Système d’information du territoire à Genève (SITG). “Zones d’affectation” (2025); “Nuages De Points Lidar 2013.” “Modèle Numérique De Surface De Canopée - État 2023”
This baseline analysis of canopy area cover in Geneva sets the stage for understanding where the urban forest is today, how it is changing, and what spaces might be investigated for prioritization and design intervention.
Establishing this baseline knowledge is important as cities increasingly use canopy percentage goals to drive broader public health and equity strategies. Studies have shown that increased canopy cover correlates with reduced mortality from heat and air pollution, improved cardiovascular and metabolic health, and stronger community cohesion — especially in low-income neighborhoods where these benefits are most needed (Kondo et al., 2020; Ulmer et al., 2016; Ziter et al., 2019).
Urban Tree Canopy assessments like this are critical to identifying priority areas for planting and care, linking tree cover expansion directly to climate adaptation and public health outcomes. They are focused not only on describing what is happening, but locating why it is happening, so we can focus on actors and actions that shift trajectories of loss to leverage potential vectors of growth.
A foundational understanding of canopy area cover is also used to support a more collaborative mode of planning and design for the urban forest. Tree canopy analysis that reveals spatial components of urban forest health can help stakeholders—across agencies, organizations, and communities—to align tree planting and preservation efforts with diverse urban goals. This type of analysis facilitates not only more informed decisions, but also greater coordination in achieving sustainability, resilience, and livability targets (Locke et al., 2013; Locke & Grove, 2016).
Finally, when analyzed in combination with land use, impervious surface, socioeconomic, and ecological data, an Urban Tree Canopy assessment based on canopy area becomes a strategic tool for setting goals in parallel with other drivers of urban change. This analysis is a primer for more directed studies undertaken by students in
this course: that combine an understanding of canopy cover area with factors such as regional urbanization, hydrologic planning, climate adaptation, and species diversity.
Data-driven approaches to Urban Tree Canopy assessments lay the groundwork for targeted action. In the following chapters, students will build upon this baseline analysis with research and recommendations on a range of dimensions key to preserve, expand, and enhance the urban forests of Geneva.
Kondo, M. C., Chen, J. T., Branas, C. C., & South, E. C. (2020). Health impact assessment of Philadelphia’s 2025 tree canopy cover goals. The Lancet Planetary Health, 4(4), e149–e157. https://doi.org/10.1016/S25425196(20)30057-5
Locke, D. H., Grove, J. M., Galvin, M. F., O’Neil-Dunne, J. P. M., & Murphy, C. (2013). Applications of urban tree canopy assessment and prioritization tools: Supporting collaborative decision making to achieve urban sustainability goals. Cities and the Environment (CATE), 6(1), Article 7. https://digitalcommons.lmu.edu/cate/vol6/iss1/7/
Locke, D. H., & Grove, J. M. (2016). Doing the hard work where it’s easiest? Examining the relationships between urban greening programs and social and ecological characteristics. Applied Spatial Analysis and Policy, 9, 77–96. https://doi.org/10.1007/s12061-014-9130-6
Ulmer, J. M., Wolf, K. L., Backman, D. R., Tretheway, R. L., Blain, C. J., O’Neil-Dunne, J. P. M., & Frank, L. D. (2016). Multiple health benefits of urban tree canopy: The mounting evidence for a green prescription. Health & Place, 42, 54–62. https://doi.org/10.1016/j.healthplace.2016.08.011
USDA Forest Service. (2019). Urban tree canopy assessment: A community’s path to understanding and managing the urban forest (FS-1121). U.S. Department of Agriculture, Forest Service. https://www.fs.usda.gov/ sites/default/files/fs_media/fs_document/utc_assessment_fs1121_april2019.pdf
Ziter, C. D., Pedersen, E. J., Kucharik, C. J., & Turner, M. G. (2019). Scale-dependent interactions between tree canopy cover and impervious surfaces reduce daytime urban heat during summer. Proceedings of the National Academy of Sciences, 116(15), 7575–7580. https://doi. org/10.1073/pnas.1817561116
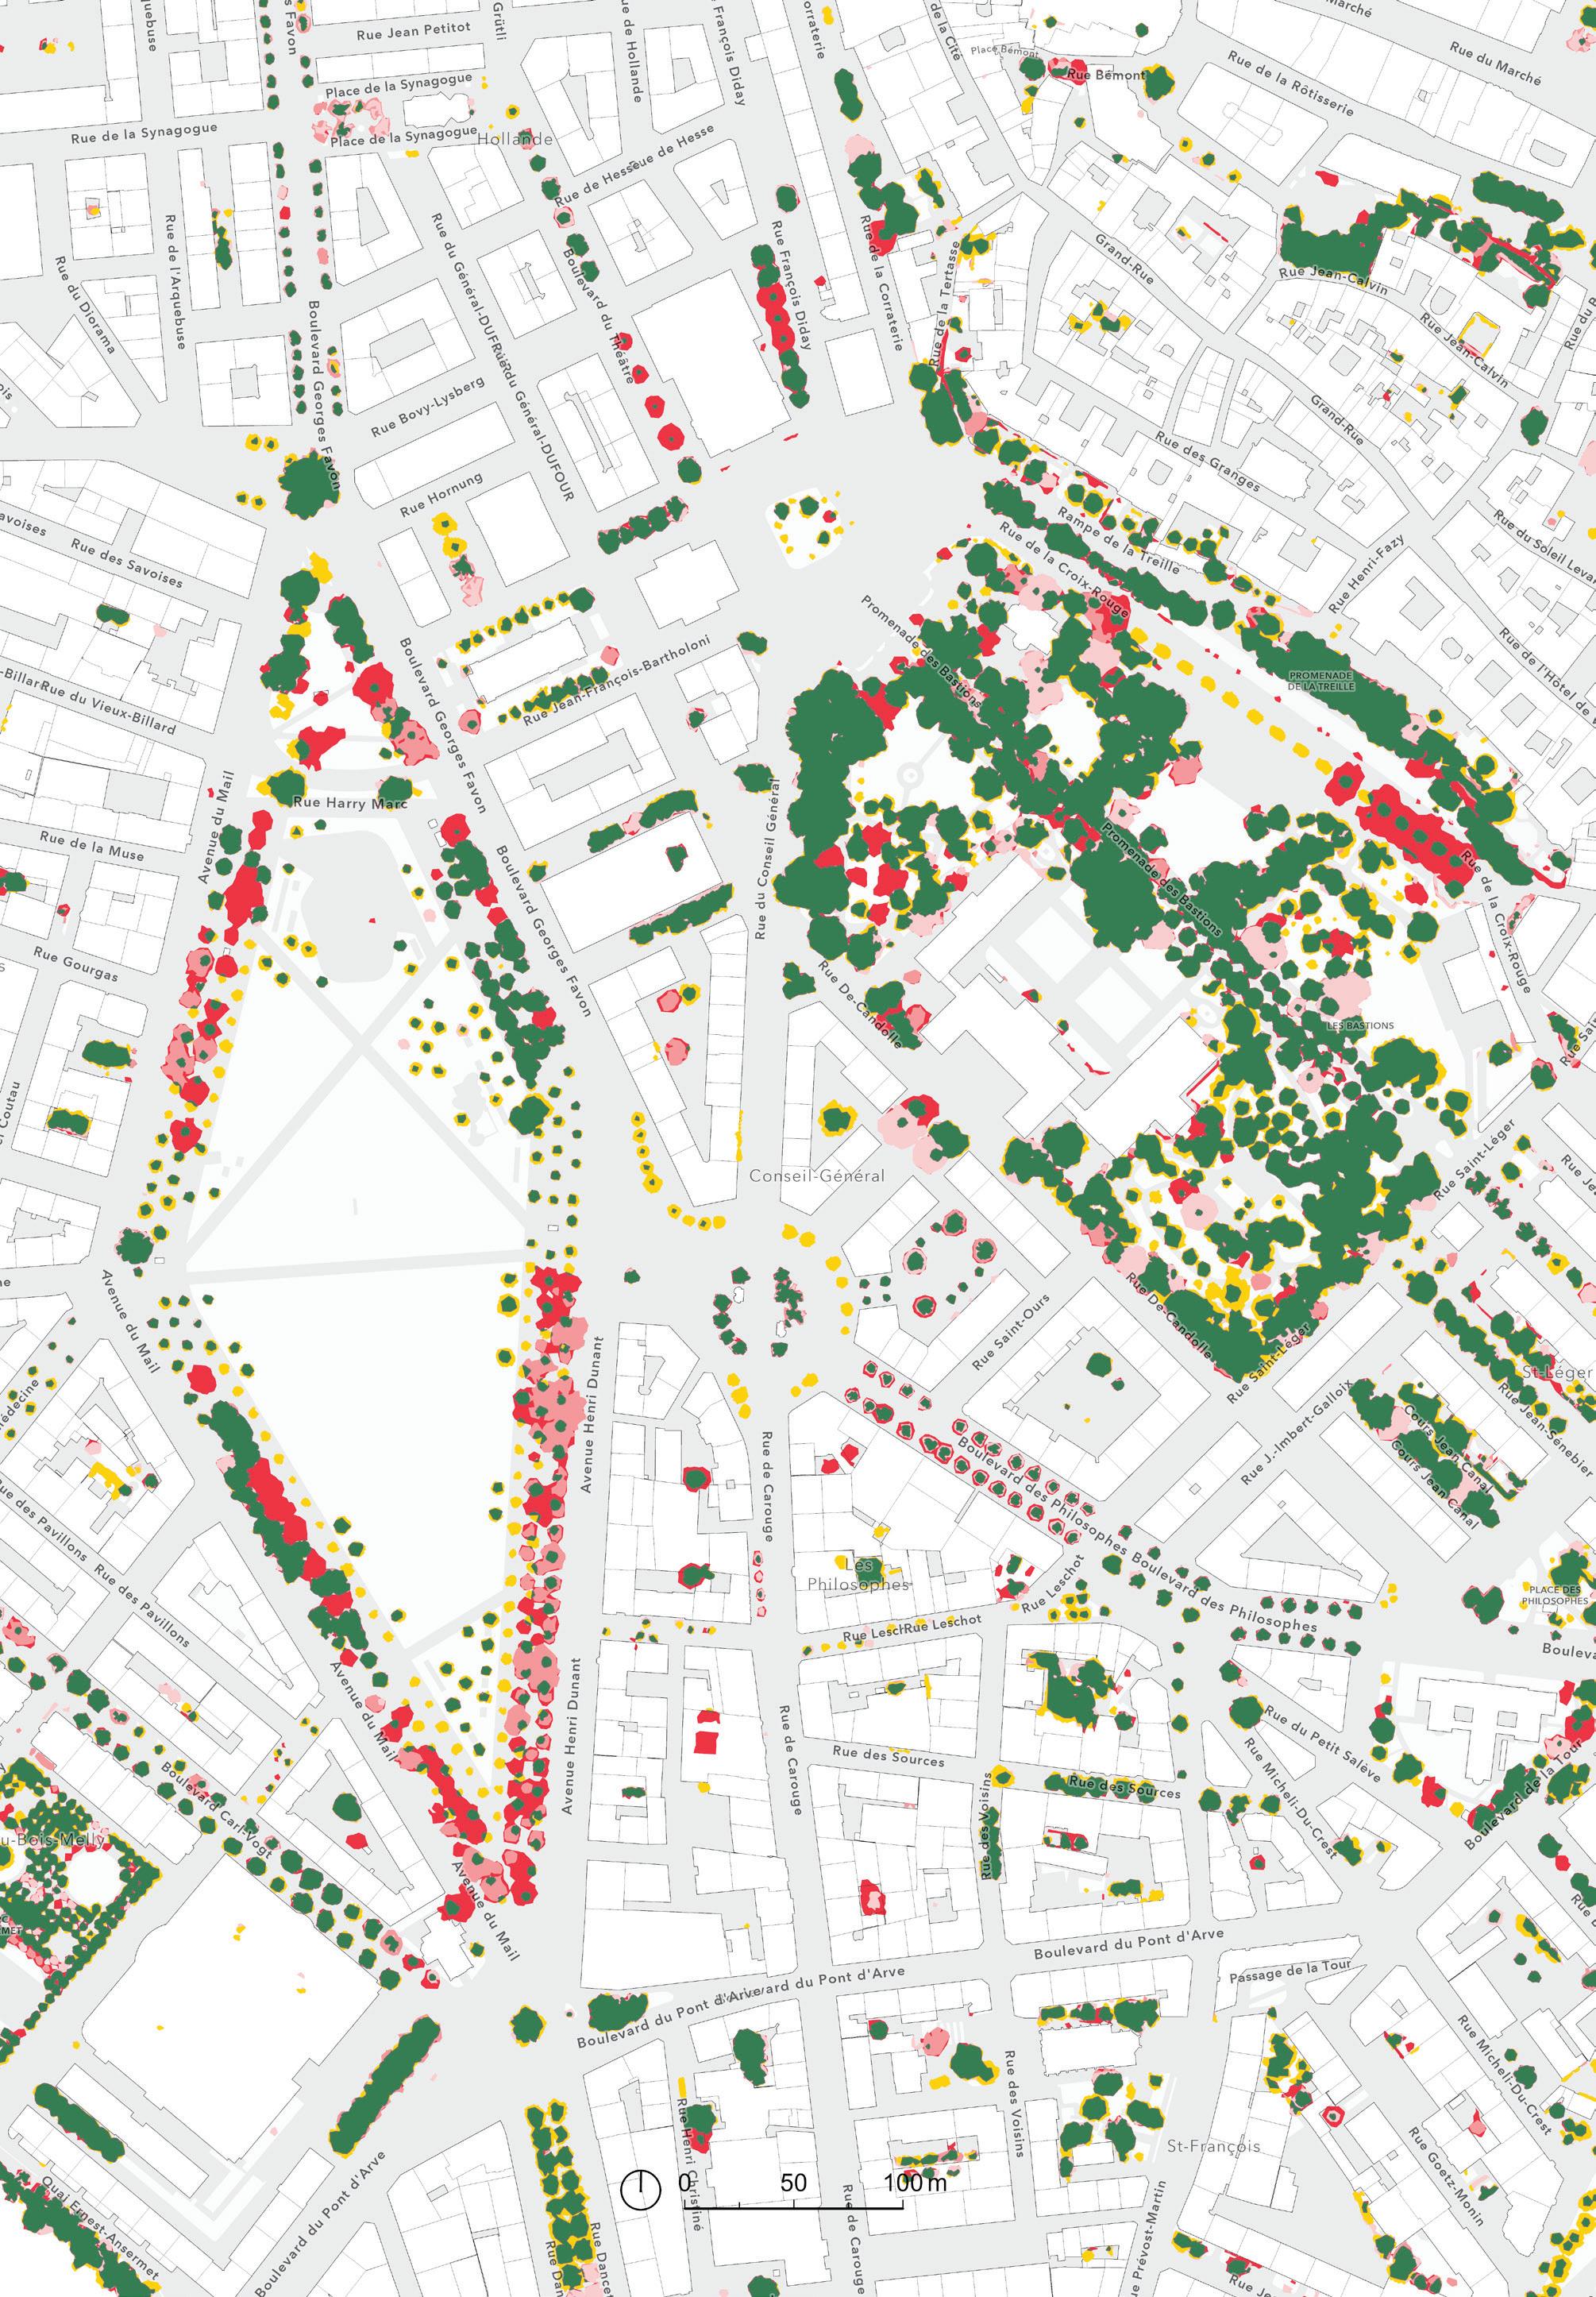
Data: Système d’information du territoire à Genève (SITG).
“Nuages De Points Lidar 2013.”
“Modèle numérique de surface de canopée - État 2017”
“Modèle numérique de surface de canopée - État 2019”
“Modèle Numérique De Surface De Canopée - État 2023”







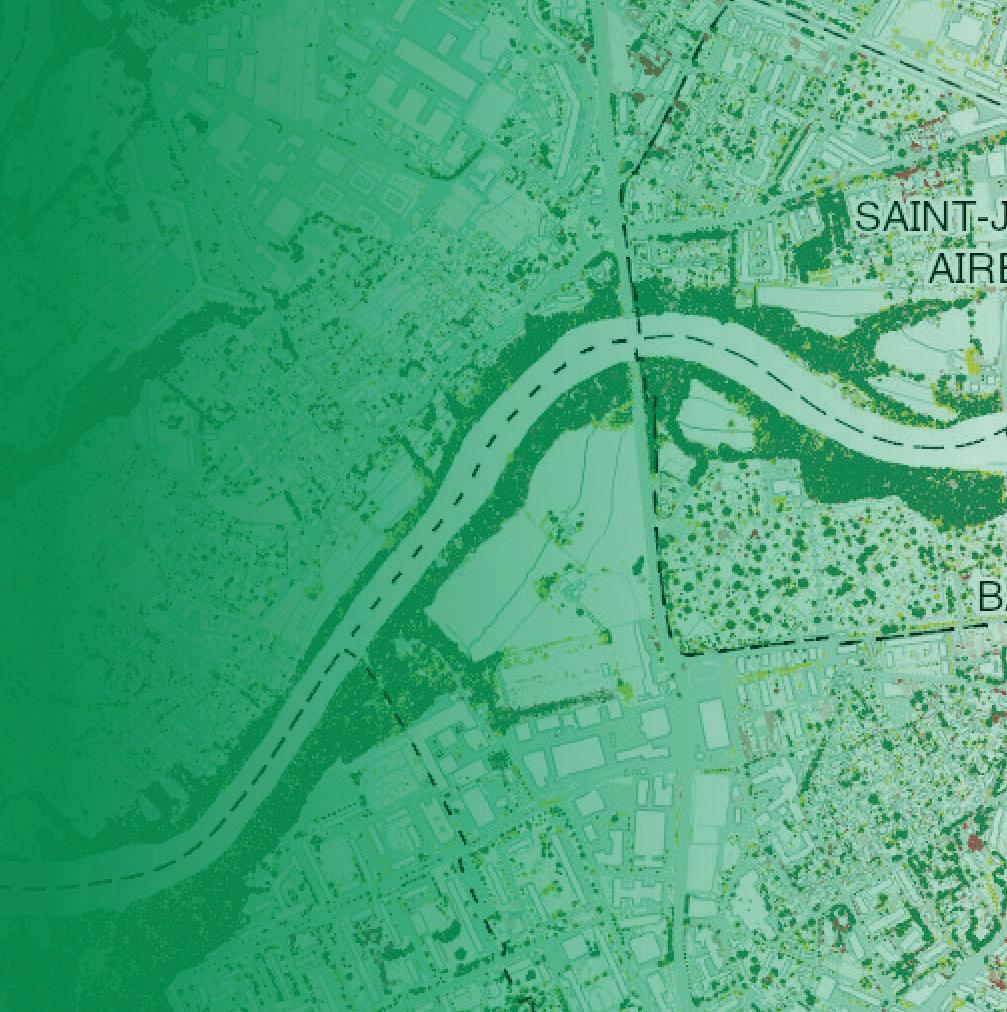
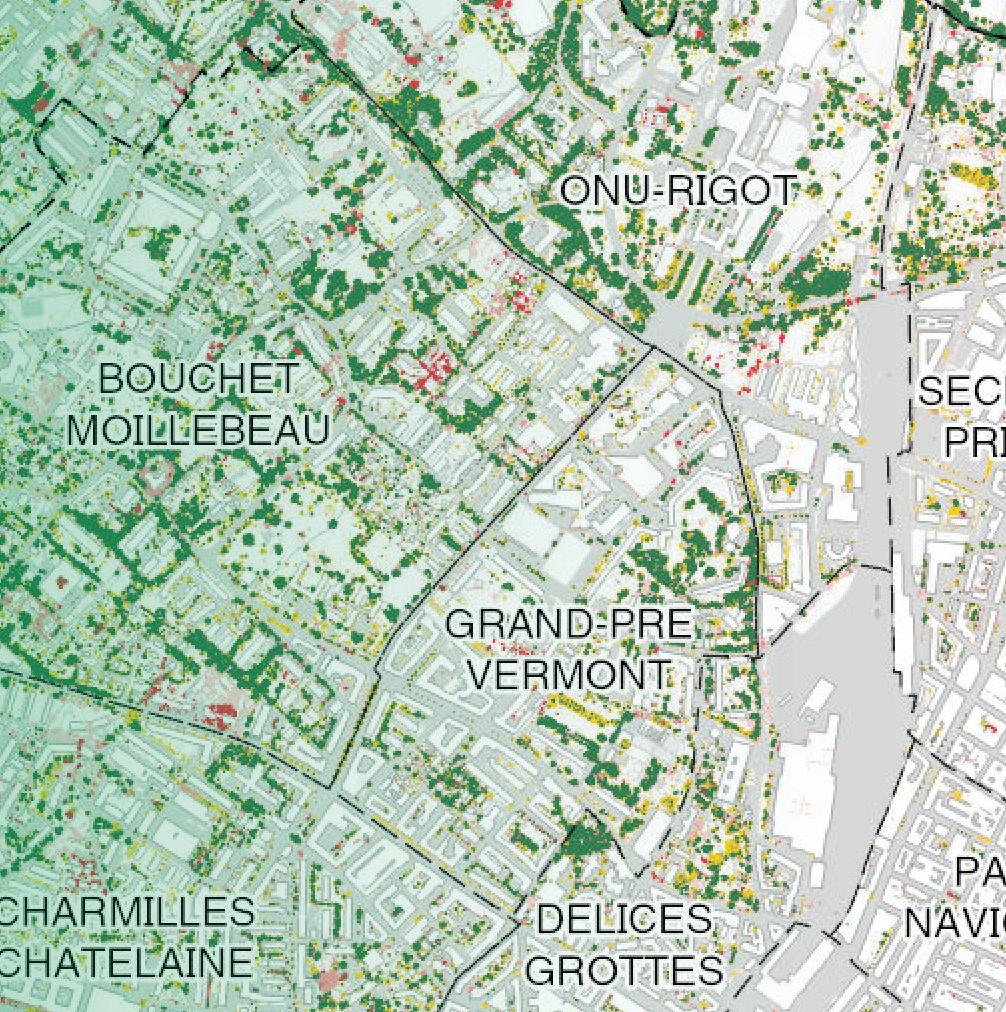

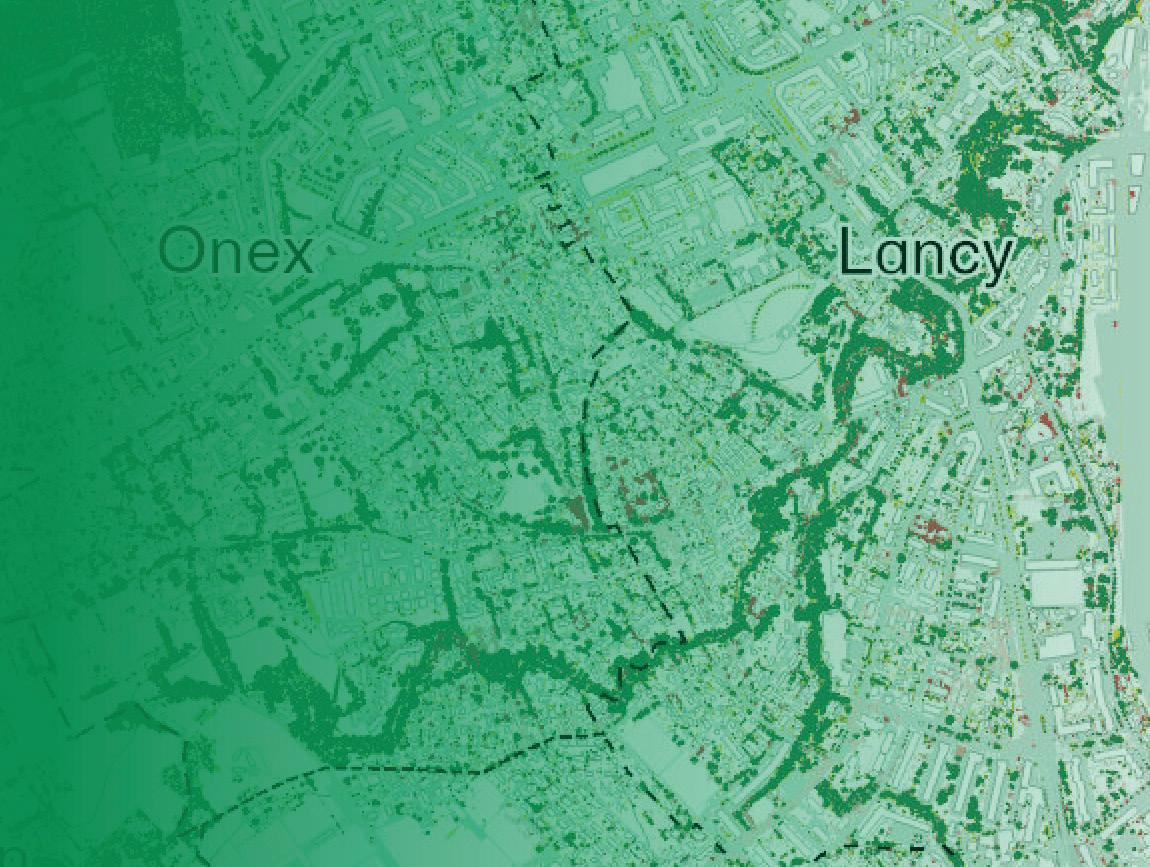



Grand Genève’s Uneven Development



Oliver Oglesby
Master in Landscape Architecture (MLA) + Master in Urban Planning (MUP) Candidate
Harvard Graduate School of Design


Transborder socioeconomic asymmetries are inscribed in the forested landscape of Greater Geneva. This research examines whether uneven development across the French–Swiss border has impacted the regional forest of the Grand Genève agglomeration. While the Cantons of Geneva and Vaud have preserved and expanded canopy cover through centralized, ecological planning, the adjacent French departments of Ain and Haute-Savoie have absorbed most population growth, often at the expense of natural landscapes. Spatial analysis of tree canopy change between 2000 and 2020 reveals that (1) Swiss territories gained canopy 20.1× faster than their French counterparts, (2) 69.2% of canopy loss was associated with transitions between agricultural and forest land, and (3) 37.8% occurred within ecological infrastructure—highlighting fragmentation even on protected lands.
To address these disparities, the study recommends a series of cross-border strategies, including (1) the creation of a Regional Forest Equity Fund to finance planting in underserved French municipalities, (2) the launch of a Grand Genève Agroforestry Program to support canopy growth in agricultural zones, and (3) the adoption of stronger Forest Natural Resource Protection Zoning to protect habitat connectivity. By aligning ecological infrastructure investments with existing urbanizationdensification projects and regional emissions reduction goals, these measures aim to support canopy equity across the agglomeration. Ultimately, the study calls for regional planning that treats forest canopy as a shared ecological resource rather than a fragmented byproduct of uneven development spanning political borders.
The Grand Genève agglomeration is characterized by one of Europe’s most significant transborder socioeconomic asymmetries. In 1997, the Livre blanc francogenevois de l’aménagement du territoire, followed by the Charte d’aménagement de l’agglomération transfrontalière franco-valdo-genevoise, established a spatial framework for binational coordination regarding infrastructural development and landscape preservation strategies. Despite debordering processes enabling economic and political integration, the Swiss Canton benefited from 89% of job creation in the last decade and preserved its landscape in the process, while the neighboring French region accommodated 75% of population growth as a detriment to its landscape—largely owing to its substantially lower property values and greater supply of affordable housing (Guichot 2024, 33, 25–26). These unequal trends pose the question:
Has uneven development impacted the regional forest of the Grand Genève agglomeration?
Considering this uneven socioeconomic development, this investigation hypothesized that tree canopy cover of the regional forest has disproportionately degraded on the French side of the agglomeration. While analysis and action can enhance the urban forest of Geneva itself, this research effort posits that the Canton of Geneva (which leads the Projet d’agglomération du Grand Genève) should also prioritize preserving and expanding canopy cover on the French side of the border, with a focus on agroforestry and ecological infrastructure across the transborder region. The report then explores the potential of regional planning and policy tools to respond to uneven canopy change throughout the agglomeration.
Grand Genève Agglomeration
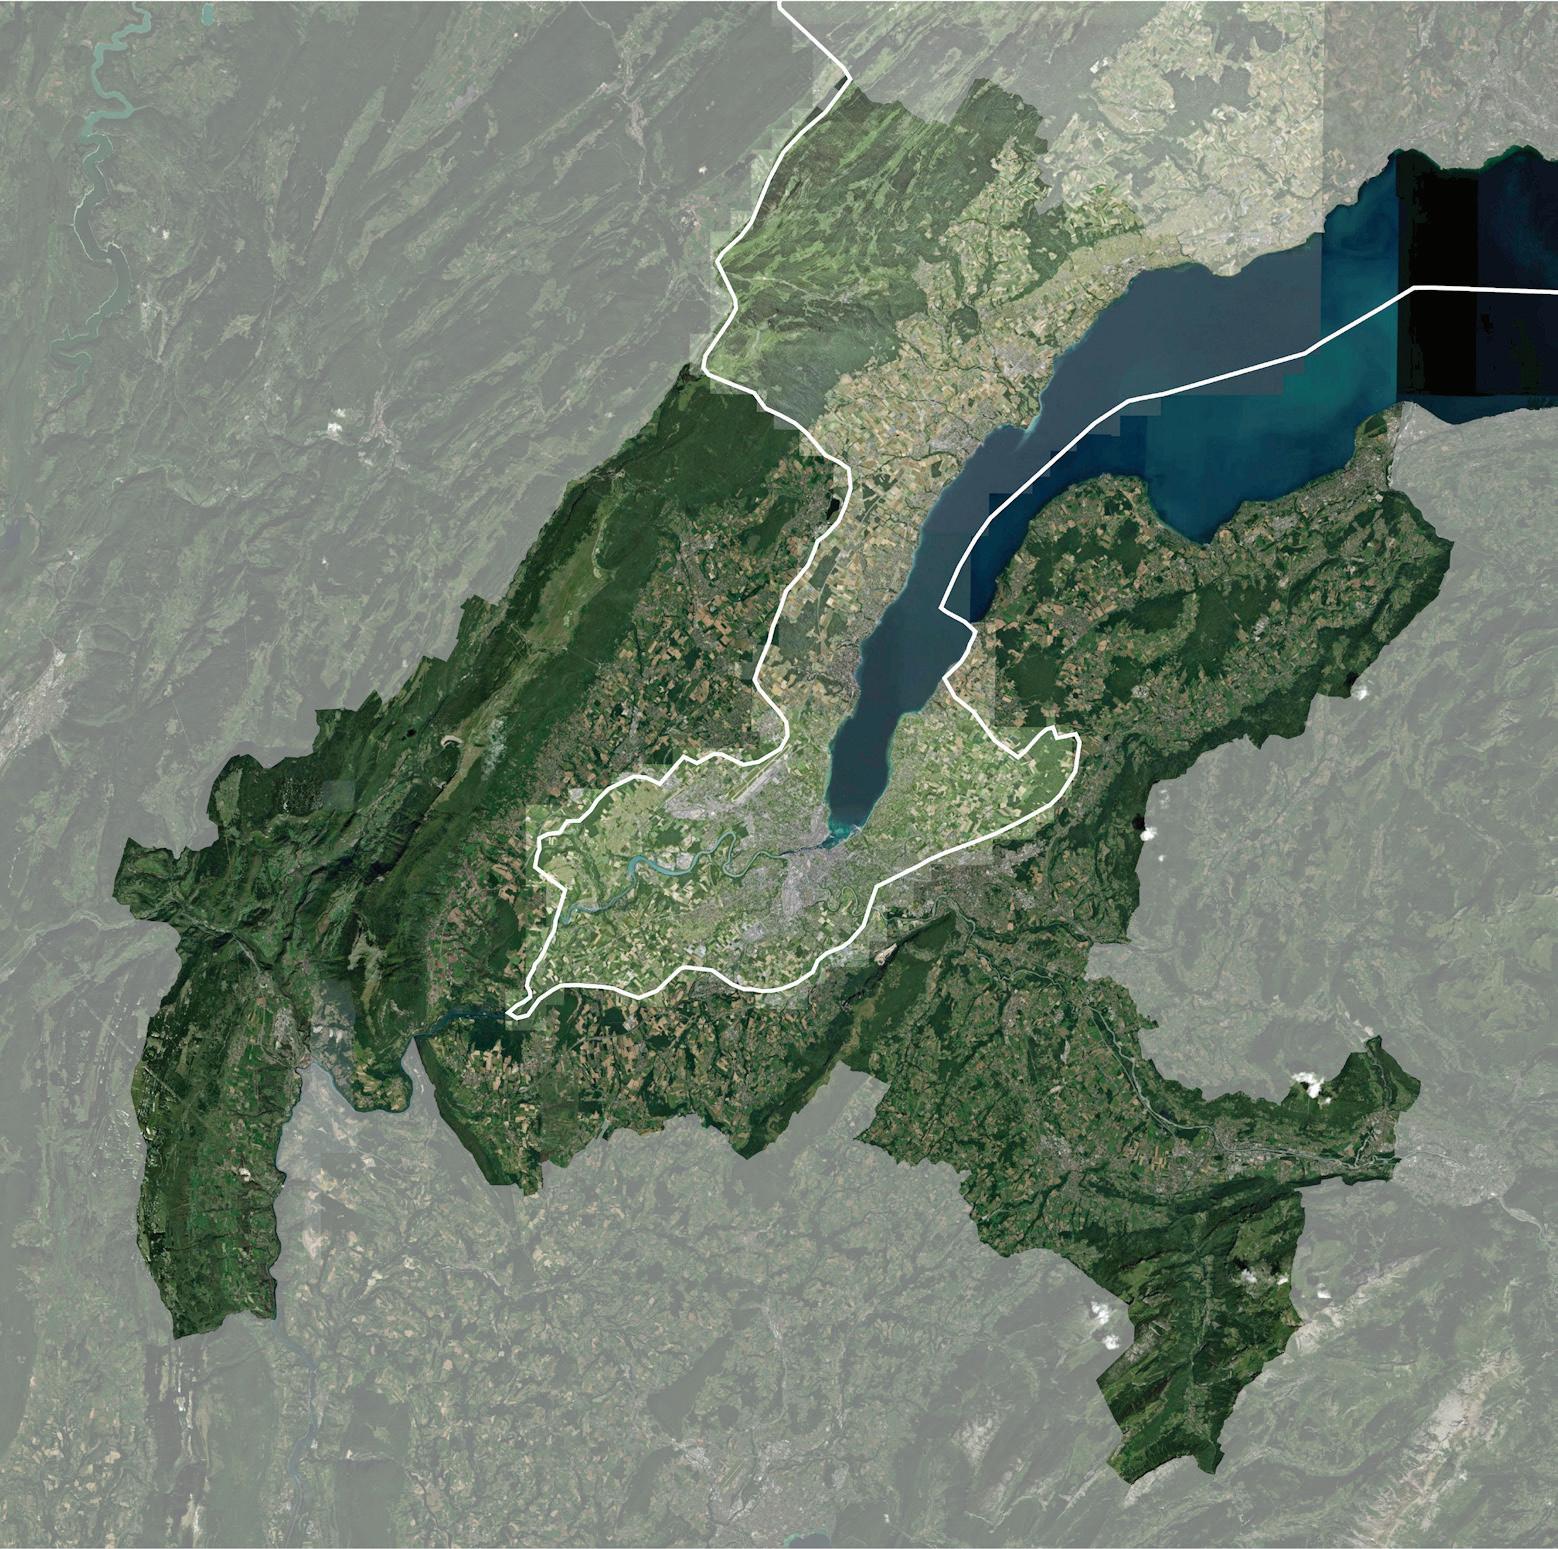
The Agglomeration Project:
Thinking at the scale of the agglomeration makes urban forestry issues a broader question of regional planning. In contrast to the urban forest, which is defined in other studies herein as limited to the City and Canton of Geneva, the regional forest encompasses the entire agglomeration of Greater Geneva. While the urban forest serves the approximately 203,000 people who live in the City of Geneva and roughly 2.5× more people who live in the Canton of Geneva, the regional forest serves over one-million people across the French-Swiss agglomeration. When accounting for the roughly 220,000 French people commuting across the border to work in Geneva daily (2024), it becomes clear that transborder canopy cover increasingly serves the entire region, especially when considering ecosystem services such as improved air quality and carbon sequestration. In parallel with the other studies that offer a fine-grain analysis of Geneva’s urban forest, this study aims to assess the state of Greater Geneva’s regional forest through the lens of tree canopy change between 2000 and 2020.
The agglomeration project was created to foster cooperation among the 2 countries, 2 Swiss cantons, 2 French departments, and 209
municipalities that constitute the region—aiming to keep uneven development in check through regional planning. Geographer Neil Smith defines uneven development as “the concrete process and pattern of the production of nature under capitalism,” not only invoking inequities inherent to the capitalist system, but also the value of nature as integral to (rather than separate from) society (Smith 1990, 25). Furthermore, uneven development operates between urban and global forces at the scale of the nation-state, such that national borders exacerbate inequities by hindering the movement of capital in and out of regions to produce conditions of development and underdevelopment (Smith 1990, 285, 293). Hence, differing economic models, labor markets, welfare systems, dominant industries, trade integration, and monetary policies are inscribed by the border and shape the respective environments. Through the Local Cross-Border Cooperation Group (the political body of Greater Geneva) and its “agglomeration projects” (Figure 2), project owners implement urbanization, transportation, and landscape measures in exchange for Swiss federal funding of transportation elements for regional integration (GLCT 2025).
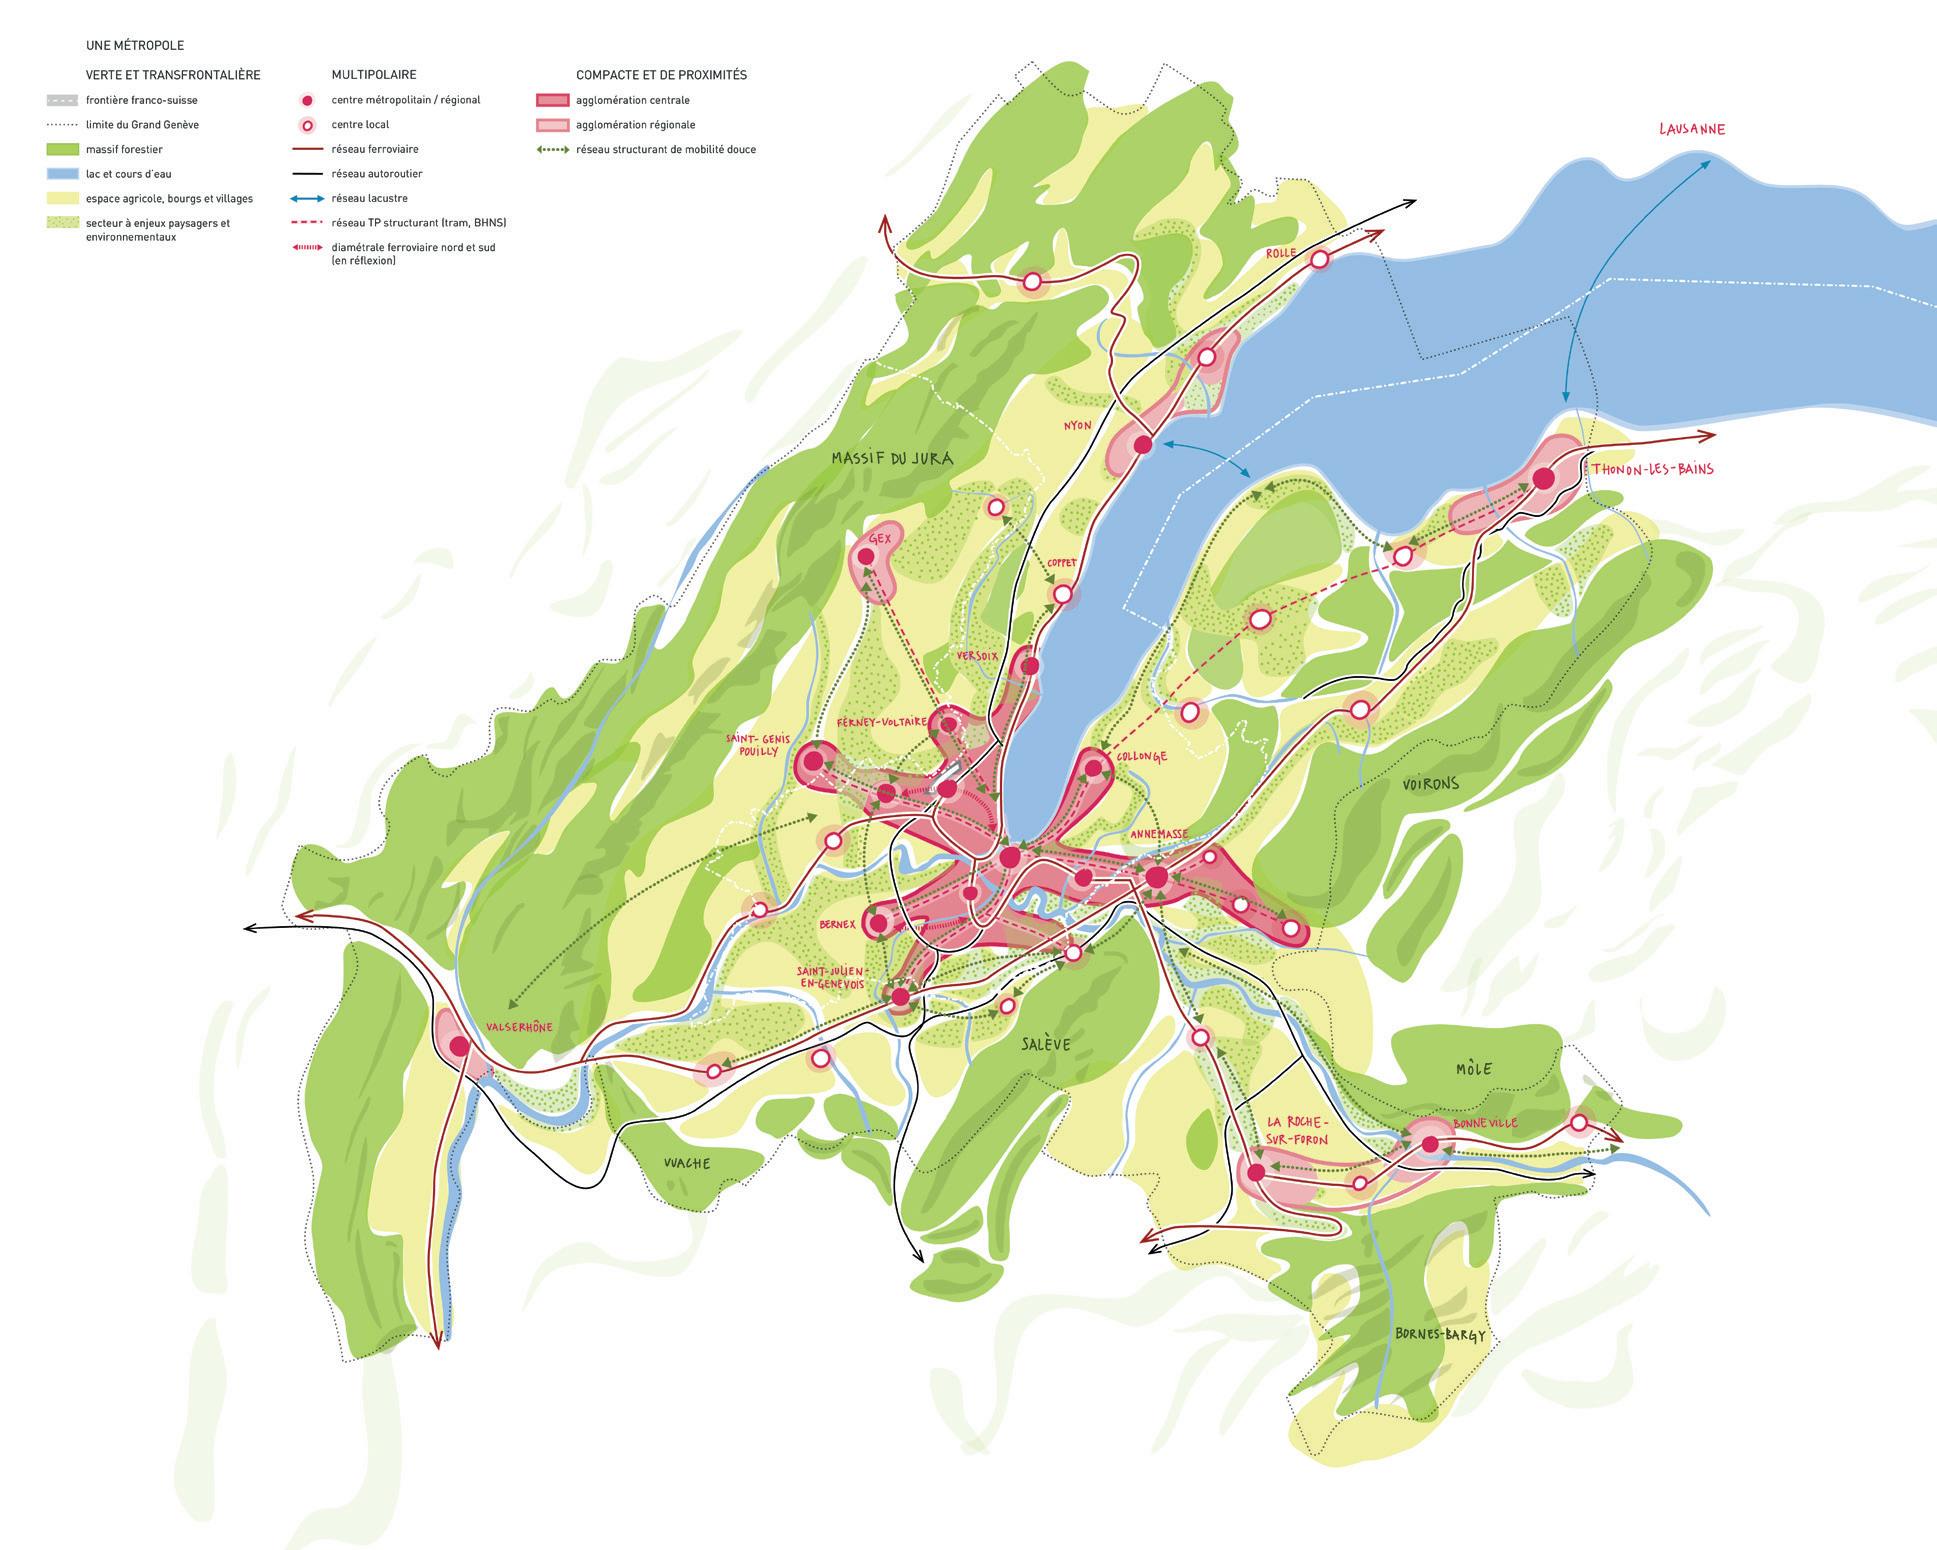


2.
Sources: GLCT. “Vision d’ensemble Grand Genève 2040.” Map. Grand Genève: Agglomération Franco-Valdo-Genevoise. 2021. https://www.grand-geneve.org/.
To assess canopy change on both sides of the border, this research employed regional-scale spatial analysis methods. Drawing from 30-meter spatial resolution global maps of forest cover change (Figure 3), derived from Landsat data by Hansen et al. (2013), canopy cover extent, loss, and gain was characterized across the agglomeration between 2000 and 2020. Canopy cover change was then summarized by three management units:
1. Administrative territories, which includes the 2 Swiss cantons, 2 French departments, and the 209 municipalities.
2. Simplified land use allocation zones, which were compiled from each territory that has its own regulations regarding urban planning and land use across the agglomeration (Figure 4). The simplified map rectifies these zones into nine primary categories: urban (tiered by density), village, public or recreation, economic or tourist activity, major transportation infrastructure, airport, green, agriculture, and forest zones. With the layer updated every 5 years since 2010, a new data layer was created to identify land use zones that changed between the earliest date of 2010 and 2020 (Figure 5). If simplified land use allocation zones dating back to 2000 were available, alignment with the full 20-year timeframe would be preferable, but this analysis was only able to use land use zone change over the most recent decade.
3. Ecological infrastructure, which includes the best 30% of the agglomeration in terms of composition, structure, connectivity, and ecosystem services. The data is defined as a network of connected (semi-)natural areas that allows for the prioritization of landscape conservation objectives for Greater Geneva’s cross-border vision and the Canton of Geneva’s biodiversity strategy, among other initiatives.
After unchanged canopy, canopy loss, and canopy gain were assessed through the management units of administrative territories, land use change zones, and ecological infrastructure, the 64 current “agglomeration projects” were overlaid on the canopy change findings to identify opportunities for targeted canopy gain. These projects include all the urbanization, transportation, and landscape types which are all located as “urbanizationdensification measures” that accelerate densification efforts toward the interior of urbanized areas in conjunction with mobility infrastructure for sustainable growth.
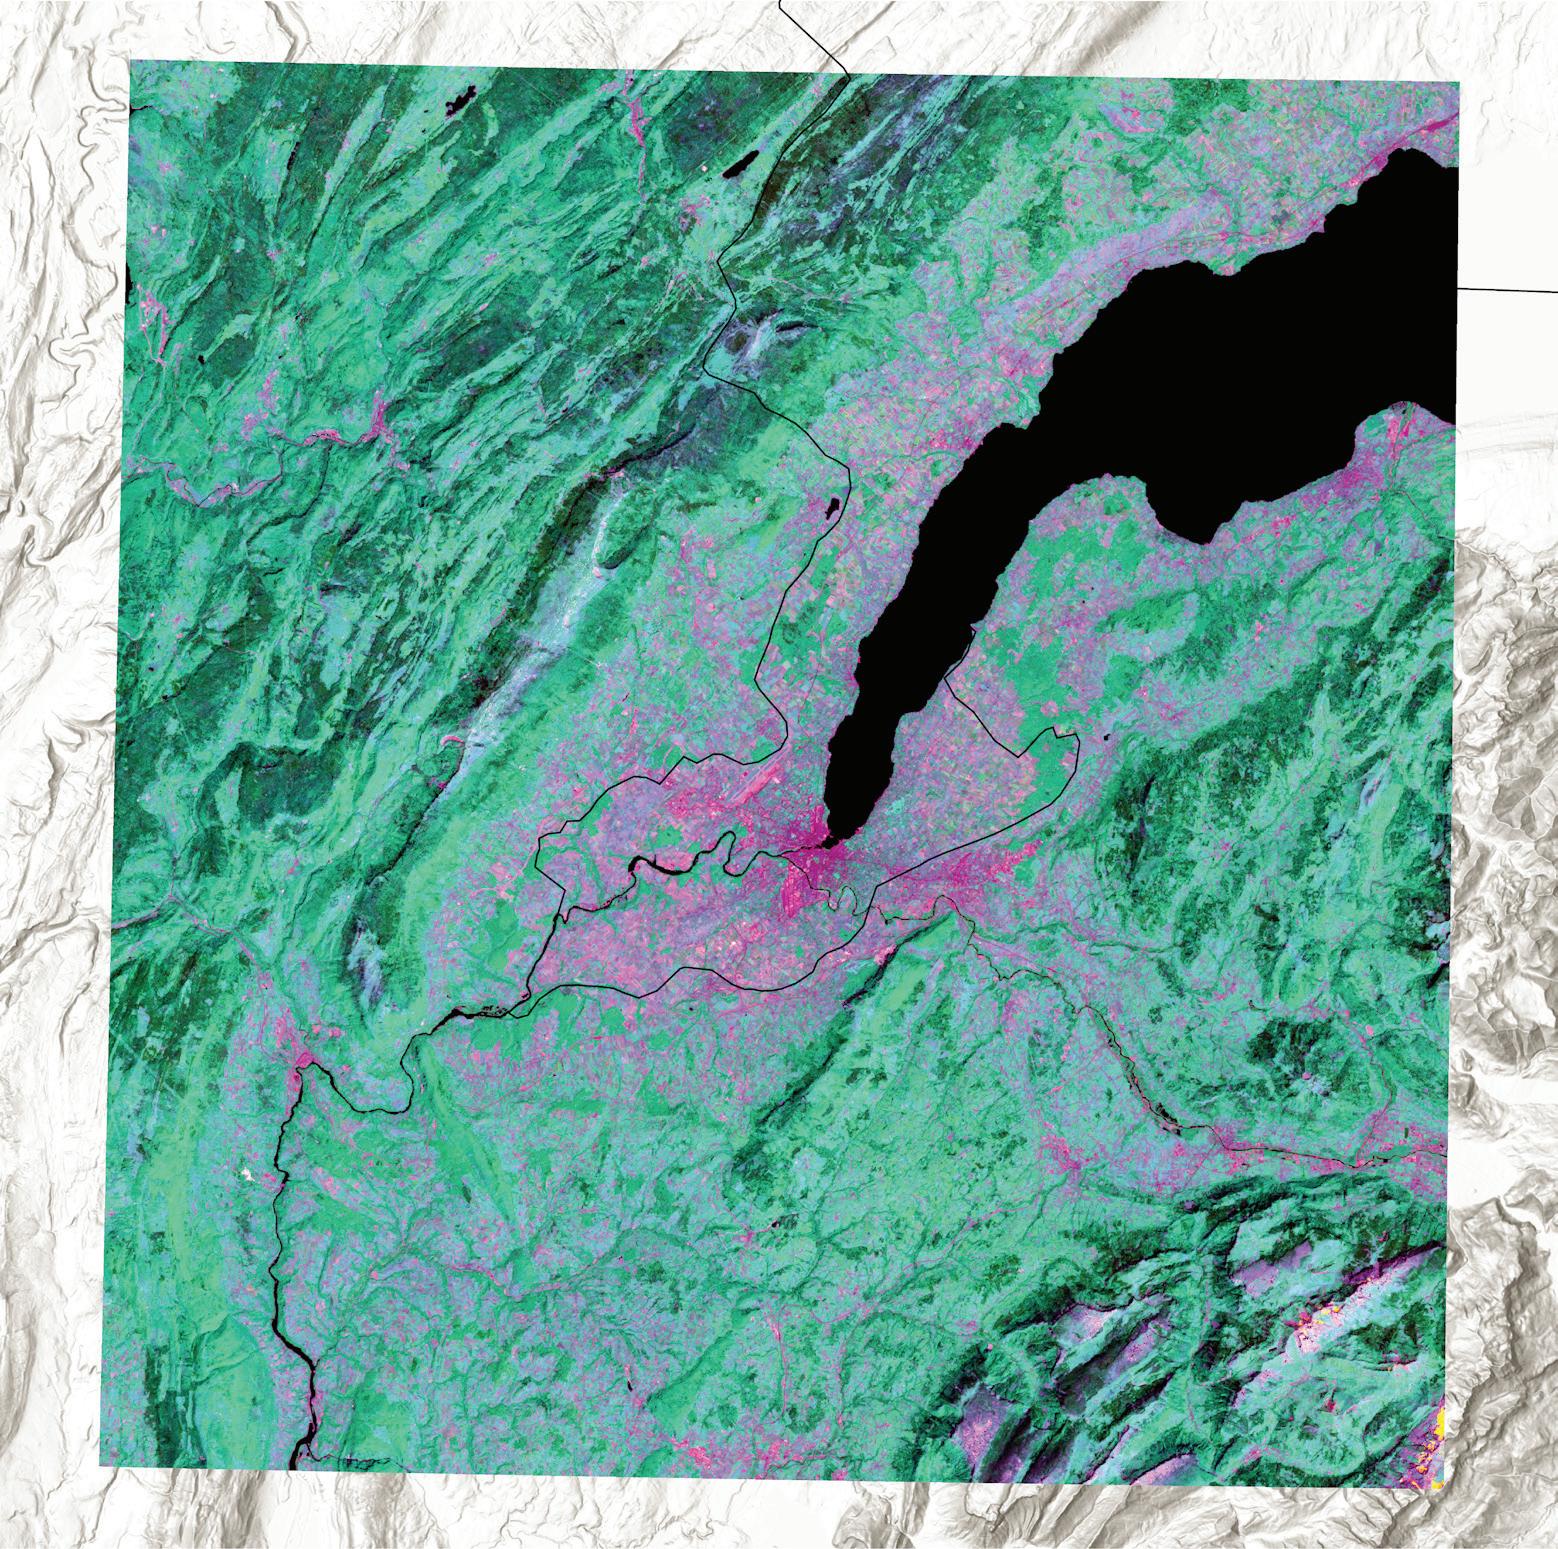
Figure 3.
Sources: “Circa year 2000 Landsat 7 cloud-free image composite.” UMD GLAD, 2022.
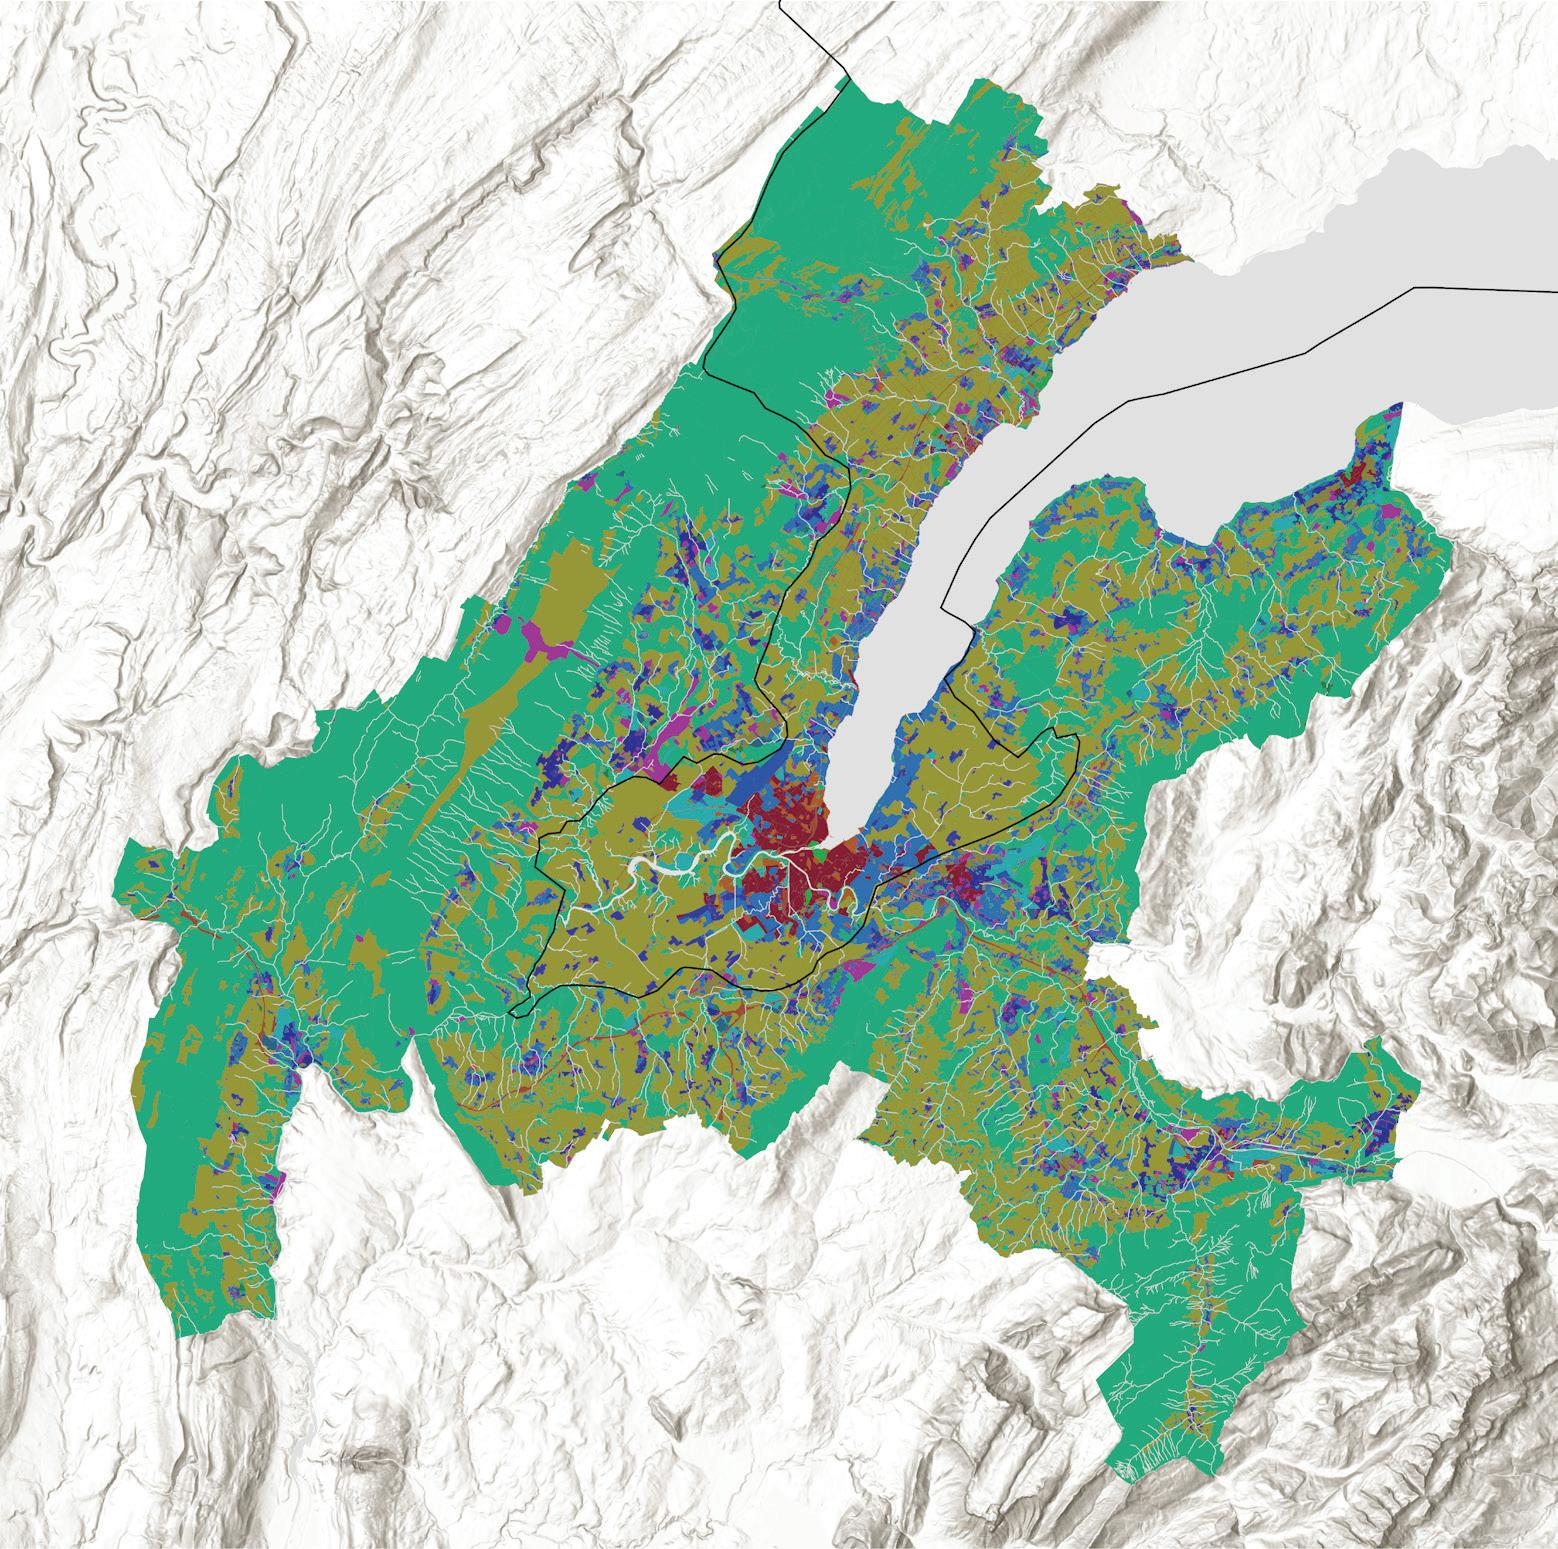
5
Green Zone
Airport Zone
Agriculture Zone
High-Density Central Zone
Economic or Tourist Activity Zone
Historic Center Zone
Village Center Zone
Deferred Assignment Zone
Major Transport Infrastructure Link Zone
Natural or Forest Zone
High-Density Pericentral Zone
Mid-Density Pericentral Zone
Low-Density Pericentral Zone
Public, Sports, or Leisure Facilities Zone
Future High-Density Central Zone
Future Economic or Tourist Activity Zone
Future Village Center Zone
Future Public, Sports, or Leisure Facilities Zone
Future High-Density Pericentral Zone
Future Mid-Density Pericentral Zone
Future Low-Density Pericentral Zone
Figure 4.
Sources:
“Agglo - Zones d’affectation simplifiée 2020” (AGGLO_ ZONE_AFF_SIMPLIFIEE_2020). SITG, 2020.
“Agglo - Périmètre du Grand Genève avec lac” (AGGLO_ PERIMETRE_AVEC_LAC). SITG, 2012.
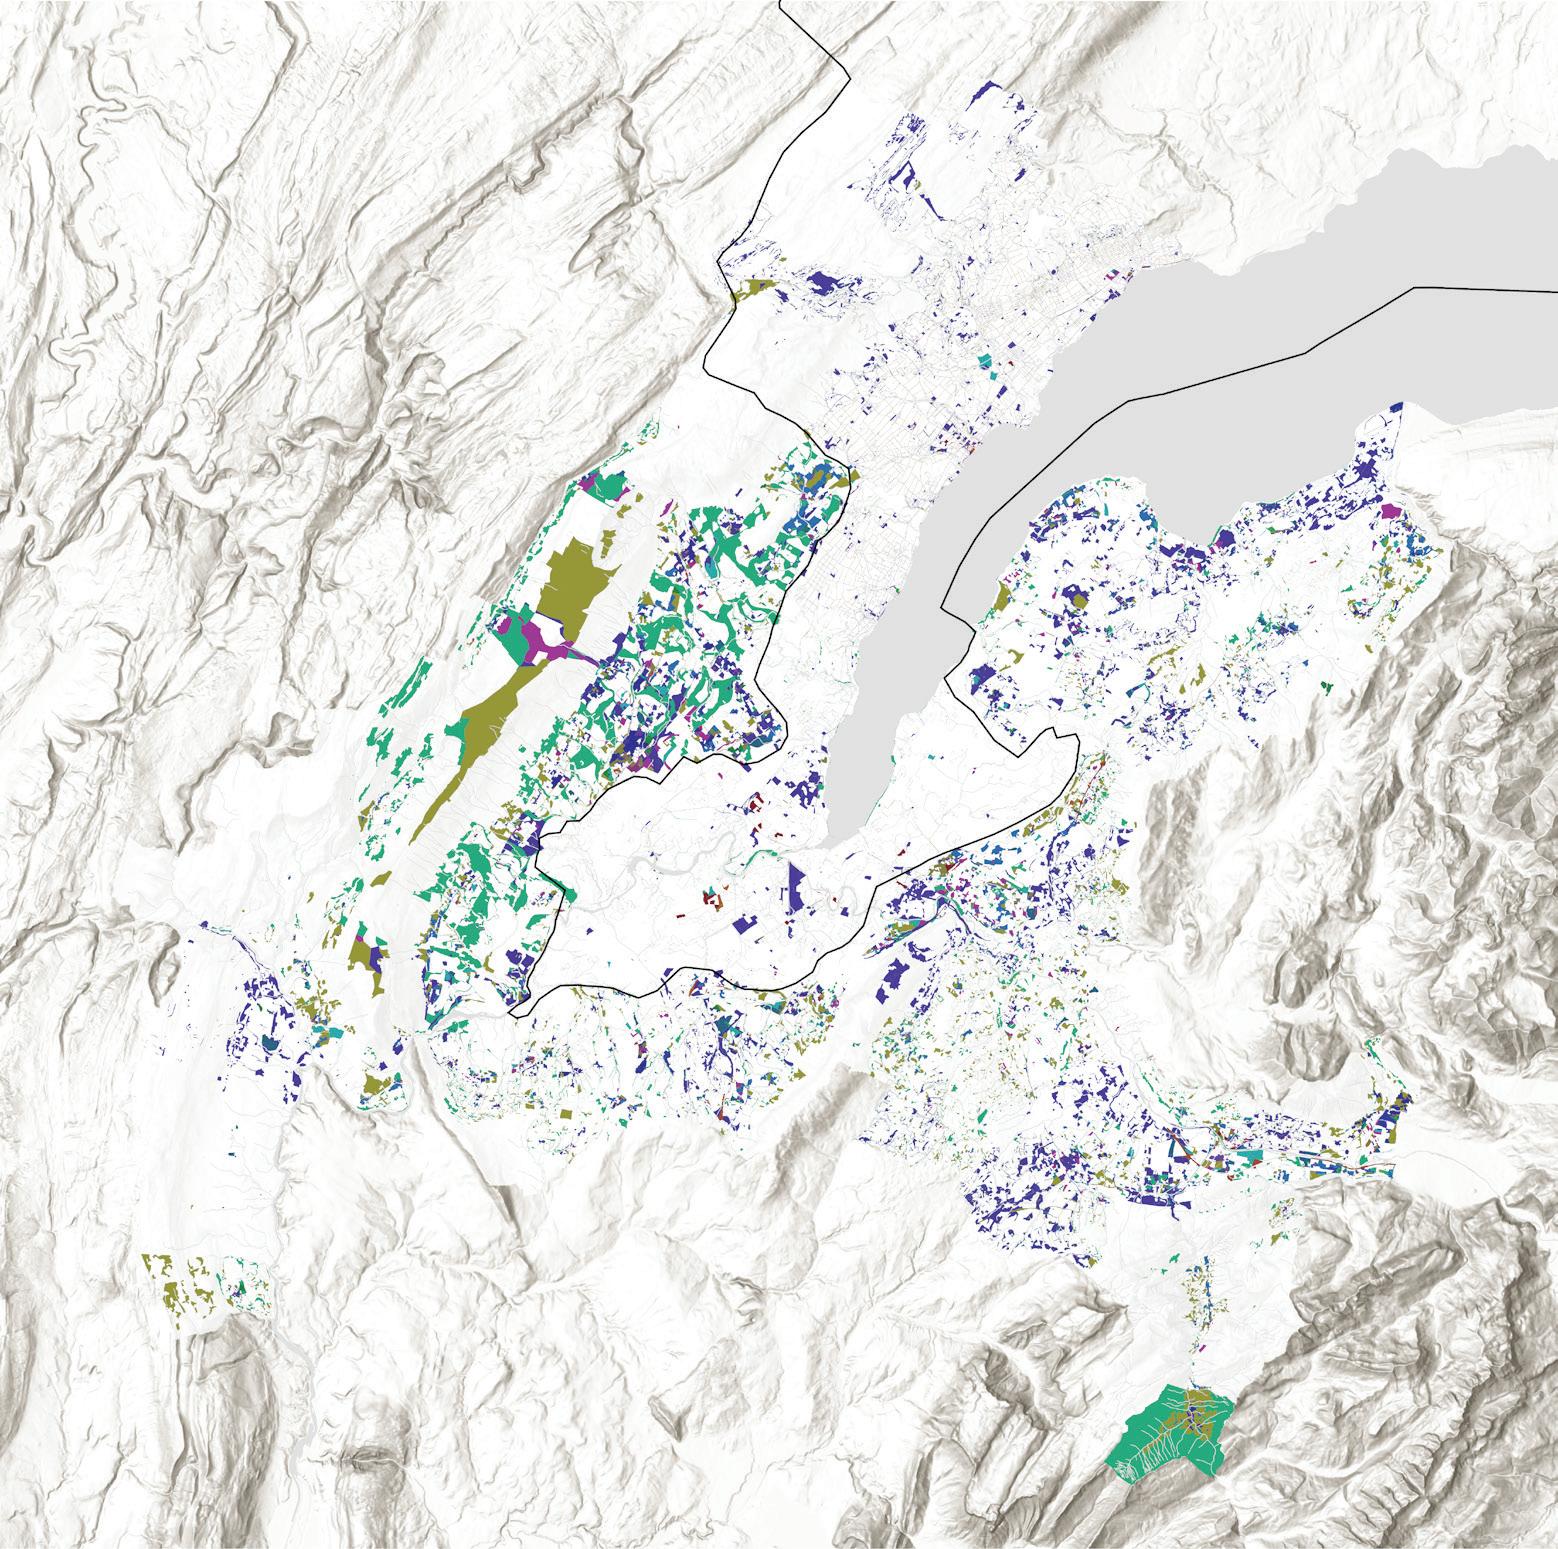
Figure 5.
Sources: “Agglo - Évolution des zones d’affectation entre 2010 et 2014” (AGGLO_ZAFF_SIMPL_EVOL_10_14). SITG, 2014. “Agglo - Évolution des zones d’affectation entre 2015 et 2020” (AGGLO_ZAFF_SIMPL_EVOL_15_20). SITG, 2020. “Agglo - Périmètre du Grand Genève avec lac” (AGGLO_ PERIMETRE_AVEC_LAC). SITG, 2012.
The analysis found that 98.7% of 2000 tree canopy cover remained in 2020 (Figure 6). Meanwhile, 1.5% of canopy cover was gained, yielding 0.2% net gain across the agglomeration. Likewise, 1.3% of canopy cover was lost, with 1.7× more loss in France during the same 20-year period. By 2020, this change produced 47.5% canopy coverage agglomeration-wide (Figure 7).
Canopy gain outweighing canopy loss from 2000 to 2020 was a positive occurrence for the agglomeration as a whole, yet canopy gain and loss was not evenly distributed. The region’s forest cover is influenced by varying planning frameworks, legal structures, and local governance practices on both sides of the border. Municipalities, cantons, and departments in the Swiss and French parts of the agglomeration experience differing rates of canopy loss or gain, shaped by factors such as development needs, zoning laws, and ecological management (Turner and Gardner 2015).
Through the lens of assessing the management units of administrative territories, land use change zones, and ecological infrastructure, key insights emerged in each of the categories. Ultimately, the analysis uncovered three principal findings:
1. From 2000 to 2020, Swiss tree canopy gained coverage 20.1× faster than the French side of the agglomeration.
2. From 2000 to 2020, 69.2% of land use zone change associated with tree canopy loss was dominated by agriculture/forest transition.
3. From 2000 to 2020, 37.8% of tree canopy loss occurred in regional ecological infrastructure, even on protected lands.
Finding #1:
From 2000 to 2020, Swiss tree canopy gained coverage 20.1× faster than the French side of the agglomeration.
Even though the French side has 2.6× more canopy coverage (50.2% versus 19.3%), arguably the most striking inequity is how much faster Swiss canopy cover gained during the 20-year period (Figure 8). This finding aligns with other literature describing that development in the form of job creation on the Swiss side has allowed its communes and cantons to preserve and expand their tree canopy coverage more so than the communes and departments on the French side, which has had to accommodate much of the demographic growth of development (Guichot 2024, 33, 25–26).
On the municipal level, there are numerous factors contributing to variable canopy change. Municipalities on the French side of the Grand Genève agglomeration—particularly in Ain and Haute-Savoie—are more likely to experience canopy loss (Figure 9) due to the combination of decentralized planning authority, strong urban development pressure from Geneva, and relatively flexible land zoning. Local governments often respond to housing and economic demands by converting forested or agricultural land into urban or peri-urban development, especially in areas along major transport corridors. While some reforestation occurs on marginal agricultural land, gains are often scattered and do not fully offset localized losses near expanding urban centers. On the Swiss side, particularly in the Canton of Geneva, municipalities face greater constraints on land conversion due to centralized and restrictive federal and cantonal laws that tightly separate construction zones from protected forests. Canopy gain is more likely in these areas due to deliberate ecological policies—such as the restoration of riparian buffers and reforestation of underused farmland—as well as active forest
management for biodiversity and climate resilience. The Canton of Vaud, which borders Geneva to the north and west, is somewhat less restrictive than Geneva but still maintains more robust development controls than neighboring French communes, resulting in moderate canopy stability with pockets of gain, particularly in rural or transitional zones.
On the cantonal and departmental level, it is worth considering that canopy cover varies considerably between the Cantons of Geneva and Vaud in Switzerland and the Departments of Ain and Haute-Savoie in France due to varied environmental conditions. The Canton of Geneva is the smallest and most urbanized of the four, accounting for 32.2% of Swiss canopy cover, primarily concentrated in protected corridors such as the Rhône valley, Salève foothills, and Bois de la Bâtie. In contrast, the Canton of Vaud has a much higher forest cover, accounting for the other 67.8%, with large contiguous forested zones in the Jura foothills and near the Plateau. On the French side, Haute-Savoie is heavily forested, especially in mountainous and rural areas such as the Voirons and Chablais. Ain has more varied topography and land use, depending on elevation and proximity to urban zones like Pays de Gex. Despite higher and roughly comparable canopy cover proportions in Ain and Haute-Savoie, they face greater risk of fragmentation due to diffuse urban growth patterns and limited cross-municipal coordination on long-term land protection.
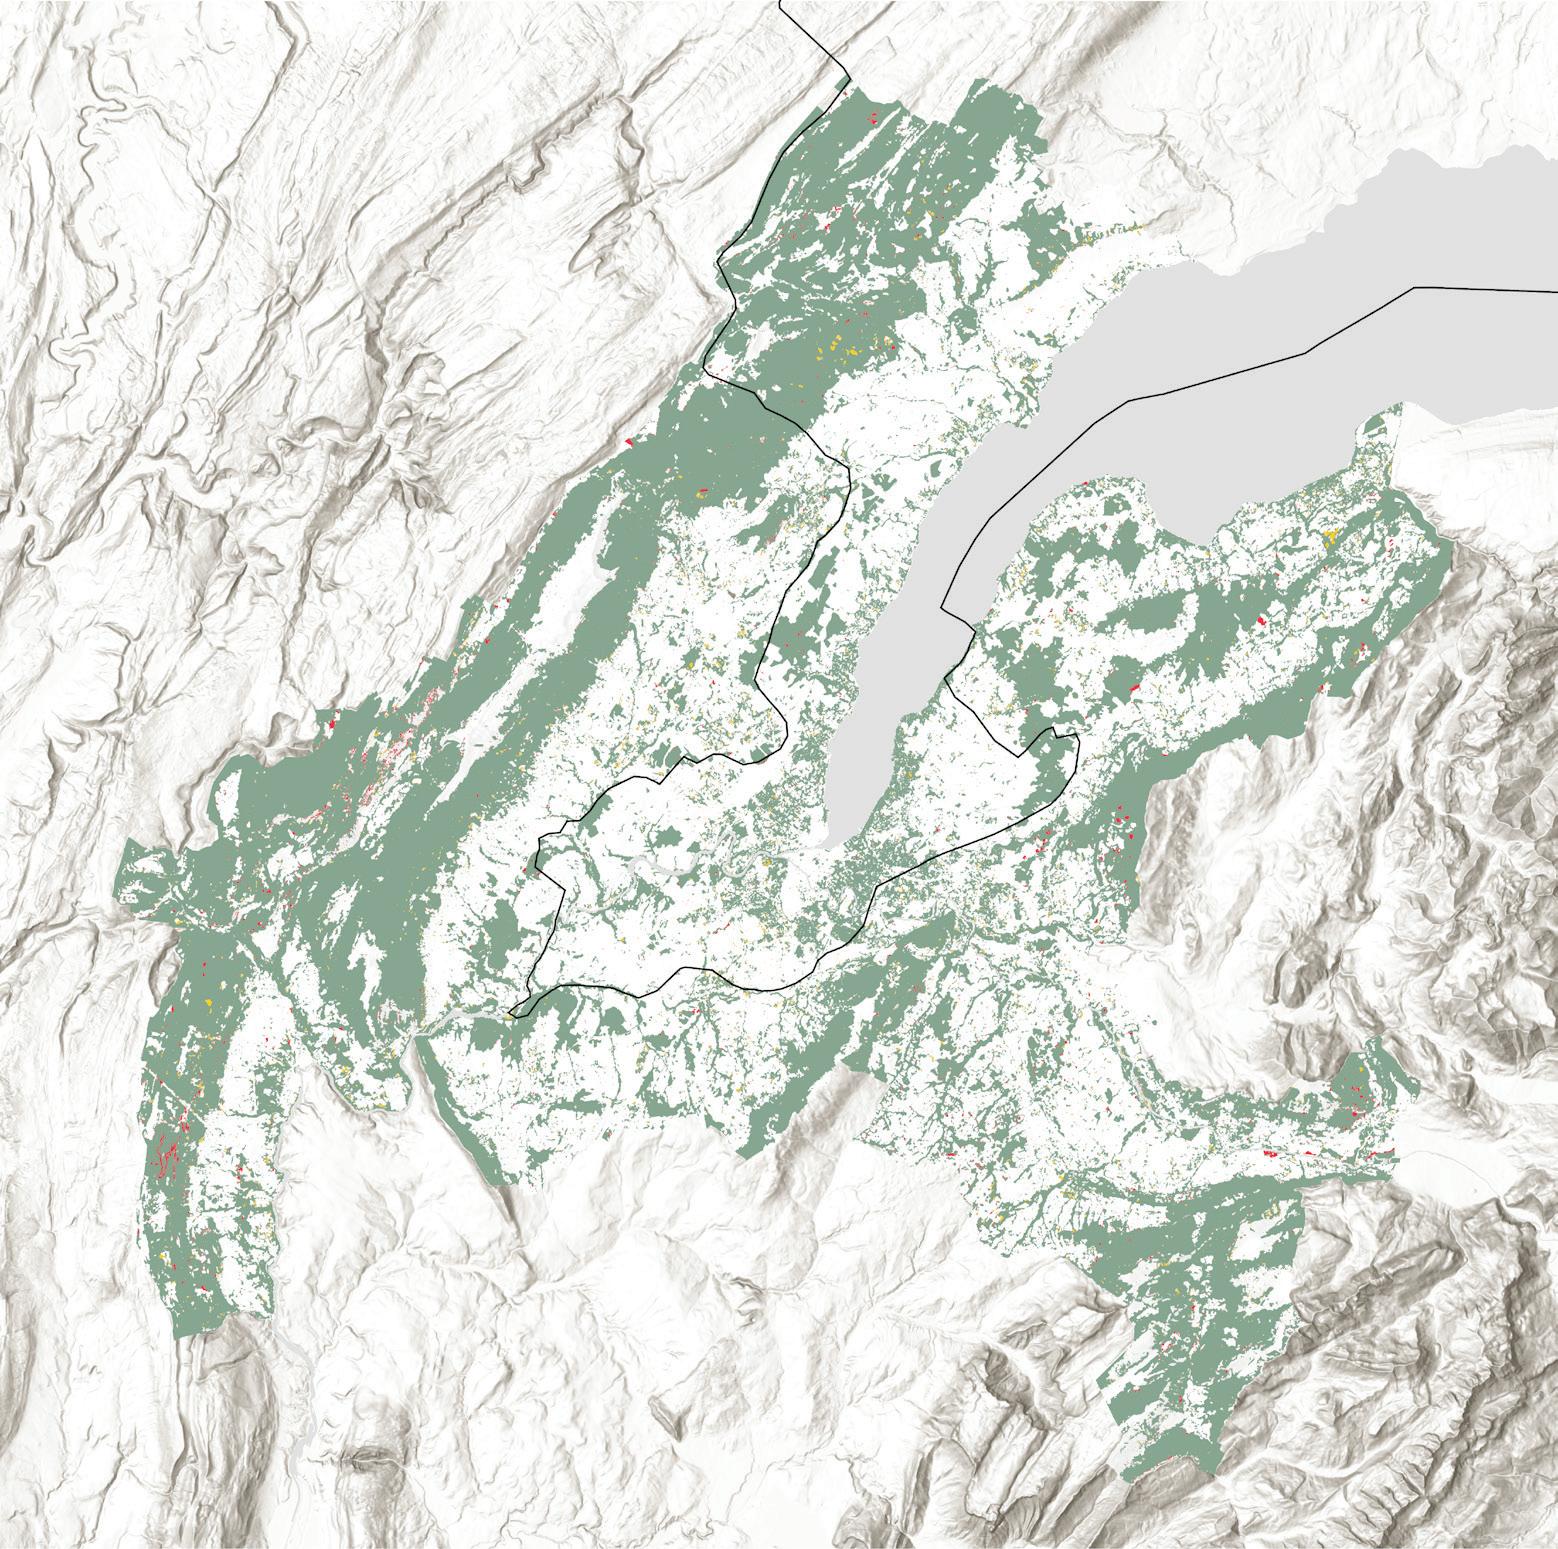
2020 Canopy Cover
47.5% of the Agglomeration has canopy cover Canopy Cover Change
19.3% of the Swiss side has canopy cover
50.2% of the French side has canopy cover
Figure 6.
Sources: “Agglo - Périmètre du Grand Genève avec lac” (AGGLO_ PERIMETRE_AVEC_LAC). SITG, 2012. “Global Land Cover and Land Use Change, 2000–2020.” UMD GLAD, 2022. Unchanged Canopy Cover Canopy Cover Gain Canopy Cover Loss

Figure 7.
Sources:
“Agglo - Communes et territoires voisins” (AGGLO_ COMMUNES). SITG, 2025.
“Agglo - Périmètre du Grand Genève avec lac” (AGGLO_ PERIMETRE_AVEC_LAC). SITG, 2012.
“Global Land Cover and Land Use Change, 2000–2020.” UMD GLAD, 2022.
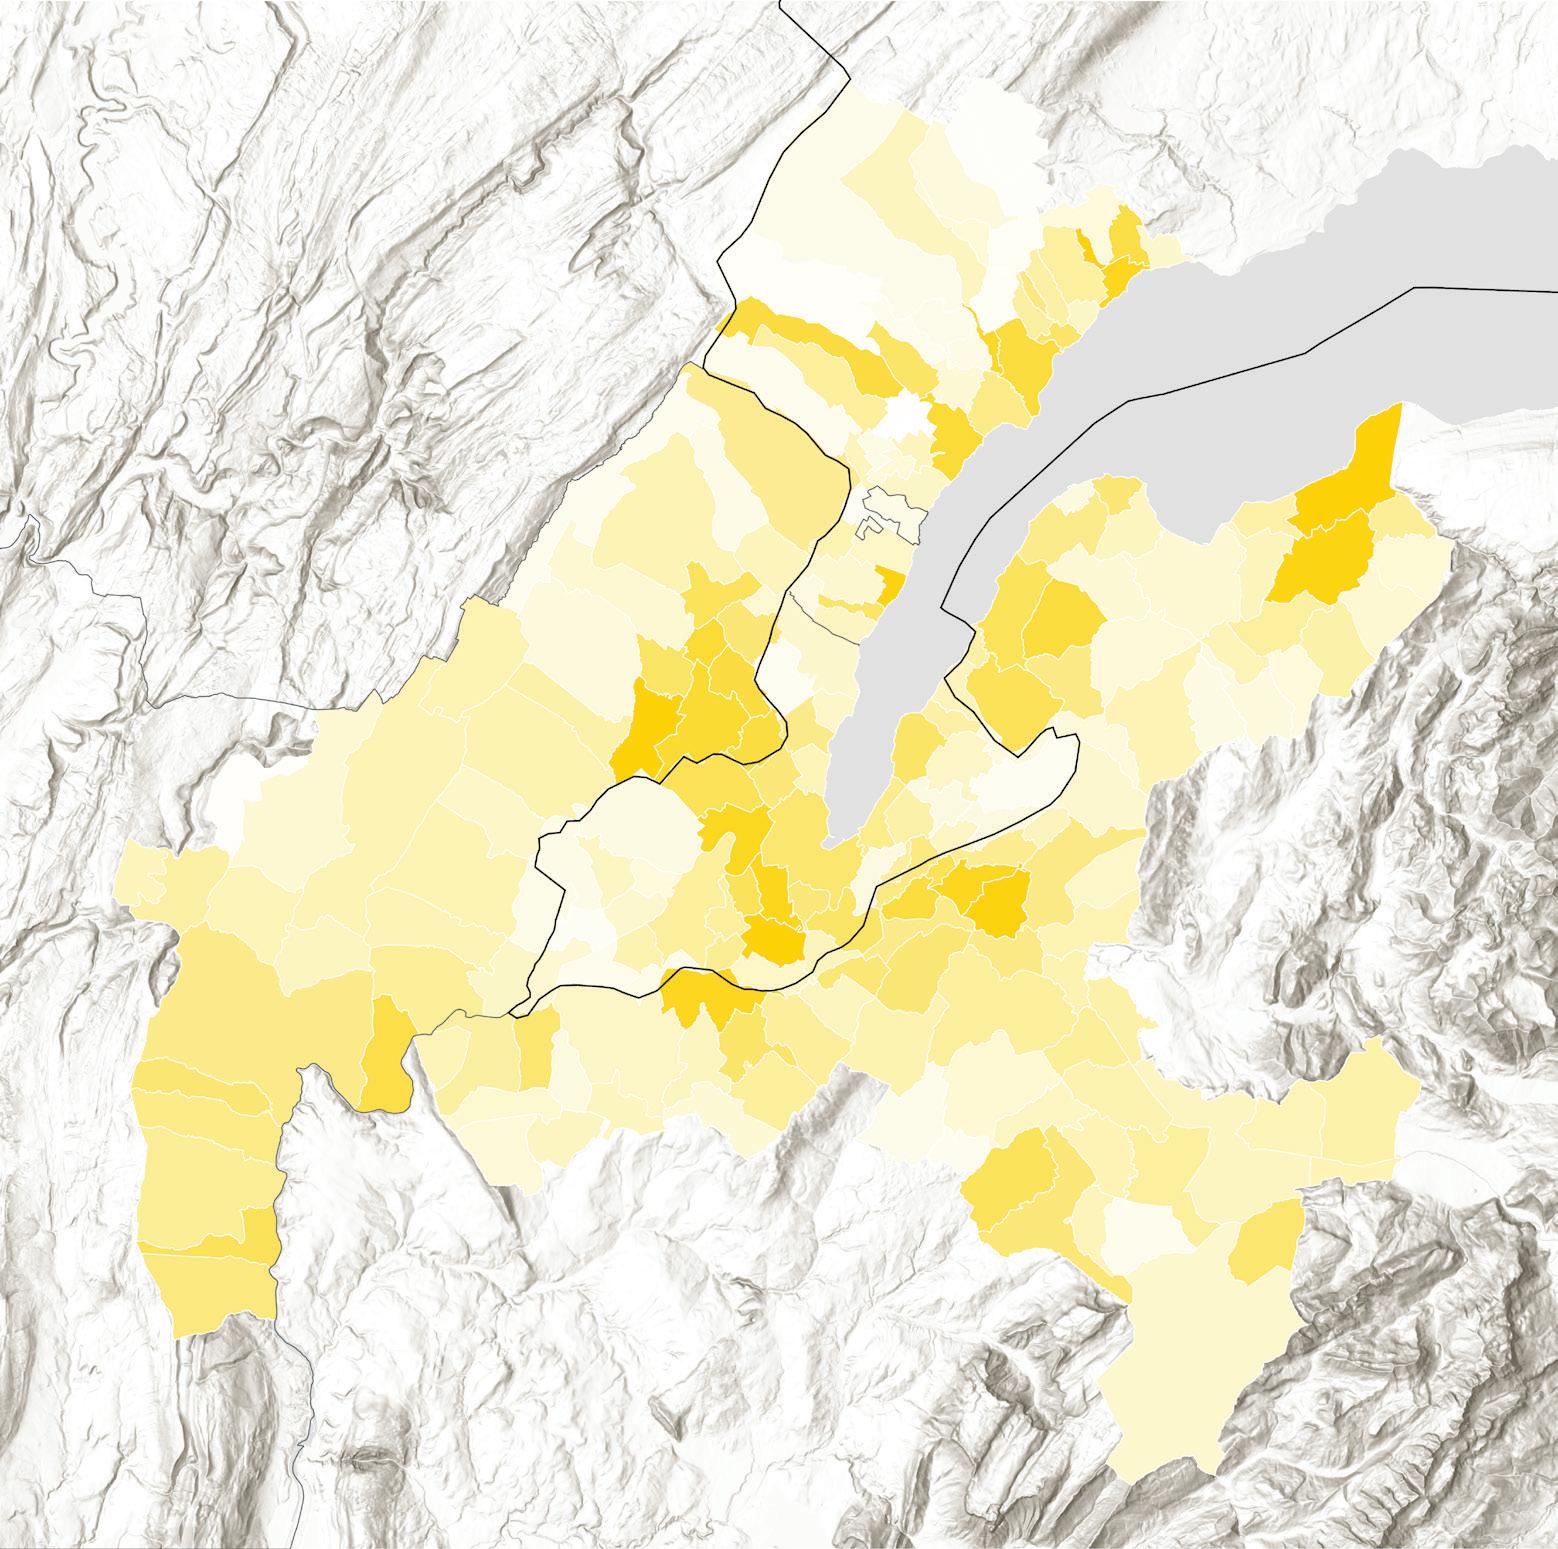
Figure 8.
Sources:
“Agglo - Communes et territoires voisins” (AGGLO_ COMMUNES). SITG, 2025.
“Agglo - Périmètre du Grand Genève avec lac” (AGGLO_ PERIMETRE_AVEC_LAC). SITG, 2012.
“Global Land Cover and Land Use Change, 2000–2020.” UMD GLAD, 2022.
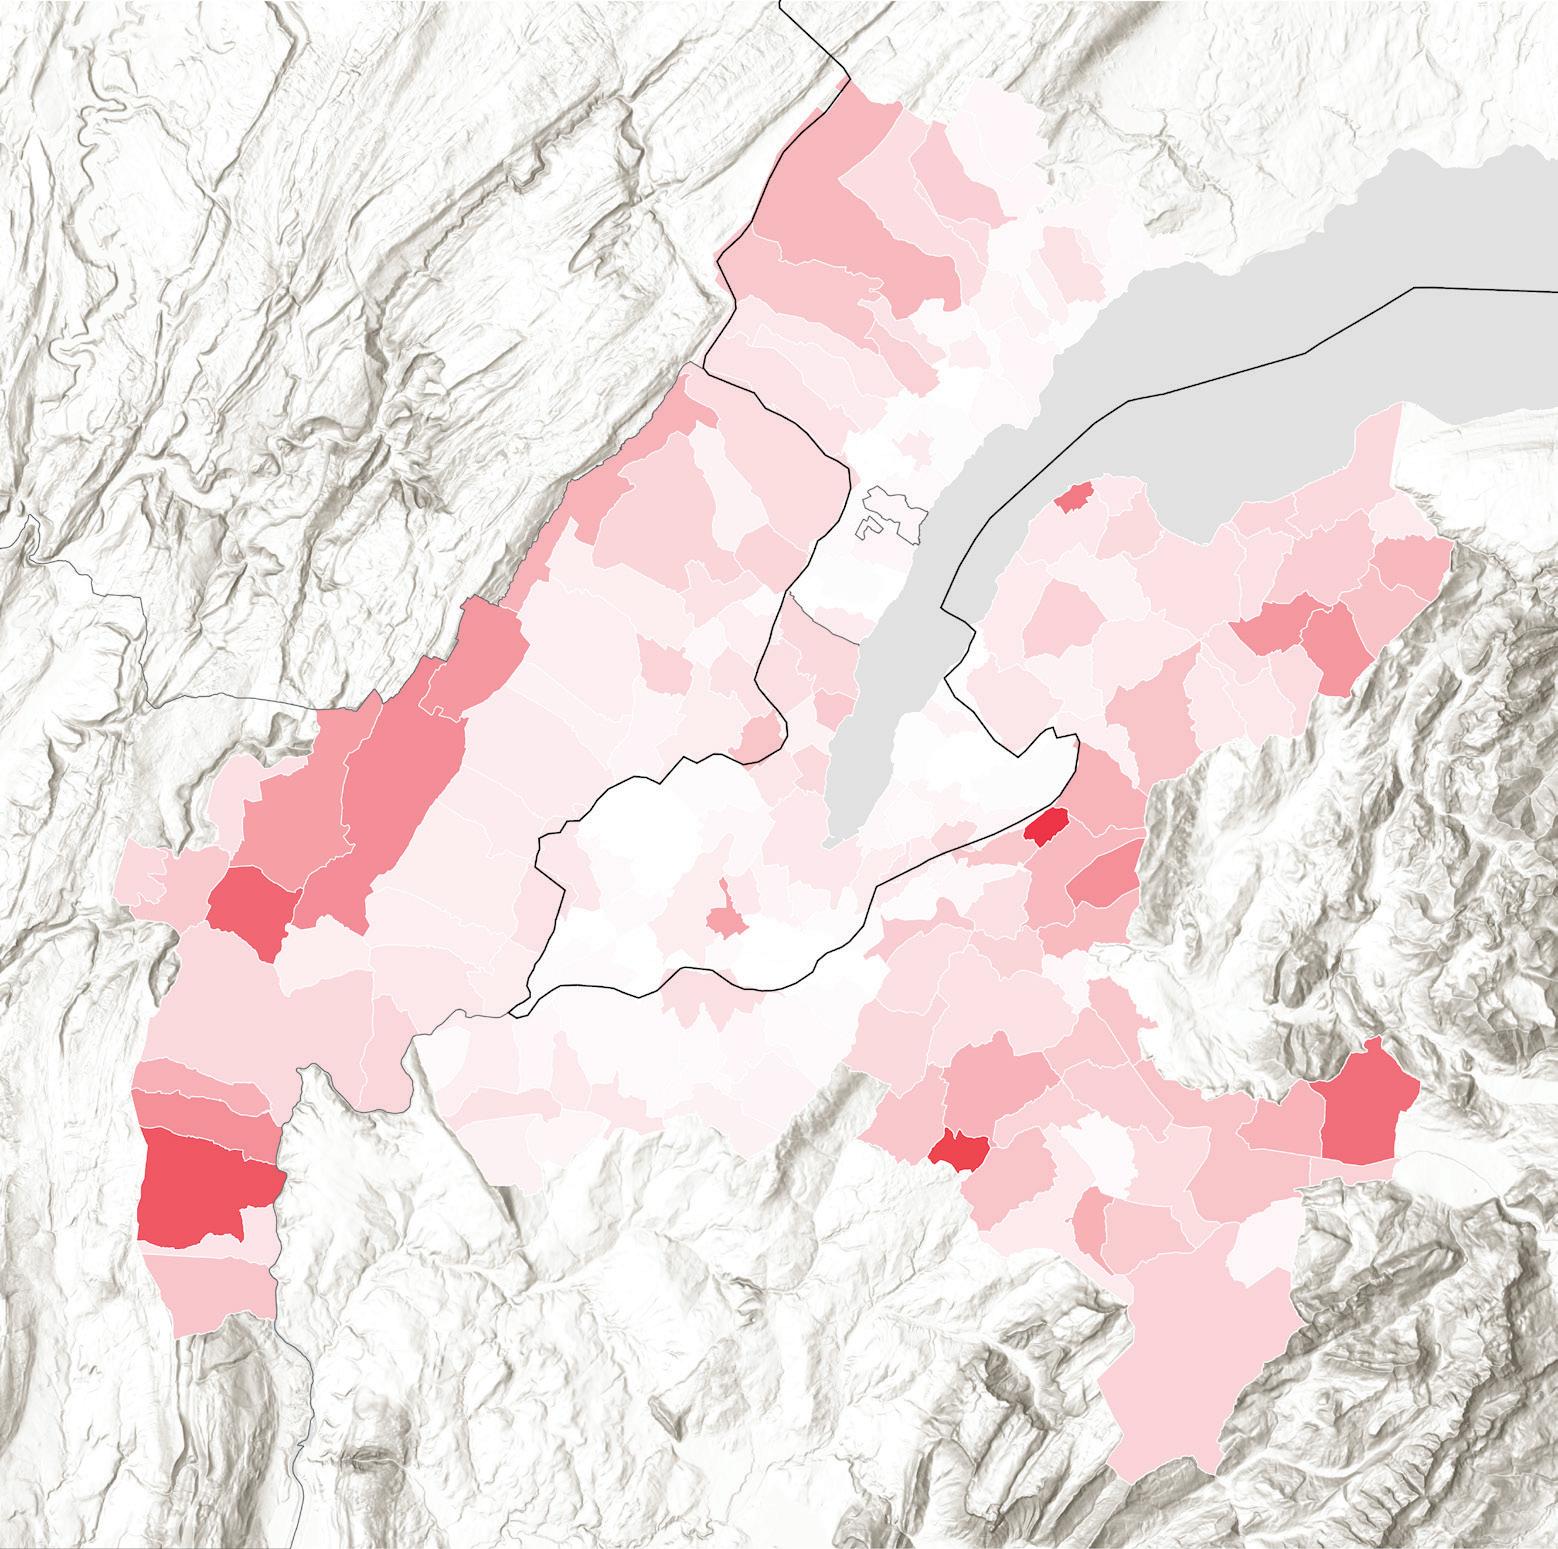
Figure 9.
Sources:
“Agglo - Communes et territoires voisins” (AGGLO_ COMMUNES). SITG, 2025.
“Agglo - Périmètre du Grand Genève avec lac” (AGGLO_ PERIMETRE_AVEC_LAC). SITG, 2012.
“Global Land Cover and Land Use Change, 2000–2020.” UMD GLAD, 2022.
Finding 2:
From 2000 to 2020, 69.2% of land use zone change associated with tree canopy loss was dominated by agriculture/forest transition.
Nevertheless, canopy gain tells a more nuanced story, with urban areas of varying densities responsible for the most gains, especially on the Swiss side. Yet binational inequities were also present, where the French side has seen higher rates of canopy change in its zones of land use change:
• 6.0× more canopy gain occurred in new French land use zones (Figure 10).
• 5.2× more canopy loss occurred in new French land uses zones (Figure 11).
With 91.6% of land use zone change occurring on the French side between 2010 and 2020, French canopy cover change follows the same trend, and is even slightly more extreme (95.1% canopy gain, and 94.4% canopy loss). Rapidly changing canopy cover and land use on the French side can largely be explained by differing systems of land use zoning due to contrasting planning philosophies, legal frameworks, and governance structures. These differences have a direct impact on forest cover and its evolution across the region.
On the French side of Greater Geneva, land use zoning is shaped by a decentralized framework in which municipalities wield significant autonomy through Plans Locaux d’Urbanisme (PLU) and broader coordination via Schémas de Cohérence Territoriale (SCoT). While national legislation like the Code de l’environnement and EU instruments such as Natura 2000 aim to preserve biodiversity and landscapes, actual land use change is heavily influenced by local priorities and development pressure radiating from Geneva. Conversion between forest and agricultural land is the dominant form of land use change—both deforestation for agricultural expansion or development, and reforestation of marginal farmland. However, in peri-urban communes, forest loss tends to outpace gains, especially near expanding towns like Annemasse
or Saint-Julien-en-Genevois, where forests are often rezoned for housing or infrastructure. Protected forest areas remain relatively few, and implementation of conservation objectives varies widely among communes, leading to a fragmented landscape where forest-agriculture boundaries are in flux and often vulnerable to long-term degradation.
On the Swiss side, particularly in the Canton of Geneva, land use is strictly controlled through centralized instruments like the Plan Directeur Cantonal and reinforced by federal laws including the Loi sur l’aménagement du territoire (LAT) and the Loi fédérale sur les forêts. These frameworks draw a firm line between buildable and non-buildable zones, with forests enjoying high levels of protection and formal management objectives. Although land use change still occurs, it is more often a shift between agriculture and forest rather than forest to urban uses. In fact, marginal agricultural lands are sometimes allowed to revert to forest or are actively reforested as part of ecological restoration policies. Urban encroachment into forested zones is rare due to rigid zoning enforcement, and Geneva’s strong ecological network planning promotes continuous green corridors. As a result, forest cover in the canton remains stable or increases slightly, in sharp contrast to the more variable trends on the French side.
Finding 3:
From 2000 to 2020, 37.8% of tree canopy loss occurred in regional ecological infrastructure, even on protected lands.
Comparatively, 25.5% of canopy gain occurred within regional ecological infrastructure, suggesting that canopy is being lost in the places it is needed most, while significantly less canopy gain is happening in these critical areas (Figures 12 and 13). The vast majority of this ecological infrastructure canopy change took place on unprotected lands on the French side of the border (93.3% canopy gain, and 89.2% canopy loss), yet a much more substantial amount changed on Swiss protected lands (33.0% canopy gain, and 39.1% canopy loss). This points to a fundamental binational difference between land protection policies.
Land protection policies on the French and Swiss sides of Greater Geneva involve a complex interplay of national, regional, and local regulations. Both countries are engaged in a delicate balancing act between accommodating urban growth and preserving natural landscapes, particularly forested areas. However, the tools, approaches, and degrees of enforcement differ across the border, reflecting broader differences in administrative structures and legal traditions.
On the French side of Grand Genève, land protection is guided by a mix of national legislation—such as the Code de l’environnement—and decentralized planning tools including the Schéma de Cohérence Territoriale (SCoT) and Plans Locaux d’Urbanisme (PLU). Forests and natural zones are sometimes incorporated into designations like Zones Naturelles d’Intérêt Écologique, Faunistique et Floristique (ZNIEFF) and EU-backed Natura 2000 sites. However, the designation of such areas remains limited, with only two officially protected zones covering forested land in the French portion of Greater Geneva. While forest protection is a formal objective, implementation varies significantly between municipalities. Some SCoTs prioritize ecological continuity and green belt buffers, while others permit fragmentation or
encroachment, especially near expanding periurban zones. This patchwork approach reflects both the strength and the challenge of France’s decentralized planning model. That said, crossborder cooperation through the Grand Genève framework has spurred greater awareness and coordination, particularly in forested corridors along the Jura and Voirons massifs.
On the Swiss side, and especially in the Canton of Geneva, land protection is more centralized and binding. The Plan Directeur Cantonal serves as a strategic framework with enforceable zoning constraints, guided by national legislation such as the Loi fédérale sur les forêts and the Loi sur l’aménagement du territoire. These laws afford forests strong legal status, making them largely off-limits to urban development while also mandating active management for ecological health, climate adaptation, and public use. Forests are deeply embedded in Geneva’s landscape planning, with ecological networks (réseaux écologiques) connecting green spaces across urban and rural zones. As a result, urban expansion is tightly restricted, and reforestation or enhancement projects are often integrated into broader sustainability goals. Collaboration within Grand Genève has reinforced this model, promoting transboundary green infrastructure, particularly near high-pressure zones such as the Salève foothills and the Rhône corridor, where Swiss forests act as buffers against regional development pressures.
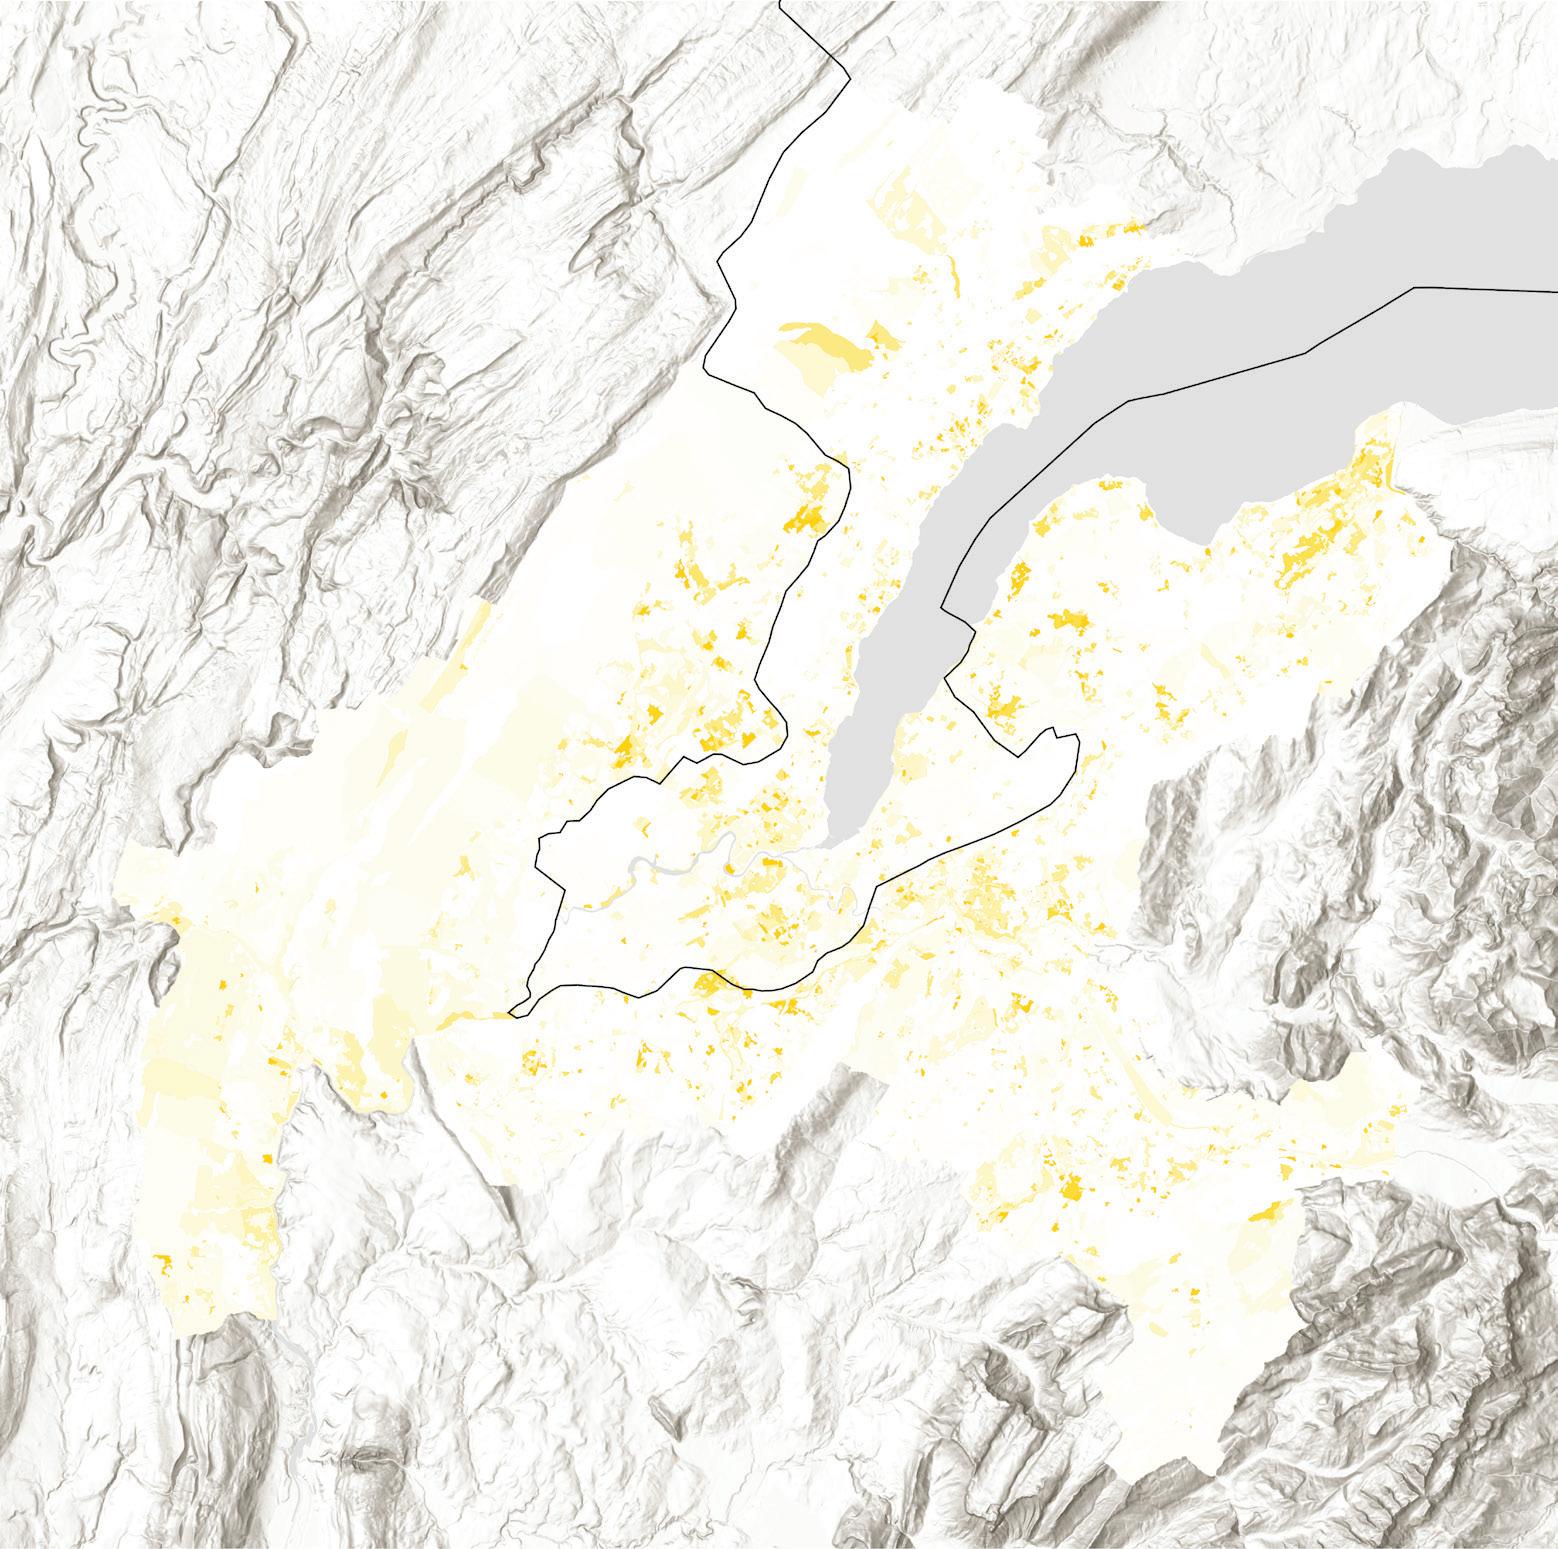
Figure 10.
Sources:
“Agglo - Zones d’affectation simplifiée 2020” (AGGLO_ ZONE_AFF_SIMPLIFIEE_2020). SITG, 2020.
“Agglo - Périmètre du Grand Genève avec lac” (AGGLO_ PERIMETRE_AVEC_LAC). SITG, 2012.
“Global Land Cover and Land Use Change, 2000–2020.” UMD GLAD, 2022.
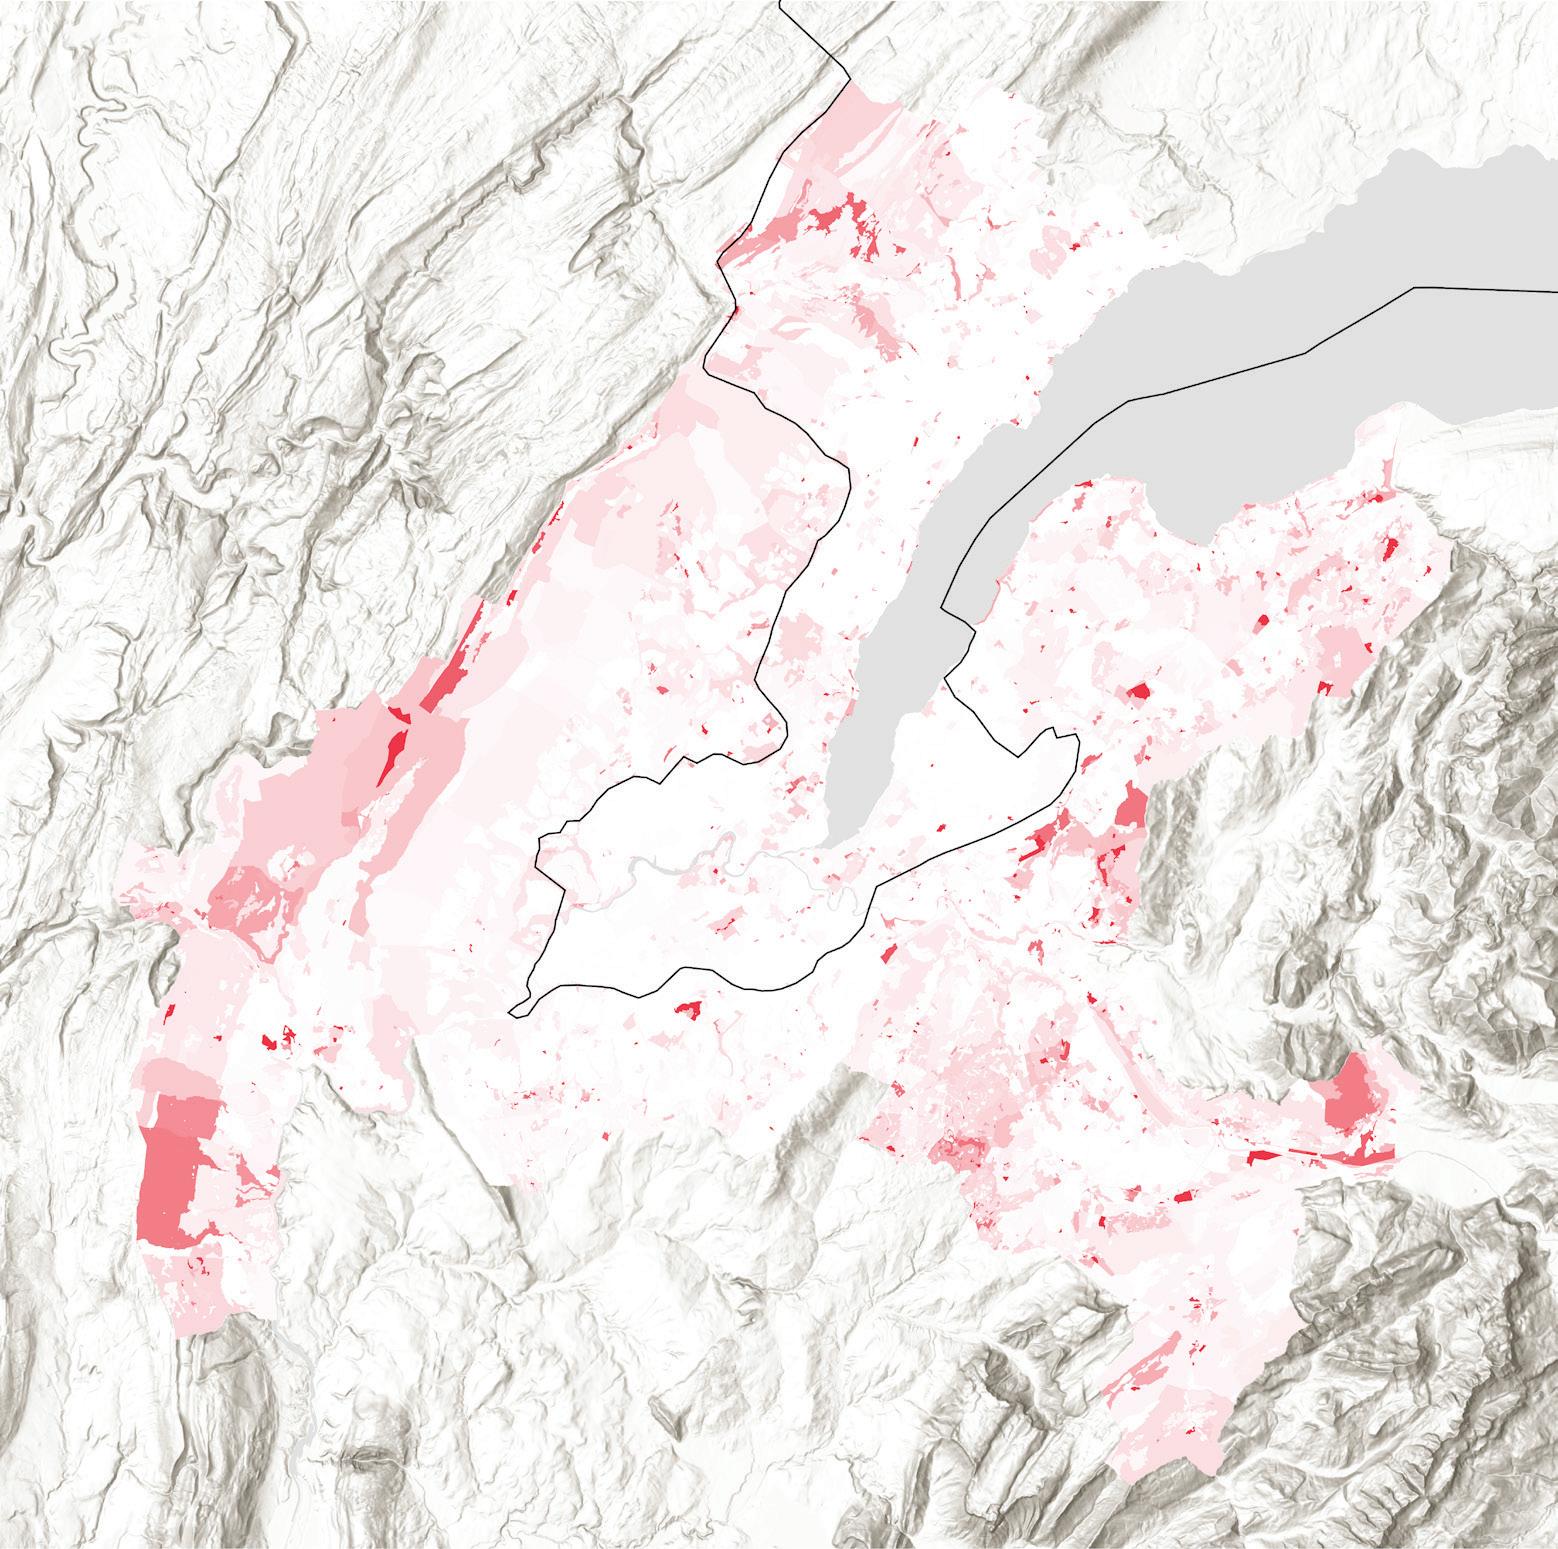
Figure 11.
Sources:
“Agglo - Zones d’affectation simplifiée 2020” (AGGLO_ ZONE_AFF_SIMPLIFIEE_2020). SITG, 2020.
“Agglo - Périmètre du Grand Genève avec lac” (AGGLO_ PERIMETRE_AVEC_LAC). SITG, 2012.
“Global Land Cover and Land Use Change, 2000–2020.” UMD GLAD, 2022.
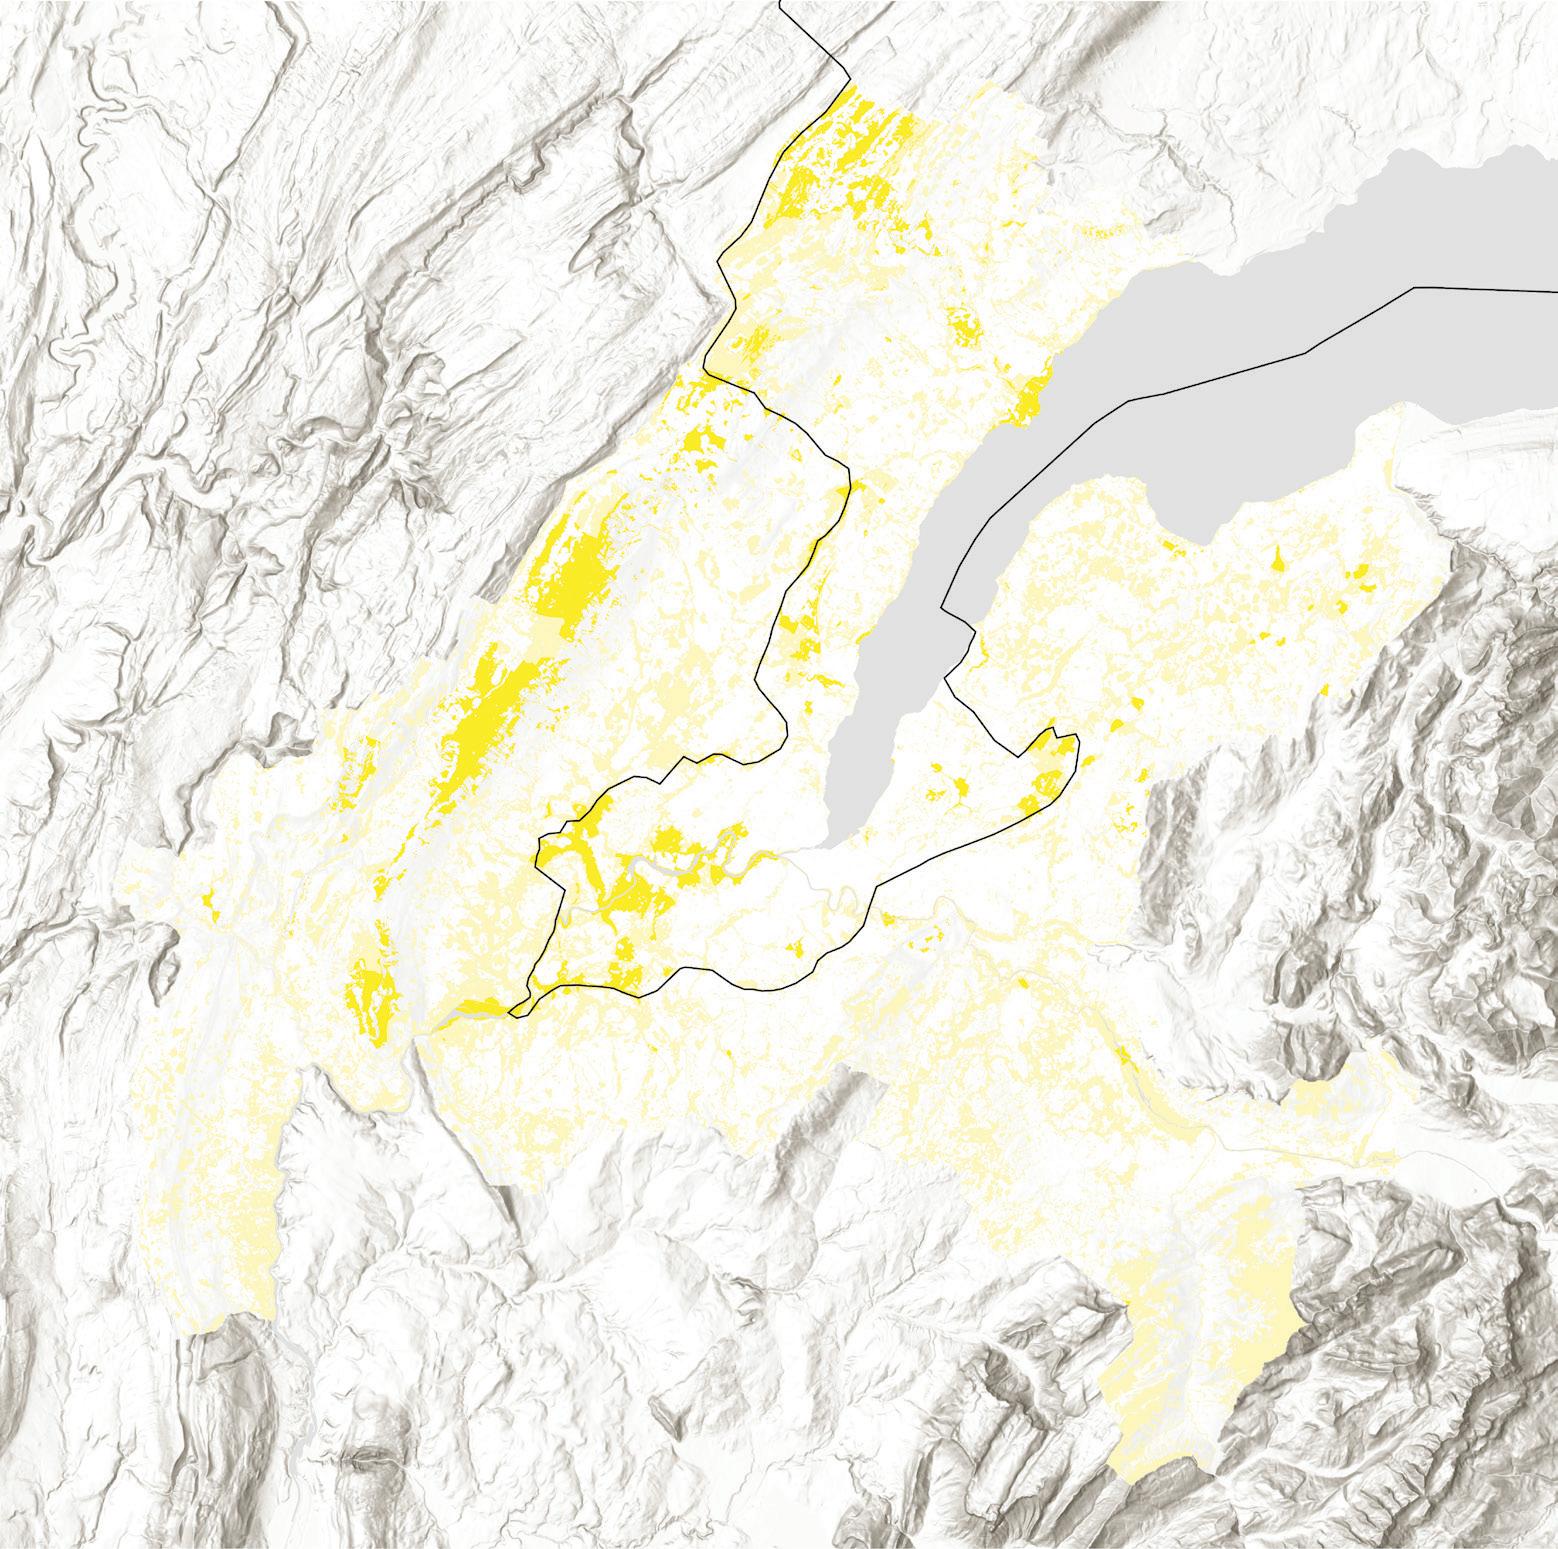
Figure 12.
Sources:
“Agglo - Infrastructure écologique” (AGGLO_IE_PERIMETRE). SITG, 2022.
“Agglo - Périmètre du Grand Genève avec lac” (AGGLO_ PERIMETRE_AVEC_LAC). SITG, 2012.
“Global Land Cover and Land Use Change, 2000–2020.” UMD GLAD, 2022.
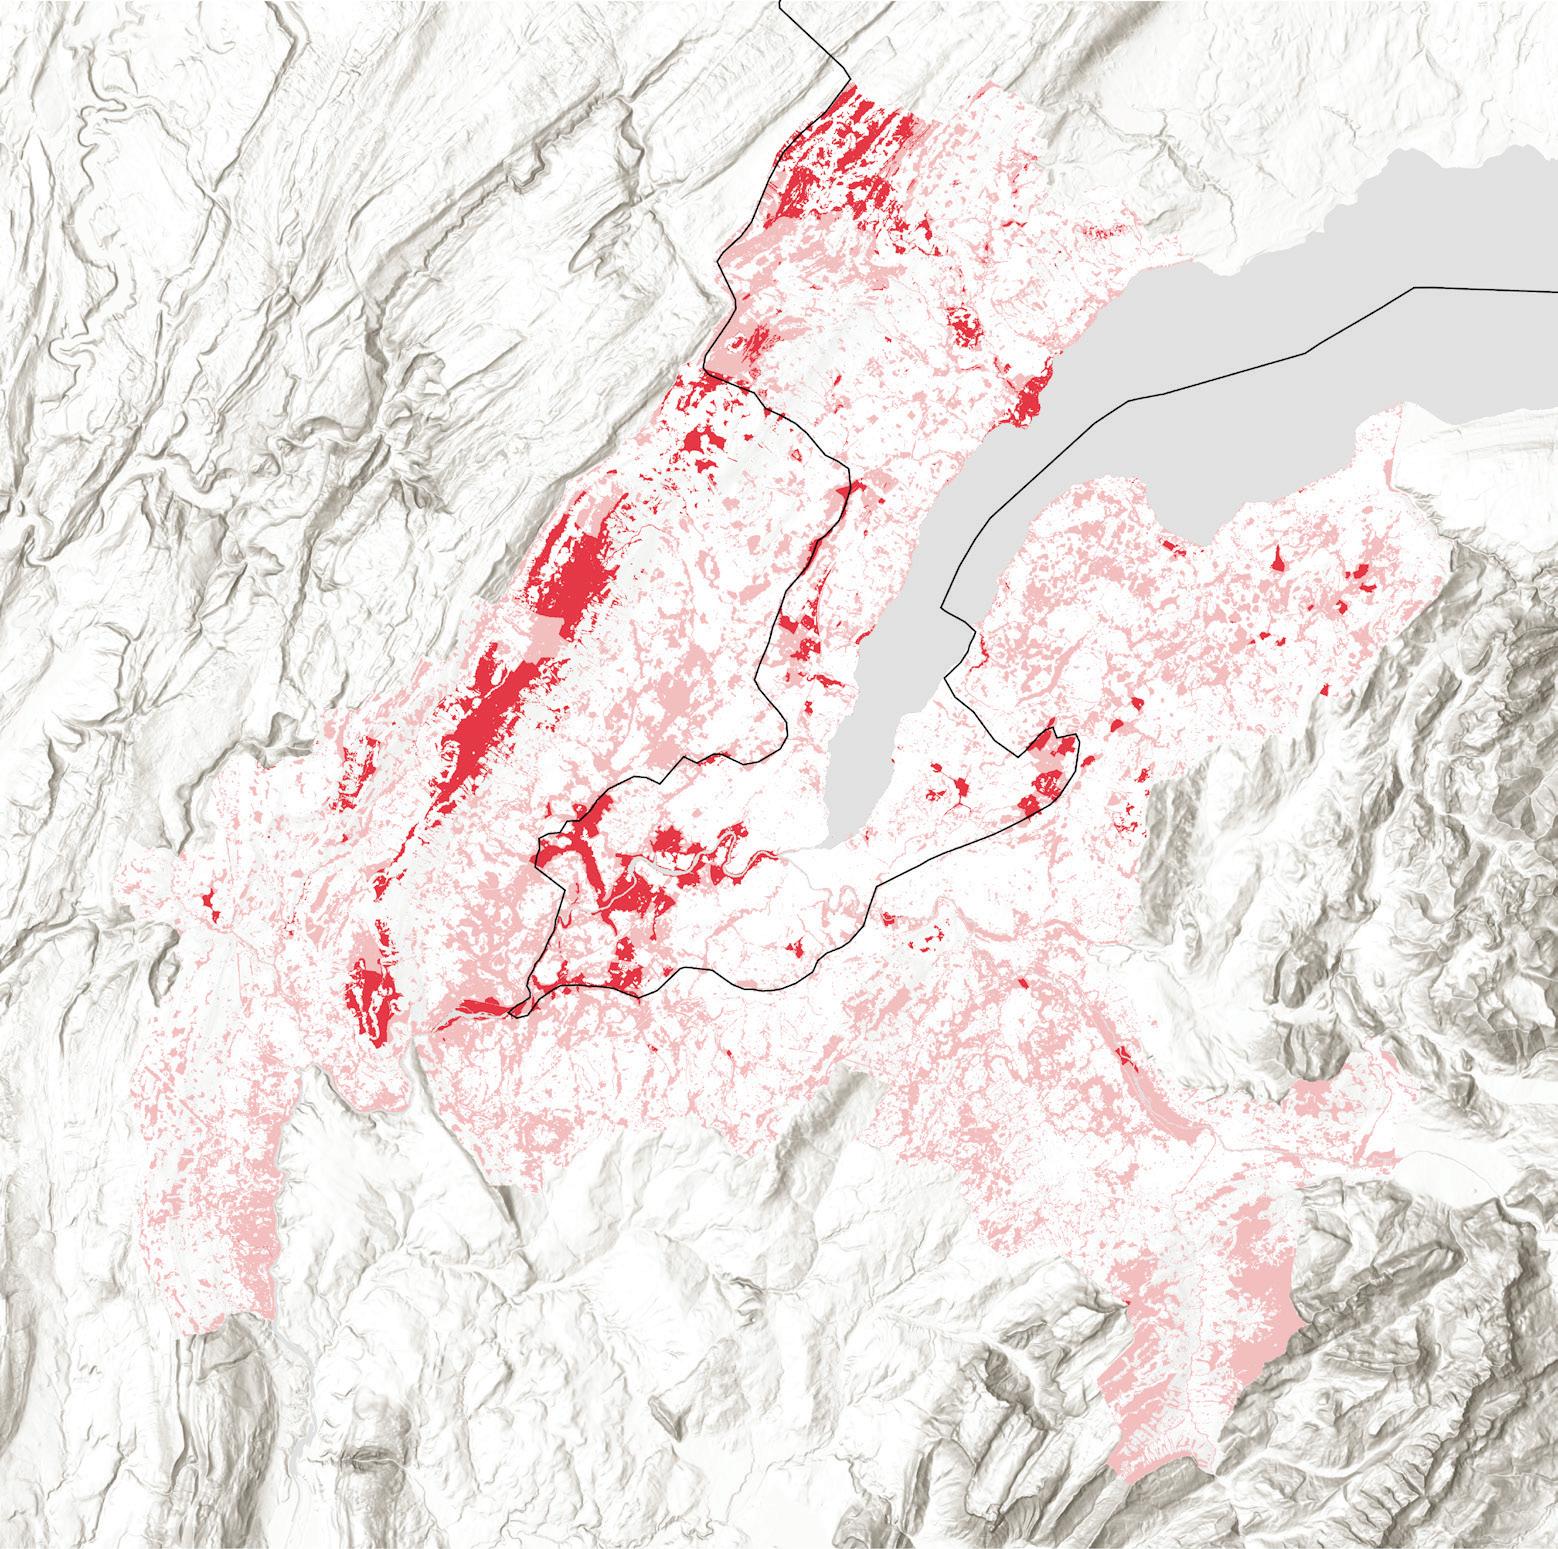
Figure 13.
Sources:
“Agglo - Infrastructure écologique” (AGGLO_IE_PERIMETRE). SITG, 2022.
“Agglo - Périmètre du Grand Genève avec lac” (AGGLO_ PERIMETRE_AVEC_LAC). SITG, 2012.
“Global Land Cover and Land Use Change, 2000–2020.” UMD GLAD, 2022.
If all 64 “urbanization-densification projects” achieved the agglomeration average of 47.5% canopy cover, the region would benefit from 6.3% canopy gain (Figure 14). While each project needs to be assessed for feasibility of reaching this average coverage with a finer grain analysis, canopy goals should also be informed by measurable targets for such strategic investments.
For instance, the Metropolitan Washington Council of Governments recently adopted a new canopy coverage target of 50% across the region to meet their climate goal of a 50% reduction in greenhouse gas (GHG) emissions below 2005 levels by 2030 (Lau 2024). While the City and Canton of Geneva aim to be carbon neutral by 2050, with the City of Geneva concurrently targeting a reduction of GHG emissions by 60% by 2030, these goals do not extend to the entire agglomeration. If only half of the 47.5% regional canopy coverage average were to be met in each of the 64 agglomeration projects, the agglomeration overall would exceed 50% canopy cover on its own and take a substantial leap toward meeting Geneva’s emissions reductions targets.
Under current rates of 0.2% net canopy gain every 20 years, reaching 50% would take 250 years; however, the current Agglomeration Project aims for implementation by 2040, achieving such goals within just 15 years to contribute to 2050 emissions reductions.
In addition to setting a regional canopy coverage goal and targeting canopy investments via already planned urbanization-densification projects throughout the region, the following recommendations are grounded in case studies that reflect the high-level findings of the spatial analysis, as well as corresponding actions for the agglomeration to direct future investments.
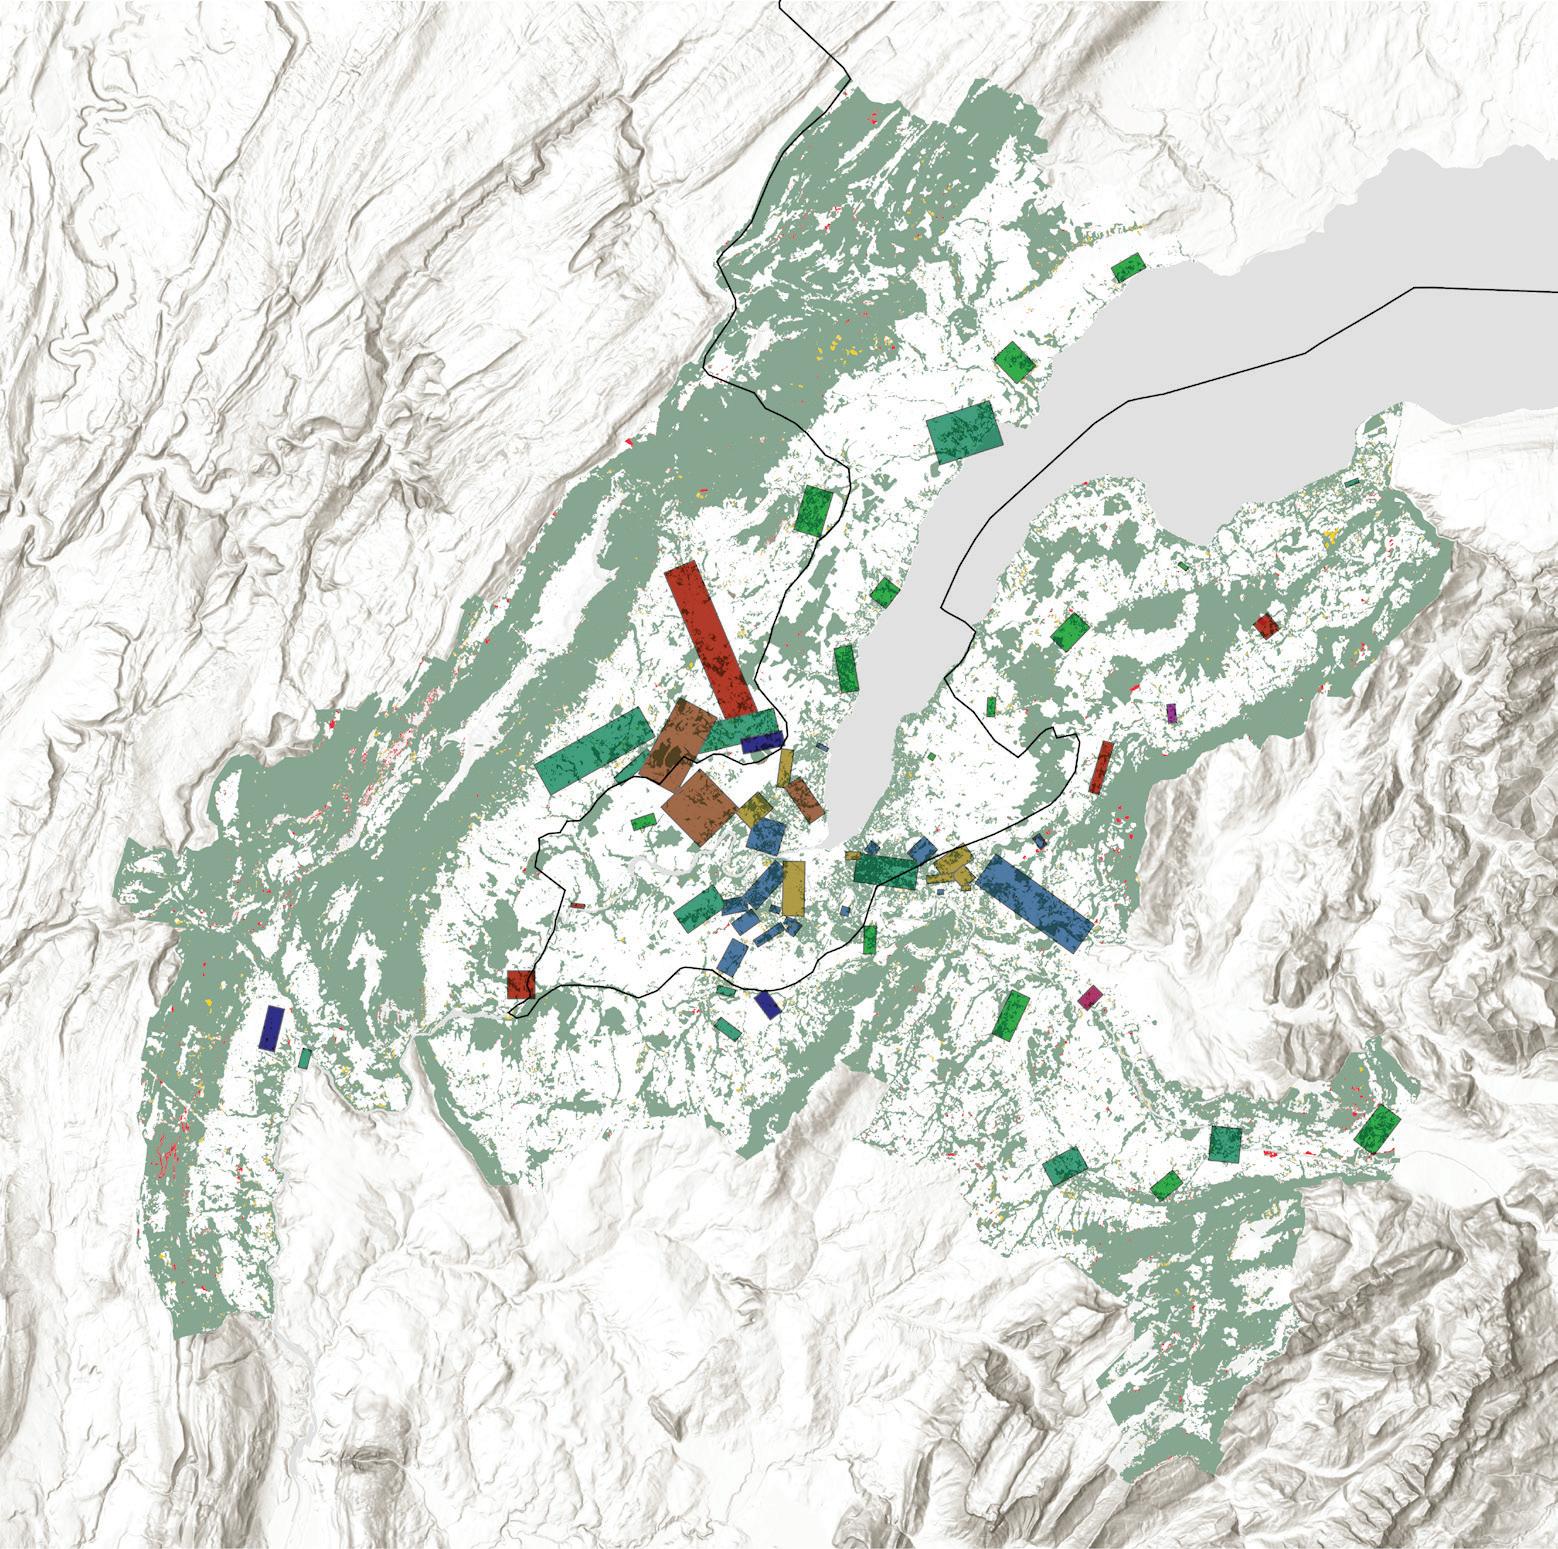
Agglomeration Center
Local
Local Center / Agglomeration
Metropolitan Center
Regional Center
Regional Center / Agglomeration Activity Center
Agglomeration Activity Center
Metropolitan Activity Center
Figure 14.
Sources: “Agglo - Mesures urbanisation” (AGGLO_MES_URBANISATION). SITG, 2025. “Global Land Cover and Land Use Change, 2000–2020.” UMD GLAD, 2022.
In Meyrin, Switzerland, the growth of the municipality has been shaped by its proximity to a dozen urbanization-densification projects, such as the CERN research facility and Geneva Airport, which has spurred urban development while maintaining green spaces through careful planning and ecological management. On the French side, Saint-Genis-Pouilly has similarly expanded with residential and commercial development in tandem with the area’s economic
opportunities. Despite this growth, the French side has faced challenges with more fragmented land use policies, leading to less cohesive green spaces and canopy cover loss. While both municipalities have grown around these major hubs, the Swiss side ensured that urban expansion did not completely encroach on natural areas, in contrast to more uncoordinated growth on the French side.
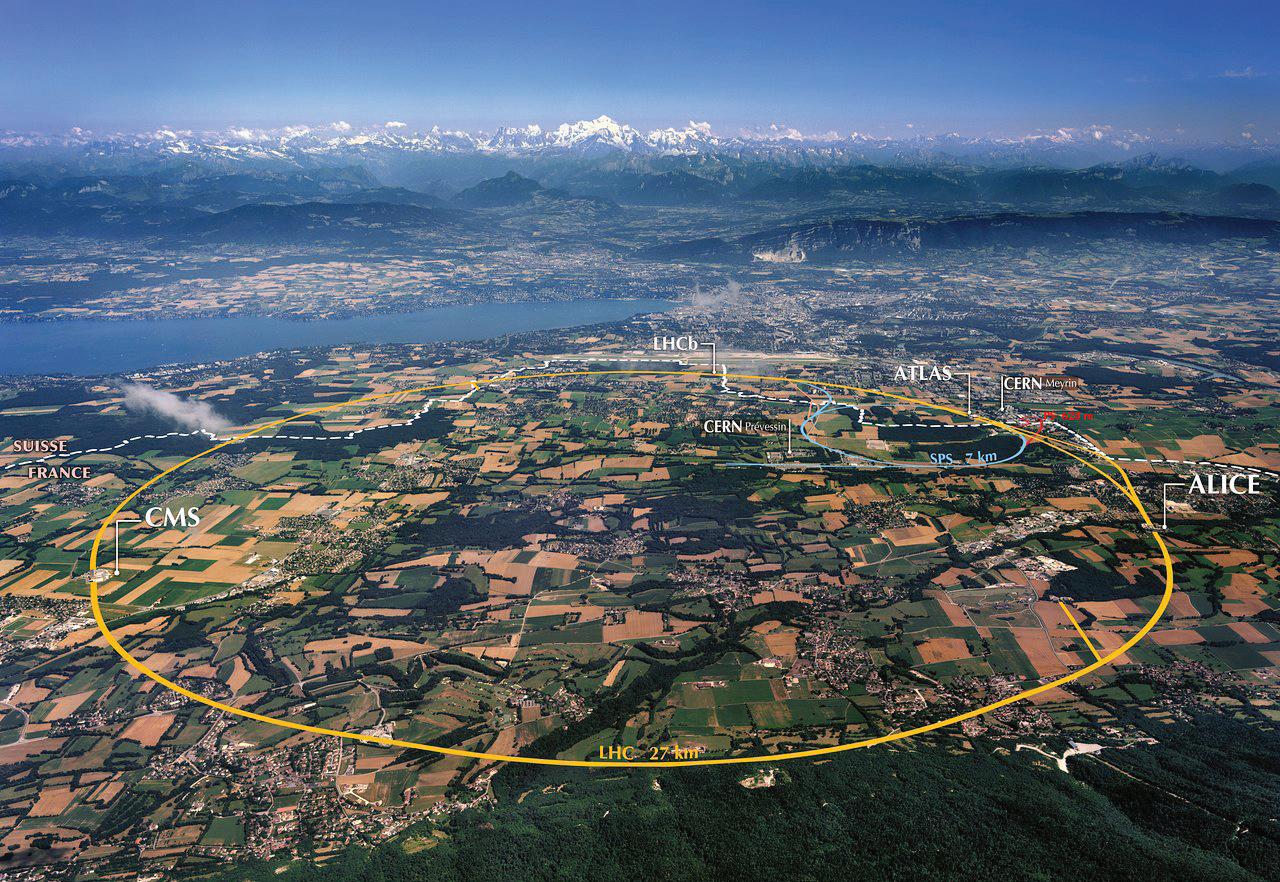
Saint-Genis-Pouilly
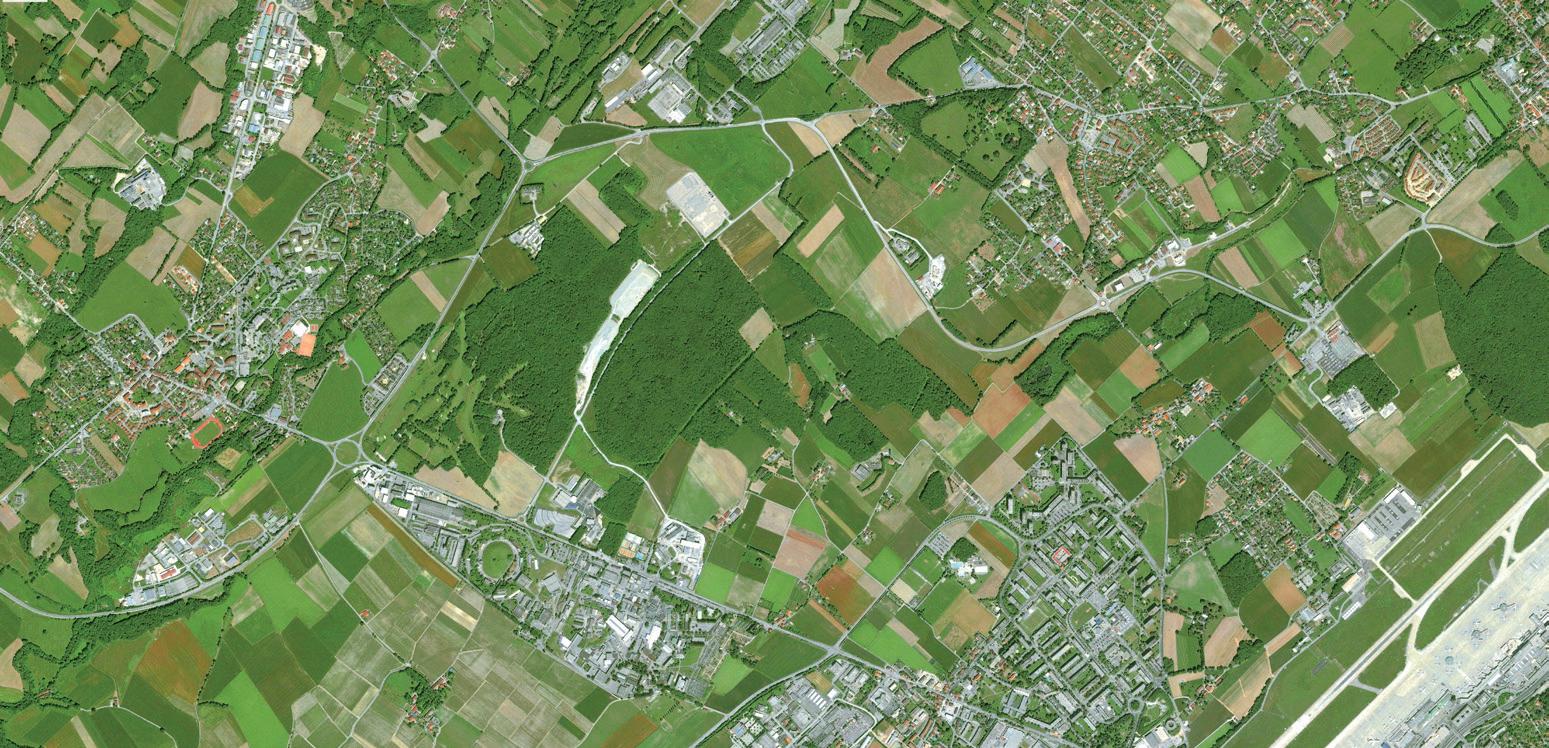
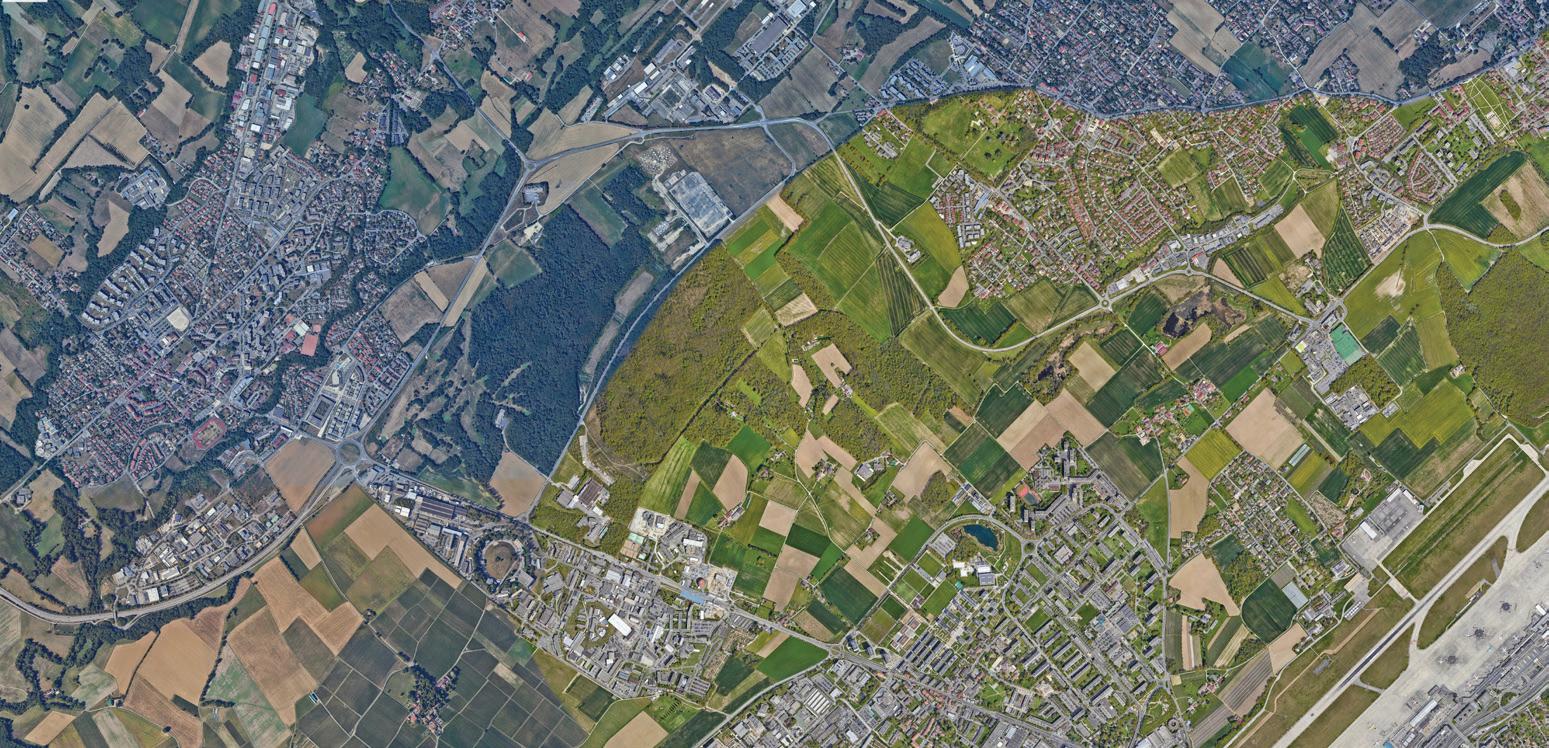
Saint-Genis-Pouilly

Sources: Brice, Maximilien. Aerial View of CERN. Photograph. Accessed May 11, 2025. https://supernova.eso.org/exhibition/images/cern-aerial-cc/.
Google Earth Historic Imagery, 2002–2025.
“Agglo - Mesures urbanisation” (AGGLO_MES_URBANISATION). SITG, 2025.
“Global Land Cover and Land Use Change, 2000–2020.” UMD GLAD, 2022.
In Perly, Switzerland, the well-known Aire River Renaturation Project by Atelier Descombes Rampini and Superpositions has restored the waterway and kept the natural landscape largely intact, with riparian buffers preserved adjacent to agricultural fields. However, just across the border in Saint-Julien-en-Genevois, France, rapid urban growth is evident, with significant residential and commercial development replacing agricultural and forested lands. As
development intensifies, the riparian buffer canopy along the Aire River is cut off at the border, a stark contrast in land management and canopy fragmentation due to urban expansion on the French side. Although the Swiss side’s canopy cover remains stable, French land use change dominates this border juxtaposition, with potential for change through a planned cross-border urbanization-densification project.
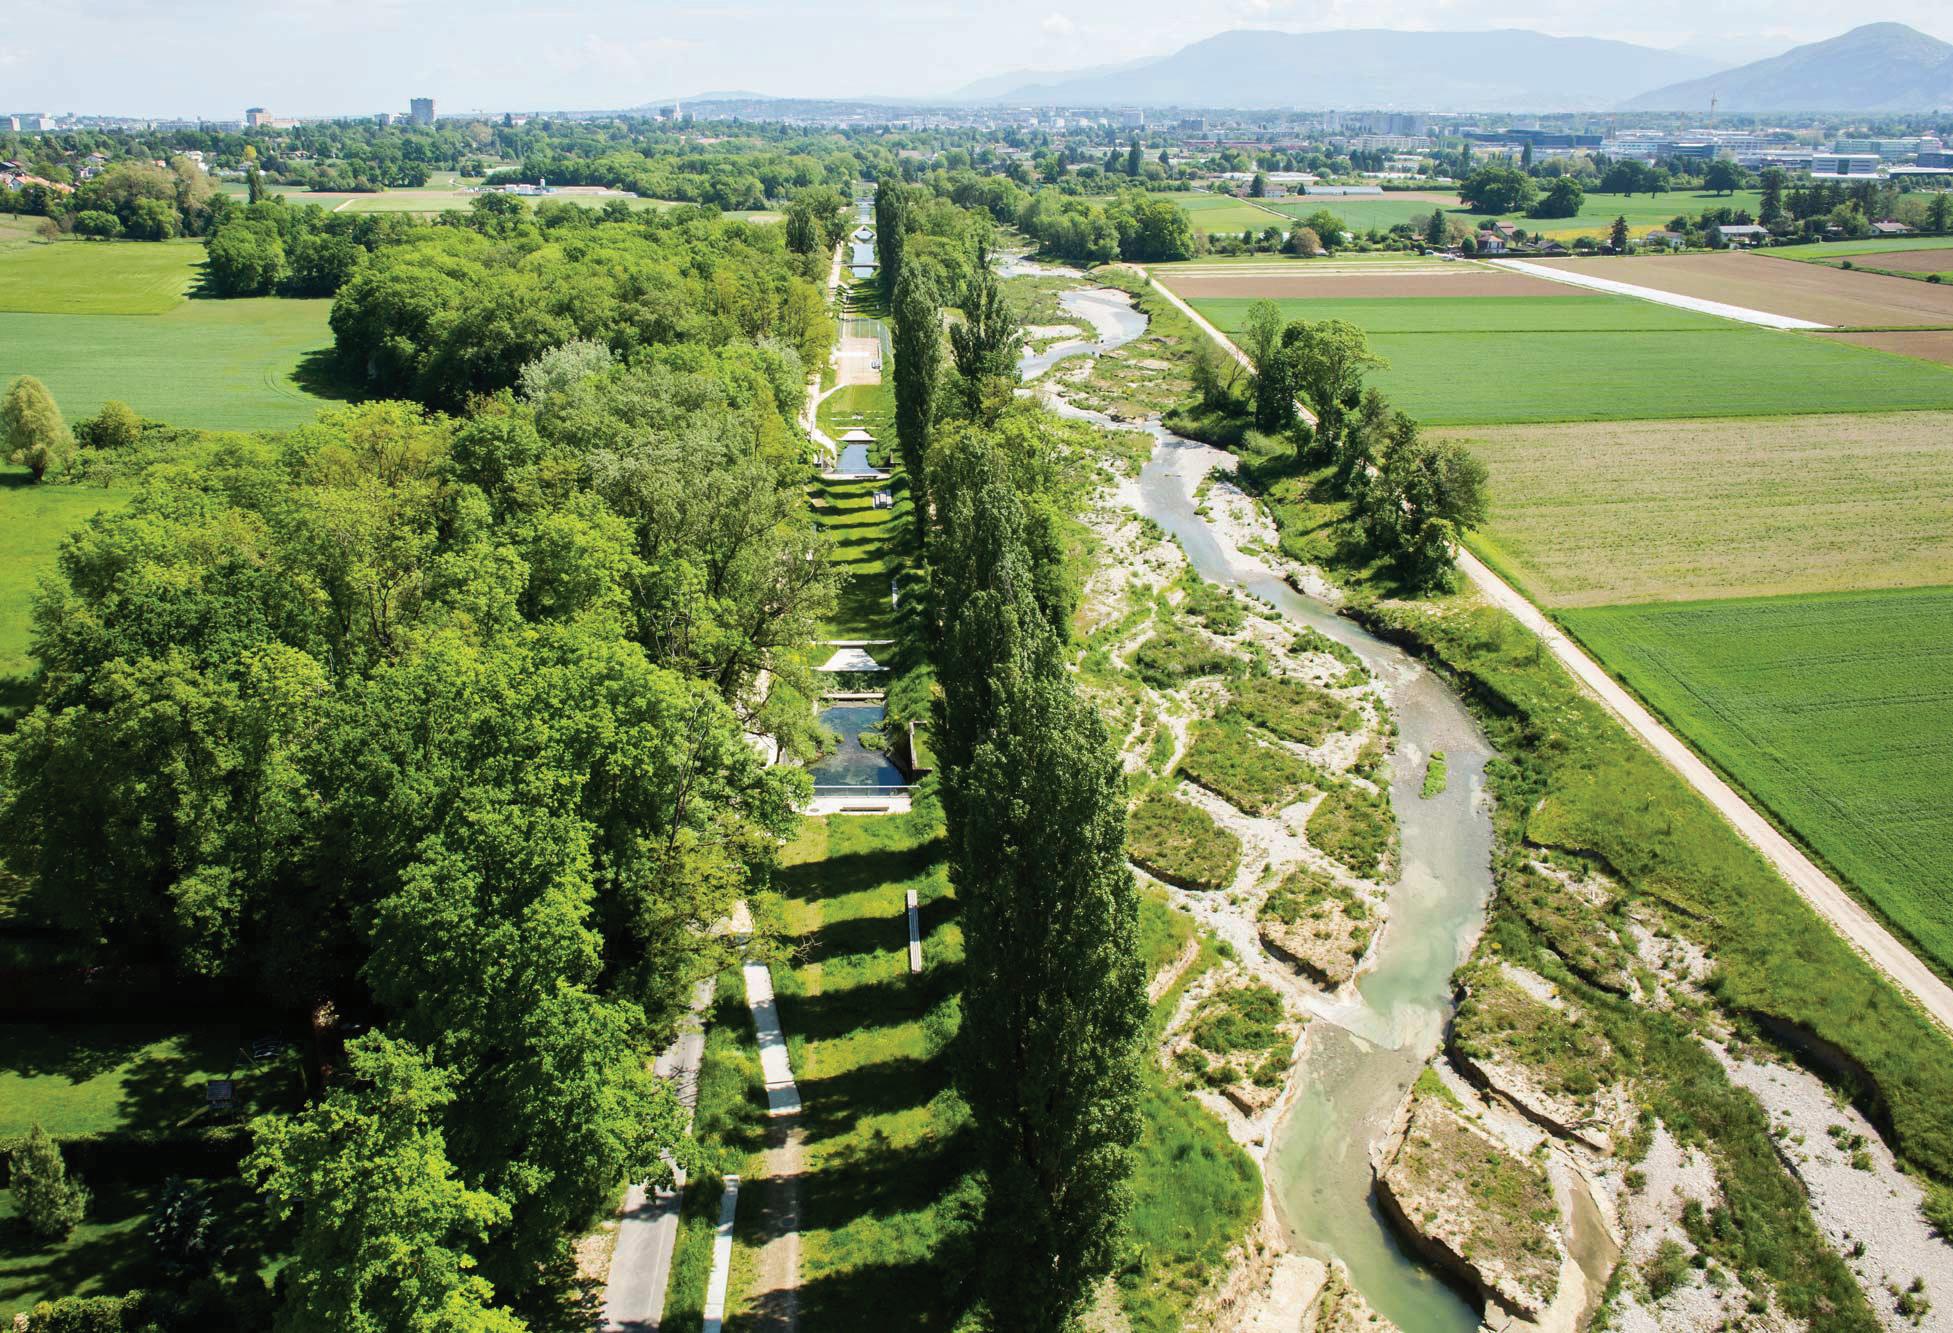
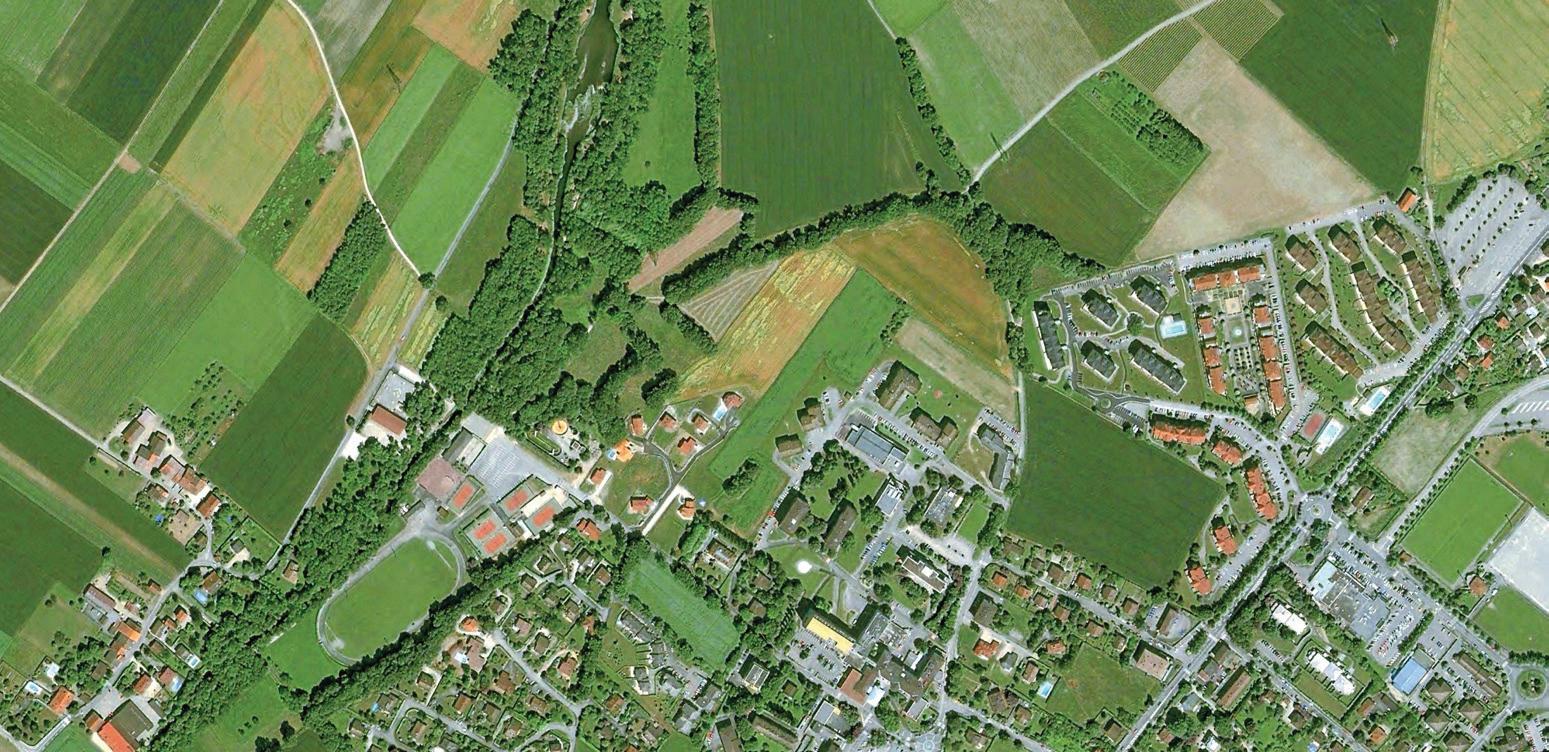

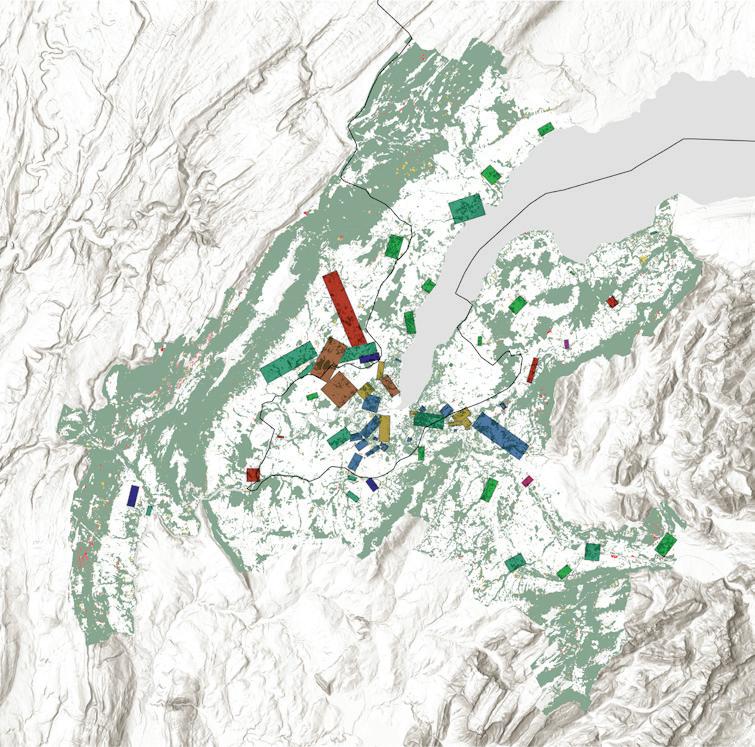
Sources: Chironi, Fabio. Renaturation of the River Aire. June 30, 2016. Photograph. https://landezine.com/renaturation-of-the-river-aire-geneva/.
Google Earth Historic Imagery, 2002–2025.
“Agglo - Mesures urbanisation” (AGGLO_MES_URBANISATION). SITG, 2025.
“Global Land Cover and Land Use Change, 2000–2020.” UMD GLAD, 2022.
The Canton of Geneva has preserved a green belt with stable canopy cover as a critical piece of ecological infrastructure. Protected areas like Réserve naturelle de la Prés de Villette maintain biodiversity and provide vital corridors for wildlife by prioritizing connectivity and limiting sprawl. In contrast, French municipalities just over the border, such as Saint-Cergues, have experienced significant urban growth driven by Geneva’s proximity, leading to the
fragmentation of natural areas and canopy loss, as green spaces are increasingly replaced by housing and industrial development. These adjacencies show a stark juxtaposition between canopy continuity and fragmentation across the border. Nevertheless, the planned Machilly urbanization-densification project has the potential to enhance ecological infrastructure on the French side.
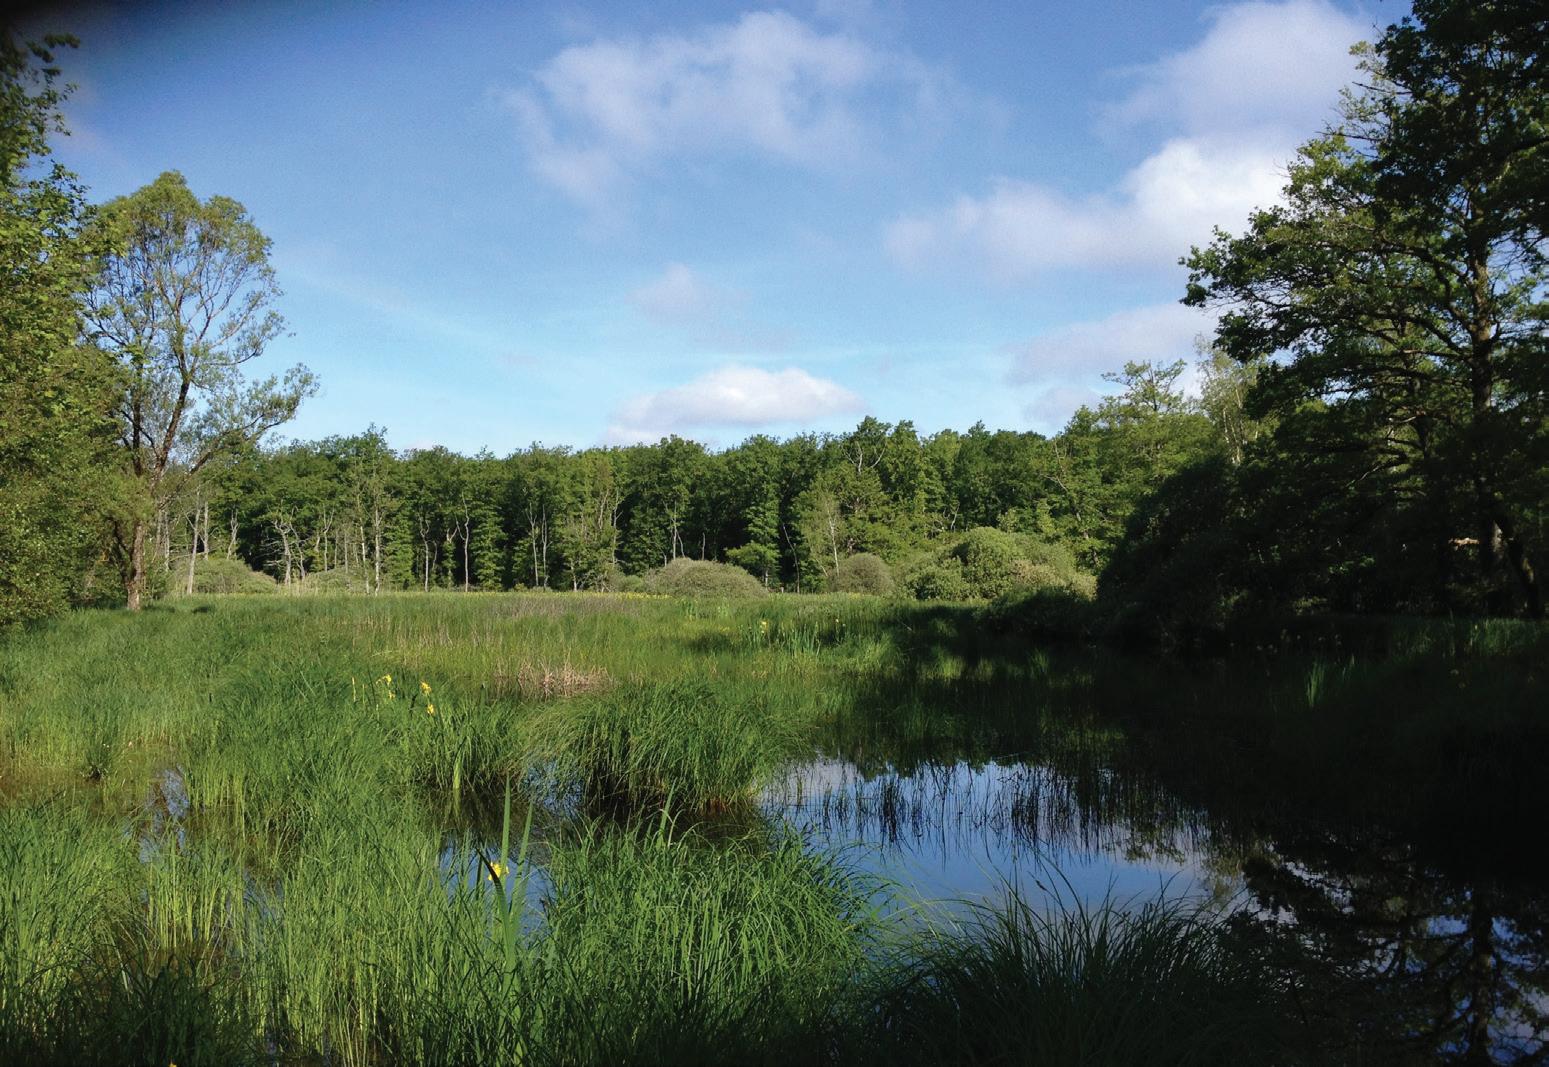
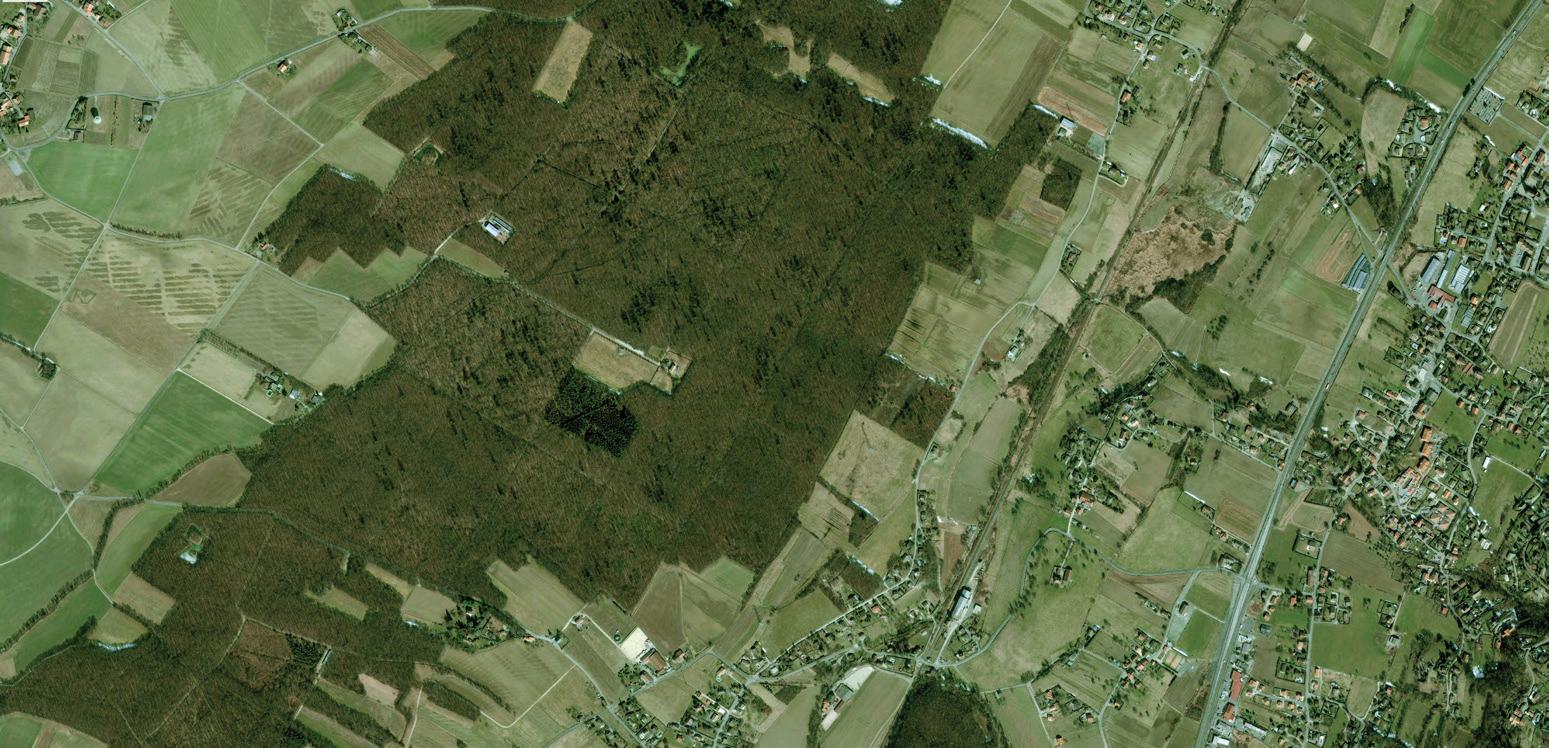
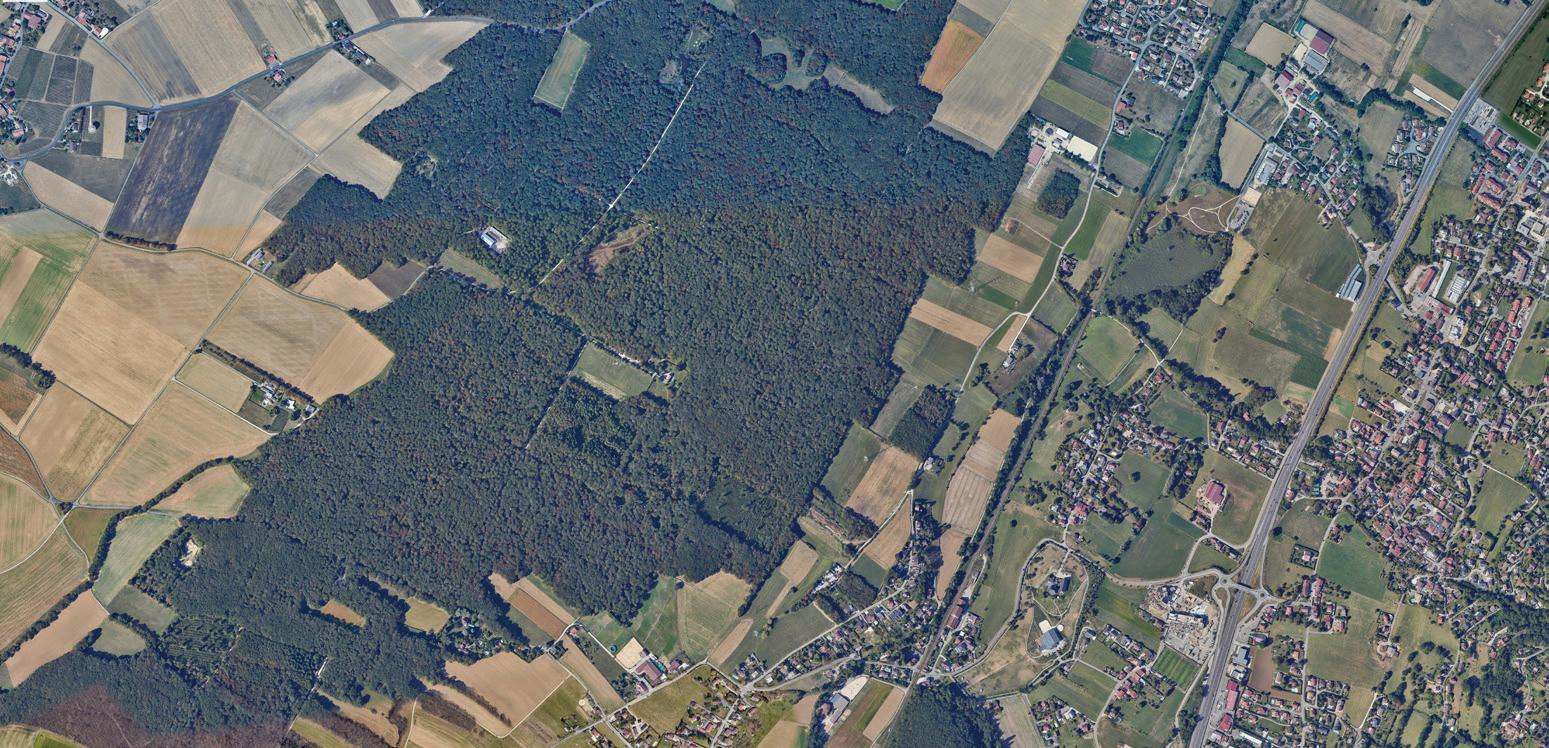

Sources: Spahni, Olivia. Visite de La Réserve Des Prés-de-Villette. May 20, 2016. Photograph. https://agenda.pronatura-ge.ch/ programme-activites/visite-de-la-reserve-des-pres-de-villette/.
Google Earth Historic Imagery, 2002–2025.
“Agglo - Mesures urbanisation” (AGGLO_MES_URBANISATION). SITG, 2025.
“Global Land Cover and Land Use Change, 2000–2020.” UMD GLAD, 2022.
Since Swiss canopy expanded 20.1× faster from 2000 to 2020, and the Canton benefited from 89% of job growth in the last decade while offloading 75% of population growth’s development demands to France, the region needs equitable canopy cover expansion strategies. The Canton of Geneva, as the leader of the Agglomeration Project, should put its resources toward benefiting canopy cover in the French communes where many of those who have enabled its economic growth reside.
Financing mechanisms could include a corporate income tax within the Canton, specifically leveraging the disproportionate job growth. Development impact exactions or linkages could also be used, similar to New York City’s Tree Fund which requires developers to contribute to off-site tree planting. Moreover, the fund could be incorporated into municipal participatory budgeting, much like Paris’s ambitious Plan Arbre tree-planting initiatives that have been funded via the city’s municipal budget, public investment, and public engagement.
Paris plans to transform its Boulevard Périphérique ring road into a circular urban forest bridging the city and its suburbs, which is currently a barrier between the historic wellresourced municipality and the fast-growing banlieues (APUR 2024). This precedent offers a striking parallel to Geneva’s cross-border relationship with France, including lessons for effectively pairing transportation infrastructure investments with canopy cover expansion. With the Swiss federal government co-financing urbanization-densification elements that are transportation-oriented at a rate of 40% (GLCT 2025), there may be opportunities to direct funding toward tree planting, alongside mobility improvements that achieve regional emissions reductions.
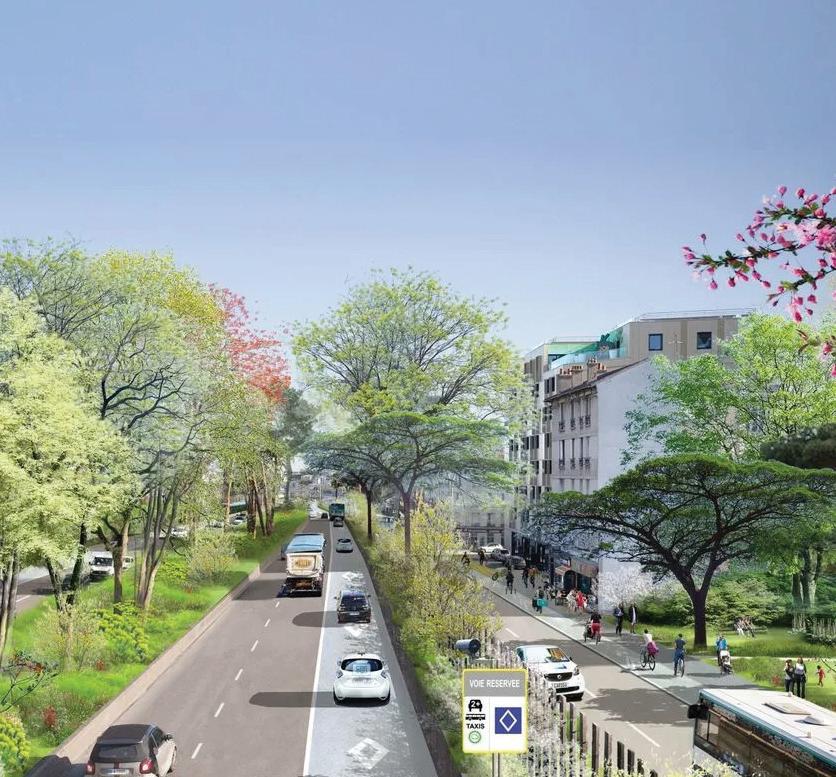

Precedent:
Sources: APUR. “Following Developments along the Boulevard Périphérique and in Green Belt Neighbourhoods.” 2024. https://www.apur.org/en/our-works/following-developments-along-boulevard-peripherique-and-green-belt-neighbourhoods-october-november-2024 . Bloomberg CityLab/Céline Orsingher. “Paris Speeds Up its Pursuit of a Slower Beltway.” 2020. https://www.bloomberg. com/news/articles/2020-06-19/paris-is-plotting-a-greenerslower-beltway.
With 69.2% of land use zone changes linked to tree canopy loss from 2000 to 2020 involving transitions between agriculture and forest, canopy coverage within these zones must be prioritized across the Greater Geneva region. Agroforestry offers a climate-smart approach that allows trees to coexist with productive land use, especially in a cross-border landscape where forests and farmland are intertwined. Practices such as silvopasture and forest farming integrate trees with livestock and understory crops, enhancing biodiversity and soil health. Windbreaks and alley cropping introduce linear canopy elements that reduce erosion and buffer extreme weather, while riparian forest buffers protect waterways and reconnect fragmented habitats. These strategies are particularly wellsuited to the prevalent viticultural zones, which could benefit from microclimate regulation and ecological enhancement.
Lessons from other regions reinforce agroforestry’s potential in Greater Geneva. In Bordeaux, vineyard agroforestry projects have shown that interplanting trees with vines can improve resilience and reduce chemical use without compromising grape quality (Chadoeuf et al. 2019). Research from the European Agroforestry Federation and INRAE has demonstrated that these systems increase biodiversity, buffer against climate extremes, and enhance long-term farm viability (EURAF 2025; INRAE 2025). Similar programs in Wallonia show that success depends on strong stakeholder collaboration, technical assistance, and public support (Walloon 2022). Building on these models, a Grand Genève Agroforestry Program could operate as a cross-border initiative, combining funding, technical expertise, and citizen science to support farmers and advance regional canopy cover and connectivity goals.
Bordeaux, FR
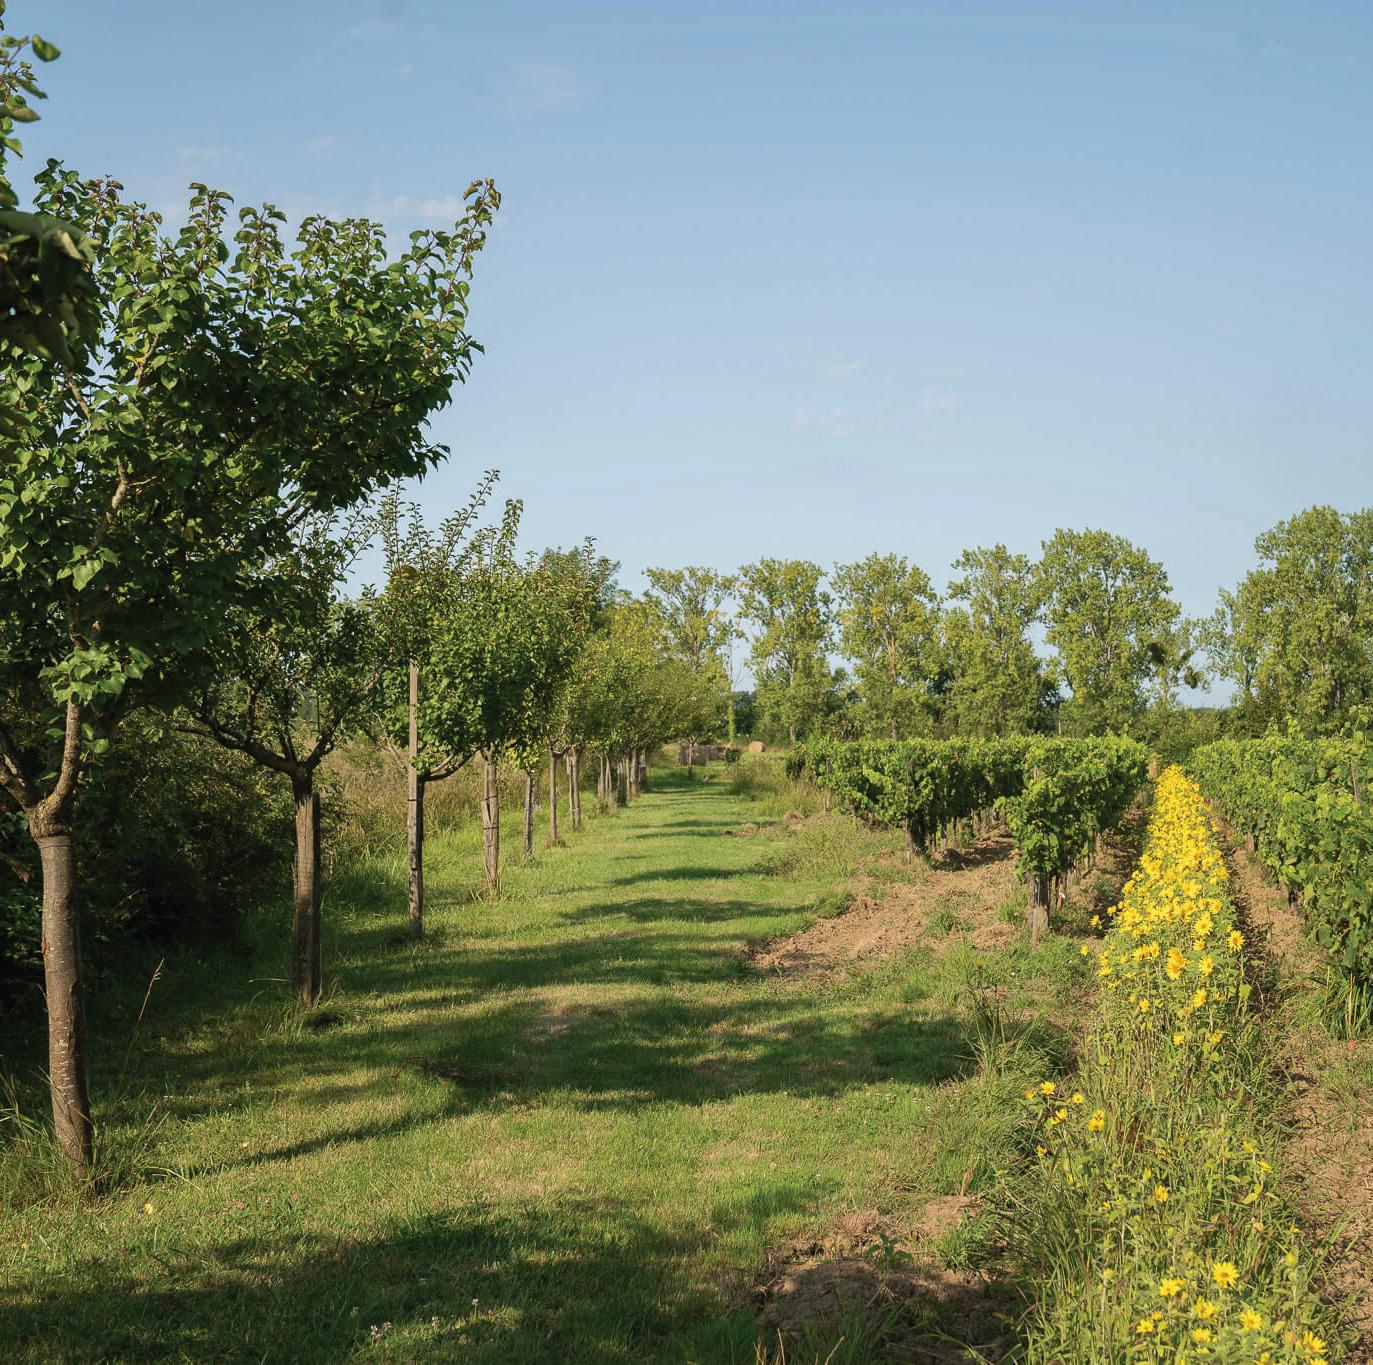
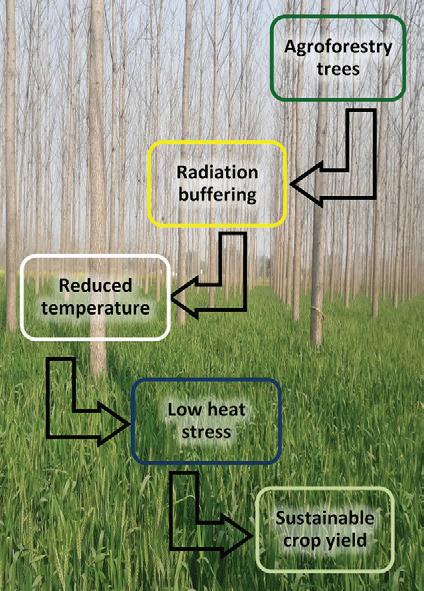
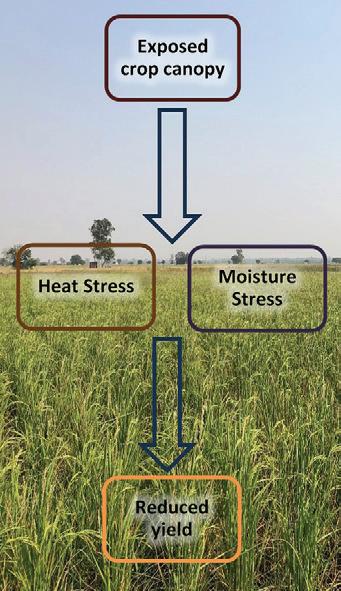
Sources: Vins de Vineyards/Bordeau Magazine. Photograph. 2025. https://www.bordeaux.com/gb/Journal/Education/Agroforestry-and-the-vineyards-of-Bordeaux-6-things-to-know. Kumar, Raj. Photograph. 2022. Popular (Populus deltiodes) based agri-silviculture systems enhances resilience of wheat crop against heat load during during extreme temperature events, Yamunanager, India. In Dobhal S. et al. “Global assessment of production benefits and risk reduction in agroforestry during extreme weather events under climate change scenarios.” Frontiers in Forests and Global Change. 7:1379741.
From 2000 to 2020, 37.8% of canopy loss in Greater Geneva occurred within ecological infrastructure, including lands with nominal protections. On the French side, forest protection zoning is inconsistent with weak enforcement, as local Plans Locaux d’Urbanisme (PLUs) can override broader ecological goals. While designations like ZNIEFFs or Natura 2000 signal ecological value, they rarely impose strict development limits. In contrast, the Canton of Geneva uses centralized planning and binding protections through its Plan Directeur Cantonal, effectively integrating forests into an ecological network. French municipalities could benefit from stronger, uniform zoning categories to restrict forest conversion, especially in corridors critical to biodiversity and connectivity.
A valuable model can be found in Massachusetts’ Natural Resource Protection Zoning (NRPZ), which concentrates development in less ecologically sensitive areas, preserving contiguous canopy cover (Lacy). This approach safeguards forests and habitat connectivity while providing developers with flexibility and predictability. French municipalities could integrate the ecological infrastructure data into zoning overlays to guide where development can and cannot occur—particularly in periurban areas under pressure. Complementary tools such as cluster development (grouping housing to preserve open space), agricultural zoning (reserving prime farmland from urban expansion), and transfer of development rights (allowing density to shift away from ecologically sensitive zones) can reinforce forest protection without halting development. Adopting these principles under the Greater Geneva framework would provide a coordinated, cross-border strategy to address forest fragmentation and secure long-term ecological resilience.
Natural Resource Protection Zoning
Massachusetts, US
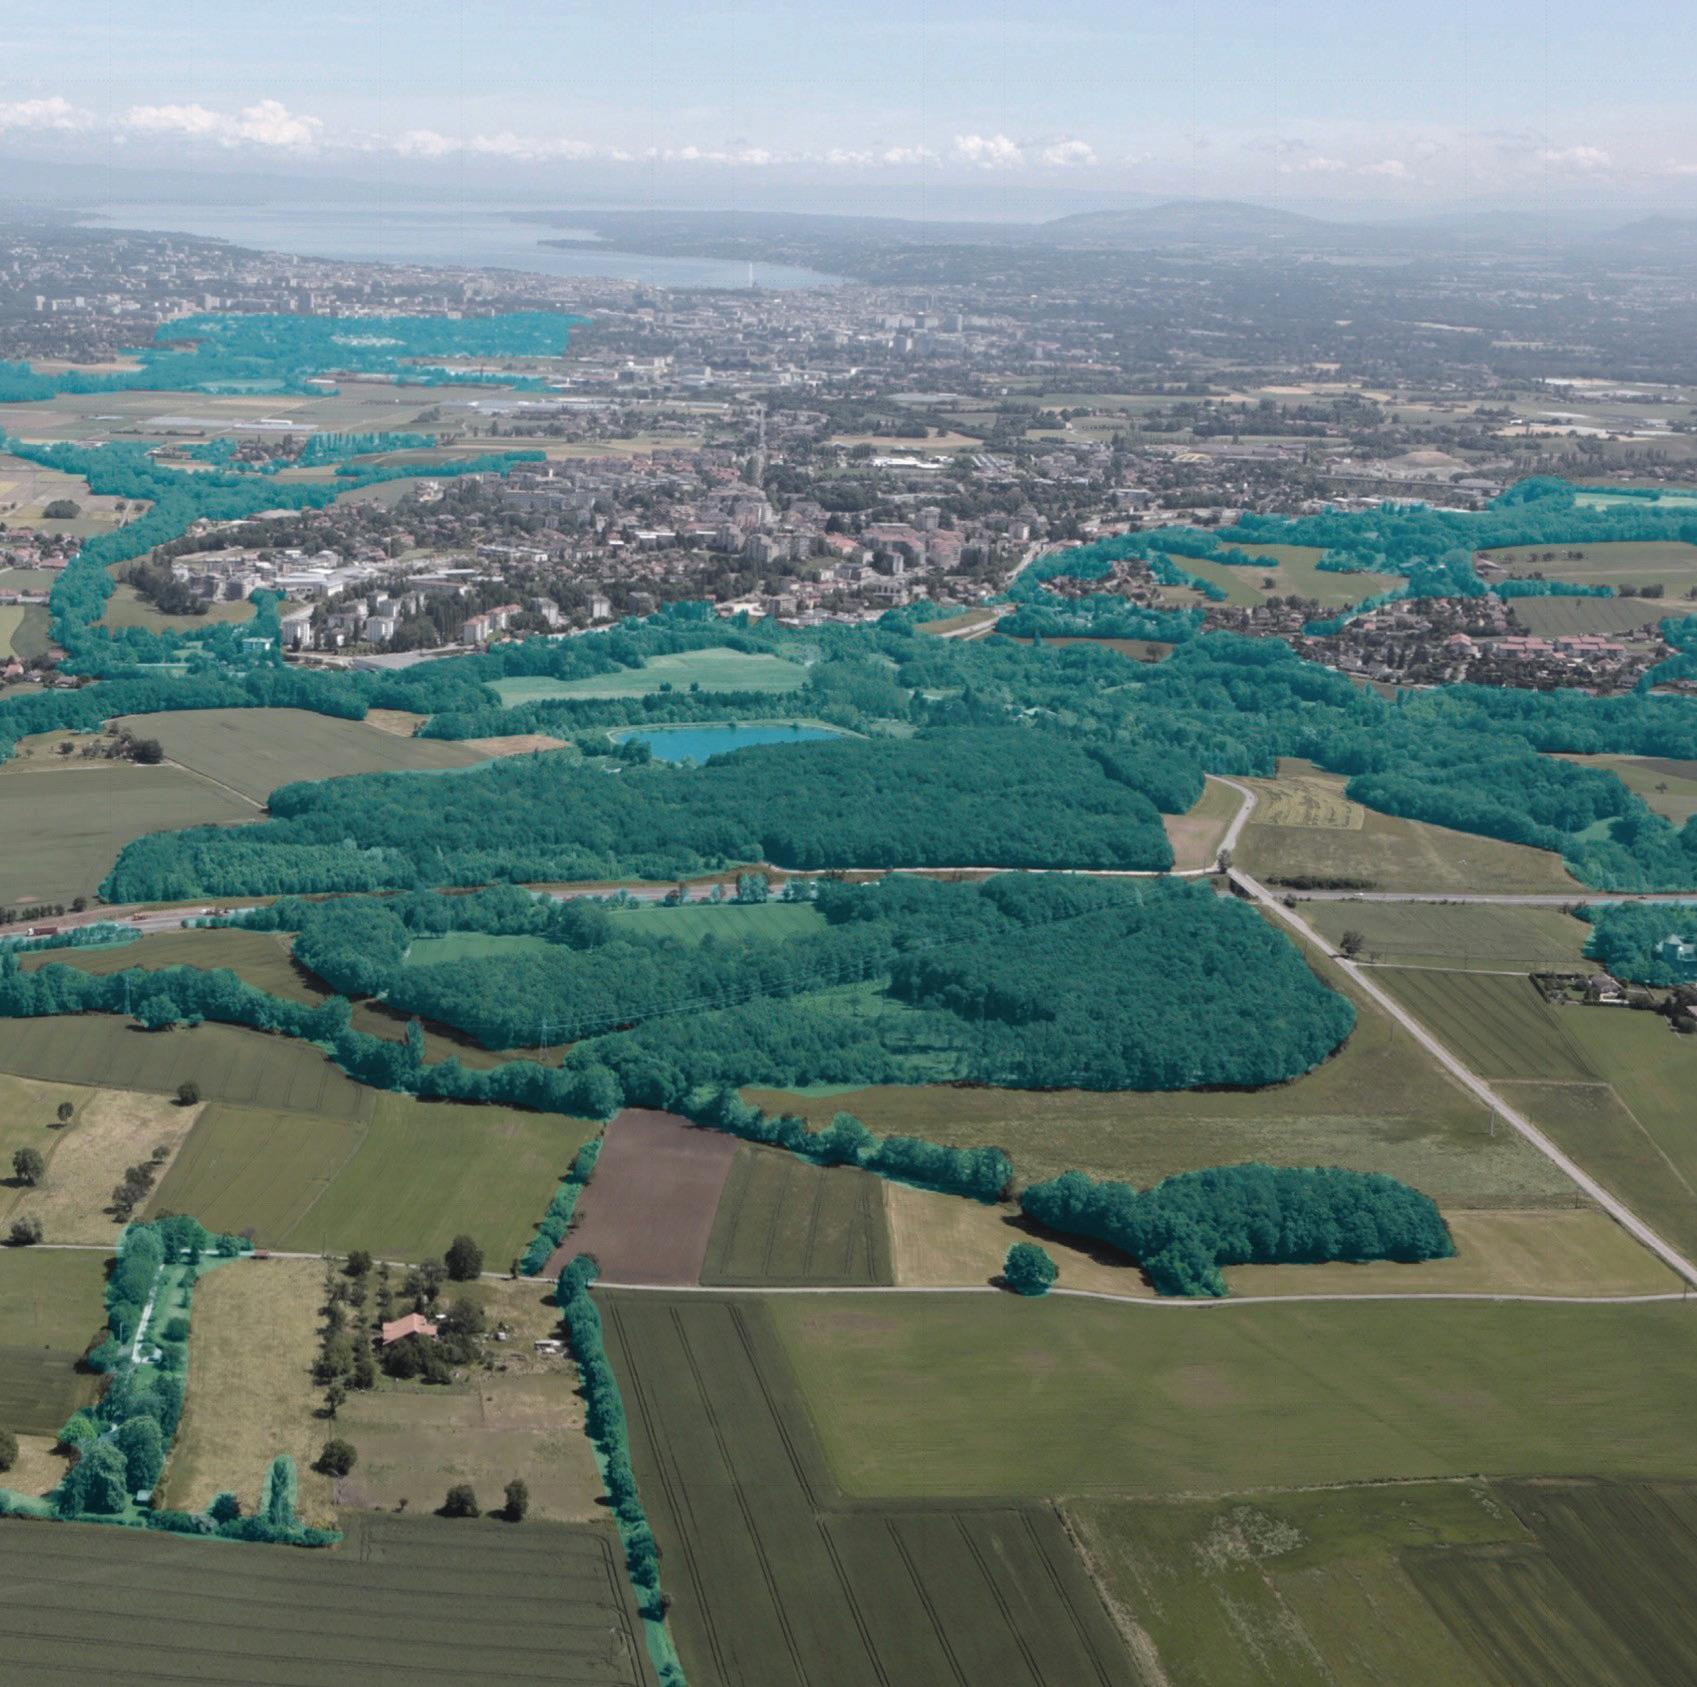
Precedent: Map of MA NRPZ Municipal Adoption
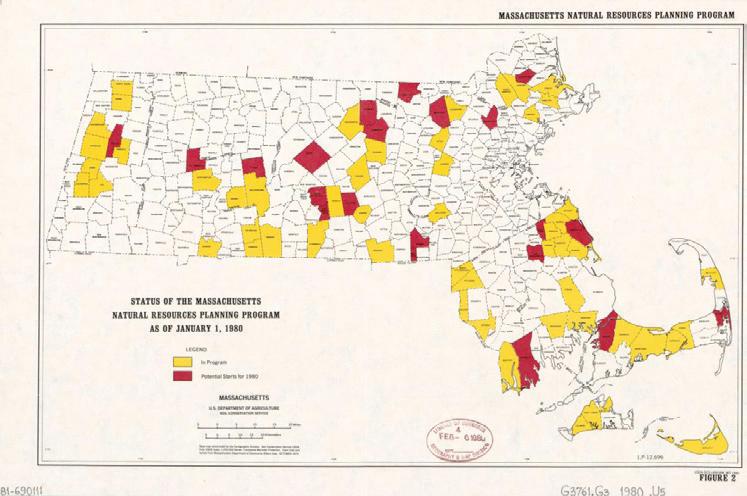
Sources: Team Grand Genève et son sol, Grand Netzwerk Stadt und Landschaft, 2020. https://www.nsl.ethz.ch/greater-genevaand-its-soil-the-built-and-the-unbuilt/ United States Soil Conservation Service. Map. “Status of the Massachusetts natural resources planning program as of January 1, 1980.” Lanham, MD : USDA-SCS, 1980. https://www. loc.gov/item/81690111/.
The regional forest findings focused on inequitable cross-border canopy gain, canopy loss centered in forest/agriculture zones, and canopy loss across critical ecological infrastructure aim to influence how the City and Canton of Geneva, along with the Agglomeration Project, allocate canopy expansion resources for the entire region. Overall, these levels of governance should prioritize action on the French side of the border, especially in areas with agroforestry potential and quality landscape composition, structure, connectivity, and ecological infrastructure to best serve Greater Geneva.
This research concludes with an open-ended question:
What is the value of canopy cover at the regional scale?
While this analysis does not intend to evaluate the importance of the regional forest, it can offer a series of rationales for why the agglomeration should strive for more equitable regional canopy cover in light of uneven development. First, canopy cover across the region has a significant cooling effect by mitigating urban heat island (Ge et al. 2020). Outside of urban areas, the regional forest has a more outsized impact in carbon sequestration to meet emissions reduction targets (Lau 2024) and improve air quality (Kofel et al. 2024). Furthermore, prioritizing landscape composition, structure, connectivity, and ecological services in green infrastructure benefits habitat and biodiversity (Honeck et al. 2020).
Further analysis could build upon various components of this study. Expanding the extent of 2-meter Lidar remote sensing data to include the French side of the agglomeration could calibrate prioritization efforts, and allow future planting of urbanization-densification projects to take plantable area and other high-resolution measures into account. In June 2025, a fifth Agglomeration Project will be submitted to the Swiss federal government including more “urbanization-densification measures” for co-financing, which offers potential for the latest regional plan to expedite regional canopy expansion goals (GLCT 2025). As the most critical next step, a regional canopy committee should be formed within the Agglomeration Project, dedicated to taking action on the essential management of preserving and expanding the regional forest (Lau 2024).
Hence, regional canopy cover can be leveraged as a powerful ecological tool—not to reinforce uneven development, but rather to advance tree canopy equity throughout Greater Geneva.
Code de l’environnement. Légifrance. Accessed May 12, 2025. https://www. legifrance.gouv.fr/codes/texte_lc/LEGITEXT000006074220/.
Confédération Suisse. Loi fédérale sur les forêts (LFo), RS 921.0. Accessed May 12, 2025. https://www.fedlex.admin.ch/eli/ cc/1992/1945_1945_1945/fr.
Confédération Suisse. Loi fédérale sur l’aménagement du territoire (LAT), RS 700. Accessed May 12, 2025. https://www.fedlex.admin.ch/eli/ cc/1979/1578_1578_1578/fr.
Direction Régionale de l’Environnement, de l’Aménagement et du Logement (DREAL) Auvergne-Rhône-Alpes. Plans Locaux d’Urbanisme et Enjeux Environnementaux. Accessed May 12, 2025. https:// www.auvergne-rhone-alpes.developpement-durable.gouv.fr/.
European Agroforestry Federation (EURAF). “Agroforestry in Europe: Enhancing the Productivity and Sustainability of Land Use.” Accessed May 12, 2025. https:// euraf.net.
European Environment Agency (EEA). Land Cover and Land Use in Europe. Accessed May 12, 2025. https://www.eea.europa.eu/ publications/COR0-landcover.
INRAE (Institut national de recherche pour l’agriculture, l’alimentation et l’environnement). “Agroforestry Systems: Advantages and Applications” Accessed May 12, 2025. https://www.inrae.fr/en/news/agroforestry-systems.
Ge, Xu, Dasaraden Mauree, Roberto Castello, and Jean-Louis Scartezzini. 2020. “Spatio-Temporal Relationship between Land Cover and Land Surface Temperature in Urban Areas: A Case Study in Geneva and Paris.” ISPRS International Journal of Geo-Information 9 (10): 593. https://doi. org/10.3390/ijgi9100593.
GLCT. Documents Stratégiques de la Région. Grand Genève: Agglomération Franco-Valdo-Genevoise. 2025. https://www. grand-geneve.org/.
Guichot, Flore, ed. 2024. Beyond the Radio-Centric Metropolis: City-Territory and Network Pluralities in The Great Geneva. Transit-Oriented Development for Inclusive and Sustainable Rural-Urban Regions. Ecole Polytechnique Fédérale de Lausanne, Habitat Research Center & Laboratory of Urbanism. https://www. epfl.ch/research/domains/habitat/ wp-content/uploads/2024/03/book_Lausanne_TOD_compressed.pdf.
Honeck, Erica, Atte Moilanen, Benjamin Guinaudeau, Nicolas Wyler, Martin A. Schlaepfer, Pascal Martin, Arthur Sanguet, et al. 2020. “Implementing Green Infrastructure for the Spatial Planning of Peri-Urban Areas in Geneva, Switzerland.” Sustainability 12 (4): 1387. https://doi.org/10.3390/su12041387.
Kofel, Donato, Ilann Bourgeois, Romana Paganini, Aurèle Pulfer, Charlotte Grossiord, and Julia Schmale. 2024. “Quantifying the Impact of Urban Trees on Air Quality in Geneva, Switzerland.” Urban Forestry & Urban Greening 101 (November):128513. https://doi.org/10.1016/j.ufug.2024.128513.
Lacy, Jeff. “Natural Resource Protection Zoning.” MassWoods, University of Massachusetts Amherst, n.d. https:// masswoods.org/sites/masswoods.net/ files/pdf-doc-ppt/natural_resources_protection_zoning.pdf.
Lau, Amanda. “COG Board Adopts a New Regional Tree Canopy Goal.” Metropolitan Washington Council of Governments, April 11, 2024. https://www.mwcog. org/newsroom/2024/04/11/cog-boardadopts-a-new-regional-tree-canopy-goal-climate--energy-conservation-forestryurban-forestry/.
Ministère de la Transition Écologique. Schéma de Cohérence Territoriale (SCoT). Accessed May 12, 2025. https://www. ecologie.gouv.fr/scot-schema-coherence-territoriale.
Muséum national d’Histoire naturelle. Inventaire National du Patrimoine Naturel (INPN): ZNIEFF et Natura 2000. Accessed May 12, 2025. https://inpn. mnhn.fr/.
Observatoire statistique transfrontalier de l’agglomération franco-valdo-genevoise. Occupation du sol et évolution des espaces naturels et agricoles. Accessed May 12, 2025. https://www.ge.ch/statistique/ domaines/environnement.
Potapov P., Hansen M.C., Pickens A., Hernandez-Serna A., Tyukavina A., Turubanova S., Zalles V., Li X., Khan A., Stolle F., Harris N., Song X.-P., Baggett A., Kommareddy I., Kommareddy A. “The global 2000-2020 land cover and land use change dataset derived from the Landsat archive: first results.” Frontiers in Remote Sensing. 2022. https://doi.org/10.3389/ frsen.2022.856903.
République et canton de Genève. Plan Directeur Cantonal 2030. Accessed May 12, 2025. https://www.ge.ch/document/ plan-directeur-cantonal-2030.
Samuel Chadoeuf, François Frécon, and Éric Malézieux. Agroforesterie Viticole: Guide Pratique. Montpellier SupAgro-INRA. 2019.
Smith, Neil. Uneven Development: Nature, Capital, and the Production of Space. University of Georgia Press, 1990. https:// www.jstor.org/stable/j.ctt46nmvk.
Turner, Monica G., and Robert H. Gardner. 2015. Landscape Ecology in Theory and Practice: Pattern and Process. New York, NY: Springer. https://doi.org/10.1007/9781-4939-2794-4.
Walloon Region Public Service. “Agroforesterie en Wallonie: Bilan et Perspectives.” 2022. https:/ /agriculture.wallonie.be.
“Agglo - Communes et territoires voisins” (AGGLO_COMMUNES). SITG, 2025.
“Agglo - Évolution des zones d’affectation entre 2010 et 2014” (AGGLO_ZAFF_SIMPL_EVOL_10_14). SITG, 2014.
“Agglo - Évolution des zones d’affectation entre 2015 et 2020” (AGGLO_ZAFF_SIMPL_EVOL_15_20). SITG, 2020.
“Agglo - Infrastructure écologique” (AGGLO_ IE_PERIMETRE). SITG, 2022.
“Agglo - Mesures urbanisation” (AGGLO_ MES_URBANISATION). SITG, 2025.
“Agglo - Périmètre du Grand Genève avec lac” (AGGLO_PERIMETRE_AVEC_LAC). SITG, 2012.
“Agglo - Zones d’affectation simplifiée 2020” (AGGLO_ZONE_AFF_SIMPLIFIEE_2020). SITG, 2020.
APUR. “Following Developments along the Boulevard Périphérique and in Green Belt Neighbourhoods.” 2024. https://www. apur.org/en/our-works/following-developments-along-boulevard-peripherique-and-green-belt-neighbourhoods-october-november-2024.
Bloomberg CityLab/Céline Orsingher. “Paris Speeds Up its Pursuit of a Slower Beltway.” 2020. https://www.bloomberg. com/news/articles/2020-06-19/paris-isplotting-a-greener-slower-beltway.
Brice, Maximilien. Aerial View of CERN. Photograph. Accessed May 11, 2025. https://supernova.eso.org/exhibition/ images/cern-aerial-cc/.
Chironi, Fabio. Renaturation of the River Aire. June 30, 2016. Photograph. https:// landezine.com/renaturation-of-the-river-aire-geneva/.
“Circa year 2000 Landsat 7 cloud-free image composite.” UMD GLAD, 2022. https:// glad.umd.edu/dataset/GLCLUC2020. GLCT. “Vision d’ensemble Grand Genève 2040.” Map. Grand Genève: Agglomération Franco-Valdo-Genevoise. 2021. https://www.grand-geneve.org/.
“Global Land Cover and Land Use Change, 2000–2020.” UMD GLAD, 2022. https:// glad.umd.edu/dataset/GLCLUC2020. Google Earth Historic Imagery, 2002–2025. Kumar, Raj. Photograph. 2022. Popular (Populus deltiodes) based agri-silviculture systems enhances resilience of wheat crop against heat load during during extreme temperature events, Yamunanager, India. In Dobhal S. et al. “Global assessment of production benefits and risk reduction in agroforestry during extreme weather events under climate change scenarios.” Frontiers in Forests and Global Change. 7:1379741.
Spahni, Olivia. Visite de La Réserve Des Présde-Villette. May 20, 2016. Photograph. https://agenda.pronatura-ge.ch/programme-activites/visite-de-la-reservedes-pres-de-villette/.
Team Grand Genève et son sol, Grand Netzwerk Stadt und Landschaft, 2020. https:// www.nsl.ethz.ch/greater-geneva-and-itssoil-the-built-and-the-unbuilt/. United States Soil Conservation Service. Map. “Status of the Massachusetts natural resources planning program as of January 1, 1980.” Lanham, MD : USDA-SCS, 1980. https://www.loc.gov/item/81690111/. Vins de Vineyards/Bordeau Magazine. Photograph. 2025. https://www.bordeaux. com/gb/Journal/Education/Agroforestryand-the-vineyards-of-Bordeaux-6-thingsto-know.

Rose Van Grinsven
Master in Landscape Architecture (MLA) Candidate
Harvard
Graduate School of Design
The 3-30-300 Rule, introduced in 2021 as a flexible guideline for urban forestry, recommends that every resident should be able to see at least three trees from their home, live in a neighborhood with at least 30% tree canopy cover, and be no more than 300 meters from a high-quality public greenspace.
This report investigates how Geneva, Switzerland currently aligns with these benchmarks, using each building within the city as a unit of analysis. It evaluates tree visibility based on proximity, canopy cover at the neighborhood level, and walking distance to green spaces larger than 0.25 hectares. Findings reveal that while 85% of buildings meet the tree visibility criterion and 82% are within 300 meters of greenspace, only 7% of neighborhoods meet the 30% canopy cover threshold.
The analysis identifies canopy cover as the greatest limiting factor due to Geneva’s urban density, particularly in historic areas. Key recommendations include increasing tree planting in low-canopy neighborhoods by converting impervious surfaces into plantable areas, and creating new green spaces in zones removed from publicly accessible parks. By strategically focusing on areas that meet only one criterion, Geneva can ensure that all residents benefit from at least two components of the 3-30-300 Rule, promoting a more equitable and context appropriate urban forest.
Since the proposal of the 3-30-300 Rule as a guideline for urban forestry in 2021, numerous efforts to map and quantify the existing state of cities have been initiatiated. The terms of the 3-30-300 Rule are intentionally vague and are left to each city to interpret their application. This research seeks to answer the question: How and where does Geneva, Switzerland meet the criteria of the 3-30-300 Rule? It also aims to identify the limiting factors and highlight potential opportunities. For the sake of this analysis, each building within the city limits of Geneva, Switzerland is used as a basic unit to describe which rules are and are not met.
Of the three components of the 3-30-300 rule, the criterion of “three trees visible from every home, school, and workplace” is the most difficult to measure due to limitations in data on individual building windows and their viewsheds. To spatialize this rule, this analysis adopts the approach used by Cobra Groeninzicht in the Netherlands, who assumes that trees within 30 meters of a building are likely visible. To further refine this assumption, the report categorizes tree visibility as follows:
• Trees within 15 meters of a building are considered most likely visible.
• Trees between 16 to 30 meters away are considered likely visible.
• Trees beyond 30 meters are considered not visible.
Buildings with three or more trees within 15 meters are shown in green. Buildings with three or more trees between 16 and 30 meters are shown in orange. Buildings without three trees within a 30-meter radius are shown in red. This analysis relies on individual tree point data and building footprint data. Some limitations include incomplete individual tree data and the lack of topographic consideration, which could result in incorrect assumptions—such as trees behind corners being visible or trees more than 30 meters away being assumed invisible when they may be seen from upper floors.
To evaluate canopy cover across neighborhoods, this report uses Geneva’s statistical sub-sectors as neighborhood boundaries. Buildings located within sub-sectors with canopy cover of 30% or more are shown in green. Those in sub-sectors with 25% to 29% canopy cover are shown in orange, indicating proximity to the target. Lastly, buildings in sub-sectors with less than 25% canopy cover are shown in red. This analysis uses Geneva’s 2023 canopy cover data, building footprints, and statistical sub-sector boundaries. For assessing proximity to high-quality green spaces, the report first defines such spaces as publicly accessible areas larger than 0.25 hectares. A 300-meter walking distance buffer is applied from the perimeter of each greenspace, using buildings as obstacles to simulate realistic walking paths. Buildings within this 300-meter range are shown in green; those outside it are shown in red. This analysis utilizes Geneva’s public open space and building footprint data.
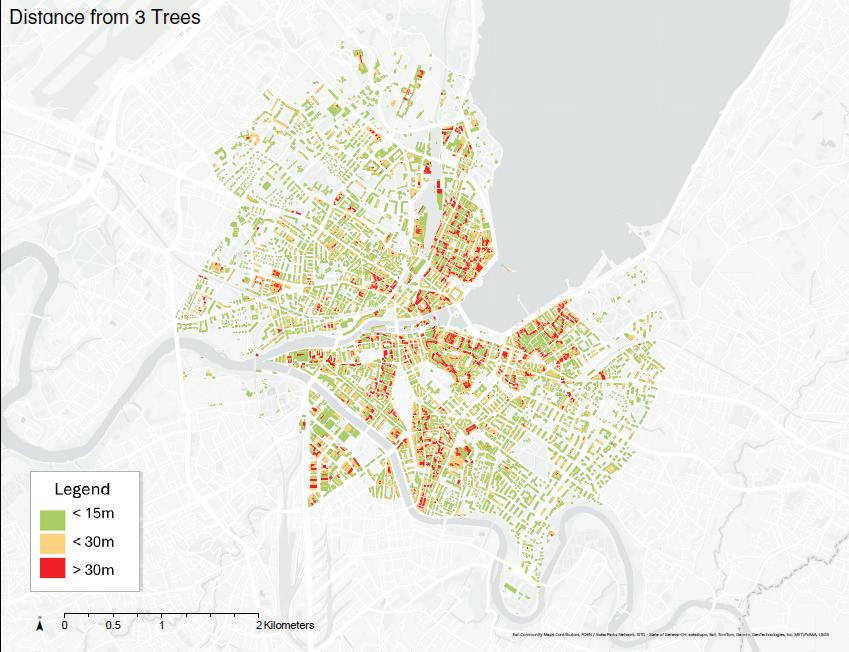
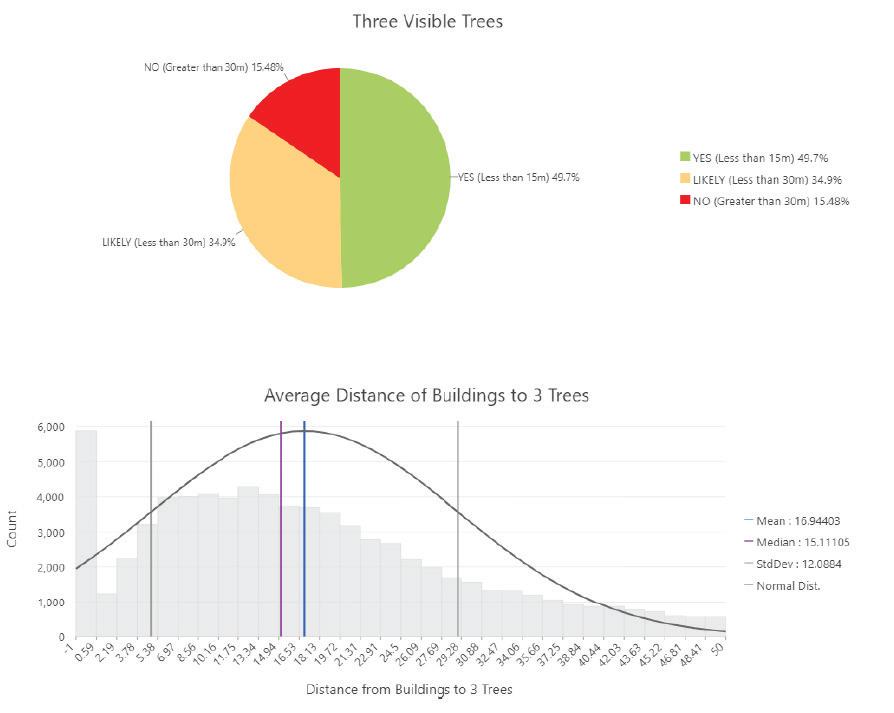
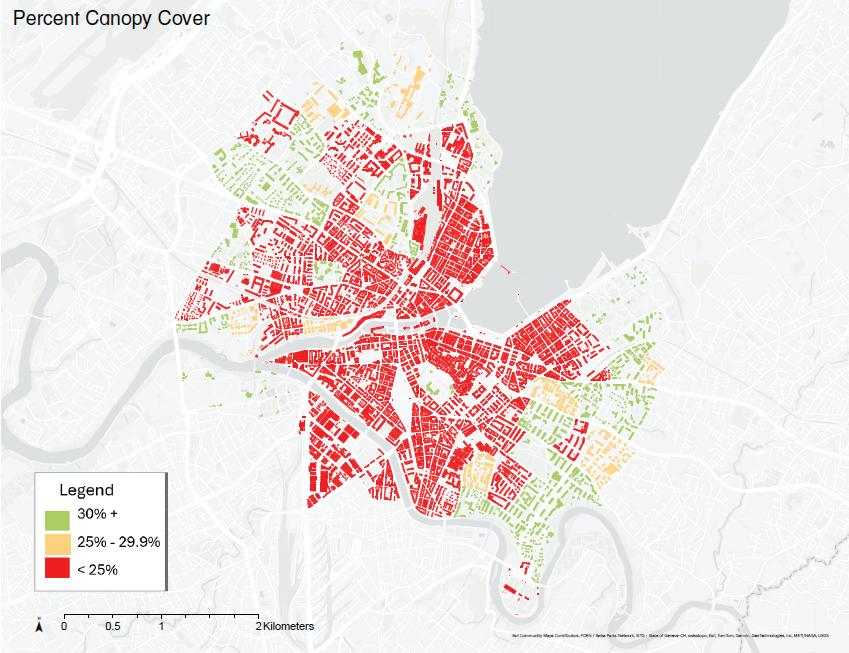
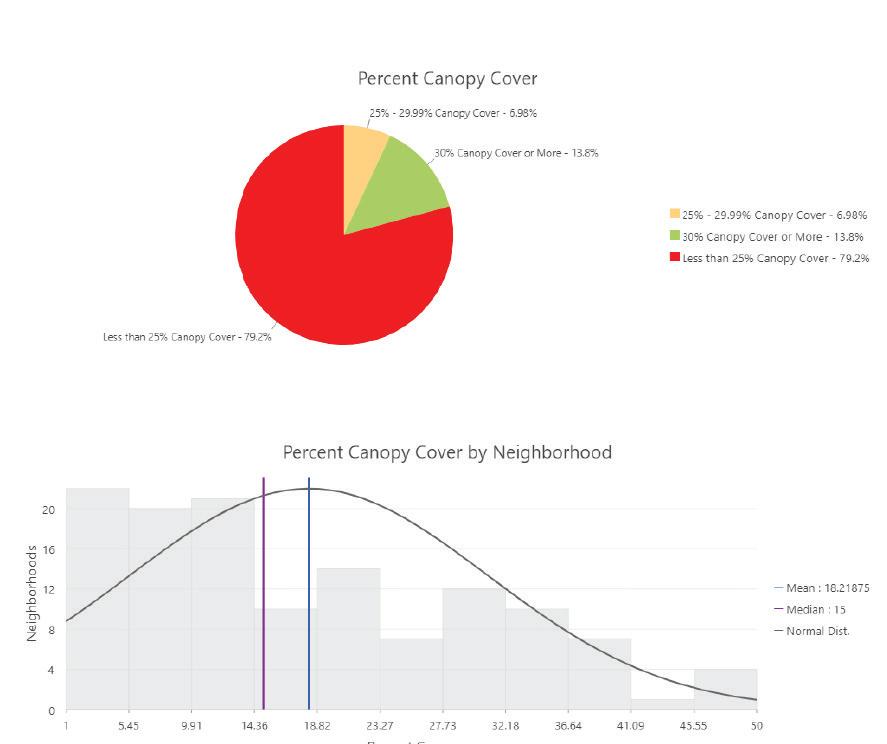

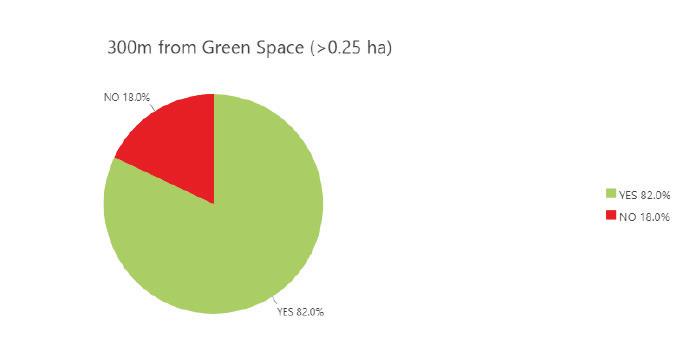
1) The average distance from buildings to three trees is 17 meters. Approximately 85% of buildings within city limits are likely to have views of three visible trees.
2) Only 7% of statistical sub-sectors have canopy cover of 30% or more. 80% have less than 25% canopy cover. The average canopy cover across sub-sectors is 18.2%.
3) 82% of buildings are within 300 meters of a publicly accessible greenspace larger than 0.25 ha.
These findings indicate that canopy cover is the most significant limiting factor for Geneva in achieving the 3-30-300 Rule. While citywide achievement of 30% canopy cover may be technically possible, it is unlikely to be equitably distributed across all neighborhoods. In some dense statistical areas, achieving this level of canopy cover may be impractical. Nevertheless, about 80% of buildings meet at least two of the three criteria, which represents a strong starting point.
First, there is opportunity to increase canopy cover in statistical sub-sectors that have less than 25% canopy cover by converting what are currently impervious public open spaces (e.g. plaza’s etc.) into plantable areas.
Second, there are opportunities to create new public open spaces centrally located in areas that are more than 300m from a park. This could be conducted through the removal of buildings, the conversion of streets into pedestrian boulevards, or the creation of publicly accessible rooftop gardens along with other inventive ideas.
Lastly, if 80% of the buildings in Geneva meet at least 2 rules, how can areas that only meet 1 one rule be prioritized so that they also can meet 2 rules?
This could be accomplished by strategically planting new street trees in areas where buildings do not have 3 visible trees near by or implementing the previous two recommendations in an acupuncture approach to achieve at least 2 rules across the entire city.
This report invites reflection on the purpose of the 3-30-300 Rule and the broader goals of urban forestry. Rather than rigidly adhering to somewhat arbitrary benchmarks, the City of Geneva should focus on equitable and accessible urban forest development. Given Geneva’s density— especially in the historic center—achieving 30% canopy cover citywide may not be feasible. If the goal of the 30% canopy rule is to promote shade and cooling, it may be more impactful for Geneva to conduct an urban heat island analysis. This would identify areas where targeted planting could maximize cooling benefits and improve well-being. As an initial step, Geneva should prioritize achieving the “three visible trees” rule and the “300-meter proximity to greenspace” rule across all areas. Ensuring that every building meets at least two out of the three criteria would significantly advance Geneva’s goals of creating a livable, green, and inclusive urban environment.


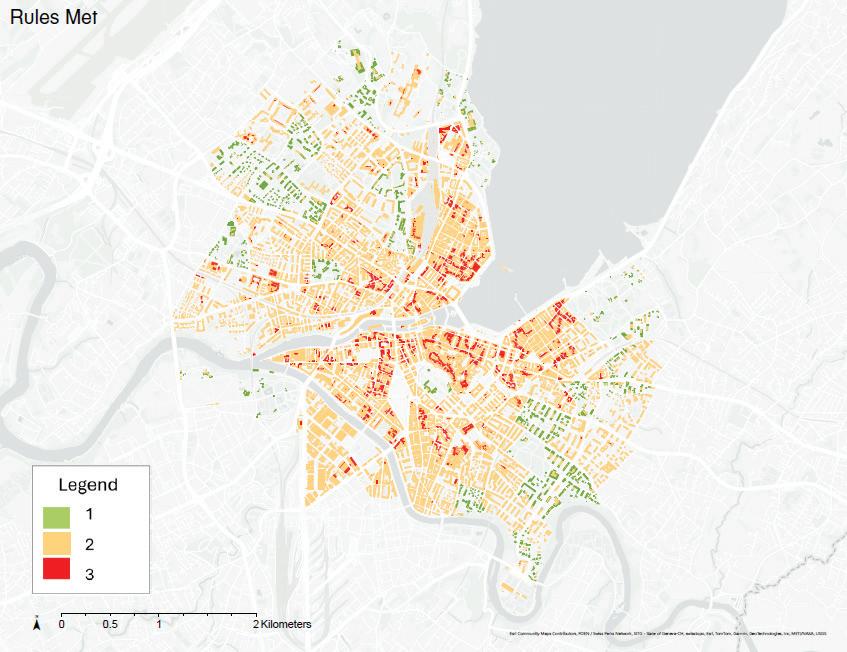
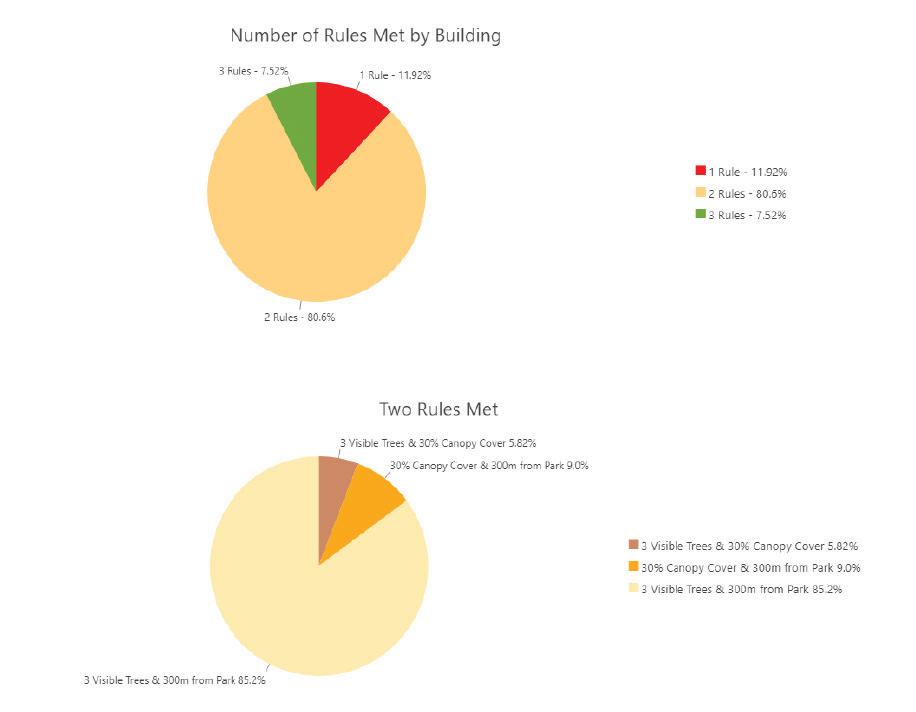
(above) spatial distribution of number of rules met by building. (middle): city-wide number of rules met by building. (bottom) proportion of two rules met by building.


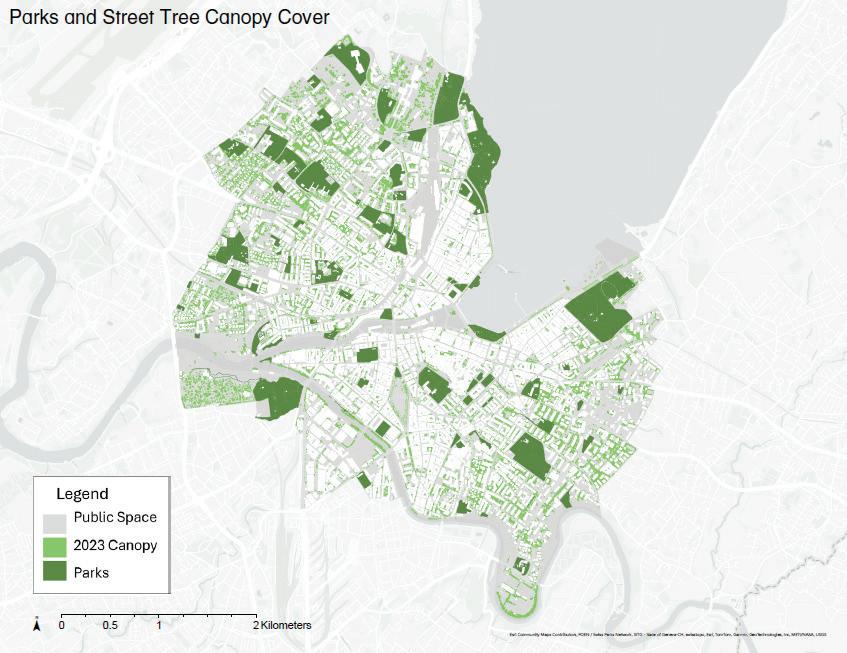
Across (above) parks and 2023 street tree cover. Across (below) public spaces with low canopy areas. (above) proportions of land covered by buildings, parks, and tree canopy.
References
Croeser, T., Sharma, R., Weisser, W.W. et al. Acute canopy deficits in global cities exposed by the 3-30-300 benchmark for urban nature. Nat Commun 15, 9333 (2024). https://doi.org/10.1038/s41467024-53402-2
“CAD BATIMENT HORSOL TOIT – Toits des bâtiments” (CAD_BATIMENT_HORSOL_TOIT). SITG, 2025.

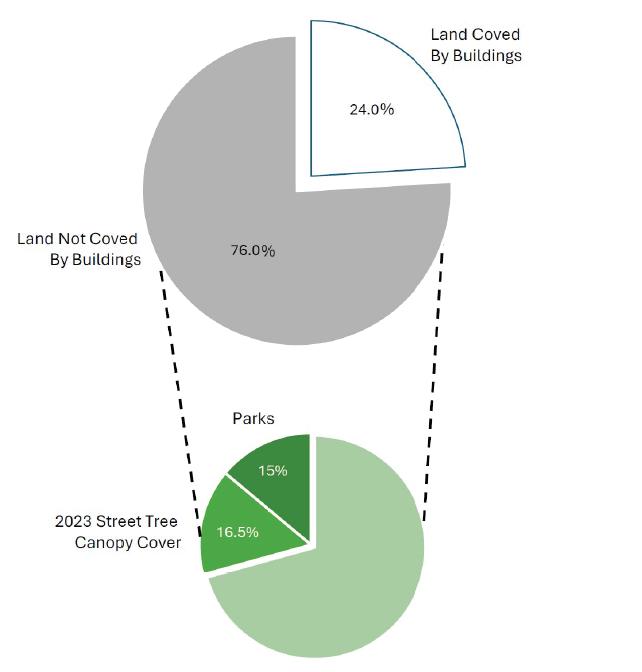
“GEO GIREC – Découpage en sous-secteurs statistiques” (GEO_GIREC). SITG, 2025.
“OBS EQUIPEMENTS ESPACES PUB – Equipements et espaces publics” (OBS_EQUIPEMENTS_ESPACES_PUB). SITG, 2025.
Sabatini, Alec. Urban Forestry’s New Benchmark: The 3+30+300 Rule; Unpacking the New Rule of Thumb for Urban Greening. PlanITGeo, (2024). https:// planitgeo.com/library/urban-forestrysnew-benchmark-the-330300-rule/
“SIPV ICA ARBRE ISOLE – Inventaire cantonal des arbres isolés” (SIPV_ICA_ARBRE_ISOLE). SITG, 2025.
“SIPV ICA MNC – Modèle Numérique de Canopée 2017” (SIPV_ICA_MNC_2017). SITG, 2017.
“SIPV ICA MNC – Modèle Numérique de Canopée 2023” (SIPV_ICA_MNC_2023). SITG, 2023.

Geneva’s urban canopy in the aquatic buffer
Caroline Brodeur
Master in Landscape Architecture (MLA) + Master in Urban Planning (MUP) Candidate
Harvard Graduate School of Design

Growing public concern for the state of waters in the 1990’s spurred decades of restoration and water quality work focused on stream renaturalization in Geneva. In the canton of Geneva this was notably achieved through the “Dix ans pour sauver nos rivières” initiative begun in 1998. It prioritized stream renaturalization and operated throughout the Canton. But there is more work to be done, with almost one third of the Canton’s rivers classified as buried, channelized, or heavily modified. As Geneva continues to make efforts towards renaturalization, understanding the relationship of its urban forest to its waterways is critical.
As the climate continues to change, so will Geneva’s relationship with water. Drier summers, wetter winters, and growing concerns around cloudbursts, will challenge the progress made. Concurrently, the impacts of rising temperatures will compromise water quality and exacerbate residents’ reliance on their waterways as a refuge. Geneva’s urban forest has an important role to play in mediating these impacts at the city and cantonal scales.
In the context of these renaturalization efforts and a changing climate, this project asks how the understanding the distribution of Geneva’s urban forest can inform canopy expansion to most benefit the city and canton’s waters.
What is the distribution of Geneva’s urban forest in the aquatic buffer and how can this inform expansion?
Aquatic buffers are vegetated areas along waterways that exist or are created to protect a waterbody from non-point source pollution and erosion associated with the inflow of contaminated sediment or stormwater runoff.
Riparian (or lacustrine) zones, where terrestrial and aquatic ecosystems meet, support critical ecological functions for habitat and biodiversity, pollutant removal from runoff, flood attenuation, and more. They are also critical spaces where Geneva’s residents can engage with their waters. Management and planning in accordance with these services is critical as Geneva’s waters and residents face increasing climate stressors.
Forested buffers are widely considered the most effective types of buffers on a variety of metrics. They provide services like shade to regulate light levels and water temperature that other types of planting cannot. They also provide complex habitat, are highly effective at trapping sediment, and can intercept significant quantities of stormwater runoff.
While more typically practiced in rural and agricultural settings, Geneva offers an opportunity to interrogate the applicability and design of aquatic buffers in an urban condition through the lens of urban forestry. While many buffers include non-disturbance requirements, the urban context and the emphasis on urban forestry can enable more expansive thinking around buffers that, in conjunction with site specific design or policy recommendations, can integrate buffer benefits with public water access, recreation, and other needs.
While river restoration is encoded in Geneva’s law, in trans-border agreements with France, through conservation programs such as RAMSAR sites of Wetlands of International Importance and the European Water Framework Directive, and riparian restoration models are being studied throughout Switzerland, they rarely take into account urban conditions or the role of forests. Further research could be done on the jurisdiction of each of these initiatives and their relationship to the urban forest.
Aquatic buffers vary greatly in depth based on characteristics including adjacent land uses, topography and slope, soil type, and performance goals. A depth of at least 30m is typically required for sediment and phosphorus removal, while nitrogen removal begins at 30m or greater. Deeper buffers are more effective at providing habitat. In an urban setting, in which buffer is understood through canopy and not necessarily multi-story planting, and due to the analytical nature of this project, a relatively deep variable buffer was established to develop a greater understanding of this aquatic zone as public and ecological space.
For this study, a variable buffer was established based on:
(1) a 100m offset from Lac Léman and the Rhône and the Arve;
(2) a 30m offset from the tributary streams; and (3) the canton-designated water protection sectors that account for surface water and unconfined aquifers.
Further study could define a more nuanced variable buffer that accounts for slope, soils, and adjacent ecosystems.
This study works between the geographies of the city and the canton, with case studies for each, to develop an understanding of the distribution, trends, and characteristics of the urban forest in the aquatic buffer.
In each geography and the case studies, it follows a series of analyses, including:
(1) Establishing the extents and distribution of the buffer;
(2) Analyzing canopy cover in relation to the entire city or canton;
(3) Analyzing canopy change between 2013 and 2023 in relation to the entire city or canton;
(4) Analyzing ground conditions to understand available planting area; and
(5) Analyzing ownership, and distribution and type of public or protected spaces along the buffers.
It also includes analysis of stream characteristics across the canton to understand the potential to include canopy requirements in ongoing renaturalization efforts.
The study culminates in recommendations that foreground the importance of the urban forest in the restoration and public experience of Geneva’s waters in a changing climate.











Genève ville
The city’ aquatic buffer is dominated by the Lake and its two main rivers, the Rhône and the Arve. To the south is the junction between the recently partially re-naturalized River Aïre and the buried and channelized Drize. At the city boundary, they flow into an underground channel running alongside the Voie Centrale before joining the Arve at Pont Saint-George. At the southernmost point of the city, the Parc Bout-du-Monde is part of the surface water protection zones for the canton and entirely included in the buffer.
16% of the city of Geneva is within the aquatic buffer

“Emprise du Lac Leman (Complet)” (GEO_LAC_LEMAN). SITG. “Graphe hydrographique transfrontalier”(AGGLO_RTGE_RESEAU_HYDRO). SITG. “Secteurs de protection des eaux” (GOL_SECTEURS_PROTECT_EAUX). SITG.


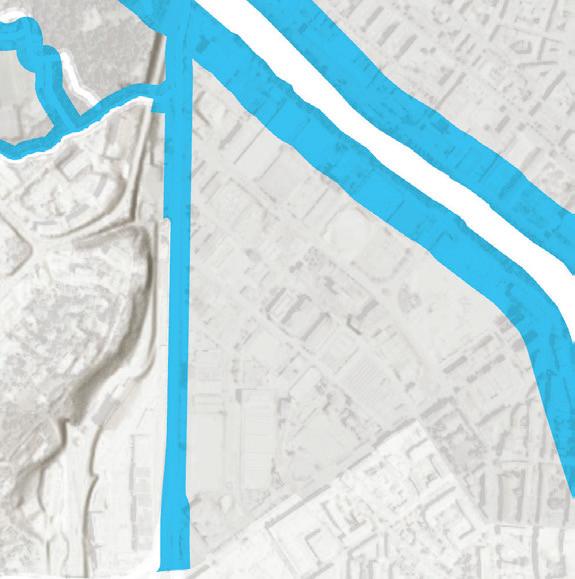




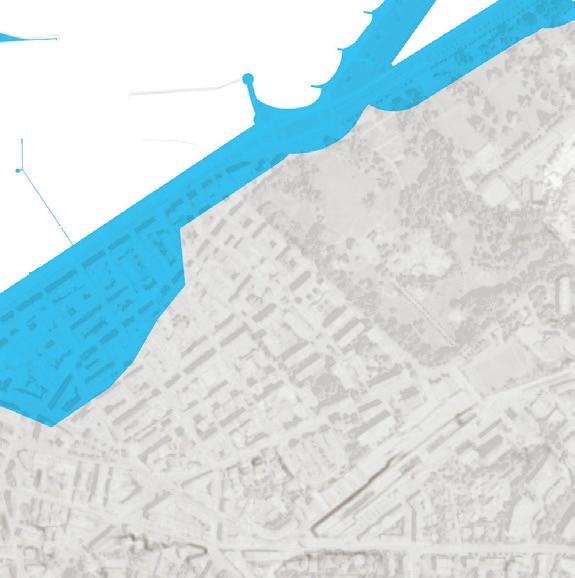
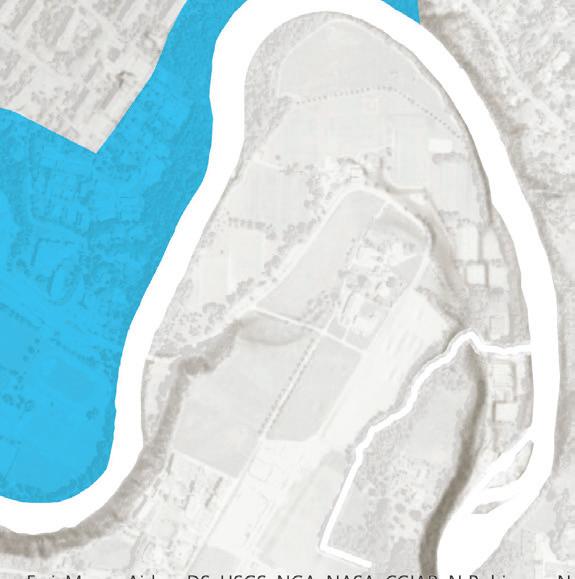


Genève ville
The aquatic buffer hosts a disproportionate amount of the city’s canopy, roughly one-fifth of the city’s total tree coverage. The buffer’s coverage is almost one-third canopy though with significant variability. High areas of coverage are concentrated at the confluence of the Rhône and the Arve, where it abuts Parc Bois de la Bâtie on the South bank and a large green space on the North bank, and in Parc Bout-du-Monde.

16% of the city of Geneva is within the aquatic buffer
20% of the city’s canopy is within the aquatic buffer
28% of the city’s aquatic buffer is covered by canopy 22% of the city is covered by canopy

“Modèle Numérique De Surface De Canopée - État 2023” (SIPV_ICA_ MNC_2023). SITG.


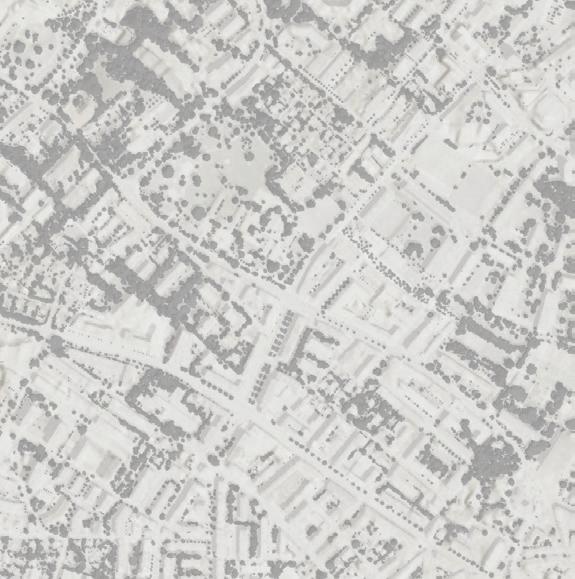
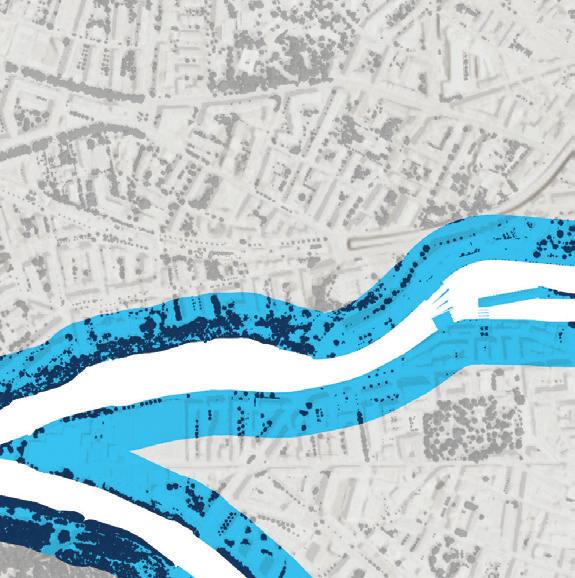
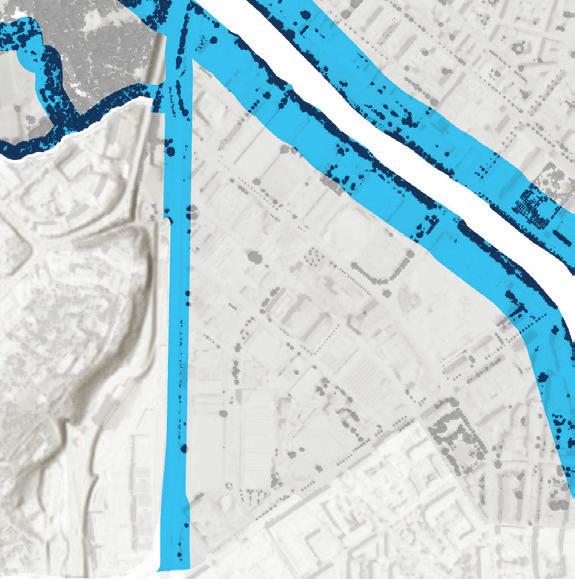


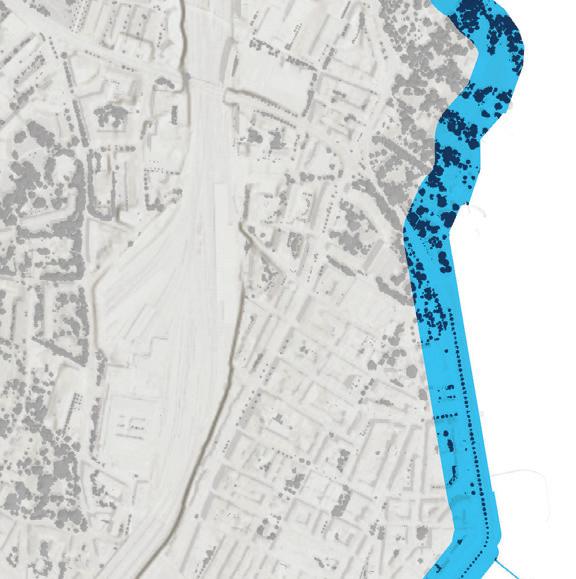

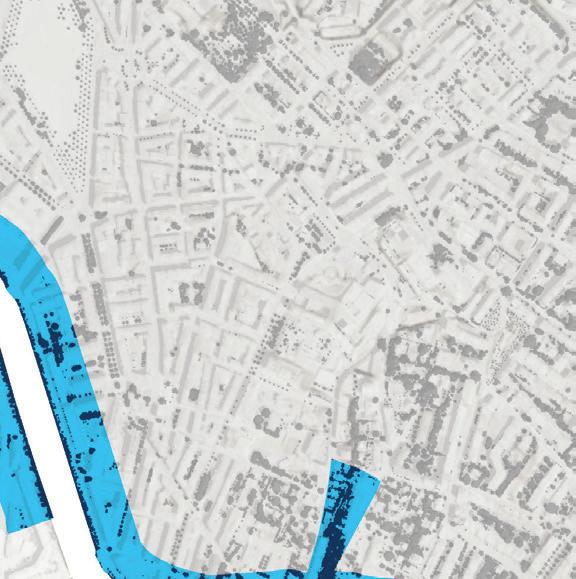
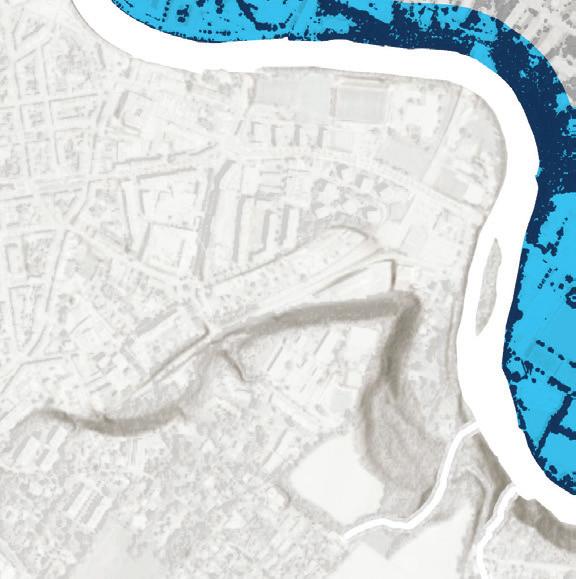


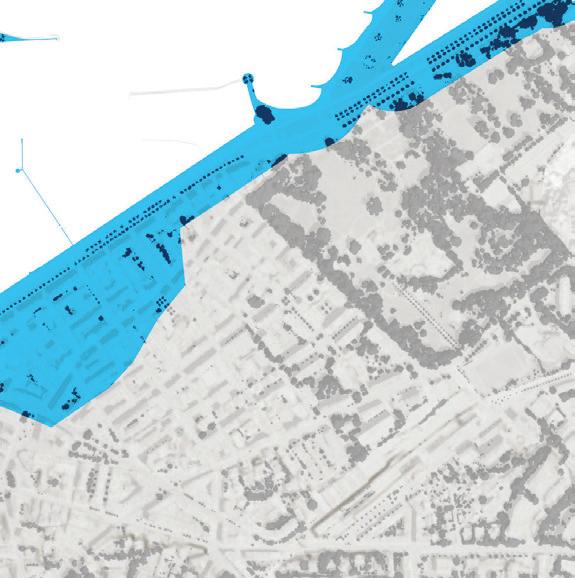
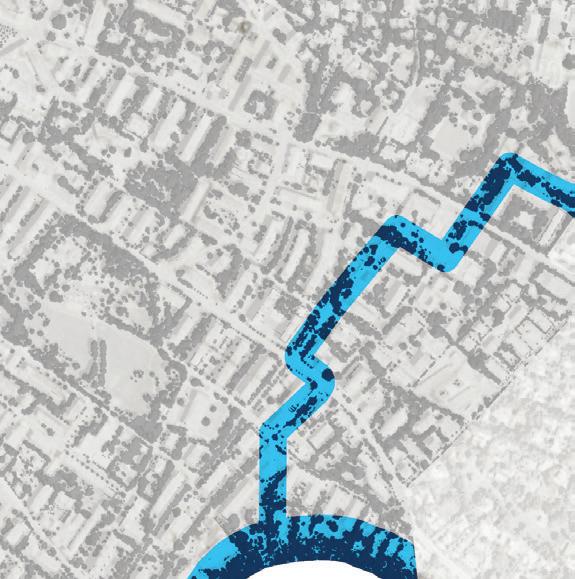
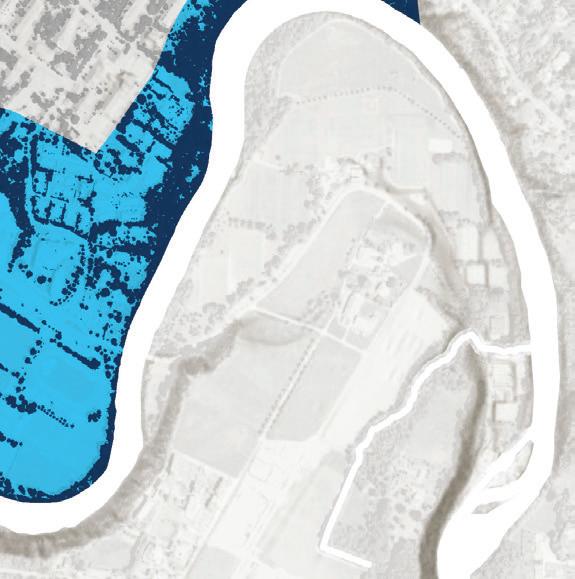


The aquatic buffer is gaining canopy at a slower rate than the rest of the city. Over a 10-year period, it experienced just over 1% gain. Both canopy gains and losses are irregularly distributed at the city-wide scale.

City - 4% Net gain of 156.5K m2 2013-2023
Aquatic Buffer - 1.4% Net gain of 10.K m2 2013-2023 67.1% No change 2.7M m2

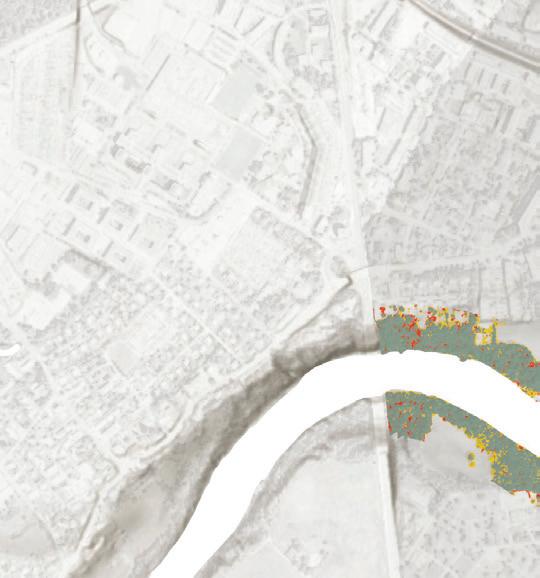


“Modèle Numérique De Surface De Canopée - État 2023” (SIPV_ICA_MNC_2023). SITG.


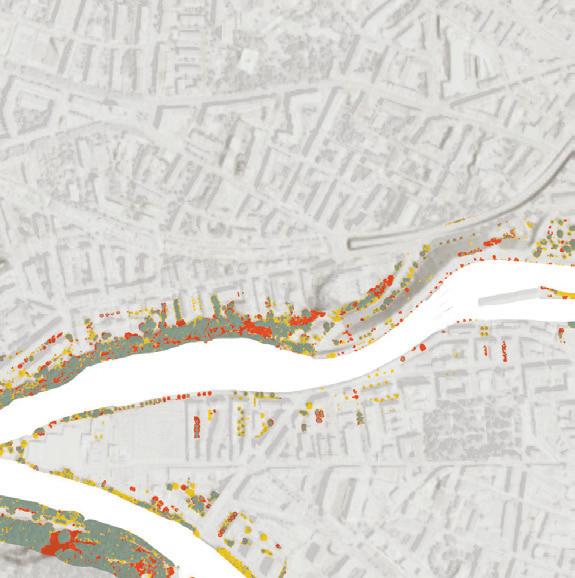


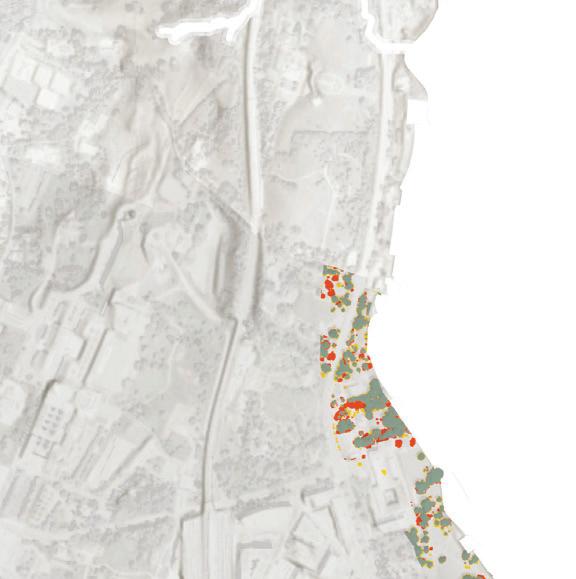
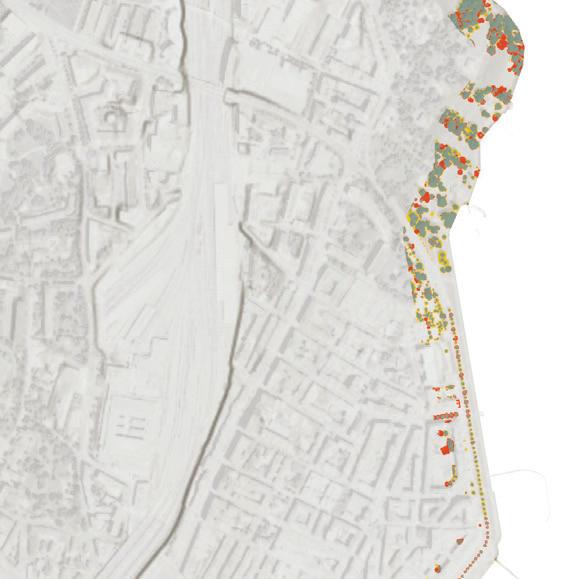

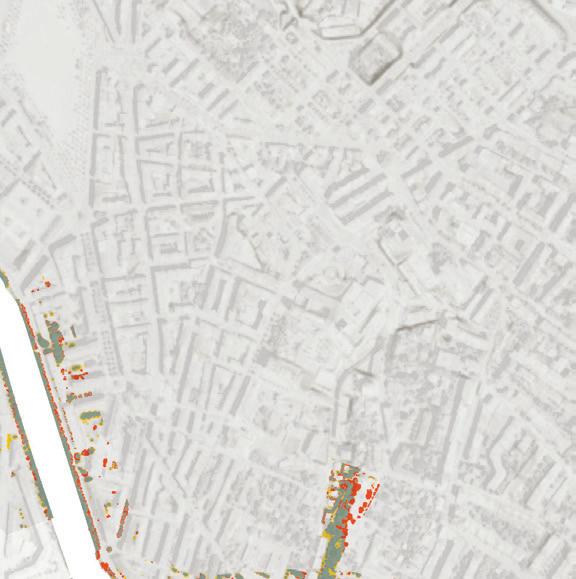


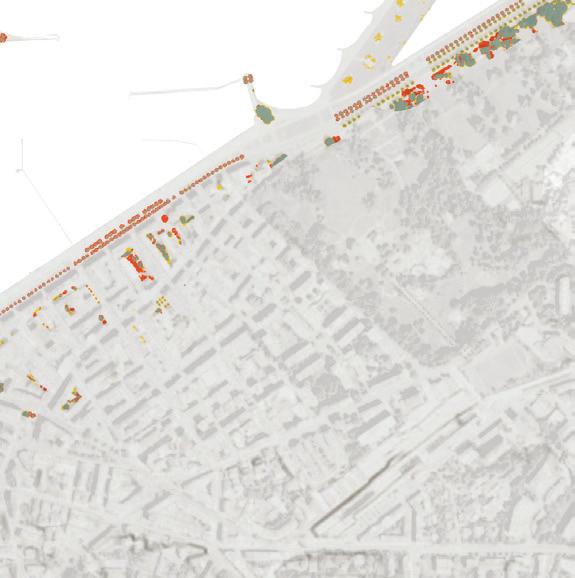
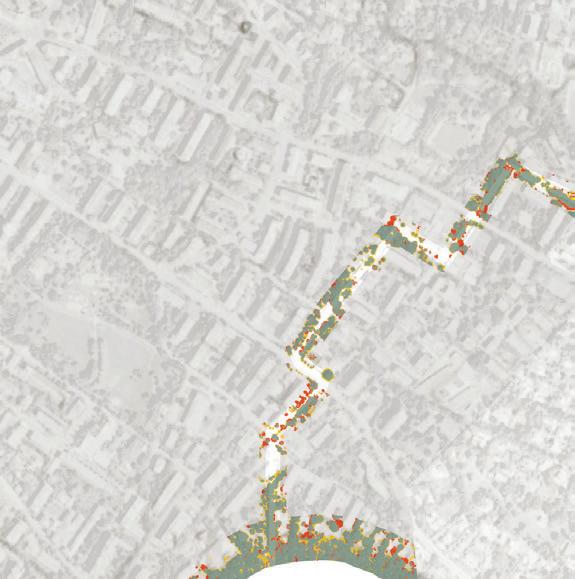
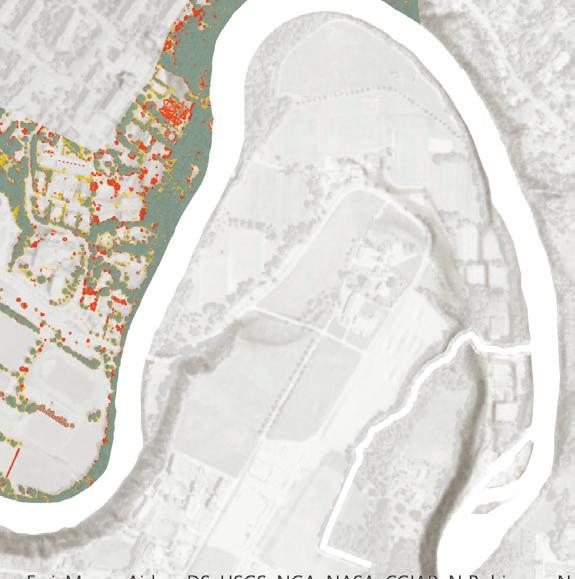


Genève ville
The aquatic buffer has a higher proportion of unpaved area than the rest of the city and has major opportunity areas for planting. Currently, 45% of the wooded, unpaved, or paved (non-street) area in the buffer is not covered by canopy.


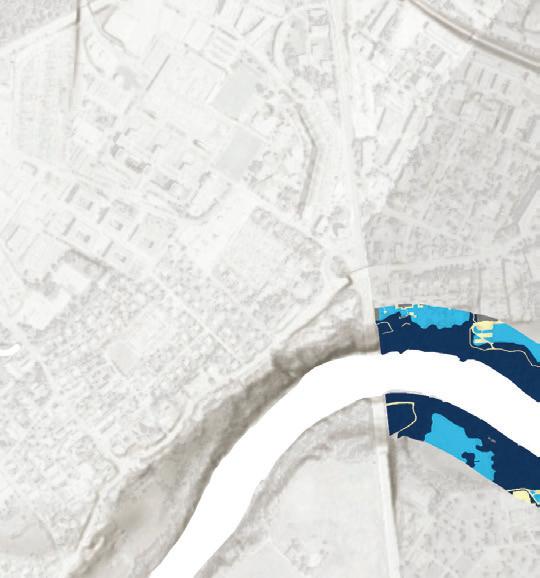


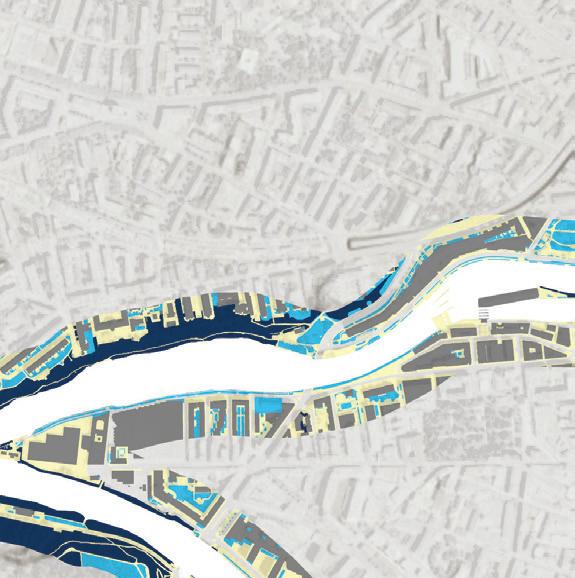
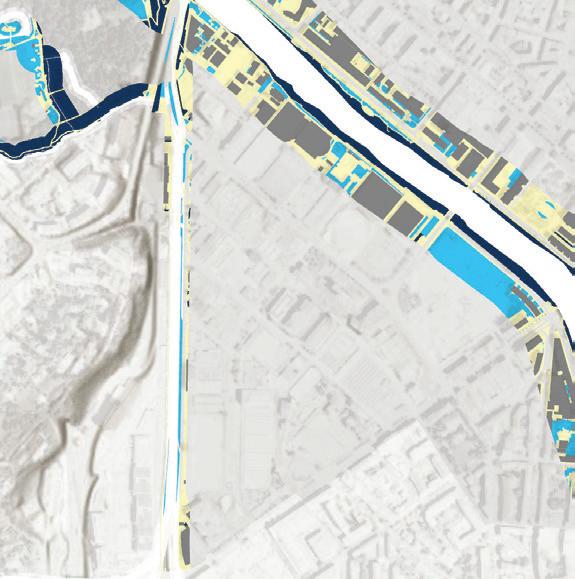

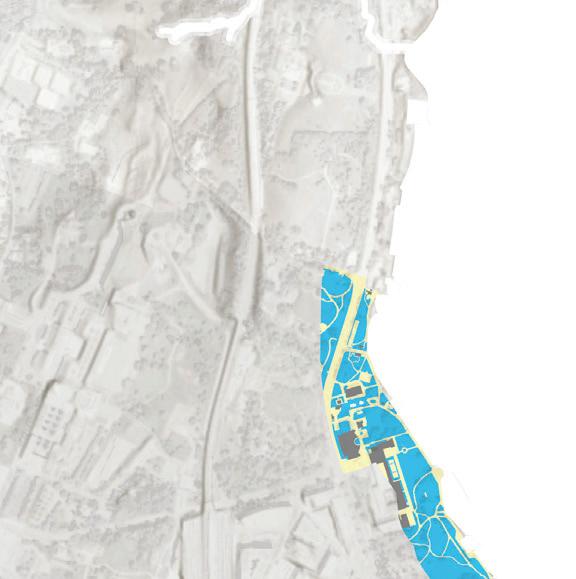
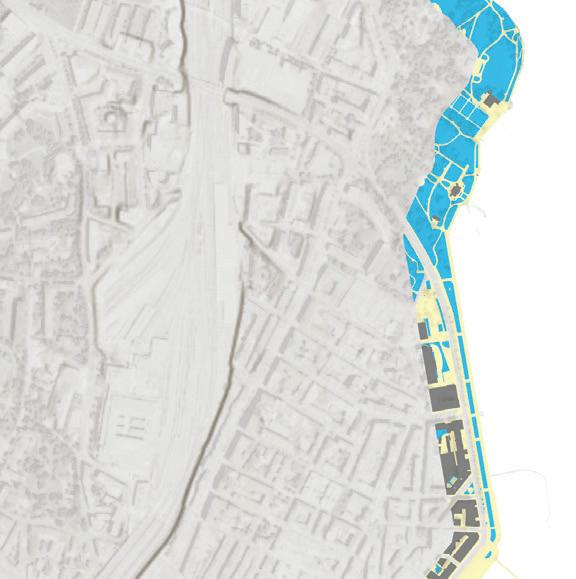
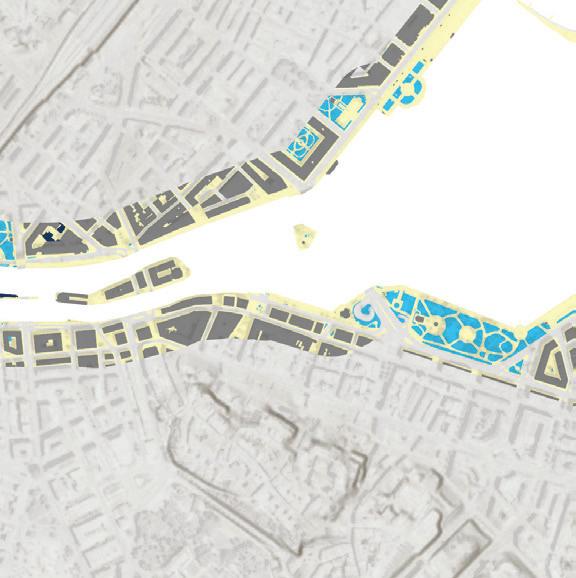

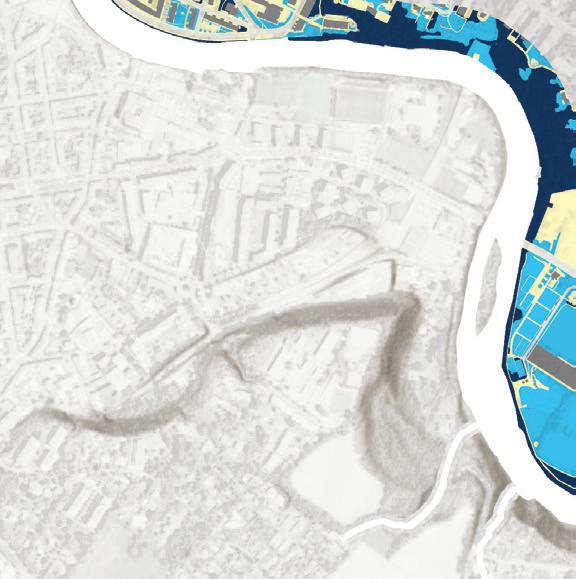


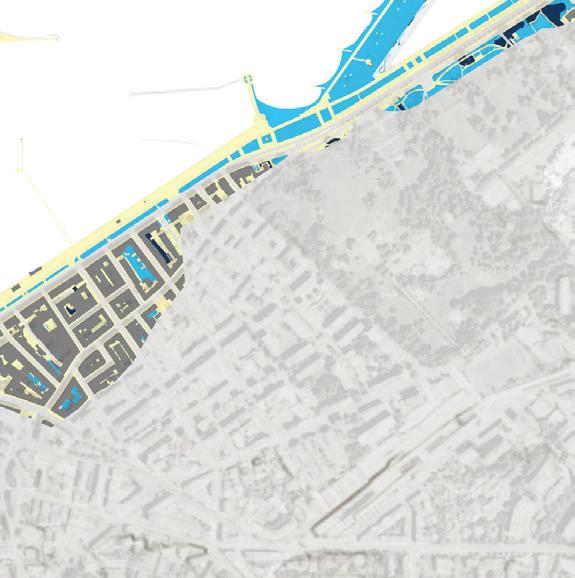
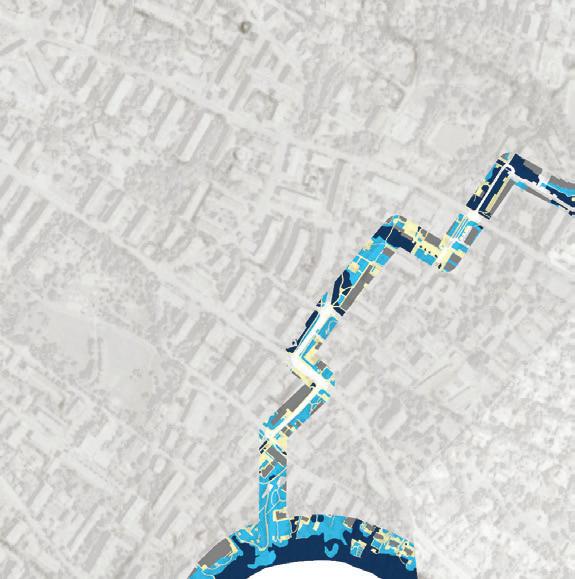
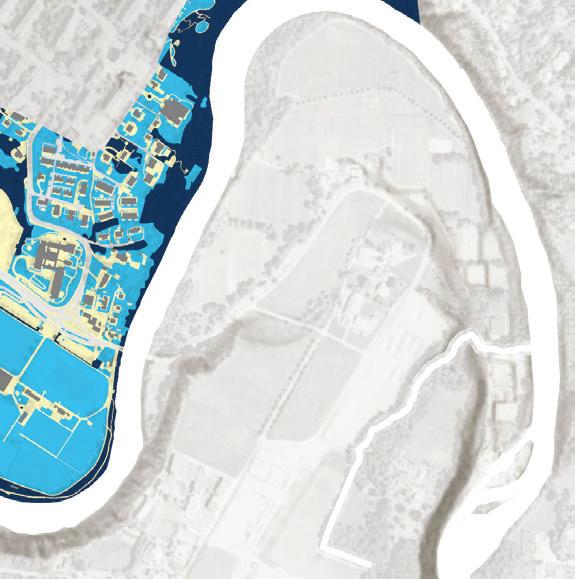


Genève ville City
Like the rest of the city, the buffer has a relatively low proportion of public ownership, though this analysis was complicated by conflicting datasets as outlined in the note below.
NOTE: There were inconsistencies in the property classification data in CAD_PARCELLE_MENSU Properties listed as private under TYPE_PROPRI would then have a designated public owner under PROPRI_PUBLIQUE, or property listed as public would have no designated public owner in the inverse.


“Parcelles de la mensuration” (CAD_PARCELLE_MENSU). SITG. “Equipements et espaces publiques” (OBS_EQUIPEMENTS_ESPACES_PUB). SITG

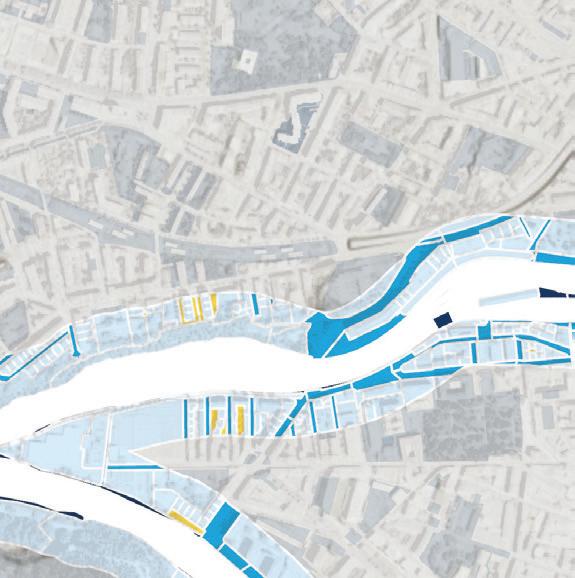

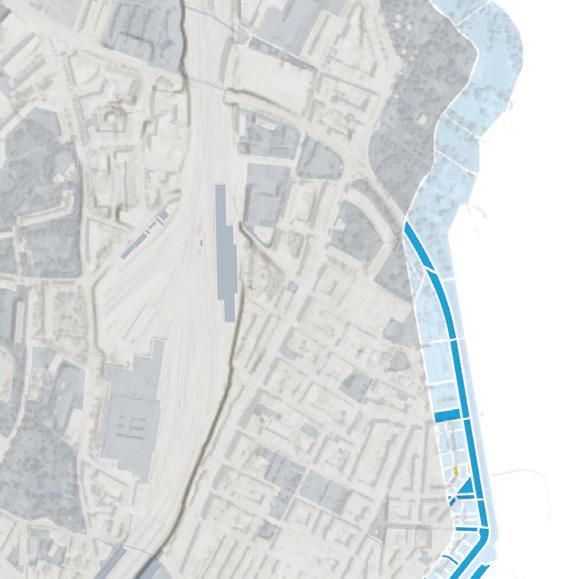
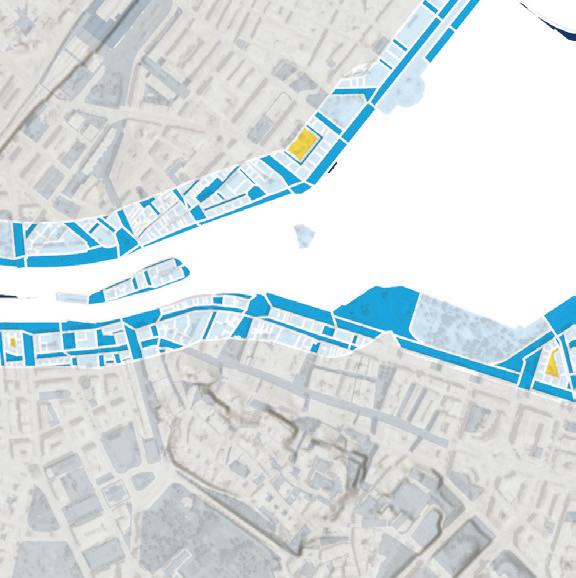
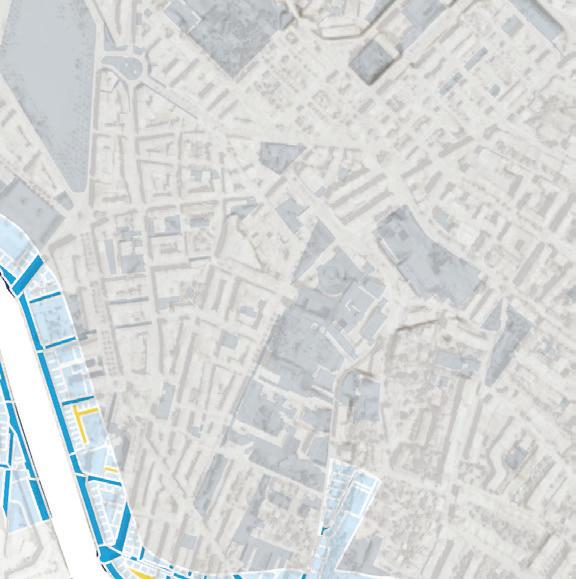
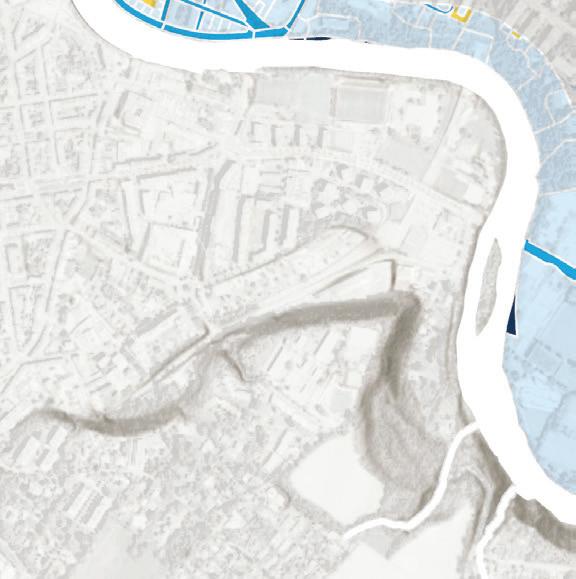


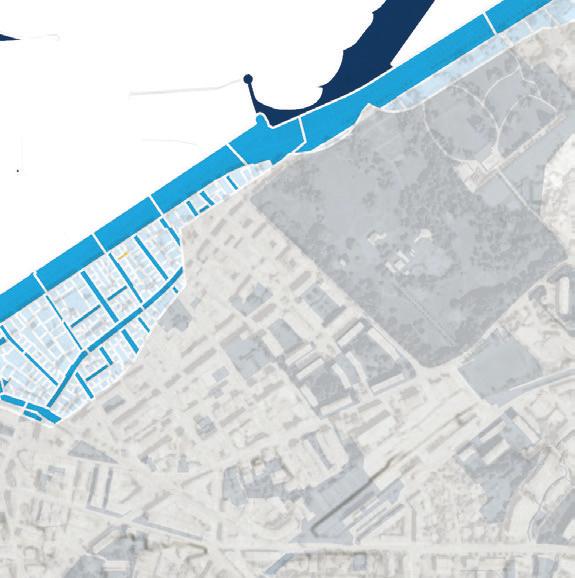
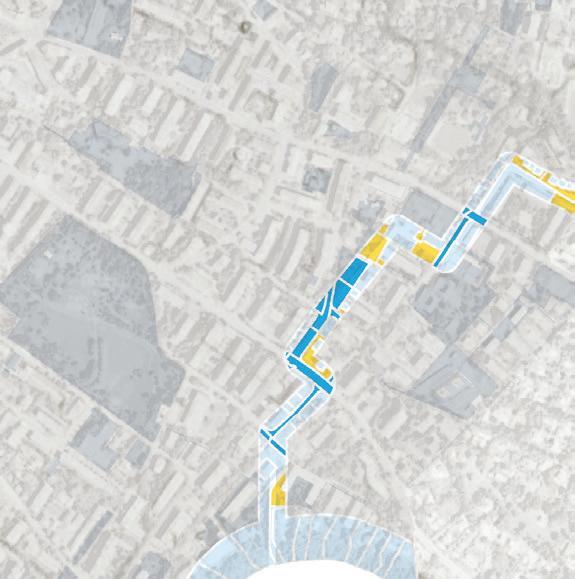
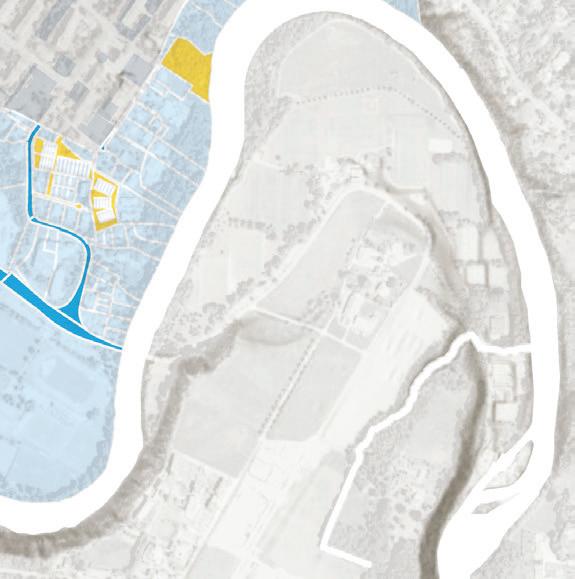


Public space was also evaluated through the “Equipements et espaces publiques” dataset which yielded slightly different results. The aquatic buffer hosted a slightly higher proportion of public spaces than the rest of the city, notably hardscaped public spaces including plazas, pedestrian promenades, and esplanades.

Just 2% of the city and 11% of the riparian buffer have some degree of environmental protection, mostly on private land. Across the city, 44% of protected space is public land, with a quarter of it in the hardscape plaza condition. In the aquatic buffer, 48% of protected space is public, with almost one third of all protected space in the hardscape plaza condition.
Types of public spaces were grouped on their general characteristics between hardscape and softscape. “Parks” includes spaces classified as sport fields, gardens, parks, and green spaces. “Plazas” indicates spaces generally dominated by hardscape including pedestrian spaces and streets, esplanades, and squares. “Other” indicates public spaces including schools, university campuses, hospitals, cemeteries and more that are operated under different management regimes or include significant built spaces.
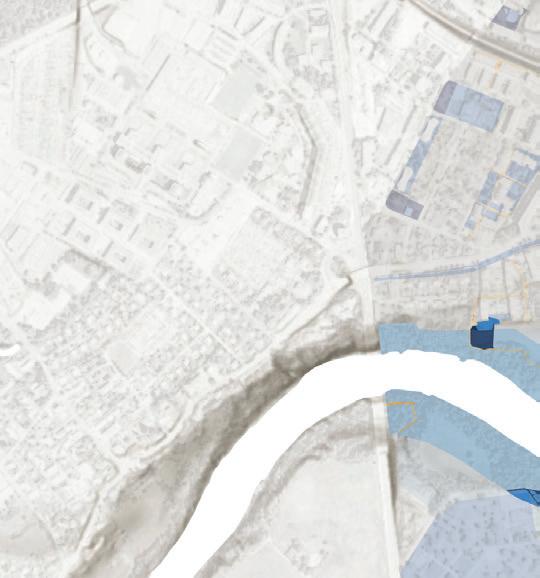
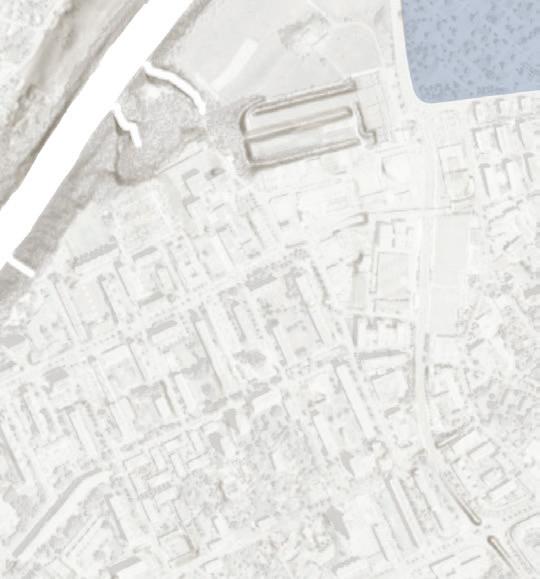

“Equipements et espaces publiques” (OBS_EQUIPEMENTS_ESPACES_PUB). SITG “Milieux proteges” (AGGLO_NAT_MILIEUX_PROTEGES). SITG


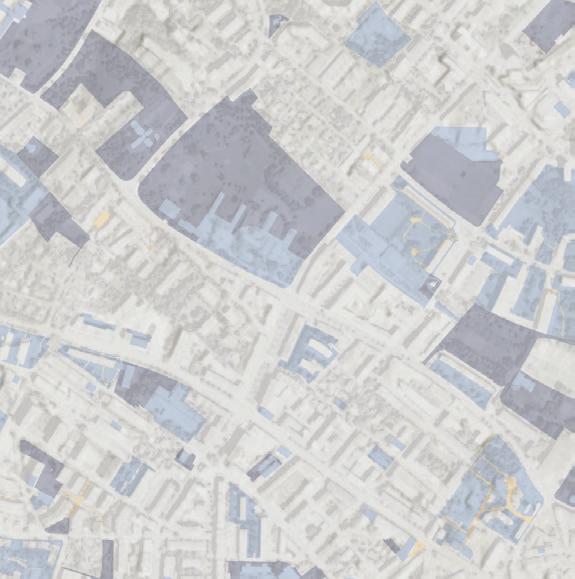
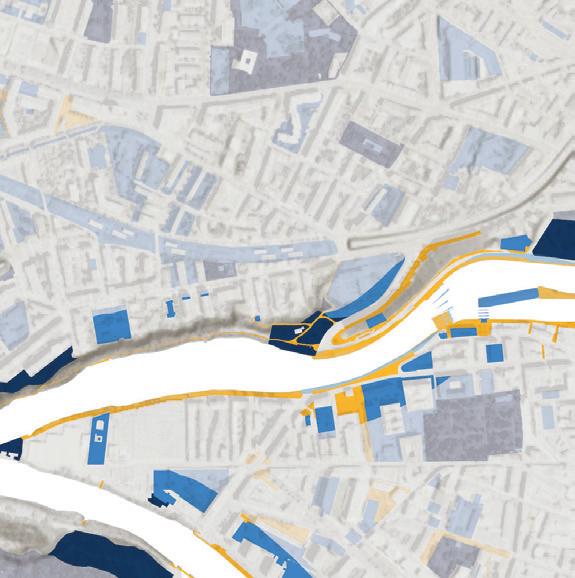


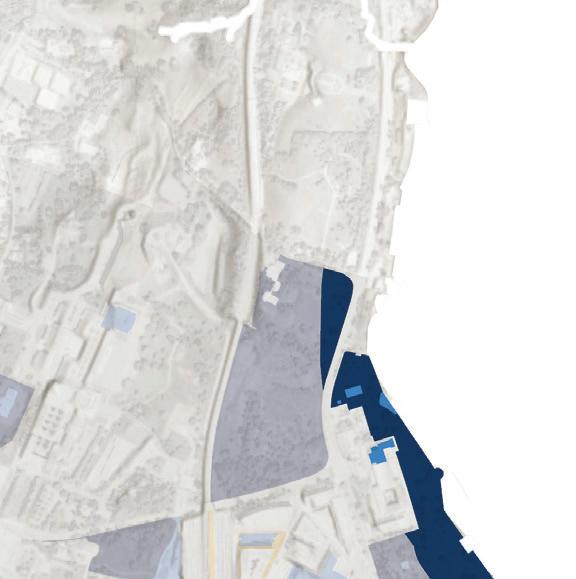
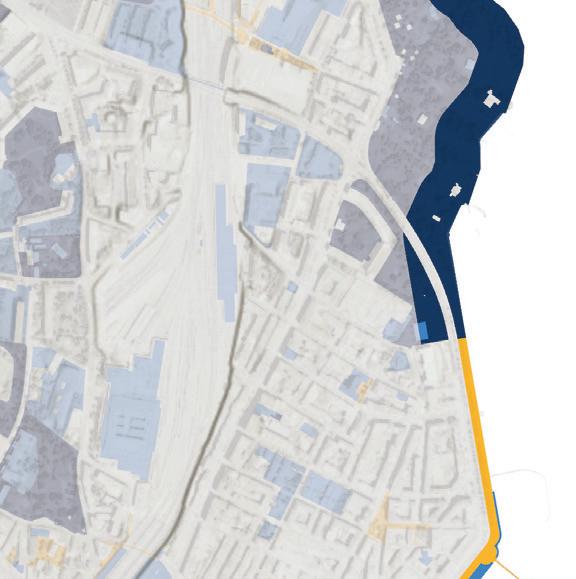
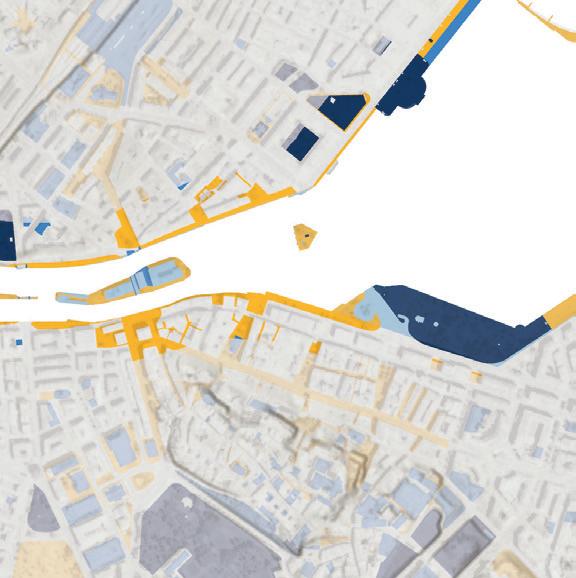
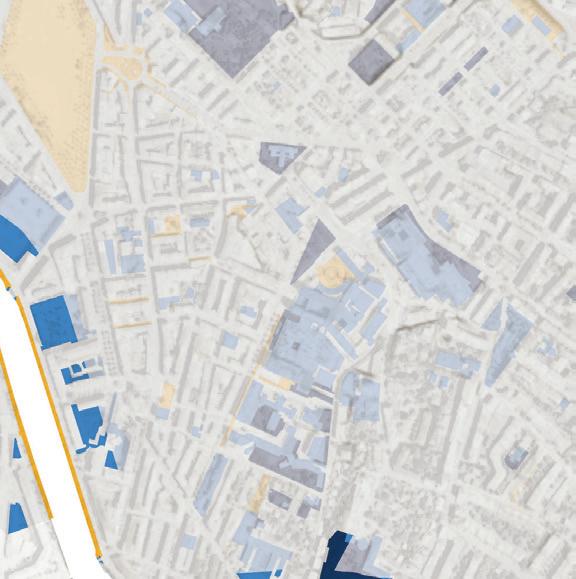
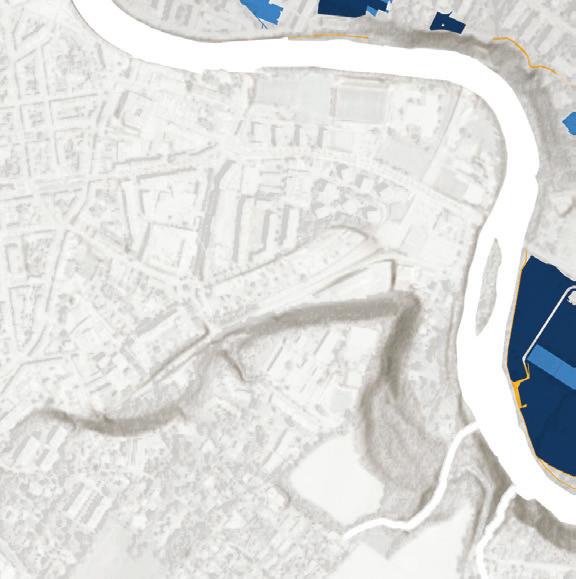


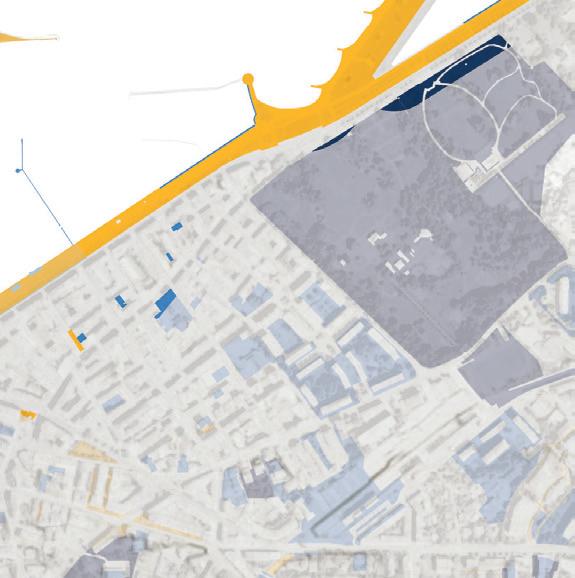
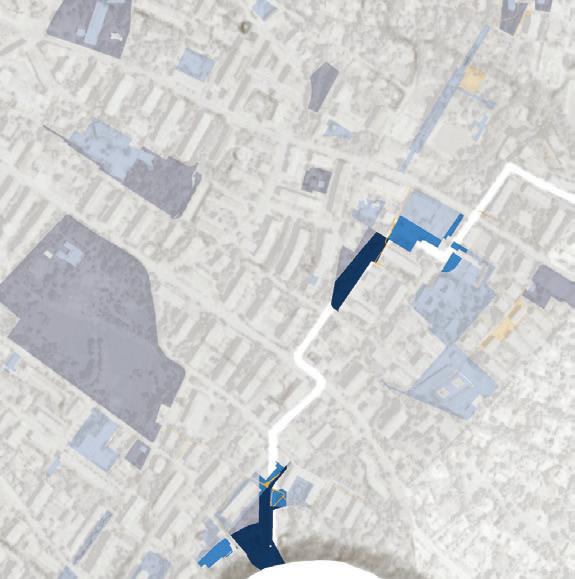
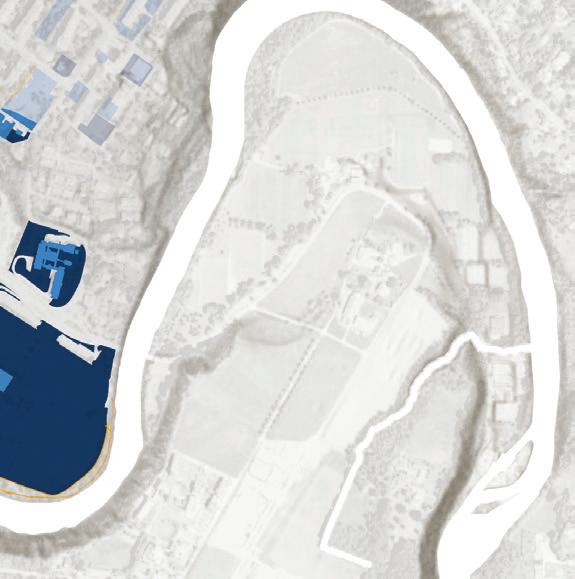


Genève ville
A case study approach allows more targeted analysis of the buffer condition in areas of the city with potential for high impact in the improving public experience of the urban canopy.
On the lake edge, Quai Gustave Ardor and Plage des Eaux-Vives form one of the larger public spaces in the city center and a major destination for tourists and residents alike for the lake and water jet views.
To the south, Parc Bout-du-Monde is one of the largest green spaces and is surrounded by the Arve on three sides. It hosts significant sport facilities that draw residents from across the city.
These public spaces offer contrasting visions of the urban forest. One, dominated by hardscape and formal allées of trees along the lake edge, and the other a more informal park condition. Both offer significant opportunities for enhancing the coverage, performance, and public experience of the urban forest in the aquatic buffer.


06.1 Quai Gustave Ardor + Plage des Eaux Vives
Quai Gustave Ardor is dominated by a hardened lake edge. To the north, the newer Plage des Eaux-Vives, opened in 2019, offers a public swimming beach and a constructed wetland on its back side.
The Quai is almost entirely a hardscape pedestrian promenadethough also used for boat access. It has an approximately 8m wide tree pit, planted with grass, with a narrow path down its center that hosts an allée of pollarded London Plane trees.
The newer Plage des Eaux-Vives features a roughly 55m deep by 32m long lawn. This features several small clusters of newly planted trees of unknown species.
Secteur Area Program
Shoreline
Current species
Eaux-Vives Lac
86.1K m2
Recreational promenade and park, marina access
58% Hardened / Stone bulkhead
31% Gravel beach
11% Constructed wetland
London Plane (Platanus × acerifolia)


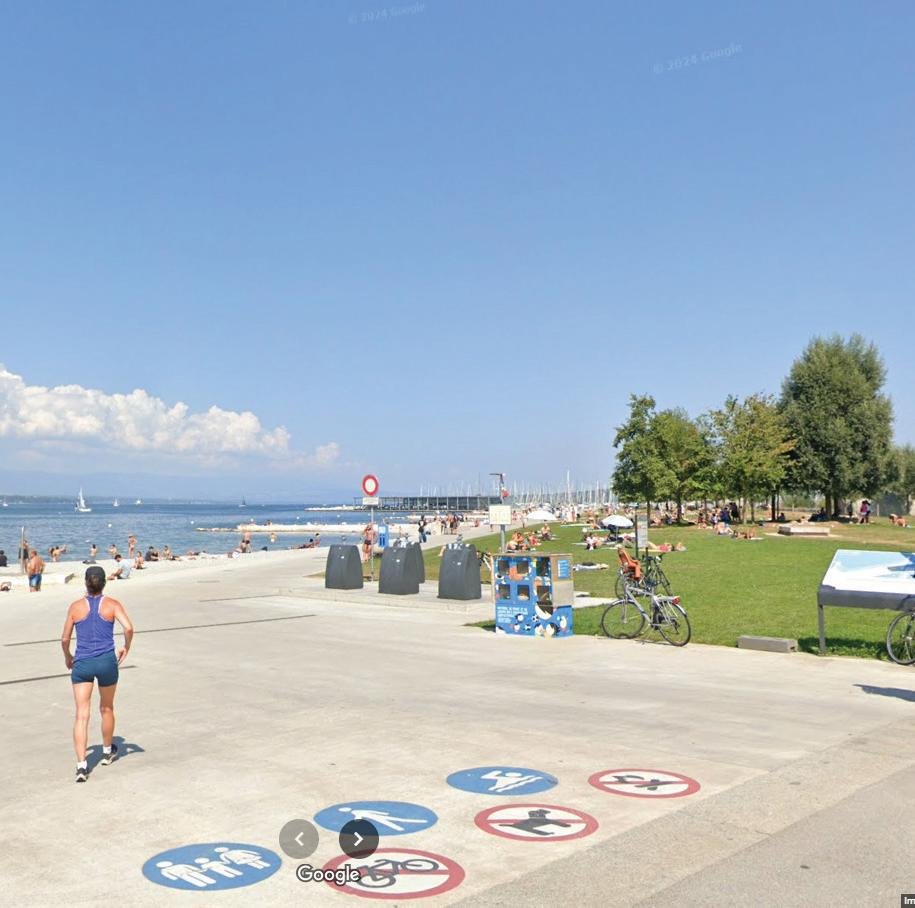
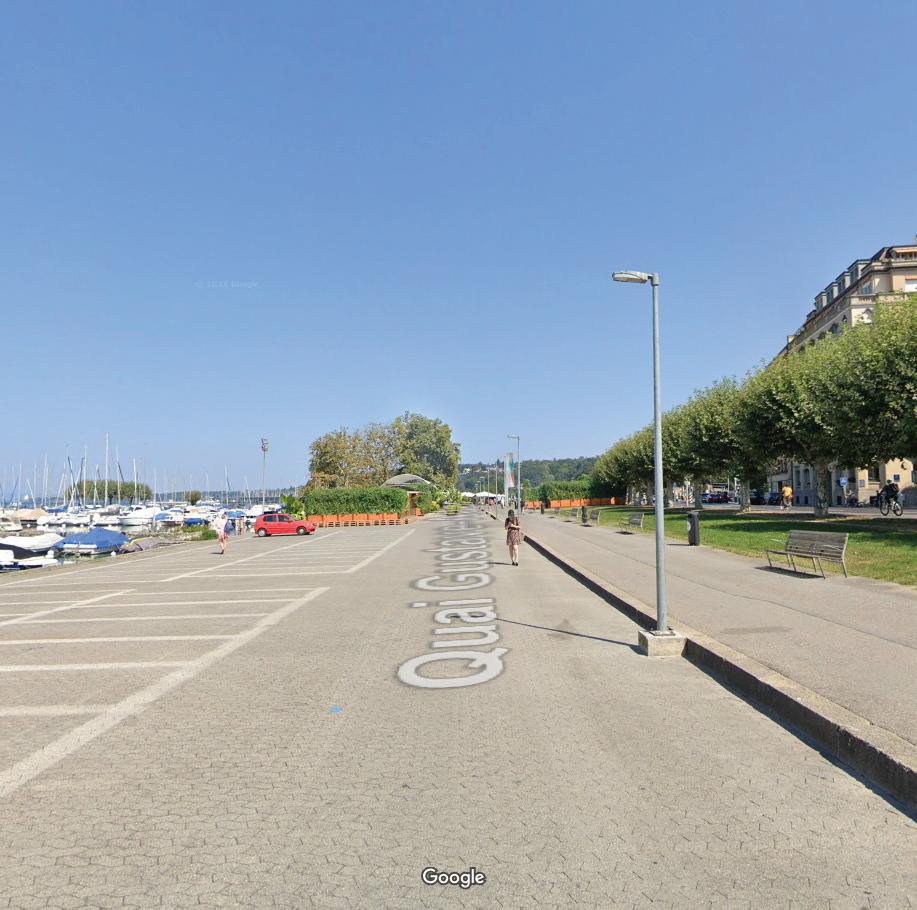
06.1 Quai Gustave Ardor + Plage des Eaux Vives
Despite its significant open space, the Quai and Plage have extremely low tree canopy. The canopy it does have is experiencing significant loss even in spite of the new planting associated with the construction of Plage des Eaux Vives. This is occurring in the allées of London Plane Trees that line the Quai, all planted in 1962.
7% of the Quai area is covered by canopy
28% of the city’s aquatic buffer is covered by canopy
22% of the city is covered by canopy
Canopy Change
Allées of London Planes (Platanus × acerifolia) are experiencing persistent loss.

“Modèle Numérique De Surface De Canopée - État 2023” (SIPV_ICA_ MNC_2023). SITG.

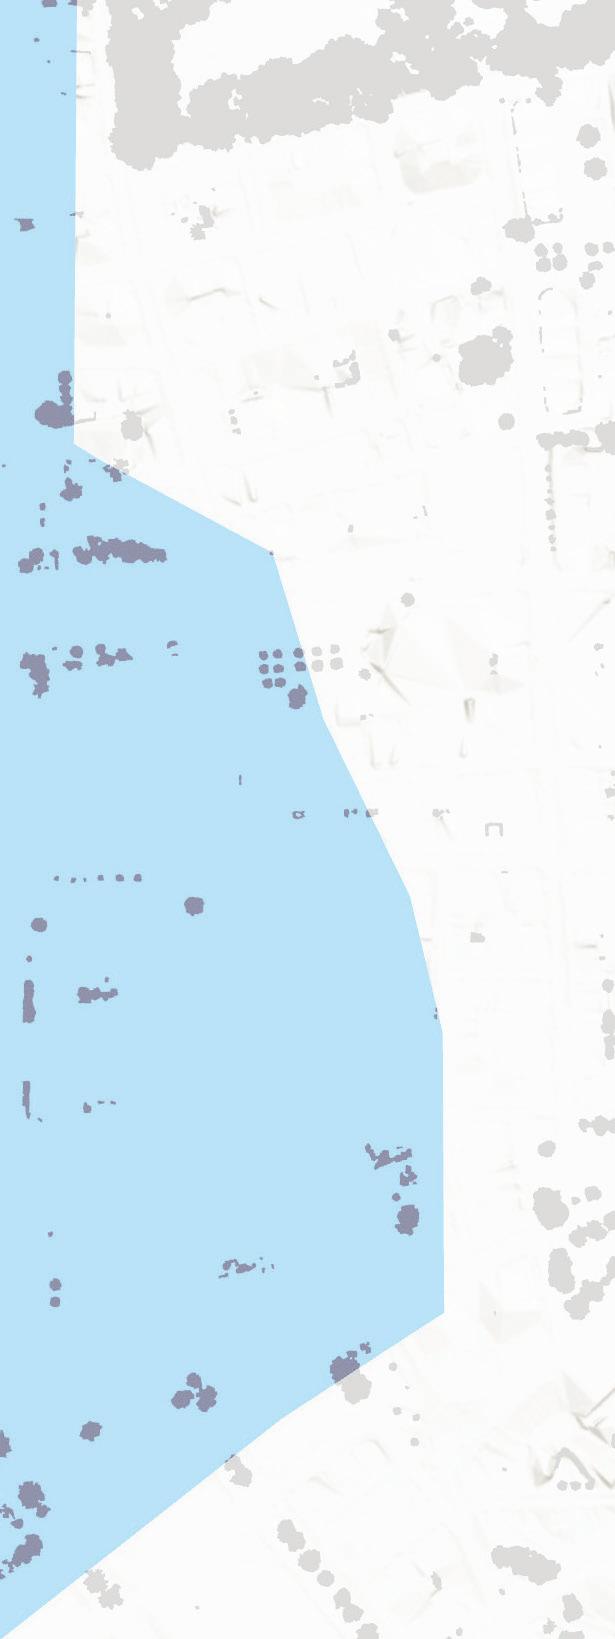

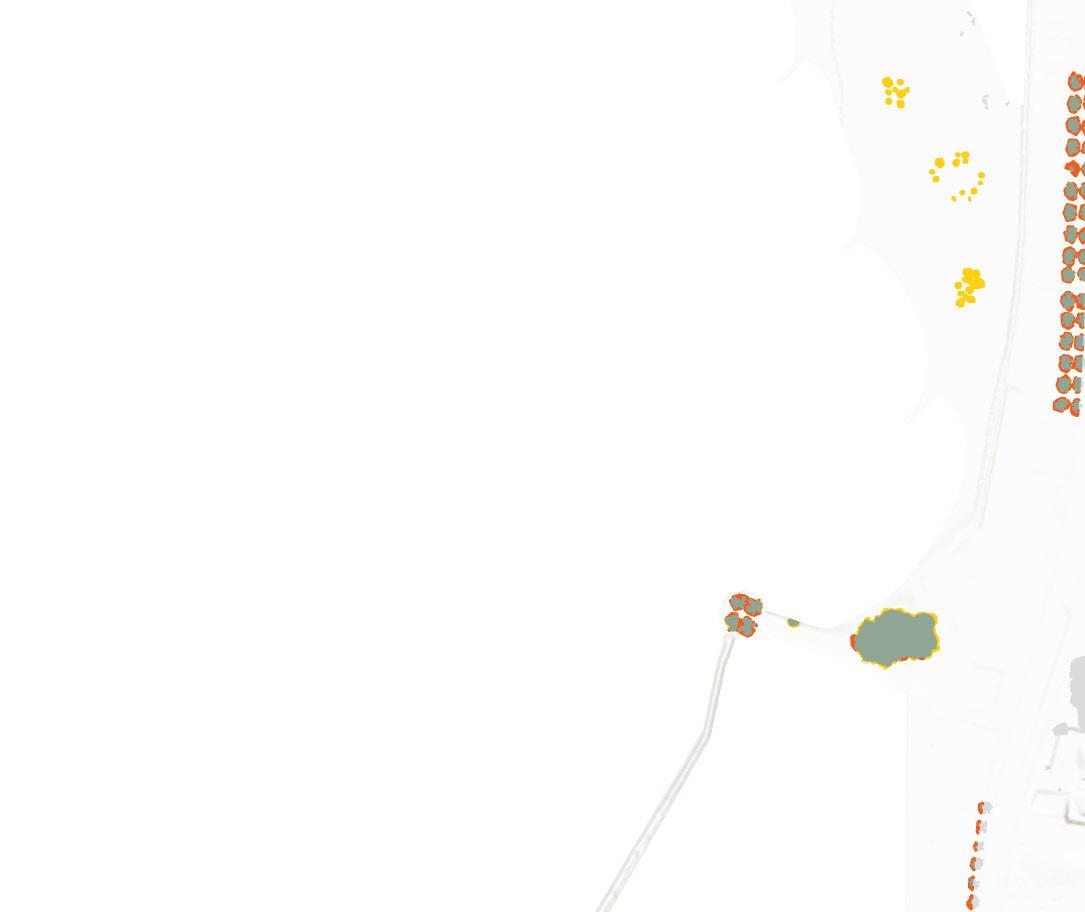



06.1 Quai Gustave Ardor + Plage des Eaux Vives
The Quai is dominated by an extremely wide hardscape walkway and a hardened lake edge. While parts of this are used for boat access, opportunities to depave this area or add trees within the hardscape present opportunities to increase canopy that would greatly impact public experience.
Ground Conditions
The site is entirely publicly owned between the canton and the commune.
24.9% of the city’s aquatic buffer is publicly owned between the canton and the commune
NOTE: There were inconsistencies in the property classification data in CAD_PARCELLE_MENSU Properties listed as private under TYPE_PROPRI would then have a designated public owner under PROPRI_PUBLIQUE, or property listed as public would have no designated public owner in the inverse.
“Couverture du sol selon classification OTEMO” (CAD_CARTE_OTEMO). SITG. “Parcelles de la mensuration” (CAD_PARCELLE_MENSU). SITG. “Equipements et espaces publiques” (OBS_EQUIPEMENTS_ESPACES_PUB). SITG


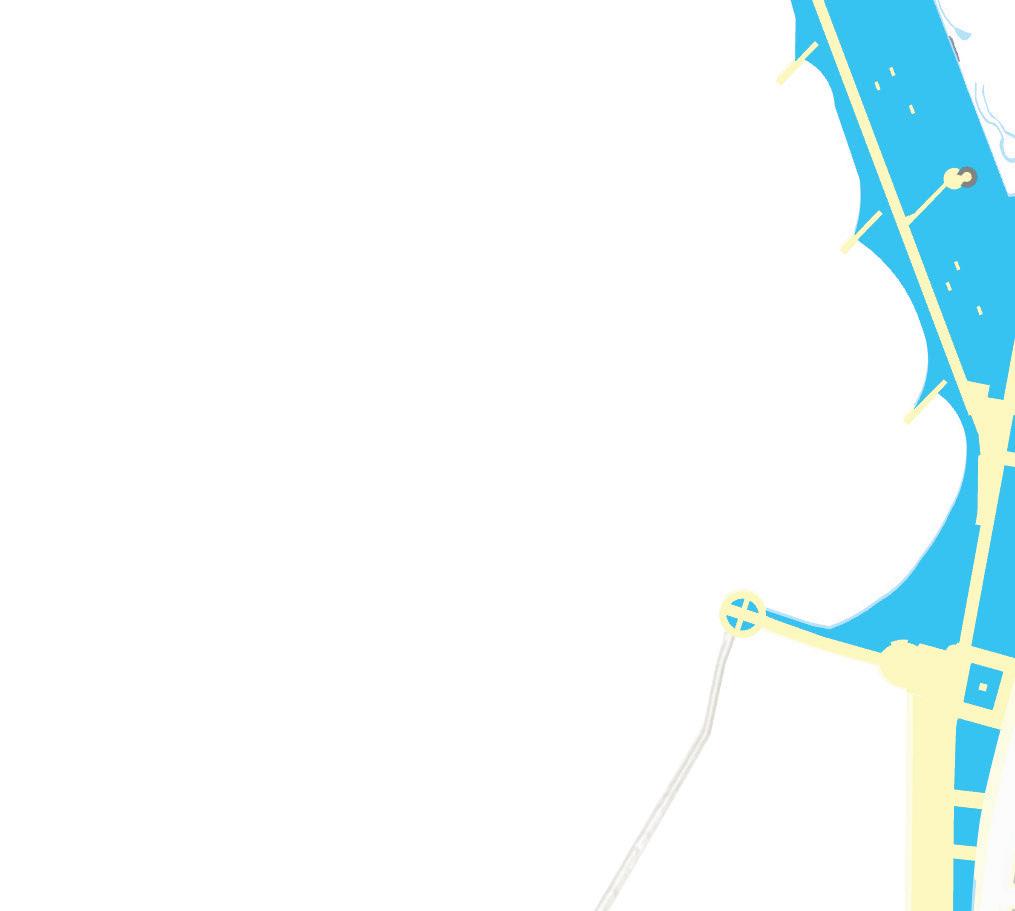






06.1 Quai Gustave Ardor + Plage des Eaux Vives
Recommendations
01
Investigate persistent canopy loss. Almost of the allées of London Plane Trees were planted in 1962 and likely approaching the end of their life
02a
Increase canopy coverage by 19,680m2 to reach 30% coverage by 36, 901m2 to reach 50% coverage
02b
Increase canopy diversity in genus, species, and age
02
Utilize a phased approach
Replace trees incrementally to limit visual disturbance and diversify ages.
03
Consider the edge and ground
A fully-functioning riparian forest is more than just canopy trees. Enhance the lawns under the alleys, expand planted permeable area, and re-naturalize part of the shoreline not used for boat docking.
The Quai represents a typical lakefront condition dominated by hardscape and formal planting. Throughout the city, the quais form a somewhat continuous public space that defines the experience of Geneva’s lakefront in the city center. It could be possible to develop a city-wide program to improve canopy coverage along the Quais that prioritizes enhanced shade, multi-story planting to limit runoff, provide habitat, and improve residents’ experiences of their waters.
Improving canopy by 10% across the quais could increase the overall canopy of the aquatic buffer from 28% to 32.7% and significantly improve public experience of the waterfront.





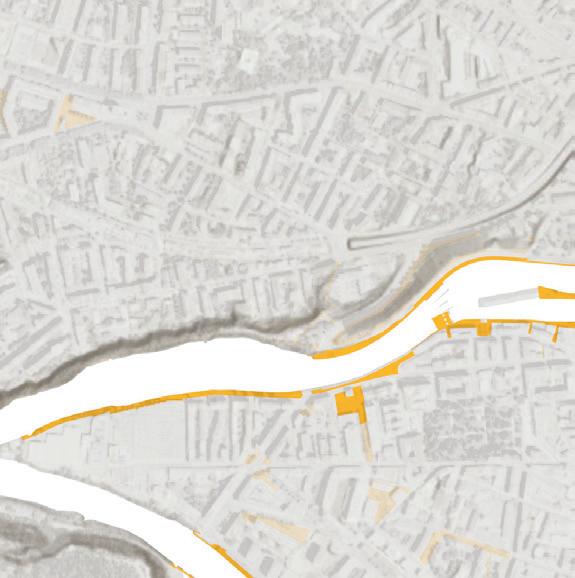






05.2 Parc Bout-du-Monde
Parc Bout-du-Monde is one of the largest parks in the city with significant athletic facilities. It hosts over a dozen sports fields that make it a city-wide destination. While it is surrounded on 3 sides by the Arve, it provides no formal river access. It features a narrow trail through its forested buffer, which varies from approximately 3m to up to 30m. Within the park, canopy is relegated to several narrow strips between fields and along roads.
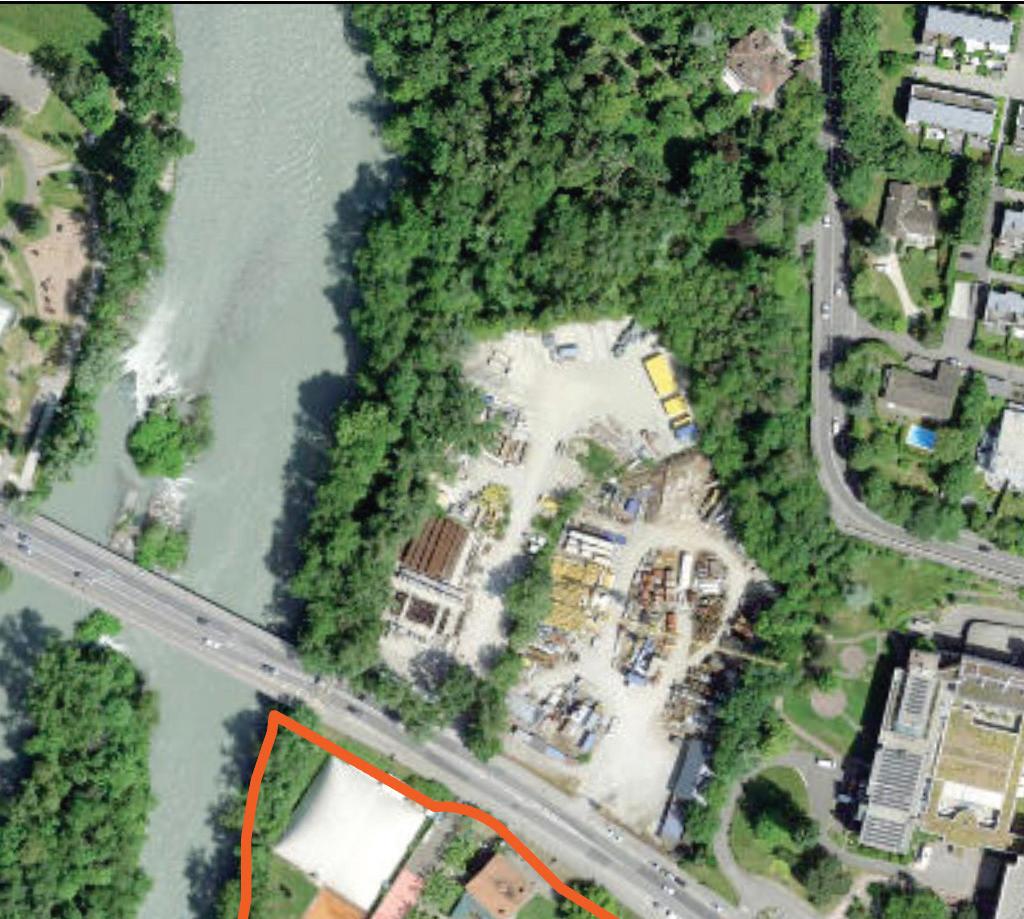
Secteur Area
Program
Shoreline
Current species
Champel Roseraie
183K m2
Active recreation
100% Forested
Mixed, including:
European Hornbeam (Carpinus betulus)
English Oak (Quercus robur)
Field Maple (Acer campestre)
Norway Maple (Acer platanoides)
White willow (Salix alba)
Beeches (Fagus)
Cottonwoods (Populus)
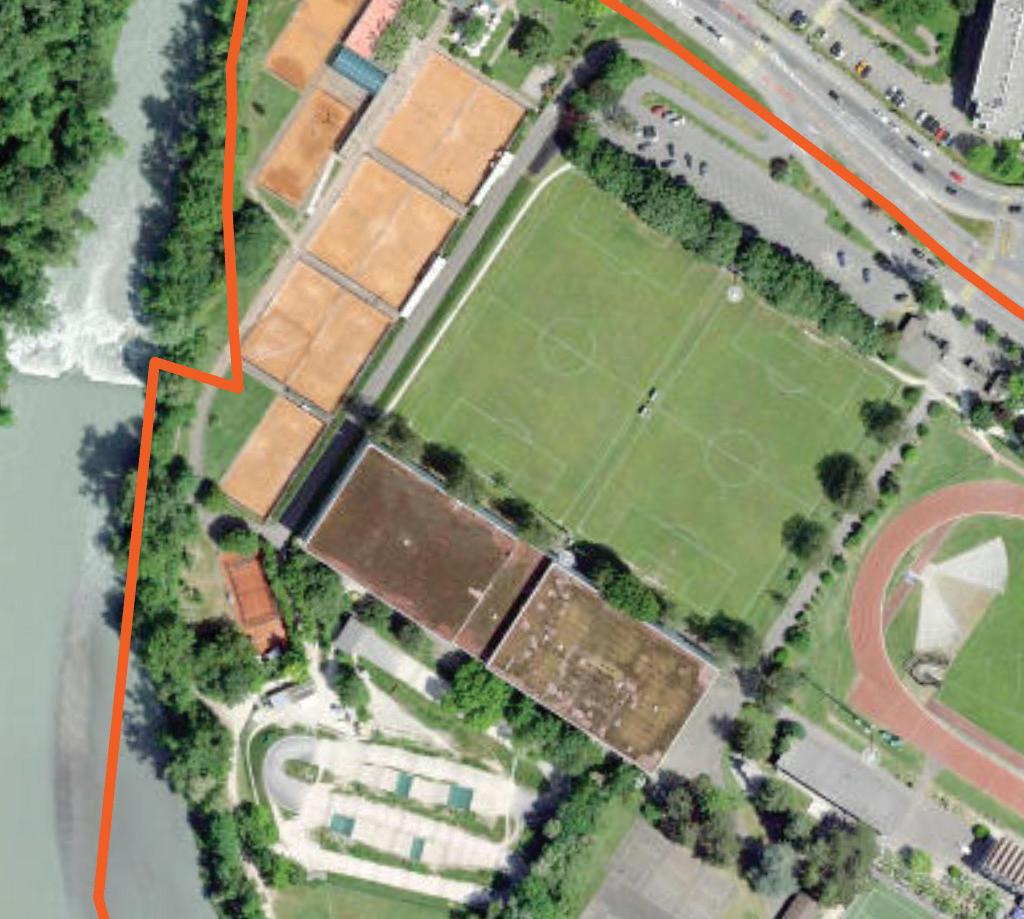
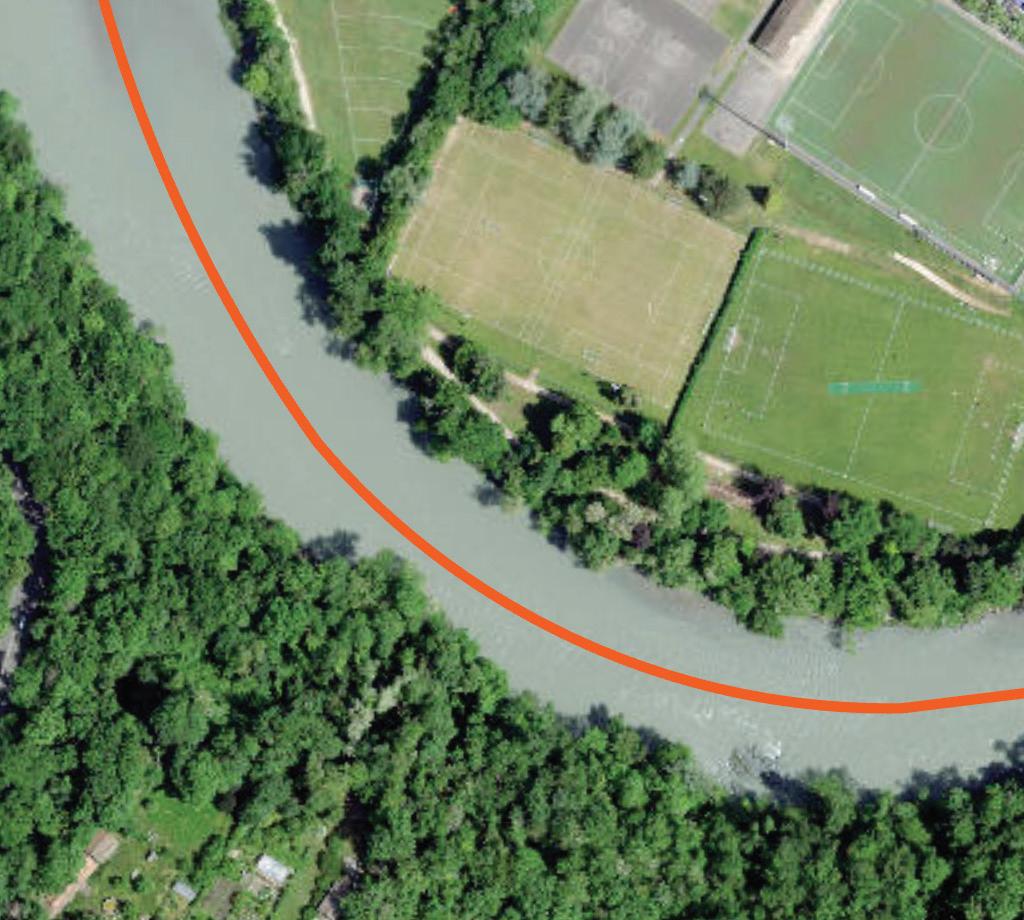
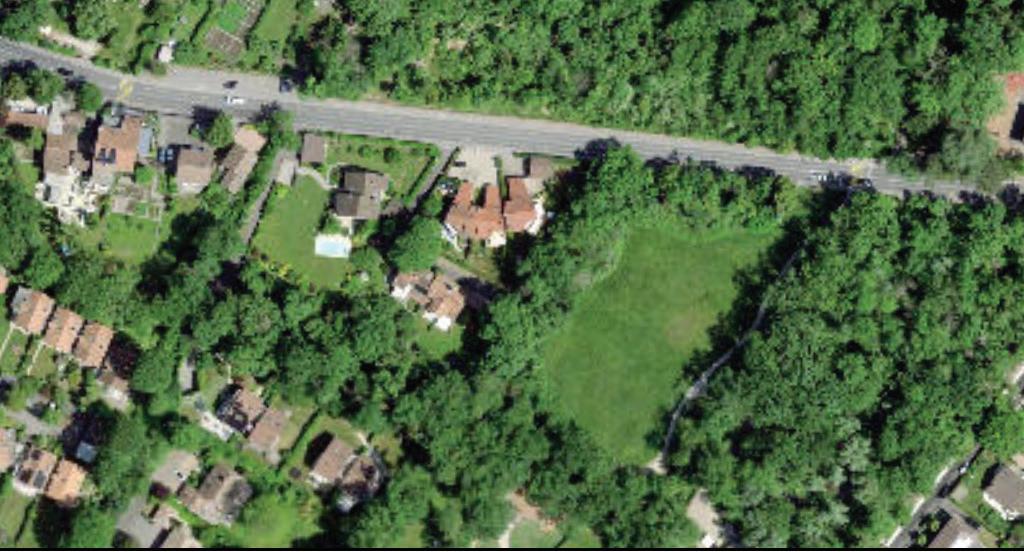

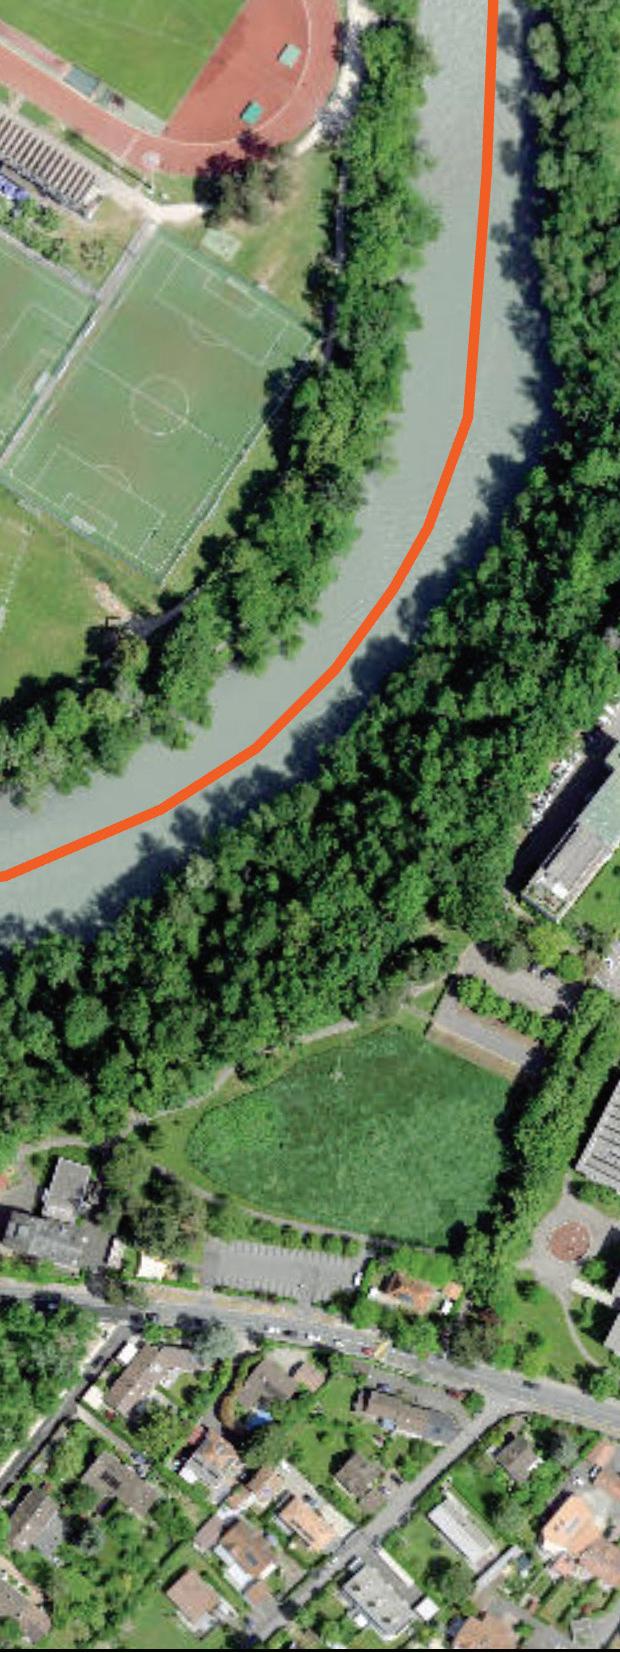
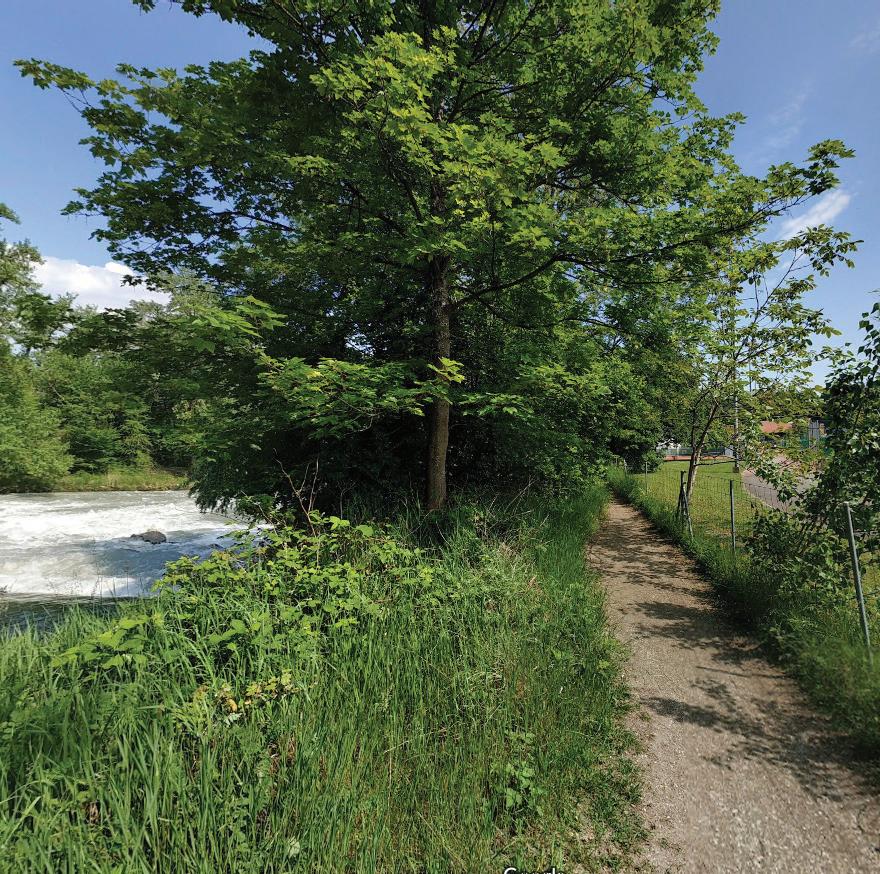
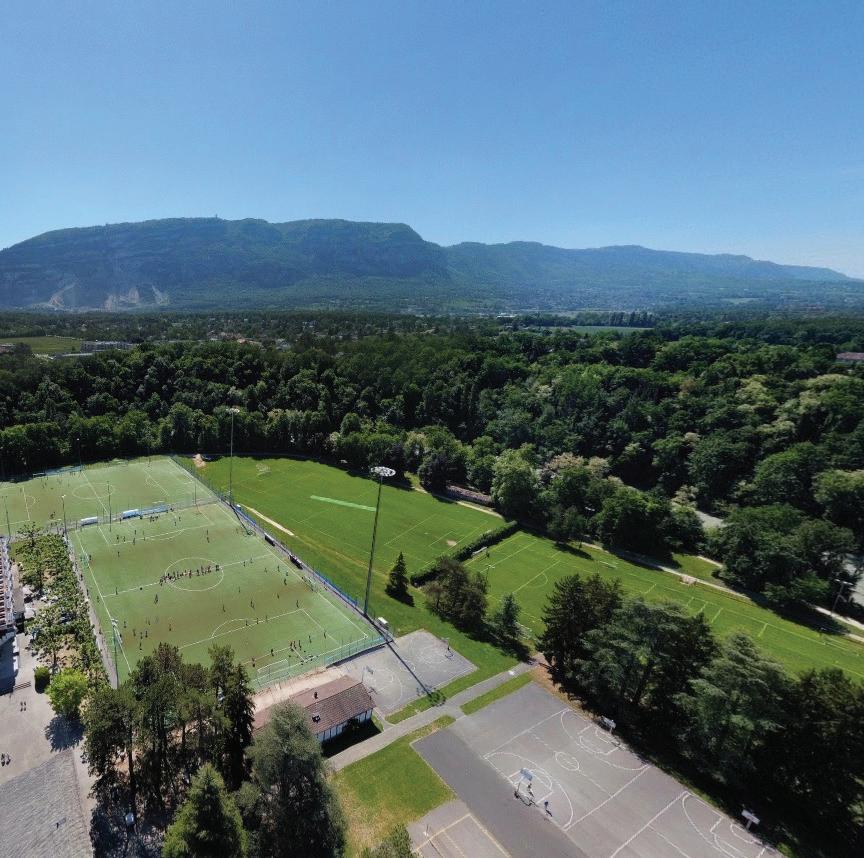
05.2 Parc Bout-du-Monde
Despite its large size, the park features relatively low canopy cover compared to the city-wide aquatic buffer and the city as a whole. Its gaining canopy at a similar rate to the city-wide aquatic buffer but slower than the city as a whole.
18% of the Parc area is covered by canopy 28% of the city’s aquatic buffer is covered by canopy
22% of the city is covered by canopy


“Modèle Numérique De Surface De Canopée - État 2023” (SIPV_ICA_ MNC_2023). SITG.


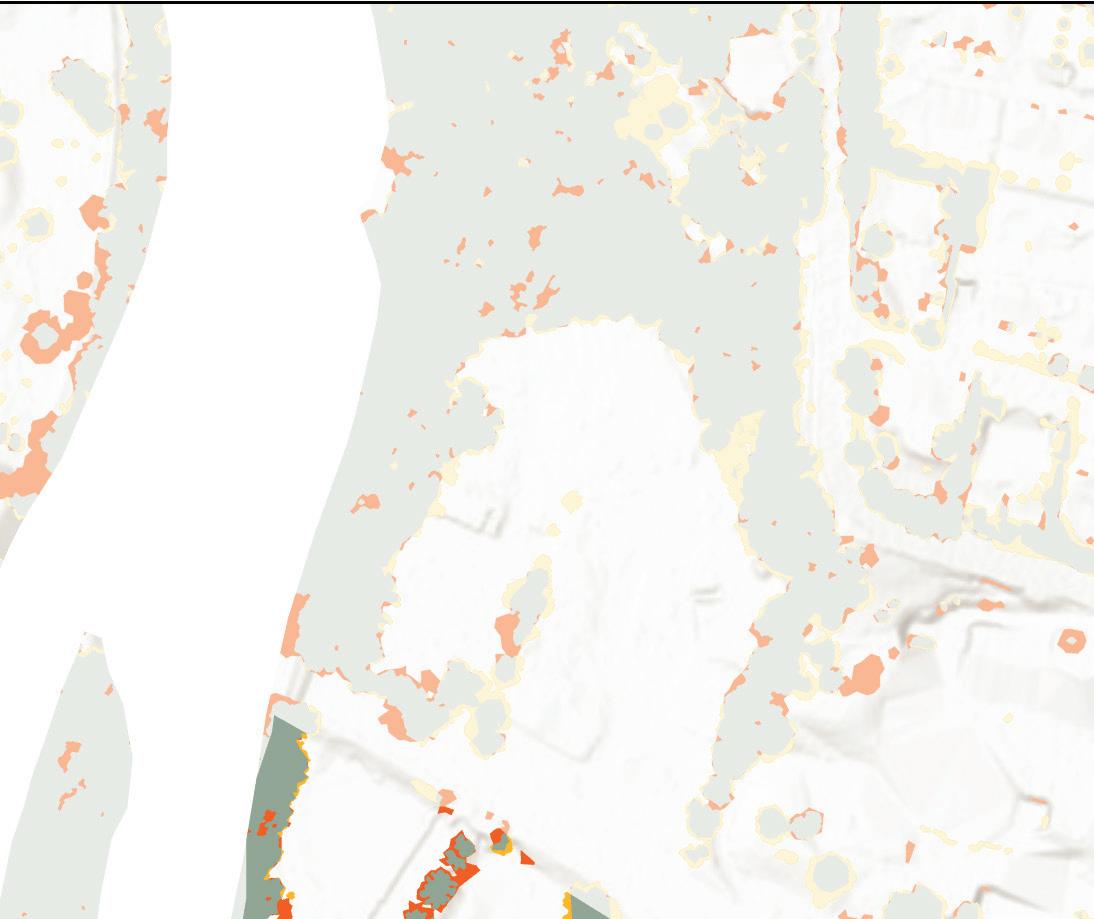
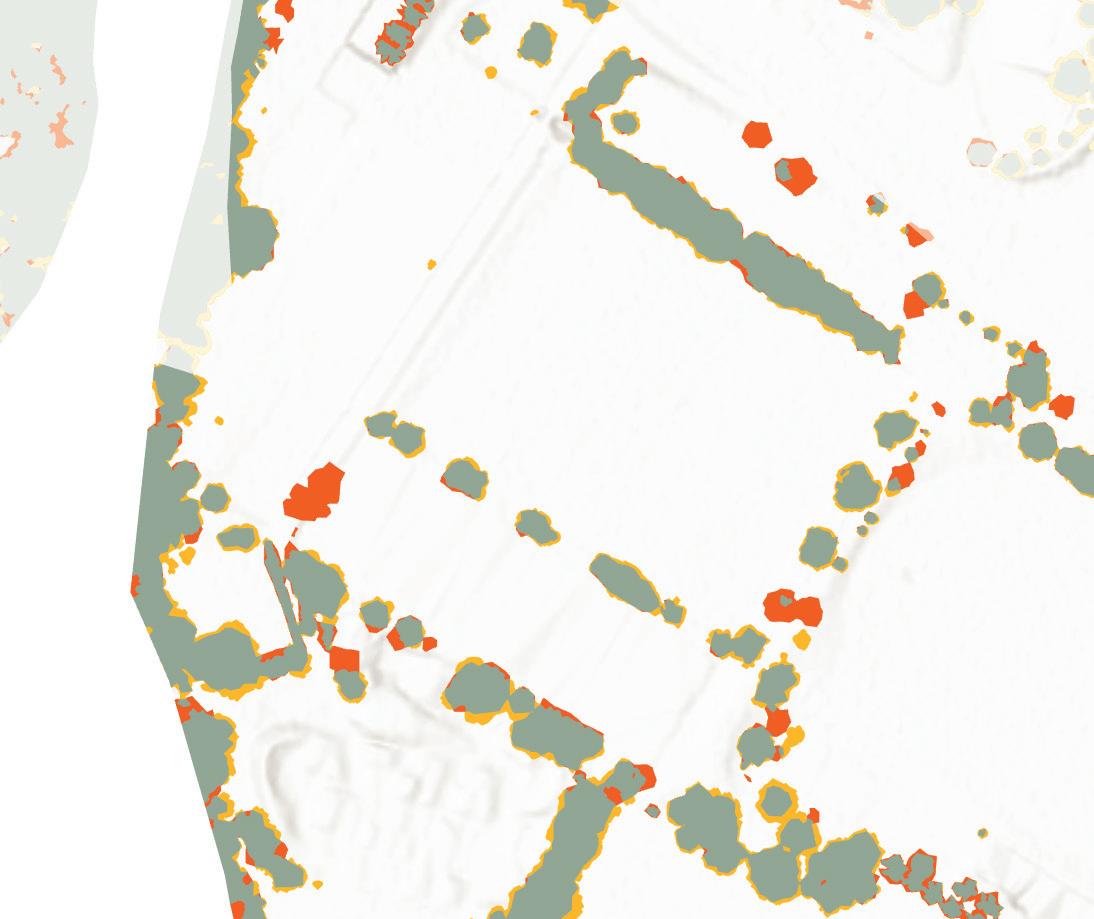
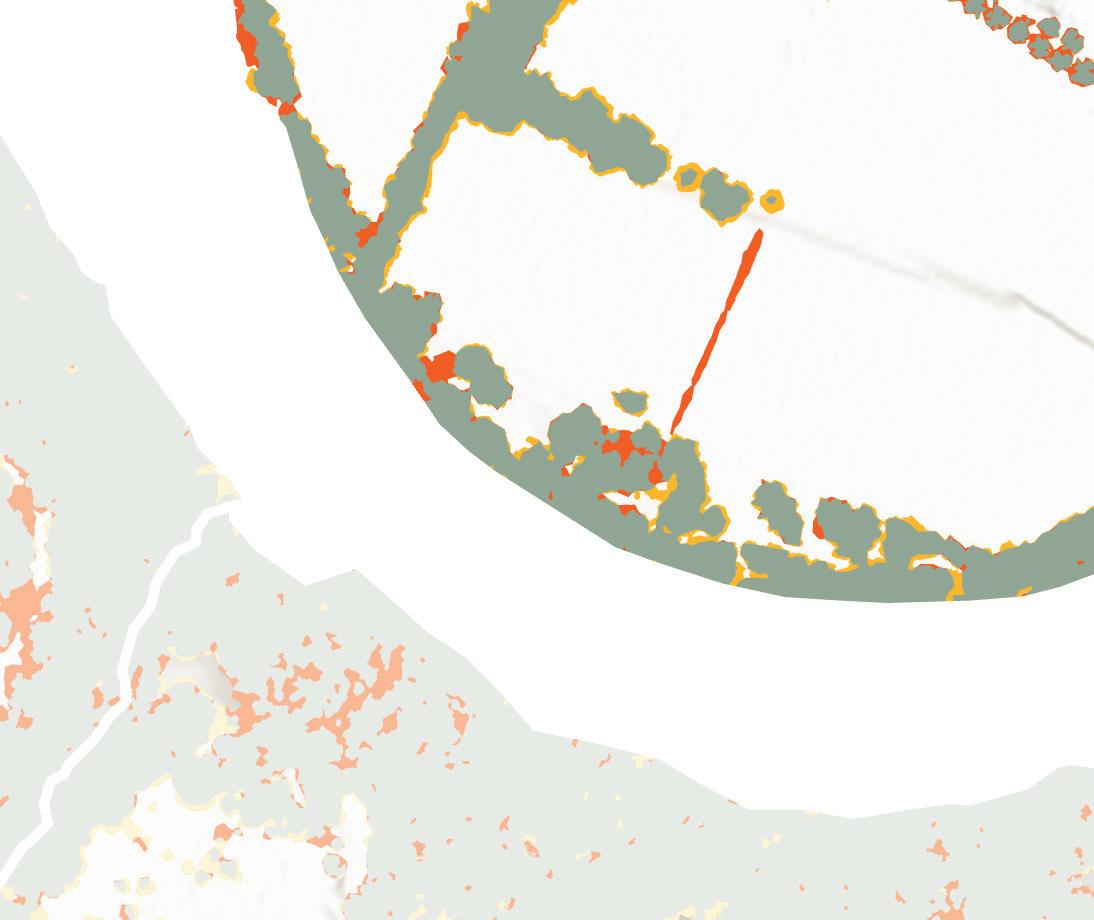
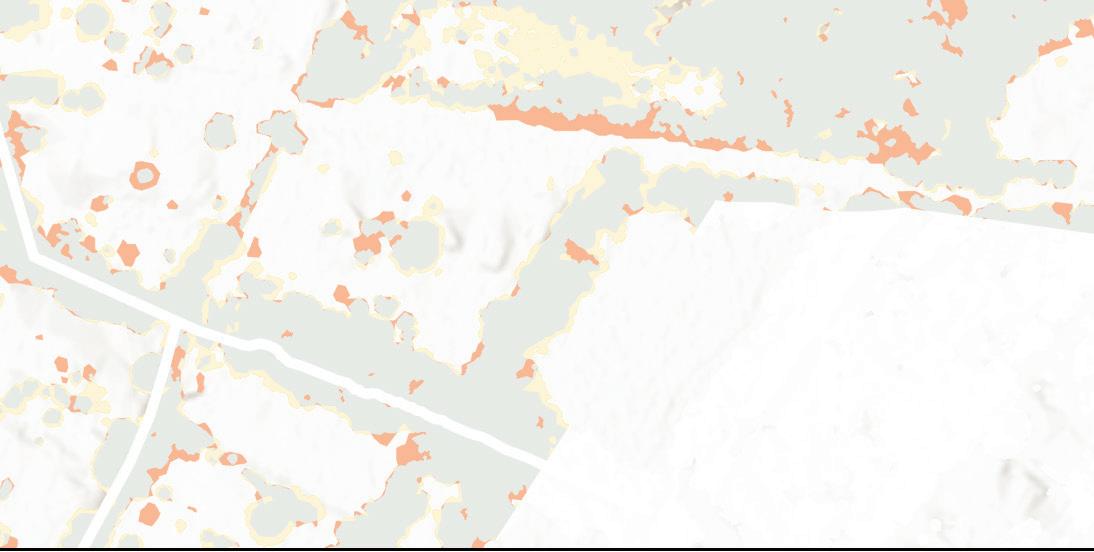

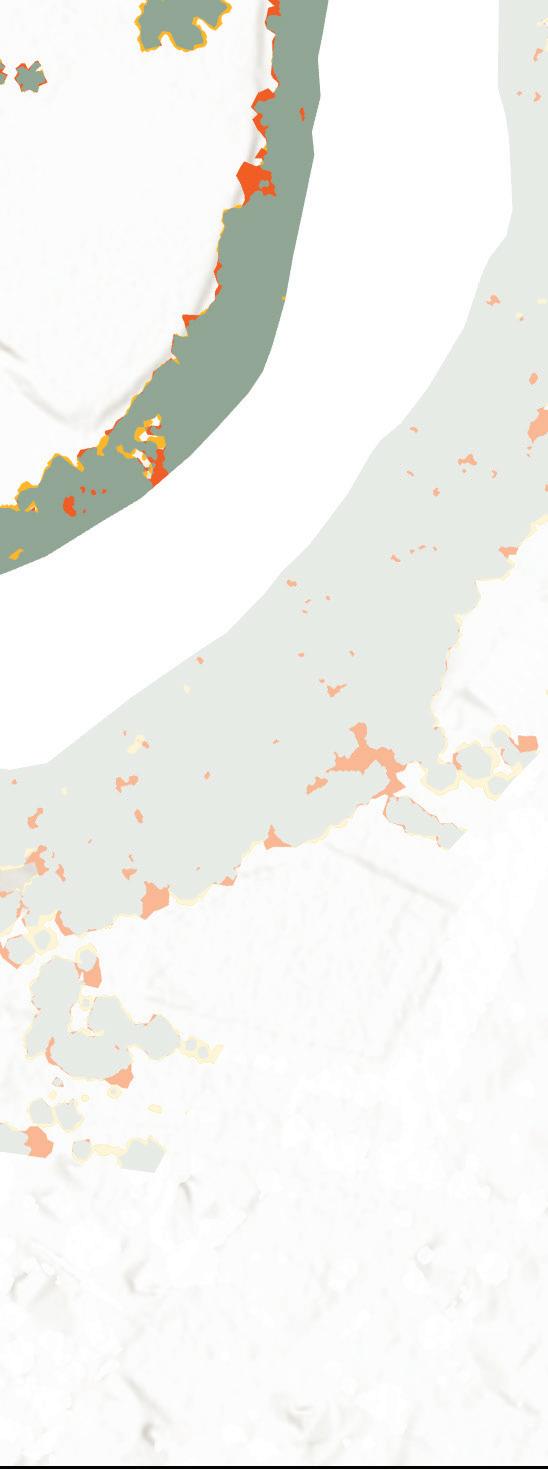

05.2 Parc Bout-du-Monde
The parc is entirely city-owned. While the site is mostly unpaved or wooded, a third of its total area is comprised of active sports fields, which limits plantable area. Its river edge is entirely wooded with informal paths to access the water.
Ground Conditions
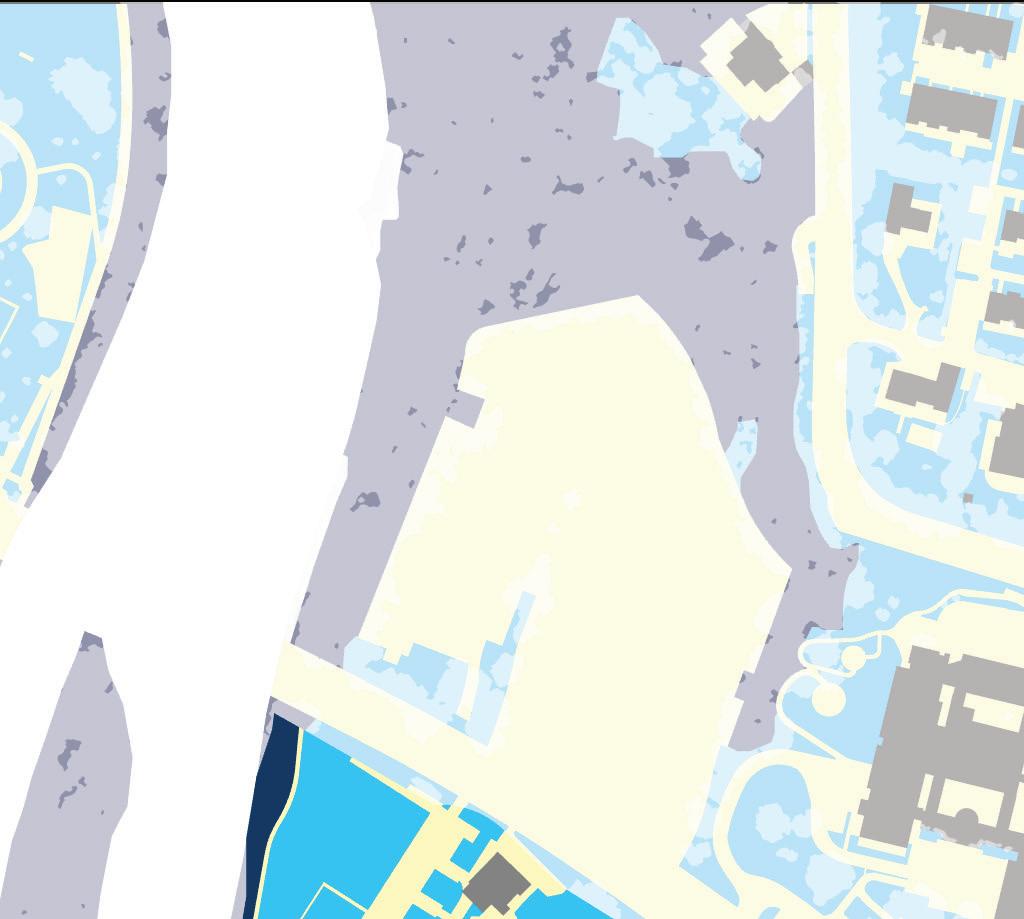
57% of unpaved areas are sports fields 33% of total site
Ownership
The site is entirely publicly owned between the canton and the commune.
100% Ville de Genève
24.9% of the city’s aquatic buffer is publicly owned between the canton and the commune
NOTE: There were inconsistencies in the property classification data in CAD_PARCELLE_MENSU Properties listed as private under TYPE_PROPRI would then have a designated public owner under PROPRI_PUBLIQUE, or property listed as public would have no designated public owner in the inverse.
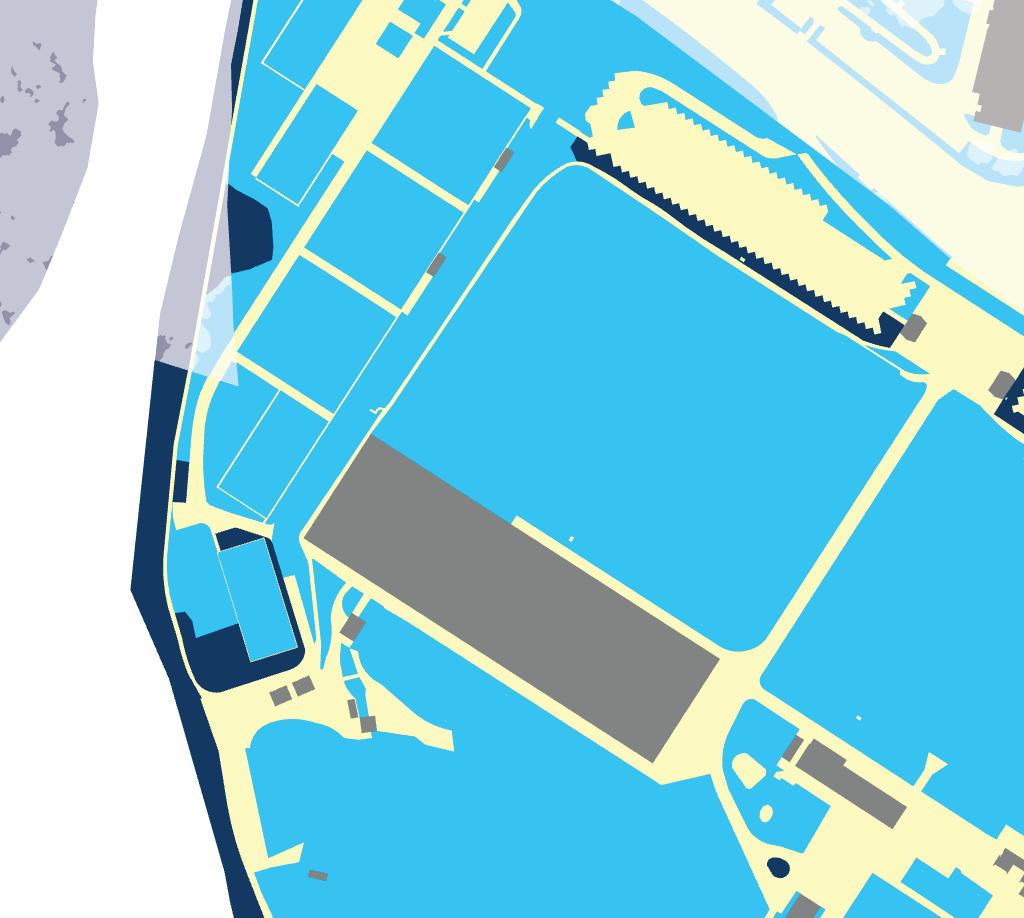

“Couverture du sol selon classification OTEMO” (CAD_CARTE_OTEMO). SITG. “Parcelles de la mensuration” (CAD_PARCELLE_MENSU). SITG. “Equipements et espaces publiques” (OBS_EQUIPEMENTS_ESPACES_PUB). SITG


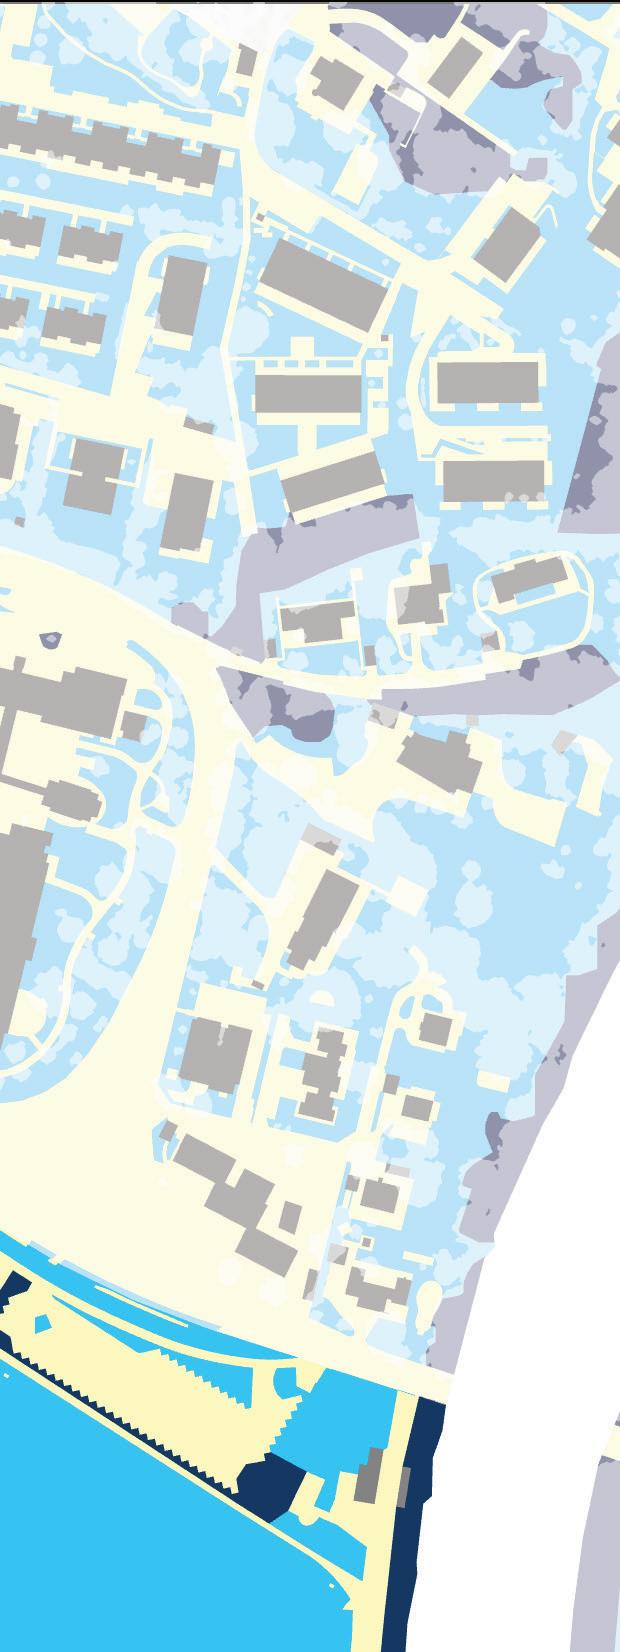
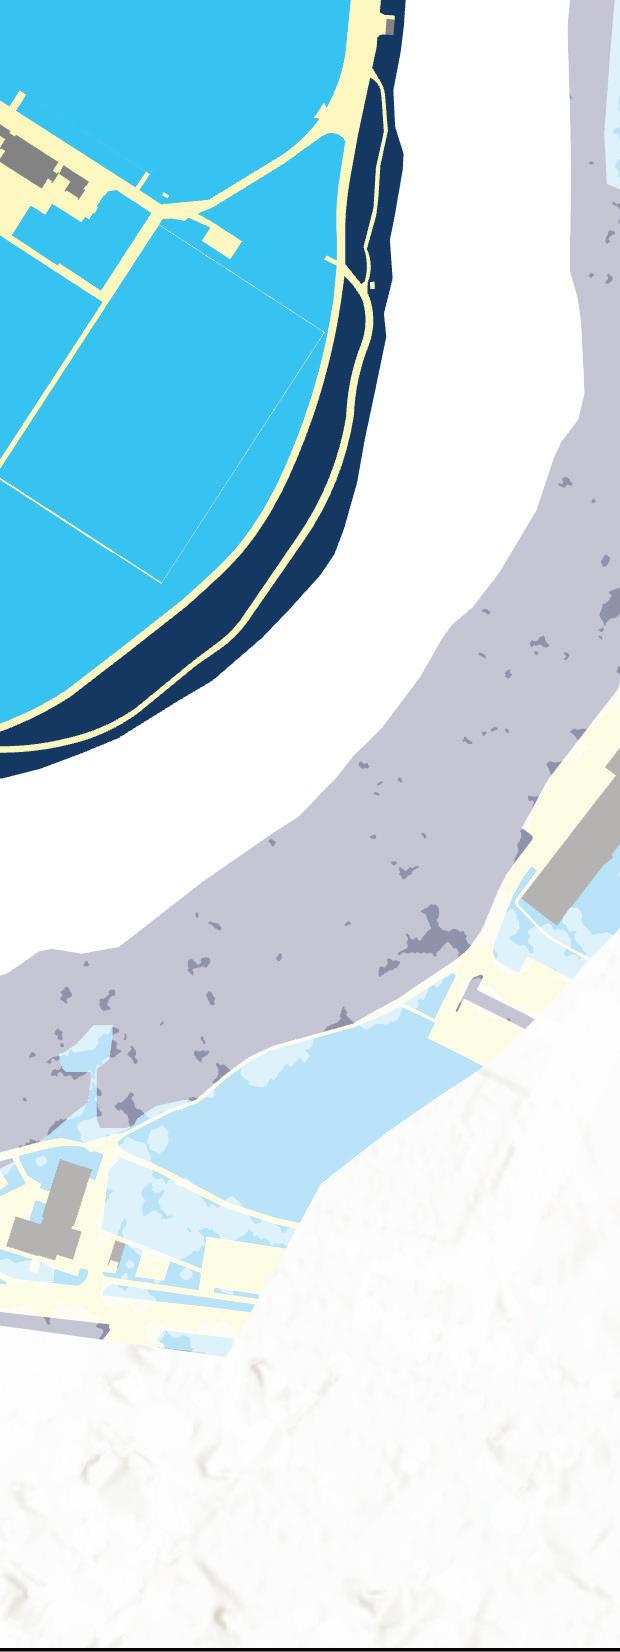






05.2 Parc Bout-du-Monde
Recommendations
01
Expand the aquatic buffer planting
Currently as narrow as 3m. Targeting a minimum depth of 20m could improve buffer performance with limited infringement upon active sports fields.
02a
Increase canopy coverage by 22, 000m² to reach 30% coverage by 58, 600m2 to reach 50% coverage
With 33% of the site occupied by active recreation reaching 50% coverage is unlikely. Prioritizing forested area along the river would be most effective.
02b
Investigate use and reorganize sports fields
Determine whether there is redundancy in sports fields or if there is possibility for nested uses to open up more of the site to plantable area. Prioritize shaded areas for spectators.
03
Enhance targeted water access to limit informal paths through the forest
The impact of these recommendations can be networked out to similar large greenspaces around the city, highlighted here. Unlike the Quais, where a program with shared goals could be developed, these are subject to more variable conditions and would require site-by-site analysis to develop goals for each.
Improving canopy by 15% across the aquatic buffers of these three parks could increase the overall canopy of the aquatic buffer from 28% to 34% and significantly improve public experience of the waterfront.





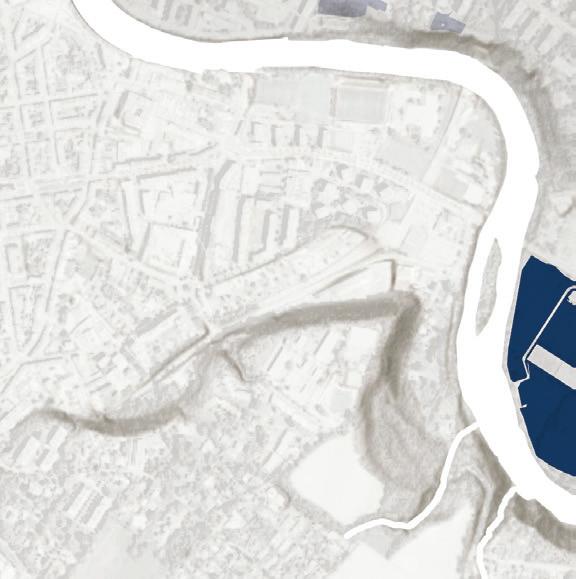


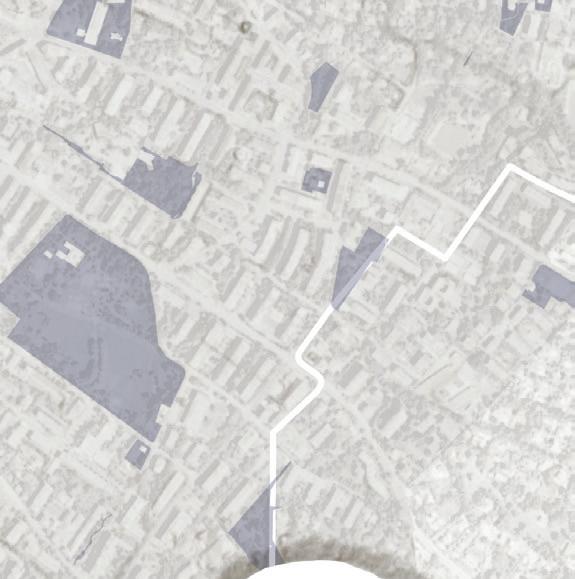
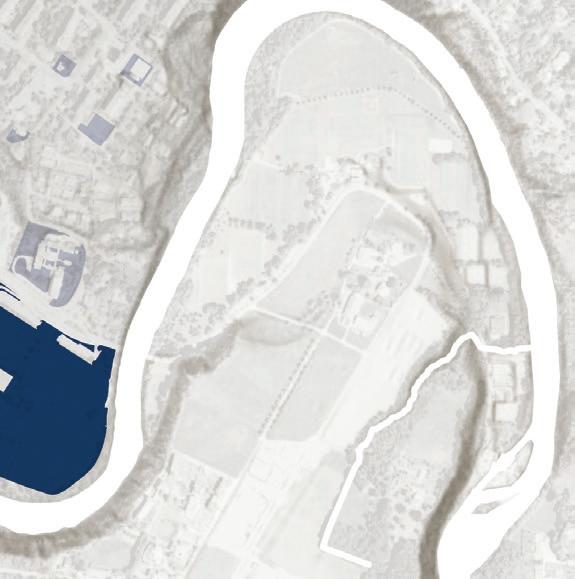










The canton’s aquatic buffer is dominated by its network of tributary streams, including the large water protection areas along the south-eastern portion of the Arve, the Allondon, and the widened buffer along the right bank of Lac Léman. Many of these streams emerge in the mountains, over the French border, and experience seasonal variation in their flows. Most drain to the two main rivers, with a few draining directly to the lake.
13% of the canton of Geneva is within the aquatic buffer


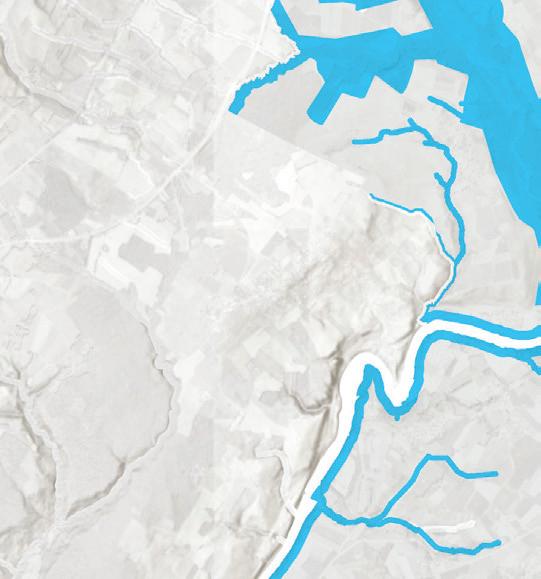

“Emprise du Lac Leman (Complet)” (GEO_LAC_LEMAN). SITG. “Graphe hydrographique transfrontalier”(AGGLO_RTGE_RESEAU_HYDRO). SITG. “Secteurs de protection des eaux” (GOL_SECTEURS_PROTECT_EAUX). SITG.
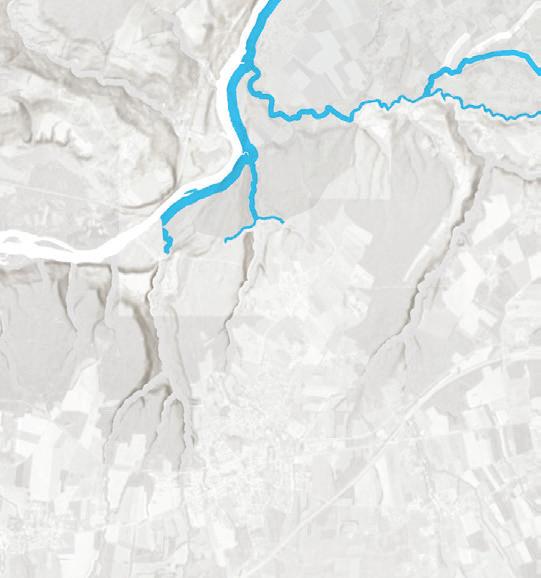




The canton’s buffer also hosts a disproportionately high canopy coverage, with concentrated forested areas along the Allondon, which is protected by RAMSAR and the national government. Many of the streams near the city center are buried or channelized and have very low canopy cover, including the Drize and Aïre.
Overall, the canton has relatively low 20% canopy coverage considering its much less built up than a typical urban area.

13% of the canton of Geneva is within the aquatic buffer

28% of the canton’s canopy is within the aquatic buffer

43% of the canton’s aquatic buffer is covered by canopy 20% of the canton is covered by canopy
“Modèle Numérique De Surface De Canopée - État 2023” (SIPV_ICA_ MNC_2023). SITG.



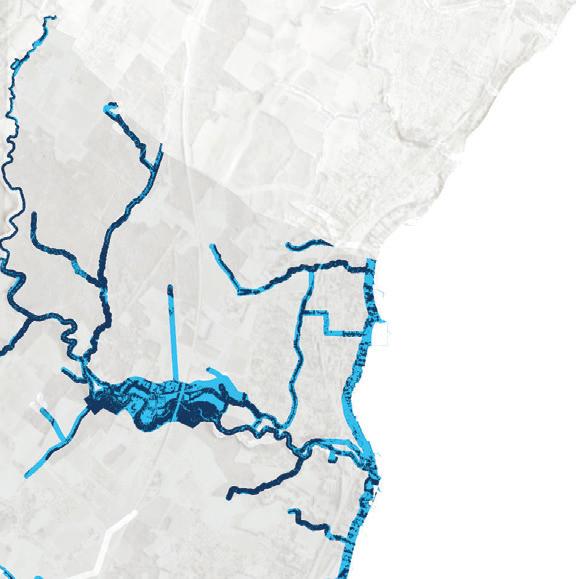
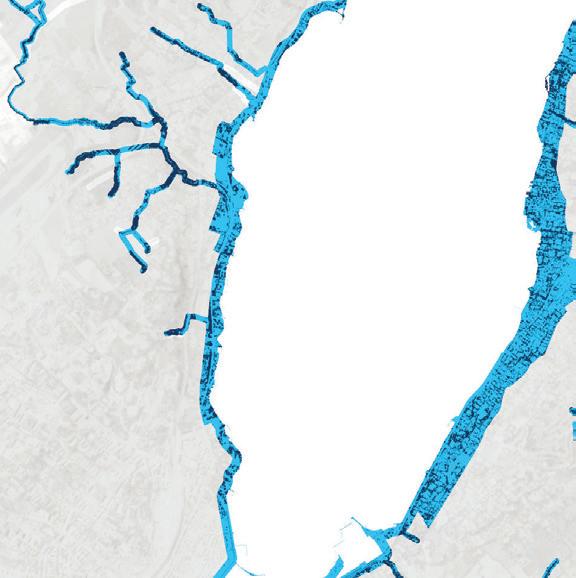
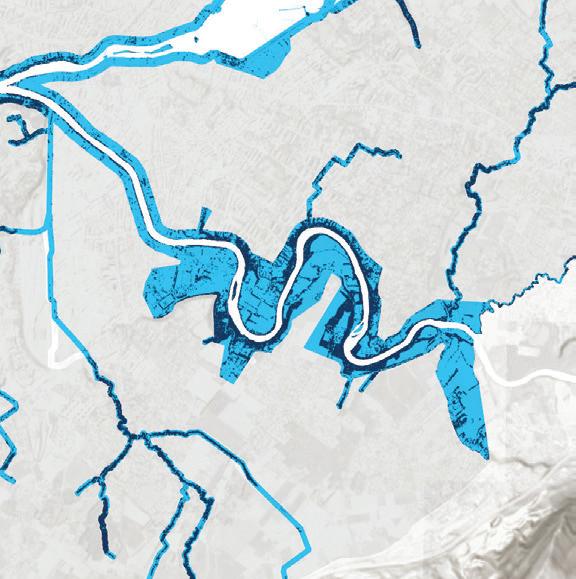



Canton
Both the Canton and aquatic buffer experienced moderate canopy gains over the past decade. Notable gains have occurred along the Allondon and parts of the renaturalized river Aïre, with significant but distributed losses along the right bank of Lac Léman.

Canton - 4.1% Net gain of 2.56M m2 2013-2023

Aquatic Buffer - 4.2% Net gain of 695K m2 2013-2023
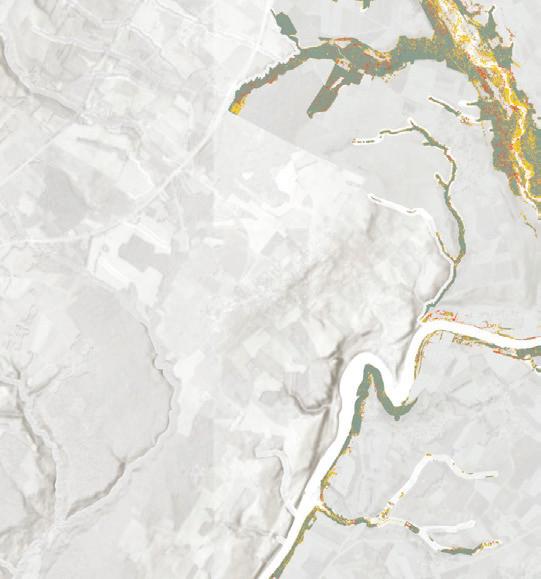

“Modèle Numérique De Surface De Canopée - État 2023” (SIPV_ICA_ MNC_2023). SITG.


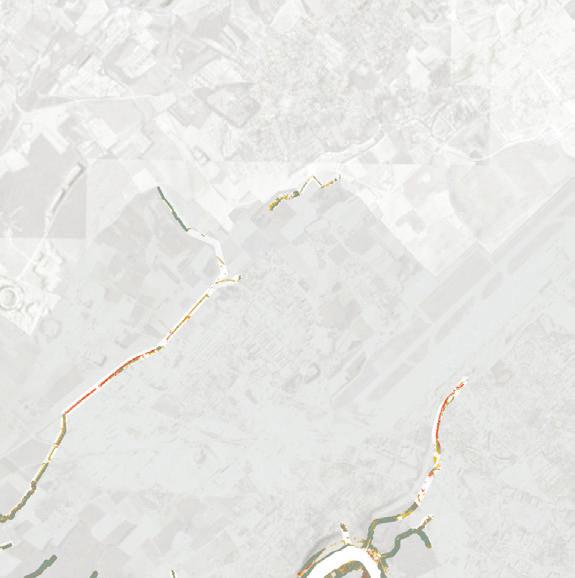
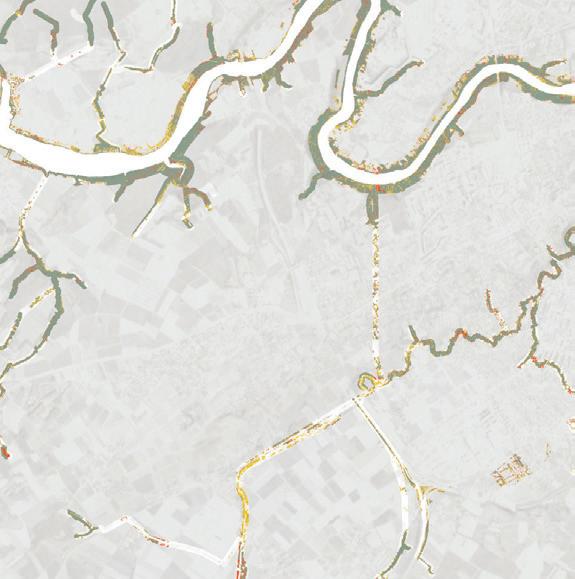
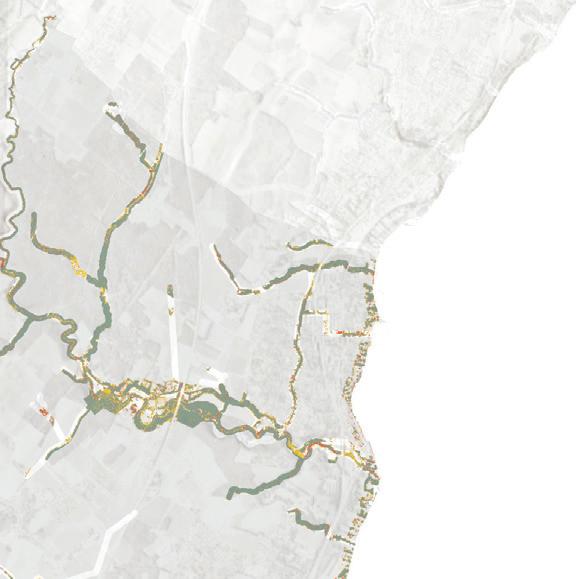
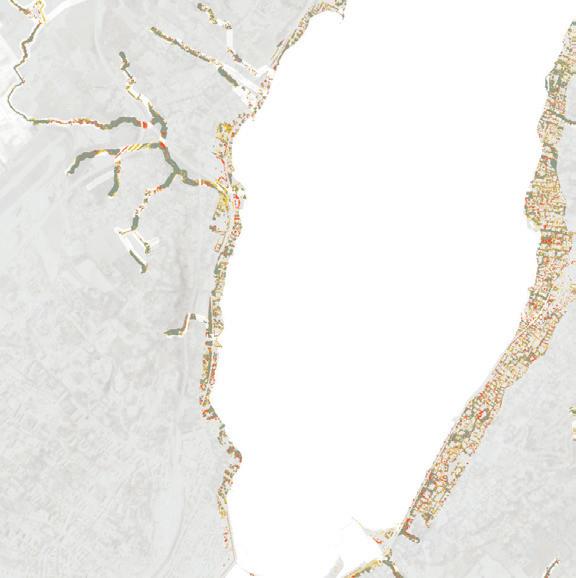
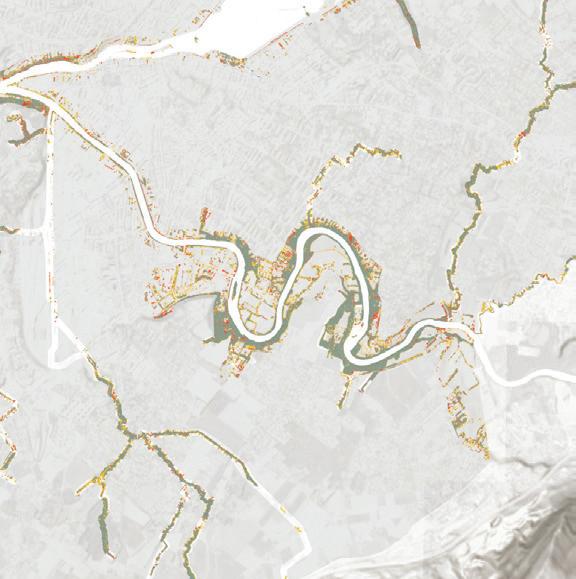
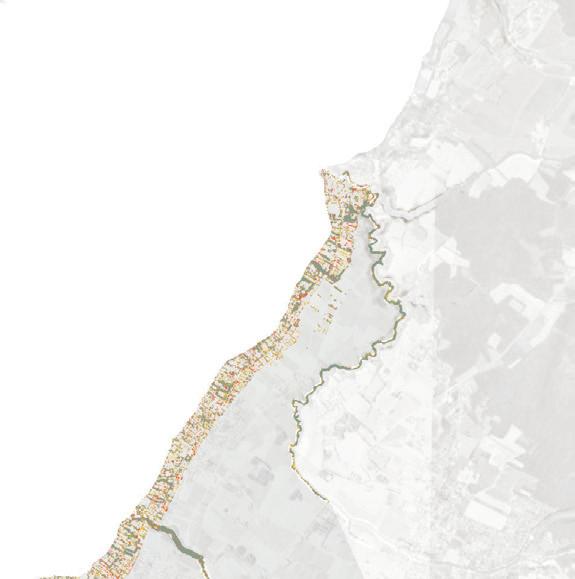

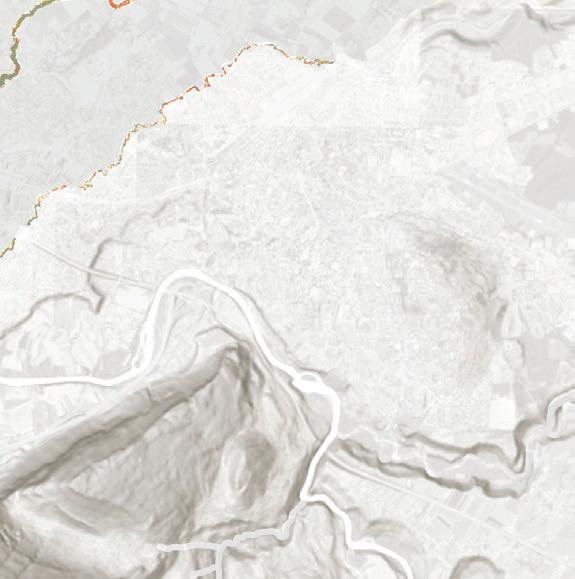


While much of the aquatic buffer is unpaved, a significant proportion of this area is unwooded agricultural land. Outside of the city of Geneva and parts of the lake banks, very little of the buffer is paved, with around 5% of the buffer occurring on this paved area.


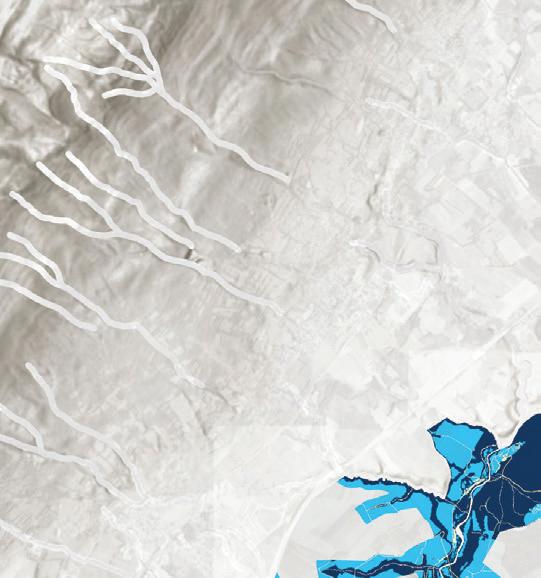

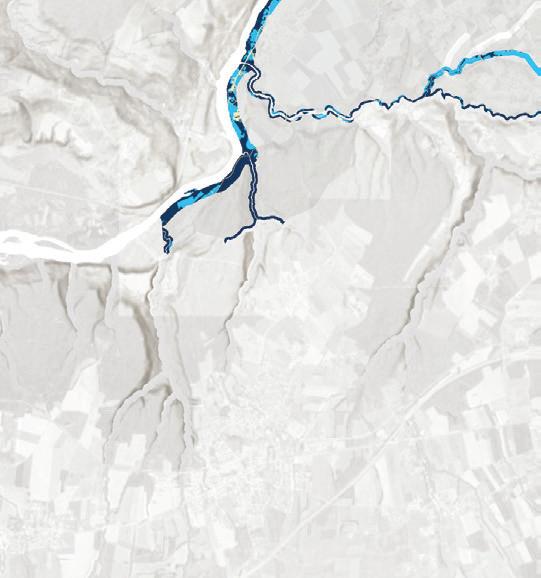




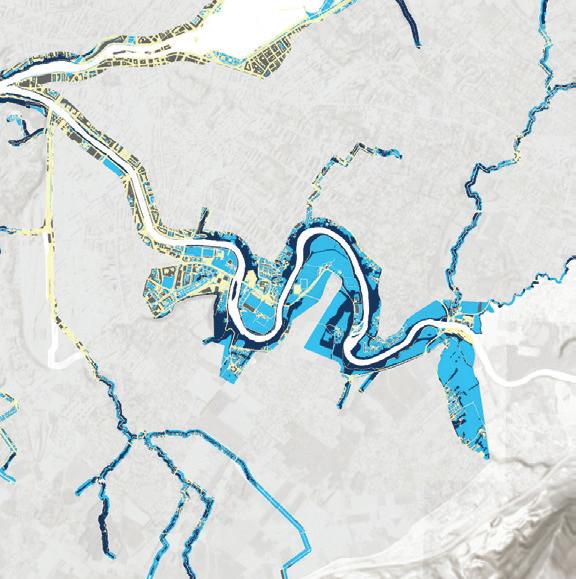

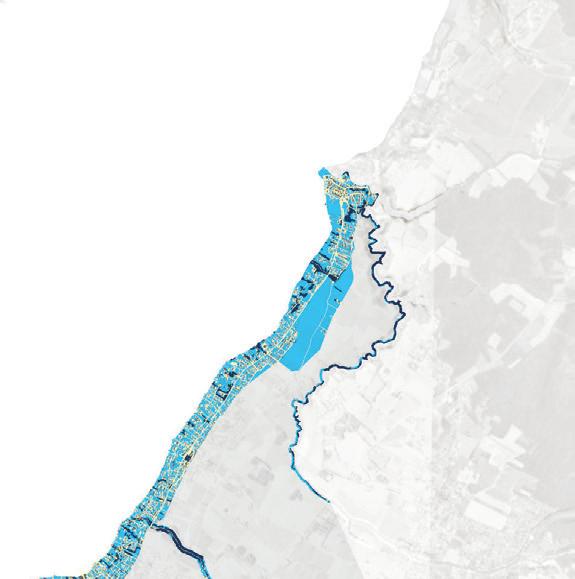


Most of the buffer is under private ownership.

NOTE: There were inconsistencies in the property classification data in CAD_PARCELLE_MENSU Properties listed as private under TYPE_PROPRI would then have a designated public owner under PROPRI_PUBLIQUE, or property listed as public would have no designated public owner in the inverse.

“Parcelles de la mensuration” (CAD_PARCELLE_MENSU). SITG. “Equipements et espaces publiques” (OBS_EQUIPEMENTS_ESPACES_PUB). SITG “Milieux proteges” (AGGLO_NAT_MILIEUX_PROTEGES). SITG




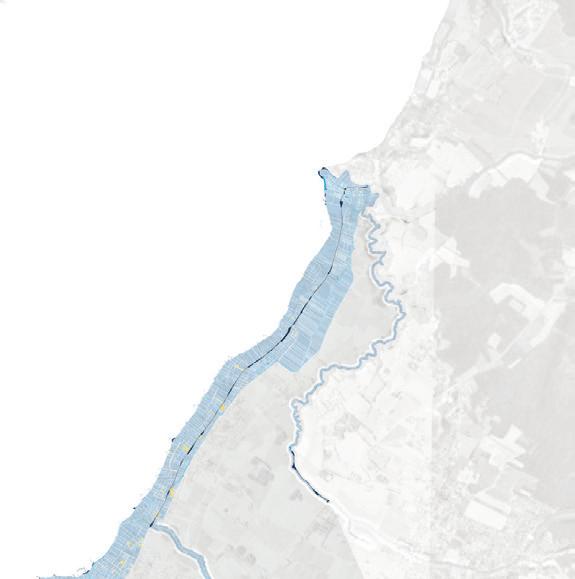
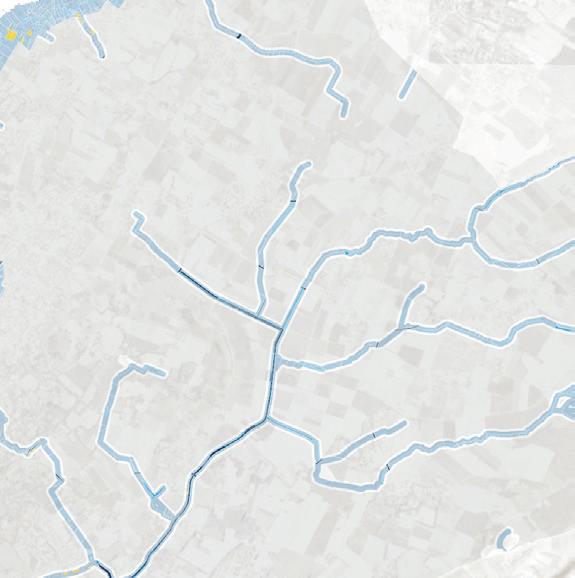


Canton
The aquatic buffer benefits from a higher coverage of environmental protection than the canton as a whole. Half of the buffer has some degree of environmental protection, though further study would be required to outline the degree and requirements of protection. Protections are unevenly distributed with significantly more to the West of the city.

Almost 90% of the protected land within the buffer is private, which speaks to the importance of policy and regulatory tools in managing the buffer.
“Parcelles de la mensuration” (CAD_PARCELLE_MENSU). SITG.
“Equipements et espaces publiques” (OBS_EQUIPEMENTS_ESPACES_PUB). SITG
“Milieux proteges” (AGGLO_NAT_MILIEUX_PROTEGES). SITG







Canton
Smaller tributaries of the lake and two rivers structure the canton’s landscape and define its aquatic buffer. Many of these streams have been subject to significant renaturalization efforts since 1998 under the “10 ans pour sauver nos rivières” initiative and subsequent efforts.
This initiative does not aim to restore to a historic baseline state but to restore the agency of the environmental processes of these streams to improve water quality, habitat, and public access. Forested buffers are a significant contributor to all of these metrics and should be considered with renaturalization projects.


The river Aïre is a significant tributary of the Arve with highly variable stream conditions. While buried and channelized where it joins the Arve, part of it was subject to a high-profile renaturalization effort, completed in 2015.


Stream conditions throughout the canton, and even along each watercourse, are highly variable. Around a third of the length of watercourses throughout the canton are buried, channelized, or heavily modified. These tend to be concentrated towards the city of Geneva, the lake edge, and the communities to the south of the city with significant industrial activity, such as Carouge. Many of the buried stream portions, including the Drize and La Lissole, a tributary of the Aïre, follow major rail or car corridors.
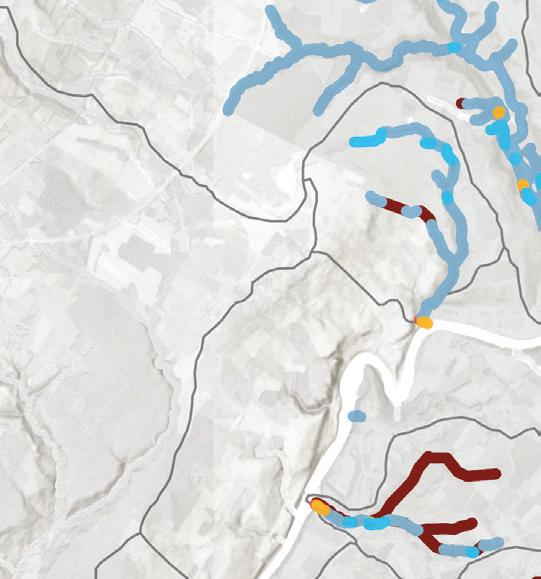

“Ecomorphologie des cours d’eau” (LCE_GRAPHE_EAU_ECOMORPHOLOGIE). SITG.
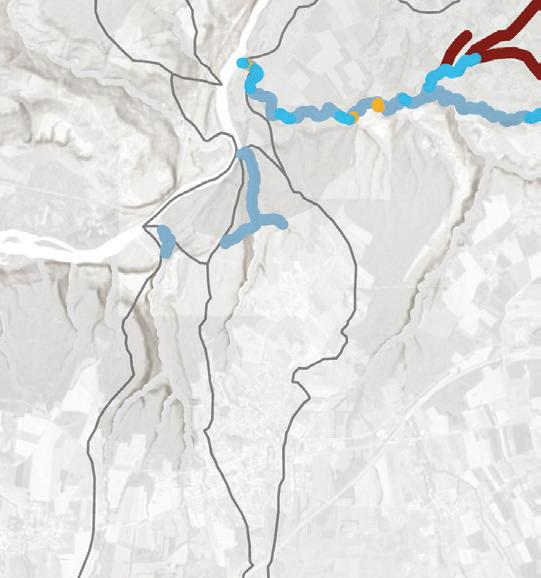


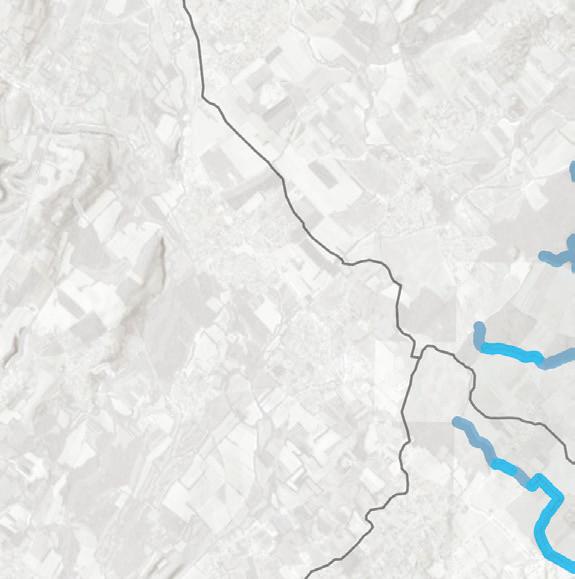
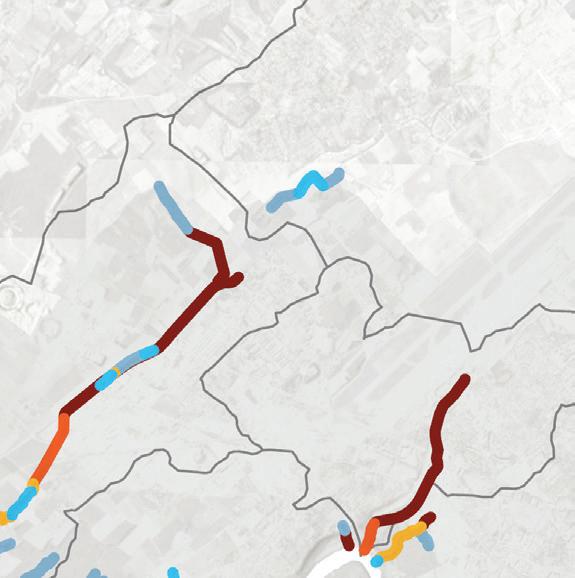
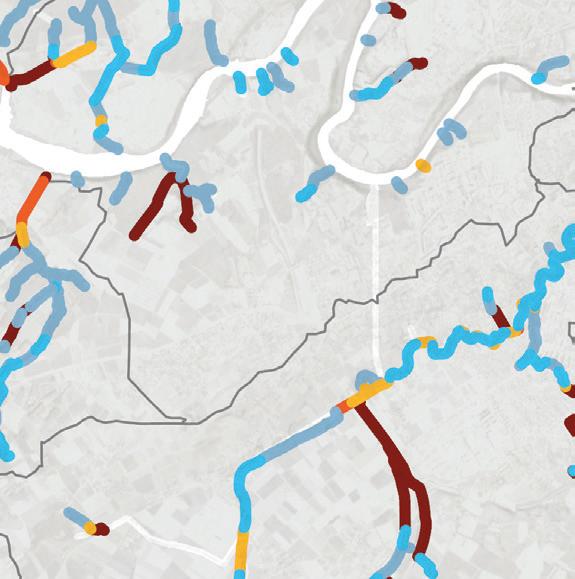
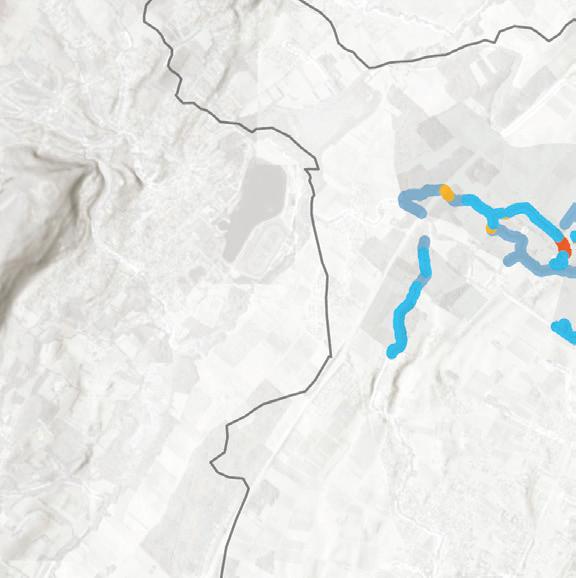
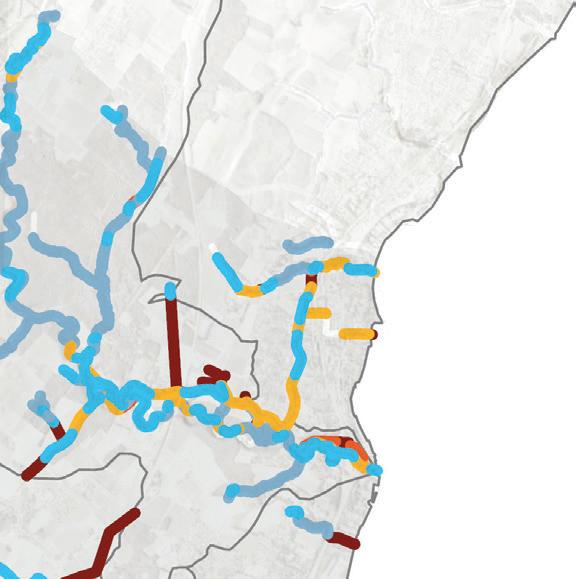
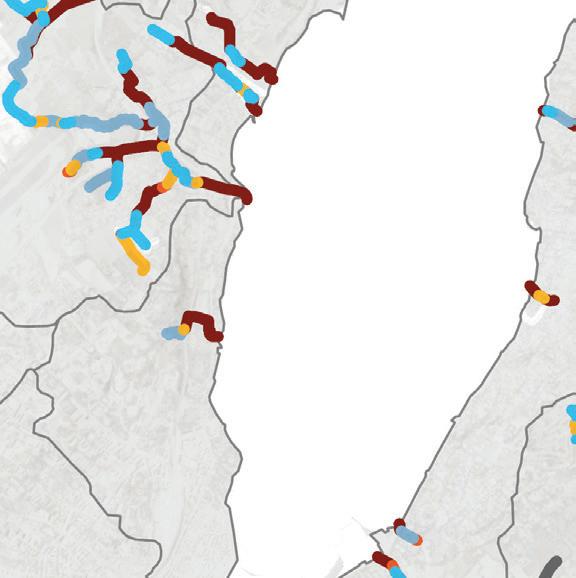

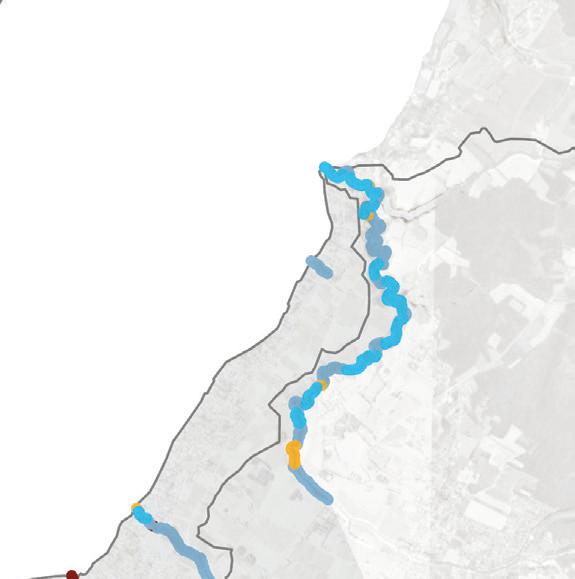
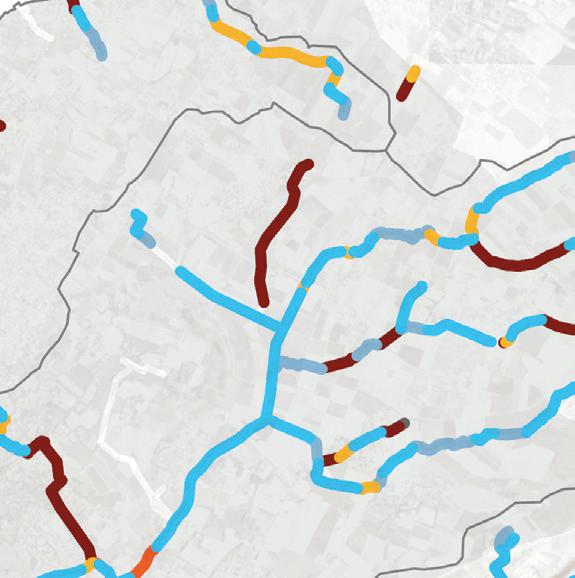


The Canton delineates twenty principal watersheds with highly variable conditions. This varies from the Avanchet, which is entirely buried or channelized, to the Laire, which is mostly naturalized. Of the principal waterbodies, the left bank of the Rhône-Léman watershed is the least naturalized, with around half of its streams heavily modified or more. The Aïre and the Drize are two of the principal streams that pass through or near the city of Geneva itself and are both significantly modified.
“Ecomorphologie des cours d’eau” (LCE_GRAPHE_EAU_ECOMORPHOLOGIE). SITG.
“Bassins Versants Principaux” (LCE_BV_PRINCIPAUX). SITG.

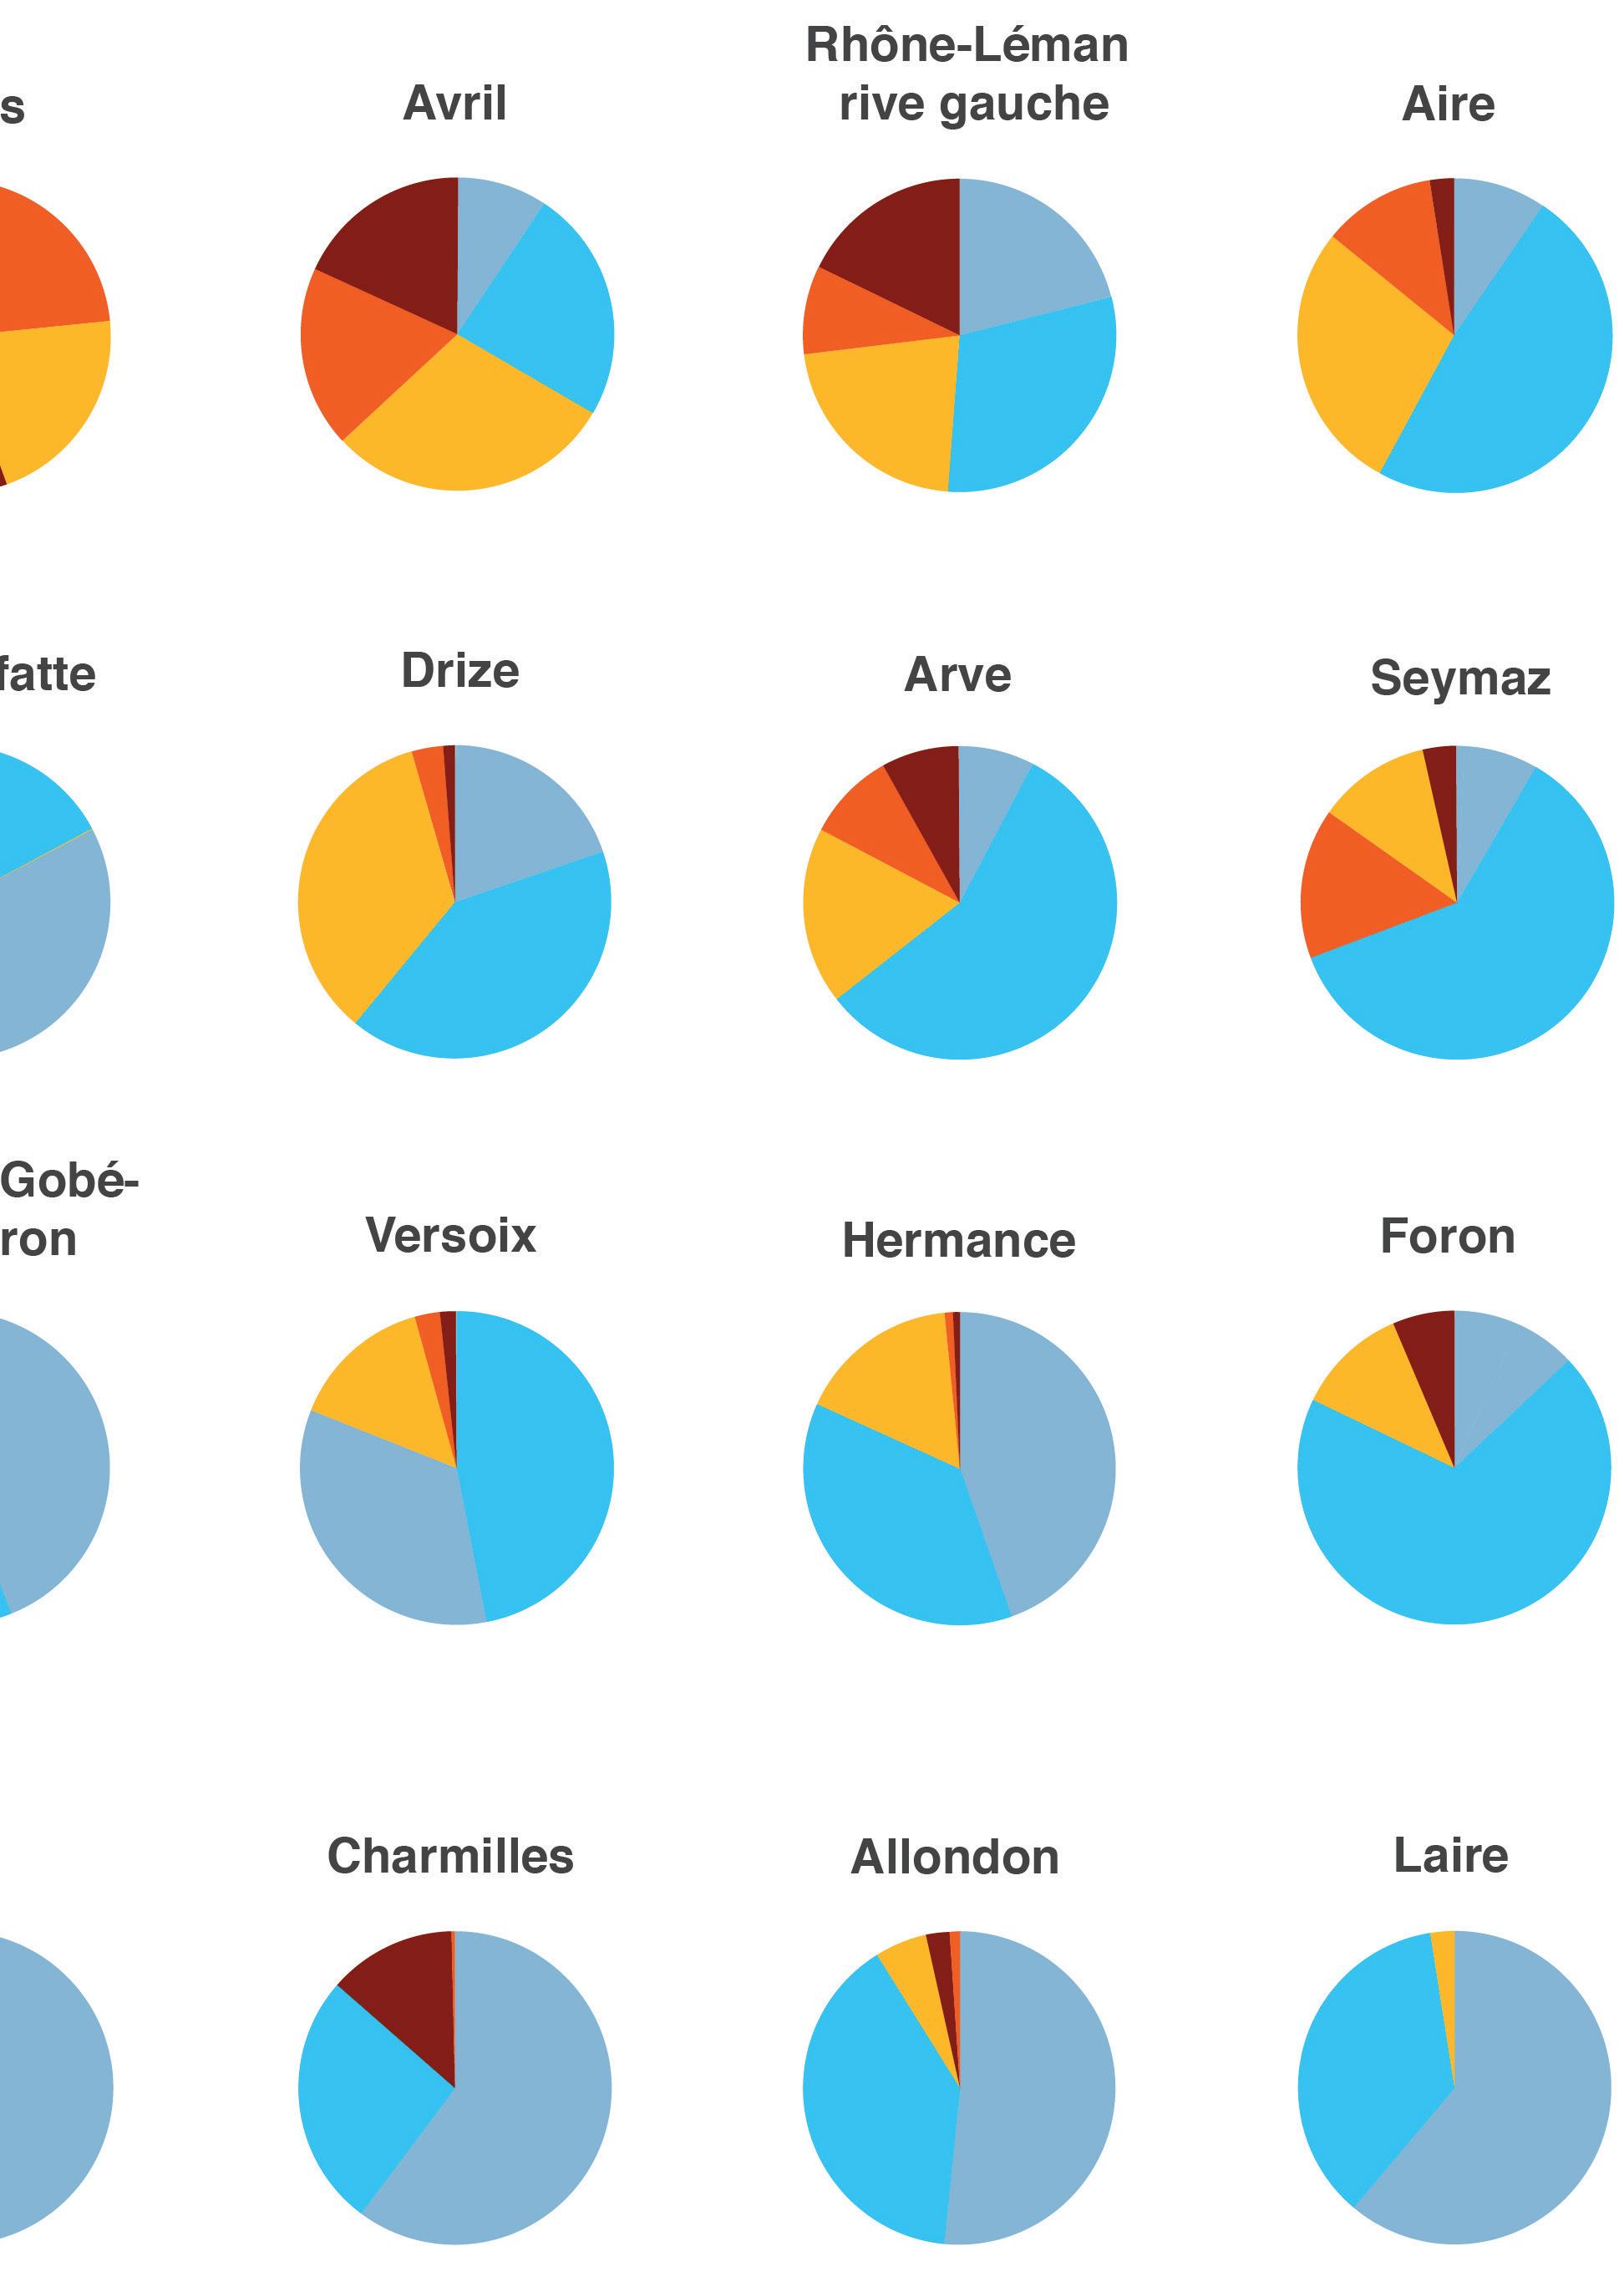
The most modified watersheds are closer to the city center and lower in the valley. Two smaller streams, the Avanchet, northwest of the city center, and the Crues, downstream along the Rhône, are over half buried, channelized, or heavily modified. The Allondon, with the largest drainage basin, in a mostly natural state. To the south, the Aïre and the Drize’s buried portions are delineated as part of the Arve or Rhône watersheds, which improves their rating. If portions of streams such as these were to be renaturalized, the watershed delineation would change.
Many of these watersheds are shared between Switzerland and France. Only information from the streams within Swiss territory is included in this analysis.


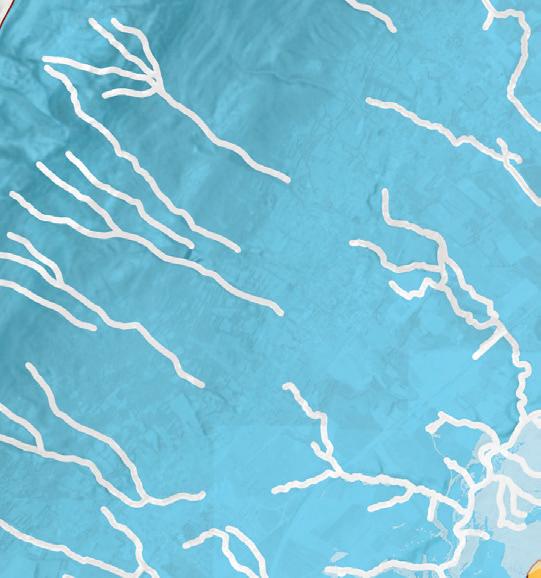
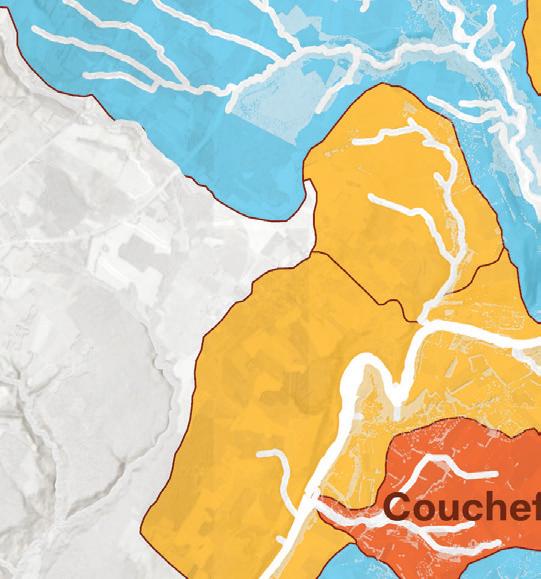

“Ecomorphologie des cours d’eau” (LCE_GRAPHE_EAU_ECOMORPHOLOGIE). SITG.
“Bassins Versants Principaux” (LCE_BV_PRINCIPAUX). SITG.
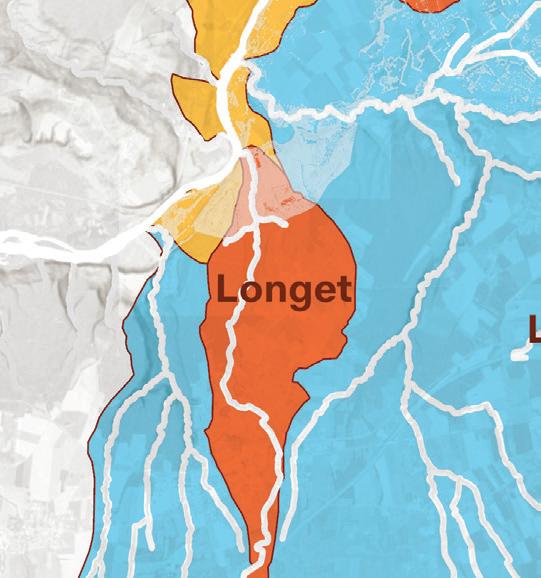

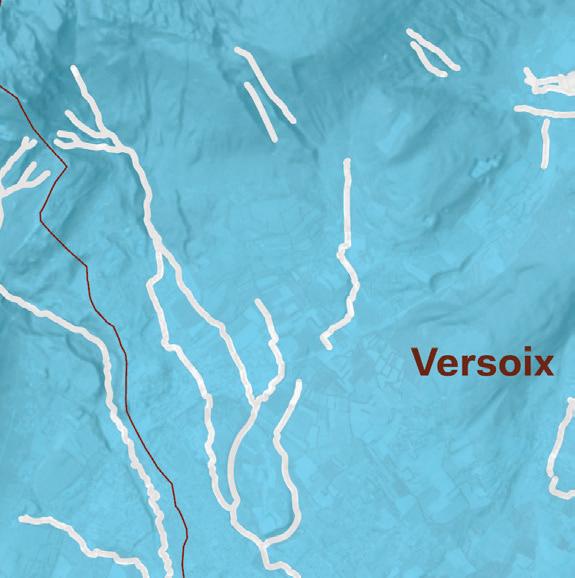


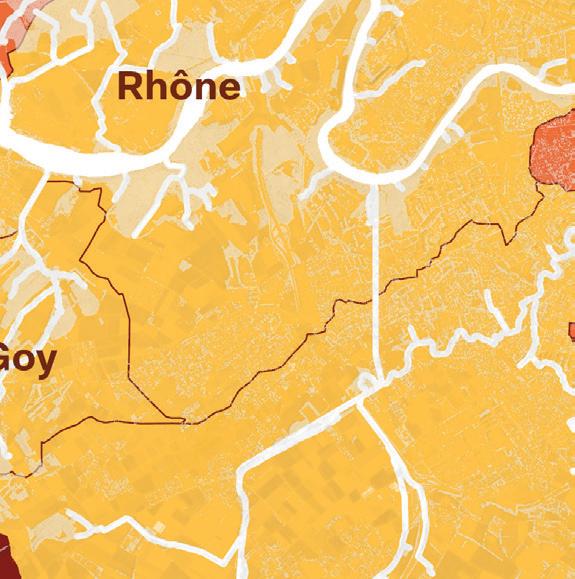
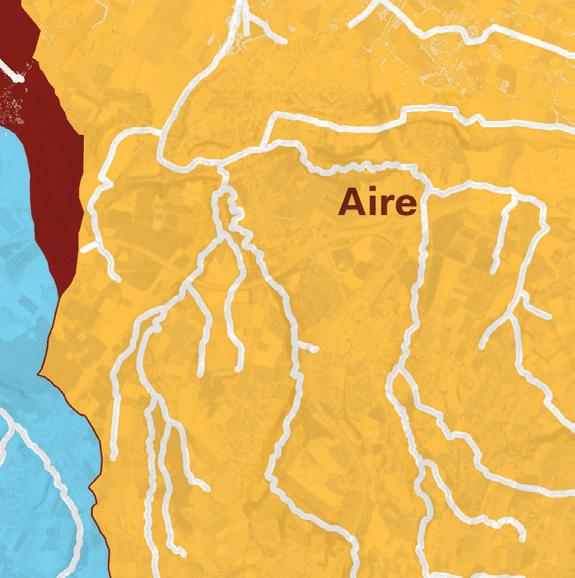
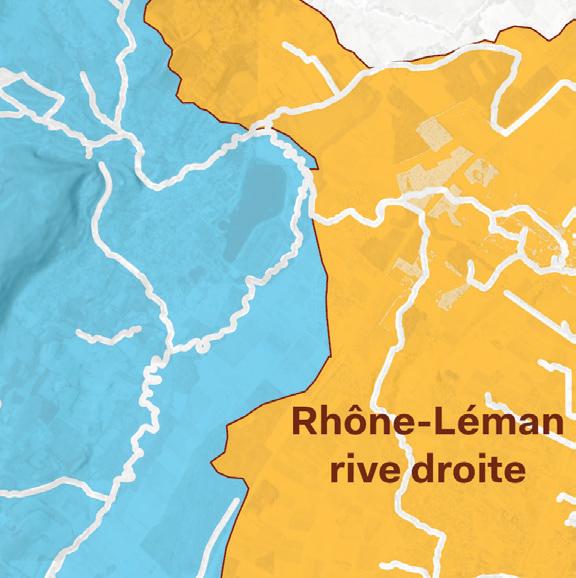
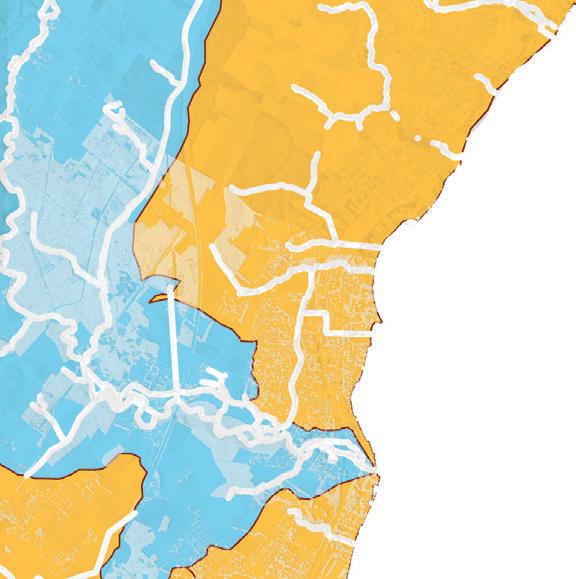
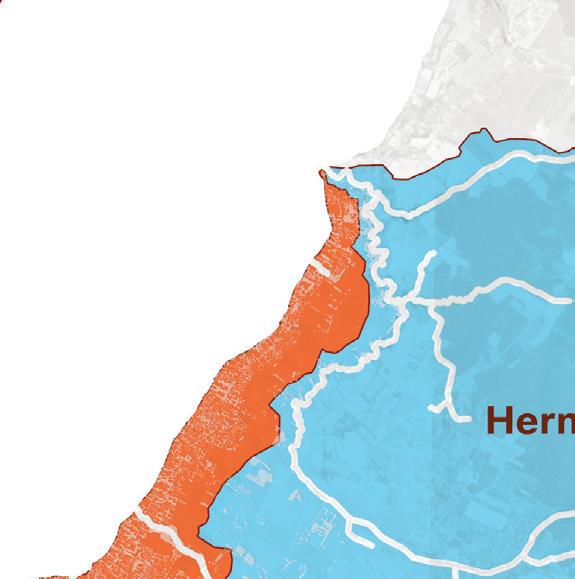
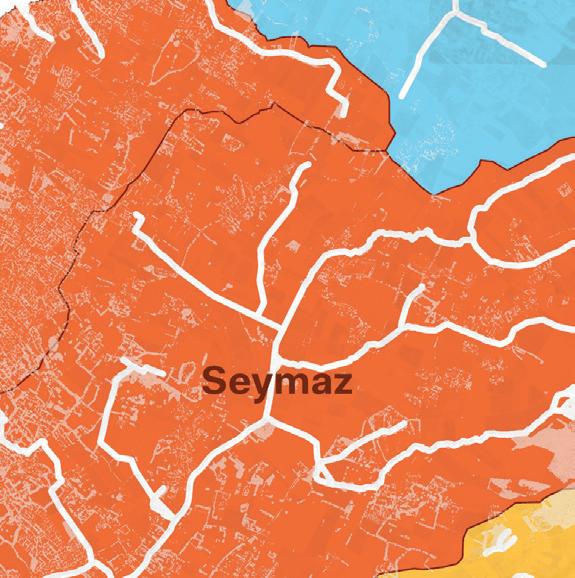
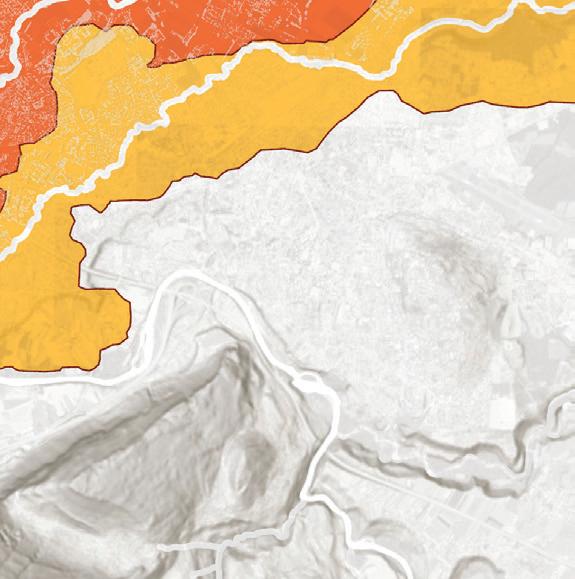


To the South of the city of Geneva, the Aïre river flows through an agricultural valley on its passage from the mountains in France to the Arve river. Like many rivers with mountainous origins, the Aïre experienced highly variable seasonal flow rates. Significant deforestatio n along the mountainous slopes in the mid19th century exacerbated this variability and associated flood risks. Following a series of floods in the late 19th century, plans were made the canalize the river’s marshy plain and gravel bed.
Over the next century, several efforts transformed the meandering river into a series of open and buried canals. Despite the original intent, this did not stop flooding, with significant flooding occurring as recently as 2002. Development along the channelized river, including motorways with direct drainage, and agricultural uses severely compromised water quality, leading to public outcry. In 1995, politician Claude Haegi launched the “10 ans pour sauver nos rivières” campaign. This led to renaturalization being established as a goal of cantonal water law, created a fund for restoration projects, and guided the development of action reports for the 14 rivers within the canton’s jurisdiction.
In 2001, a competition to restore the channelized Aïre was award to landscape architecture firm Superpositions. Construction was split into four phases, with Phase 2 (20092011) and Phase 3 (2012-2015) included in this analysis. Phase 4, nearest to the French border, is ongoing.
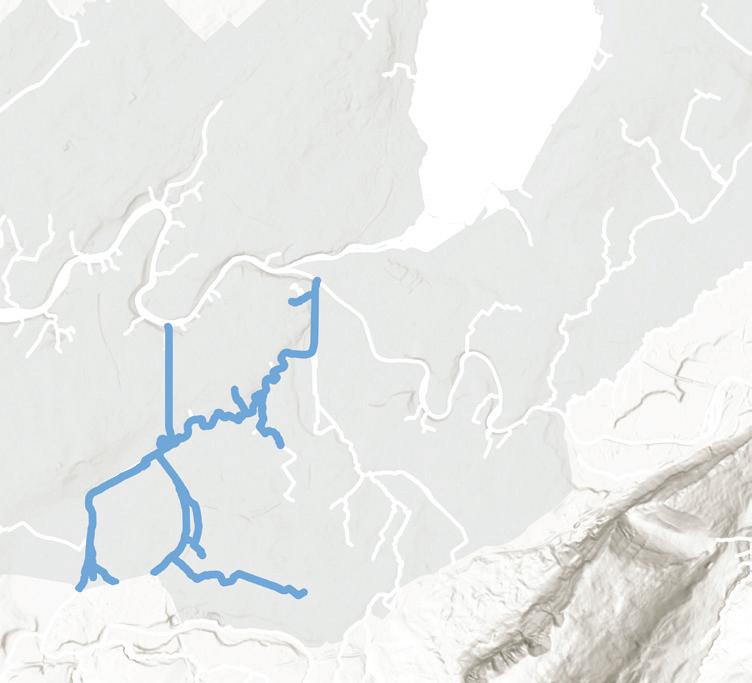
https://www.asconfignon.ch/vallon-de-l-aire/renaturation-de-l-aire
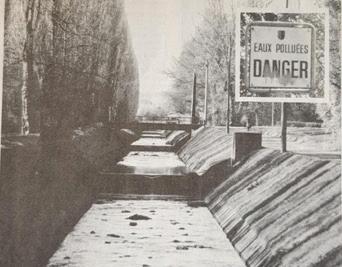











Canopy coverage and change
The 30m aquatic buffer aligns closely with the footprint of the renaturalization project. The restoration effort has already seen significant canopy gains 10 years postconstruction. While its coverage remains lower than the canton-wide riparian area, this is possibly because of the young age of the trees.
29% of the area is covered by canopy 43% of the canton’s aquatic buffer is covered by canopy 20% of the canton is covered by canopy
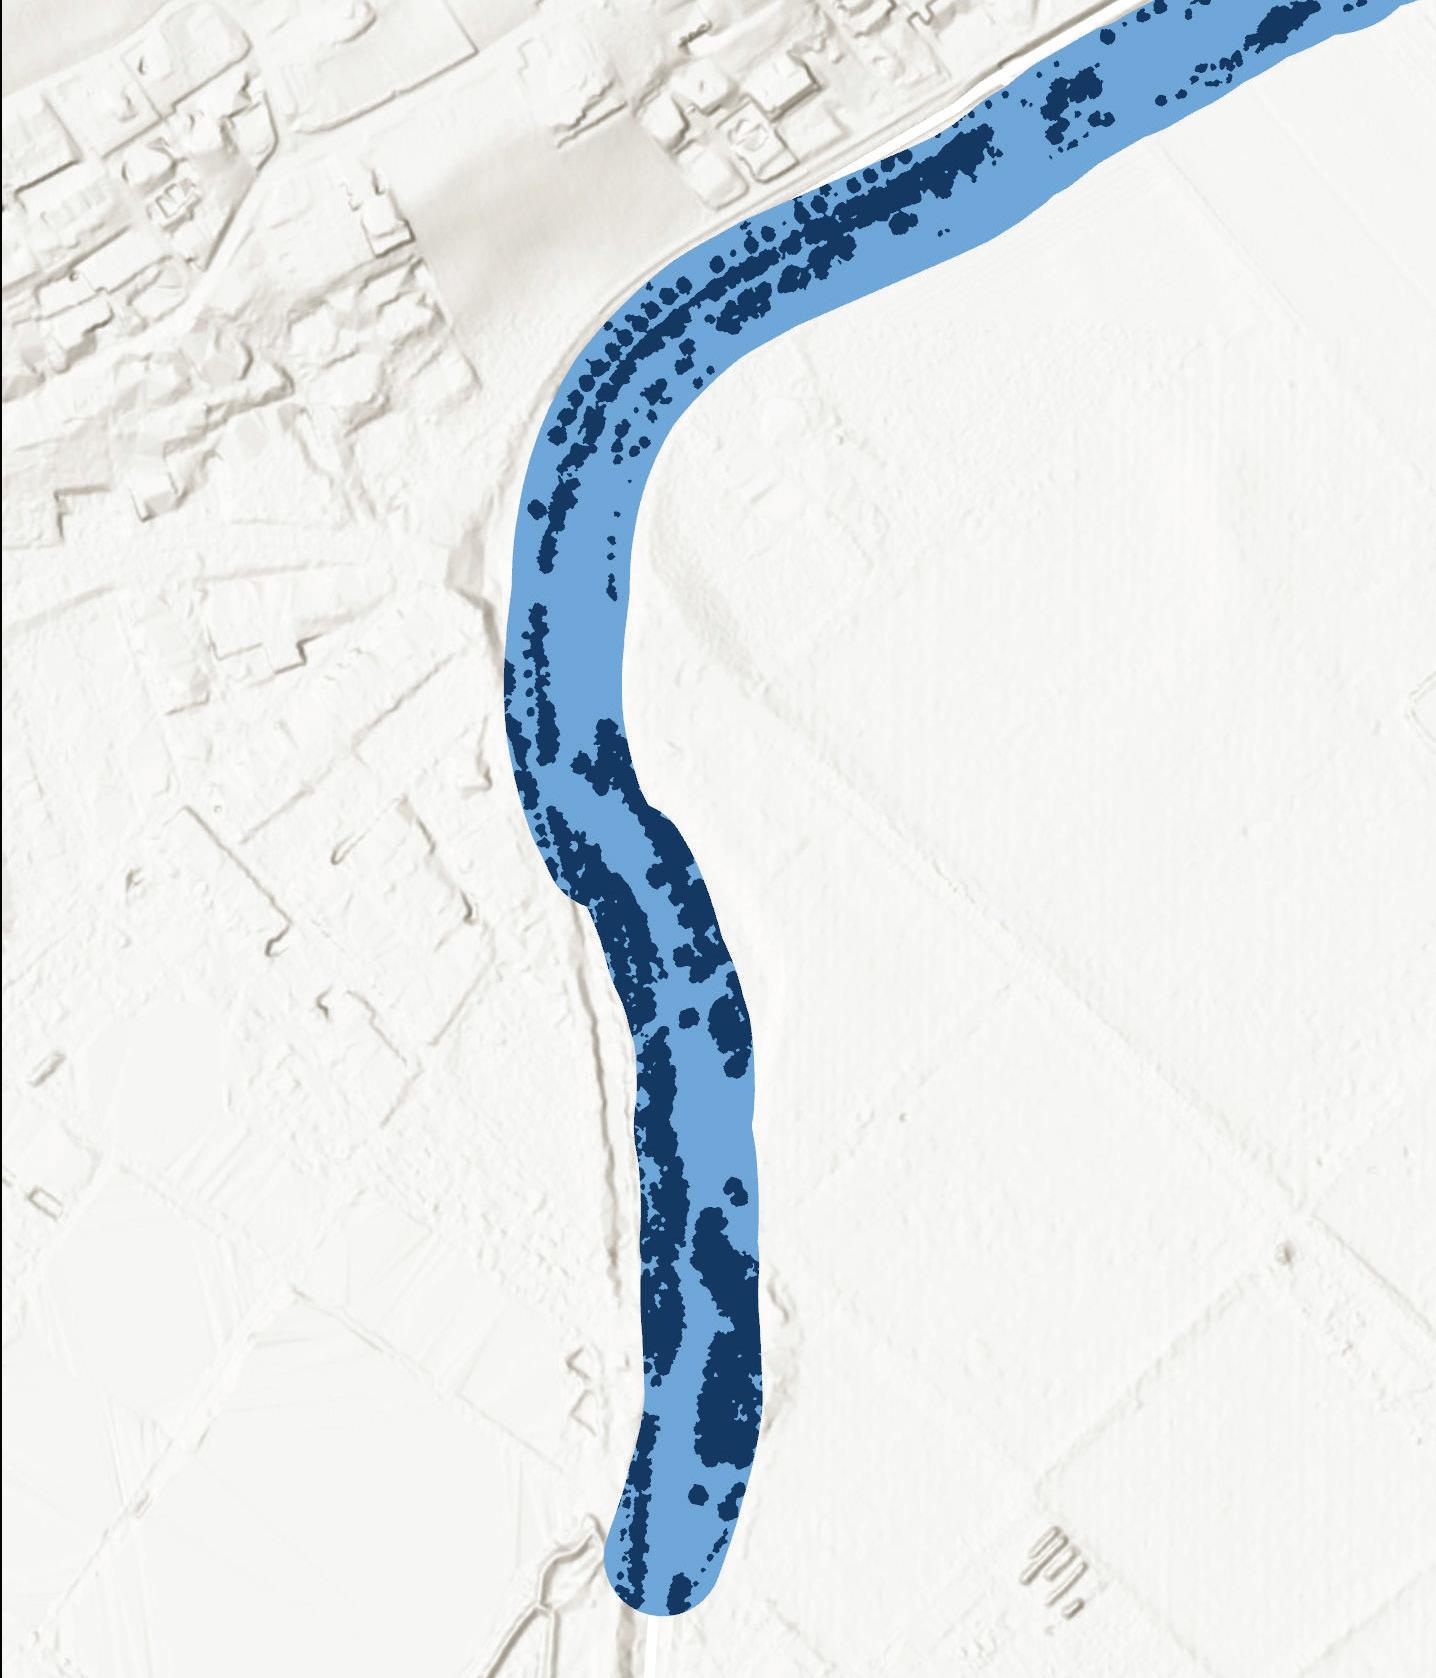
“Modèle Numérique De Surface De Canopée - État 2023” (SIPV_ICA_ MNC_2023). SITG.
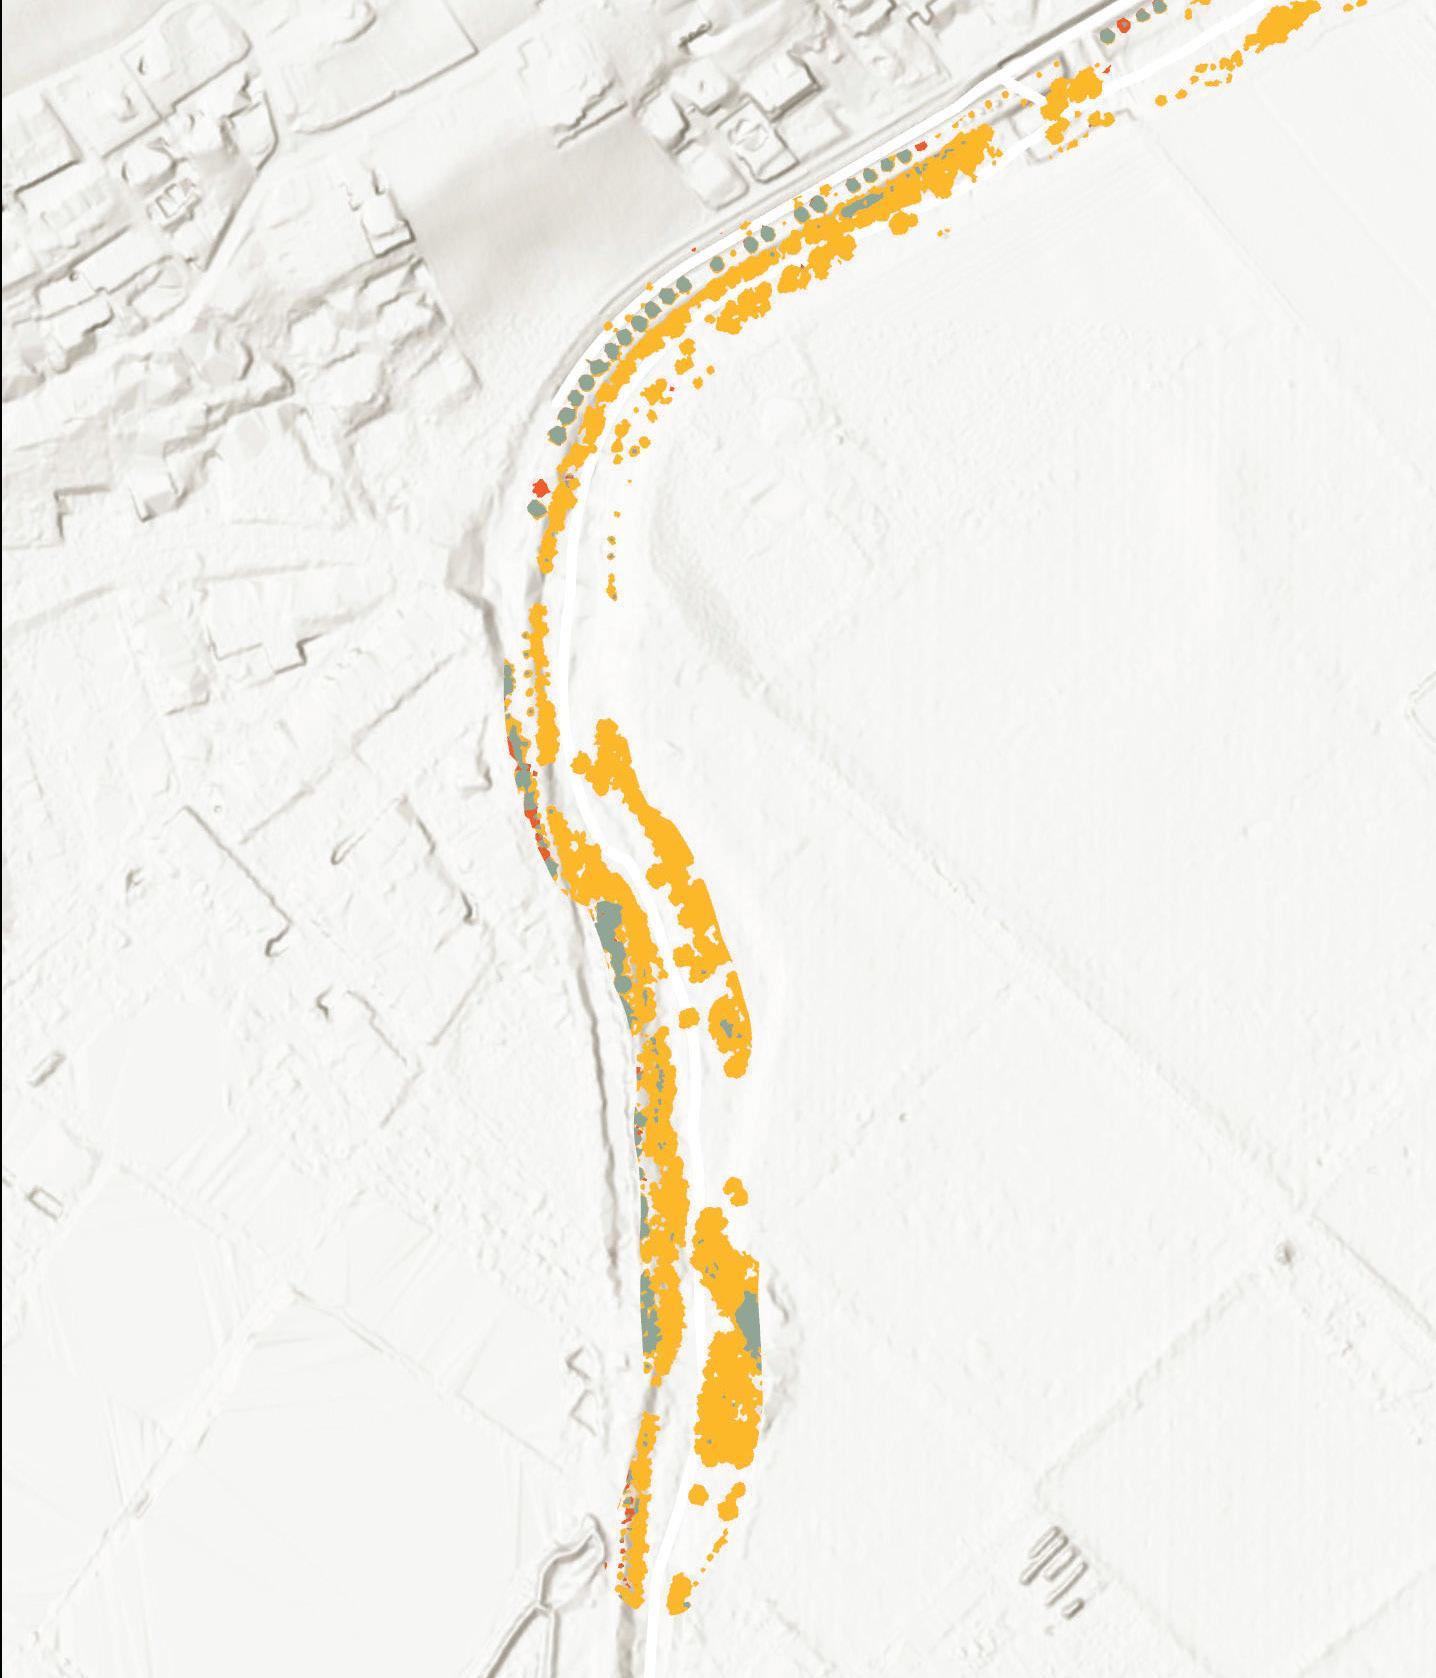
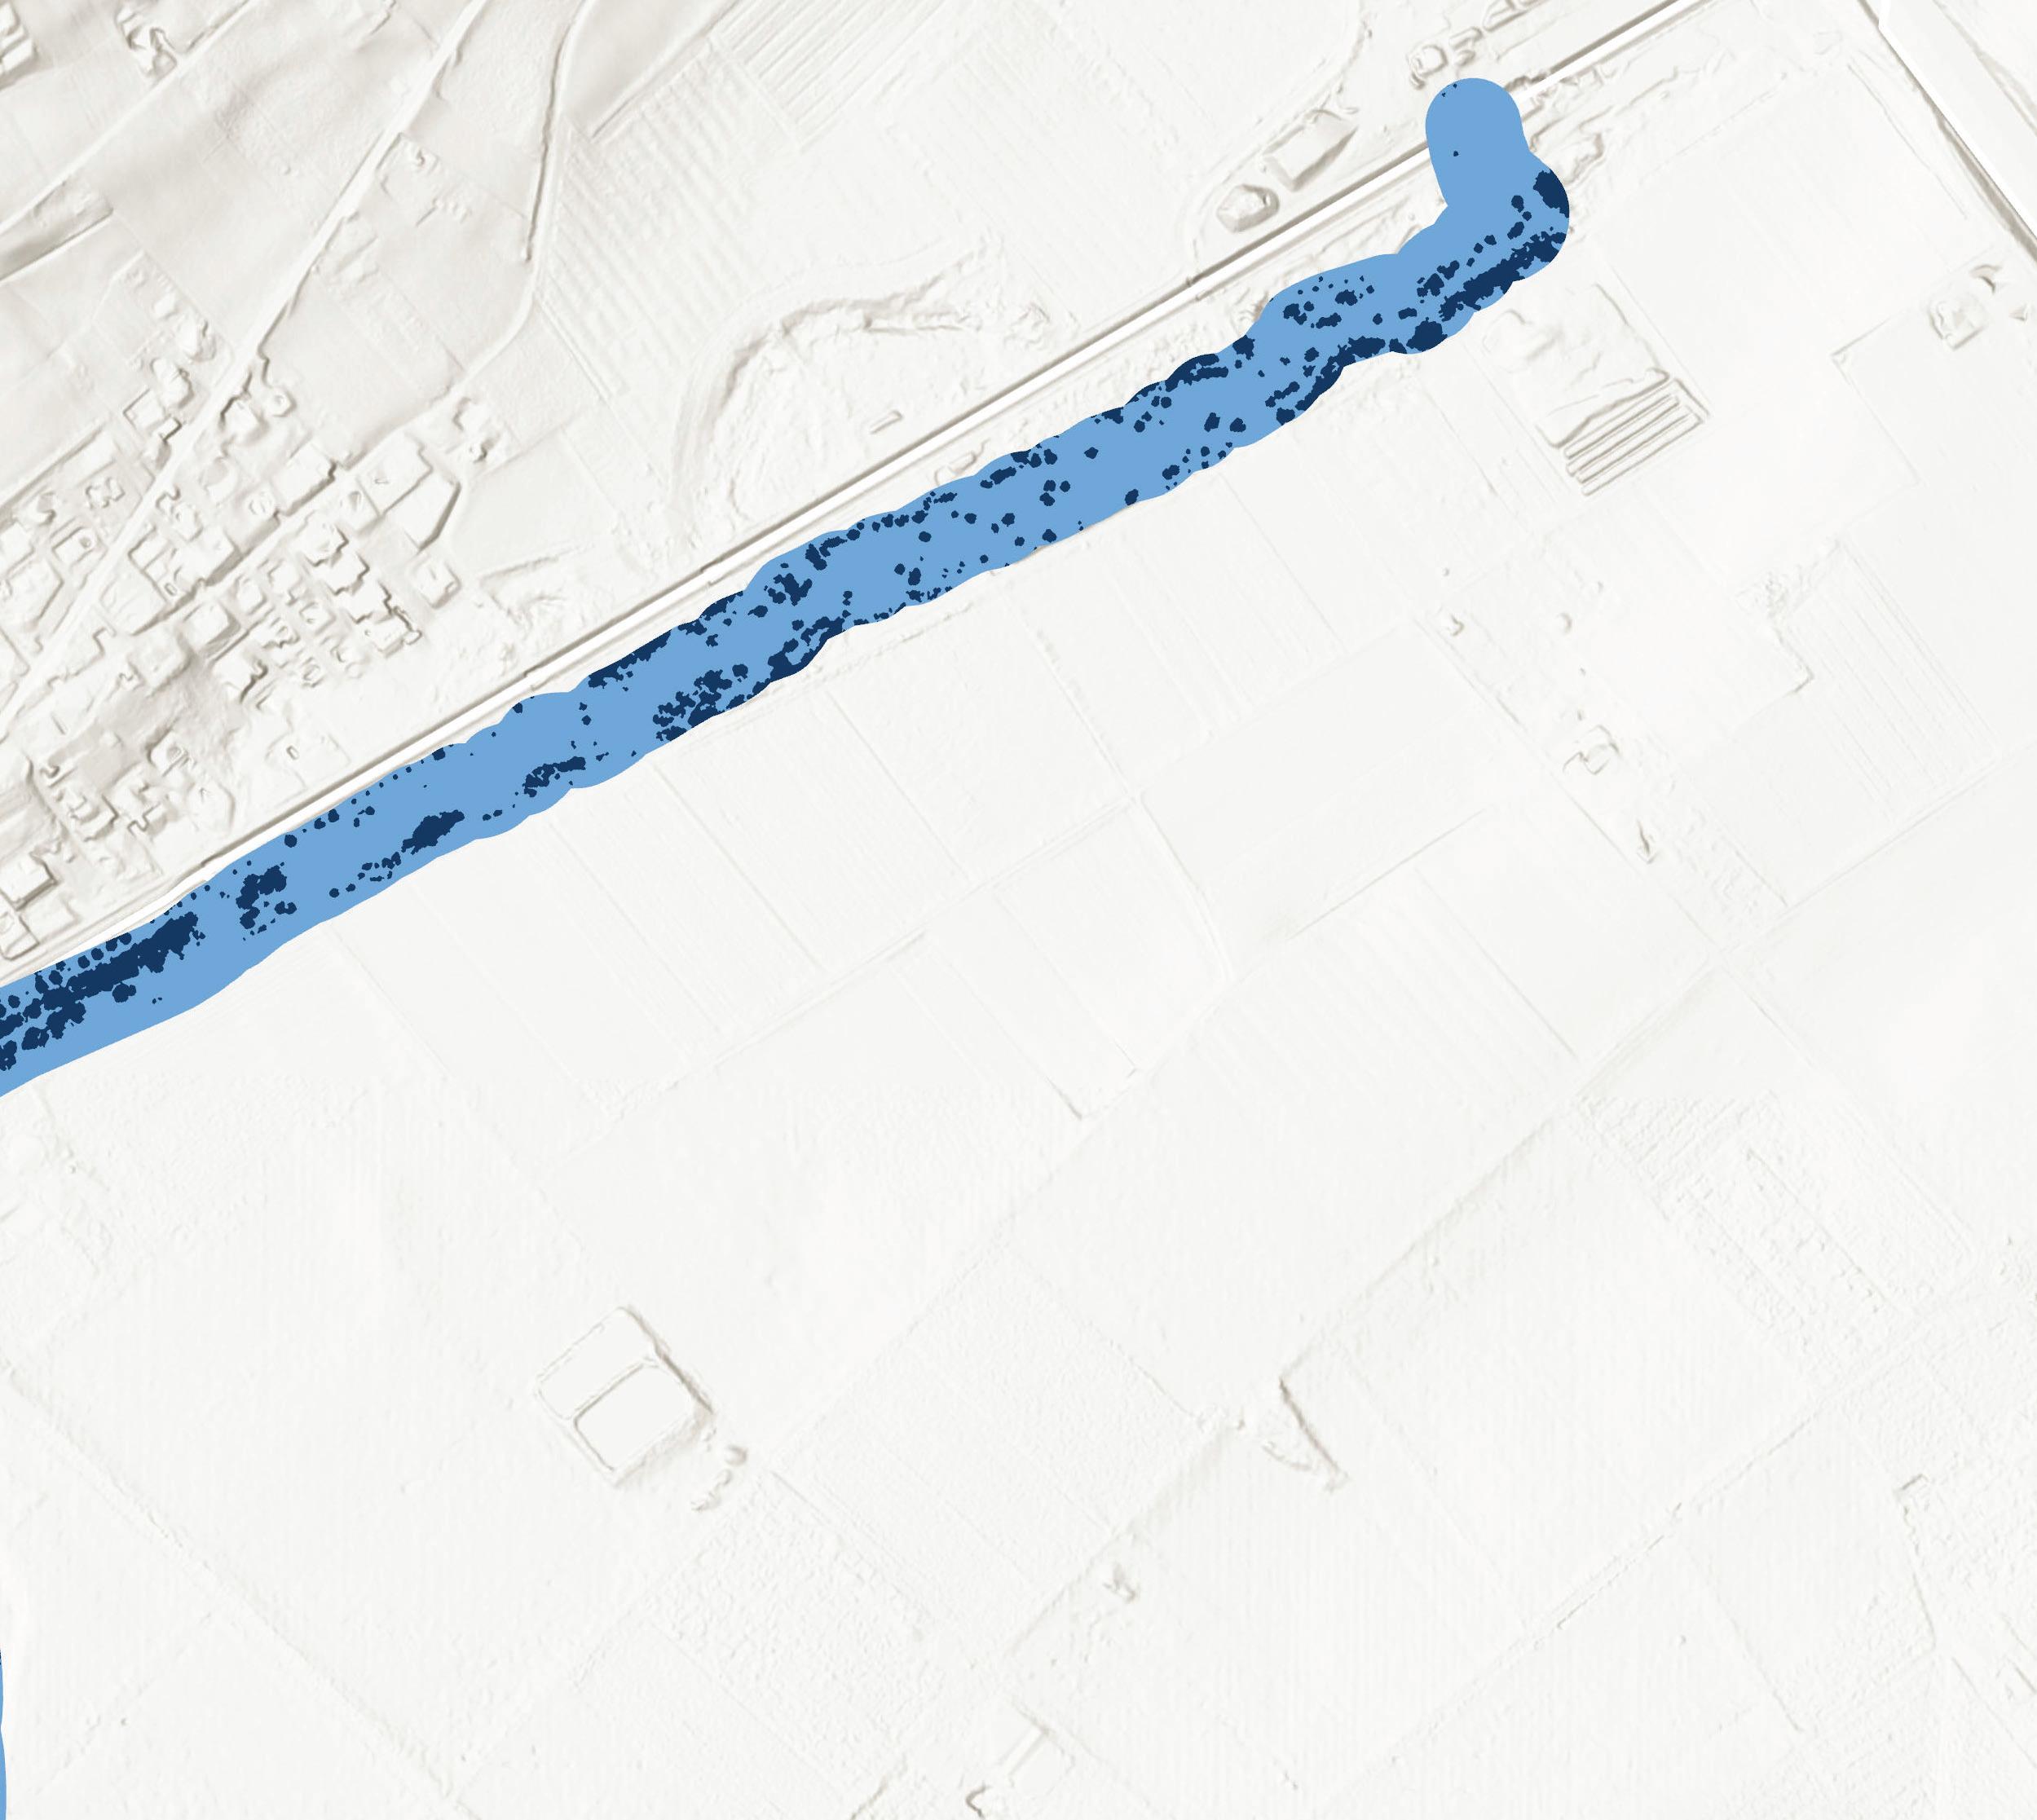
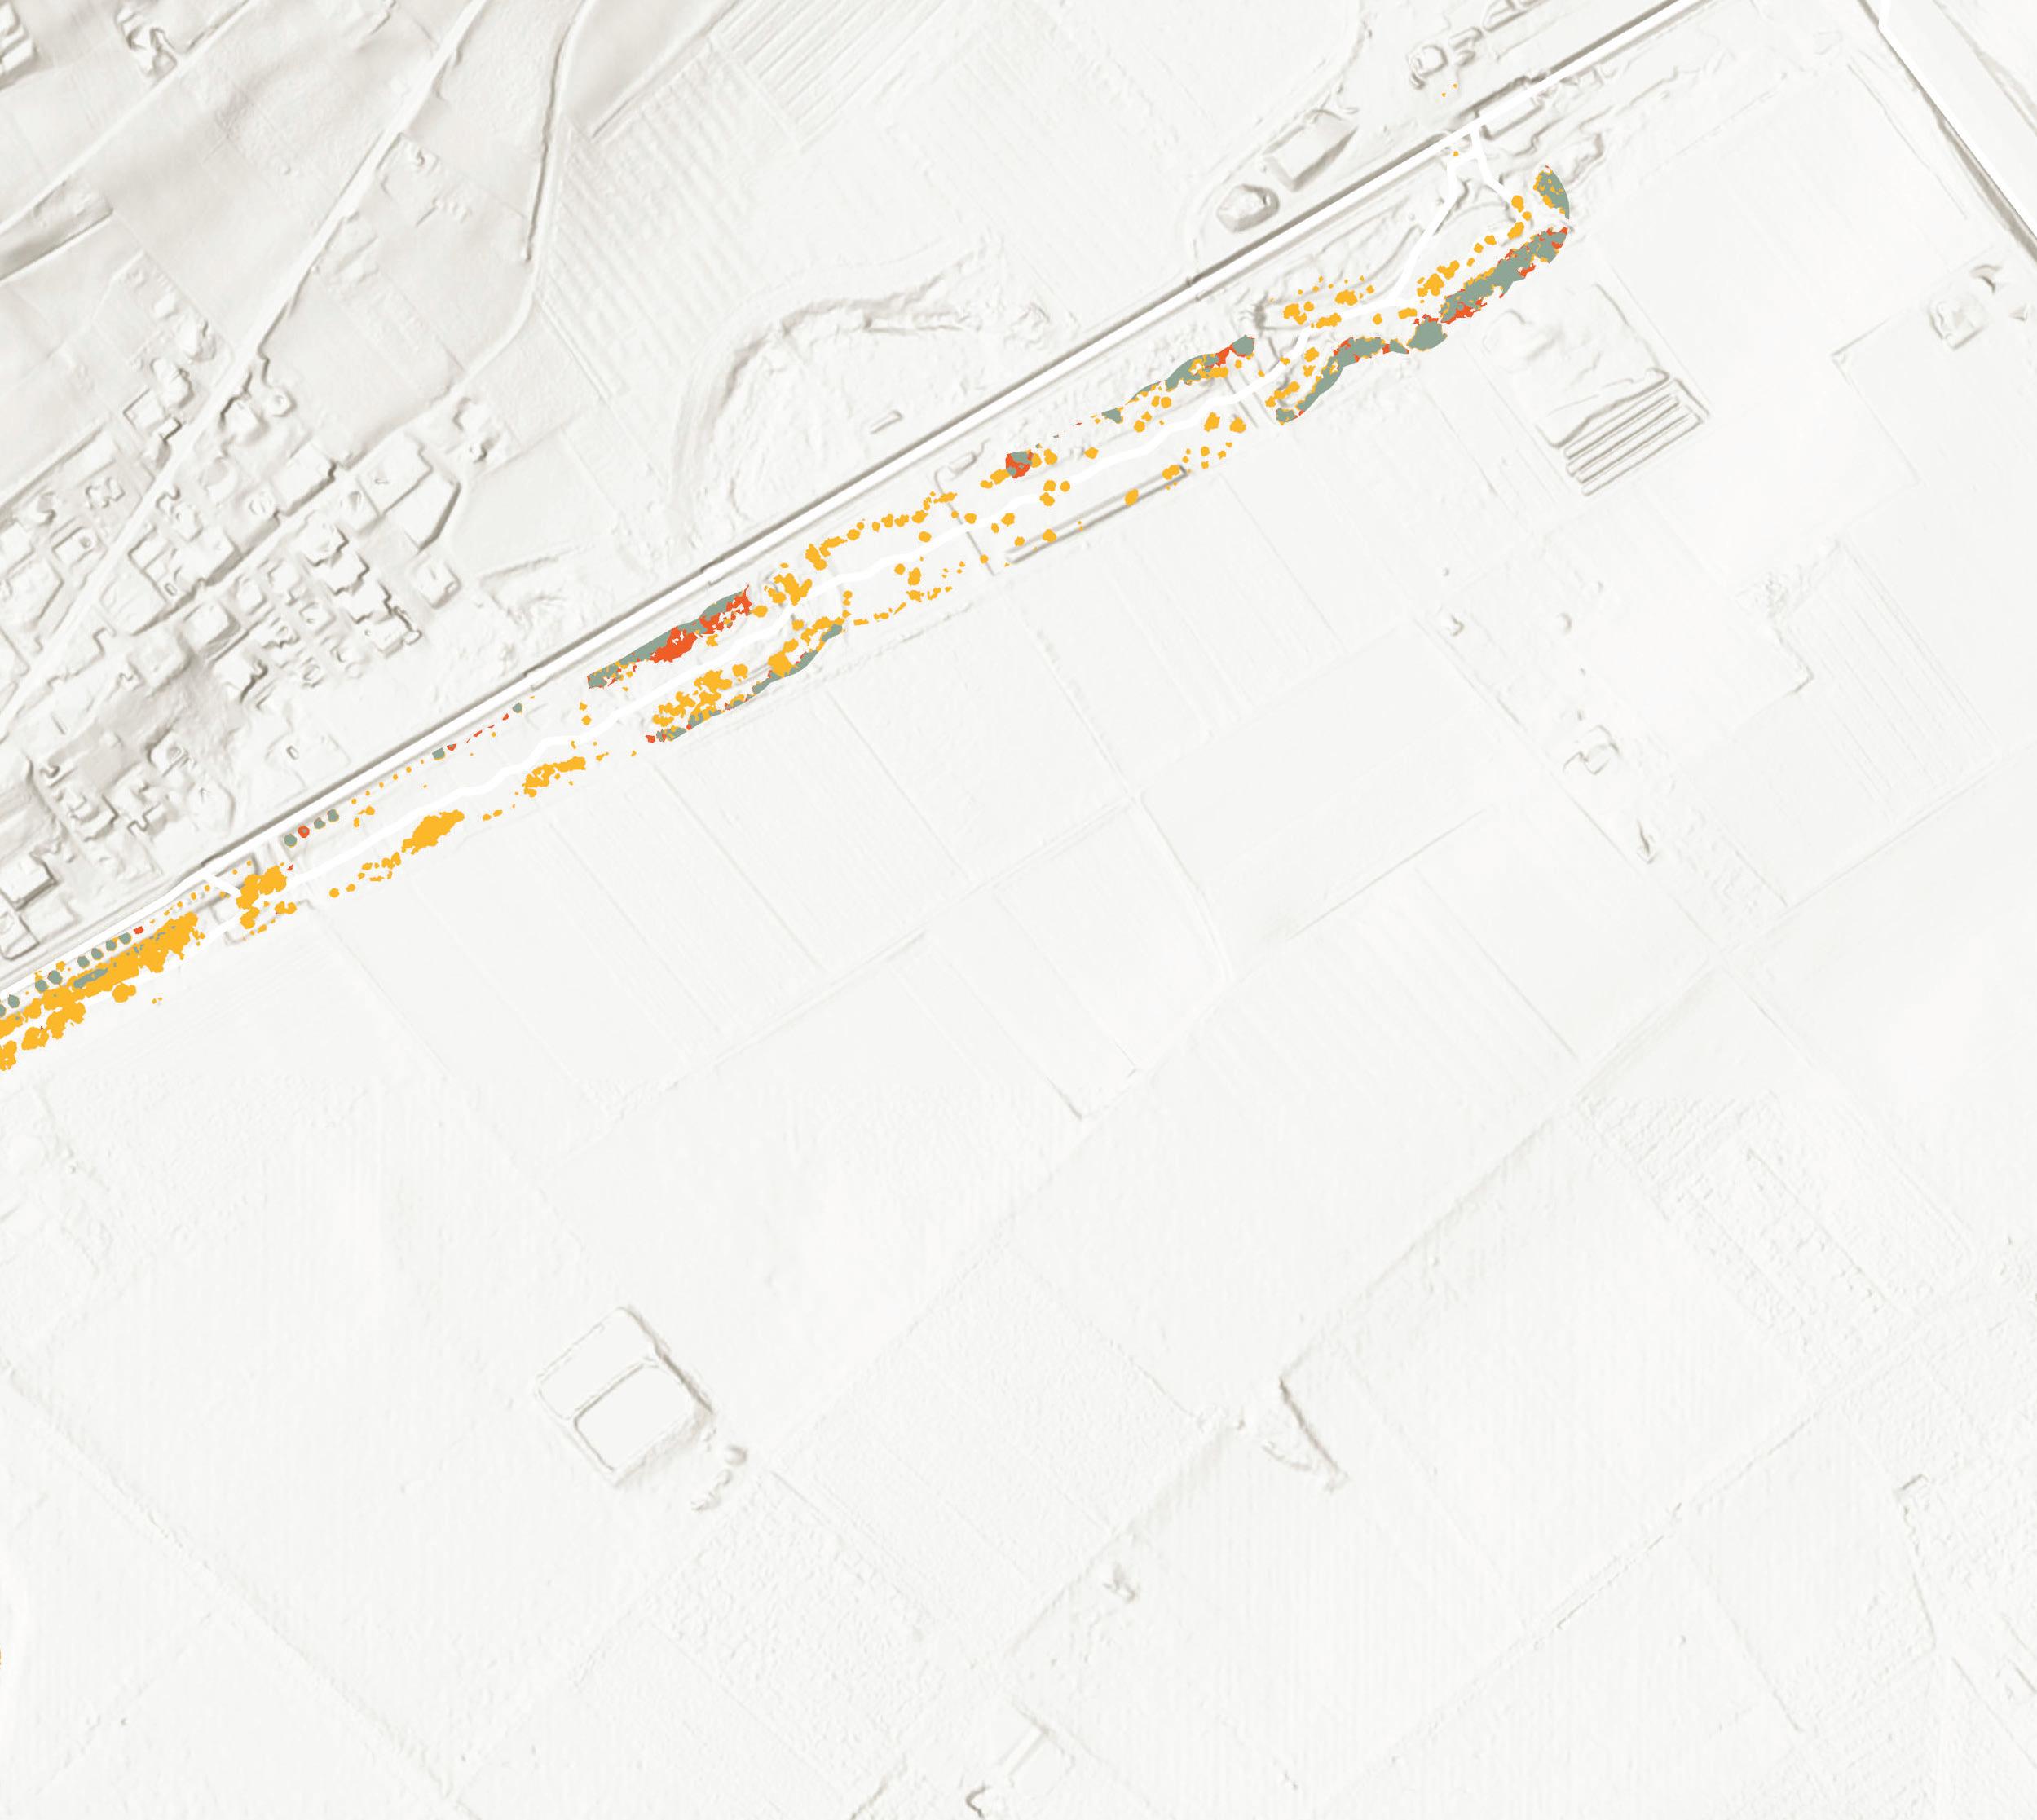
Recommendations
01
Integrate canopy targets in renaturalization efforts
If two-thirds of the remaining buried, channelized, or heavily modified streams in the canton were restored with 50% canopy, the canopy cover of the aquatic buffer across the canton would increase from 43% to 47%.
02
Expand environmental protections in the aquatic buffer
Despite the improvements along the Aïre, it benefits from no official environmental protections. A 2024 Motion (M 2682B) to the Grand Council of Geneva, the canton’s legislature, has called for the formation of a protection plan for the river in recognition of its recent improvements. This speaks to the impact large landscape architecture projects can have in influencing legislation.
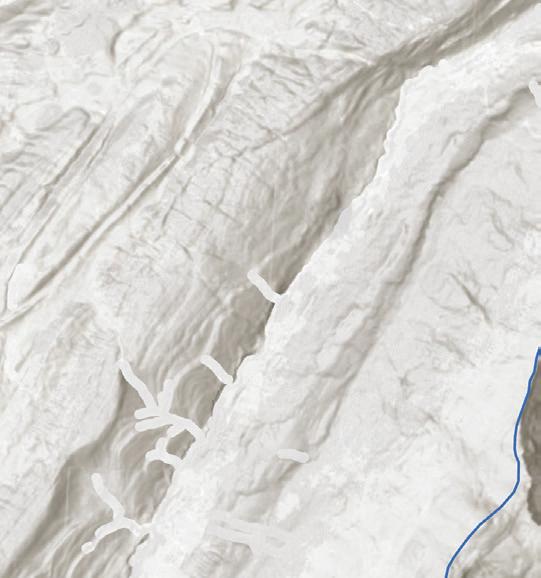

“Ecomorphologie des cours d’eau” (LCE_GRAPHE_EAU_ECOMORPHOLOGIE). SITG.
“Bassins Versants Principaux” (LCE_BV_PRINCIPAUX). SITG.



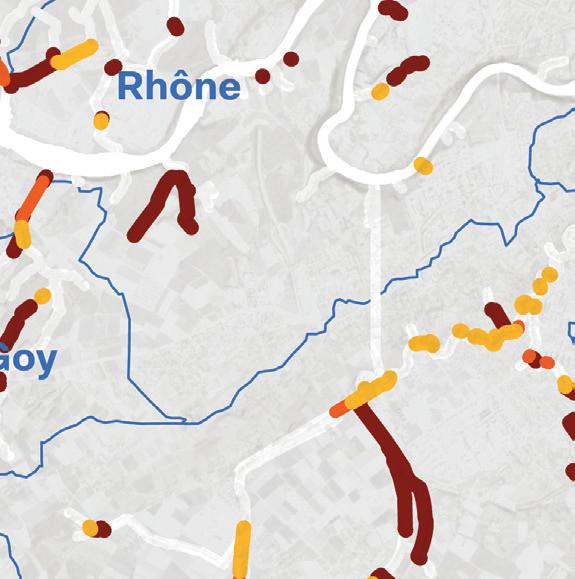
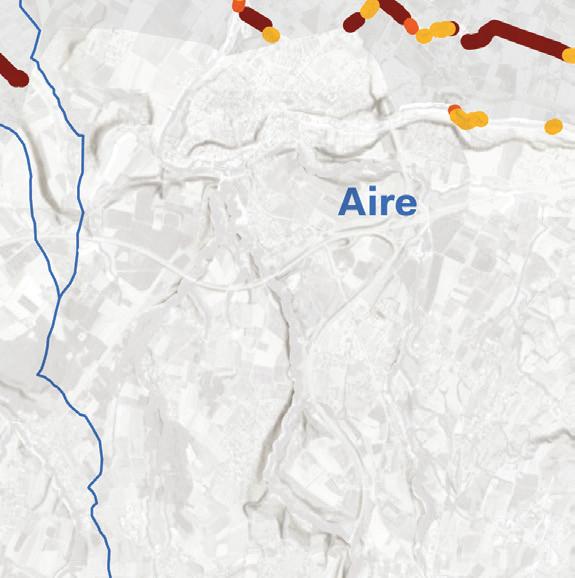
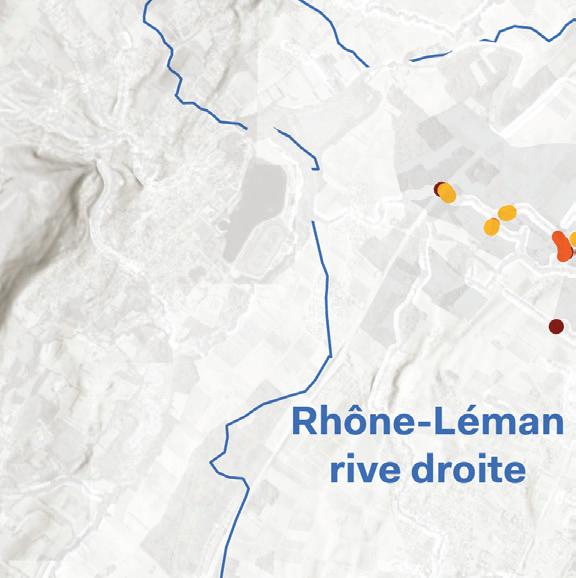
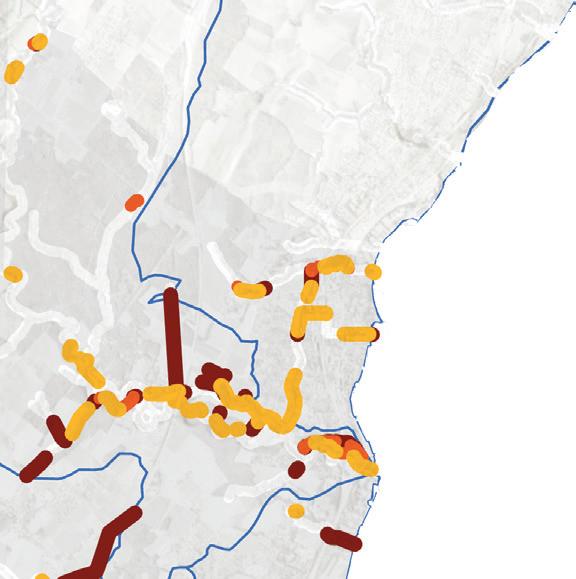
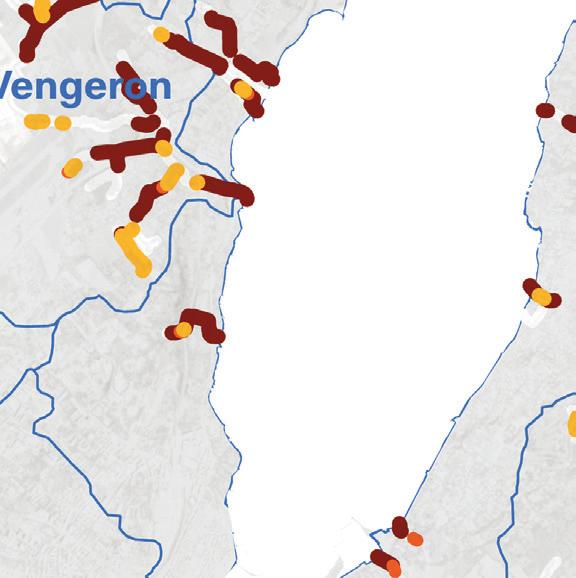
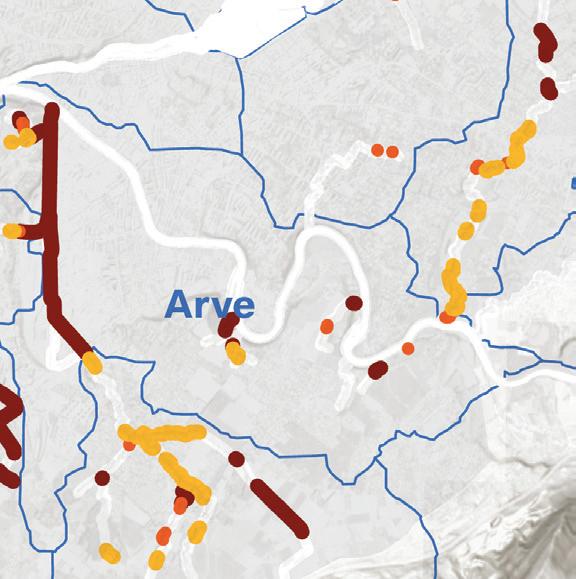
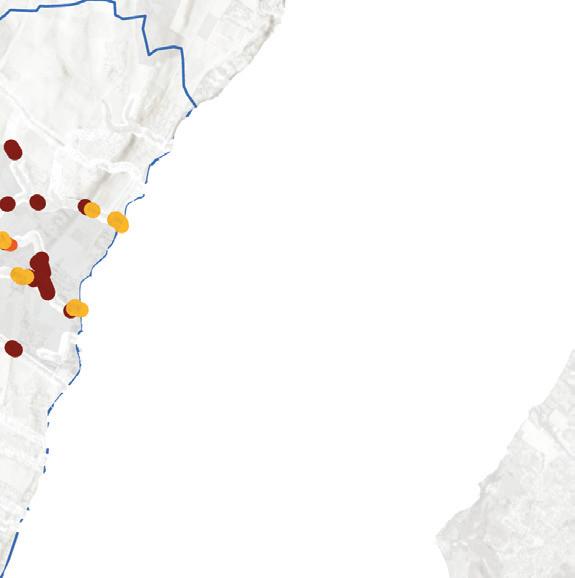
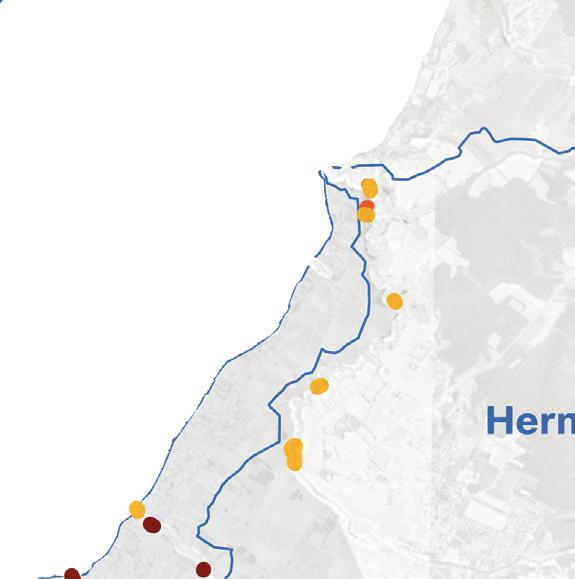
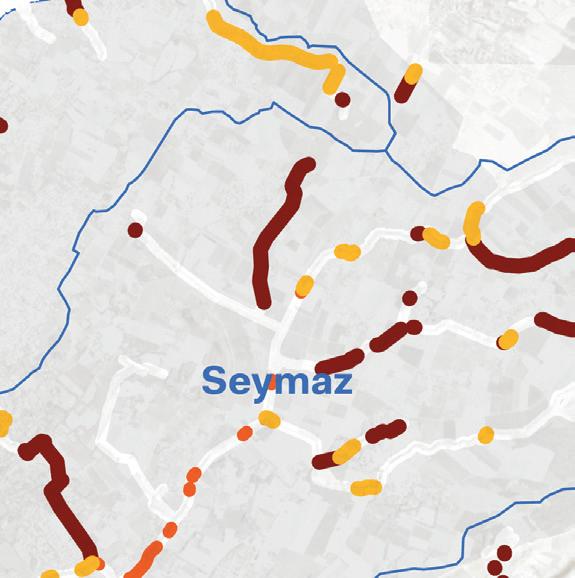



Urban forests are not evenly distributed nor should they be. Concentrated higher proportions of canopy in areas of ecological or social significance enhance the impact of the urban forest on the experience and environmental performance of the city and canton. Aquatic buffers provide a lens through which to enact this. Even within the buffer, understanding difference is critical and solutions that respond to varying physical conditions, ownership types, and uses is critical to effective planning. The case studies were critical to developing these understandings that determining where opportunities for interventions exist.
The following series of findings and recommendations are associated with these geographies and provide a framework for prioritization of efforts.
The aquatic buffer hosts a disproportionate amount of Geneva’s urban forest.
In the city, 16% of the land hosts 20% of the total canopy. Across the canton, 13% of the land hosts 20% of the canopy.
The aquatic buffer should be planned with a higher canopy coverage target. This reflects its already higher canopy coverage, its potential for ecological impact, relationship to public space, and relatively high proportion of plantable area.
In the city, a 40-50% coverage target could significantly enhance public experience of the waterfront and ecological performance.
Across the canton, a 50-60% coverage target could improve ongoing renaturalization efforts.
Canopy is unevenly distributed within the aquatic buffer, even in public space. The case study approach reveals inequities and opportunities for intervention at an actionable scale.
Recommendation
Site-based interventions on publiclyowned land should conceptualize the buffers as active public spaces. Buffers should go beyond their provision of ecosystem services to provide Genevans opportunities to access their waters and forests. Two proposed programs could guide capital interventions on public space.
Consider the Quais
Geneva’s quais define much of its city-center waterfront. However, they are dominated by hardened edges and paved areas, experience canopy coverage as low as 7%, and in many instances are experiencing persistent canopy loss.
I propose to develop a program to conceptualize the quais as a contiguous public waterfront space with increased canopy, opportunities for shoreline naturalization, and multi-story planting. Increasing canopy cover of the quais by 10% could increase the city-wide aquatic buffer by 4.7%.
Waterfront parks
Geneva’s three large waterfront parks should be considered for their ecological value in the aquatic zone in addition to their social and recreational uses. An initiative to redesign the parks to enhance ecological performance in the aquatic zone could also enhance resident’s access to water. Increasing canopy cover of the parks aquatic buffer by 15% could increase the city-wide buffer by 6%.
In targeting just the quais and the three largest waterfront parks, city-wide aquatic buffer coverage could be increased from 28% to 38.7%.
03 - Canton
Finding
The aquatic buffer is mostly on privatelyowned land.
Recommendation
Policy precedes projects. Environmental protections should be expanded in the aquatic buffer across the canton Precedents such as Toronto’s Ravine By-Laws could help conceptualize the buffers not just by their depth but by their length and connectivity as part of living systems. Efforts such as Motion 2682B to protect the Aïre in the cantonal legislature should be supported and expanded to enhance and preserve the buffer beyond capital projects and across private land.
04 - Canton
Finding
Canopy coverage of stream renaturalization projects is significantly improved but is still less than canton-wide coverage. The enormous success of the “10 ans pour sauver nos rivières” initiative can be enhanced with targets for enhanced canopy. This can enhance their provision of habitat, control stream temperatures and light levels, attenuate flooding and further limit pollutant and sediment inflows in runoff.
Recommendation
Integrate canopy cover targets in ongoing stream renaturalization efforts. If two-thirds of the remaining buried, channelized, or heavily modified streams in the canton were restored with 50% canopy, the canopy cover of the aquatic buffer across the canton would increase from 43% to 47%.
Office cantonal de l’eau (OCEau). Renaturation des rivières genevoises, bilan de 10 ans d’actions : 1998–2008. Genève: Département du territoire, République et canton de Genève, 2018. https:// www.ge.ch/document/eau-renaturation-rivieres-genevoises-bilan-10-ans-actions-1998-2008.
National Centre for Climate Services. “Geneva.” Last modified July 1, 2024. https://www.nccs.admin.ch/nccs/en/home/regions/ kantone/genf.html.
Maximillian Merrill, “Riparian Buffers: The Lack of Buffer Protection Policies and Recommendations to Expand Protection,” Journal of Environmental Law and Litigation, Vol. 30, 65: 66-68.
Graziano, Michael P., Amanda K. Deguire, and Thilina D. Surasinghe. 2022. “Riparian Buffers as a Critical Landscape Feature: Insights for Riverscape Conservation and Policy Renovations” Diversity 14, no. 3: 172. https://doi.org/10.3390/d14030172
Office cantonal de l’eau (OCEau). Renaturation des rivières genevoises, bilan de 10 ans d’actions : 1998–2008.
Portail cartographique de l’État de Genève. 2025. “Portail cartographique de l’État de Genève.” ArcGIS StoryMaps. Accessed May 10, 2025. https://app2.ge.ch/tergeoportal/apps/storymaps/ stories/c46b45ad8f5144af883ebc3468c471e0.
The Convention on Wetlands. 2025. “Wetlands of International Importance.” Ramsar.org. Accessed May 10, 2025. https://www.ramsar.org/about/our-mission/wetlands-international-importance.
European Commission. 2025. “Water Framework Directive.” Environment. Accessed May 10, 2025. https://environment.ec.europa. eu/topics/water/water-framework-directive_en.
Stieger, M., Mckenzie, P. Riparian Landscape Change: A Spatial Approach for Quantifying Change and Development of a River Network Restoration Model. Environmental Management 74, 853–869 (2024). https://doi.org/10.1007/s00267-024-02025-w
James M. McElfish et al., « Setting Buffer Sizes for Wetlands,” National Wetlands Newsletter, Vol. 30, 2 (2008), 6-8.
McElfish et al., « Setting Buffer Sizes for Wetlands.”
Office cantonal de l’eau (OCEau). Renaturation des rivières genevoises, bilan de 10 ans d’actions : 1998–2008.
Association pour la Sauvegarde de Confignon (ASC). n.d. “Renaturation de l’Aire.” Accessed May 12, 2025. https://www.asconfignon. ch/vallon-de-l-aire/renaturation-de-l-aire.
Landezine. 2016. “Renaturation of the River Aire, Geneva.” Last modified August 2016. https://landezine.com/renaturation-of-the-river-aire-geneva/.
Grand Conseil de la République et canton de Genève. 2024. M 2682B - De l’Aire, moins de pollution dans nos rivières genevoises ! Pour garantir une quantité et une qualité d’eau suffisante à l’Aire. October 30, 2024. Accessed May 12, 2025. https://ge.ch/grandconseil/ data/texte/M02682B.pdf.
Système d’information du territoire à Genève (SITG):
“Bassins Versants Principaux” (LCE_BV_PRINCIPAUX).
“Couverture du sol selon classification OTEMO” (CAD_CARTE_ OTEMO).
“Ecomorphologie des cours d’eau” (LCE_GRAPHE_EAU_ECOMORPHOLOGIE).
“Emprise du Lac Leman (Complet)” (GEO_LAC_LEMAN).
“Equipements et espaces publiques” (OBS_EQUIPEMENTS_ESPACES_PUB).
“Graphe hydrographique transfrontalier”(AGGLO_RTGE_RESEAU_HYDRO).
“Milieux proteges” (AGGLO_NAT_MILIEUX_PROTEGES). SITG
“Modèle Numérique De Surface De Canopée - État 2023” (SIPV_ ICA_MNC_2023).
“Parcelles de la mensuration” (CAD_PARCELLE_MENSU).
“Secteurs de protection des eaux” (GOL_SECTEURS_PROTECT_EAUX).
Strengthening the Connectivity of Geneva’s Urban Forest through Easement Zones

Emma Tracy
Master in Landscape Architecture (MLA) Candidate
Harvard Graduate
School of Design
This analysis explores the potential of land easements as plantable spaces and poses the question: Can planting and passage easements serve as new plantable areas to help strengthen the connectivity of Geneva’s urban forest? Land easements encompass a unique category of land that is privately owned but publicly accessible. This implies that these spaces could serve the public to accommodate the urban canopy.
This analysis will focus on passage easements and planting and fencing easements. According to SITG, land easements “oblige the owner of the encumbered land to tolerate certain acts or to refrain from certain acts.” Passage easements are also known as ‘right-of-way’ easements and typically mean that they must be kept clear for access. Planting easements are spaces dedicated specifically to planting and must not be built or paved over.
Passage easements and planting and fencing easements represent fragmented land that could act as crucial links to support biodiversity and habitat connectivity for non-human actors across Geneva’s urban area. In “Yards increase forest connectivity in urban landscapes,” the authors address the potential of private yards to strengthen Boston’s urban forest. They argue that “High canopy cover is associated with greater arthropod species richness and abundance in cities across Switzerland.”1 This analysis aims to catalog where these easements exist, how they link to larger open spaces across the city, and how they can serve as connecting elements to strengthen the existing urban canopy across Geneva.
This analysis primarily used the ‘Servitudes registre foncier (surface)’ layer to determine where potential plantable easements exist across Geneva. This layer includes twelve types of easements including: Pipelines, Land Charges, Construction, Miscellaneous, Neighborhood Rights, Exploitation, Multi Types, Passage, Planting and Fencing, Neighborhood Regulations, and Usage. This analysis was performed using only the Passage Easements and the Planting and Fencing Easements (*NOTE: Other easement types that could be valuable to analyze include Neighborhood Rights, Neighborhood Regulations and Miscellaneous easements, but because it is difficult to find information about intention, ownership, and regulation of these types of easements we will not analyze them in this report).
Other layers used include CAD_CARTE_ OTEMO to determine surface cover across easements studied, GEO_GIREC to outline the cantonal territory of Geneva, and CAD_ COMMUNE to outline different neighborhoods across Geneva, AGGLO_ZONE_AFF_ SIMPLIFIEE to understand land use in relation to easements. To understand existing canopy cover across Geneva, I used SIPV_ICE_ARBRE_ ISOLE to understand isolated tree locations, MNC_2013_2023_CHANGE to understand canopy loss and gain between 2013 and 2023, and SIPV_ICA_MNC_2023 to illustrate the most up-to-date condition of Geneva’s urban canopy cover.
New layers created derived from existing data include mapping the existing canopy, canopy loss and canopy gain between 2013 and 2023 over all passage easements as well as mapping the existing canopy, canopy loss and canopy gain between 2013 and 2023 over all planting and fencing easements. To determine potential plantable area within passage easements and planting and fencing easements, I have extracted each of these subcategories from
the ‘Servitudes registre foncier (surface)’ layer using ‘select by attribute’ and selecting both the Planting and Fencing Easement and the Passage Easement and turning them into their own respective layers. I think overlaid data from the CAD_CARTE_OTEMO layer to determine where existing impervious surface and buildings were within these easement zones and removed these to create two new layers that consisted of only ‘potential plantable’ area within the specified easement zones. To determine area for new canopy, I have extracted where the passage easements and planting and fencing easements exist and used the Clip tool to remove existing building footprints, existing canopy cover, and existing impervious surface across these polygons.
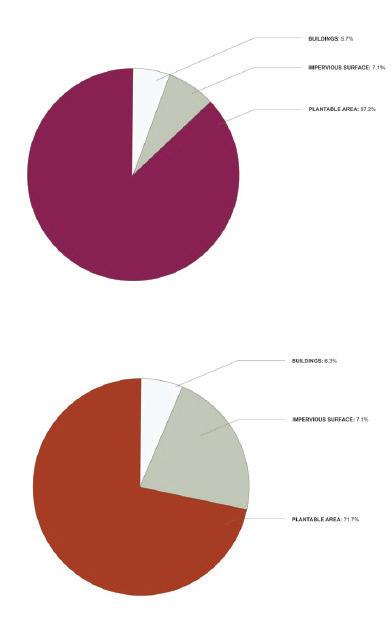
Planting Surface Easements
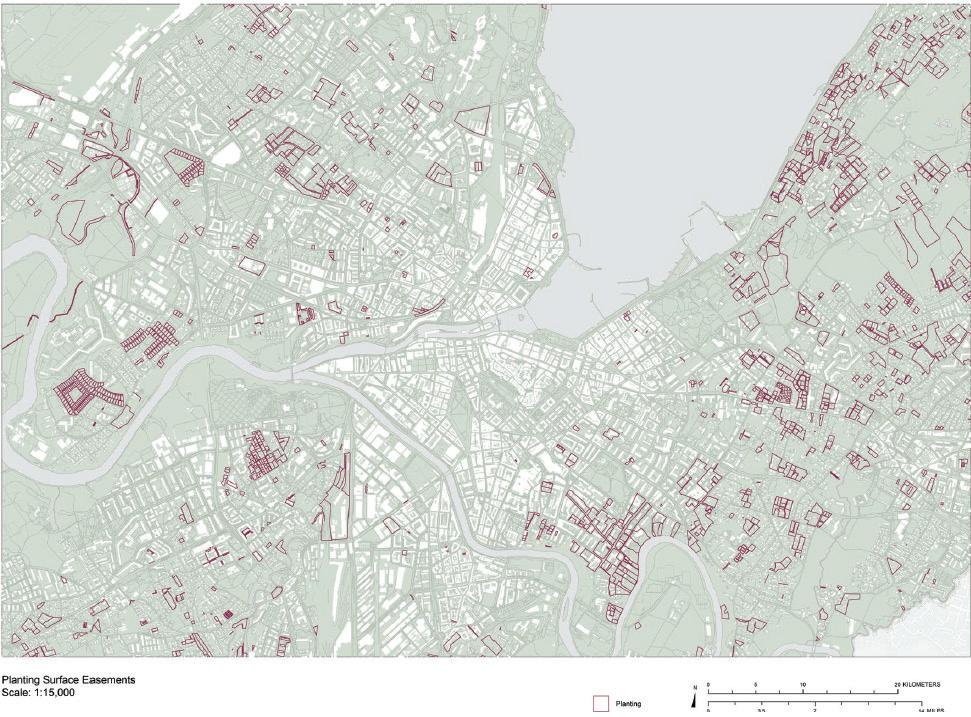
Passage Surface Easements
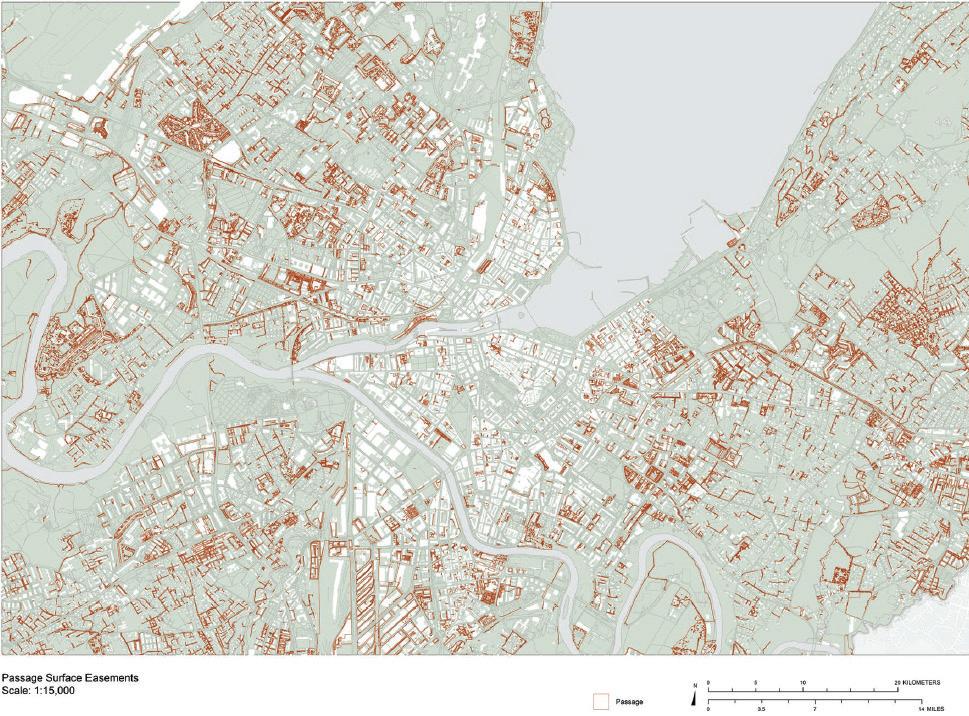
1. The potential plantable area across all planting and fencing easements and passage easements is 28.36 square kilometers or 11.53% of Geneva’s total land area.
“Potential plantable area” is defined as area that does not consist of existing built infrastructure or impervious surface. The total area cover of the passage easments and the planting and fencing easements is 36.1 square kilometers or 14.68% of Geneva’s land area. This means that 78.56% of these easements zones could be plantable area.
Easement zones represent a unique category of land cover because they are required by law to remain accessible and unbuilt. This analysis assumes passage easements must keep
impervious surfaces unobstructed but there is potential to plant new canopy over spaces where there is no existing infrastructure. Planting easements are easements dedicated to the purpose of planting – these areas indicate key areas where we could increase canopy with no push back or limitations.
One limitation is that all passage easements operate on a case-by-case basis so this requires further research and development into each of these individual spaces.
2. The existing canopy cover of the planting and fencing easements is only 18% and the existing canopy cover of passage easements is 16.5%.
The existing canopy cover of the passage easements is not surprising as these spaces are typically required to remain unobstructed. However, 71.72% of the land in passage easements does not contain built infrastructure or impervious surface which indicates that we could increase canopy cover to be more than 16.5% while still leaving critical passages unobstructed.
The canopy cover of planting easements being only 18% – slightly more than the canopy cover of the passage easements – is surprising. We can assume that these easements must primarily be used for ground or shrub planting rather than tree planting. Only 12.77% of these easement zones are built or impervious surface which leaves 87.23% of land open for planting.
3. There is 22.15 square kilometers of plantable area for new canopy (plantable area is determined as space within easements zones excluding existing canopy, building footprints, and impervious surfaces).
This calculation is based off of the previous calculation to determine potential plantable area across all specified easement zones and then removing existing canopy from that area to determine where how much space is left for new planting. 22.15 kilometers makes up about 9% of Geneva’s land area which could be a significant amount of increase in Geneva’s urban canopy cover.
This number does raise new questions about the existing condition of these easement zones. 69.2% of planting and fencing easements and 55.5% of passage easements is potential space for new planting meaning that this space neither contains existing canopy, built infrastructure, or impervious surface. This begs the question of what this space is currently being used for and are there other measures that will prevent us from using these spaces for planting?
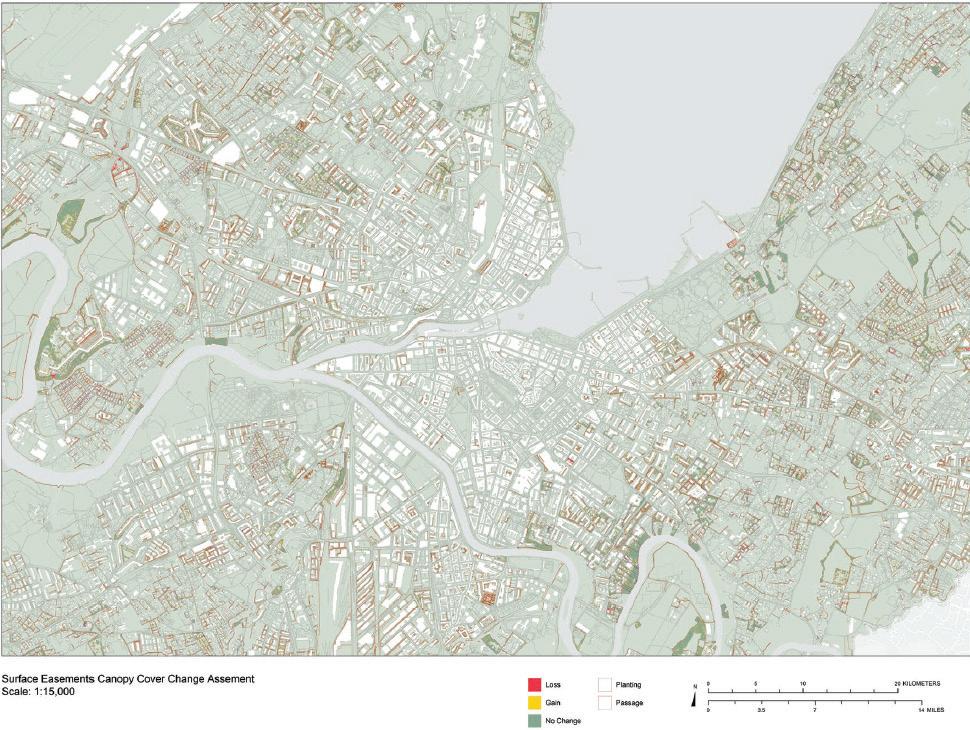
1. Propose a policy change which stipulates that planting and fencing easements and passage easements must be used to meet urban canopy targets on existing unbuilt land.
A potential canopy cover target over passage easements could be 27% which would still leave a significant amount of unbuilt land unobstructed while significantly increasing canopy cover over these spaces. A potential canopy cover target over planting and fencing easements could be 35% which would nearly double the amount of canopy over these spaces while still leaving space for open space, grass, ground and shrub planting.
2. Prioritize passage easements that function as connecting corridors between larger open spaces and canopy clusters.
Passage easements by nature tend to be more fragmented so it might be realistic to prioritize using passage easements with a minimum land area of 100 square kilometers or a minimum length of one kilometer.
3. Develop incentives for private landowners to plant and maintain new canopy cover over easement zones or develop a system which allows the city to maintain private canopy cover over easement zones.
Proposing new planting areas over privately owned property can have many difficulties due to the burden it places on the landowners. Alleviating this burden by accepting the costs and labor of maintenance will incentivize private landowners significantly to help reach urban canopy targets.
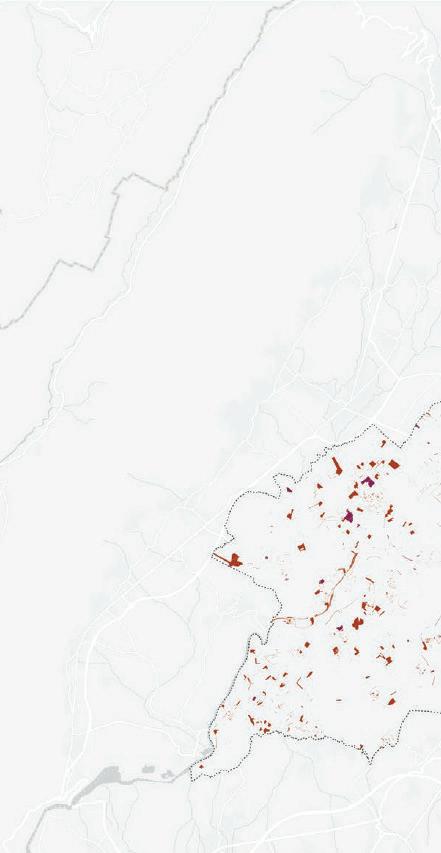

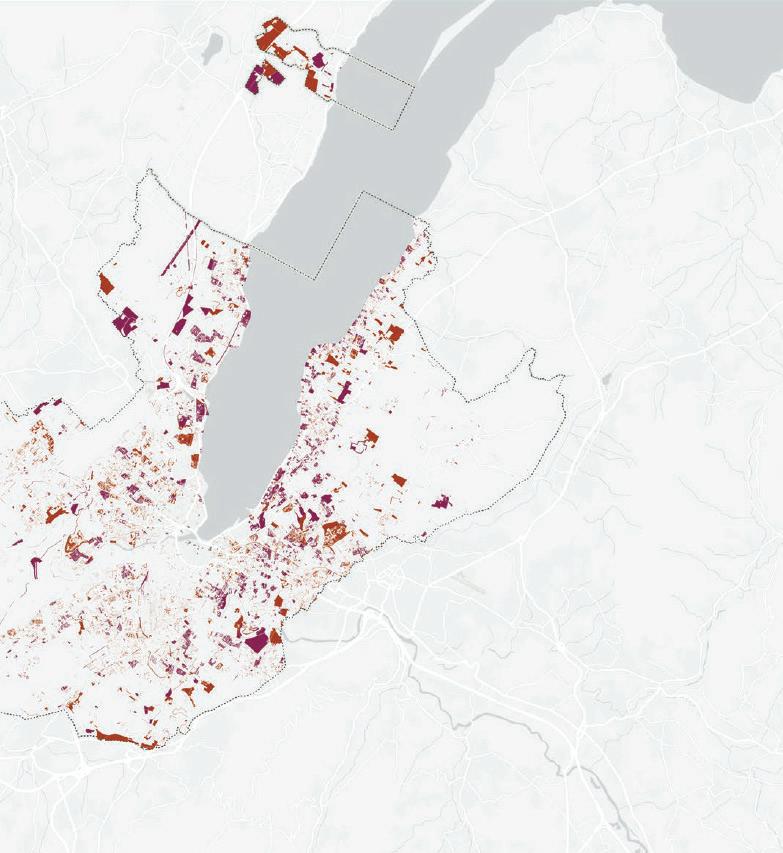

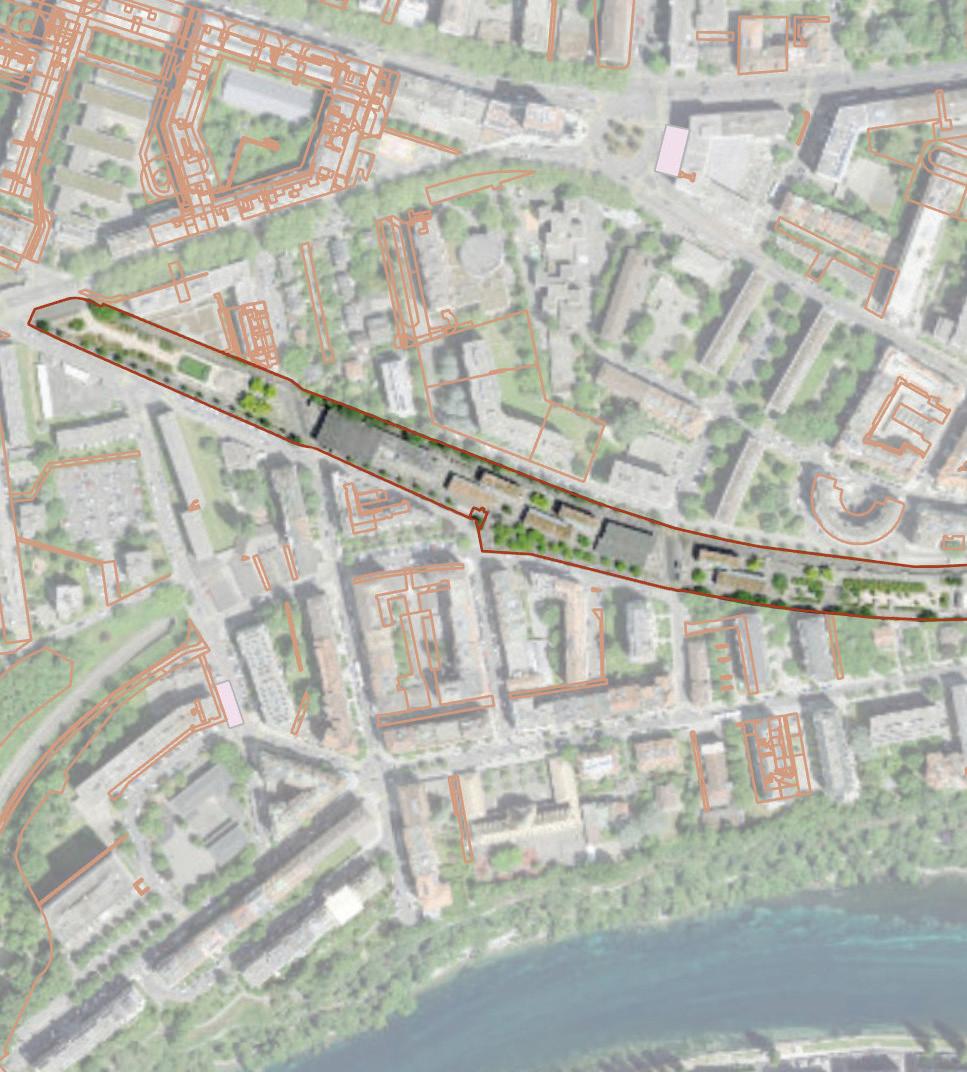
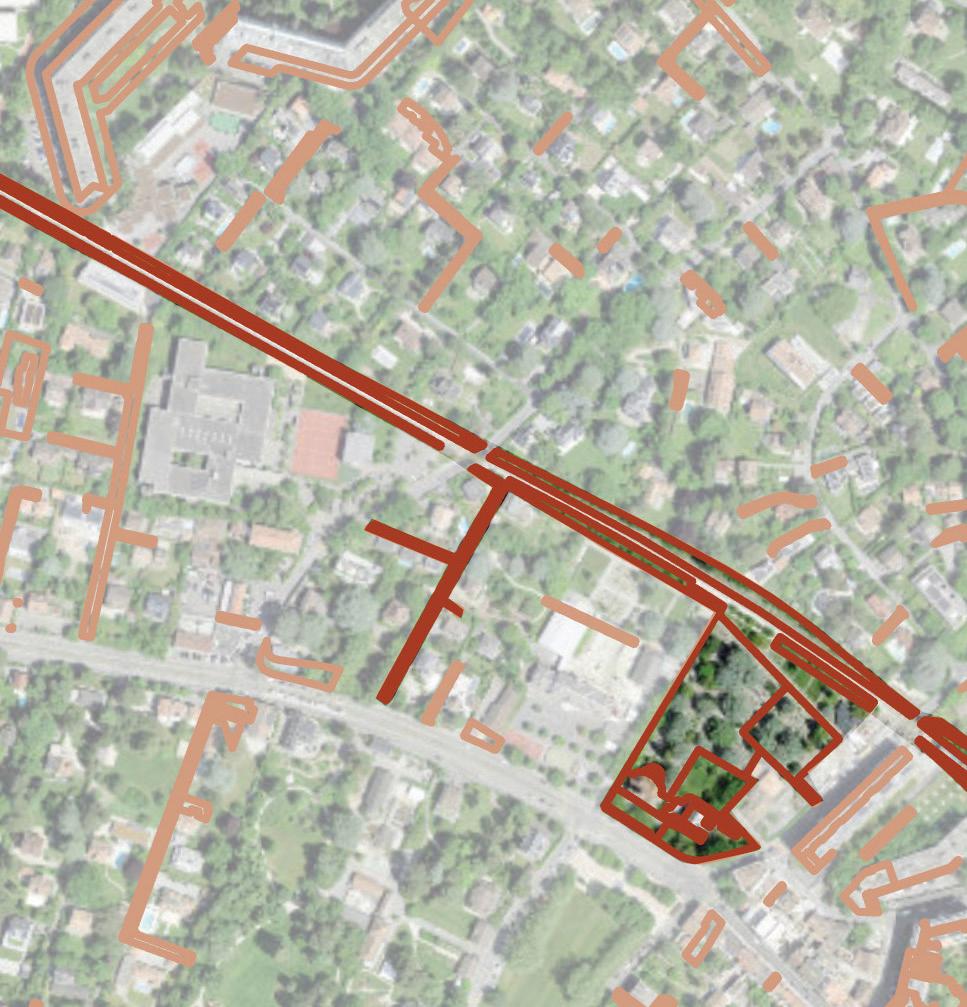
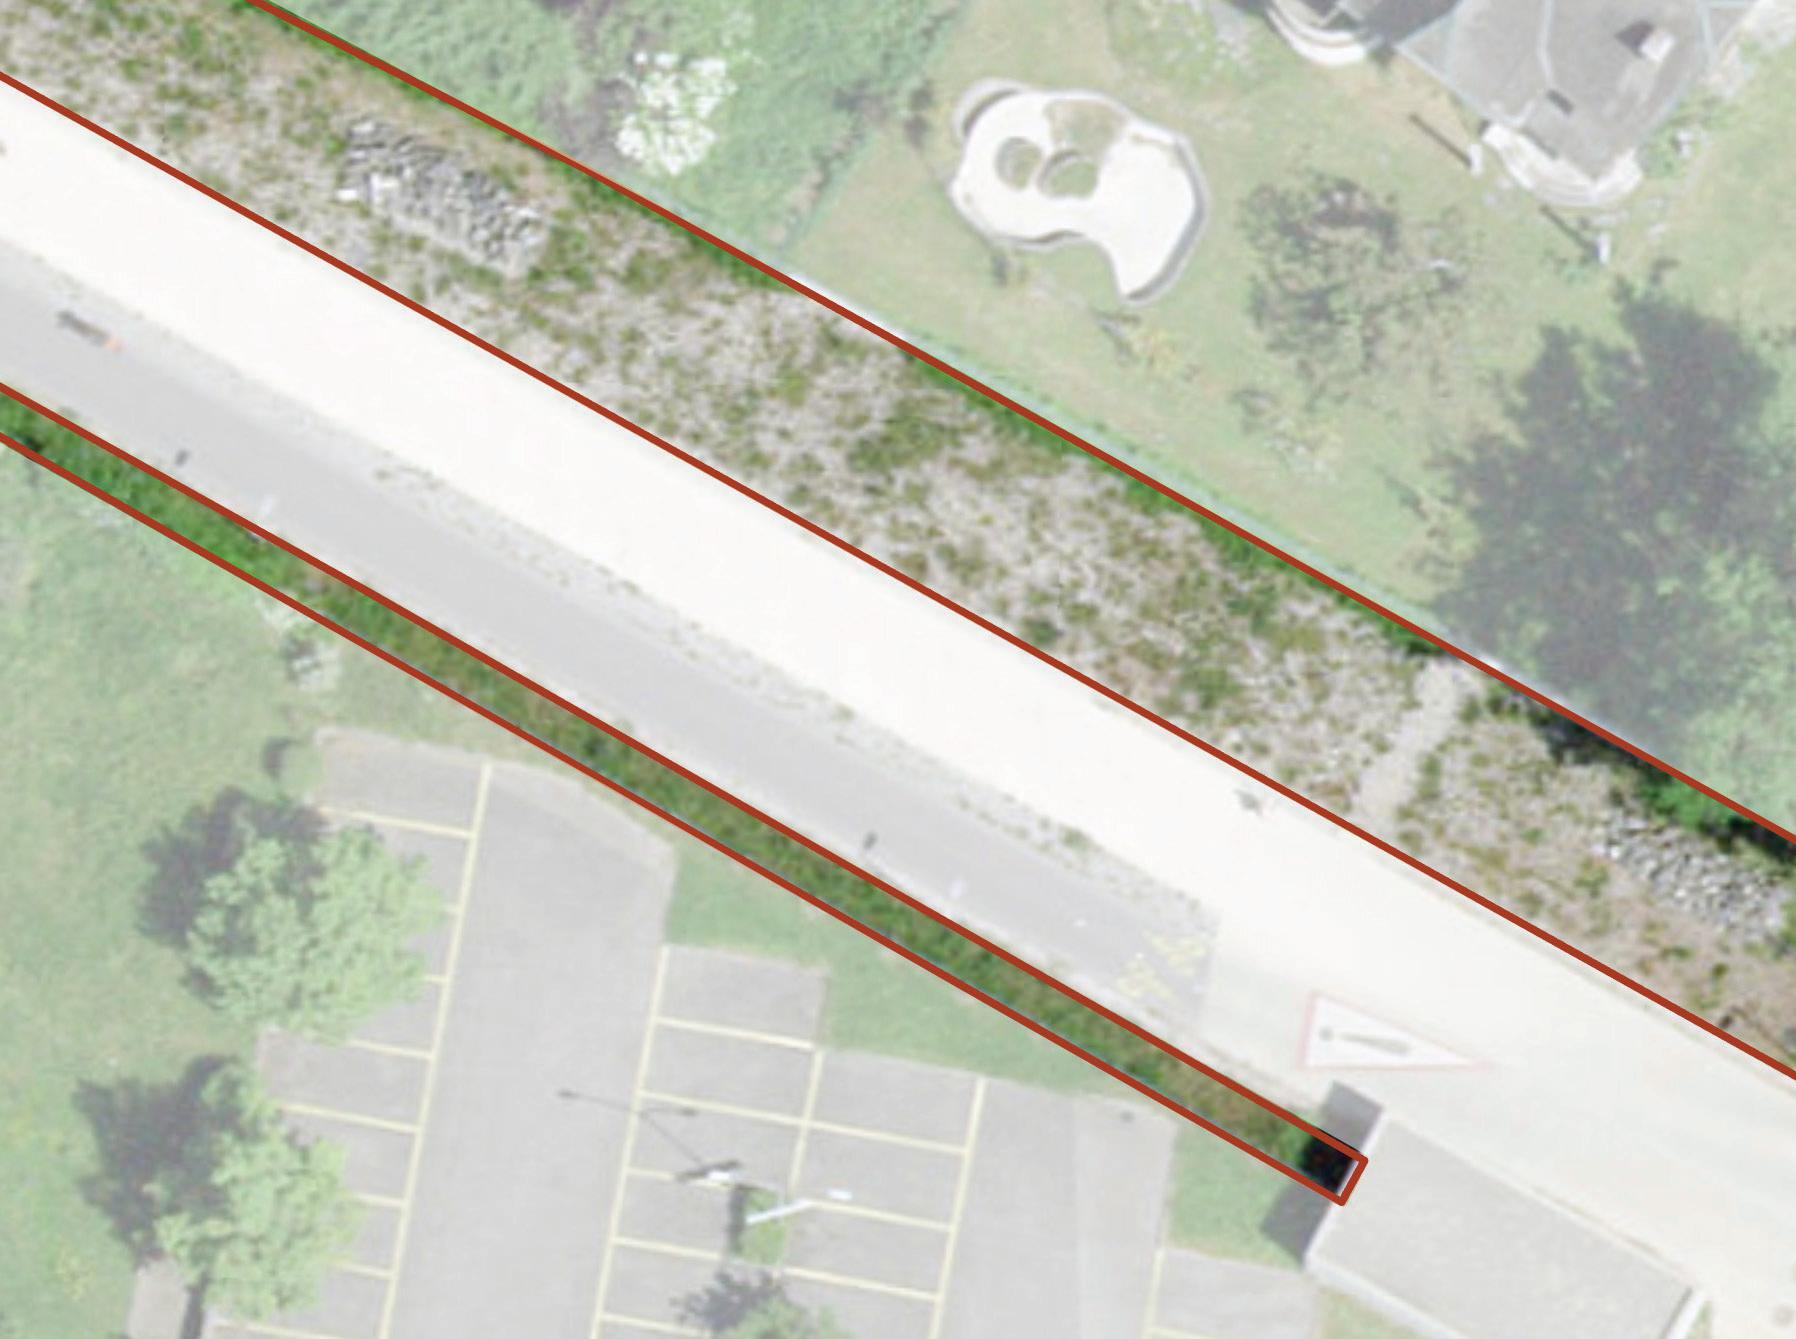
There are many right of way passages that serve as long stretches of land between existing neighborhoods or along streets and parking lots. These spaces often appear underplanted or as just large tracts of land (as pictured above) these spaces could begin to serve as new canopy plantable areas since they are not constructed and are already mostly planting.
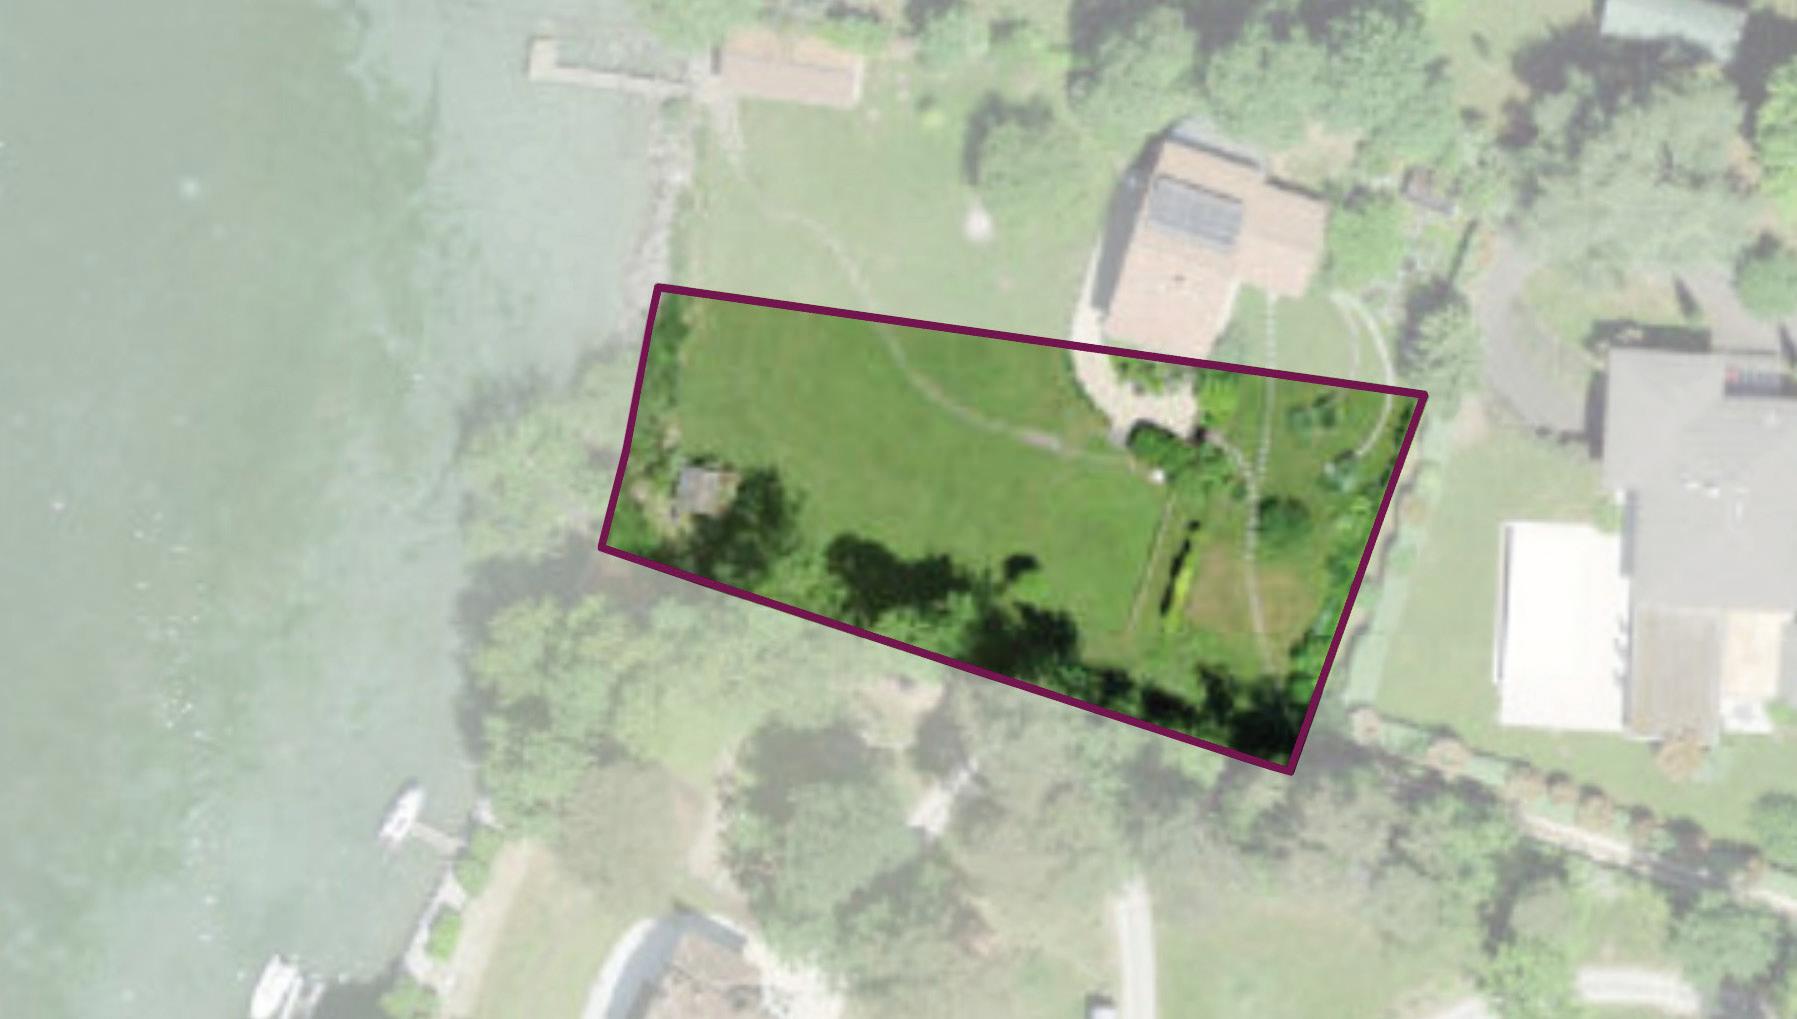
The planting easements require deeper research into. Here are some examples of unique scenarios that fall under the planting and fencing easement category. In the image pictured above,
this is a space that is mostly green space but still lacks significant canopy cover. Spaces like this act as potential areas where we can densify tree planting.
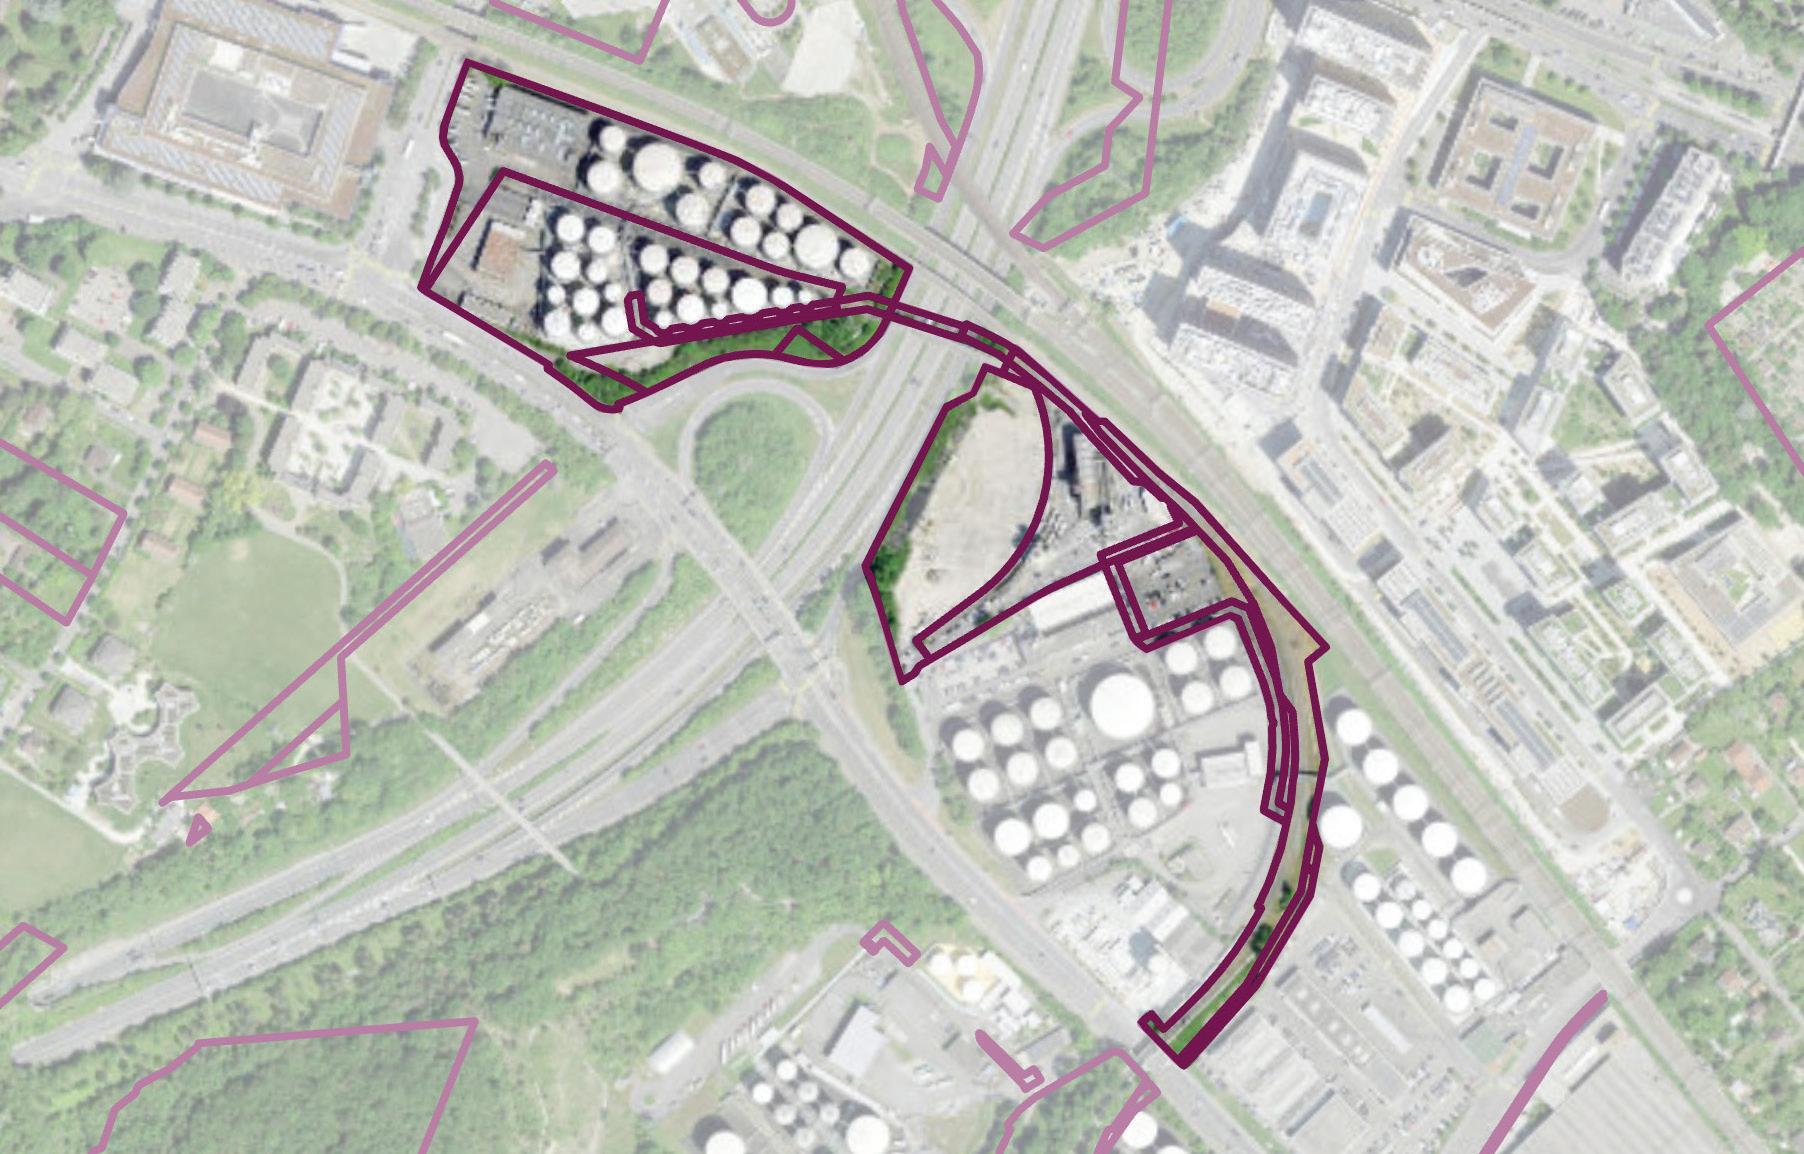
This space indicates an area that is fenced off and falls within the planting and fencing easement zone. It is mostly impervious surface and densely built on. Perhaps there needs to be a distinction between “planting easements”
and “fencing easements” or a policy change that requires ALL zones deemed as planting and fencing easements need to have a minimum of 35 percent canopy cover.
This approach focuses on spaces that are privately owned but dedicated to remaining unbuilt. Focusing particularly on researching planting easements across the city allows Geneva to prioritize areas that are already set aside for planting. Increasing canopy in these areas should be more straightforward as opposed to passage easements. In the case of passage easements, it would be best to focus on prioritizing areas that are a signicant size and have the potential to connect existing open spaces. This will help to strengthen overall connectivity of the urban forest and aid in creating and strengthening habitat for non-human actors across the city like birds and small mammals.
References
Système d’information du territoire à Genève (SITG.ge.ch):
RFO_SERVITUDE_SURFACE
GEO_GIREC
CAD_COMMUNE
CAD_CARTE_OTEMO
RFO_TOUTES_SERVITUDES
AGGLO_ZONE_AFF_SIMPLIFI
SIPV_ MNC_2013_2023_CHANGE
SIPV_ICA_MNC_2023
Fishburn, Isla S., Peter Kareiva, Kevin J. Gaston, and Paul R. Armsworth. “The growth of easements as a conservation tool.” PloS one 4, no. 3 (2009): e4996.
Locke, Dexter H., Alessandro Ossola, John Paul Schmit, and J. Morgan Grove. “Sub-parcel scale analysis is needed to capture socially-driven canopy cover change in Baltimore, MD.” Landscape and Urban Planning 253 (2025): 105187.
Ossola, Alessandro, Dexter Locke, Brenda Lin, and Emily Minor. “Yards increase forest connectivity in urban landscapes.”Landscape Ecology 34, no. 12 (2019): 2935-2948.
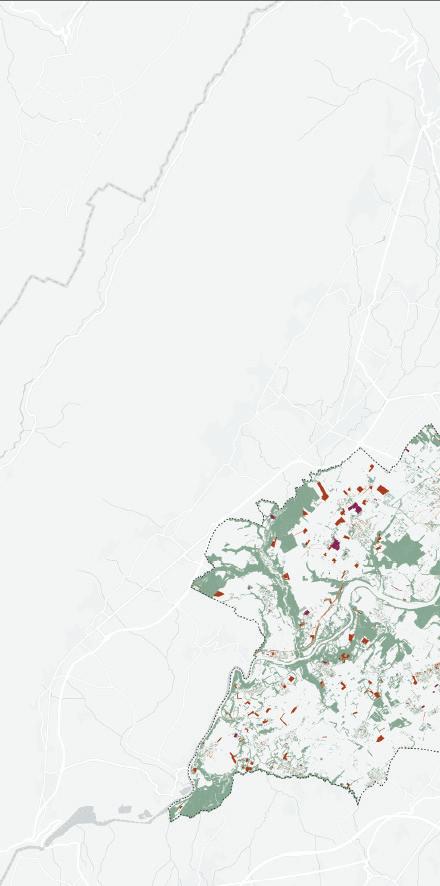
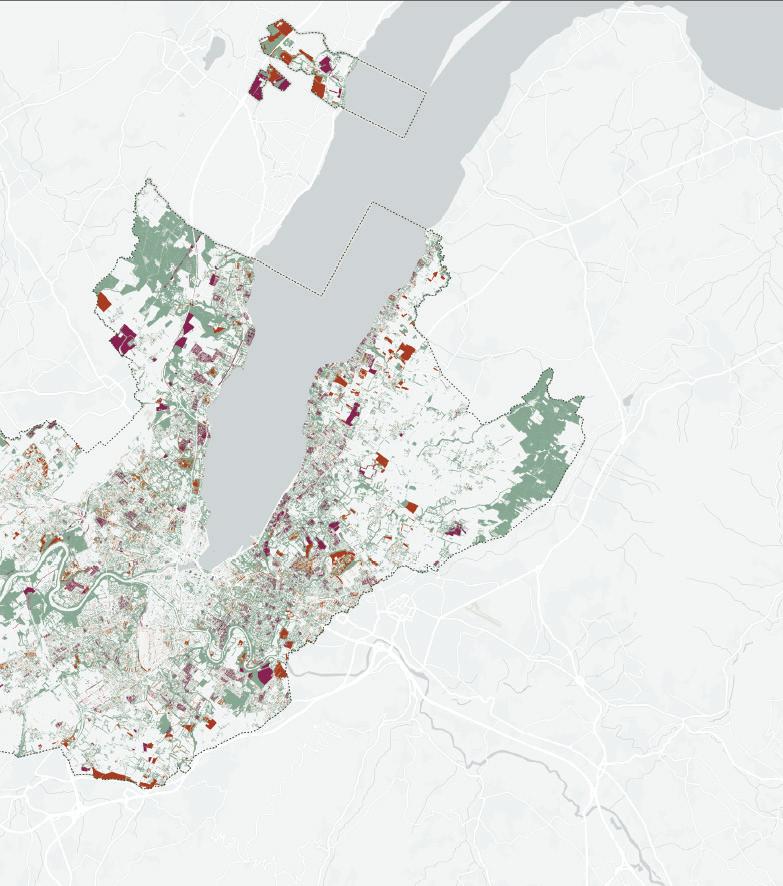

Carpinus betulus
Climate Adaptation and Risk Management
Acer platanoides
Taxus baccata
Acer pseudoplatanus var. pseudoplatanus
Aesculus
hippocastanum
Platanus x acerifolia
Is the current mix of tree species in the City of Geneva putting the urban canopy at risk in the face of rising heat and climate stress?
Acer campestre
Pinus sylvestris
Tilia cordata Quercus robur subsp. robur
Andrew Ó Murchú
Master in Landscape Architecture (MLA) + Master in Urban Planning (MUP) Candidate
Harvard Graduate School of Design
This analysis consider heat risk and species diversity with respect to the resilience of the urban canopy in the city of Geneva. Across the city, future RCP 8.5 projections show that temperatures will increasingly exceed 30°C. Of all Swiss cities, Geneva is expected to experience the most severe heat risks with 31-39 days of temperature above 30°C expected by 2060. At least two of the tree species that dominate the top ten most-occurring across the city—Acer campestre and Acer pseudoplatanus—will be vulnerable in these climate scenarios.
Species diversity measured using the 10-20-30 Rule is considered and suggests a healthy distribution of species diversity at the city level. However, when assessed at the neighborhood level, several areas of the city are vulnerable to large losses of tree canopy, particularly when the potential future loss of Acer campestre and Acer pseudoplatanus are accounted for.
This analysis suggests a spatial prioritization framework for where the city should most immediately take action to mitigate potential future loss. As the majority of these vulnerable species exist on private land (86%), then creative efforts will need to be established to address this loss outside of areas under city control.
This analysis engaged a data set from the City of Geneva consisting of 44012 data points. The analytical purchase of the data were limited since many trees were recorded only by genus and tree performance was inconsistently captured at the species level. The data set was reduced by 33.17% to discount data points limited to genus, thereby aiming to accurately address tree vulnerability at the species level. Inconsistent data capture included recording tree diameter at breast height (DBH) and tree condition at varying time intervals, thereby making it difficult to assess success of growth across the city by these measures. This analysis used ArcGIS Pro and Excel worksheets with existing available data and literature to address heat risk and tree diversity across the city. The analysis resulted in a priortization framework for action.
Across the City of Geneva, this analysis used RCP 8.5 projections to show that temperatures will increasingly exceed 30°C.1 Using daytime (1400H) median summer temperature projections from a geospatial raster layer of the Département du territoire for the years 2035, 2060, and 2085—“Analyse climatique 2020Température de l’air diurne”²—this analysis showed that the city will experience varying degrees of heat. But it also showed that almost all neighborhoods (13 of 16) will experience median summer temperatures above 30°C by the year 2060. The analysis identified projected heat at the neighborhood level by using the Département du territoire raster layer to generate a summary statistics table.
Of all Swiss cities, Geneva is expected to experience the most severe heat risks with 31-39 days of temperature above 30°C expected by 2060.³ To assess whether the top ten most occurring species in the city would be vulnerable to such heat risk, the American Horticultural Association’s “Plant Heat Zone” designation for each species was considered. This analysis assumes the “Fire Performance Plant Selector” designation, a joint venture by Firewise Communities, USDA Forest Service, West Virginia Division of Forestry, and Ohio State University.4
Acer campestre and Acer pseudoplatanus have the lowest designation of 5, meaning their limit for heat tolerance is in the range of 30-45 days on average per year above 30°C. While this suggests projections for 2060 remain within the current species’ range, it highlights that they will increasingly experience conditions in their upper limit of tolerance.
With respect to heat risk, drought risk was also considered by plotting 1991-2021 average monthly temperature and precipitation on a Gaussen diagram. Regarding projected precipitation for Geneva in 2060, the range of uncertainty plotted by the Swiss National Centre for Climate Services, alongside projected temperature increases from the Département du territoire, show increased opportunities for drought by end of century in Geneva. In the literature, over 17 compound drought days were identified in scenario RCP 8.5 after 2085.5








SPECIES
Genus Species
Carpinus betulus
Acer platanoides
Taxus baccata
Acer pseudoplatanus
Aesculus hippocastanum
Common Name
European hornbeam
Norway maple
Englishy yew
Sycamore maple
Horse chestnut
Platanus x acerifolia London plane
Acer campestre
Hedge maple
Pinus sylvestris Scot’s pine
Tilia cordata
Quercus robur
ADAPTABILITY
Climate Adaptationi Urban Adaptationii
Little-leaf linden
English oak
Based on American Horicultural Society’s (AHS) “Plant Heat Zone” designation. Low (designation 5); moderate (designation 6); high (designation 7 or higher). Designation of AHA Heat Tolerance Zone from “Fire Perfromance Plant Selector” https://fire.sref.info/
ii Urban adaptation score based on drought, salt, and pest resistance as noted above. A score of low, moderate or high receives a 1,2 or 3, respectively. A score of no recieves 0, while yes receives 2. Scores are grouped as follows: 0=low; 0-2=low-medium; 3-4=medium; 5-6=medium-high; 7-8=high
iii Designations based on “Fire Performance Plant Selector” https://fire.sref.info/
iv The Fire Performance Plant Selector designates drought tolerance as high, yet the table here is marked as low to align with a European specific study from Stefan J. M. M. van der Molen et al., “Heat Tolerance of Temperate Tree Species from Central Europe,” ForestEcologyandManagement 580 (2025): 122541
v Valentin Brühwiler, NeueErkenntnissezuAnthostomadecipiensundseinerRollealsPathogenderHagebuche (Master’s thesis, ETH Zürich, 2022), 10
vi B. Cochard, J. Crovadore, P.Y. Bovigny, R. Chablais, and F. Lefort, “First Reports of Cryptostroma corticale Causing Sooty Bark Disease in Acer sp. in Canton Geneva, Switzerland,” New Disease Reports 31 (2015): 8
vii “Viele neue und altbekannte Schadpilze im Jahr 2023,” WSL – Eidgenössische Forschungsanstalt für Wald, Schnee und Landschaft, accessed May 8, 2025
viii Vivanne Dubach, “Needle and Shoot Diseases of Pine Trees in Switzerland,” LinkedIn, January 17, 2022, https://www.linkedin.com/ pulse/needle-shoot-diseases-pine-trees-switzerland-vivanne-dubach/.
Above: Species matrix
Opposite: Gaussen Diagram 1991-2021 (Source: Climate-data. org); 2060 projected precipitation (Sources: NCCS Changements climatiques dans le canton de Genève Ce que l’on sait et ce qui est attendu dans le futur)
Pest Resistanceiii Salt Tolerantiii
Pests and diseases
Anthostoma decipiens (reported in Geneva since 2017)v
Cryptostroma corticale (reported in Geneva since 2014)vi
Phytophthora (Root rot)vii
Cryptostroma corticale (causes sooty bark disease)
Pulvinaria regalis
Ceratocystis platani (Stain canker)
Cryptostroma corticale (causes sooty bark disease) low low high high yes yes yes yes
Dothistroma spp.; Diplodia shoot dieback; Cenangium diebackviii
Apiognomonia errabunda
Acute oak decline
Everything is an average here--current 1991 to 2021r from climate-data. P1;P2;P3 projected ave summer temps--SITG; and temp projected precipitation is average from NCCS
Species City of Geneva, %
Using the 44012 data points (minus 33.17%), trees were organized into each of the 16 neighborhoods by species, genus, and family. From here, charts were generated to allow an assessment of the top ten across each category, and the degree to which each neighborhood fell within the benchmark of the 10-20-30 Rule.
Above: Breakdown of species, genus, and family across the city according to the 10-20-30 Rule.
Acer
Acer campestre
campestre
Tilia cordata
Quercus robur subsp. robur
Above: Breakdown of neighborhoods by benchmarks of the 10-20-30 Rule. Red denotes where a neighborhood falls outside of the threshold, making the urban forest less diverse and vulnerable.
Andrew Ó Murchú
Florissant Malagnou La Cluse Philosophes
13% or 366 trees
20% or 96 trees
Above: Neighborhoods where either two or three of the 10-20-30 Rules are not met. Note Acer campestre or Acer pseudoplatanus (highlighted in red) appear in all three of these neighborhoods with vulnerable level of diversity.
Paquis Navigation
4% or 15 trees

3 thresholds unmet
2 thresholds unmet
1 thresholds unmet





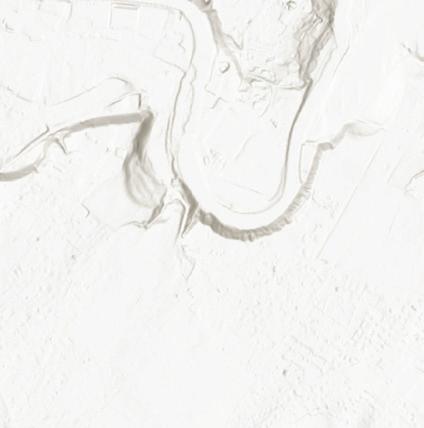


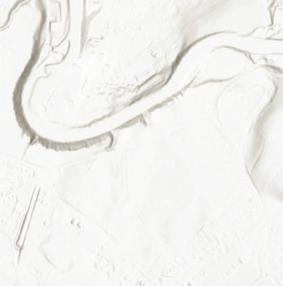
Above: Neighborhoods according to meeting the thresholds of the 10-20-30 Rule.
Across the City of Geneva, this analysis revealed that daytime (1400H) median summer temperature will increasingly exceed 30°C placing certain species most at risk—Acer pseudoplatanus and Acer campestre
Both these species are dominant in the urban canopy across the City of Geneva—the fourth and seventh most-occuring species, respectively, and representing approximately 6% of the total city canopy. However, as this analysis discounted over 30% of the tree data in the city—as it was not captured at the species level—the presence of these two species in the city may well be much larger.
In fact, Acer represents 15% of the total genera in the City of Geneva’s urban canopy. While not all Acer sp. fall within this vulnerable Plant Heat Zone (5) and some of those are accounted for at the species level (Acer platanoides is 5% urban canopy), it is important to note that the city’s urban forest could be more at risk than represented by this analysis.
Species diversity measured using the 10-2030 Rule is considered and suggests a healthy distribution of species diversity at the city level, but not in all neighborhoods. Here, several areas of the city are vulnerable to large losses of tree canopy, particularly when the potential future loss of Acer campestre and Acer pseudoplatanus are accounted for.
At least one of these species appears in each neighborhood, and in some of those
neighborhoods poor diversity intersects with a large number of vulnerable species. In Florissant Malagnou, for example, both the species and genus exceed the recommended threshold of 10% and 20% of species and genera, respectively. There are 366 species of either Acer campestre or Acer pseudoplatanus in this neighborhood. Were heat to increase along the scenario of RCP 8.5, or if sooty bark disease to become more prominent in Geneva, then this zone of the city would be particularly vulnerable. And as mentioned earlier, this analysis underestimates the prevalence of these species in the city, which is likely to be much higher.
betulus by Plant
Zone
Above: Projected loss to tree canopy after 2060 in an RCP 8.5 Scenario if no mitigation measures take place regarding dominance of Acer campestre and Acer pseudoplatanus in the City of Geneva’s urban forest. Below: Top 10 species by Plant Heat Zone type.


Undefined
Bords de voie Track edges
Cimetière Cemetery
Cour Courtyard
Ecole School
Jardin Garden


Parc, espace vert Park, green space
Parking Parking
Place Square
Place de jeux Playground
Terrain de sport Sports field
Trottoir/Zone piétonnière Sidewalk
Champ/pré Field/meadow
City sections/Neighborhoods


While 80% of all species in the City of Geneva are on private land, 86% of vulnerable species are on private land—Acer campestre and Acer pseudoplatanus. While 11% of potentially impacted species are on public land and the City can take direct action in planting plans and specifications to mitigate future risk, addressing
this on private land will prove more challenging since cities can not schedule removals and replacements here. This analysis shows that vulnerable species are situated across all location types in the city—from schools to sports fields and homeowner’s gardens. The stratification of these locations will make it difficult to address targeted efforts for replanting and specification recommendations.


Public land
Private land
Other land
Acer pseudoplatanus or Acer campestre


This analysis engaged a data set from the City of Geneva consisting of 44012 data points. The analytical purchase of the data were limited since many trees were recorded only by genus, reducing the data set by 33.17%. The impact of vulnerable species on the urban canopy is, therefore, likely to be much higher than
suggested here. Tree performance was also inconsistently captured at the species level.
Inconsistent data capture included recording tree diameter at breast height (DBH) and tree condition at varying time intervals, thereby making it difficult to assess success of growth across the city by these measures.
1. Track vulnerable species and plan for transition
As long-term data on performance of trees at the species-level is not available, the City should closely monitor the performance of Acer campestre and Acer pseudoplatanus in the nearfuture to judge whether their growth is affected by increased heat and associated climate risk. The City should also identify species designated as well-adapted to end-of-century climate scenarios and plan for the transition.
2. Assess Measurment of Tree Diversity at City-Level
While the 10-20-30 Rule is met at the citylevel, several neighborhoods are at risk due to poor distribtuion of diversity. The City should assess whether the Rule should be met by neighborhood, and what impact a large loss in vulnerable species would have with respect to an equity lens across the city.
3. Incentivize Private Action
The City should assess its measures for incentivizing resilient tree planting on private land—such as tree planting programs, and leveraging zoning and tree ordinances to encourage the provision of resilient species.
4. Adopt Best-Management Practices for Tree Records
To facilitate accurate and timely management of the urban canopy, the City should explore whether it is possible to conduct a frequent audit of all tree performance and urban canopy growth.
Batie Acacias
Bouchet Moillebeau
Champel Roseraie
Charmilles Chatelaine
Cite-Centre
Delices Grottes
Eaux-Vives Lac
Florissant Malagnou
Grand-Pre Vermont
Jonction Plainpalais
La Cluse Philosophes
Onu-Rigot
Paquis Navigation
Saint-Gervais
Chantepoulet
Saint-Jean Aire
Secheron Prieure


Above: Prioritization Framework spatialized
Delice Grottes
affected species: 130 (14%)
10:20:30—9:21:25
Paquis
Navigation affected species: 15 (4%)
10:20:30—23:22:22
Cite-Centre
affected species: 78 (4%)
10:20:30—12:14:23
Florissant
Malagnou
affected species: 366 (14%)
10:20:30—13:22:25
La Cluse
Philosophes
affected species: 96 (20%)
10:20:30—15:29:35
This analysis suggests a prioritization framework for targeting action by areas most at risk. The framework reaches a “priority score” based on climate and diversity metrics.
The climate score was reached by categorizing species at heat risk in each neighborhood into buckets of 0,1,2, or 3. For example, the neighborhood with the most affected species (366) was designated a score of 0. The neighborhood with the least (15) was designated a score of 3. For the diversity score, neighborhoods that fell within all (3) of the 10-20-30 Rule’s thresholds were marked as 3, those that met 2 were marked as 2, etc. The scores from climate and diversity were accumulated to reach a priority score. Areas with a higher score are of less priority, and areas with a lower score are of higher priority.
1 République et canton de Genève, Climat Température 14h00 P3 2020, SITG - Système d’information du territoire à Genève, accessed May 12, 2025, https://sitg.ge.ch/donnees/climat-temperature-14h00-p3-2020.
2 ibid.
3 CH2018 Project Team. CH2018 – Climate Scenarios for Switzerland: Technical Report. Zurich: National Centre for Climate Services, 2018.
4 Southern Group of State Foresters. Eastern United States Fire Performance Plant Selector. Accessed May 12, 2025. https://fire. sref.info/.
5 Christoph Nathanael von Matt, Regula Muelchi, Lukas Gudmundsson, and Olivia Martius, “Compound Droughts Under Climate Change in Switzerland,” Natural Hazards and Earth System Sciences (2024), 24: 1975-1990.
Système d’information du territoire à Genève (SITG): GEO_GIREC SIPV_ICA_ARBRE_ISOLE CAD_PARCELLE_MENSU
CLIMAT_TEMPERATURE_14H00_P1_2020-49
CLIMAT_TEMPERATURE_14H00_P2_2045-74
CLIMAT_TEMPERATURE_14H00_P3_2070-99
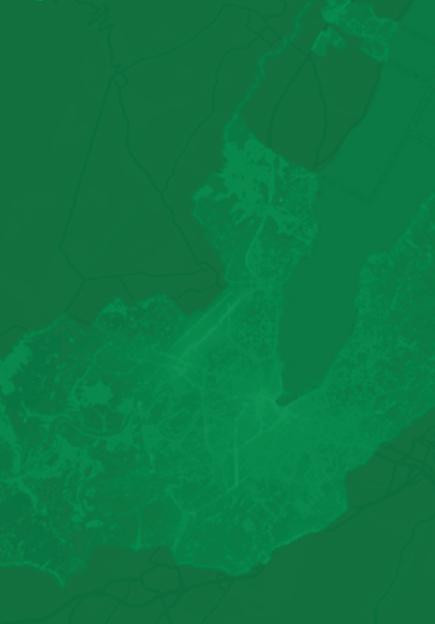
Prioritizing Tree Planting Efforts Based on Pollution Exposure and Existing Canopy Coverage Near Roadways Prioritizing Strategies for Planting
Michelle Lee
Master in City Planning (MCP) Candidate, Massachusetts Institute of Technology
Urban trees are often looked to for their pollutant removal and positive impact on air quality. However, research has shown that trees can also play a detrimental effect on air quality, particularly under certain conditions. Particular tree species emit large enough levels of biogenic volatile organic compounds (BVOCs) that can contribute to ozone (O3) layers, particularly in nitrogen dioxide (NO2) rich environments. This can present challenges in cities, especially on roads where NO2 levels tend to be higher. This dual role of urban trees can complicate their use as solutions for urban air quality improvement.
This study examines how tree planting efforts can be prioritized based on NO2 exposure and existing canopy coverage near roadways. By analyzing spatial data on tree canopy coverage with NO2 concentrations, and species-specific pollutant interactions, specific areas and species were identified as undermining air quality. Recommendations were made based on these and included targeted replacement of high-BVOC species with refined species selection criteria for future plantings.
Urban forests are a central component of sustainable city planning and for the future. Trees have been recognized for their multiple positive impacts, particularly their ability to remove pollutants and better air quality. However, research has shown that their influence on air quality is not uniformly beneficial.
Urban trees can worsen air quality by emitting what are known as biogenic volatile organic compounds, or BVOCs. BVOCs are organic compounds, such as isoprene and monoterpenes, that are naturally emitted by plants. While they are relatively harmless if released in remote areas where NO2 concentrations are relatively low, in places like cities with high NO2 levels, they can react to form ground-level ozone (O3), a pollutant harmful to respiratory health.
While Geneva’s efforts to increase urban tree cover aligns with climate adaptation and public health improvement, existing guidelines do not sufficiently account for the differential impacts of different species and their relationship with NO2 on air quality. This study further analyzes how tree planting efforts can be prioritized based on pollution exposure and existing canopy coverage near roadways.
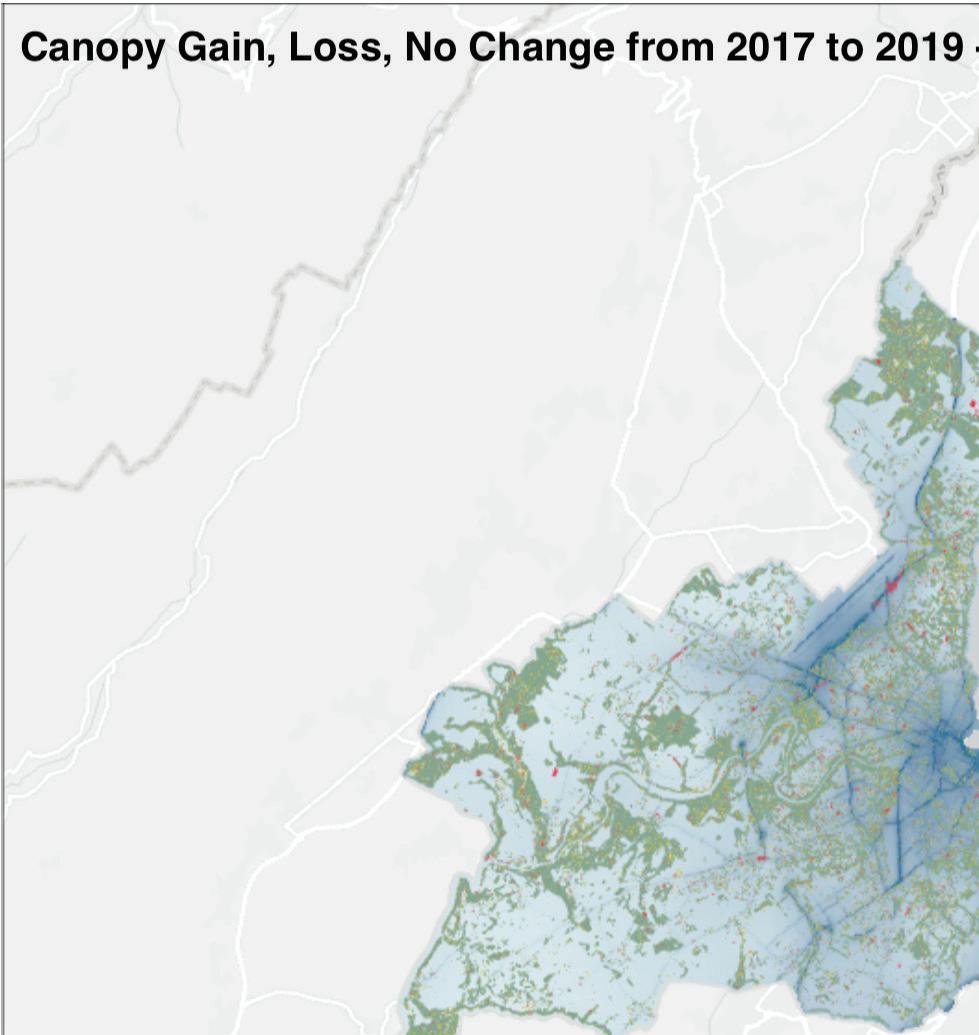

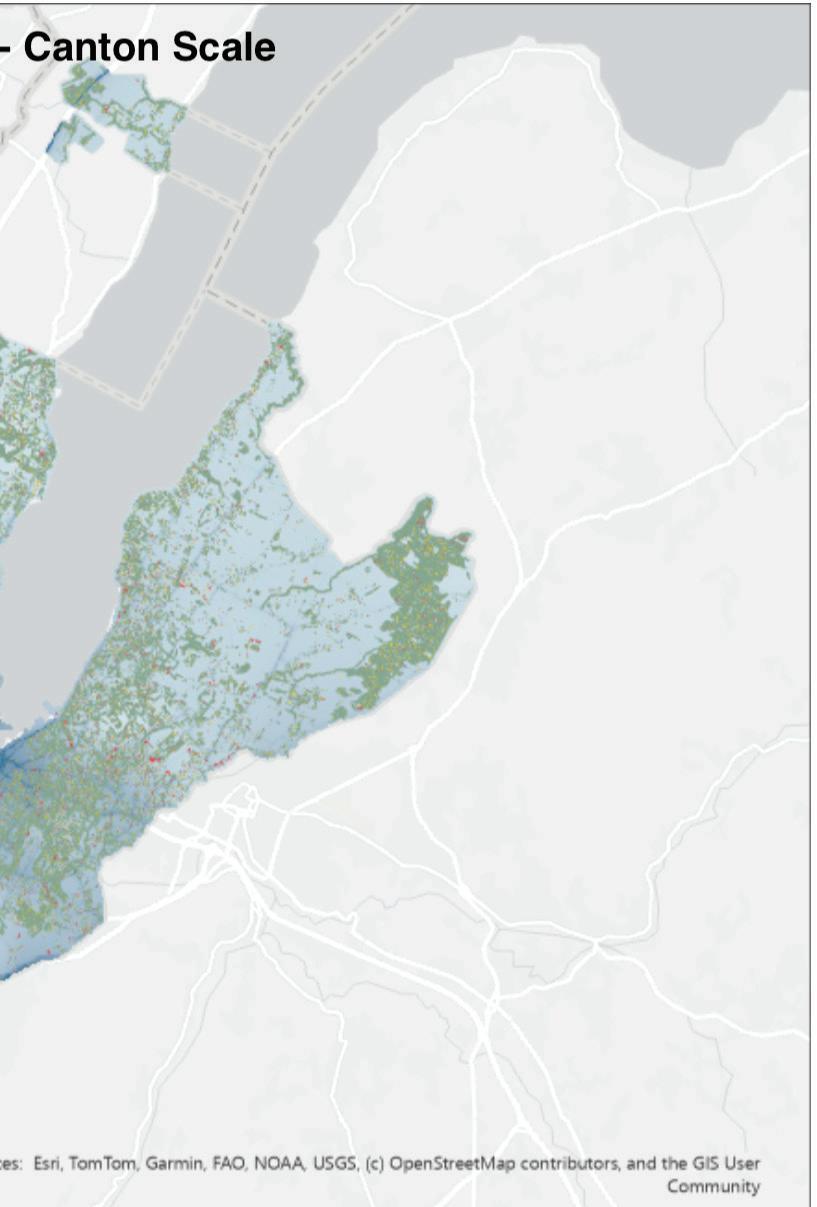

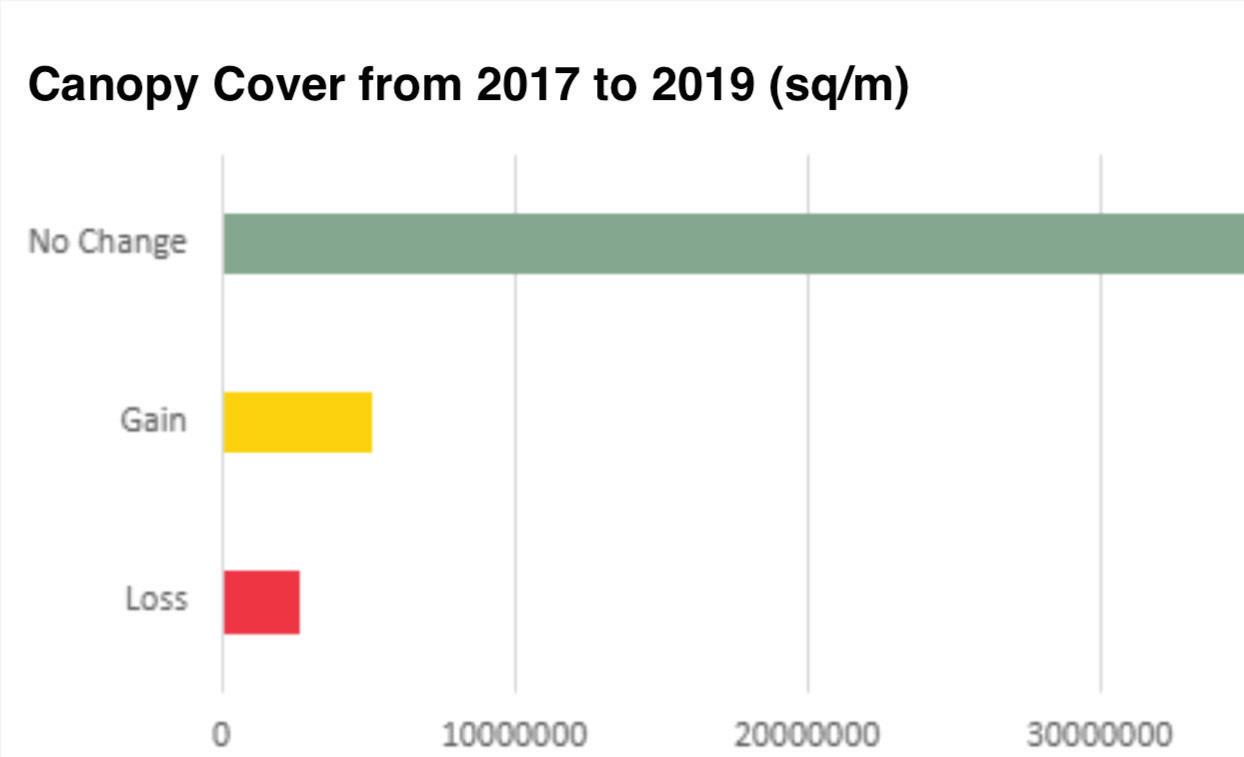
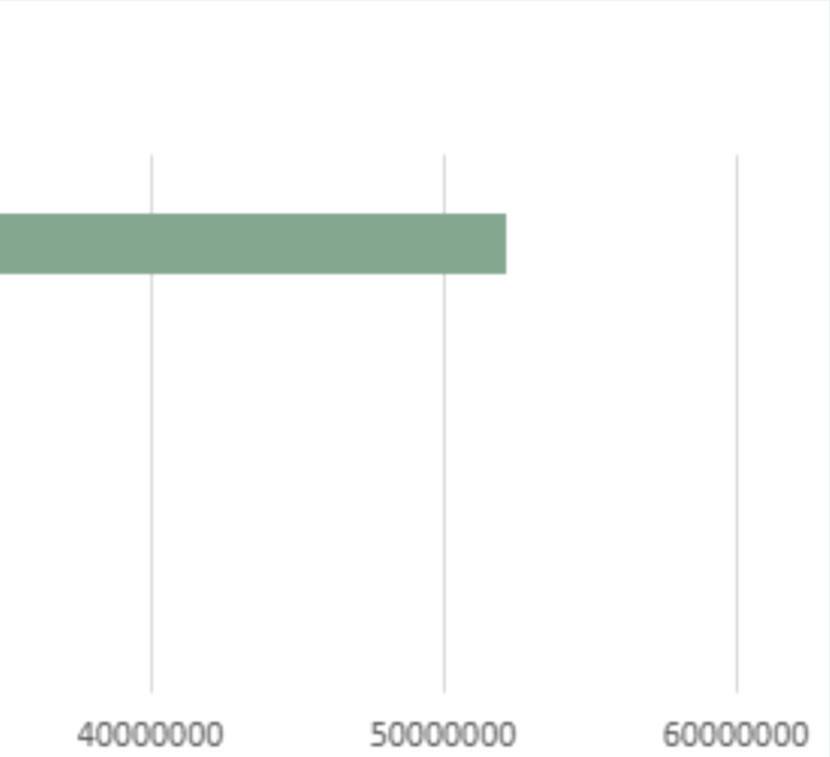
This study began with a spatial data analysis approach. Taking the canopy cover data from 2023, it was overlaid with the 2023 NO2 emissions in order to visualize and analyze a correlation between the two. However, because the NO2 emissions data did not fully cover the canopy cover dataset, further analysis was done with the 2017 and 2019 datasets.
To further understand and visualize changes in canopy coverage, the 2019 canopy cover data was overlaid with the 2017 canopy cover data to identify areas where there was canopy cover loss, gain, or no change. This was then overlaid with the NO2 emissions data from 2019. This provided insight into where tree loss may have been exacerbated by pollution exposure, to help determine priority zones for intervention.
NO2 levels were then categorized into 3 zones (not based on actual air quality index):
Zone 1 (Low): 0 - 20 ppb
Zone 2 (Medium): 20.001 - 30 ppb
Zone 3 (High): 30.001+ ppb
Each roadway was categorized into one of four types: Réseau primaire, Réseau secondaire, Réseau quartier, and Réseau quartier structurant. This classification facilitated an examination of correlations between road types and NO2. The intent was to evaluate whether specific road types were associated with higher pollution levels and greater needs for tree planting strategies.
1. Réseau primaire: Includes main roads designed to support large scale travel, enabling fast circulation between different parts of the canton and beyond.
Pollution Level: High
Pollution Buffer Distance: 100 - 200m
Percentage of Total Roads: 11.0%
2. Réseau secondaire: Made up of collector roads, facilitating connections between neighborhoods and access to the primary network. It is designed to efficiently distribute traffic while maintaining moderate speeds.
Pollution Level: Medium
Pollution Buffer Distance: 50 - 100m
Percentage of Total Roads: 14.9%
3. Réseau quartier: Subset of neighborhood networks, includes roads that play a key structuring role within neighborhoods.
Pollution Level: Low to Medium
Pollution Buffer Distance: 30 - 50m
Percentage of Total Roads: 65.8%
4. Réseau quartier structurant: Mainly intended to serve residential and local activity areas, prioritizes pedestrian access and limits through-traffic.
Pollution Level: Low
Pollution Buffer Distance: 10 - 30m
Percentage of Total Roads: 8.4% In conjunction with spatial data analysis, academic literature research was conducted to further understand how tree traits influence pollutant interactions.
Leaves characteristics were identified as an important feature to consider. Leaf biomass was identified as a key variable influencing the emission of BVOCs. While bigger and more leaves can lead to more BVOC emissions, it can also mean more potential for removing pollutants, like particulate matter (PM), NO2, and O3. This meaning, species with low BVOC emissions and large leaf areas can clean air more effectively.
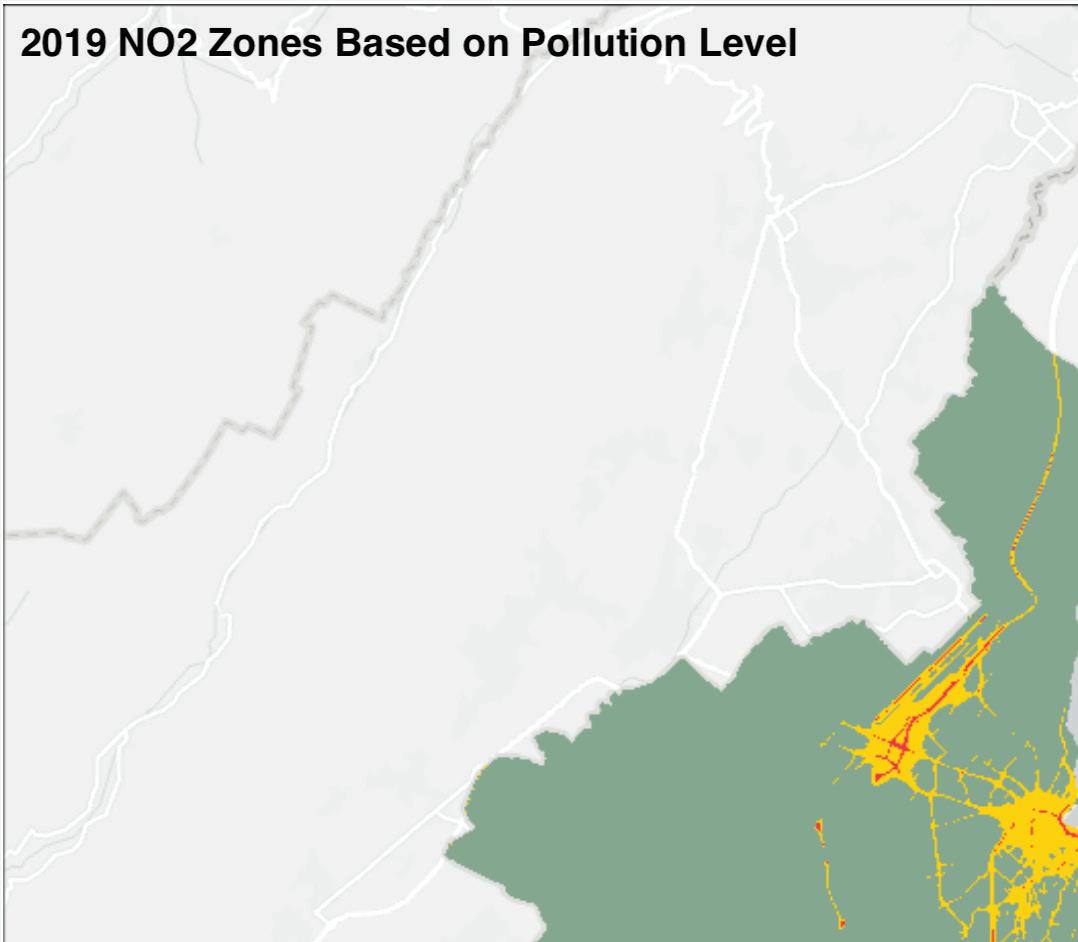
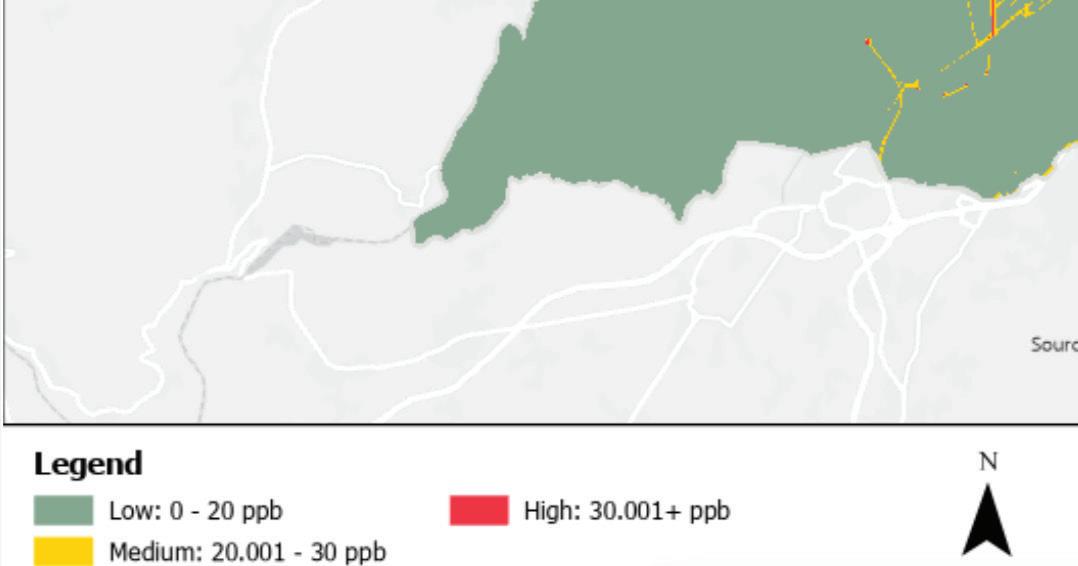
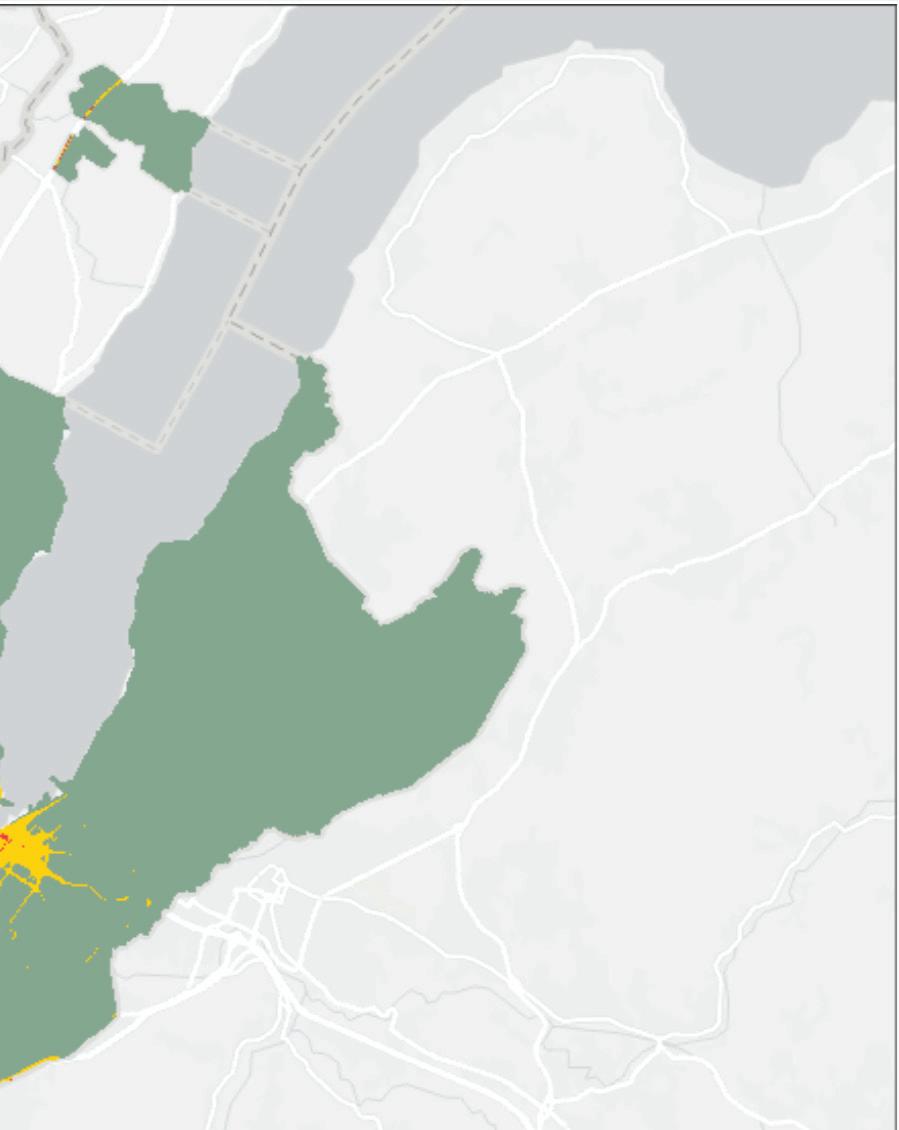
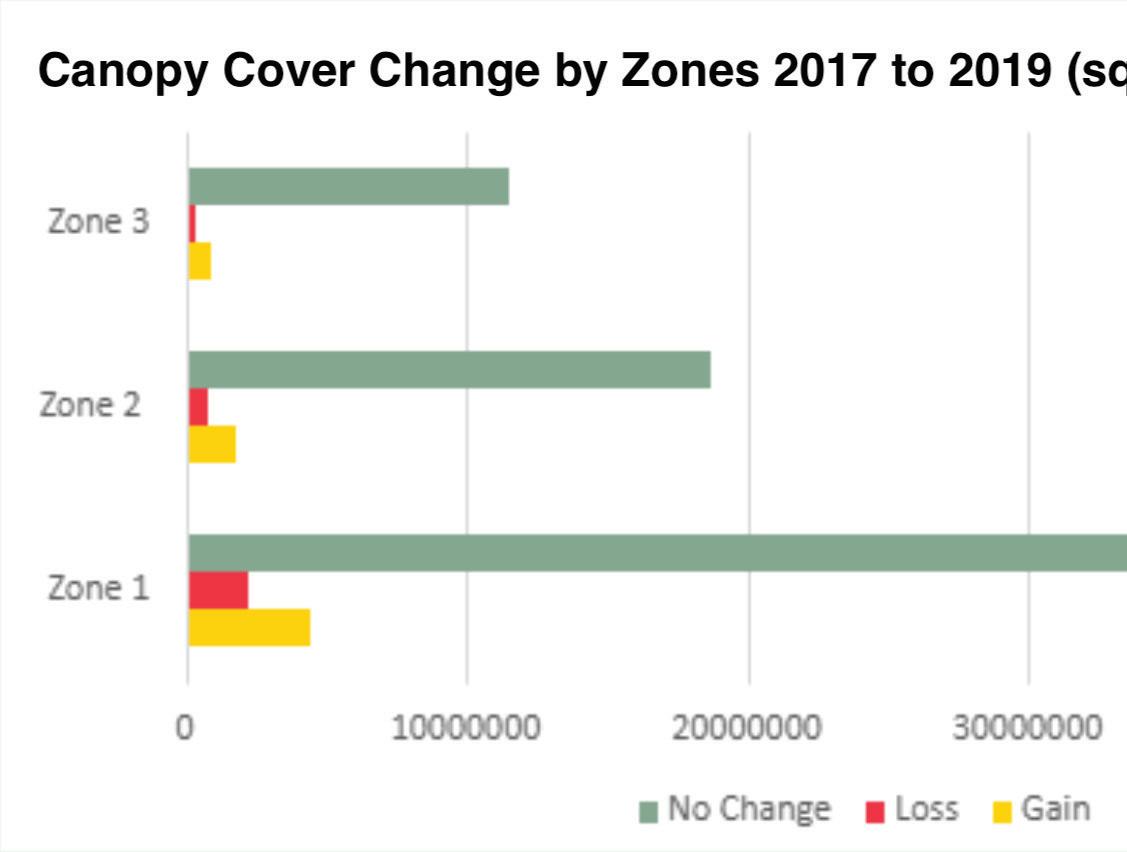

A second characteristic was complex or waxy leaves. Rough, hairy, or structured leaves were shown to have higher PM capture rates, while thicker cuticles and waxes can nearly double PM removal rates. Leaf hairiness and microtextures were also shown to increase the surface area and pollutant contact time. Species such as Fraxinus excelsior and Pseudotsuga menziesii, demonstrated notably higher capacities for particulate matter deposition.
Crown characteristics were also examined. While trees with dense crowns have the ability to restrict airflow in narrow urban streets and potentially trap pollutants and BVOCs, allowing for the destruction of O3, it can also have the complete opposite effect. Trees with dense crowns can cause higher residence time and lead to a local increase in the concentration of pollutants. This allows for more chemical reactions between reactive gaseous pollutants and emitted BVOCs, which is particularly concerning in urban areas with high NO2 levels where the conditions for ozone formation are optimal.
Seasonal changes affecting leaf traits were noted as additional variables affecting overall air quality impact. While BVOC emissions are species specific, generally, it can increase with temperature and light, as well as when the plant is exposed to severe drought, air pollution, or when plant tissue is damaged. Younger leaves were also identified as typically emitting more BVOCs than older ones.
1. High NO2 concentrations are found mostly along réseau primaire and réseau secondaire, which also have comparatively lower canopy coverage.
2. Tree canopy gains between 2017 and 2019 did not consistently occur in areas with high pollution exposure. Areas with increasing canopy occurred in Zone 1 and Zone 2, suggesting that canopy expansion has not been prioritized where air quality needs are most
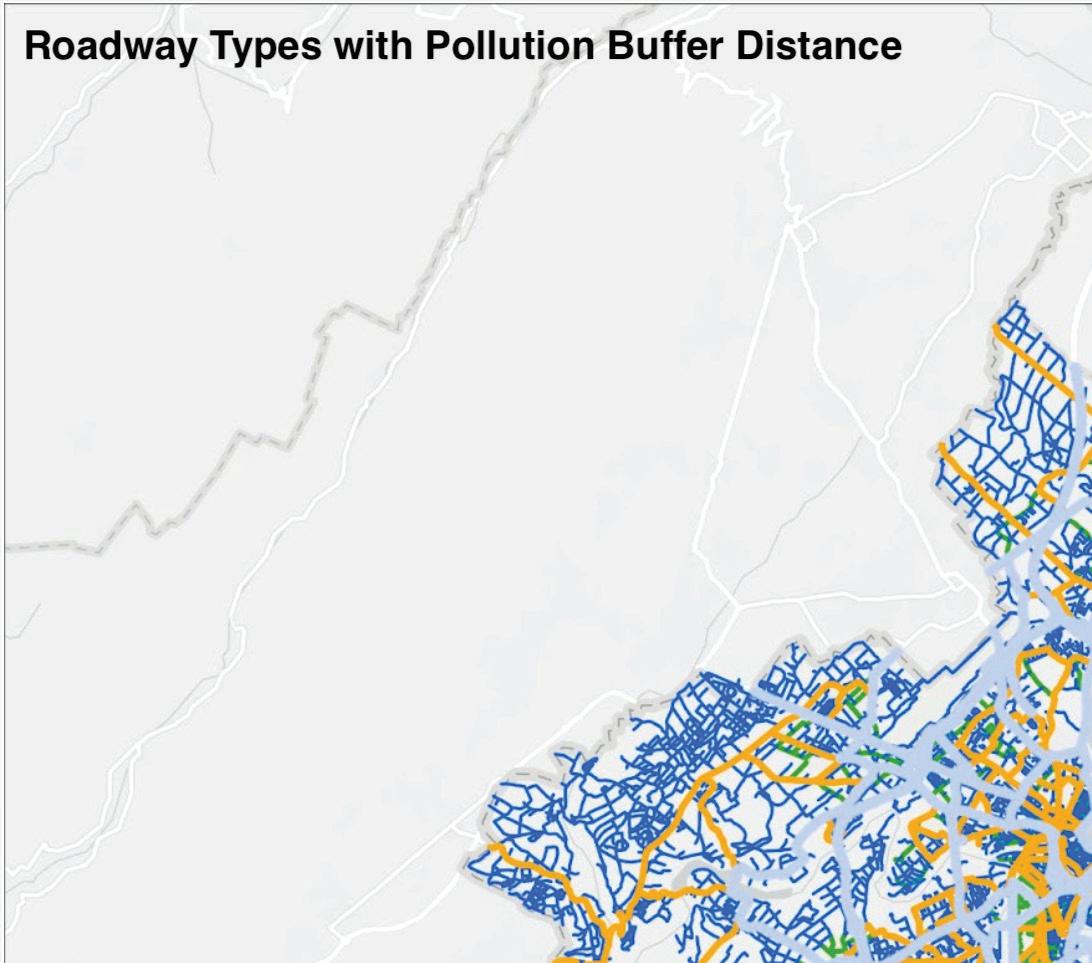
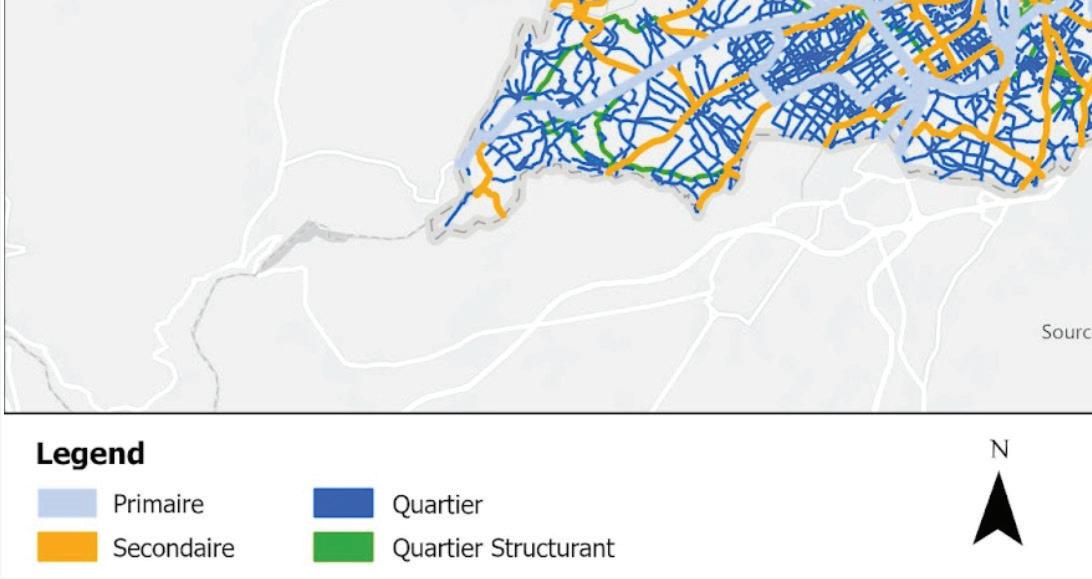
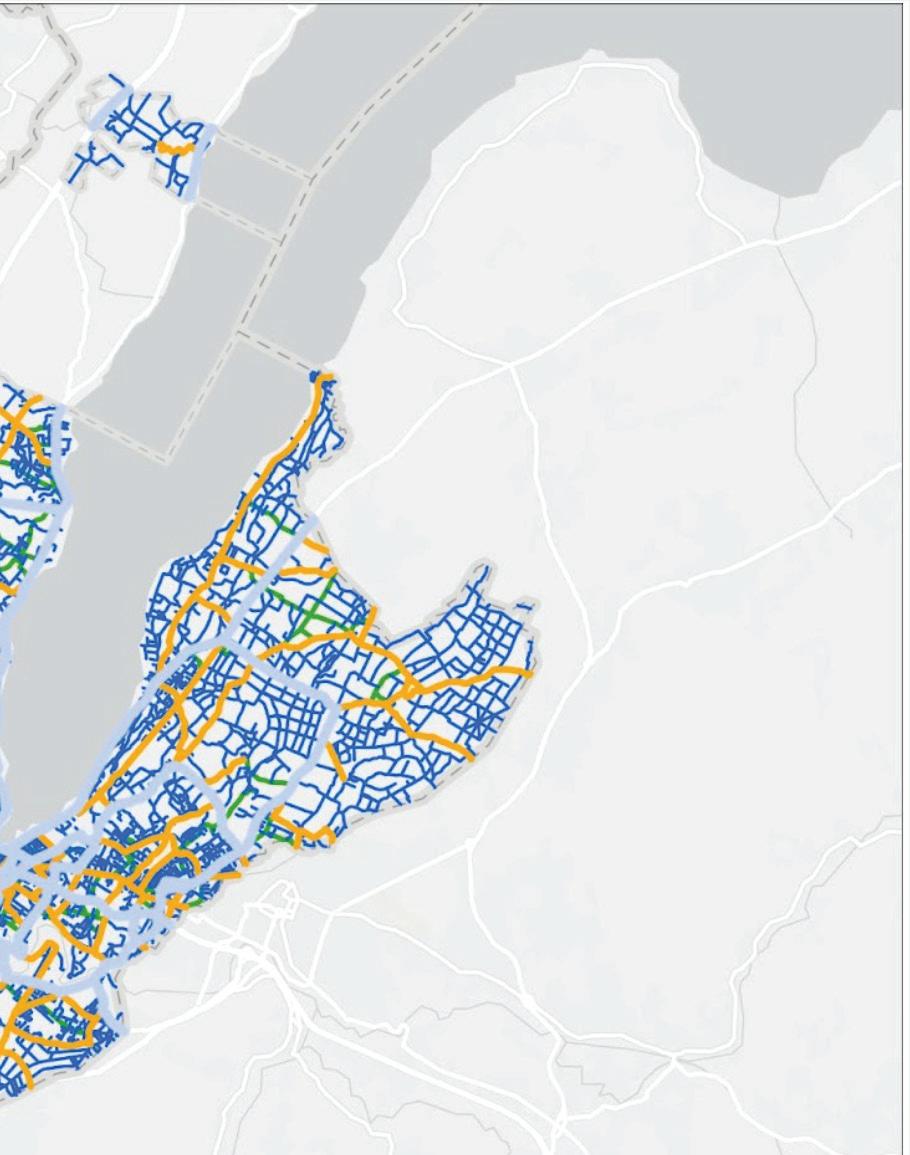
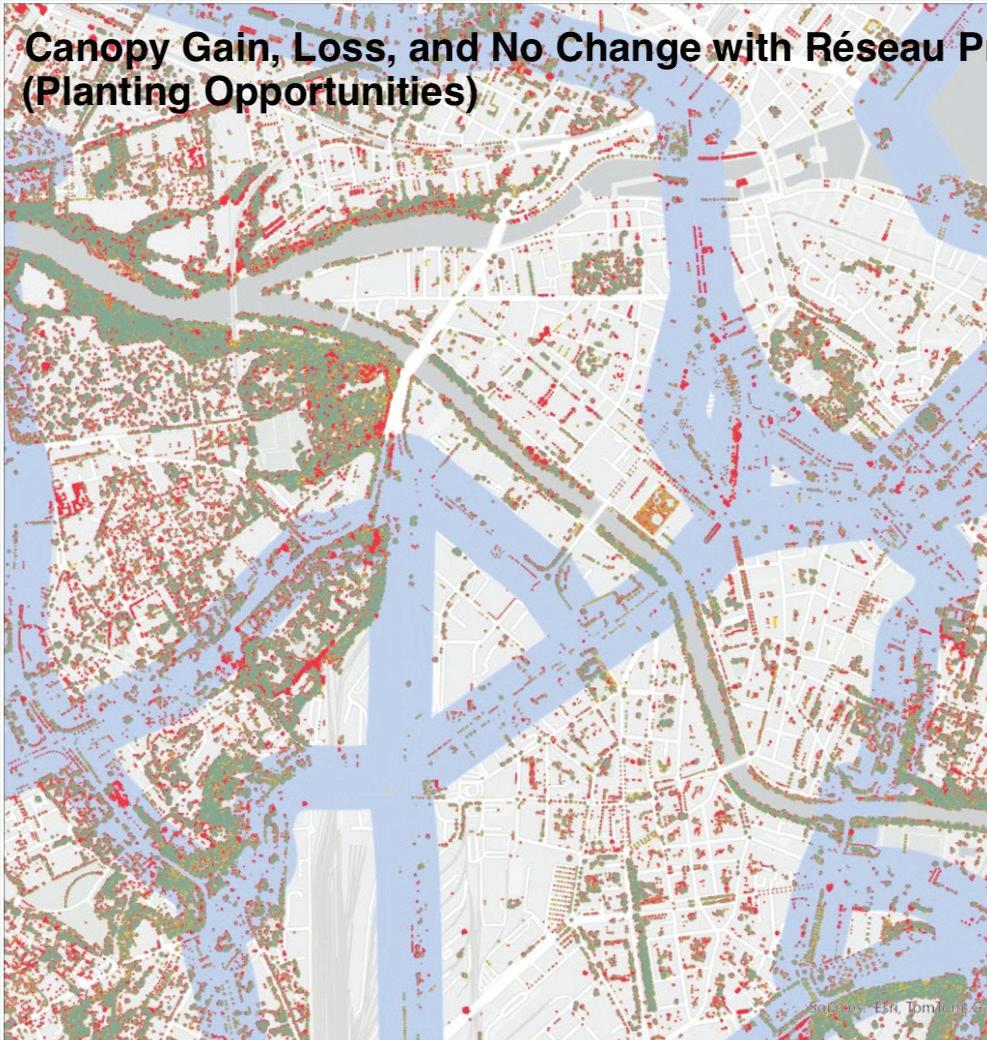

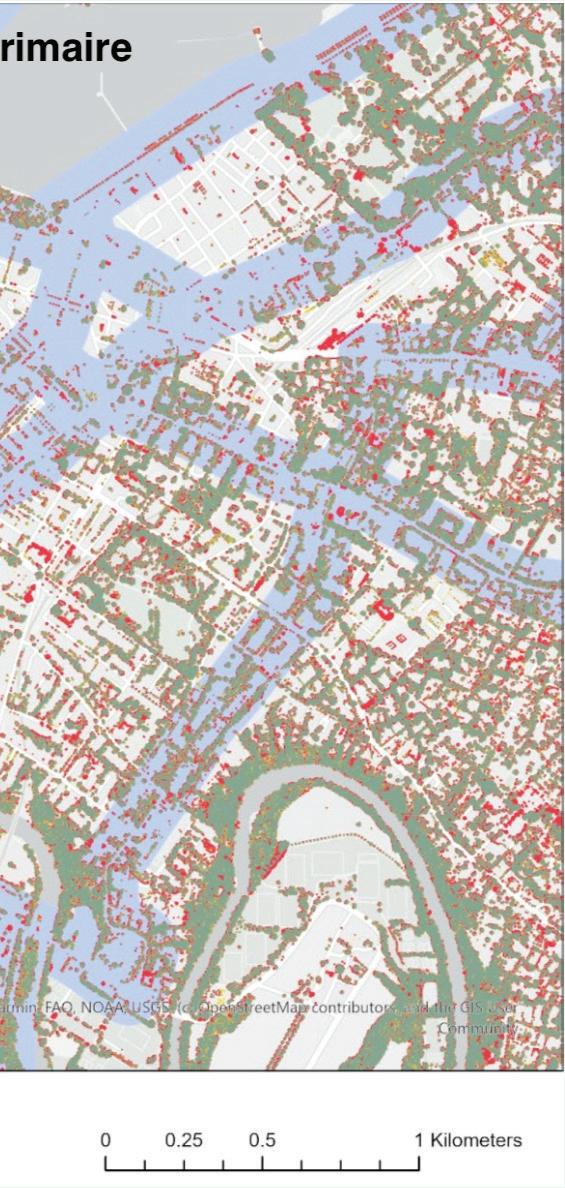
1. High NO2 concentrations are found mostly along réseau primaire and réseau secondaire, which also have comparatively lower canopy coverage.
2. Tree canopy gains between 2017 and 2019 did not consistently occur in areas with high pollution exposure. Areas with increasing canopy occurred in Zone 1 and Zone 2, suggesting that canopy expansion has not been prioritized where air quality needs are most necessary.
3. Species-specific traits such as high BVOC emission and dense crown structures can counteract intended air quality benefits of urban trees.
This research points to a critical gap between where trees are planted and where they are most needed for air quality benefits. Réseau primaire and réseau secondaire not only have the highest NO2 exposure, but are also least covered by urban canopy. This suggests that current planting efforts priorities need to shift to these areas.
The data also raises an important question about the quality, rather than quantity, of tree planting. Species choice emerges as a key variable in ensuring urban trees contribute positively to air quality. Trees that emit high levels of BVOCs or interfere with airflow can unintentionally worsen air quality, especially in dense environments. This pattern indicates a need for
species-level strategic planning, particularly in areas where pollutant levels are highest. Without changes to planting practices, these trees could exacerbate rather than mitigate air pollution.
For specific trees, currently the three most common species with the highest ozone formation potential (OFP) in Geneva are Quercus robur, Populus nigra, and Salix alba. This high OFP largely offsets their O3 removal rates.
Literature review and trait analysis indicate that some species exacerbate pollution through ozone formation, or by trapping pollutants in poorly ventilated streets.
1. There remains a high planting potential in primaire roads and areas with high NO2 levels. Particularly for these areas, planting strategies should focus on low BVOC emitting and high pollutant deposition species.
These trees would be best positioned in central medians or buffer strips, so their broad canopies can intercept pollutants without impeding air flow. Recommended species would include Platanus or Tilia, as they are known for their resilience to air pollution and effectiveness in pollutant capture.
2. Integrating NO2 emissions maps into the city’s greening planning efforts to guide site selection and species selection.
A tree species selection guide evaluated based on published metrics for BVOC emissions, PM capture, O3 removal rates, and ozone formation potential (OFP) should be developed and integrated to go hand in hand with this. Specific tree recommendations are as follows:
Best Tree Recommendations:
- Acer platanoides (3362 g tree−1 y−1)
- Ulmus minor (615 g tree−1 y−1)
- Acer saccharinum (560 g tree−1 y−1)
Evergreen trees show the best results for PM removal:
- Cedrus atlantica (1932 g tree−1 y−1)
- Pinus nigra (835 g tree−1 y−1)
- Picea abies (711 g tree−1 y−1)
Deciduous species for PM removal:
- Aesculus hippocastanum (603 g tree−1 y−1)
- Tilia platyphyllos (581 g tree−1 y−1)
Best results for both PM removal and net O3 balance:
- Tilia x europaea
- Acer saccharinum
- Pinus sylvestris
- Fraxinus excelsior
3. Replace or intersperse high BVOC emitting species in high NO2 zones with low-BVOC, high-deposition species, such as Cedrus atlantica, Pinus nigra, Tilia x europaea, or Acer saccharinum.
Both the capacity to remove pollutants and the contribution to ozone formation must be considered and prioritized (O3 removal must be greater than OFP).
4. Particularly in poorly ventilated street corridors, tree species with aerodynamic crown structures should be prioritized to promote air circulation and minimize pollutant trapping as stagnant air can accumulate NO2 and particulate matter.
Current findings suggest that planting strategies would benefit from a shift in prioritization criteria. Rather than focusing solely on increasing overall canopy cover, the strategy should integrate pollution exposure and speciesspecific emissions. A revised prioritization framework could potentially evaluate planting sites based on local NO2 concentrations, speciesspecific pollution interaction, and existing canopy density.
1 Brancalion, Pedro H. S., and Karen D. Holl. “Guidance for Successful Tree Planting Initiatives.” Journal of Applied Ecology 57, no. 12 (2020): 2349–61. https://doi.org/10.1111/1365-2664.13725.
2 Calfapietra, C., S. Fares, F. Manes, A. Morani, G. Sgrigna, and F. Loreto. “Role of Biogenic Volatile Organic Compounds (BVOC) Emitted by Urban Trees on Ozone Concentration in Cities: A Review.” Selected Papers from Urban Environmental Pollution 2012 183 (December 1, 2013): 71–80. https://doi.org/10.1016/j. envpol.2013.03.012.
3 Churkina, G., R. Grote, T.M. Butler, and M. Lawrence. “Natural Selection? Picking the Right Trees for Urban Greening.” Environmental Science & Policy 47 (March 1, 2015): 12–17. https://doi. org/10.1016/j.envsci.2014.10.014.
4 Kofel, Donato, Ilann Bourgeois, Romana Paganini, Aurèle Pulfer, Charlotte Grossiord, and Julia Schmale. “Quantifying the Impact of Urban Trees on Air Quality in Geneva, Switzerland.” Urban Forestry & Urban Greening 101 (November 1, 2024): 128513. https://doi.org/10.1016/j.ufug.2024.128513.
5 Martínez-Villa, Johanna Andrea, Alain Paquette, Kenneth J Feeley, Paula Andrea Morales-Morales, Christian Messier, and Sandra M Durán. “Changes in Morphological and Physiological Traits of Urban Trees in Response to Elevated Temperatures within an Urban Heat Island.” Tree Physiology 44, no. 12 (December 1, 2024): tpae145. https://doi.org/10.1093/treephys/tpae145.
6 Nilsson, Urban, Jaana Luoranen, Taneli Kolström, Göran Örlander, and Pasi Puttonen. “Reforestation with Planting in Northern Europe.” Scandinavian Journal of Forest Research 25, no. 4 (August 2010): 283–94. https://doi.org/10.1080/02827581.2010.49 8384.
7 Northrop, B.G. Tree Planting, Forestry in Europe, and Other Papers. Cambridge Scholars Publishing, 2012. https://books.google. com/books?id=RAk_QgAACAAJ.
4 Salmond, J. A., Tadaki, M., Vardoulakis, S., Arbuthnott, K., Coutts, A., Demuzere, M., ... & Wheeler, B. W. (2016). Health and climate related ecosystem services provided by street trees in the urban environment. Environmental Health, 15(S1), S36. https://doi. org/10.1186/s12940-016-0103-6

How can planting be prioritized to target the key drivers of vulnerability in the most at-risk urban areas?

Xinying (Kiesza) Li Master in Landscape Architecture (MLA) Candidate Harvard Graduate School of Design
Urban vulnerability to environmental stressors such as heat and air pollution is unevenly distributed across Geneva, often aligning with socio-demographic factors including age and occupational exposure. Despite growing interest in climate adaptation and nature-based solutions, spatial strategies to target greening efforts where they can most effectively reduce vulnerability remain underdeveloped.
This study integrates demographic, environmental, and land-use data to spatially assess social and environmental vulnerability across the canton and city of Geneva. Vulnerability was defined using indicators of age sensitivity (populations under 19 and over 65), air pollution, urban heat exposure, and employment in outdoor-based sectors. These indicators were normalized and weighted to generate composite vulnerability maps, while canopy cover was evaluated at grid-cell resolution to identify areas of shading deficiency. Results indicate that the northeastern and northwestern edges of the canton and central dense neighborhoods within the city exhibit the highest vulnerability and lowest canopy coverage.
Findings support a spatially targeted approach to urban greening. Priority areas for intervention include zones where high vulnerability overlaps with low canopy cover, particularly in dense, built-up districts. Recommended strategies emphasize small-scale, high-impact interventions such as street tree planting, pocket parks, shaded pedestrian corridors, and green roofs. Integrating vulnerability and canopy data enables more equitable and effective planning for urban cooling and air quality improvement in Geneva.
This study adopts a spatial multi-criteria analysis to identify vulnerability to environmental stressors and inform urban canopy planning in the canton and city of Geneva.
The assessment focused on four key indicators: (1) the proportion of residents under 19 years of age, (2) the proportion over 65 years of age, (3) ambient air pollution levels, and (4) employment in the primary sector, the latter serving as a proxy for outdoor occupational exposure. These variables were selected based on policy priorities articulated in the Geneva 2050 Plan and local surveys indicating public concern for air quality and vulnerable age groups.
Geneva’s 2050 strategy prioritizes health, air quality, and support for sensitive groups such as the elderly and youth. In response, this study develops a vulnerability map to identify areas where populations face the greatest combined environmental and social risks. The vulnerability assessment in Canton area is based on four indicators: population under 19, population over 65, air pollution levels, and employment in the primary sector, which serves as a proxy for outdoor environmental exposure.
To assess canopy coverage, existing tree cover data were intersected with the grid, and the proportion of shaded area within each cell was calculated. Overlapping canopy polygons were dissolved to prevent duplication in area calculations. Raster Calculator and Spatial Join tools were used to generate composite vulnerability and canopy deficiency maps. These were then combined through weighted overlay to produce planning priority maps. The analysis highlighted the importance of aligning spatial resolution with both the scale of environmental processes and the geometry of the built environment to ensure meaningful, actionable results. Lessons learned include the necessity of early standardization of spatial resolution and geometry correction to maintain analytical accuracy in overlay operations.
Each indicator was normalized to a 0–1 scale, and weights were assigned to reflect their relative importance in Geneva’s context. As shown in Table 1, populations under 19 and over 65 were each given a weight of 25%, in recognition of their heightened sensitivity to heat and pollution, as outlined in public health literature and local planning priorities. Air pollution was also weighted at 25% due to its significant and widespread impact on respiratory and cardiovascular health. Employment in the primary sector received a weight of 25%, as outdoor workers—particularly in agricultural zones—are more exposed to environmental hazards, yet often overlooked in urban resilience planning. The equal weighting reflects an integrated understanding of vulnerability as a product of both social sensitivity and environmental exposure.
Table 1. Canton vulnerability analysis criteria.
sensitive group with significant health vulnerabilities to heat and pollution.
2 Young_ Age below 19
3 Outdoor Exposure Works_ Primary Sector
4 Heat Island
Sensitive due to developmental vulnerabilities, though generally more adaptable than elderly.
Significant direct daily exposure, but typically includes healthier demographics, balancing sensitivity.
Areas with high heat island effects directly increase vulnerability, significantly impacting health outcomes.
Direct impact on respiratory and cardiovascular health, substantially influencing vulnerability.
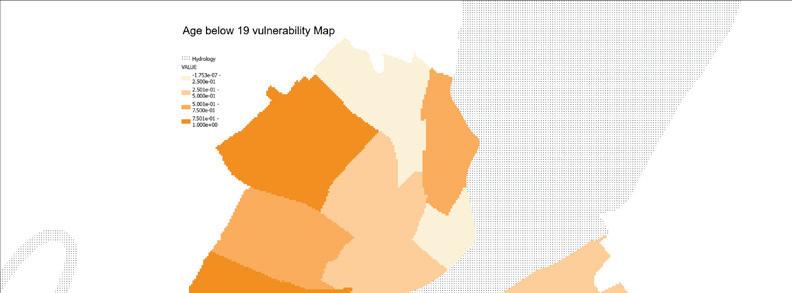

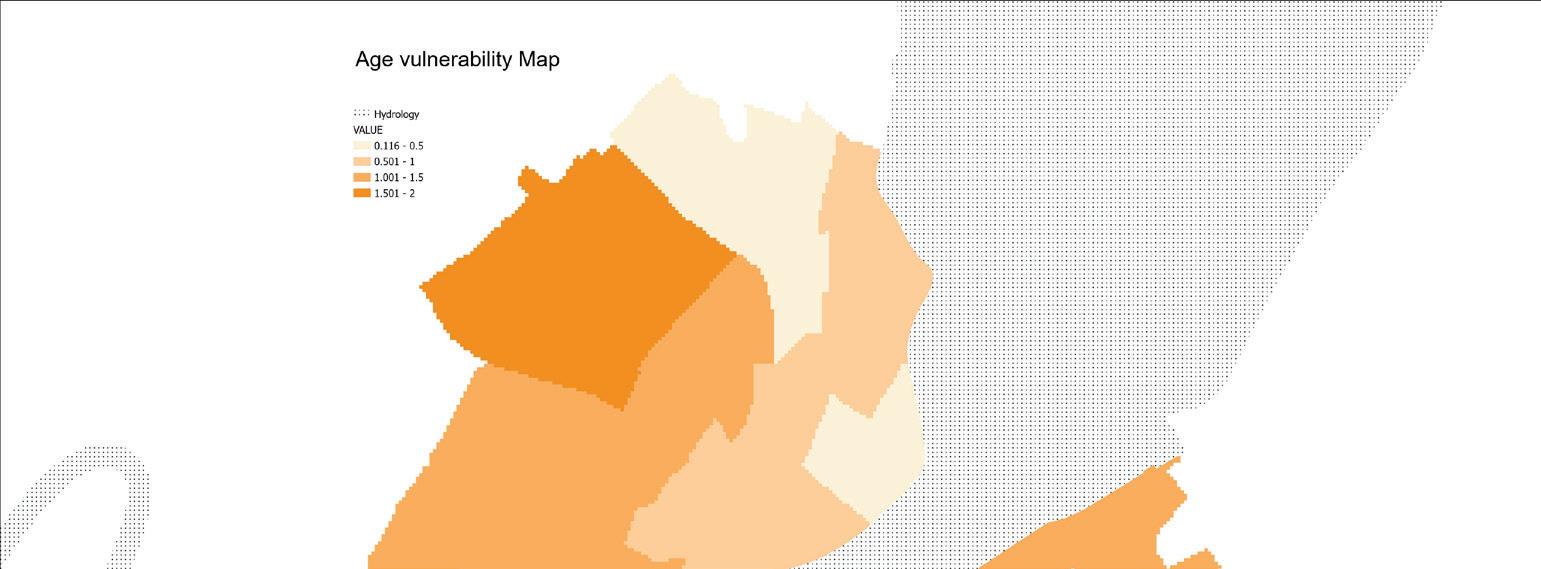
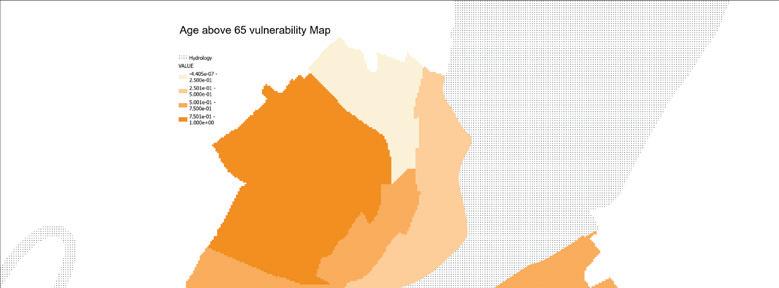
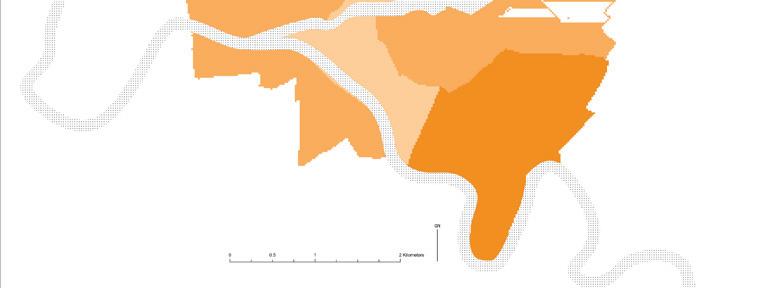
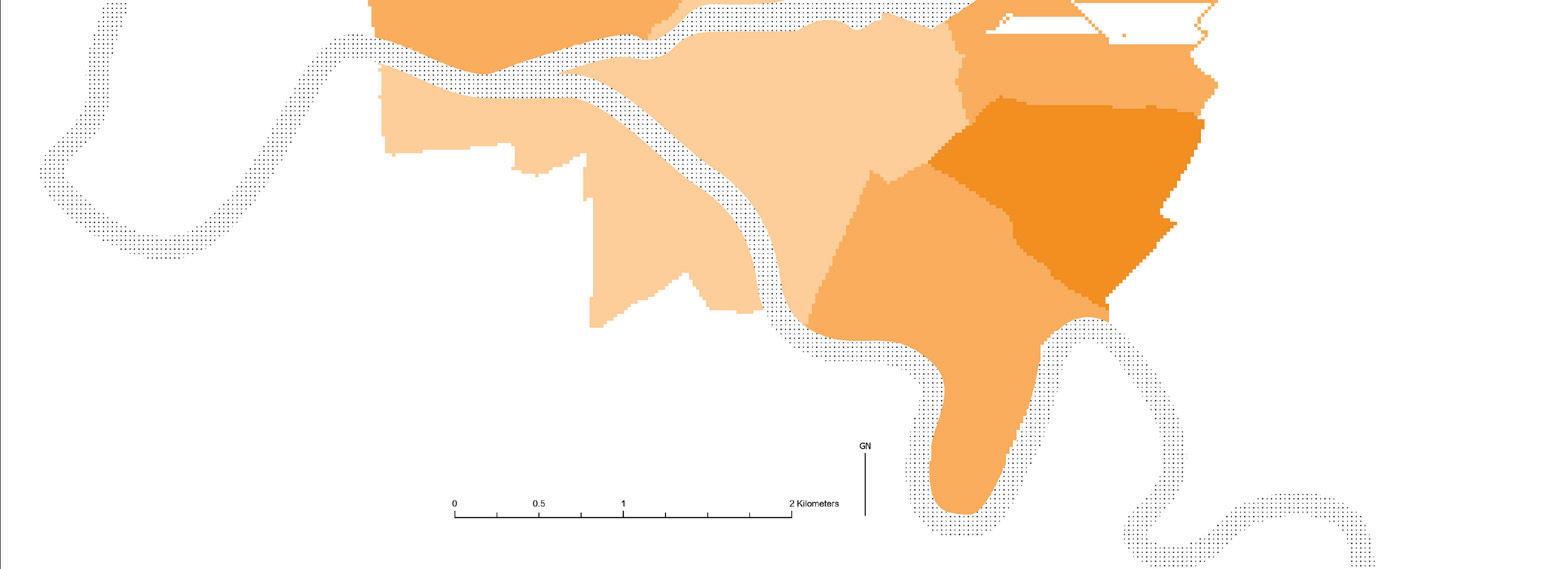
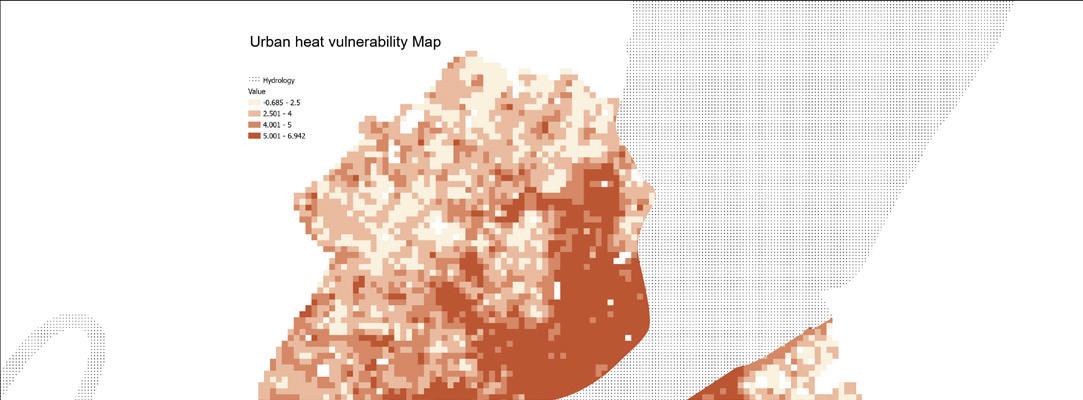
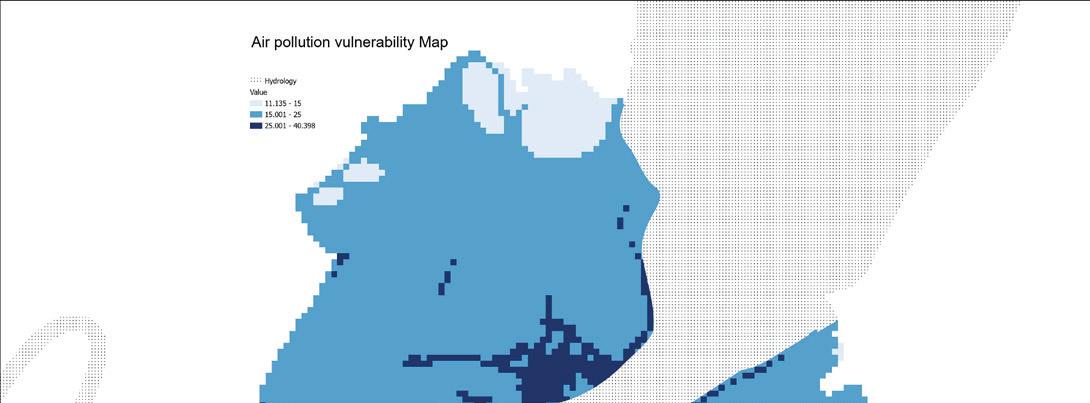
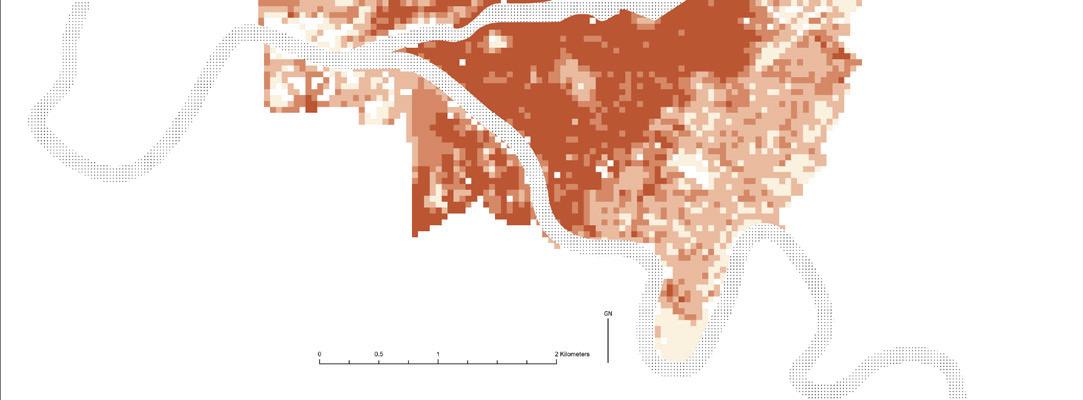
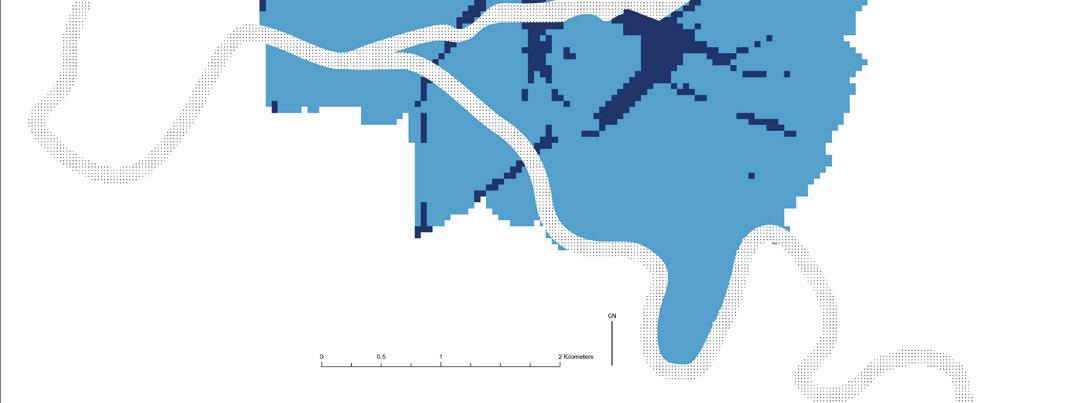
Above: Composite age vulnerability map (percent population older than 65 and younger than 19.
Below (left): Urban heat vulnerability map.
Below
Air pollution vulnerability map.
The spatial distribution of age-based demographic vulnerability across Geneva reveals distinct patterns concentrated at the urban periphery. Out of a total population of 529,187, residents under 19 years old account for 110,302 and those over 65 for 88,558. The highest recorded proportions within individual grid cells reach 28% for youth and 27% for the elderly. As figure 1 shows, these elevated concentrations are primarily located along the canton’s border, with younger populations more common in rural and peri-urban areas outside the main city, and elderly populations clustering in the south and northeast.
After normalization and equal weighting of the two indicators, a composite social vulnerability map was produced(fig. 2). The resulting spatial pattern highlights increased social vulnerability in the northern and southern outskirts, where high proportions of sensitive age groups overlap with lower accessibility and environmental protection.
Environmental vulnerability in Geneva was assessed based on outdoor exposure, air pollution, and urban heat, revealing spatial patterns that intersect with urban form and land use. Employment data show that out of 419,329 total workers, only 2,106 are employed in the primary sector; however, the spatial distribution of these workers is highly uneven. In some grid cells located along the canton’s outskirts, primary sector employment reaches up to 34% of the working population. These areas are characterized by extensive agricultural activity, where workers are more exposed to environmental hazards such as heat and air pollution due to the lack of structural or vegetative shading.
Elderly
Young
“OCS POPULATION
SSECTEUR – Statistique cantonale de la population (information au sous-secteur)”
(OCS_POPULATION_ SSECTEUR). SITG, 2025.
“OCS POPBATLOG COMMUNE –Agrégation statistiques population et parc immobilier (communes)”
(OCS_POPBATLOG_ COMMUNE). SITG, 2025.
“OCS EMPLOI VGE SECTEUR – Statistique structurelle des entreprises (Information aux secteurs de la ville de Genève)”
(OCS_EMPLOI_VGE_ SECTEUR). SITG, 2025.
Spatial join to grid; normalized to 0–1 scale; weighted at 25%
Descriptive Statistics, Raster Normalization
Primary Sector
“OCS EMPLOI COMMUNE – Statistique structurelle des entreprises (information à la commune) ”(OCS_EMPLOI_ COMMUNE). SITG, 2025
Spatial join to grid; proportion calculated; normalized to 0–1 scale; weighted at 15%
Exposure Proxy, Spatial Join
Heat Island
Air Pollution
“CLIMAT ILOT CHALEUR 4H00 P1 2020 – Analyse climatique 2020 - Ilot de chaleur nocturne 2020-2049” (CLIMAT_ ILOT_CHALEUR_4H00_ P1_2020). SITG, 2025. Raster-based thermal data; extracted to grid cells; normalized to 0–1; weighted at 35% Raster Normalization , Raster Calculator
“SPAIR IMMISSIONS
NO2 2023 – Pollution De L’Air - Immissions No2 2023” (SPAIR_ IMMISSIONS_ NO2_2023). SITG, 2023. Raster interpolation/ resampling; normalized to 0–1 scale; weighted at 25%
For air pollution, PM10 concentration values were used as an indicator of environmental health risk. Based on WHO guidelines, which recommend annual mean PM10 levels not exceeding 15 µg/m³ (WHO, 2021), areas below 10 µg/m³ were classified as low vulnerability, while those exceeding 20 µg/m³ were identified as highly vulnerable. These thresholds reflect meaningful differences in exposure that have been associated with increased cardiovascular and respiratory morbidity, particularly in urban contexts with limited air circulation.
Urban heat was assessed using a land surface temperature dataset, revealing intensified heat exposure in central Geneva. These hotspots align with densely built environments characterized by low vegetation and high impervious surface coverage, which amplify the urban heat island effect.
All indicators were normalized and weighted according to their relative contribution to environmental vulnerability—air pollution and heat each at 35%, and primary sector employment at 30%.
The vulnerability assessment for the City of Geneva was tailored to the urban context by refining the indicator set and spatial resolution. Given the negligible presence of agricultural employment within the city, the primary sector indicator used at the canton level was removed. As shown in Table 3, the revised analysis retained three indicators—proportion of population under 19, over 65, and air pollution— and introduced urban heat as a fourth factor to better reflect the dominant environmental stressors in dense urban areas. Urban heat was included due to its spatial heterogeneity and strong correlation with land surface characteristics such as vegetation cover and built density. Weightings were adjusted to reflect this shift in emphasis: air pollution and urban
heat were assigned higher weights (35% each), while the demographic indicators received lower weights (15% each), acknowledging that exposure factors play a more prominent role in shaping vulnerability at the intra-urban scale. A 50 × 50 meter grid was employed to capture granular spatial variation, allowing for detailed identification of localized vulnerability patterns at the block and neighborhood level.
The demographic analysis focused on populations under 19 and over 65 years of age, representing 36,452 and 33,696 individuals respectively, out of a total urban population of 207,650. The highest proportion of youth in indvidual grid cells reached 22%, while the elderly population peaked at 20%. After normalization, spatial patterns revealed higher age-based vulnerability in the west-north and east-south outskirts of the city, consistent with suburban residential zones. These areas tend to have limited access to urban services and reduced shading, increasing their exposure to environmental risks.
Air pollution was assessed using interpolated PM10 values, with a gradient reclassified into three vulnerability levels: below 15 µg/m³ (low), 15–25 µg/m³ (moderate), and above 25 µg/m³ (high). his range was selected based on World Health Organization (2021) air quality guidelines [2], which recommend an annual mean PM10 limit of 15 µg/m³ to prevent adverse health effects. The upper threshold of 25 µg/m³ reflects concentrations associated with increased risk of cardiovascular and respiratory morbidity in urban settings, particularly in areas with high traffic density [3]. Within Geneva, the spatial distribution of air pollution closely followed the city’s transportation infrastructure, indicating that vehicular emissions are a major driver of localized environmental vulnerability.
Urban heat was also integrated into the assessment using land surface temperature data, with the highest intensities recorded in the city center. These areas are characterized by dense building patterns, low vegetative cover, and extensive impervious surfaces, all of which contribute to the urban heat island effect. Combined, the spatial distributions of air pollution and urban heat demonstrate that environmental exposure in Geneva is not evenly distributed, but concentrated in areas with high human activity and limited ecological buffering.
Table 3. City vulnerability analysis criteria.
1 Elderly_ Age above 65 15 Highly sensitive group with significant health vulnerabilities to heat and pollution.
2 Young_ Age below 19 15 Sensitive due to developmental vulnerabilities, though generally more adaptable than elderly.
3 Heat Island 40
4 Air Pollution 30
Areas with high heat island effects directly increase vulnerability, significantly impacting health outcomes.
Direct impact on respiratory and cardiovascular health, substantially influencing vulnerability.
After assigning differentiated weights to each indicator based on their relevance at different spatial scales, a composite vulnerability map was generated for both the canton and the City
of Geneva. At the canton scale, the resulting spatial distribution shown in figure 1, highlights heightened vulnerability along the northeastern and northwestern peripheries of the canton, where environmental exposure (particularly air pollution and heat) overlaps with occupational risk from outdoor labor. Within the urban extent, core areas of Geneva also exhibited elevated vulnerability, primarily driven by the combined effects of high surface temperatures and trafficrelated air pollution.
At the city scale, the indicator set was refined to reflect the more densely built urban context. The primary sector was excluded, and urban heat was introduced, resulting in a four-indicator model with adjusted weights. This weighting scheme emphasizes the predominance of environmental stressors in shaping intra-urban vulnerability. Using a 50 × 50 meter grid, the city-scale composite map reveals that the highest vulnerability is concentrated in the central urban corridor, where heat and pollution intensities are greatest(fig. 2). However, increased demographic vulnerability is observed in peripheral residential zones, particularly in the west-north and east-south edges, where higher proportions of age-sensitive populations are located.
Together, the canton- and city-scale analyses demonstrate that vulnerability in Geneva is spatially differentiated: the urban core is primarily shaped by environmental exposure, while the outskirts reflect socio-demographic sensitivity. These findings underscore the need for multiscalar, site-specific planning strategies that can effectively address the distinct but overlapping dimensions of urban vulnerability.
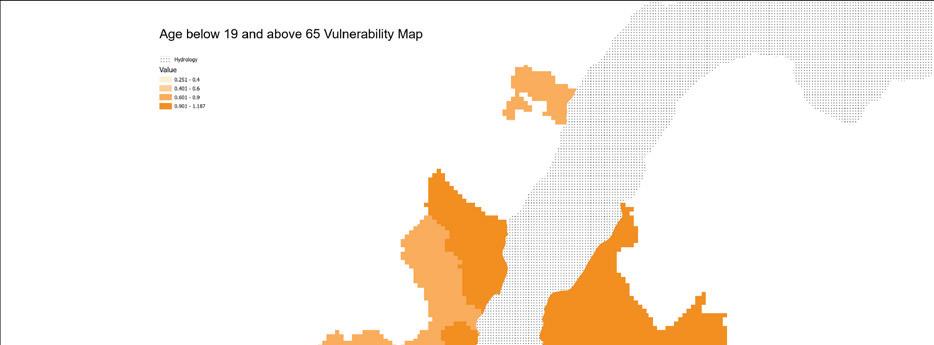

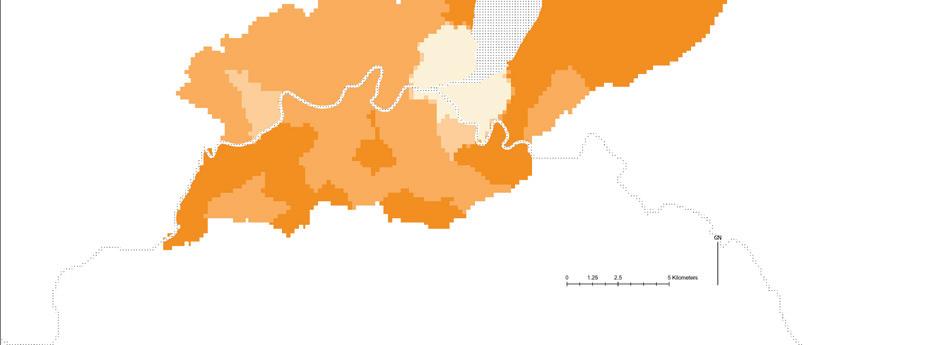
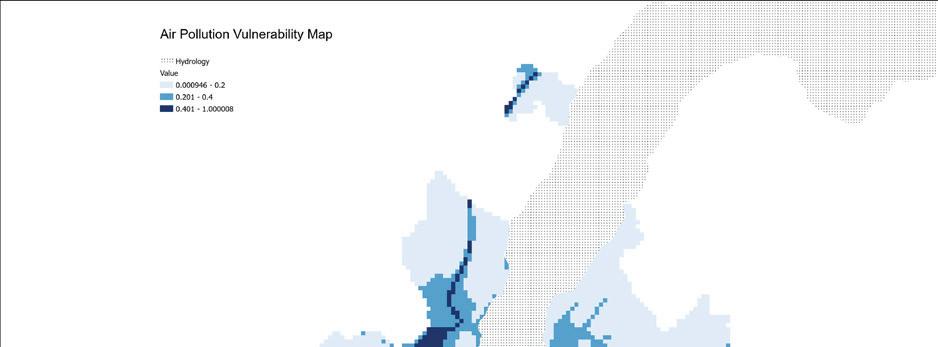
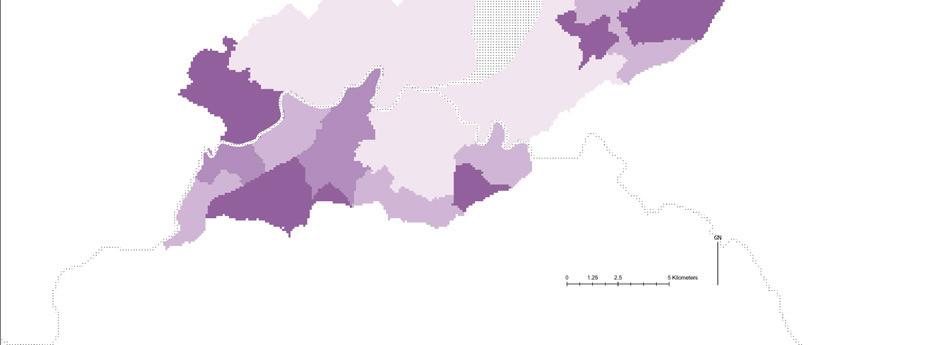
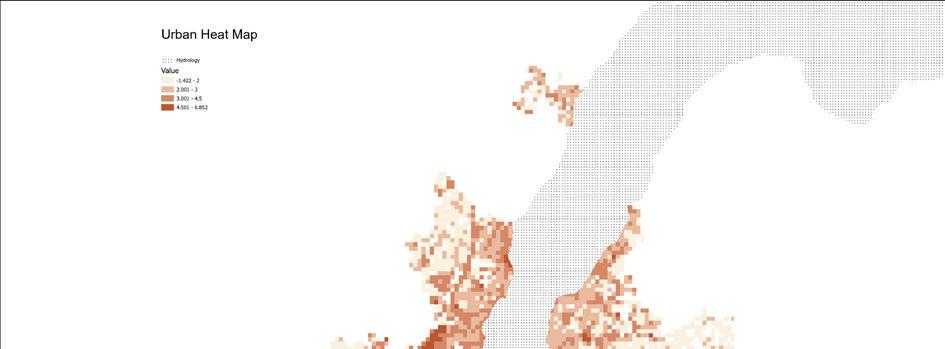
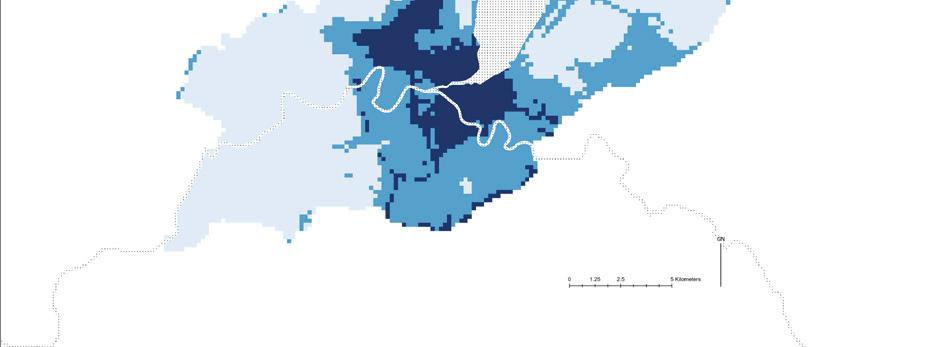
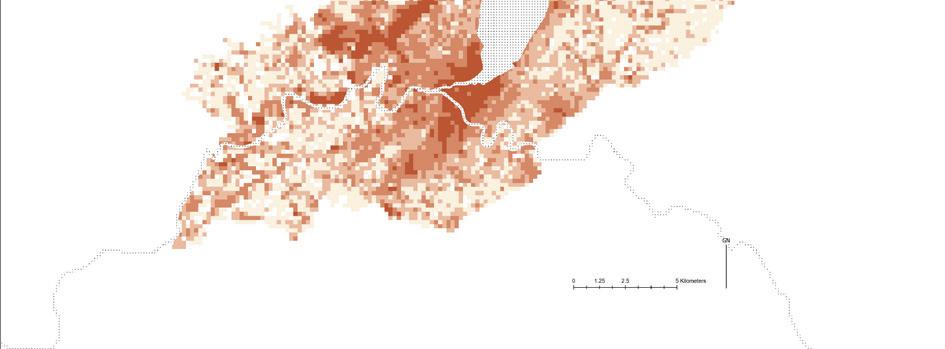
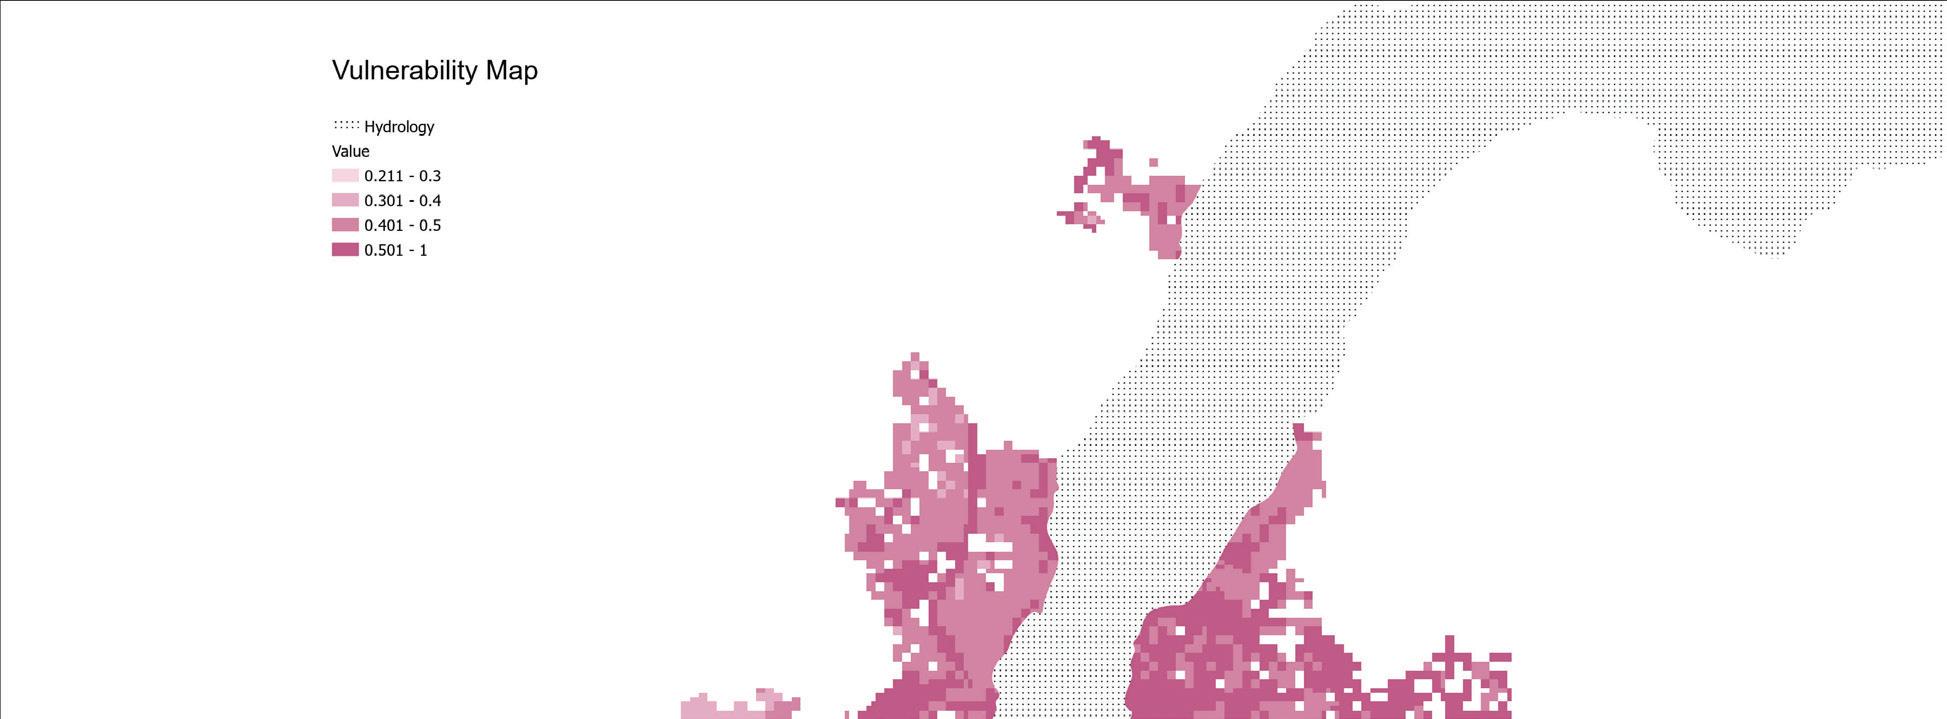
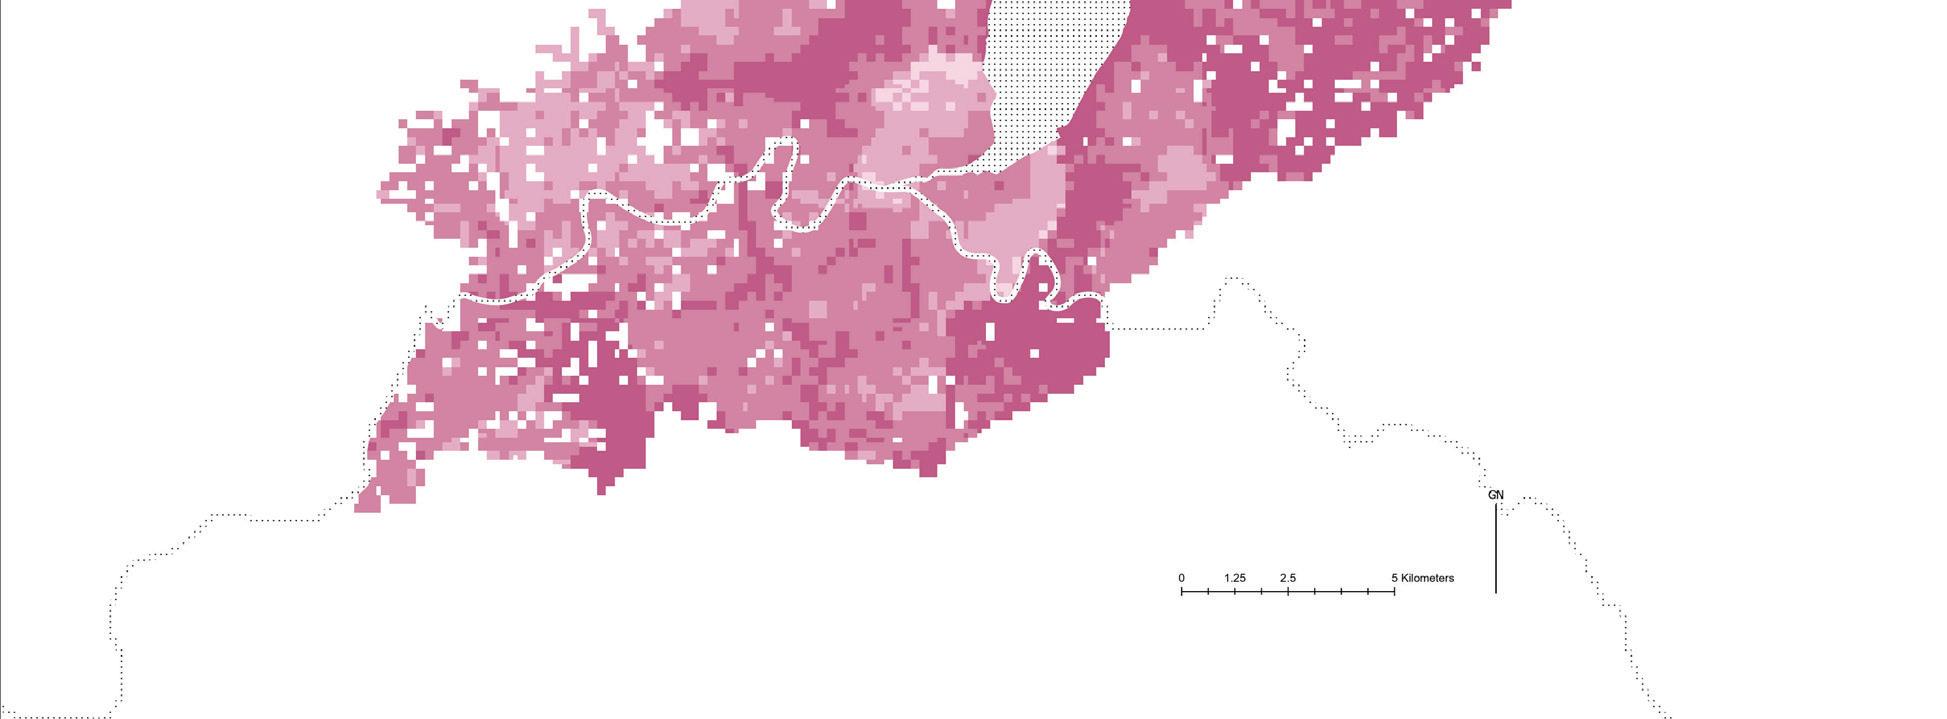
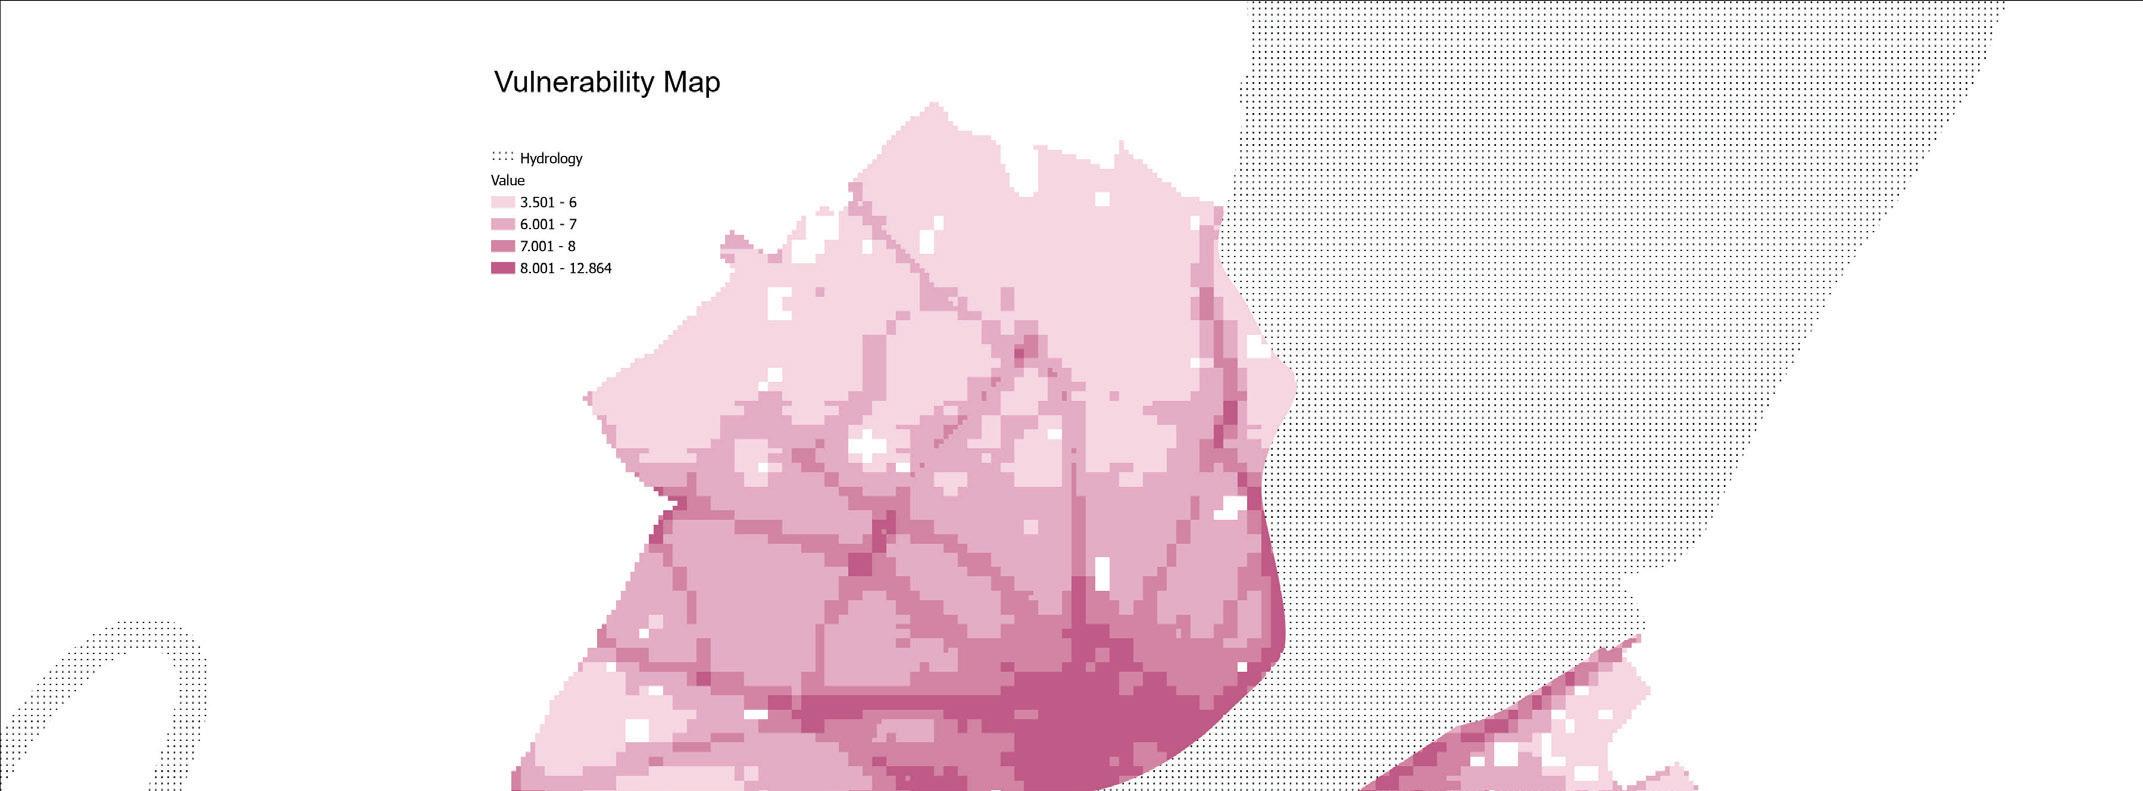
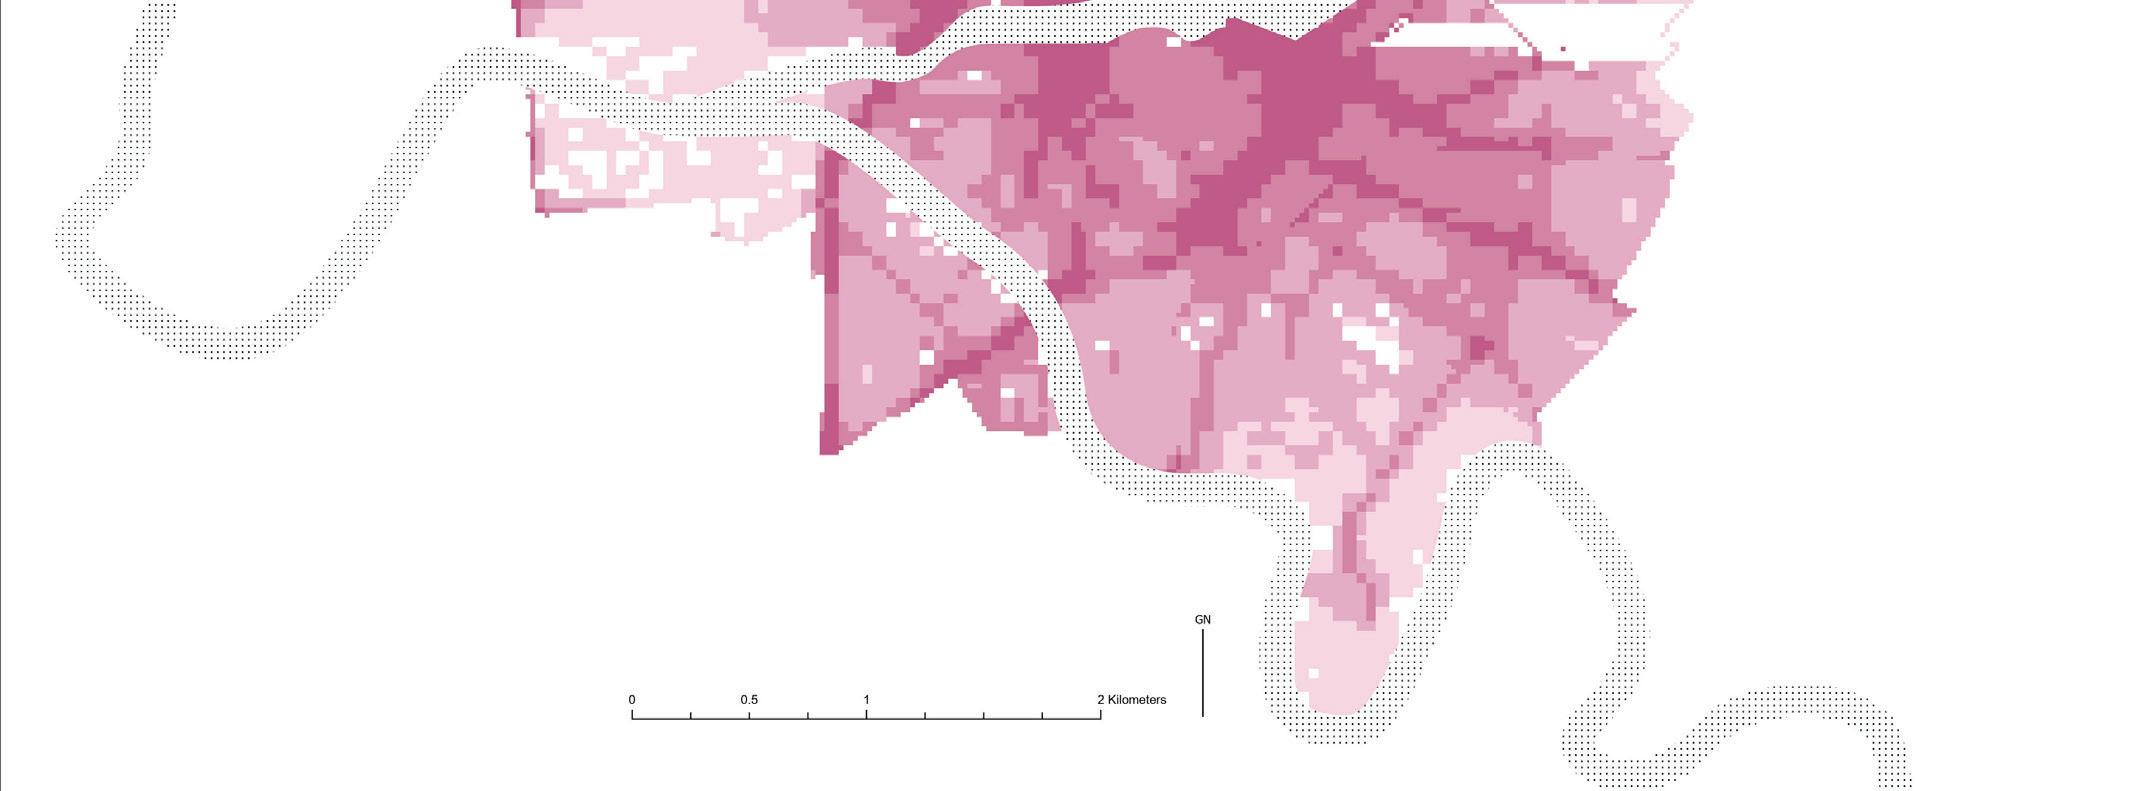
To evaluate shading conditions and identify areas with the greatest need for canopy interventions, existing tree cover was assessed across both the canton and the city of Geneva. Canopy cover was calculated as the percentage of tree coverage within each 200-meter grid cell at the canton scale and 50-meter grid cell in the city, using high-resolution aerial imagery and urban tree inventory data. This cell-based spatial framework enabled consistent quantification of shading conditions across heterogeneous urban and peri-urban landscapes.
The percentage of canopy cover within each grid cell was classified into three relative ranges: below 30%, 30–60%, and 60–90%. These breakpoints were not based on absolute ecological targets, but rather designed to reflect the observed distribution of canopy cover within the study area. The <30% class represents cells with limited shading potential, often corresponding to impervious or sparsely vegetated surfaces. The 30–60% category identifies cells with moderate canopy presence,
typically characterized by fragmented or partially vegetated urban landscapes. The >60% class includes cells with relatively high canopy density, generally associated with parks, institutional grounds, or well-established residential vegetation. This relative classification facilitates the identification of spatial disparities in canopy distribution without assuming that a fixed threshold universally defines adequate coverage at the cell scale.
To assess shading needs, a canopy cover priority map was created by normalizing and inverting the percentage values to express relative canopy deficiency. The inverted values were grouped into four ranges—0–0.01, 0.01–0.1, 0.1–0.3, and 0.3–1—based on the statistical distribution of normalized scores.
These classes distinguish areas with minimal shading needs from those with acute deficits. The 0.3–1 class identifies grid cells with low or no canopy cover, representing the highest priority for shading interventions.

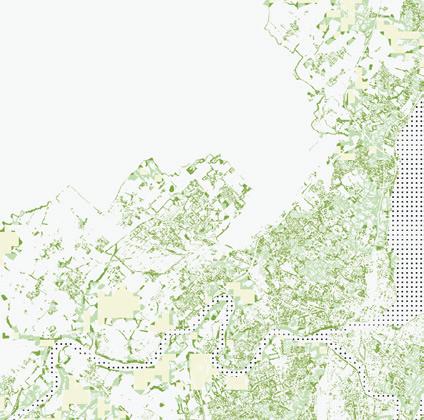
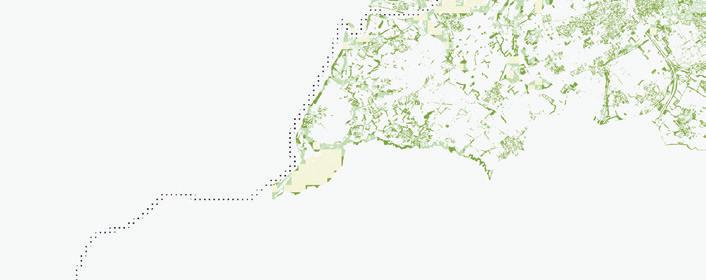
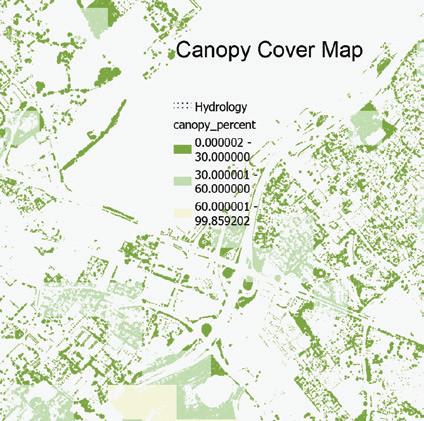
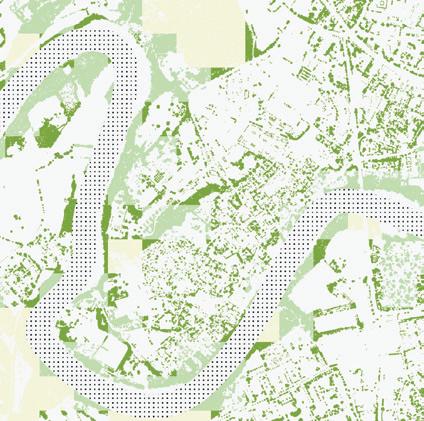

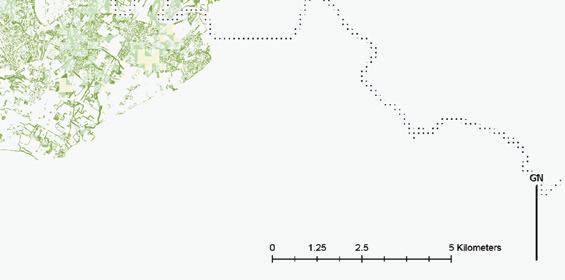
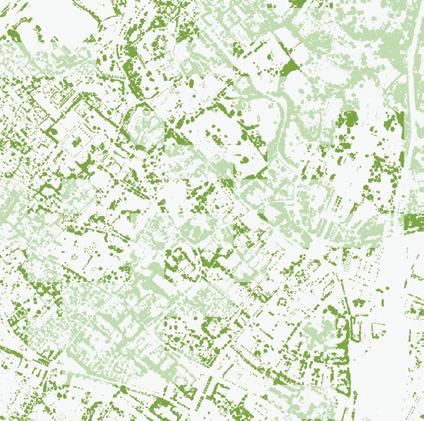
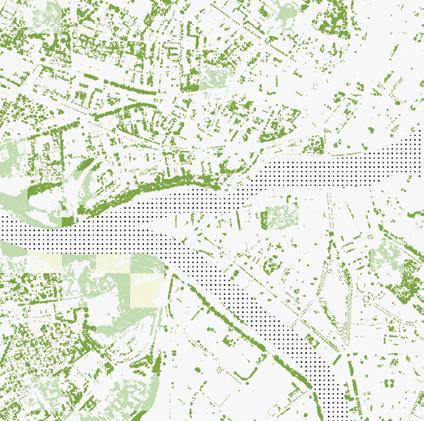
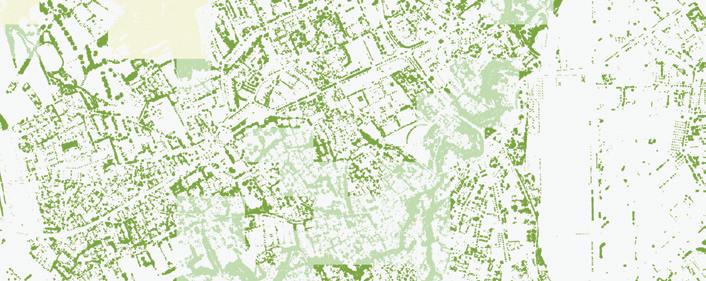

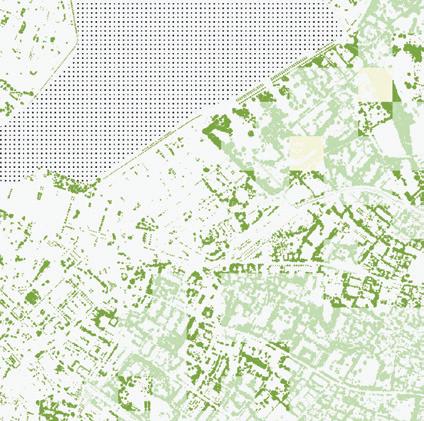
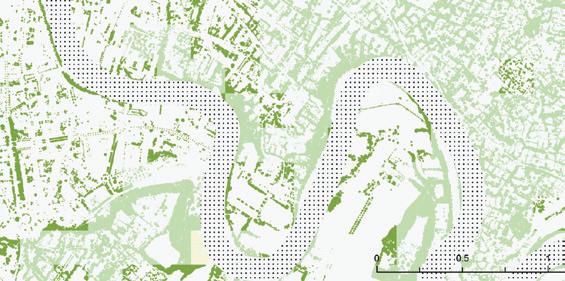


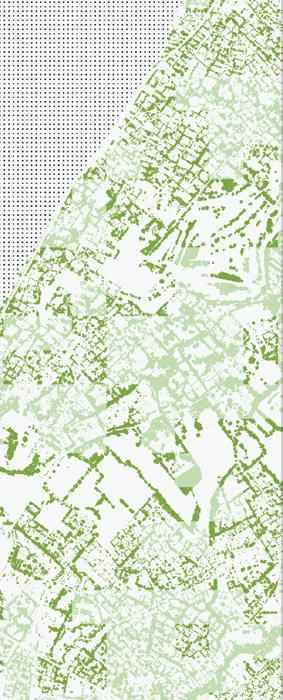
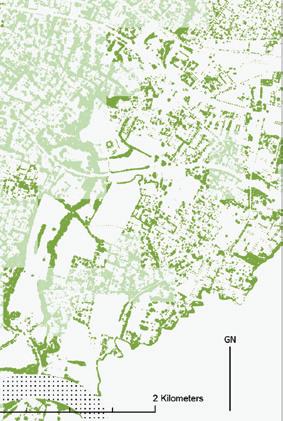


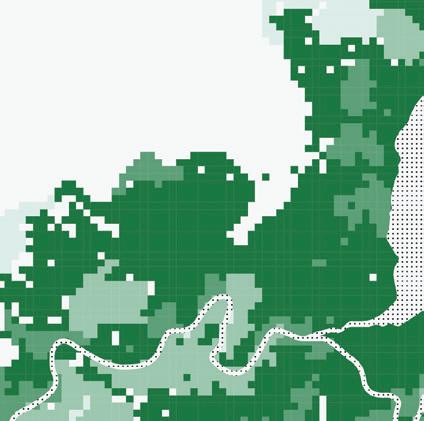
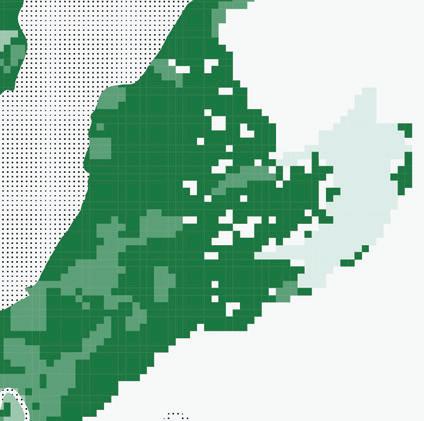

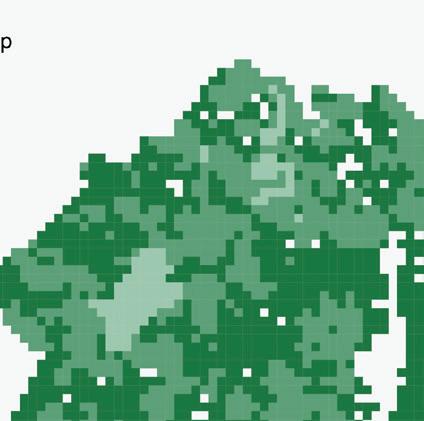
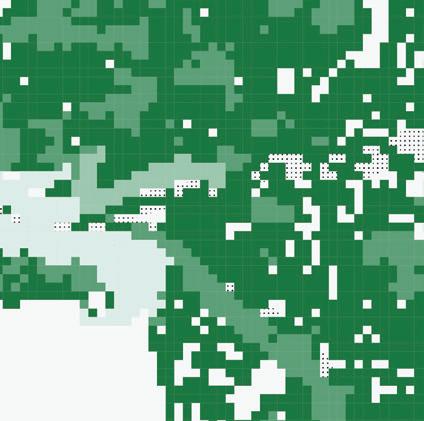


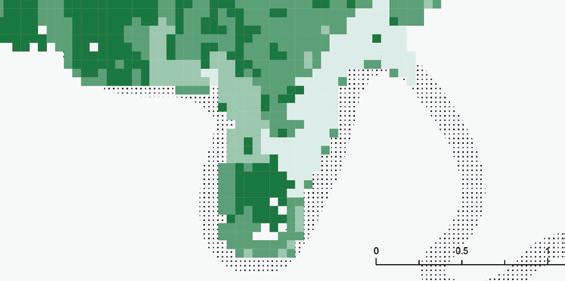


To support spatially targeted climate adaptation planning, the vulnerability map and canopy cover priority map were integrated to identify areas where shading interventions are most urgently needed. The objective was to combine two complementary dimensions of spatial risk: (1) vulnerability, reflecting demographic sensitivity and environmental exposure, and (2) shading deficiency, expressed through inverted canopy cover values. Together, these layers provide a composite representation of both the need for protection and the absence of existing ecological infrastructure.
Each map was first normalized to a 0–1 scale to ensure comparability, maintaining consistency with the processing steps used in earlier analyses. Equal weighting—50% for vulnerability and 50% for canopy deficiency —was applied to emphasize the dual importance of socialenvironmental vulnerability and ecological scarcity in shaping intervention priorities. This weighting scheme avoids overemphasizing either demographic need or biophysical exposure and supports a balanced decisionmaking framework. The resulting planning priority index was calculated using raster overlay techniques in a GIS environment, producing a continuous surface where higher values indicate areas of both high vulnerability and low canopy cover.
The final composite planning priority map reveals distinct spatial patterns across both the canton and the City of Geneva. At the canton scale, high-priority areas are concentrated along the northeastern and northwestern peripheries, where elevated vulnerability—driven by outdoor employment and sensitive age groups— coincides with sparse canopy cover. These areas typically comprise agricultural or recently developed residential zones with limited green infrastructure and increased exposure to environmental stressors.
Within the city, the highest-priority areas are found in central urban corridors, where air pollution and surface heat intensity converge with low levels of existing vegetation. These zones are characterized by high building density, limited open space, and proximity to major transport infrastructure. In contrast, institutional grounds and park-adjacent neighborhoods—where canopy cover is higher— tend to display lower priority scores, despite moderate levels of demographic sensitivity.

Below 30% Canopy Cover
Below 15% Canopy Cover
Below 40% Canopy Cover
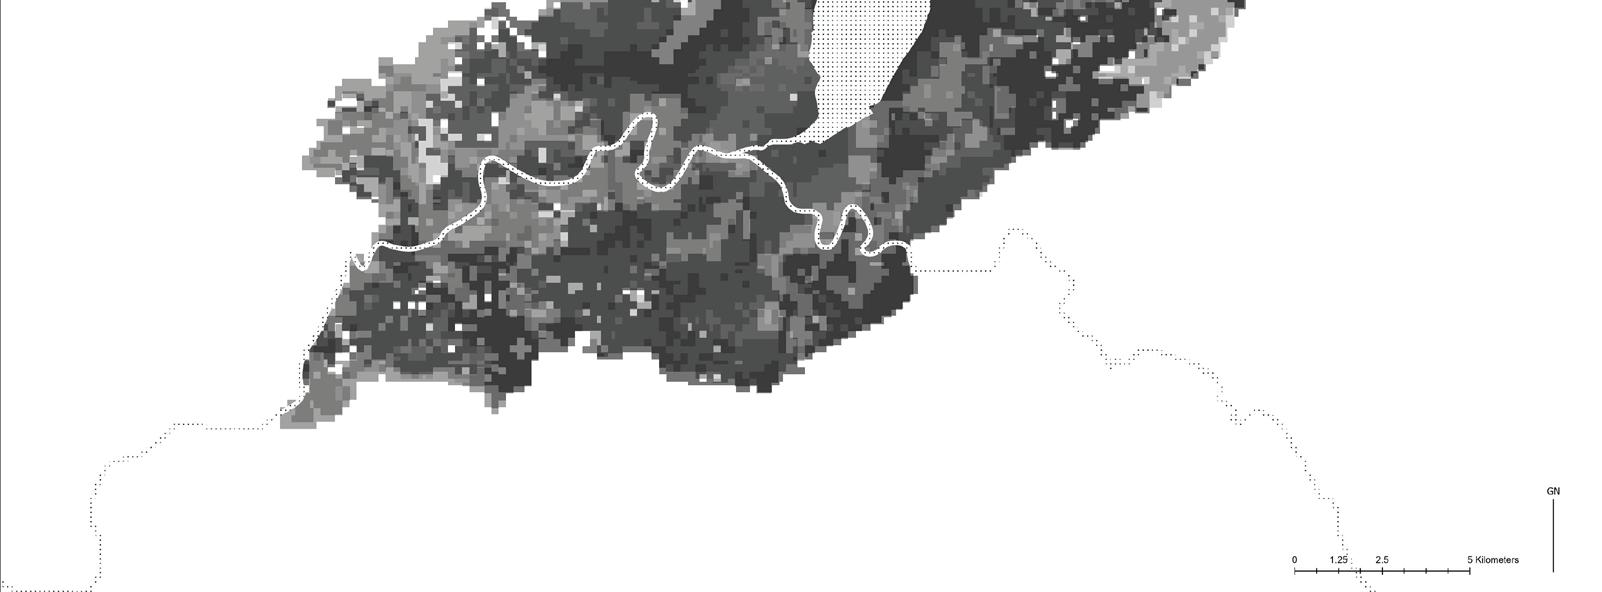
Below 60% Canopy Cover
Below 30% Canopy Cover
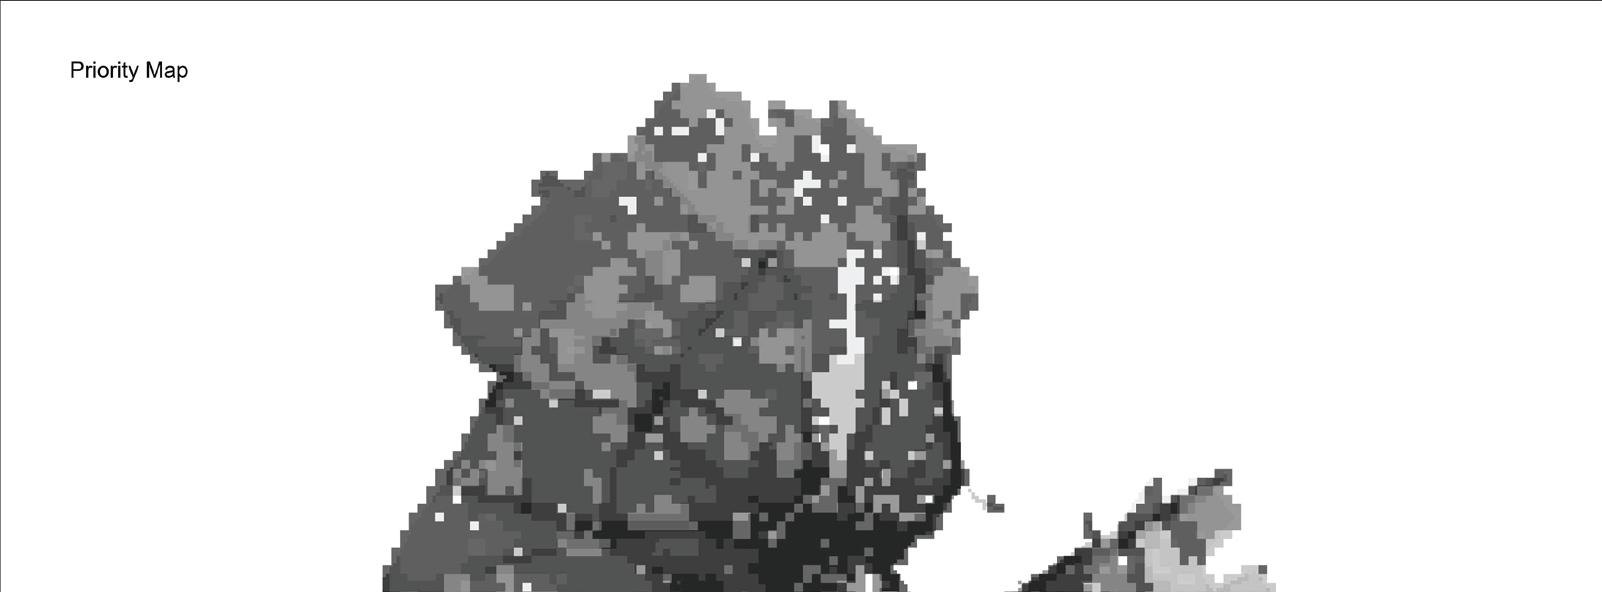
Below 15% Canopy Cover
Below 20% Canopy Cover
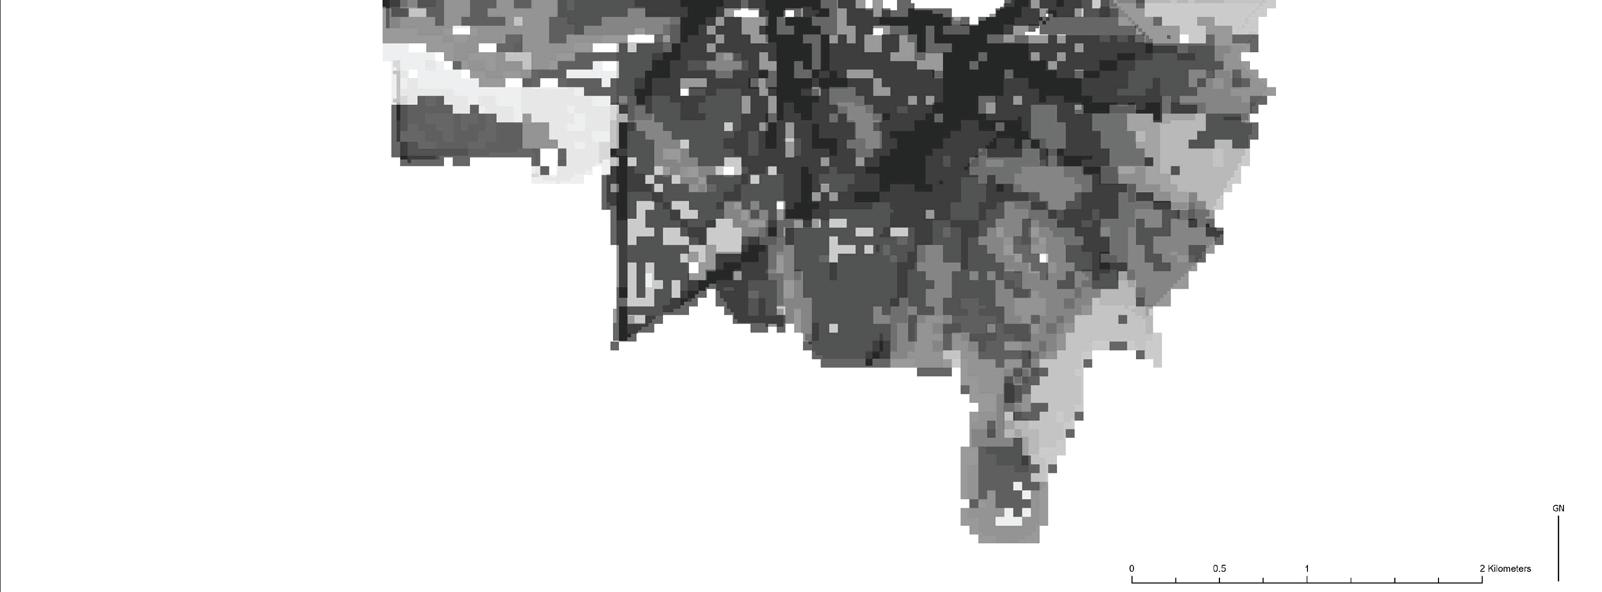
Below 15% Canopy Cover
The spatial patterns revealed by the composite planning priority maps indicate that the highest-need areas for shading interventions are concentrated in dense urban neighborhoods and along the city’s primary transportation corridors. These zones exhibit a co-occurrence of high demographic and environmental vulnerability with minimal existing canopy cover. However, the physical and spatial constraints of these areas—such as limited open space, high impervious surface coverage, and built-form intensity—pose significant barriers to implementing traditional large-scale urban greening strategies. As a result, a shift toward small-scale, context-sensitive interventions is essential for addressing localized vulnerabilities while working within the morphological limits of the urban fabric.
To respond effectively to these constraints, the application of urban acupuncture principles— targeted, small-scale interventions with systemic impact—is recommended. A range of sitespecific greening strategies can be deployed to increase shading and cooling capacity in high-priority zones. Pocket parks offer the opportunity to convert underutilized parcels into shaded microclimates, particularly in residential blocks lacking access to public green space. Street tree planting along sidewalks and transit corridors can improve thermal comfort and air quality, especially in areas where high vulnerability aligns with major road networks [4]. For sites where ground space is unavailable, vertical greening systems such as green roofs and green walls can introduce vegetative cooling while minimizing spatial intrusion.
In locations requiring immediate shading with minimal ground disruption, modular shading structures integrated with vegetation, such as pergolas or vine-covered frameworks, provide flexible and scalable solutions. Furthermore, the enhancement of cooling corridors—linear routes with continuous canopy cover— can facilitate comfortable pedestrian mobility across neighborhoods and improve connectivity between high-vulnerability areas and key services. Finally, community-based greening programs can play a critical role in sustaining interventions, particularly in residential areas where municipal access is limited. Residentled planting and maintenance efforts foster stewardship and enable long-term ecological and social benefits in high-need areas [5].
The implementation of these interventions should be guided by a clear set of spatial and equity-based criteria derived from the planning priority analysis. First, areas with both high vulnerability and low canopy coverage should be prioritized, as these zones represent the greatest combined exposure and service deficit. Second, the needs of sensitive population groups—specifically the elderly and children—must be addressed by ensuring proximity and accessibility to shaded areas and green infrastructure. Third, integration with public transportation networks should be emphasized, given the observed alignment of vulnerability with transit corridors and mobility nodes. Greening efforts along these routes can simultaneously address environmental exposure and enhance the thermal comfort of active transport users.
Li
This study developed a spatially explicit framework for identifying priority areas for shading interventions in Geneva by integrating demographic and environmental vulnerability indicators with existing canopy cover data. Using a grid-based analysis at both canton and city scales, the research revealed that vulnerability is spatially differentiated—environmental exposure is concentrated in central urban areas, while demographic sensitivity is more pronounced along the periphery. The resulting composite planning priority map highlights where nature-based interventions, such as street tree planting, pocket parks, and cooling corridors, can be most effectively targeted. Given the spatial constraints of dense urban zones, the findings support a shift toward small-scale, adaptive greening strategies that prioritize high-need areas, improve thermal comfort, and enhance climate resilience for vulnerable populations.
References
1 Voelkel, Jackson, and Vivek Shandas. 2017. “Towards Systematic Prediction of Urban Heat Islands: Grounding Measurements, Assessing Modeling Techniques.” Climate 5 (2): 41.
2 World Health Organization (WHO). (2021). WHO Global Air Quality Guidelines: Particulate Matter (PM2.5 and PM10), Ozone, Nitrogen Dioxide, Sulfur Dioxide and Carbon Monoxide.
3 Brunekreef, B., & Holgate, S. T. (2002). Air pollution and health. The Lancet, 360(9341), 1233–1242.
4 Salmond, J. A., Tadaki, M., Vardoulakis, S., Arbuthnott, K., Coutts, A., Demuzere, M., ... & Wheeler, B. W. (2016). Health and climate related ecosystem services provided by street trees in the urban environment. Environmental Health, 15(S1), S36. https://doi. org/10.1186/s12940-016-0103-6
5 Gill, S. E., Handley, J. F., Ennos, A. R., & Pauleit, S. (2007). Adapting cities for climate change: The role of the green infrastructure. Built Environment, 33(1), 115–133.
6 “Galeria De Pocket Parks: Respiros Urbanos Em Pequena Escala - 1.” n.d. ArchDaily Brasil. https://www.archdaily.com. br/br/956639/pocket-parks-respiros-urbanos-em-pequena-escala/60218f87f91c81f8ad000066-pocket-parks-respiros-urbanos-em-pequena-escala-imagem.
7 “10 Impressive Green Roofs and Walls From Around the World.” 2023. Green Grace Land. June 8, 2023. https://greengraceland. wordpress.com/2023/06/08/10-impressive-green-roofs-andwalls-from-around-the-world/.






Strategies for Expanding Geneva’s Urban Forest


Nina Zhao





Master in Landscape Architecture (MLA) Candidate
Harvard Graduate School of Design



The Geneva Urban Area Arborization Strategy (SAG) sets an ambitious long-term objective: increase average tree canopy cover from 23% to 30% by 2070, while ensuring that no neighborhood falls below a 10% minimum. Trees are recognized not only as natural heritage but as vital infrastructure for urban cooling, biodiversity, and everyday well-being. Achieving this canopy goal, however, requires more than a numerical target. It demands strategic, spatially informed action that accounts for the realities of land use, ownership, and local capacity.
This report analyzes Geneva’s canopy expansion potential by cross-referencing land ownership and surface typologies using GIS data from Système d’information du territoire à Genève (SITG). Instead of treating the 30% goal as uniformly applicable, the analysis reframes the question: what is a realistic and meaningful canopy target for each type of urban surface and who must act to achieve it? The study illustrates this approach through example typologies such as sidewalks, parking lots, and gardens to contextualize where and how action might occur. These cases highlight the constraints and opportunities specific to each category, while underscoring that further spatial analysis and site-specific design will be essential for operationalizing the strategy at scale. Ultimately, the report advocates for a differentiated, actor-aligned approach to urban forestry implementation in Geneva.
This study applies a spatially grounded analysis to assess Geneva’s urban canopy expansion potential and identify the governance structures responsible for implementation. It draws on high-resolution data from the Système d’information du territoire à Genève (SITG), including data for parcel-level land ownership, land use and surface classifications, and for existing (2023) tree canopy coverage.
These datasets were processed using ArcGIS Pro to intersect ownership, surface condition, and canopy extent. By adopting the typology categorization from Carte OTEMO, consisting: (1) green areas (e.g., gardens, meadows), (2) hardscapes (e.g., sidewalks, islets), (3) wooded areas, and (4) no vegetation zones, each category was evaluated based on its planting status - planted, not planted, or plantable - with plantable surfaces representing the key opportunities for canopy growth.
The typology was intersected with parcel-level ownership data to determine where canopy could expand and who holds authority and responsibility for that expansion. This framework helped reframe the 30% canopy goal through the dual lens of spatial feasibility and governance alignment.
Rather than generalizing findings across categories, the study adopts a zoom-in strategy, highlighting representative examples within each surface type—such as a sidewalk corridor, a parking lot, and a public park. These vignettes contextualize the complexity of planting interventions and illustrate the spatial and infrastructural limitations that shape what is realistically achievable in each setting. They also demonstrate the importance of moving beyond fixed numerical targets toward typologysensitive, actor-specific strategies.
As a result, two planting scenarios were developed to explore these trade-offs. One prioritizes canopy gains in green areas, particularly on private land, aiming for over 70% coverage where feasible. The other focuses on expanding tree cover in constrained urban surfaces—such as sidewalks and construction zones—where visibility and public benefit are high, but space and soil conditions are limited. Together, these strategies

Where to act and whom to act with
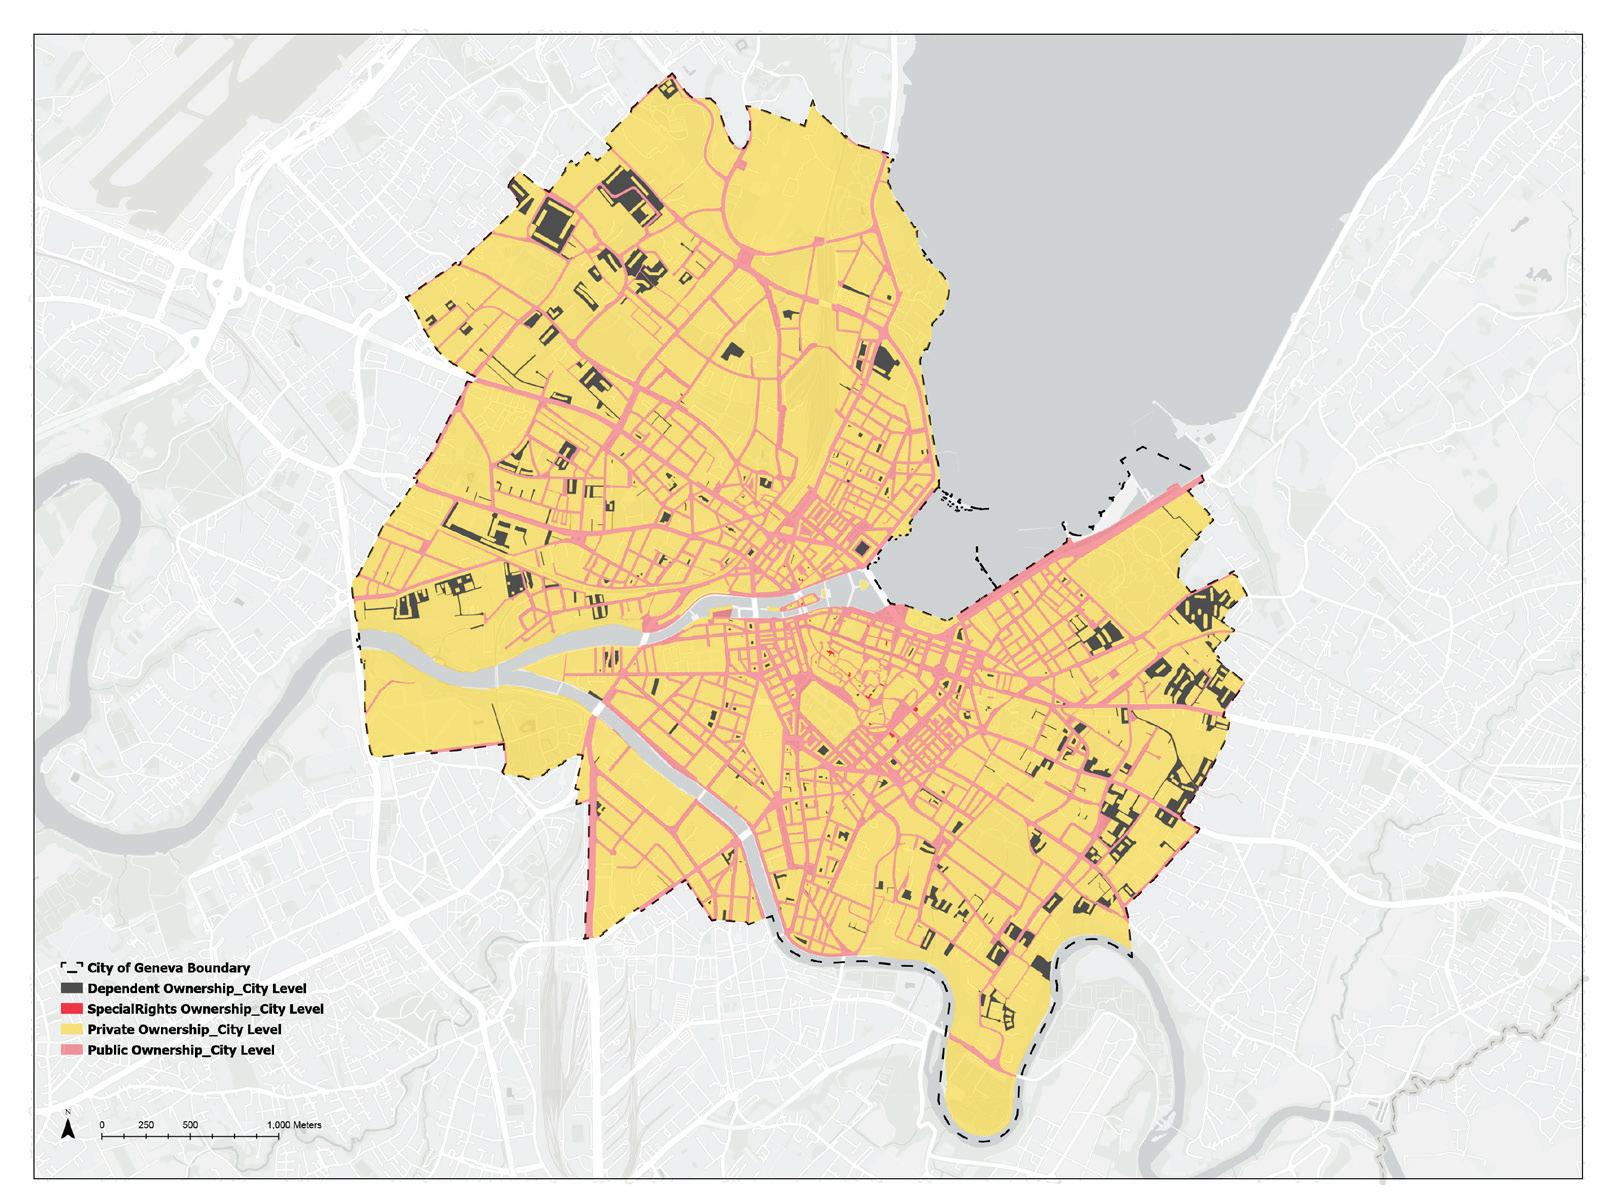

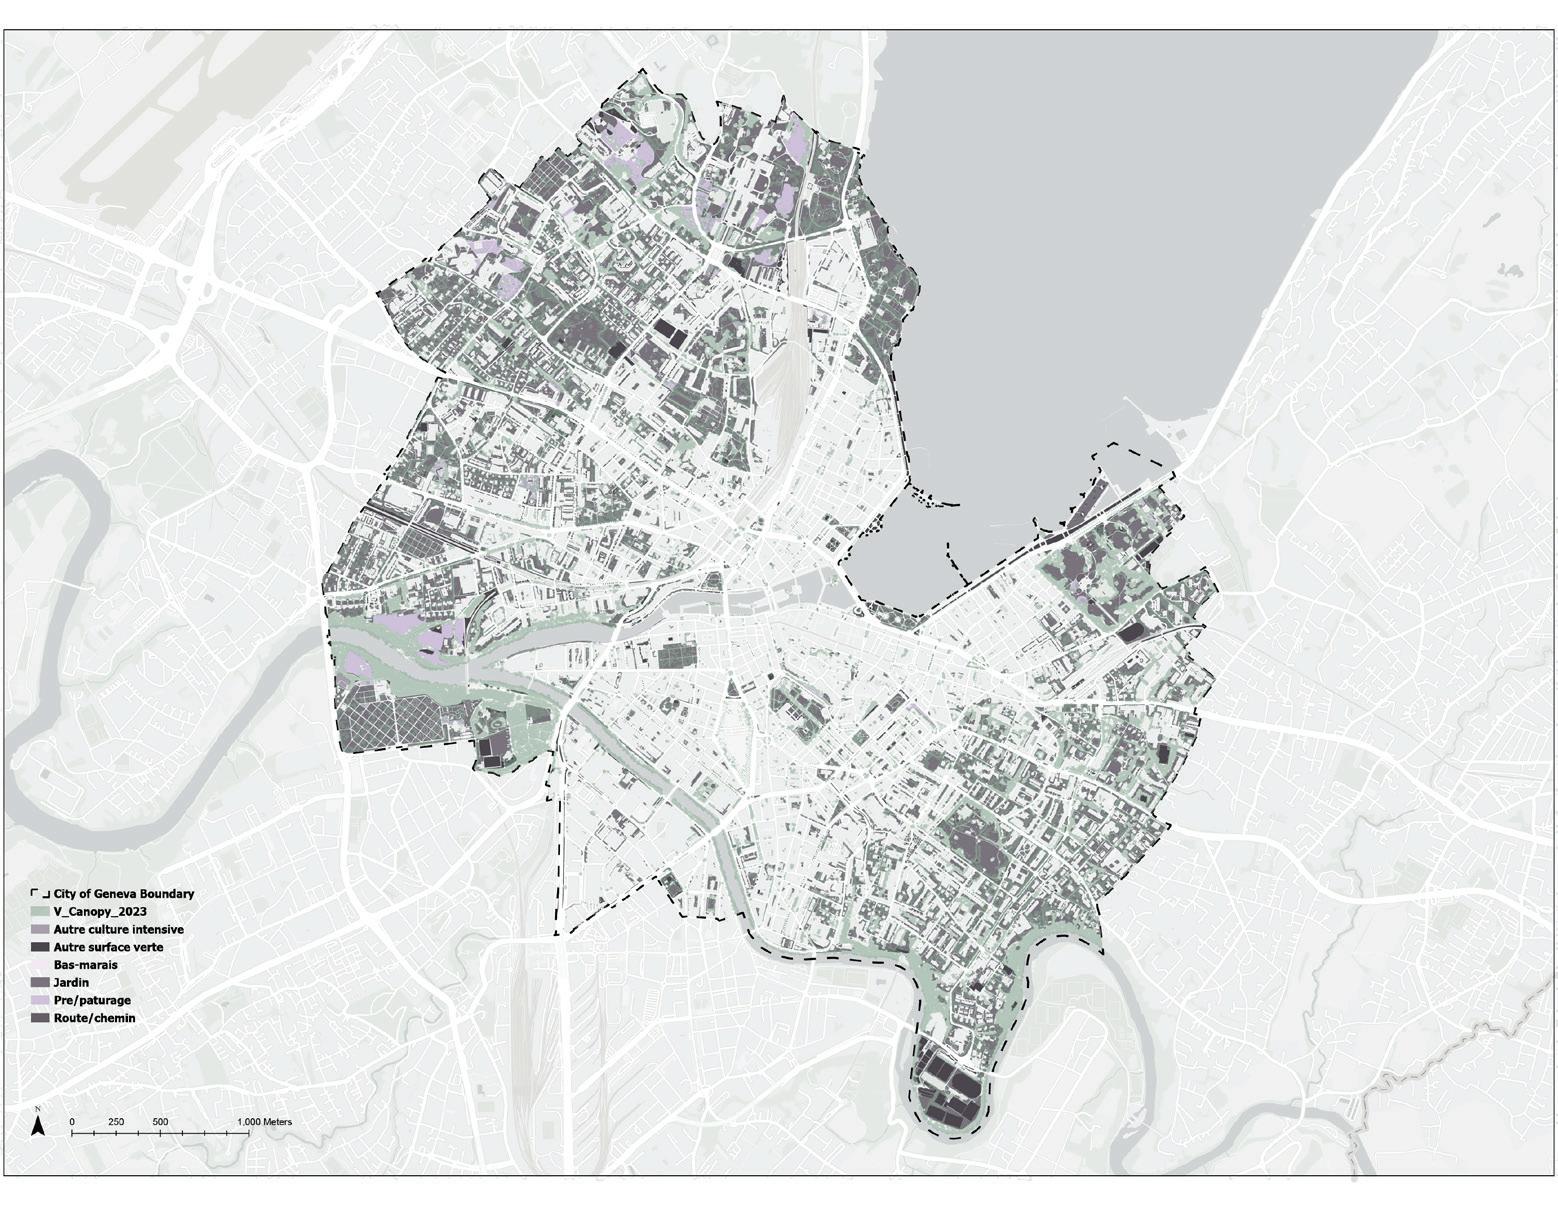
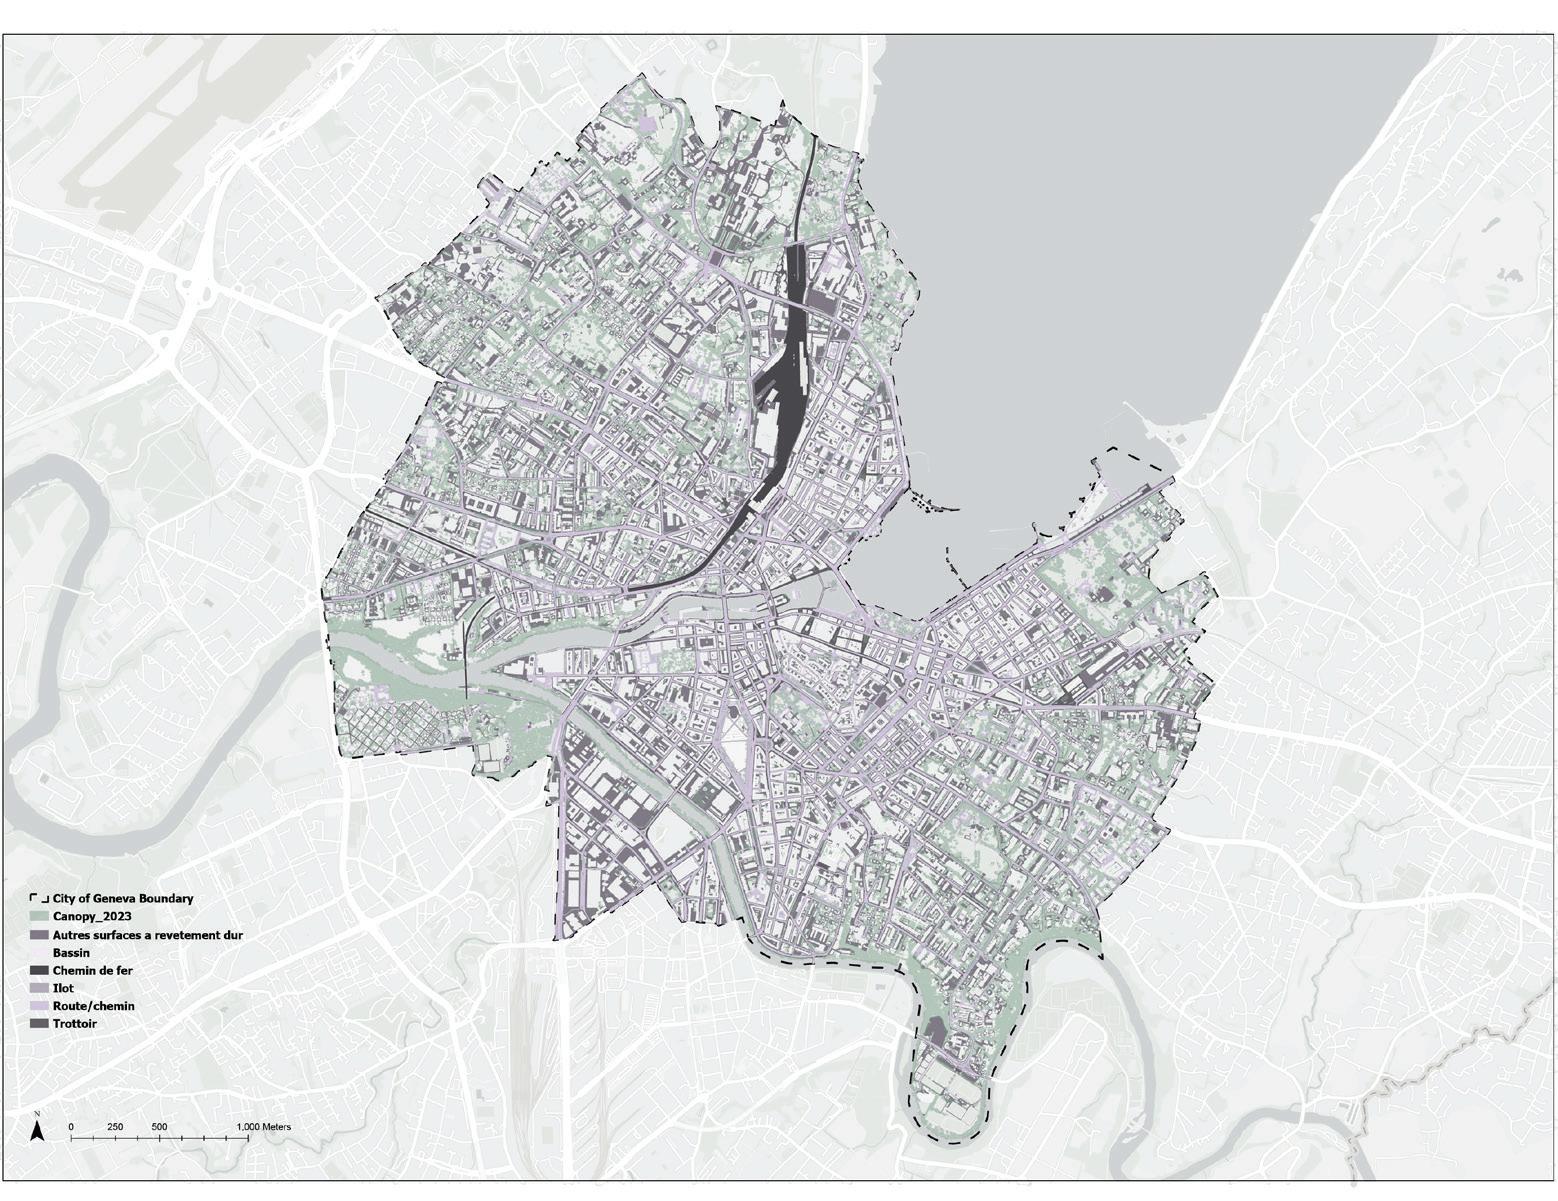
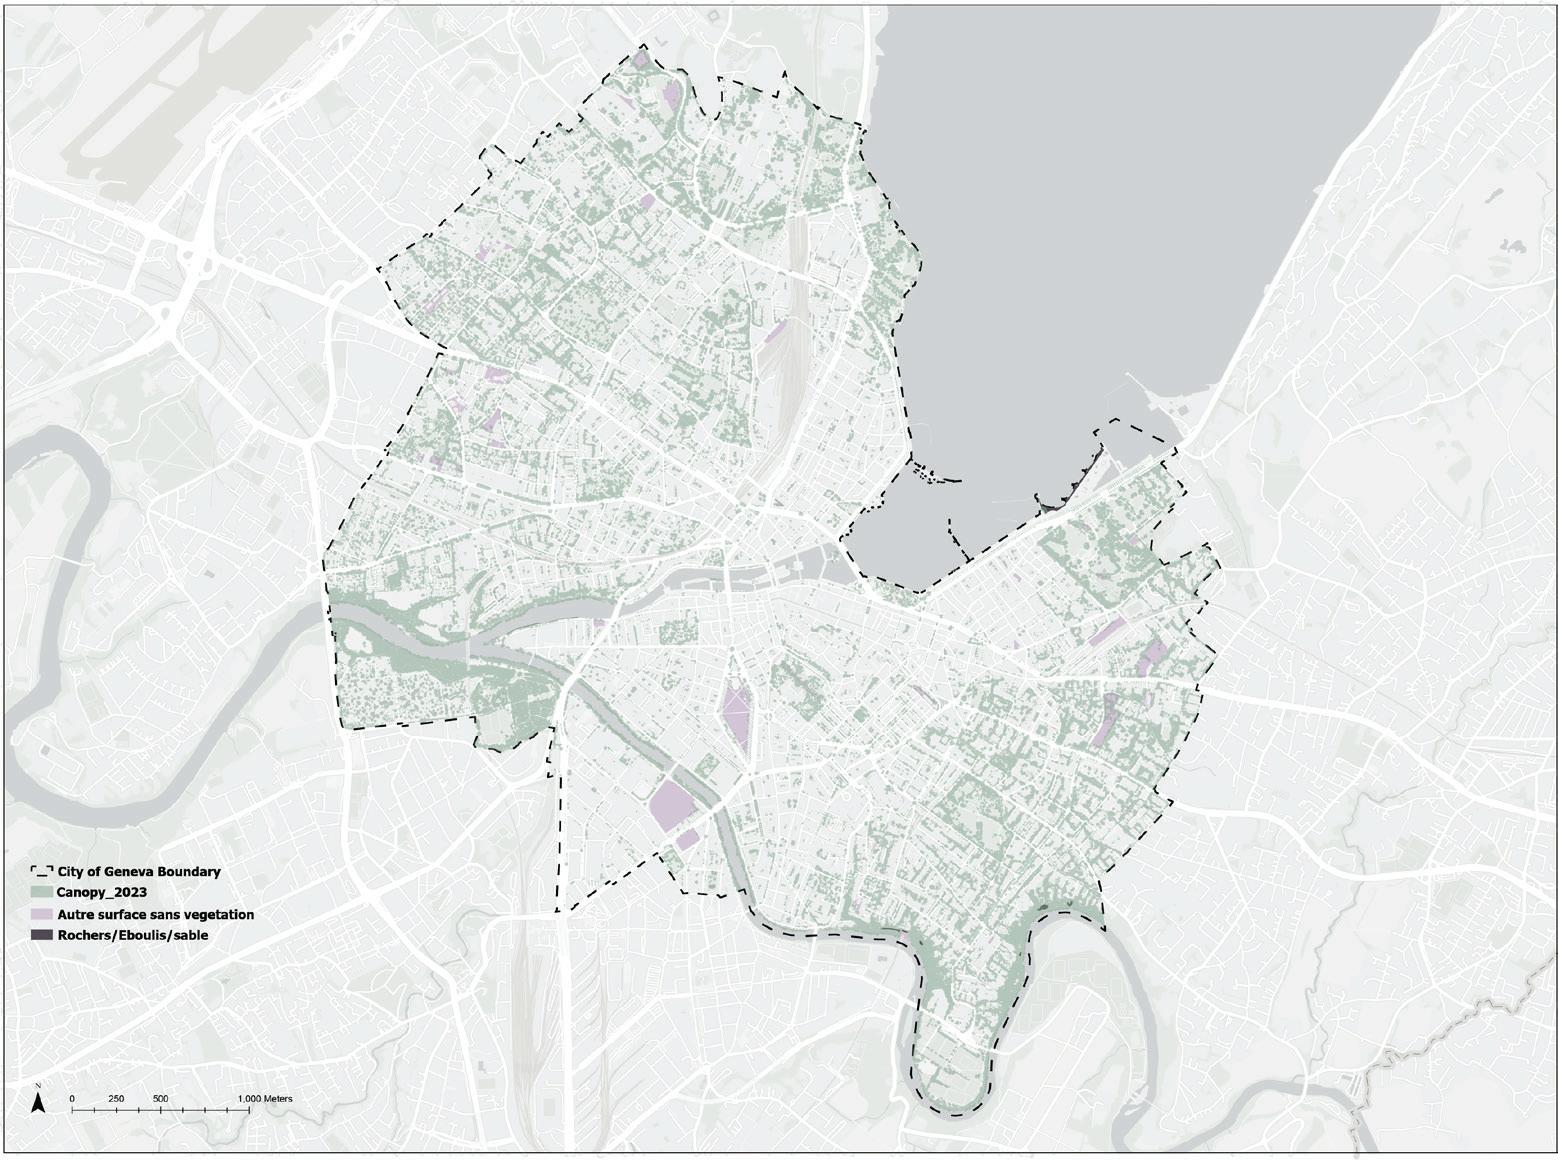
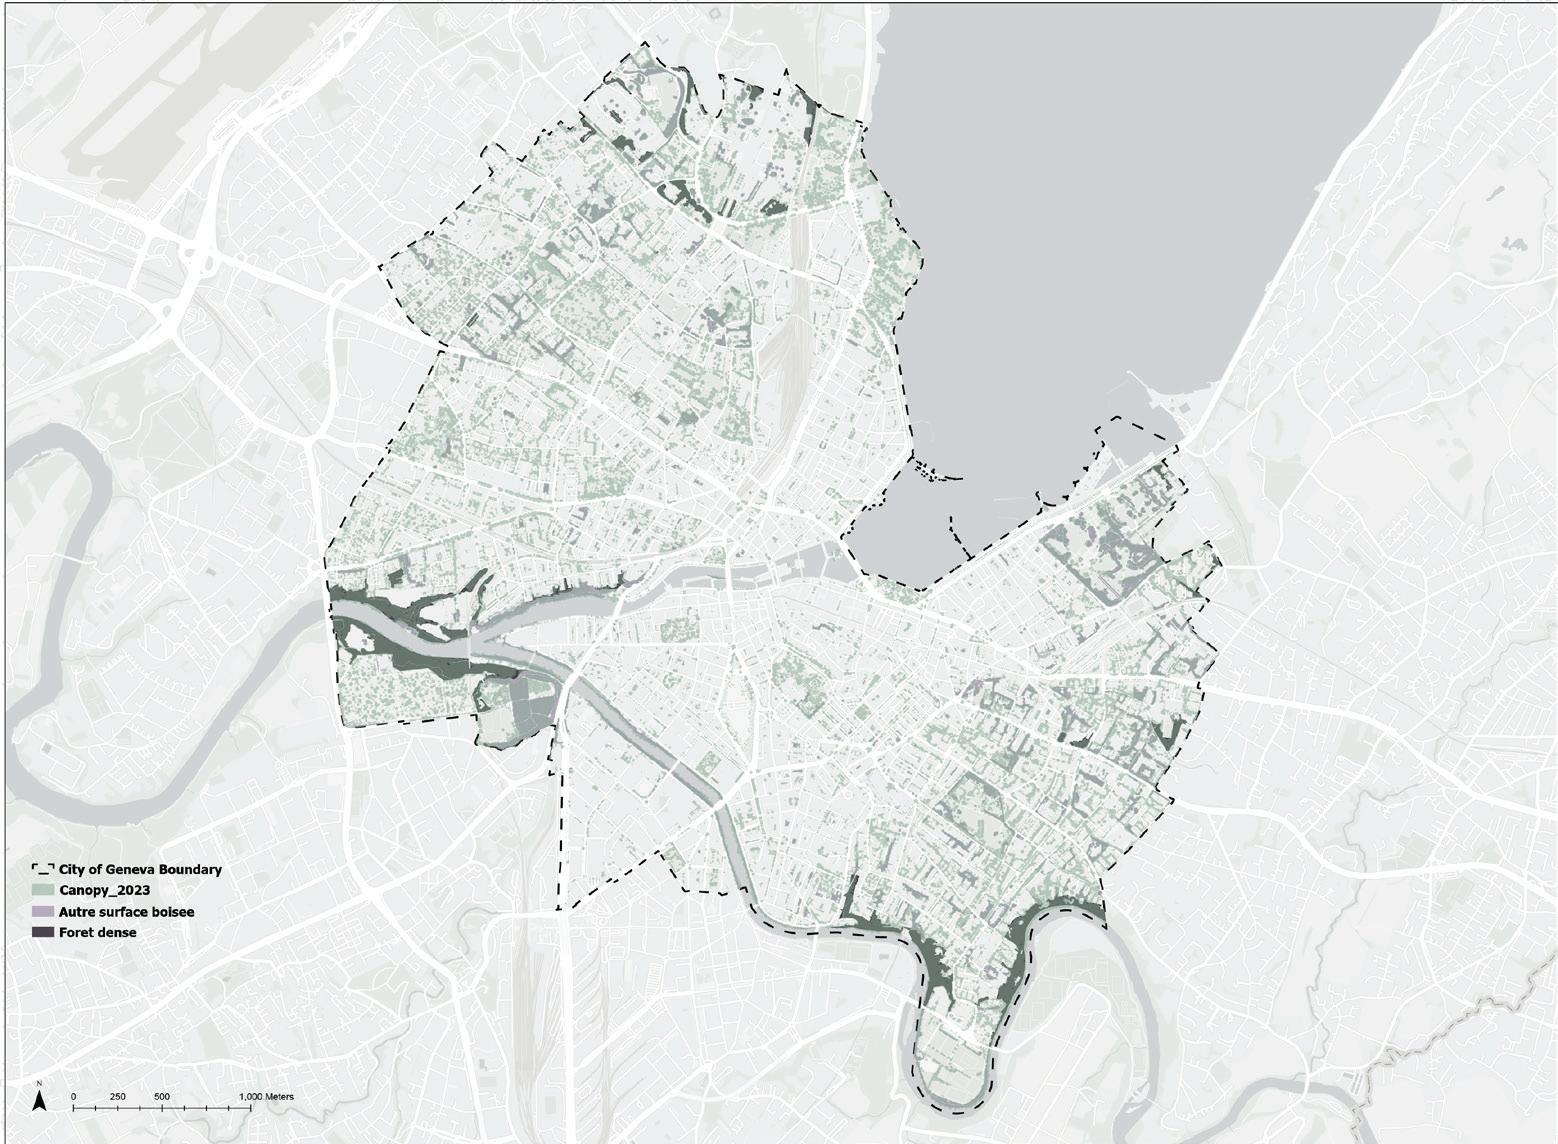
Above: Subcategories of “unvegitated” land surface cover. Below: Subcategories of “wooded area” land surface cover.
1. Gardens and Meadows Represent the Largest Canopy Expansion Potential but Rely on Private Landowners’ Actions and Contextual Sensitivity
The analysis reveals that gardens and meadows account for nearly 90% of Geneva’s green areas, making them the most significant surface category for future canopy expansion. These zones often feature low existing canopy but high plantability, particularly in residential and peri-urban areas. Their soft surfaces, minimal infrastructure conflict, and spatial continuity make them ecologically suitable for tree growth. From a biophysical standpoint, these spaces represent a high-potential area for targeted canopy intervention.
However, this apparent opportunity must be interpreted with care. Many of these open green spaces, particularly lawns and sports fields, are intentionally left unplanted. Whether for aesthetic, recreational, or historical reasons, the absence of trees is not always an oversight. In many cases, open lawns may support community uses, from local events to informal play. Tree planting in such spaces could unintentionally displace valued activities or compromise visibility, safety, or historical design intent. As such, canopy expansion must be balanced with the spatial logic and social role of open space.
Compounding this complexity is the issue of land control: the majority of these green surfaces lie on private or dependent parcels (private landowners hold 72.25% of total city land). This means that even where planting is technically feasible, the decision to act lies outside the city’s direct authority. Increasing canopy in gardens and meadows is not merely a planting exercise but a process that requires fine-grained spatial analysis, design sensitivity, and community engagement. Unlocking their potential will depend on tailored governance strategies, ranging from incentives and guidelines to participatory planning and regulatory tools.
Compared to Geneva’s extensive green areas, the total area of plantable hard surfaces, including sidewalks, islets, parking lots, and construction sites, is relatively small. This means that public hardscapes alone cannot fully deliver the citywide 30% canopy coverage target. However, their strategic value lies not in scale but in location: these surfaces are concentrated in dense, highly visible urban areas. Planting trees in such zones can deliver outsize benefits in the form of urban heat mitigation, improved walkability, stormwater management, and a visible presence of nature within the built environment.
Because these surfaces fall predominantly within the public realm, they are more accessible for municipal investment, maintenance integration, and coordinated planning. They are also wellsuited to design standards, infrastructure retrofits, and greening mandates. Even modest canopy gains across these zones can have amplified public impact, particularly when focused on transit corridors or areas lacking access to green space.
Achieving the citywide canopy target will require the active leadership of public actors in shaping conditions for private sector participation. The public sector must therefore be positioned not just as a landowner, but as a system-wide coordinator that is capable of setting priorities, distributing resources, and aligning action across private/dependent ownership landscapes.
3. Typology-Based Goals Are More Realistic Than Uniform Targets and Complement Existing Planning Frameworks
Across all surface types, the analysis confirms that planting feasibility is highly context-specific. Even within a single typology such as “sidewalks“ or “other green spaces”, tree establishment
Where to act and whom to act with
potential varies due to site conditions. This spatial heterogeneity makes it clear that Geneva’s 30% canopy goal cannot be applied uniformly across all districts or surface types.
To address this complexity, the study introduces a plantability-based typology that categorizes land according to its physical surface condition and potential for canopy expansion. This ecological lens complements the GIREC-based framework
used in the SAG report. While GIRECs provide a valuable spatial unit for tracking demographic and social indicators, the plantability typology offers a ground-level lens focused on feasibility and ecology. By layering these perspectives, planners can better align urban forestry efforts with both physical site constraints and social equity priorities.
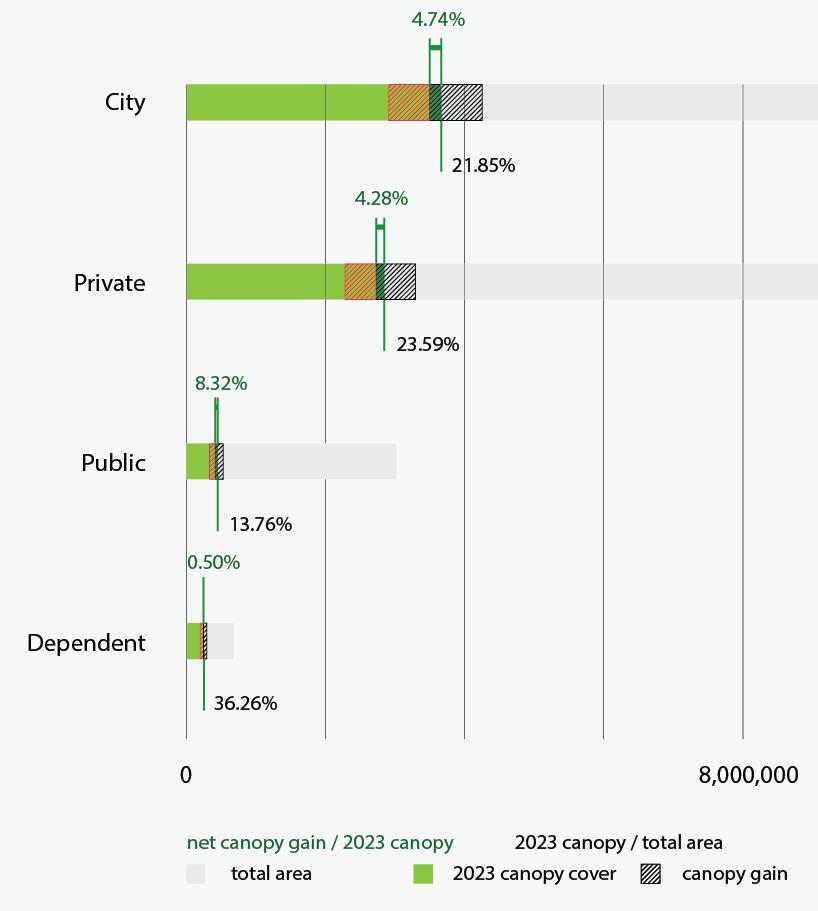
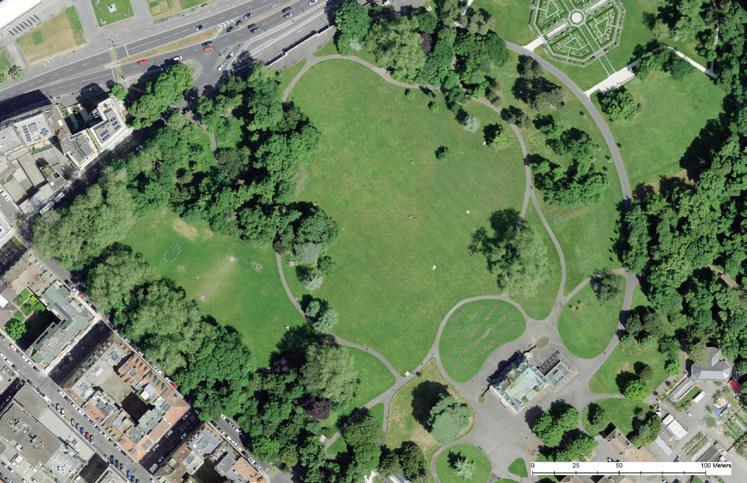
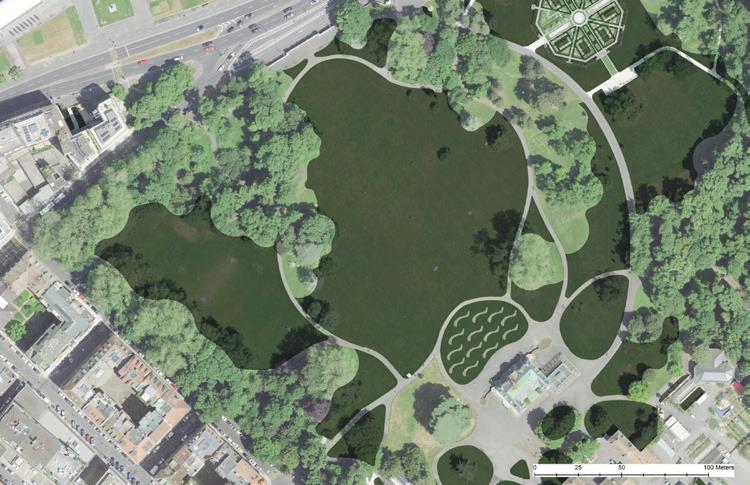

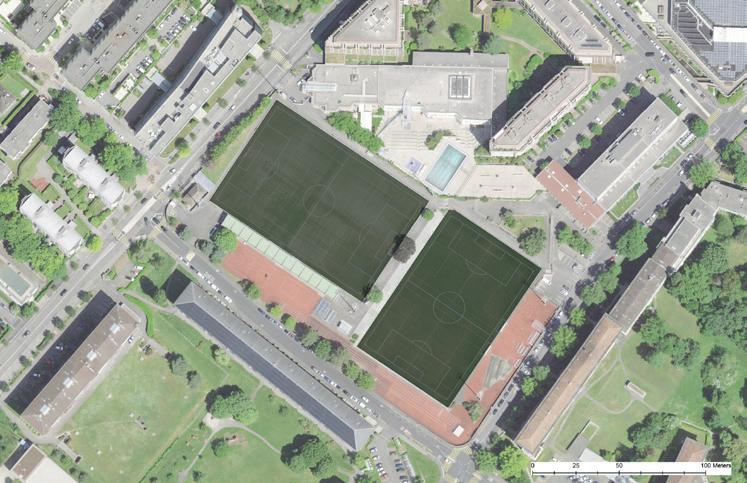
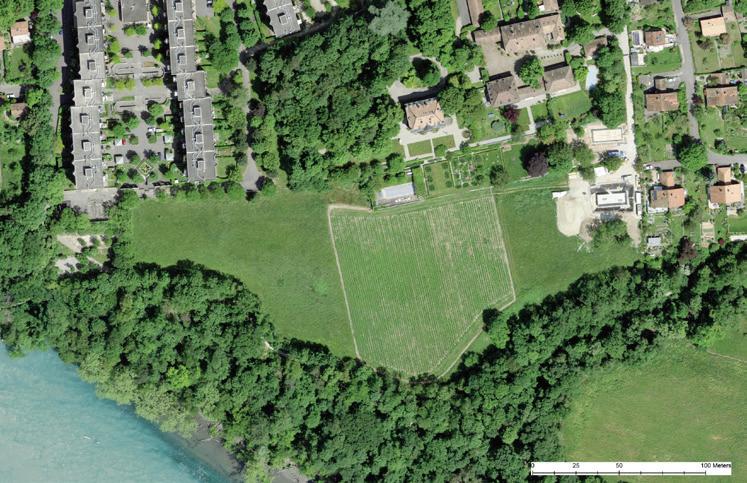
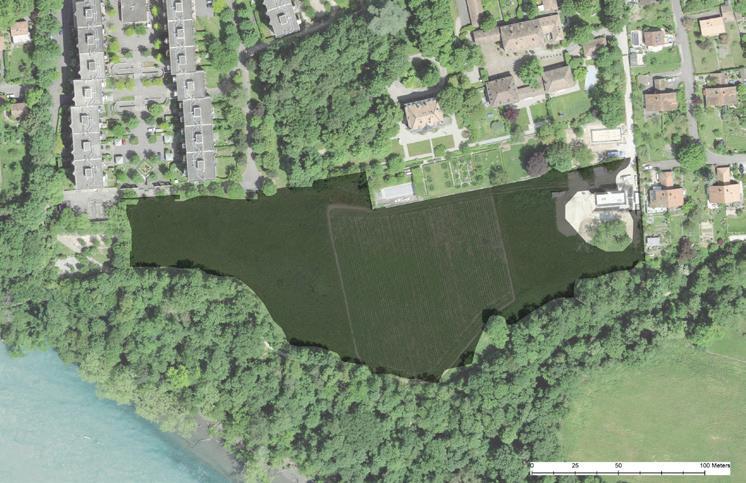
Top: Parc La Grange, a zoom in example of the “garden” type (classified area highlighted in black), where tree canopy expansion is limited by historical landscape design and the functional need to preserve open green space for public use.
Middle: Varembé Sports Center, a zoom in example of “other green spaces” type (classified area highlighted in black), where future canopy expansion is limited without a shift in land use or program replanning/relocating.
Bottom: Meadow near Villa Zep, a zoom in example of “meadow” type (classified area highlighted in black), offering high potential for future tree canopy expansion due to open, unshaded conditions and minimal surface constraints.
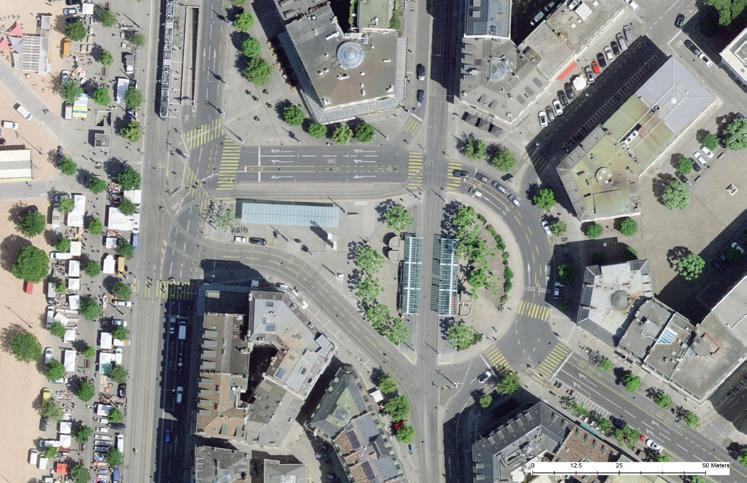

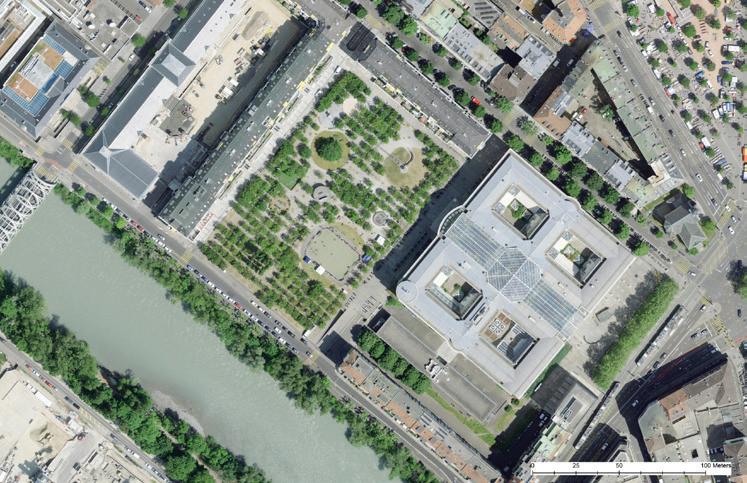
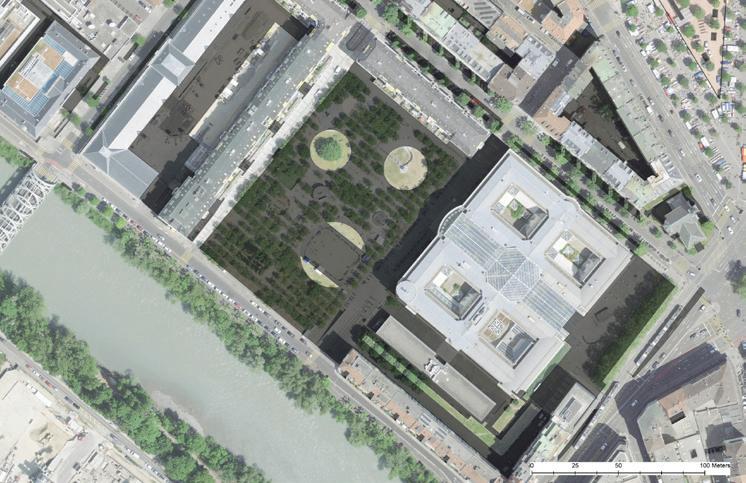

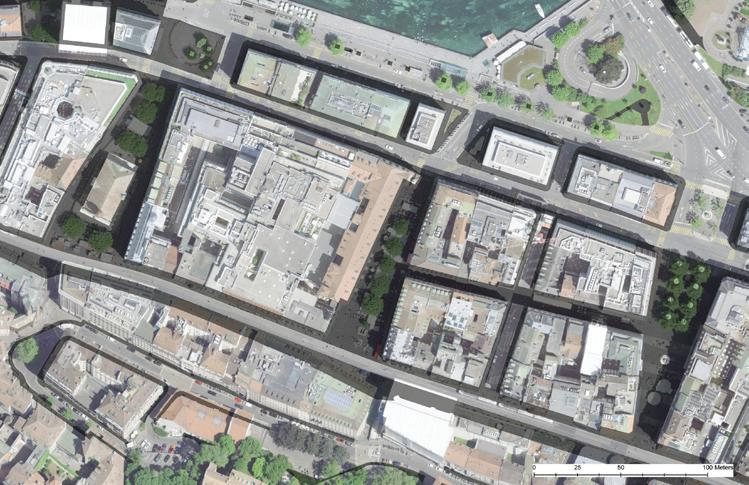
Top: Plainpalais transit station, a zoom in example of the “islet” type (classified area highlighted in black). A hardsurfaced traffic island with high canopy expansion potential. Transforming it into a green transit hub would require careful coordination with underground infrastructure constraints.
Middle: Université de Genève, a zoom in example of the “other hard surfaces” category, (classified area highlighted in black) showing the diversity contained within the “other hard surfaces” category. This area spans multiple surface functions, an urban park, loading zones, and campus plaza, highlighting the need for site-specific assessment when planning canopy interventions.
Bottom: Sidewalks near Molard transit station, a zoom in example of “sidewalk” type (classified area highlighted in black). This area highlights the variation within the “sidewalk” category, ranging from narrow pedestrian paths (5m wide) to wide urban corridors (30 m wide), each requiring site-specific planting strategies.
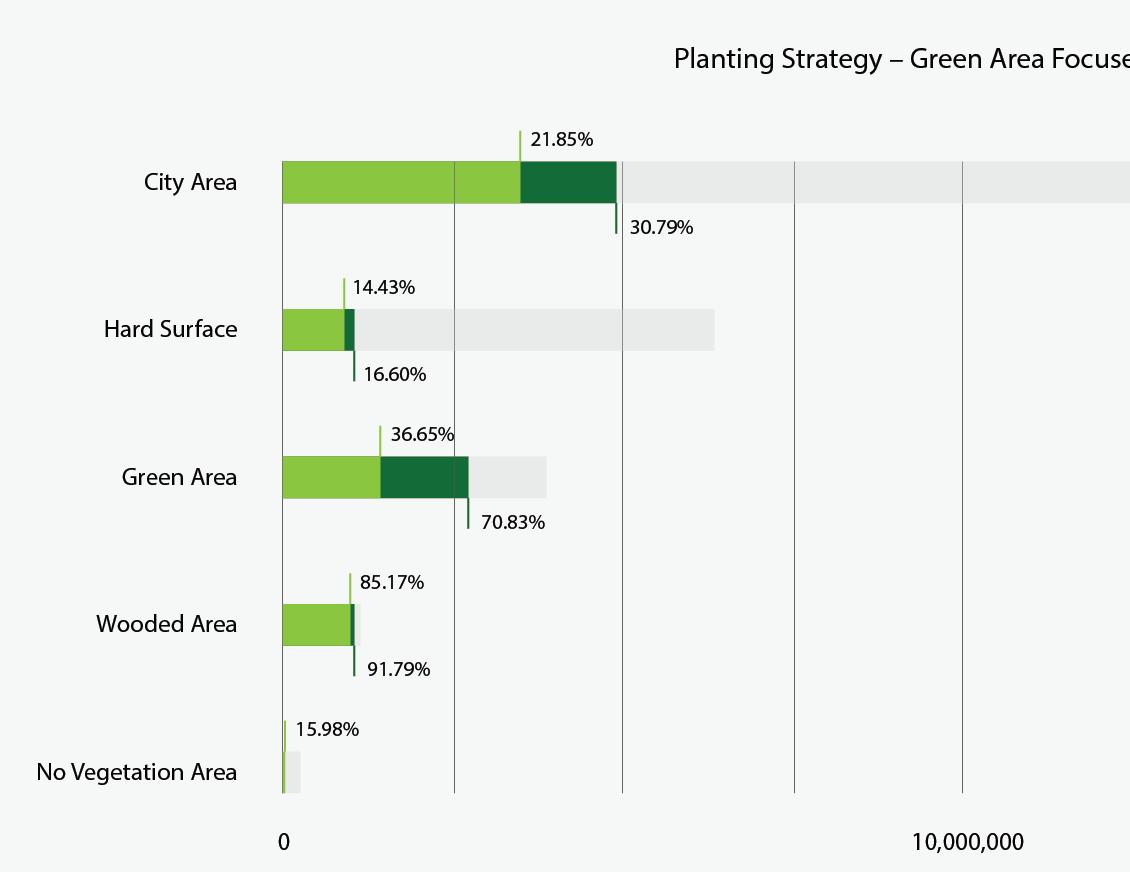

Hard Surface French
Green Area French
Wooded area
No Vegetation French
Top: future canopy expansion by prioritizing planting in green areas, aiming to raise coverage to over 70%. Wooded areas are preserved, while modest gains are projected for hard surfaces and no-vegetation areas.
Bottom: Detailed breakdown on the canopy increase target for each category with changes highlighted in red.


Hard Surface
French
Autres surfaces à revêteme Others (parking, between bu
Green Area
French
Wooded area
No Vegetation
French Label English Translation
Autre surface sans végétatioOthers (plaza, construction)
Rochers/Éboulis/sable Rocks/scree/sand
Top: Future canopy expansion prioritizing hard surfaces such as sidewalks, plazas, and parking areas. While green areas still contribute to gains, wooded areas are preserved, and novegetation zones see targeted improvement.
Bottom: Detailed breakdown on the canopy increase target for each category with changes highlighted in red.
1. Refine Surface Typologies and Develop Plantability Mapping (Top Prioritization)
To move from general categories to actionable planning, Geneva should subdivide broad land-use types like “garden” or “other green area” into more specific subcategories (e.g., currently cemeteries, university campuses, and private back of house courtyards all fall into the “garden” category), each with distinct planting constraints and governance structures. This should be paired with the creation of a plantability map, which is a GIS-based layer scoring surfaces by feasibility factors such as soil conditions, infrastructure presence, and existing use. Together, these tools will allow for more precise and realistic planting strategies.
2. Ground Citywide Goals Through ZoomIn Case Studies and Conceptual Design Testing (Next Step Prioritization)
Once a plantability-based typology is established, to validate whether 30% canopy is feasible in different contexts, the city should develop detailed case studies of representative site and test planting concepts through design exercises. This report identified six zoom-in cases studies to depict the complexity of spatial constrains and opportunities. These zoom-ins would become starting points to help define achievable targets for each typology and reveal trade-offs between planting, site use, and technical constraints, ultimately informing scalable strategies.
3. Establish Canopy Standards Based on Typology and Enforce Them in Project Approvals (Future Prioritization)
Based on zoom-in case studies, Geneva should define minimum canopy targets for each surface category and adopt them as enforceable standards for all new public or publicly reviewed projects. Any renovation or new development should be required to meet its assigned canopy goal or provide justification and compensatory measures. This would turn long-term tree planting ambitions into operational criteria guiding everyday urban design decisions.
Where to act and whom to act with
The Geneva Urban Area Arborization Strategy (SAG) sets an ambitious long-term objective: increase average tree canopy cover from 23% to 30% by 2070, while ensuring that no neighborhood falls below a 10% minimum. Trees are recognized not only as natural heritage but as vital infrastructure for urban cooling, biodiversity, and everyday well-being. Achieving this canopy goal, however, requires more than a numerical target. It demands strategic, spatially informed action that accounts for the realities of land use, ownership, and local capacity.
This report analyzes Geneva’s canopy expansion potential by cross-referencing land ownership and surface typologies using GIS data from Système d’information du territoire à Genève (SITG). Instead of treating the 30% goal as uniformly applicable, the analysis reframes the question: what is a realistic and meaningful canopy target for each type of urban surface and who must act to achieve it? The study illustrates this approach through example typologies such as sidewalks, parking lots, and gardens to contextualize where and how action might occur. These cases highlight the constraints and opportunities specific to each category, while underscoring that further spatial analysis and site-specific design will be essential for operationalizing the strategy at scale. Ultimately, the report advocates for a differentiated, actor-aligned approach to urban forestry implementation in Geneva.
References
1 “CAD Parcelle Mensuelle –Parcellaire Officiel” (CAD_PARCELLE_MENSU). SITG, 2024. https://sitg.ge.ch/donnees/ cad-parcelle-mensu.
2 “Carte OTEMO –Occupation du Territoire et Modes d’Occupation” (CAD_CARTE_OTEMO). SITG, 2024. https://sitg.ge.ch/ donnees/cad-carte-otemo.
3 Département du Territoire, République et Canton de Genève. Geneva Urban Area Tree Planting Strategy (SAG). Adopted by the Council of State, May 8, 2024. https://map.sitg.ch/app/?mapresources=NATURE.
4 “SIPV ICA MNC –Modèle Numérique de Canopée 2023” (SIPV_ ICA_MNC_2023). SITG, 2025. https://sitg.ge.ch/donnees/sipvica-mnc-2023.




Eric Kramer, Max Piana, and Slide Kelly


Understood through the four key components of data-driven urban forest planning methodologywe have identifed, student studies return the high-level takeaways and recommendations in the following categories:
Improve data and modes of analysis to understand the urban tree canopy, its contexts, and how it has changed.
Anticipate the future trajectory of an urban forest based on present conditions, identifying risks and opportunities presented.
Evaluate the possibility for changing projections through testing altered conditions or interventions in the built environment.
Identify critical grounds for action in terms of defined spatial typologies, equity of access, and opportunities for management and governance change.
Improve data and modes of analysis to understand the urban tree canopy, its contexts, and how it has changed.
1. Enhance data resolution: systematic tree inventories and multi-spectral lidar.
2. Link analyses of canopy cover to equity using the 3:30:300 methodology.
Anticipate the future trajectory of an urban forest based on present conditions, identifying risks and opportunities presented.
1. Model existing tree age, growth rate, and life expectency to project future trends in urban forest structure.
2. Model the impact of existing trends of canopy change at the regional scale.
3. Model the impacts of climate change and future disturbance on species diversity.
Evaluate the possibility for changing projections through testing altered conditions or interventions in the built environment.
1. Expand definitions of what land can be “plantable.”
2. Leverage strategic urban design interventions
Identify critical grounds for action in terms of defined spatial typologies, equity of access, and opportunities for management and governance change.
1. Define a prioritization framework that focuses planting in high-impact spatial typologies.
2. Target planting where it can most improve equity and access.
3. Set context-specific canopy targets.
4. Incentivize and support private action.
a. Perform regular on-the-ground stem-based tree inventories to update the Cantonal Inventory of Isolated Trees.
Data on species, size, and condition should be collected systematically at 3 to 5 year intervals for individual trees to allow for more detailed understanding of species performance under specific growing conditions and with respect to climate adaptation. These data should include basic forest inventory metrics including: tree species, location (point data), stem diameter, tree health and vigor.
b. Incorporate multi-spectral photography with LiDAR into regular cantonal data collection.
c. Use machine learning to categorize trees by species and condition to evaluate species diversity and condition, allowing for long-term monitoring of performance and identifying of early signs of risk.
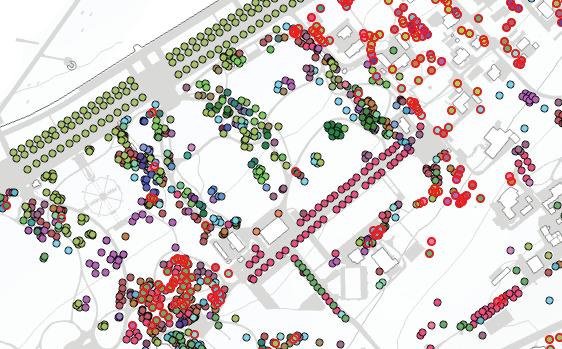
a. Implement data-driven assessments of urban forest performance that combine metrics of canopy cover area with equity, access, and public health.
b. Tailor existing frameworks like the 3-30-300 rule to reflect context-specific goals for Geneva and repeat assessments over time to measure progress towards goals.
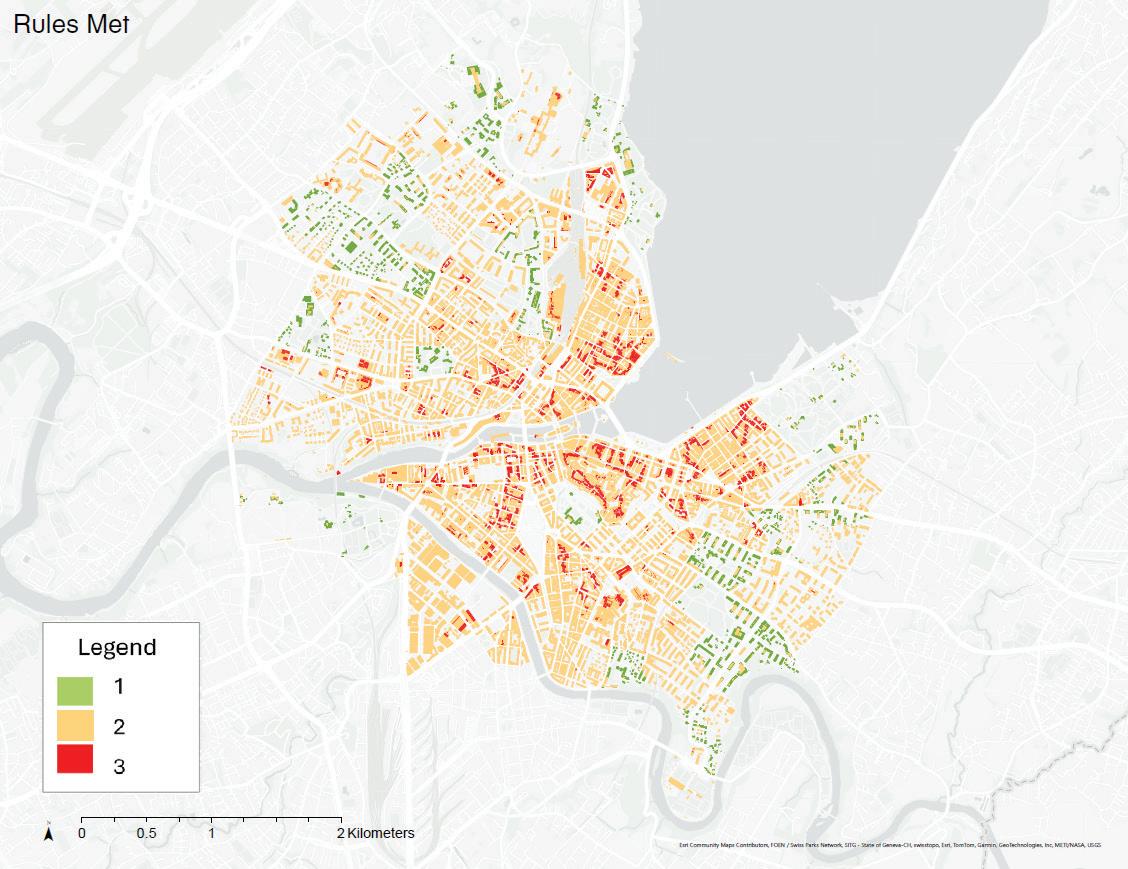
1. Model existing tree age, growth rate, and life expectency to project future trends in urban forest structure.
a. Predict where and when successional planting will be required.
2. Model the impact of existing trends of canopy change at the regional scale.
a. Engage the Grand Geneve framework to respond to patterns of displacement and inequity.
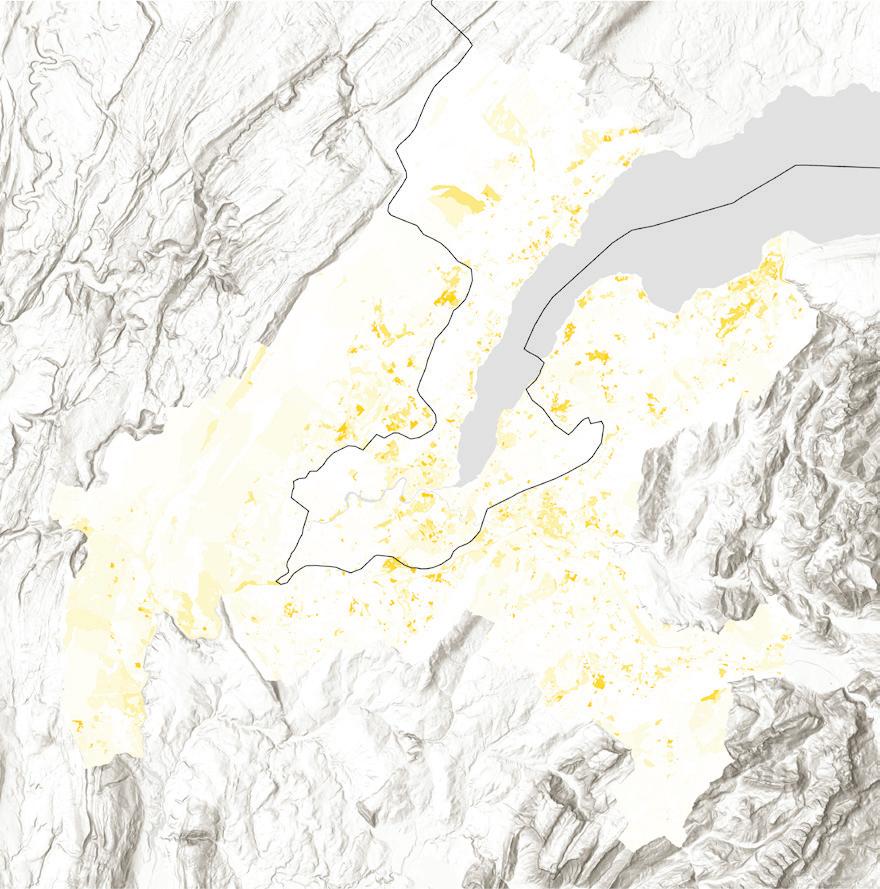
a. Develop a database documenting the risk of climate change to tree species and identify specific areas of risk based on species distribution across Geneva.
b. Identify climate-adapted species and set diversity targets for future planting, especially in areas of high risk identified above
c. Work with private landholders to plant climate-resilient and diverse species

a. Expand canopy planning by developing flexible “plantability” classifications across land uses, refining broad categories into actionable surface types. For example, recategorize roadway sections and parking designations as potentially plantable.
b. Engage high-impact marginal spaces such as primary roadways and easements in scenarios for prioritization and design.
c. Undertake a more detailed geospatial analysis of utilities and other below-grade conditions. Identify areas of potential plantability pending utility relocations.
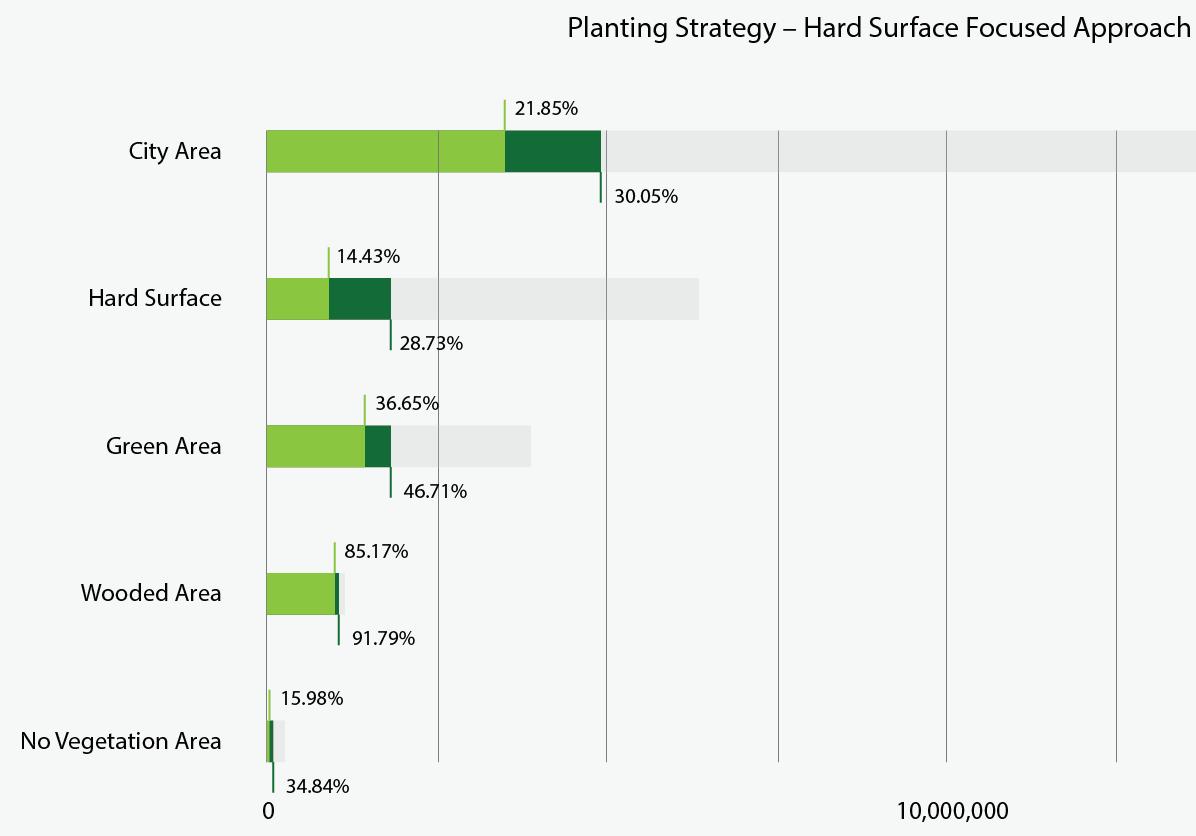


a. Target “urbanization-densification” projects and “development” land use zones for higher canopy cover targets and innovative urban forest designs.
b. Link urban development with higher standards for tree planting and canopy cover.
c. Implement design-based pilot projects to test planting feasibility and inform citywide canopy standards.
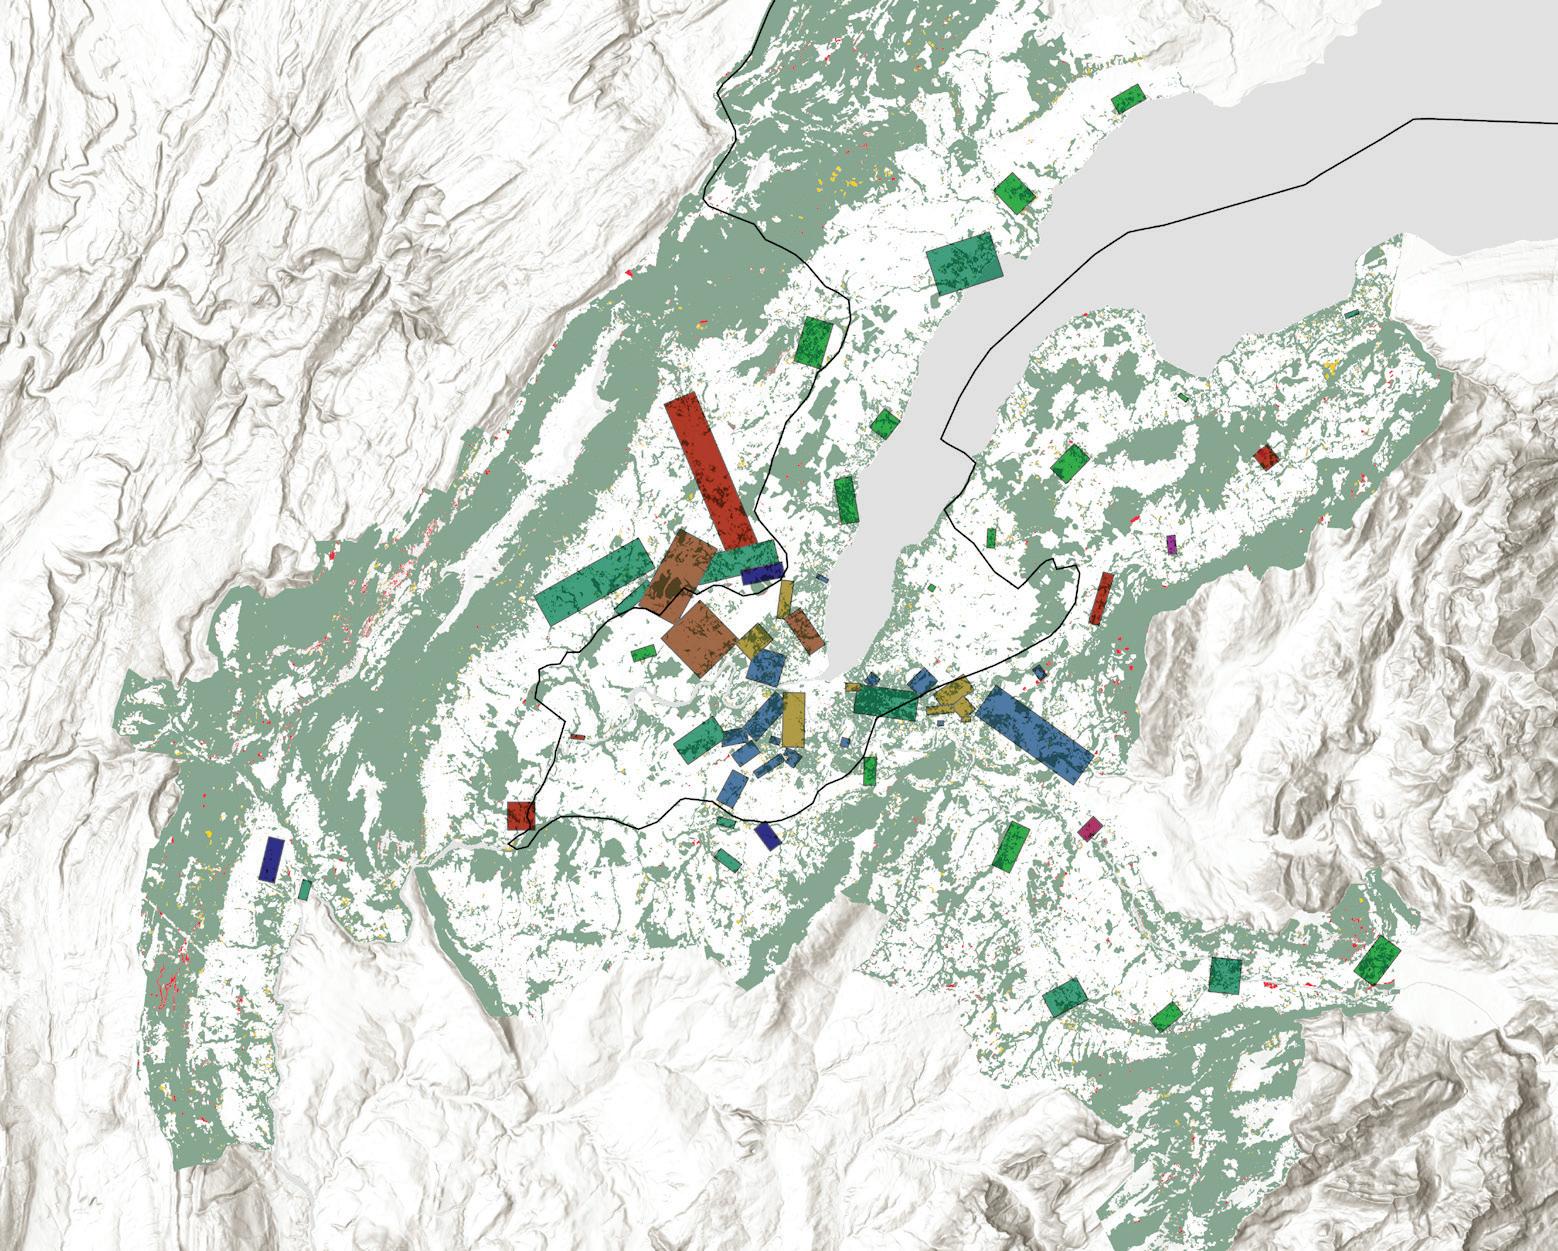
Switzerland France
1. Define a prioritization framework that focuses planting in high-impact spatial typologies, including:
a. Aquatic corridors/buffers.
b. Urbanization-densification sites.
c. Ecological Infrastructure corridors (designated).
d. Primary roadway corridors.
e. Areas with climate-vulnerable species and low species diversity.
f. Easements for planting, fencing, and passage.
g. Agricultural land.
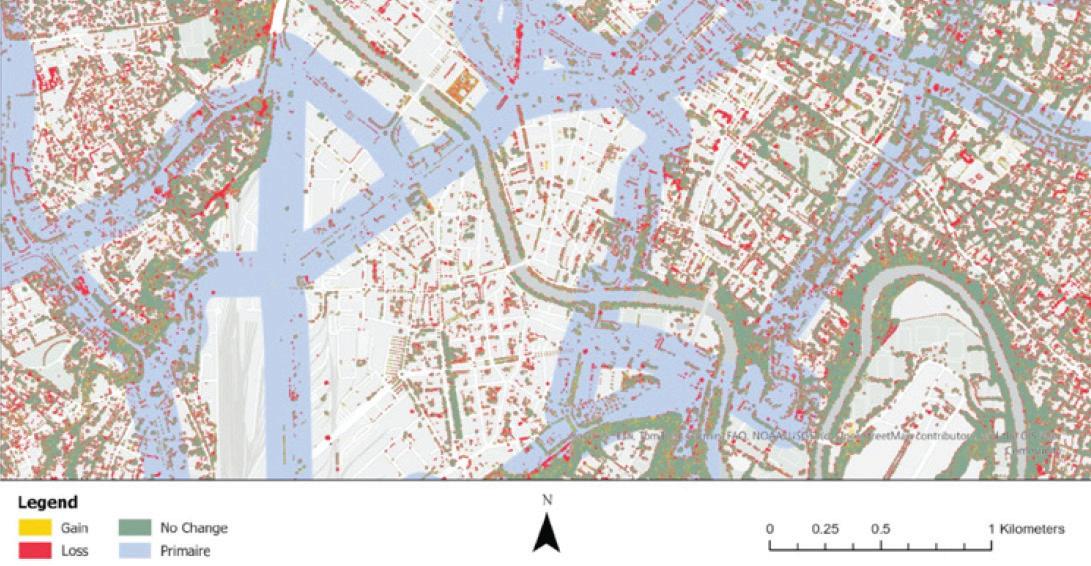


it
a. Underserved or vulnerable populations.
i. Population age above 65 or below 19 years of age.
ii. Outdoor exposure in primary work occupations.
iii. High exposure to urban heat island effects.
iv. Exposure to high levels of air pollution.
b. Populations with low spatial measures of access, Scoring 1/3 of 3-30-300 analysis.
i. Low neighborhood canopy cover.
ii. Low proximity to large parks.
iii. Low proximity to individual trees.







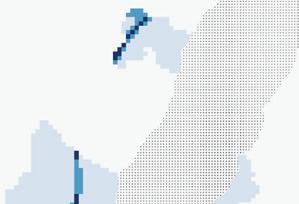

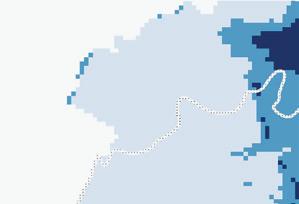
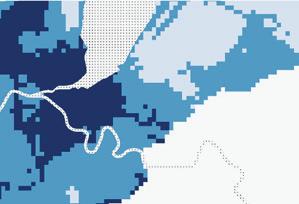


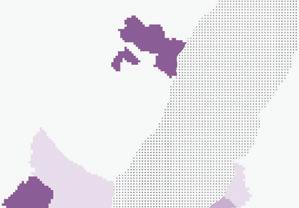

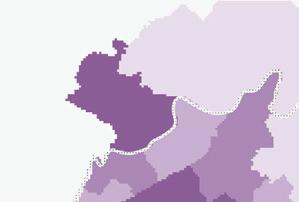
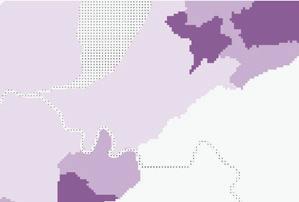


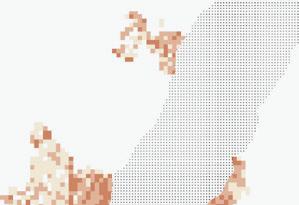

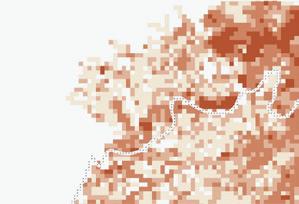
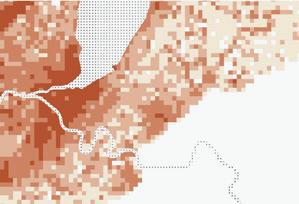


a. Maximize canopy cover goals for specific spatial types: e.g., aquatic buffers, roadways, easement zones, dense urban fabric, and transborder zones. Base goals on spatially-defined capacity analysis for each type.
b. Use typologies (e.g., “garden,” “quai,” “primary road”) to define minimum canopy targets that are enforceable through planning approvals or other regulatory frameworks.

a. Encourage and support tree planting on private land, particularly in easements under government regulations and in vulnerable zones.
b. Provide resources, maintenance support, or policy levers (e.g., zoning incentives) to enable private participation.
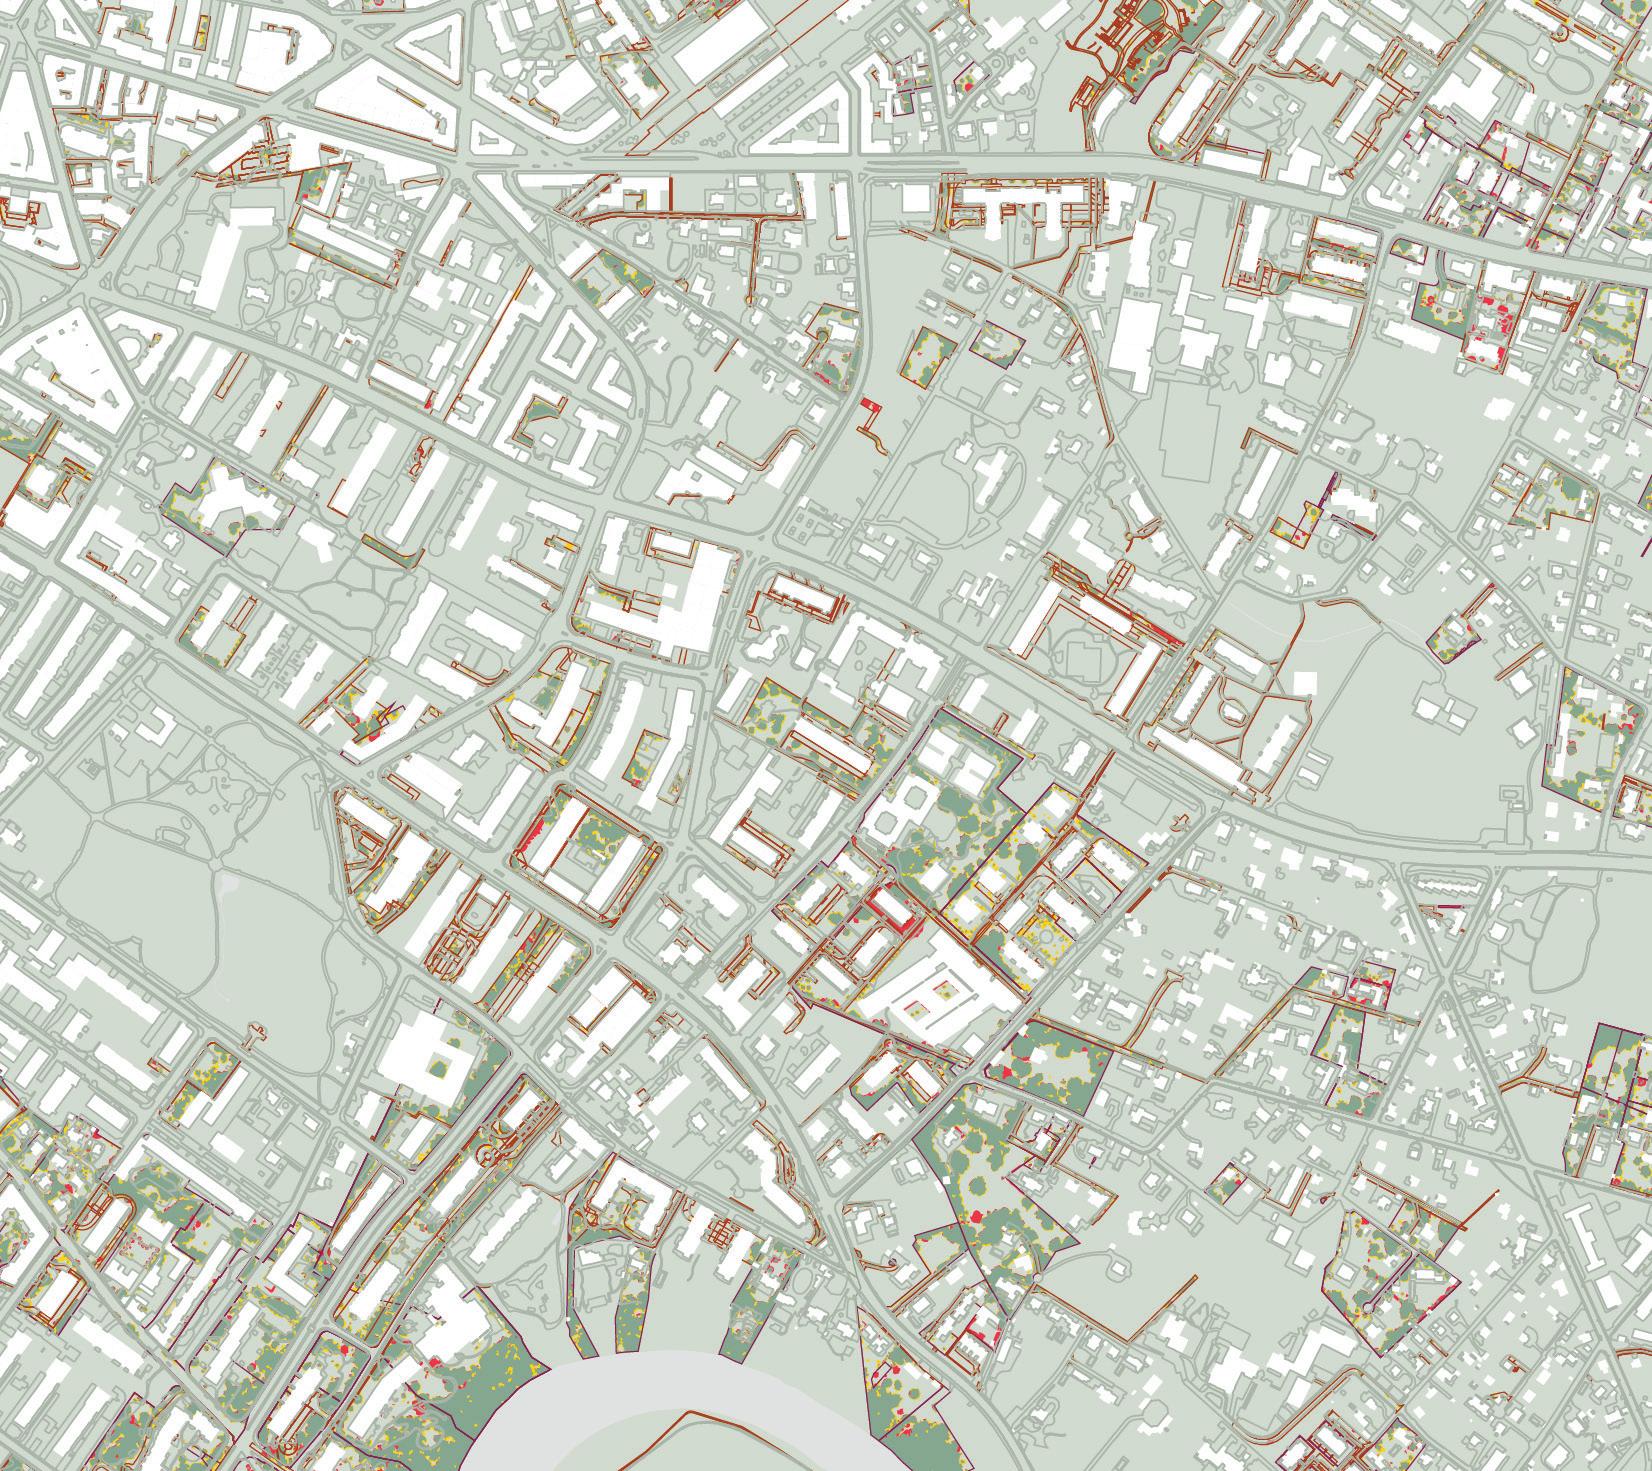
After Data: Forest Futures for Geneva
Fall 2025 Option Studio in Landscape Architecture

Anita Berrizbeitia
The fall 2025 option studio in landscape architecture will explore the histories and future possibilities for the forests of Geneva, Switzerland. Building on the findings of the research seminar “Cultivating Shade: Policy, Planning, Design, and Activism for Geneva’s Urban Forest,” the studio will explore Geneva’s forests at the urban, cantonal, and regional scales.
The studio will seek to assist Geneva in realizing their “Geneva Urban Area Arborization Strategy” (SAG), which specifies the city’s goals for expanding its tree canopy from the current average of 23% to 30%, with no areas below 10%. This translates to an estimated 150,000 trees planted over the next 15 years. As stated in the SAG report, “…we now know that the tree is one of the key levers of the transformation toward greater sustainability…a means of action to provide answers to crucial challenges expressed on the scale of the city: improvement of the climate, environmental quality, support for biodiversity and resilience in the face of the effects of global warming.”
Beyond the technical and performative aspects of trees (what they “do” for the environment), the studio will focus on the cultural dimension of forests in a city that has operated for millennia as a cultural and political crossroads. Geneva is strategically located at the southwestern end of Lake Geneva, the largest alpine lake in Europe, where the Rhone River emerges to continue its trajectory through France toward the Mediterranean Sea. The city and its regional unit, the canton, lie on the Couvette Genevois, a geographical basin bound by the Jura Mountains and Alps. These enclose the canton in a quasienclave of rural and agricultural landscapes that contrast with its urban core.
However, this strong territorial identity of Geneva is belied by its bi-national and global reach. Of its 104 kilometer-long border, only four kilometers are shared with the neighboring Swiss canton of Vaud, and the remaining 100 kilometers with France.
The city has grown into a cross-border metropolis, Greater Geneva, with bedroom communities for the city’s laborers on the French side characterized by socio-economic and environmental disparities. What roles will forests play in the future of Greater Geneva?
Geneva’s global reach is also an essential part of its identity. It is the European home of the United Nations, with several of its entities, such as the World Health Organization, based there. It hosts more than 40 international organizations and hundreds of NGO’s, the world’s epicenter for diplomacy and international cooperation. “Tree Diplomacy,” the planting of trees from many different geographical regions with a presence in Geneva, has a role in developing its urban tree canopy. How should we define tree diplomacy in these perilous times?
Finally, Geneva offers a range of canonical design projects that reassert forested landscapes’ cultural and experiential dimensions. Of note is Georges Descombes’s Voie Suisse. L’itineraire genevoise. De Morschach a Brunnen (1998) and the Renaturation of the River Aire (c.2010-15). The studio will also examine planning proposals for Greater Geneva. Max Piana, Visiting Lecturer in Plant Science and Forest Ecology, Eric Kramer of Reed Hilderbrand, and Slide Kelly, Design Critic in Landscape Architecture, will support the studio.
During the studio, students will travel to Geneva to learn from subject matter experts in the city and exchange knwledge with landscape architecture students at HEPIA.
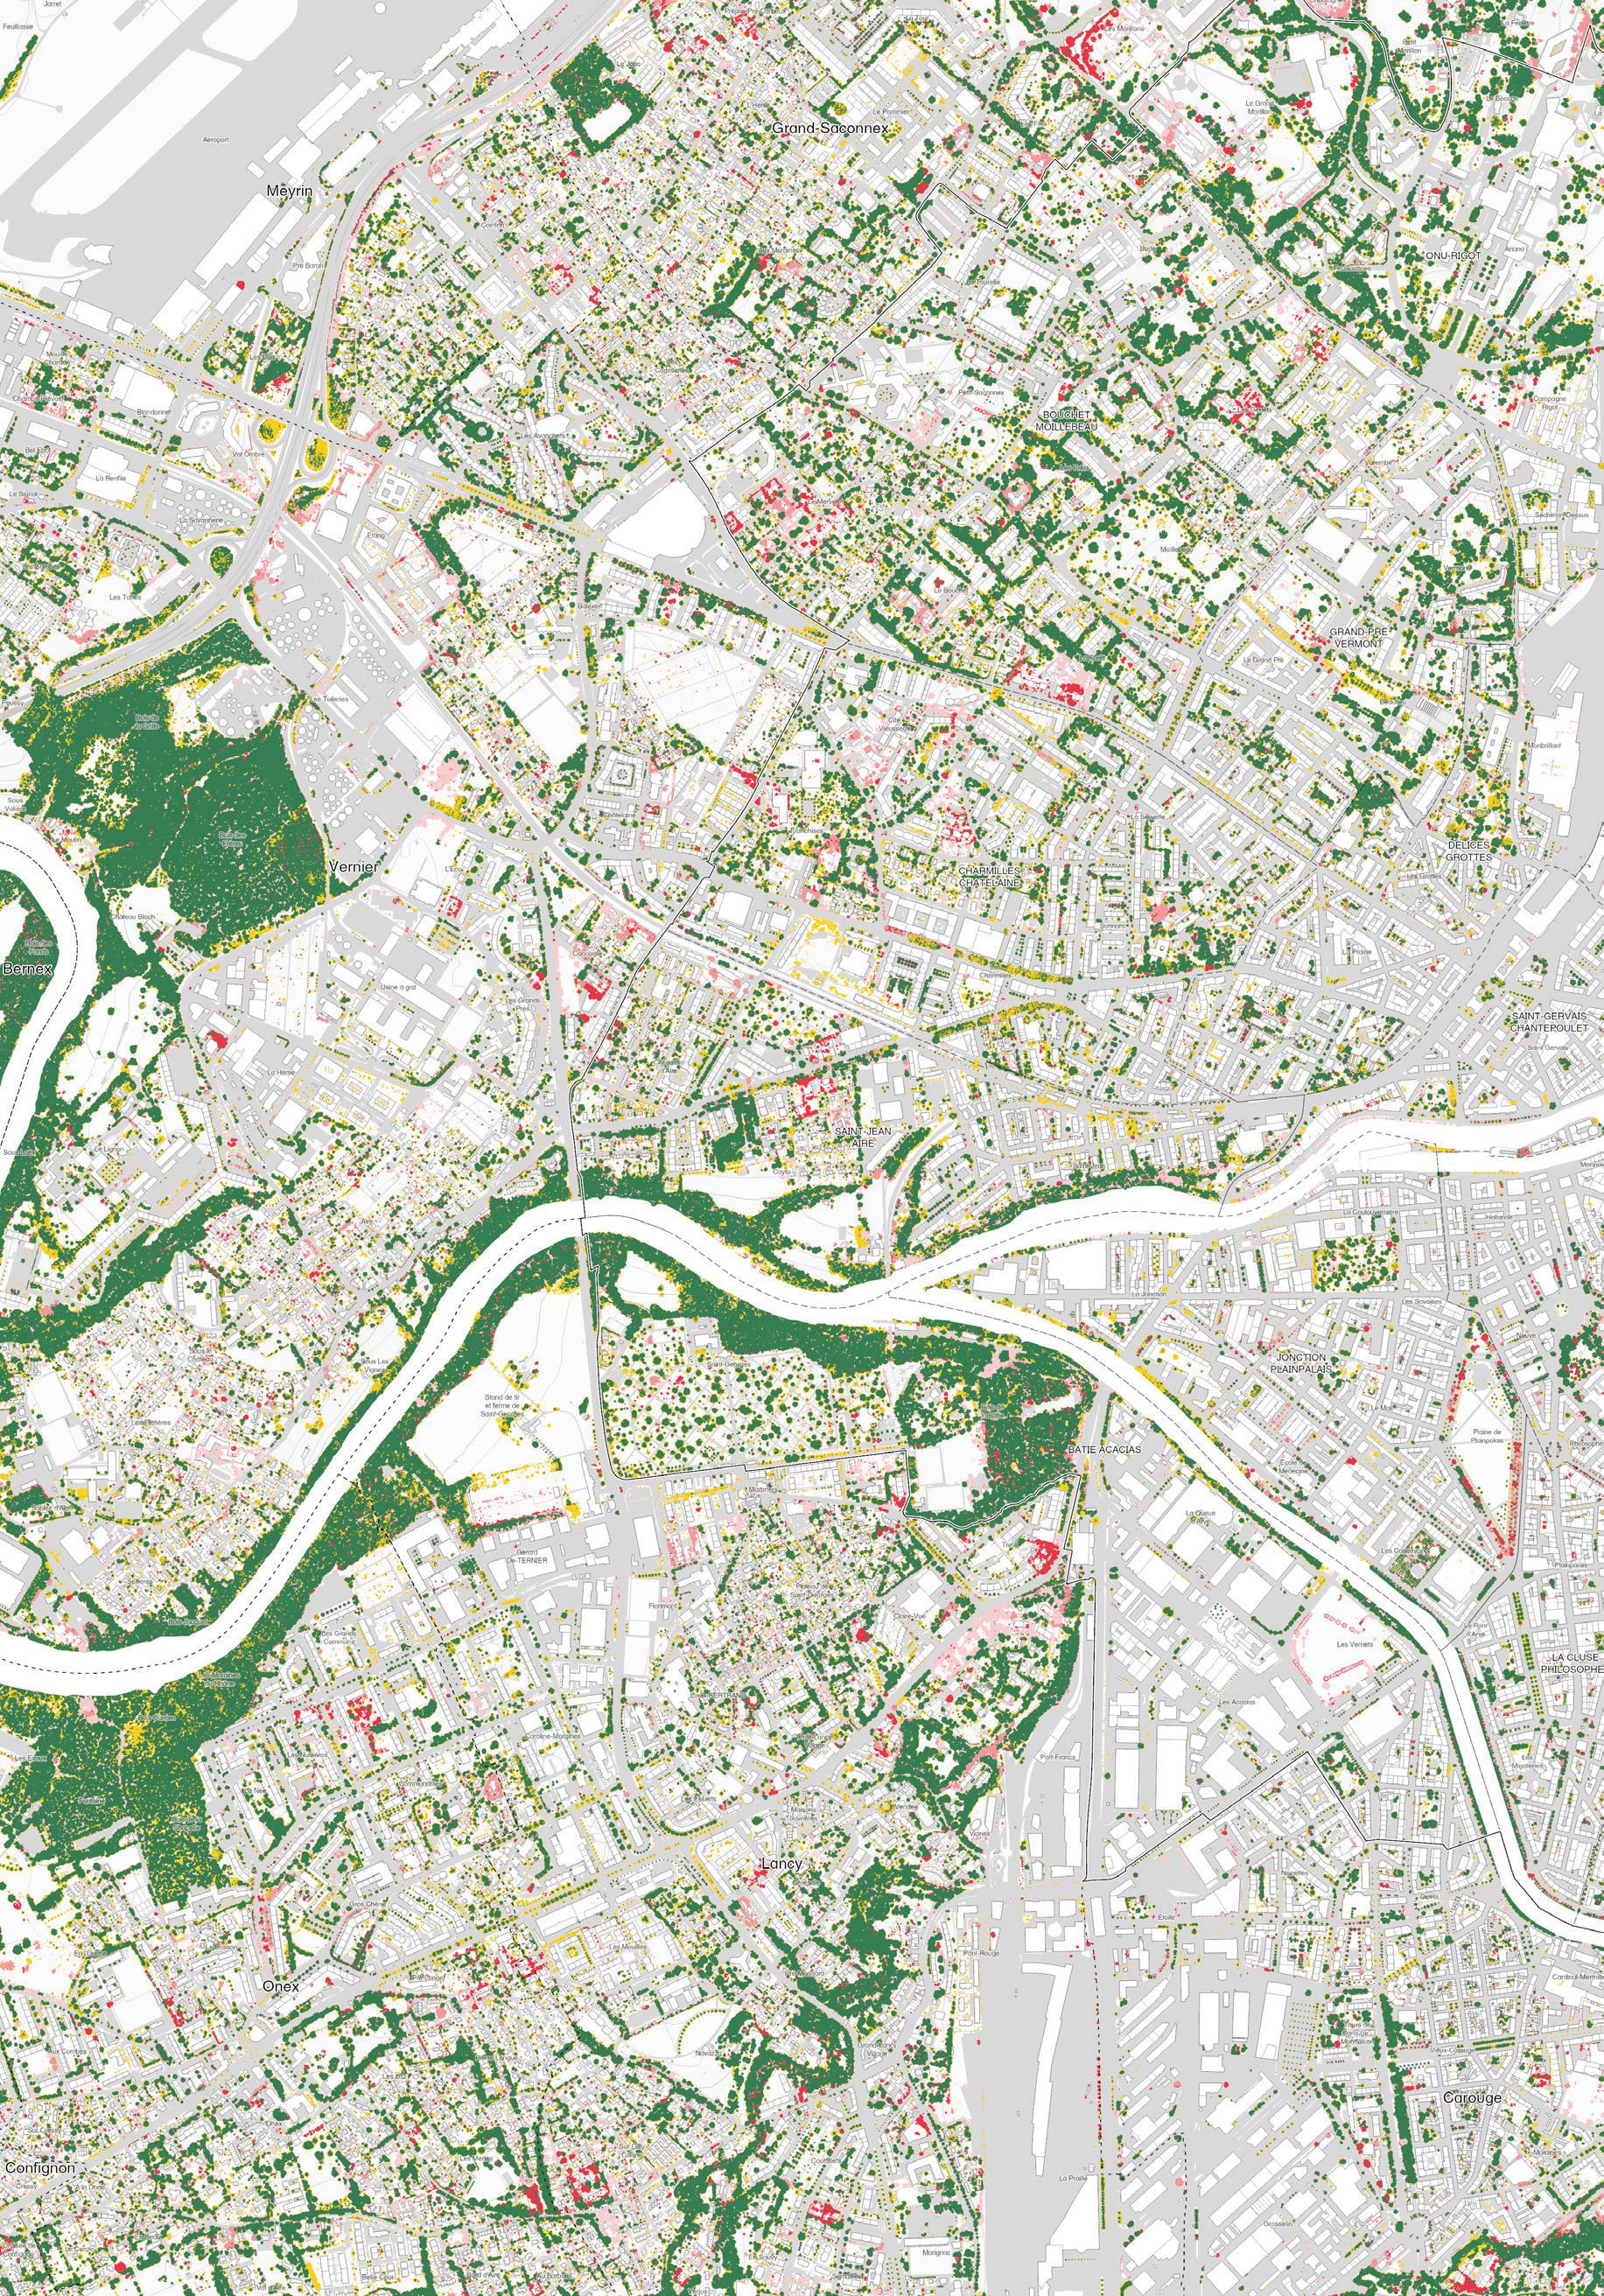
Canopy Change (2013 to 2023)
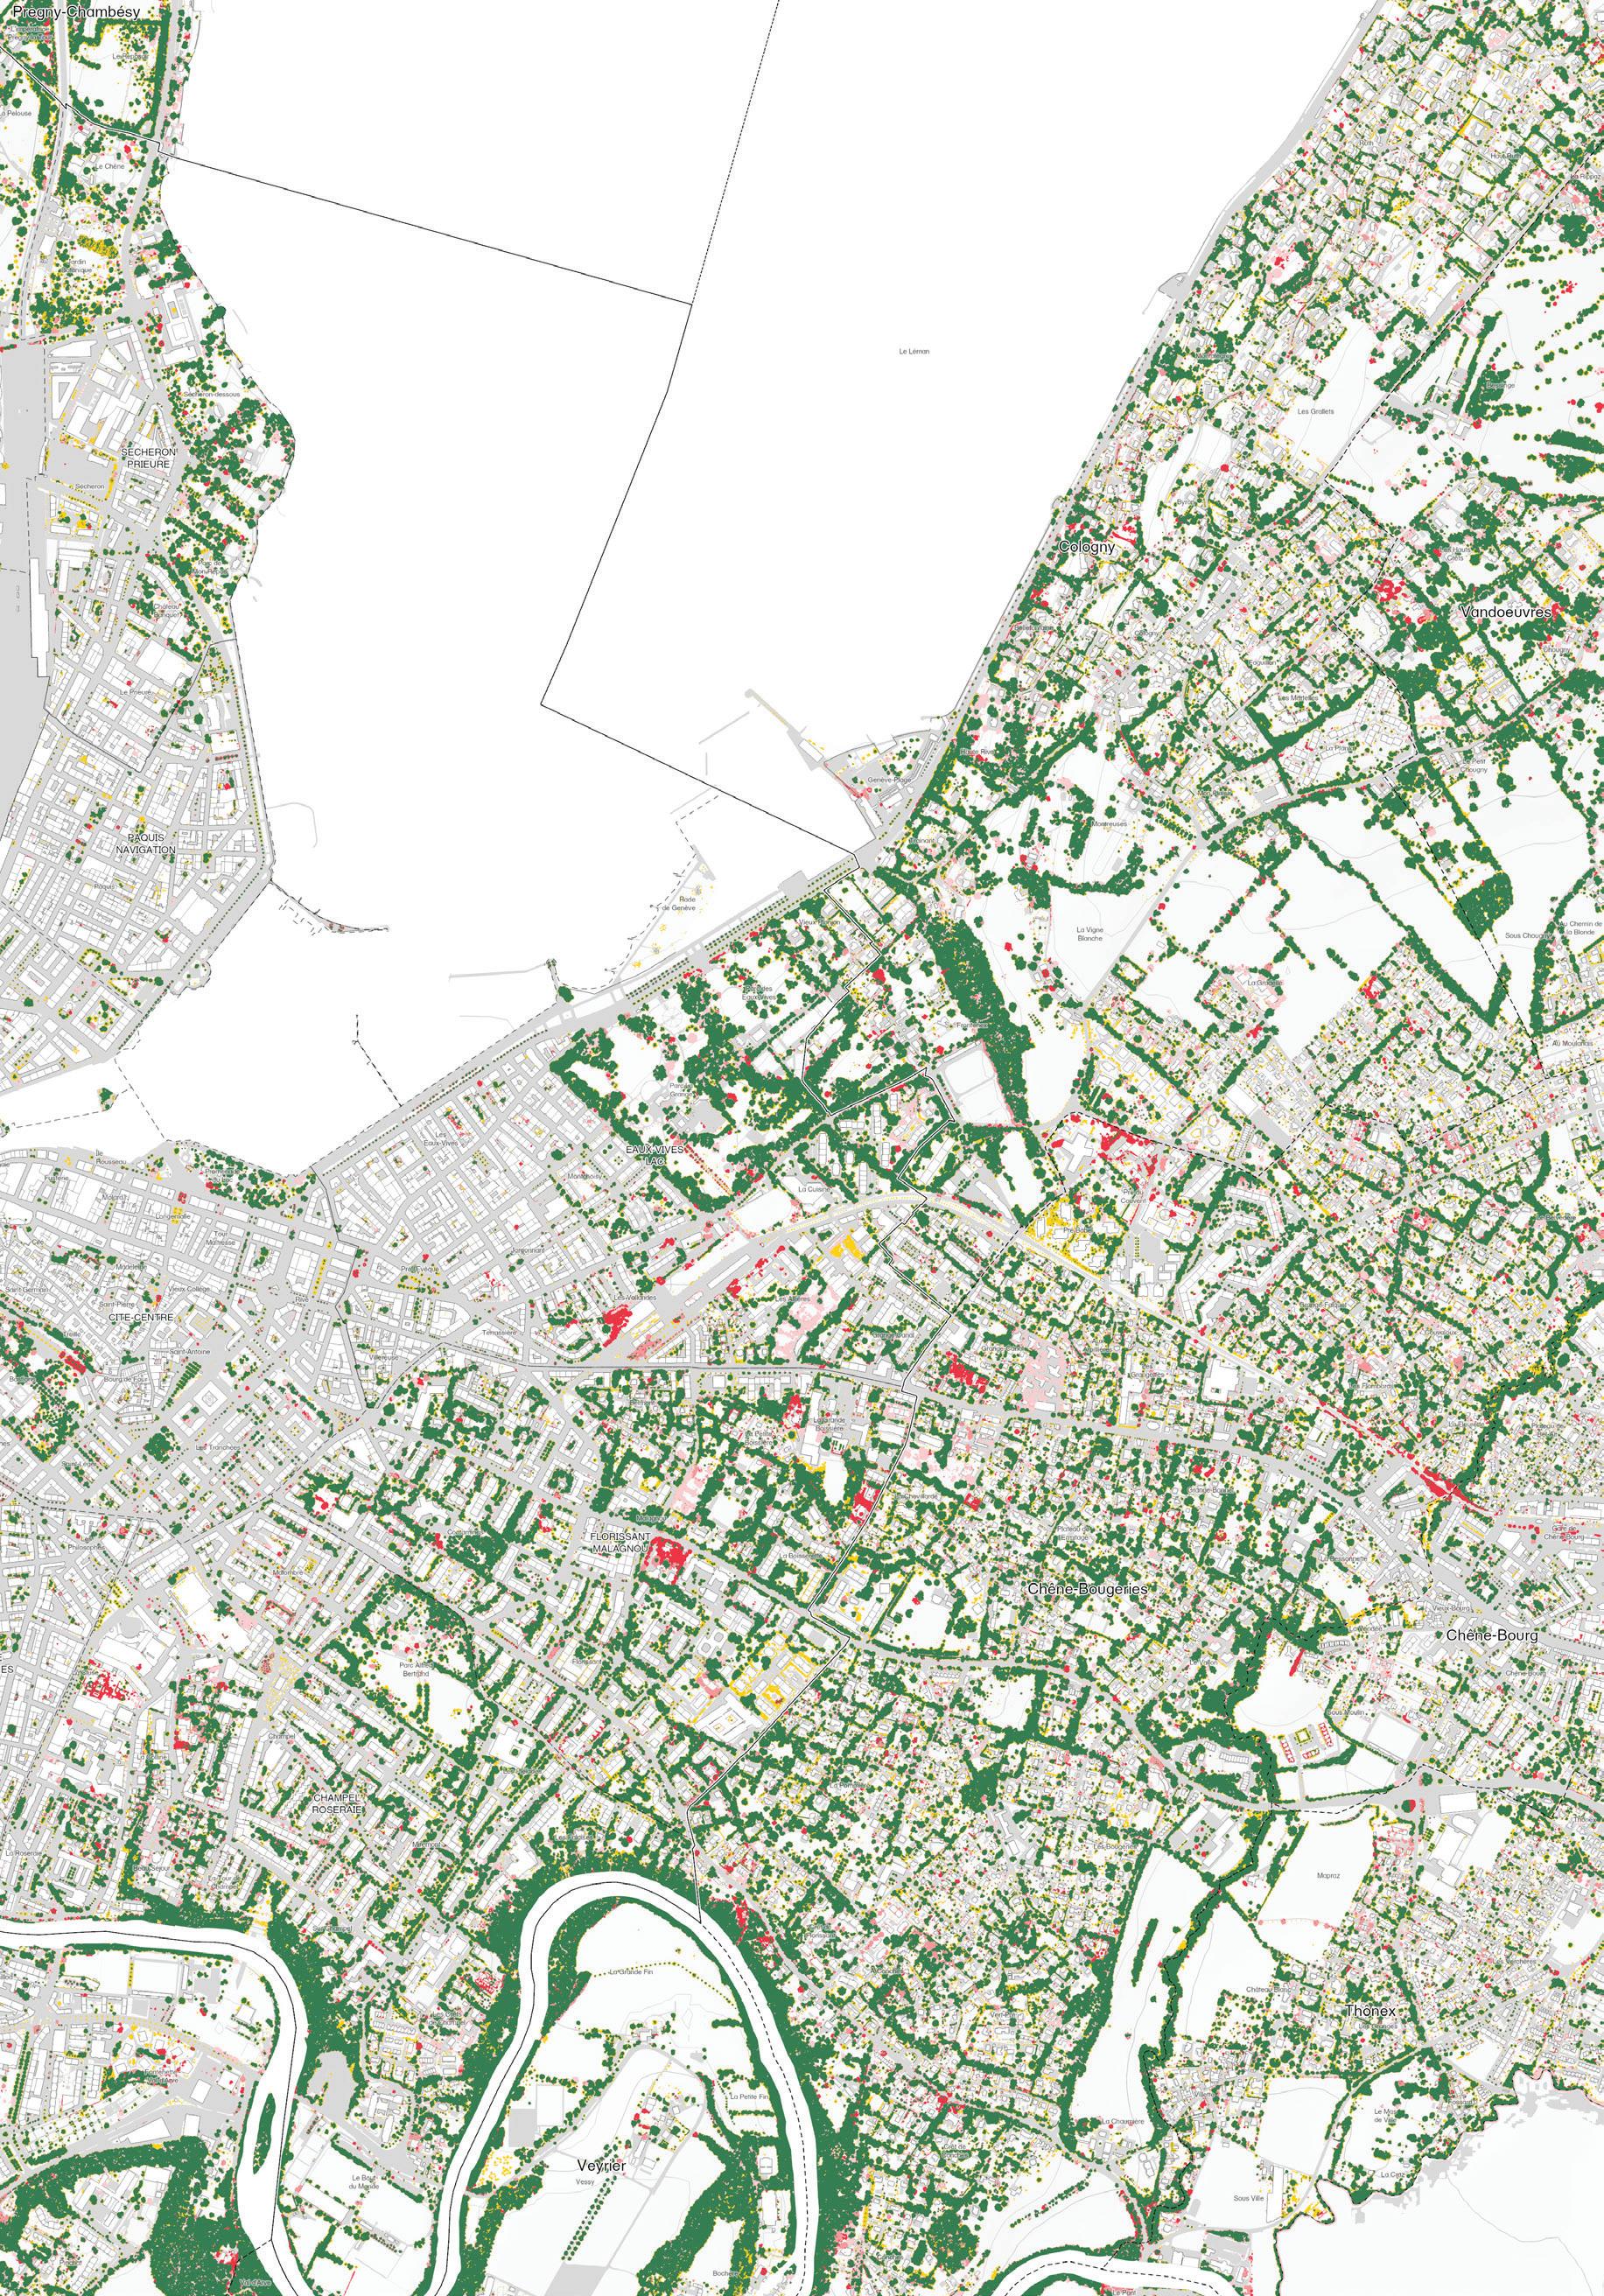
Data: Système d’information du territoire à Genève (SITG).
“Nuages De Points Lidar 2013.”
“Modèle numérique de surface de canopée - État 2017”
“Modèle numérique de surface de canopée - État 2019”
“Modèle Numérique De Surface De Canopée - État 2023”
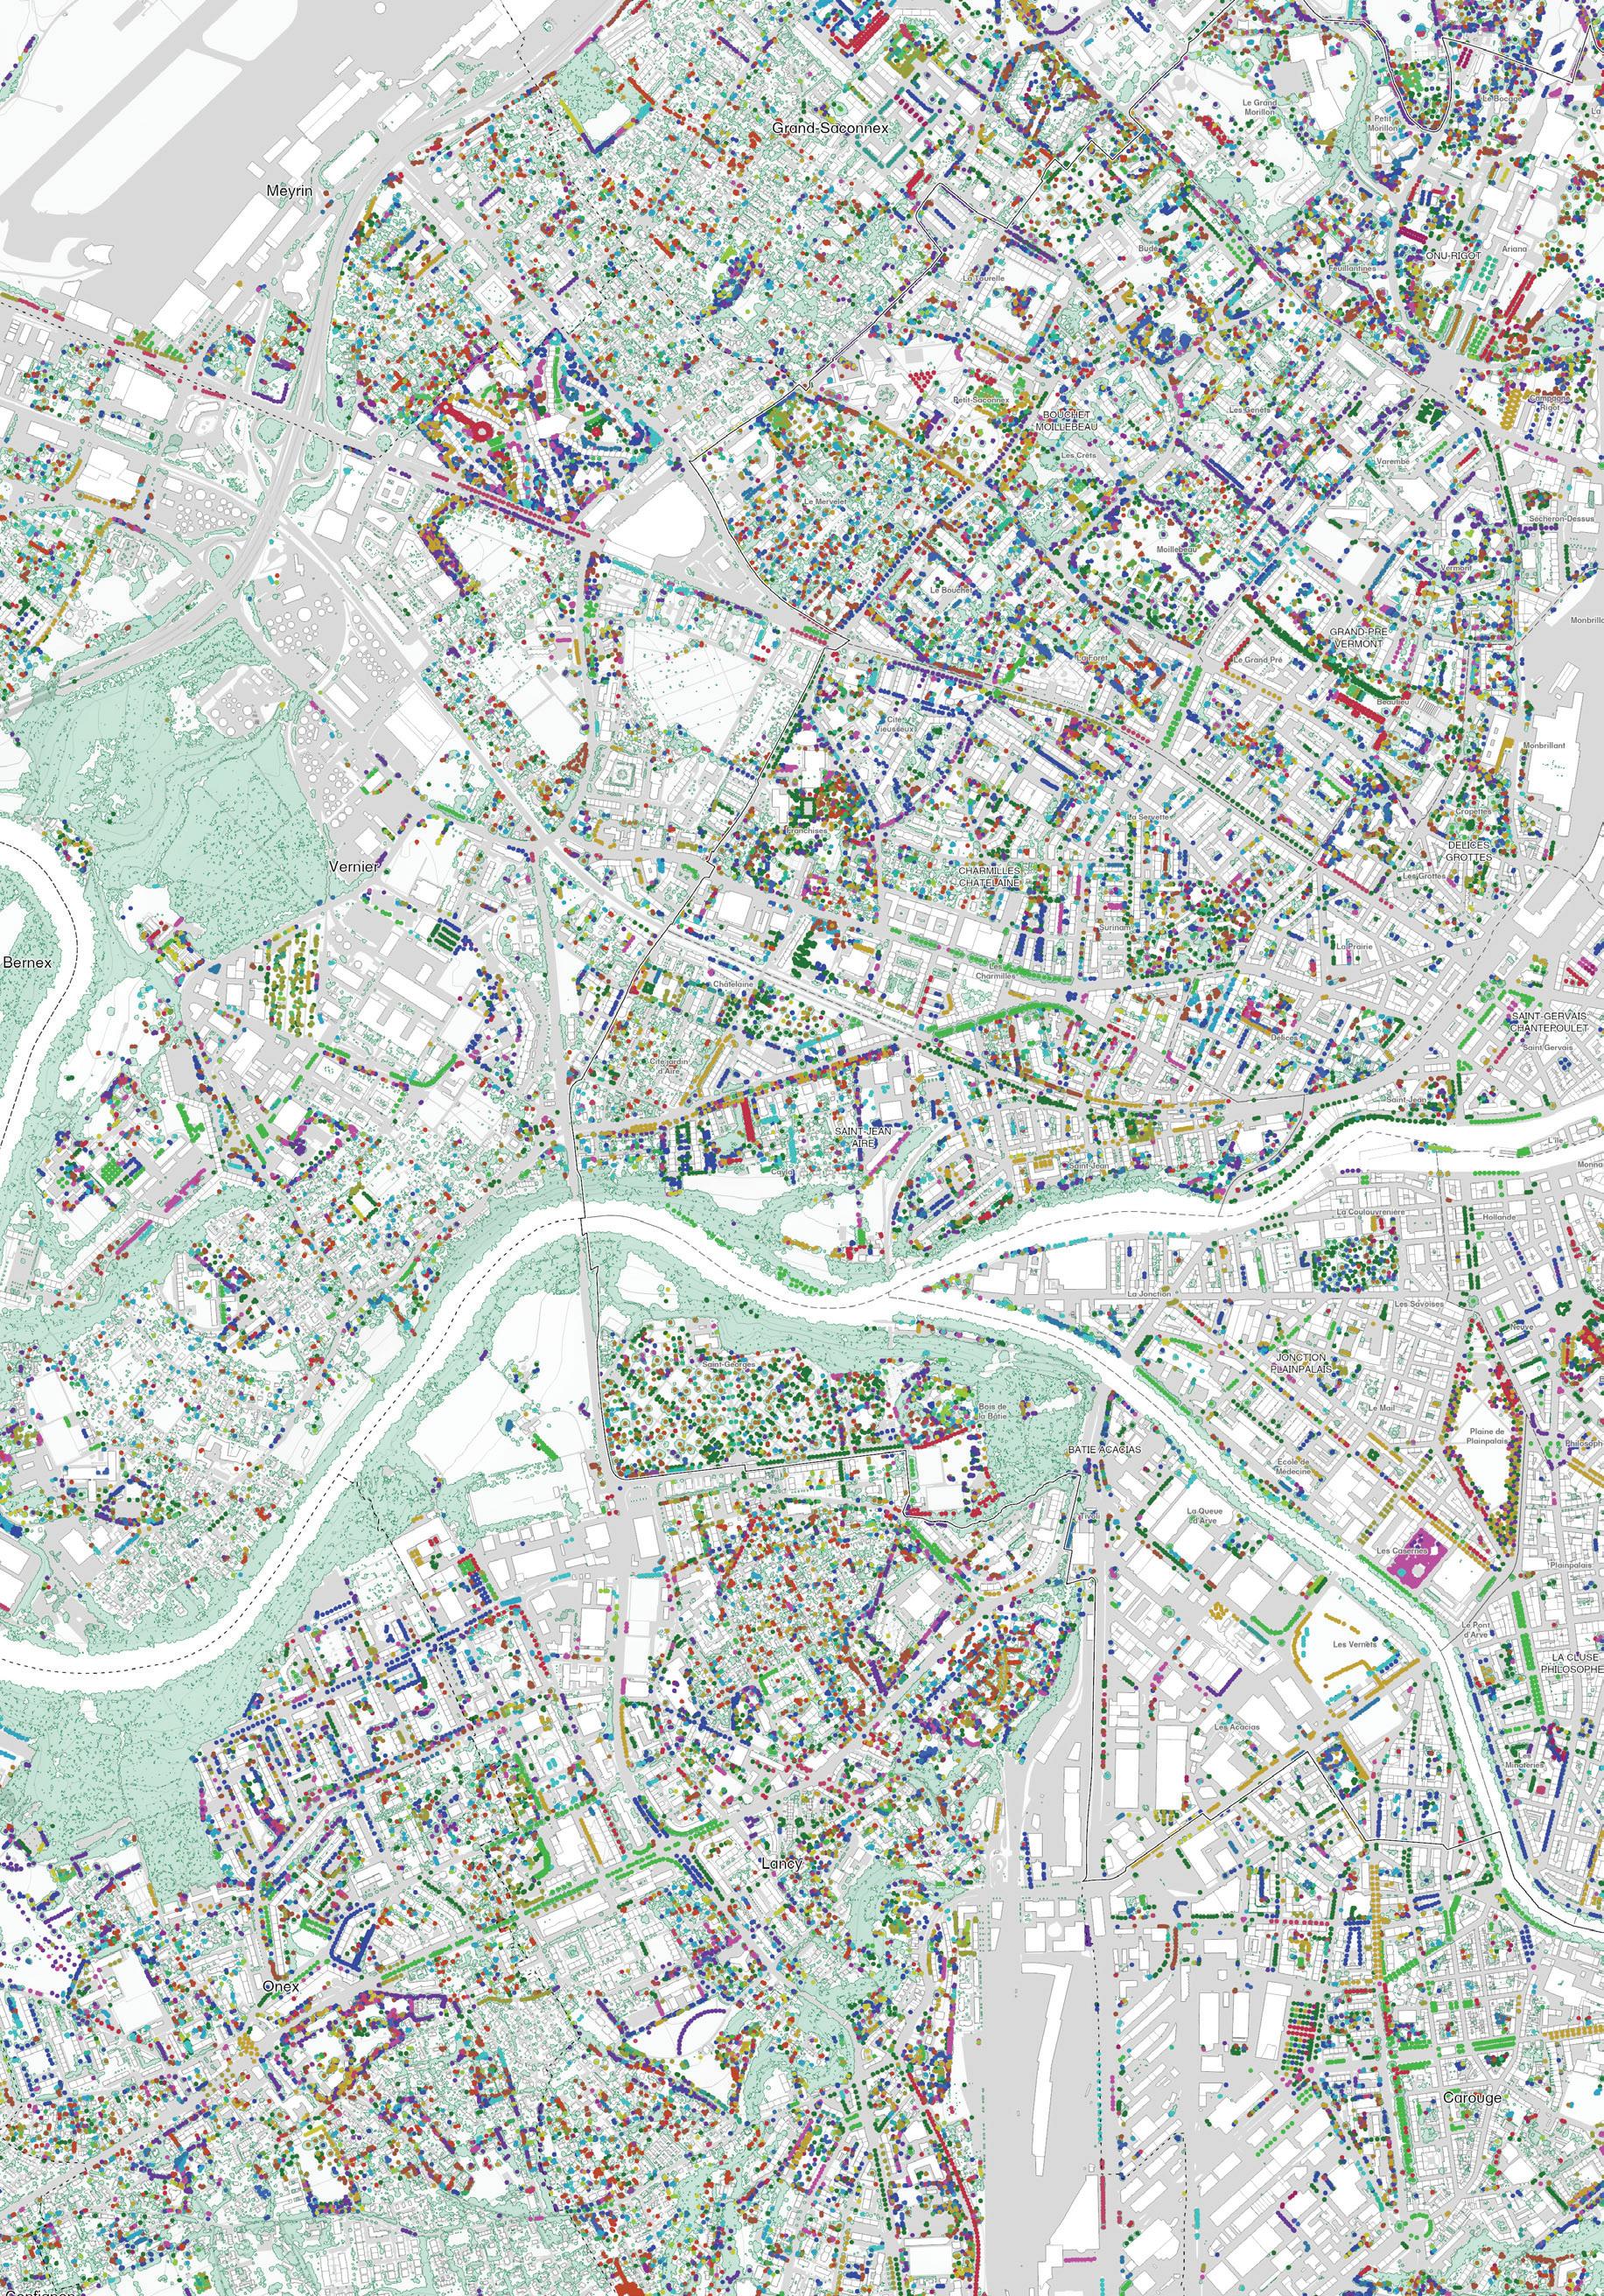
Abies
Acer
Aesculus
Betula
Carpinus
Cedrus
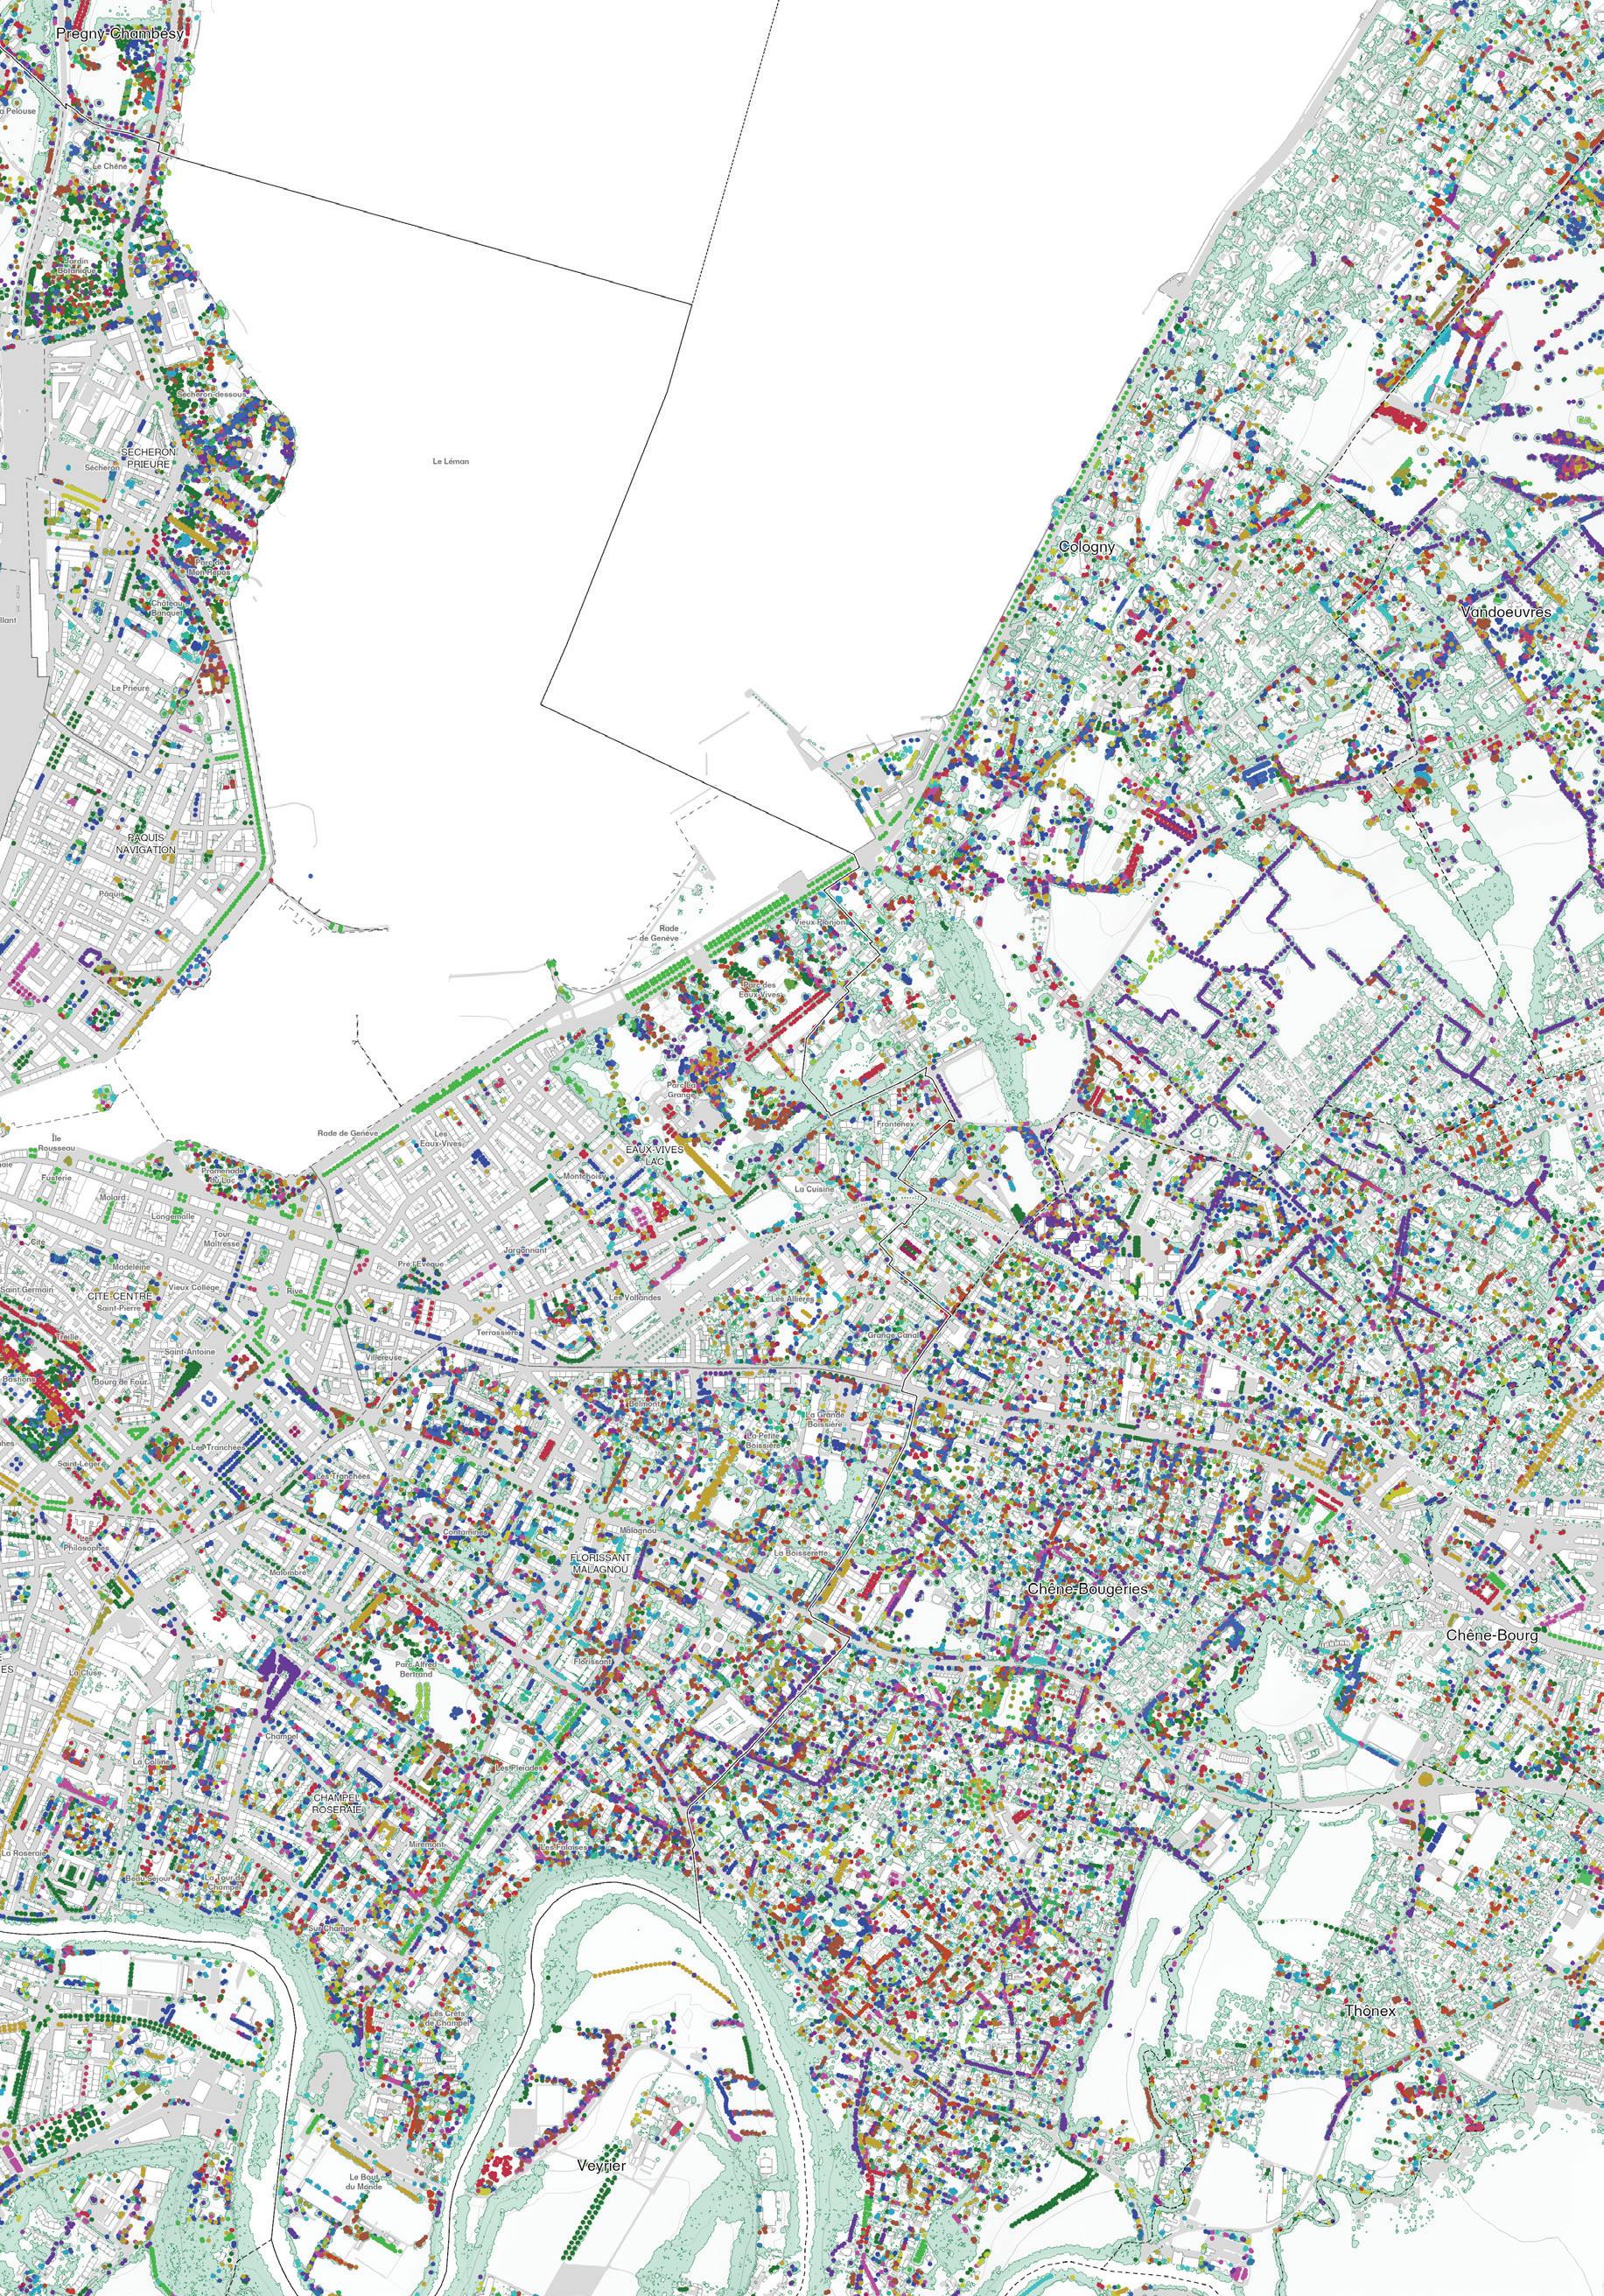
Cupressus Fagus
Fraxinus
Larix
Magnolia
Malus
Tilia Ulmus
Tree Canopy (2023)
Picea
Pinus
Platanus
Populus
Prunus
Pyrus
Other Genus
0 0.5 1 km
Data: Système d’information du territoire à Genève (SITG).
“Inventaire cantonal des arbres isolés”
“Modèle Numérique De Surface De Canopée - État 2023”
Quercus
Robinia
Salix
Taxodium
Taxus
Thuja

Tree Canopy Change (2013 to 2023)
Canopy Loss Canopy Gain No Change
2019 to 2023 2013 to 2023
2017 to 2023
2013 to 2023
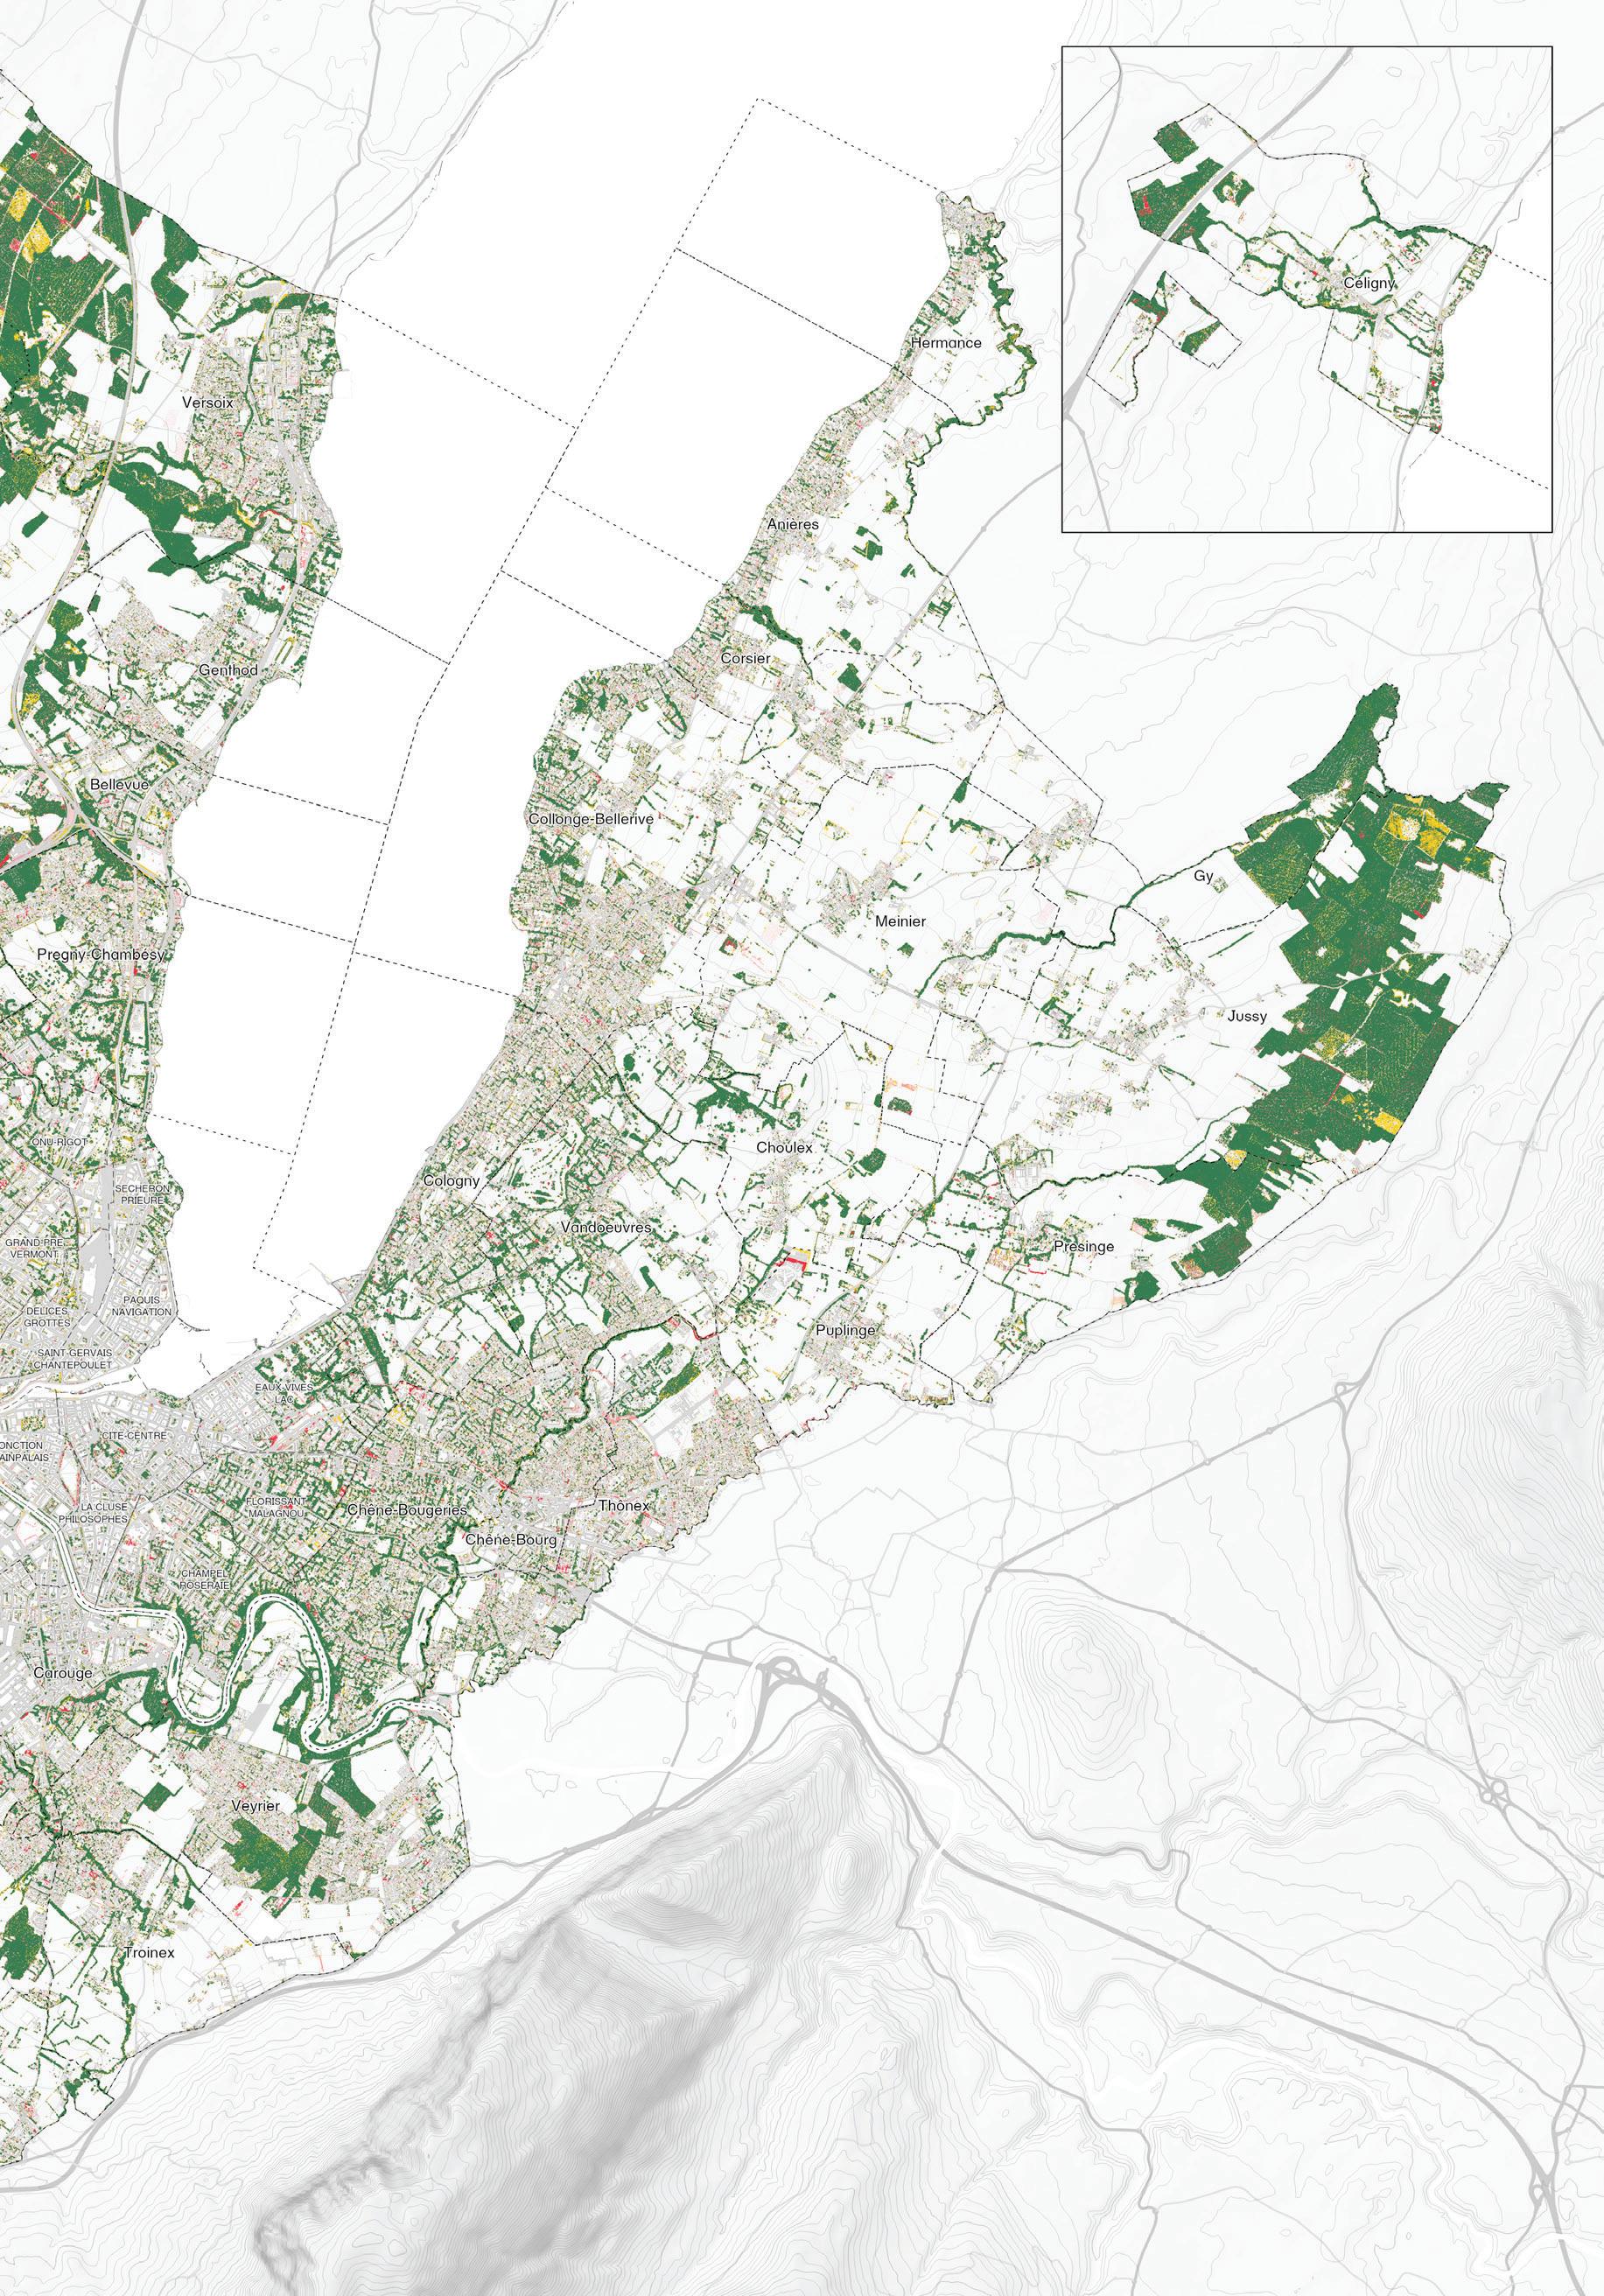
2013 to 2023
0 1 0.5 2 3 km
Data: Système d’information du territoire à Genève (SITG). “Nuages De Points Lidar 2013.” “Modèle numérique de surface de canopée - État 2017” “Modèle numérique de surface de canopée - État 2019” “Modèle Numérique De Surface De Canopée - État 2023”
Cultivating Shade: Policy, Planning, Design and Activism for Geneva’s Urban Forest
Instructor
Eric Kramer
Teaching Team
Max Piana, Slide Kelly, Melanie Louterbach, Anita Berrizbeitia
Report Design
Slide Kelly, Andrew Ó Murchú
A Harvard University Graduate School of Design Publication
Dean and Josep Lluís Sert Professor of Architecture
Sarah Whiting
Chair of the Department of Landscape Architecture
Gary R. Hilderbrand
Copyright © 2025 President and Fellows of Harvard College. All rights reserved. No part of this book may be reproduced in any form without prior written permission from the Harvard University Graduate School of Design.
Text and images © 2025 by their authors.
Acknowledgments
This seminar and studio are made possible thanks to the generous support of Foundation La Gara, located in Geneva.
Image Credits
Cover, pages 2, 301: “Tree Canopy ChangeCity of Geneva (2013-2023).” Slide Kelly.
Pages 10, 12, 280: Slide Kelly
Page 20: “Healthy Forest, Healthy City” (2020. City of Cambridge, Reed Hilderbrand Landscape Architects LLC.
Page 72: “Nuages de points LiDAR 2023.”
Système d’information du territoire à Genève.
Page 86-87: “Tree Canopy Change - Canton of Geneva (2013-2023).” Slide Kelly.
Page 88: Oliver Oglesby.
Page 126: Rose Van Grinsven.
Page 136: Caroline Brodeur.
Page 204: Emma Tracy.
Page 216: Andrew Ó Murchú.
Page 236: Michelle Lee.
Page 248: Xinying (Kiesza) Li
Page 264: Nina Zhao
Page 292: “Nuages de points LiDAR corps de rue 2012.” Système d’information du territoire à Genève.
Pages 294-299: Slide Kelly.
The editors have attempted to acknowledge all sources of images used and apologize for any errors or ommissions.
Harvard University Graduate School of Design
48 Quincy Street Cambridge, MA 02138
gsd.harvard.edu
Seminar Report
Spring 2025
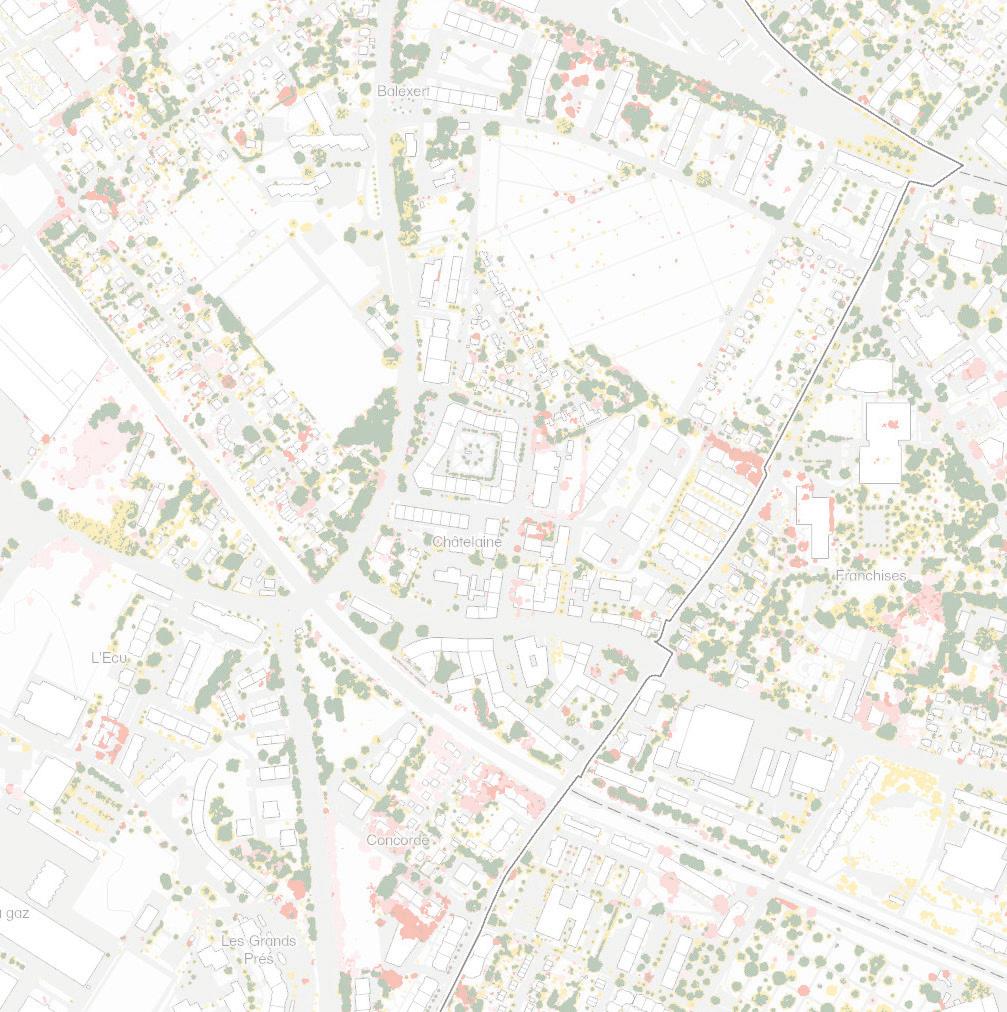
Harvard GSD
Department of Landscape Architecture
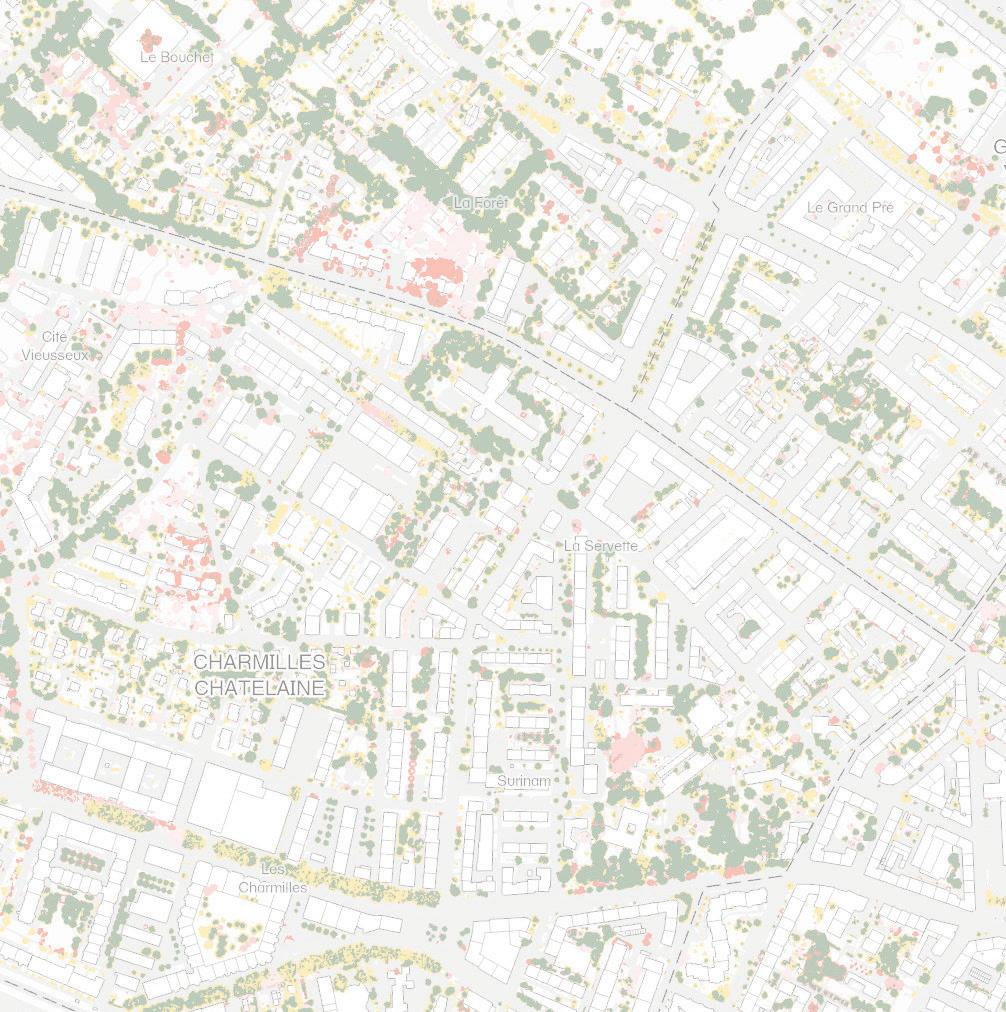
Caroline Brodeur, Michelle Lee, Xinying (Kiesza) Li, Oliver Oglesby, Andrew Ó Murchú, Emma Tracy, Rose Van Grinsven, Nina Zhao
