
December 11, 2015
Edited: January 19, 2016
Prepared for the City of Fayetteville


INTRODUCTION
In August 2015, the City of Fayetteville, Georgia retained the firm of Garner Economics, LLC to create an economic development strategy specific to the City that will take into account the current state of the City and provide a roadmap for Fayetteville to create economic opportunities for its citizens.
The focus of this engagement is for the City to understand the product improvement, marketing, and potential organizational changes it must make to ensure that the City strengthens its competitive position and is able to attract and retain the types of businesses that will create jobs and opportunities for its citizens.
This Competitive Realities Report (CRR) is the first of two reports that will be provided to the City of Fayetteville. It documents the work of the first two elements of the project scope and summarizes the findings of Phase I (see Figure 1 on page 4).
METHODOLOGY
Specifically, the scope of services for the overall project includes:
1) A comprehensive and holistic assessment of key forces driving the economy and its shifting dynamics;
2) An Assets and Challenges Assessment (A&C) of Fayetteville from the perspective of a site location consultant that facilitates investment decisions;
3) Recommendations for business targets suitable for the City based on our research and analysis; and finally,
4) A set of implementable recommendations that the leadership in the City can utilize to enhance the economic well-being of the area and make Fayetteville a desirable business location and enhance its quality of place.
The CRR is a compilation of local facts and data points with quantitative analysis and some subjective opinions noted in the Assets and Challenges Assessment. Together, the Assets and Challenges Assessment, Community Engagement Summary, and the Economic and Labor Analysis inform this process, upon which the strategy and its recommendations will be built.

This CRR offers no recommendations. The final strategy report will consist of the business target recommendations along with conclusions and recommendations for how the City of Fayetteville can enhance its global competitiveness. (The final report will be presented in March 2016.)
Assets and Challenges Assessment
Our approach to creating the CRR began with the consulting team conducting an Assets and Challenges Assessment of the City. This was done through a windshield tour of the area and against a predetermined list of 51 criteria used to evaluate the area from a siteselection perspective. Garner Economics assessed the City based on the qualities, elements, and infrastructure that a business will look for when considering the City as a place for its operations.
The assessment is both an objective and subjective evaluation of the area. We applied many of the same criteria to assess

Fayetteville that we use when engaged by a corporate client in evaluating communities for possible investment. The assessment allows us to document challenges that exist in the City that constitute barriers to successful economic development. By knowing what challenges or gaps exist, the City can take the steps necessary to ameliorate the situation, strengthen its overall “product,” and be a more attractive business location. Likewise, by knowing its strengths, the City can better leverage them in its efforts to attract and retain businesses.
The objectives of the Assets and Challenges Assessment are to:
Help local leaders understand the City’s potential so that they can best develop realistic goals;
Identify key strengths to emphasize in economic development marketing efforts; and
Identify key weaknesses that may limit investment in the City so that remediation of these local challenges may occur.
Project Phases
Phase I: Discovery Phase II: Strategy
Evaluate Fayetteville’s competitive position from an economic development perspective:
Demographic & economic analysis
Labor market & cluster analysis
Community Assets and Challenges Assessment (A&C)
Compare Fayetteville to the benchmark communities of Woodstock, Georgia; Opelika, Alabama; the State of Georgia; and the nation
Retail analysis
Publish the Competitive Realities Report (a summary of Phase I).
Position Fayetteville to achieve success through an actionable strategy addressing:
Business retention
Product planning and development
Entrepreneurship development
Business recruitment and marketing
Workforce needs
Phase III: Implementation Recommendations
High-level implementation plans for actionable items, including:
Targeted business recruitment and marketing strategy
Retention efforts
Organizational recommendations for ED service delivery
Budgeting and phasing
Appropriate engagement with other economic development efforts
Workforce development recommendations
Metrics to track success
Present the final report to an external audience.

Benchmarking
Because Fayetteville must compete with other geographies including those globally it is important to understand where the City stands compared to those key competitors. To conduct such benchmarking, Garner Economics evaluated key demographic and economic indicators for the City and compared the community to statewide and national-level data, as well as to Woodstock, Georgia and Opelika, Alabama. These benchmark geographies were selected by the City of Fayetteville.
The variables against which Fayetteville and the other benchmark cities, the nation, and the state were compared include:
Stakeholder Input
Finally, as a complement to the assessment of the physical and regulatory structure of Fayetteville against its benchmarked peers, Garner Economics conducted three focus groups with key community stakeholders and conducted online surveys to solicit a variety of perceptions of the City’s business climate and areas for improvement.
The following chapters describe our findings within a cohesive economic assessment of Fayetteville’s current state and economic potential. It sets the groundwork for developing strategies and recommendations to assist the City in providing excellent economic development service delivery within the scope of its mission.
Growth trends
Age group composition
Race and ethnicity
Crime rates
Migration trends & sources of change
Composition & sources of income
Proprietor trends
Wage comparison
Retail leakage analysis
Employment growth
Unemployment trends
Exports

CHAPTER 1: COMMUNITY ENGAGEMENT
Garner Economics believes that community input is a vital part of the strategic planning process. In addition to providing a context around the data accumulated in Phase I of the project, feedback from stakeholders in a community provides a way to validate conclusions. Similarly, the input often raises issues or nuances that are critical to understanding the community that may or may not be discernable through desktop research.
Given this, Garner Economics undertook two community engagement streams to better understand the economic development issues facing the City of Fayetteville:
Focus Groups
Three focus groups were held on November 4, 2015, and included representatives from employers within the City, educators, real estate developers, and others engaged in efforts to improve the City’s business climate. The City identified and invited participants for the groups.
The focus groups solicited stakeholders’ perceptions and opinions of the business climate of the City and its economic development efforts. Additionally, questions gauged the stakeholders’ thoughts on the area’s attractiveness to companies and the types of companies that would be a good fit for the region.
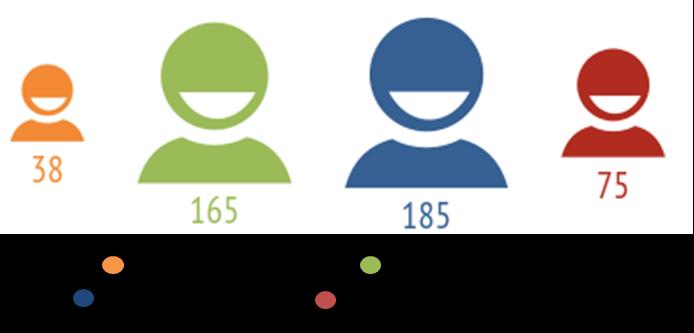
A total of 52 people participated in the three groups. A list of focus group participants is included in Appendix A. Summaries of the groups’ responses to questions posed in each session are included in Appendix B.
Electronic Surveys
Based on feedback received from the focus groups, Garner Economics developed and launched a community survey to solicit feedback from a broader group of Fayetteville’s stakeholders. The survey was open November 16–December 4, 2015, and 182 people completed the survey. Twenty-three percent of the main survey respondents live and work in Fayetteville.
Additionally, a shorter version of the survey was distributed to a group of high school students to gauge their perspective on the future of Fayetteville.
The most frequently provided responses to questions asked during the focus group were used as the response options for the survey. Survey respondents were also given an open-ended section to provide “other” responses. A more detailed profile of the respondents participating in the community survey and responses provided are included in Appendix C.
* For the purposes of the above live/work tally, Fayetteville was defined as those living and/or working in ZIP code 30214 or 30215. Survey results are reported for all respondents regardless of ZIP code of residence or employment.

Key Themes
Feedback from both streams was relatively consistent on broad, overarching issues facing Fayetteville. However, as would be expected given the higher degree of interaction with the economic development organizations and the impact that such service delivery has on their work or livelihood, participants in the focus groups tended to have more detailed perceptions of the economic development process in the City.
Nevertheless, all groups held similar perceptions of issues that inhibit the City’s growth, the strengths of the City, and Fayetteville’s potential.
Among the groups, the overarching key themes that emerged include:
Continuing tensions between encouraging growth in Fayetteville and maintaining the status quo
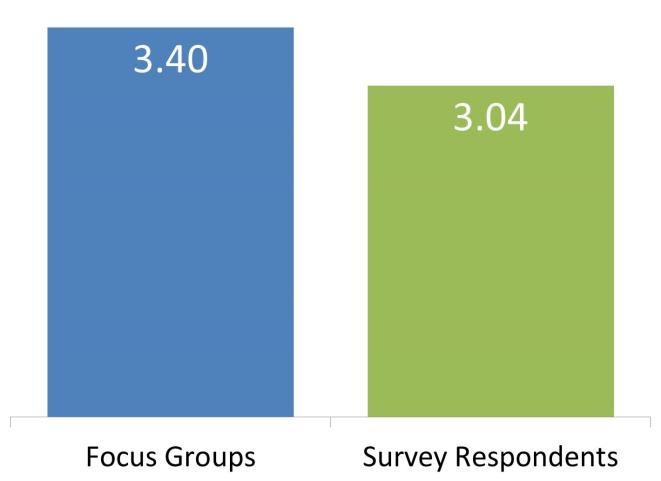
As noted in Figure 2, both groups rated the City’s business climate as slightly above average (a score of 3 is average). Focus groups referenced the City’s reputation of being “anti-growth” in the past, but noted recent improvement and proactive efforts by the City to attract and retain business (though they also noted that much more can be done and that the City should continue these efforts). Some participants noted that, with a few exceptions (e.g., the sign ordinance), the policies and regulations in place are not impediments to growth. However, they note that there are still some in the City leadership who are satisfied with the status quo (i.e., Fayetteville remaining a bedroom community). The majority of the focus group participants would like the City to be more proactive in attracting companies and building a community where people both live and work.
FIGURE 2: COMMUNITY VIEWS OF FAYETTEVILLE’S BUSINESS CLIMATE
Focus group participants were asked to provide a number from 15, with 5 being the highest, to rank the business climate of the City of Fayetteville.* Survey respondents were asked to rank the business climate of Fayetteville on a scale of 1-5—from very weak to very strong with 5 being very strong.
Similarly, survey respondents echoed this polarization and noted perceptions that Fayetteville is anti-growth or that resistance to change is inhibiting companies from locating in and in some cases—remaining in Fayetteville.
While there were several vocal opinions on the need to restrain growth, the majority of respondents see the need to continue to grow the City and to do so in a way that leverages current assets and better distinguishes Fayetteville from other jurisdictions in the Atlanta metropolitan area.
* Business climate is defined by those policies and laws enacted by the local government that impact local businesses.

Need to improve access to and through the City
All of the focus groups and a large number of survey respondents noted the City’s quality of place and its potential to strengthen its competitiveness as a place for businesses. However, they noted that it is difficult to get to Fayetteville and even more difficult to get around Fayetteville. Survey respondents echoed this concern and ranked improving the internal road network and transportation as a high concern. Related to the discussion on access, participants and respondents noted the lack of parking (especially in downtown) as a potential impediment to future growth. Several noted the need to think beyond the City square when considering how to make downtown more of an attraction and more walkable. They also noted that the City should look at better traffic flow on streets of regional significance (i.e., those that regional commuters use, transiting through Fayetteville on the way to their home or work in other jurisdictions).
Lack of amenities for younger professionals and visitors
The focus groups and survey respondents noted the need to attract more corporate employers and businesses that would provide residents of Fayetteville employment alternatives. Both recognized, however, that Fayetteville is at a disadvantage to other areas in the Atlanta metropolitan region as it has few amenities to attract young professionals. Focus group participants also recognized the need to create locations to draw people to Fayetteville from around the region—be it downtown, creating mixed-use complexes, or upgrading retail alternatives.
Of the 20 students responding to the student survey, only four plan to return to Fayetteville after they finish their degree. Those indicating that they have no intention of relocating to Fayetteville after college or an advanced degree cited the lack of job opportunities and things to do.
“You have to make a mistake to come here.”
─Focus Group Participant
“Fayetteville is attractive to seniors living in close proximity to the hospital, but not young families that want easier access to the interstate and amenities.”
─Survey Respondent
“Arts, cultural areas, hip bars and dining options, and edgy retail shopping would attract more 30somethings to live here.”
─Survey Respondent

Opportunity to leverage the energy of Pinewood Atlanta Studios
More so than the survey respondents, focus group participants noted the tremendous opportunities created by the location of Pinewood Atlanta Studios (Pinewood Studios) in the City. Participants were excited about the tie to the Georgia Film Academy and suggested that more be done to leverage the Studios to attract other companies and talent to the City.
A desire for regionalism—on the County level
Recognizing the relatively small land mass of the City and the concentration of companies and residents in neighboring Peachtree City, focus group participants in particular called on the City’s leadership to look at ways to better work with Fayette County and identify ways the City can benefit from, and balance its proximity to, Peachtree City.
Both the focus groups and survey respondents recognize that the County is in a better position to attract companies and improve the overall business climate if it is branded as a collection of aligned and collaborative municipalities.
Recruit companies to Fayetteville, so residents have opportunities closer to home and the City’s tax base is increased
The majority of focus groups and a large number of survey respondents noted the need to increase the tax base in the City and provide closer employment opportunities for its residents.
Respondents and participants recognize the untapped potential of the City and provide suggestions on how to balance growth while maintaining Fayetteville’s small-town character.
“There is ambiguity over what is Fayetteville versus Fayette County. We need one big group working together to improve the entire County—or else we compete against each other.”
More detailed summaries of the focus group discussions and the survey responses are included in Appendices B and C, respectively. Figures 3–7 highlight the feedback in terms of the overall competitive position of the City.
“Fayetteville needs to improve our schools – especially compared to the high schools in Peachtree City. People only want to live in certain school districts; they avoid ones they think are under-performing.”
Focus group participant

FIGURE 3: PRIORITIES TO STRENGTHEN FAYETTEVILLE’S COMPETITIVE POSITION AS A PLACE FOR BUSINESSES AND TALENT
When asked to indicate the top items they would like to see the City leadership take on to strengthen Fayetteville’s ability to attract and retain quality companies and talent to the City without worrying about money or politics the two groups responded as follows:
Most frequently noted by focus groups: Most frequently noted by survey respondents:
Improve access to highways and strengthen the road system within Fayetteville
Create a cultural arts district or performing arts center
Develop an area within the City that is a destination for residents and attracts visitors
Ensure that the school system is ready to address the diversity that the County is experiencing
Communicate the many assets Fayetteville has to offer
Develop downtown and adjacent properties
Attract/retain millennials; serve needs of aging population
Attract and grow jobs/lessen need to out-commute
Fix the internal road system
Create a shopping district that is unique and draws visitors
Ensure that our school system is ready to address diversity
Improve K-12 schools within Fayetteville
Better market Fayetteville to potential tourists/companies
Promote regionalism in Fayette County
Open a new park or nature area within the City
Create a cultural arts district
Host more festivals/events to build community
Encourage developments that are lifestyle centers
Improve inter-city transit
Better leverage and use the Tax Allocation Districts
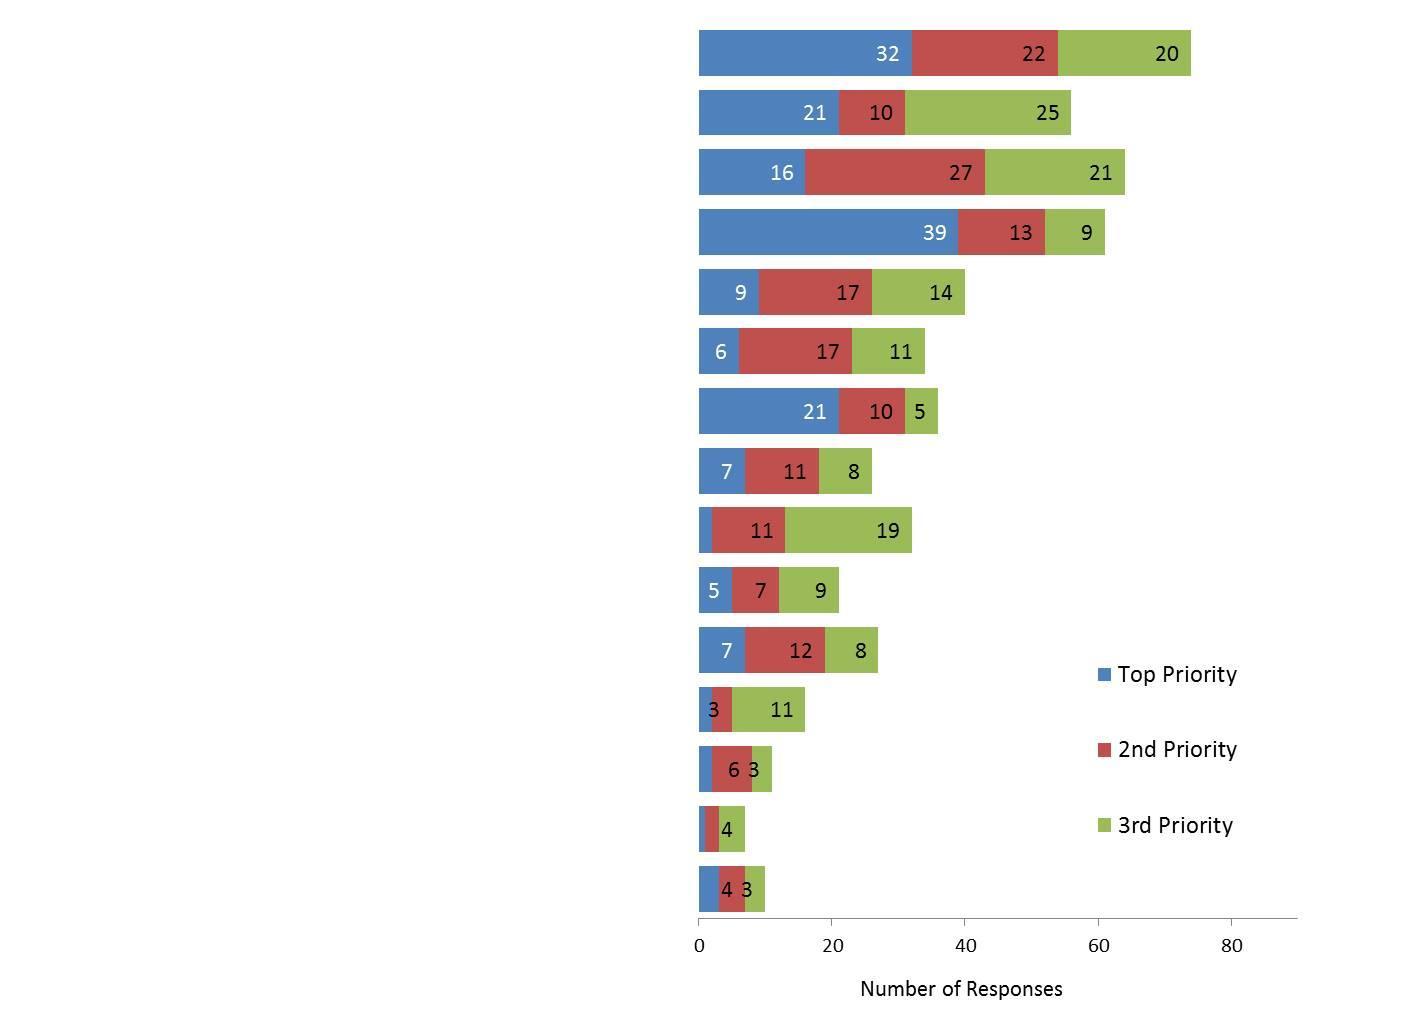

FIGURE 4: PERCEIVED STRENGTHS
When asked to indicate Fayetteville’s strengths, the two groups responded as follows:*
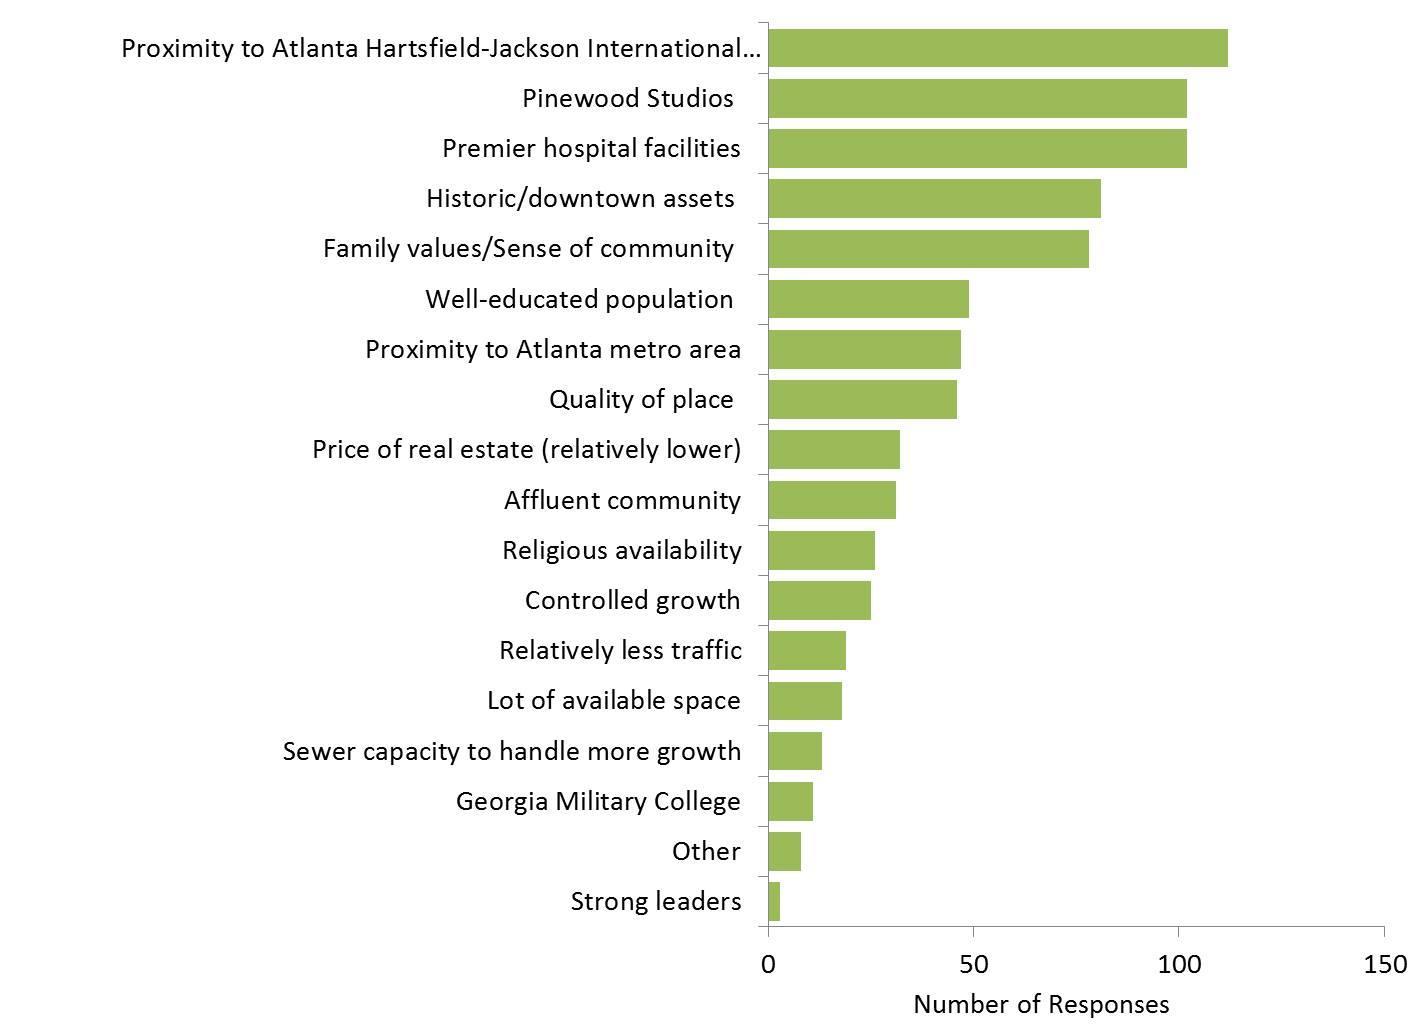
*Survey respondents were asked to choose up to five of the possible options.

FIGURE 5: PERCEIVED INHIBITORS
When asked to indicate issues that inhibit Fayetteville from recruiting businesses, the two groups responded as follows:*
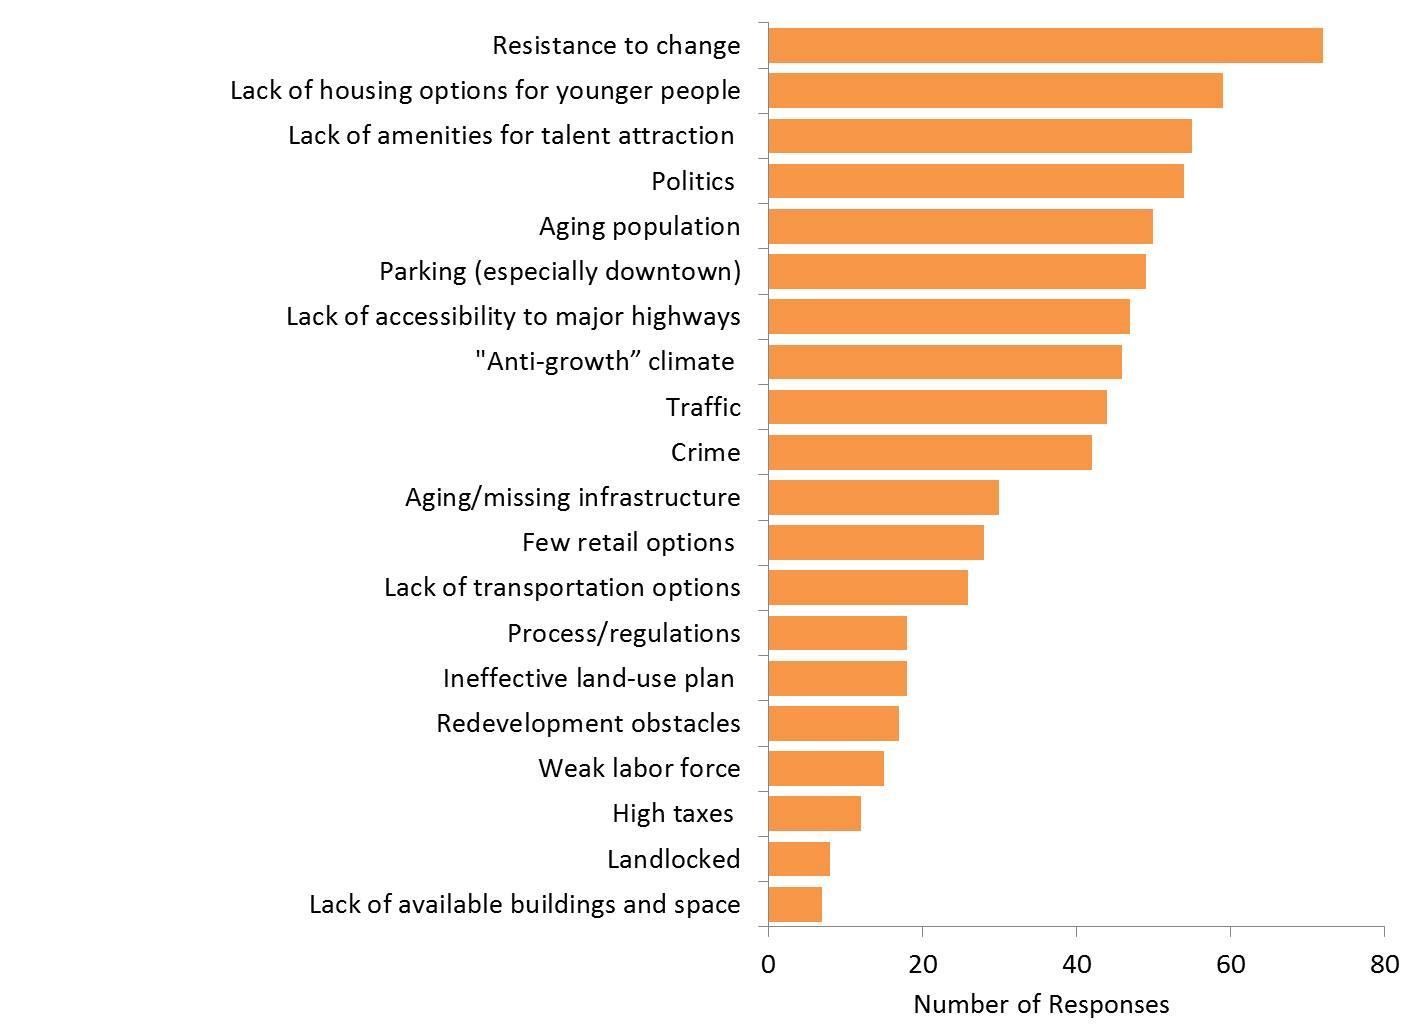
*Survey respondents were asked to choose up to five of the possible options.

When asked what types of companies would be a good fit for the area, the two groups responded as follows:


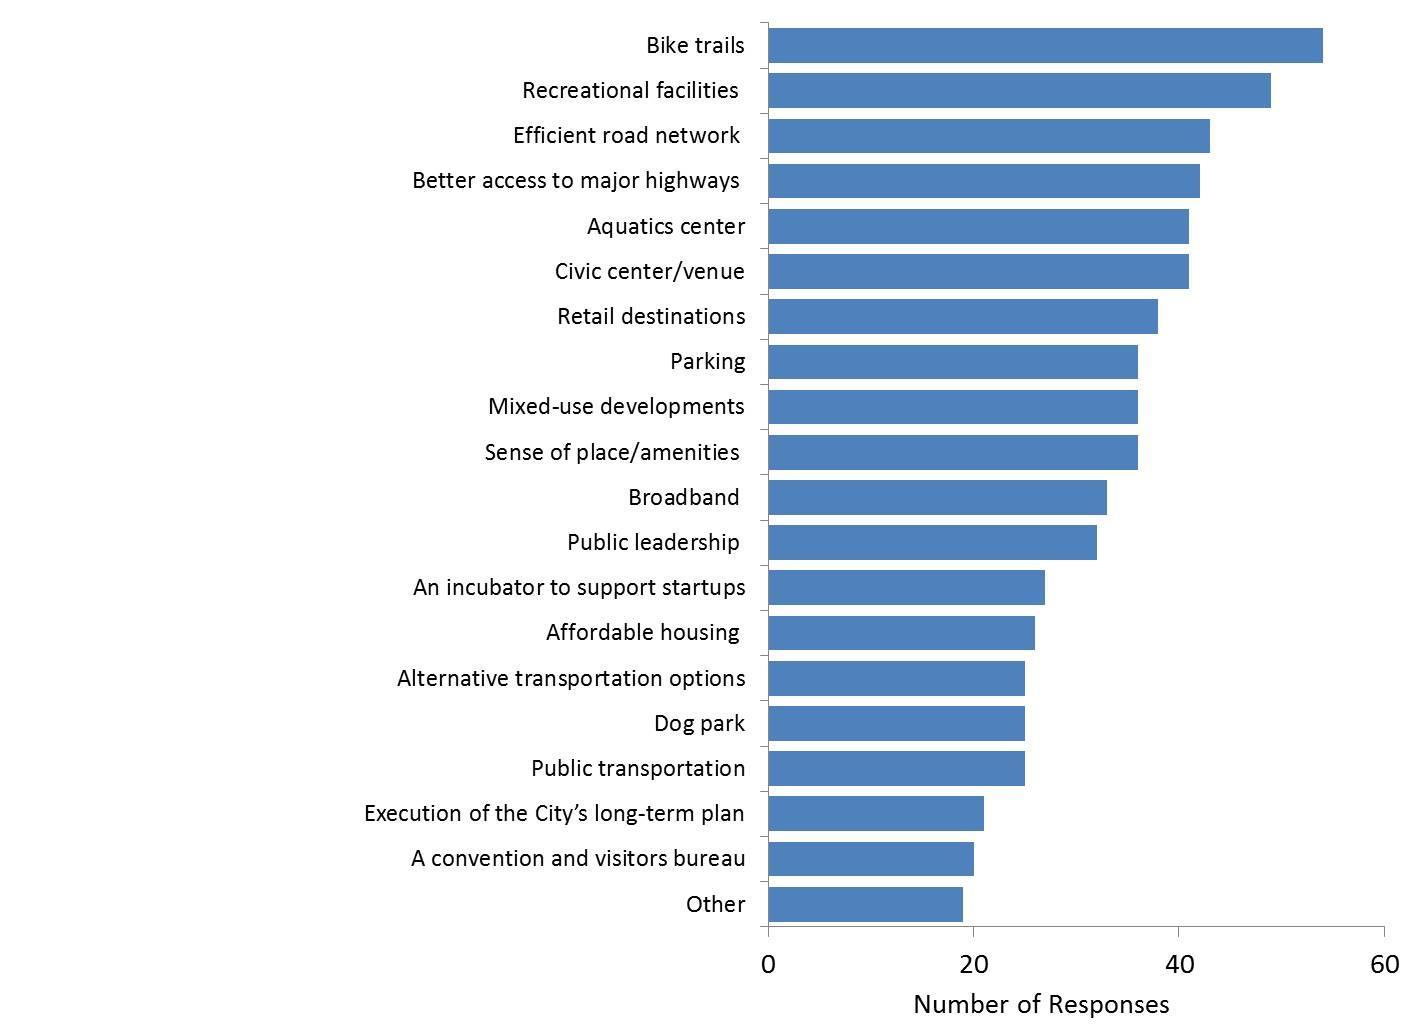
FIGURE 7: LACKING INFRASTRUCTURE
When asked what hard or soft infrastructure* is weak or missing in Fayetteville, the survey respondents ranked the items as follows below. Focus group participants most frequently noted the need for a more efficient road network and parking.
*Hard infrastructure was defined as the physical networks such as roadways, sewer, broadband Internet, airports and/or ports. Soft infrastructure was defined as institutions or places that support the economic, health, and cultural climate of a place, such as the education system, the health care system, system of government, and/or parks.
Note: Survey respondents were asked to choose up to five of the possible options.

CHAPTER 2: ASSETS AND CHALLENGES ASSESSMENT

The City of Fayetteville offers a unique mix of assets for businesses that are contemplating relocation, expansion, or a startup. Our approach in conducting the Assets and Challenges Assessment (A&C) is to employ the same criteria and methodology we use when we conduct a community evaluation for our corporate clients when exploring locations for investment. By understanding its assets and challenges from a location strategy perspective, we believe that the City will be better positioned to compete more effectively and to resolve area challenges that are likely inhibitors to investment projects. By recognizing and understanding strengths and opportunities, the City will ultimately be able to determine the proper target audience of companies to which it should effectively communicate the area’s assets.
Garner Economics analyzed 51 community factors as part of the assessment. Ratings were identified by evaluating the City’s position for each of the factors against the State of Georgia, the United States, and in many instances, the benchmarked cities of Woodstock, Georgia and Opelika, Alabama.
We define a Neutral rating as normal in the realm of economic development opportunity and competitiveness. An Asset rating indicates a positive feature of the City that would be evaluated and rated as a competitive strength versus the benchmark locations.
A Challenge rating identifies a factor that is considered a relative deficiency compared to other locations (or from the perspective of the consultants), which should be addressed with future
remediation and may be an impediment to economic development if not resolved over time.
Of the 51 variables analyzed, 17 are considered an Asset and 20 a Challenge (13 rated as Neutral). With 20 challenge rankings, Fayetteville has too many in the negative column based on the ratio of an economically healthy, dynamic city. The goal in the future will be for those policymakers engaged in local economic development to move the bar with the neutral rankings from neutral to an asset, and the challenge ranking to neutral (or better).
To enable a summary overview of the report’s main findings for readers, a set of dashboard icons is presented. Each finding has an accompanying icon to assist with interpretation. Readers are encouraged to review the supporting data to gain a more complete understanding of those areas of interest in the full report.
REPORT DASHBOARD

Indicates the City is better (more positive) compared to a majority of the benchmark geographies or points to a positive trend or asset within the area.
Indicates the City is neutral or normal, neither positive nor negative. Indicator may represent an observation or be in the middle of the benchmark geographies.
Indicates the City is worse compared to a majority of the benchmark geographies or points to a negative trend or challenge within the area.

Access to Markets
Fayetteville’s geographic location makes it an ideal community for domestic and international business accessibility. The City is within 400 miles of over 57 million people. Atlanta Hartsfield-Jackson International
Airport is less than 18 miles away. Fayette County’s Atlanta Regional Airport–Falcon Field is close by in Peachtree City. According to the National Telecommunications and Information Administration, households in Fayetteville have the greatest access to DSL compared to the benchmark cities, the County, state, and nation—with 98.5% of households having access. Challenges include no direct interstate access, inland port facilities, or rail service.


City Economic Development Program
The City does not have a true economic development department in the traditional sense. Rather, it has a community development department that serves as the ad hoc economic development entity for the City, including managing and administering Planning and Zoning, the City's Main Street Program, and operating The Southern Ground Amphitheater. They provide staff support to the City of Fayetteville Downtown Development Authority and the Fayetteville Main Street Tourism Association. With 2.5 FTEs, they perform admirably. However, the City wishes to enhance its economic development efforts and, as such, they will need to grow their economic development initiative and staffing. The City’s community development budget (economic development) is $275k, which is significantly below Opelika and the average benchmark in the southeast of $500k for a community the size of Fayetteville.

Access to Space
The City has virtually no excess space for industrial use. There is currently a 3 percent vacancy rate. Conversely, office and retail space is an asset with a 13.23 percent vacancy rate for office and a 9.91 percent vacancy rate for retail. However, as the City works to attract more office and boutique retail, more Class A space will be needed.
Access to Capital
Most of the jobs created in today’s national economy are through entrepreneurs. Those communities that have innovative and creative programs that support and nurture entrepreneurs are those communities that have a sustainable and healthy economy. Fayetteville has no formalized venture or early stage capital program to assist entrepreneurial development. Low-interest loans for small businesses are typically provided by local banks and state programs and the Georgia Cities Foundation Revolving Loan Fund.

The availability and capacity of wastewater treatment (wastewater demand is 2.124 MGD and capacity is 5.0 MGD), the availability of labor training incentives (Georgia’s Quick Start), and the level of City property taxes compared to its benchmarks are all an asset. Challenges include the current availability of water demand and capacity and SAT scores for Fayette County High School compared to its benchmarks.

A city’s quality of place is what differentiates a community. Fayetteville has a number of unique assets to help in that differentiation. Availability of executive-level housing, cost of living, level of cultural activity, diversity of shopping options, and quality health care are all assets. Challenges include the variety of local eating establishments, availability of AAA-rated properties with three diamonds or more, availability of recreational facilities, and the availability of apartments which are all seen as challenges. Level of crime, the availability of moderate-cost housing, the appearance of the community as a whole, and the Central Business District (CBD) are all considered neutral.

CHAPTER 3: DASHBOARD INDICATORS SUMMARY AND DATA METHODOLOGY

The following analysis examines the economic position and competitiveness of the City of Fayetteville, Georgia. For context, this report compares the City to itself over time, the nation, the State of Georgia, and two benchmark cities: Woodstock, Georgia and Opelika, Alabama. Where city-level data is unavailable, either zip code or county-level information is used. In particular, retail
Demographic & Labor Dynamics


leakage, wage and employment data (pages 61-78) use the zip codes of 30214 and 30215.
This analysis relies heavily on raw objective data collected by governmental or impartial third-party agencies. In all cases, the original and most current available data as of October 2015 is used. Garner Economics conducted all unique calculations and computations from the original data. Additional information and methodology is included in the Appendices of this report.
Over the last decade, the total population of Fayetteville has increased 16.1% or 2,698 residents; the rate is above the nation, the state, Fayette County, and Opelika, but below the benchmark city of Woodstock.
Over the last five years, the annual rate of population growth in Fayetteville has been 1.5%, while over 10 years, the rate averaged 2.2%. Fayetteville’s 5- and 10-year annual pace of population growth is above Opelika, Fayette County, the state, and the nation.
Over the 2009 to 2013 period, Fayetteville attracted 36.5% of its new residents from a Different County in Same State, a higher proportion than was experienced in both benchmark communities, the state, and the nation. Fayetteville attracted the lowest relative proportion of new residents from a Different State. The City also attracted the second highest percentage from Abroad.
Among all of the study areas, Fayetteville has the second most racially diverse population.
At 41.2 years, the median age in Fayetteville is higher than both benchmark cities, the state, and the nation, but slightly lower than the County median.
Fayetteville’s highest proportion of residents is in two age groups: 35–44 and 45–54. Fayetteville has a lower share of residents in age groups 25–34 than both benchmark cities.
Fayetteville’s violent and property crime rates were below Opelika, the state, and the nation, but above Woodstock and the County.

Demographic & Labor Dynamics (continued)


Educational attainment among the majority of Fayetteville’s population ages 25+ holds at least a high school diploma, with 42% holding a Bachelor’s Degree or Graduate or Professional Degree. With the exception of Woodstock, Fayetteville has the lowest proportion of residents whose highest level of educational attainment is Less than 9th Grade.
At 1379, Fayetteville’s 2015 composite SAT total score for Fayette County High School is below all of the study areas.
Fayette County High School and the entire district rank above allother benchmark except Opelika in high school graduations rates.
Among Fayetteville’s new residents ages 25 and over, 42.3% hold a Bachelor’s Degree or higher. This is greater than Opelika, the state, and the nation, and only slightly lower than Woodstock and the entire County.
Among Fayetteville residents ages 25 and over, median earnings areon par with the state and nation for all categories of educational attainment, however, lower than Fayette County. Earnings were lower than Woodstock as well, with the exception of the Graduate or Professional Degree category.
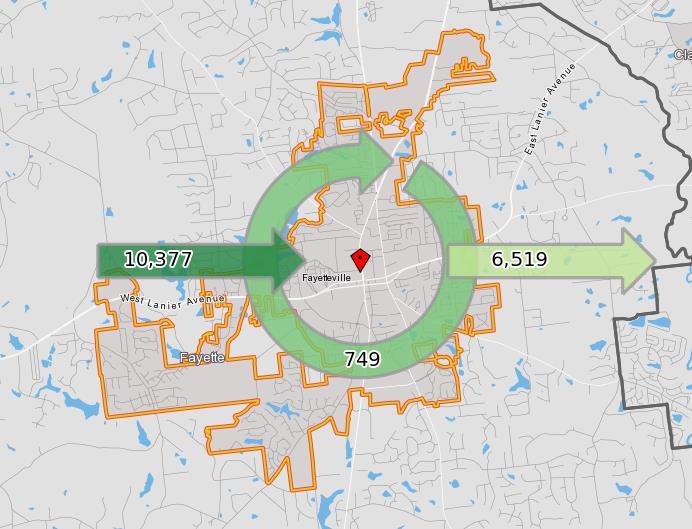
58.8% of those working in Fayetteville live outside the area (in-commute).
6,519 workers that live in Fayetteville travel outside the area for employment (out-commute).
Over the last 10 years, the number of workers Living in Fayetteville but Employed Outside (out-commuters) has increased 40.8% or 1,890 more workers.

Economic Dynamics


The 2015 estimated average weekly wage in Fayetteville is $719. The average wage applies to employees that work in Fayetteville regardless of residence. This average wage is the third lowest among the study areas, with the lowest in Opelika.
Over the five year period of2010 to 2015, the estimatedaverage weekly wage in Fayetteville increased by $26 or3.7%. This increase is well above the benchmark city of Opelika, but behind Woodstock, the County, the state, and the nation.
For 2013, the per capita income in Fayetteville was $30,036, which was higher than the Opelika, as well as the state and the nation, but lower than Woodstock and Fayette County.
Over 11.2% of workers in Fayetteville classify themselves as Self-Employed, which is the second only to Fayette County which had 11.4% SelfEmployed.
Median earnings among those Fayetteville workers classified as Self-Employed in Own Not Incorporated Business were the lowest among the study areas at $18,049.
Among residents ages 16 and over in Fayetteville, 58.1% are employed, which falls between the two benchmark cities, is below the County, but above both the state and nation.
Fayetteville’s proportion of families with two income earners (Married, Husband and Wife in Labor Force) is 43.3%, which is higher than Opelika, the state, and the nation, but lower than Woodstock and the County.
Compared to the nation and the state, Fayetteville has the highest total share of households with incomes in the $15,000 to $24,999 category. Fayetteville’s proportion of those above $100,000 is 26.4%, which is below the overall county average of 38.5% and Woodstock’s average of 28.5%.
Of 20 major industry categories, Fayetteville has the highest relative percentage in one industry: Health Care and Social Assistance.
The 2015 composite cost-of-living index for Fayette County-Fayetteville is estimated to be 93.4. This is lower than Auburn-Opelika and the national average.
Households in Fayetteville have the greatest access to DSL and cable broadband compared to the benchmark cities, the County, state, and nation.

Economic Dynamics (continued)


Fayetteville’s average percentage of retail leakage is 59.4, indicating that shoppers from Fayetteville spend less than half of their disposable income in the City.
The largest retail gap (indicating local consumers travel outside Fayetteville to satisfy their retail demands) is in Motor Vehicle & Parts Dealers at $212.9 million, followed by General Merchandise Stores with an $86.2 million gap.

Local Specialization, Competitiveness & Growth
Below are general observations from an in-depth analysis of industry sectors and occupational groups in Fayetteville. This information is not benchmarked to the nation, the state, or benchmark cities:
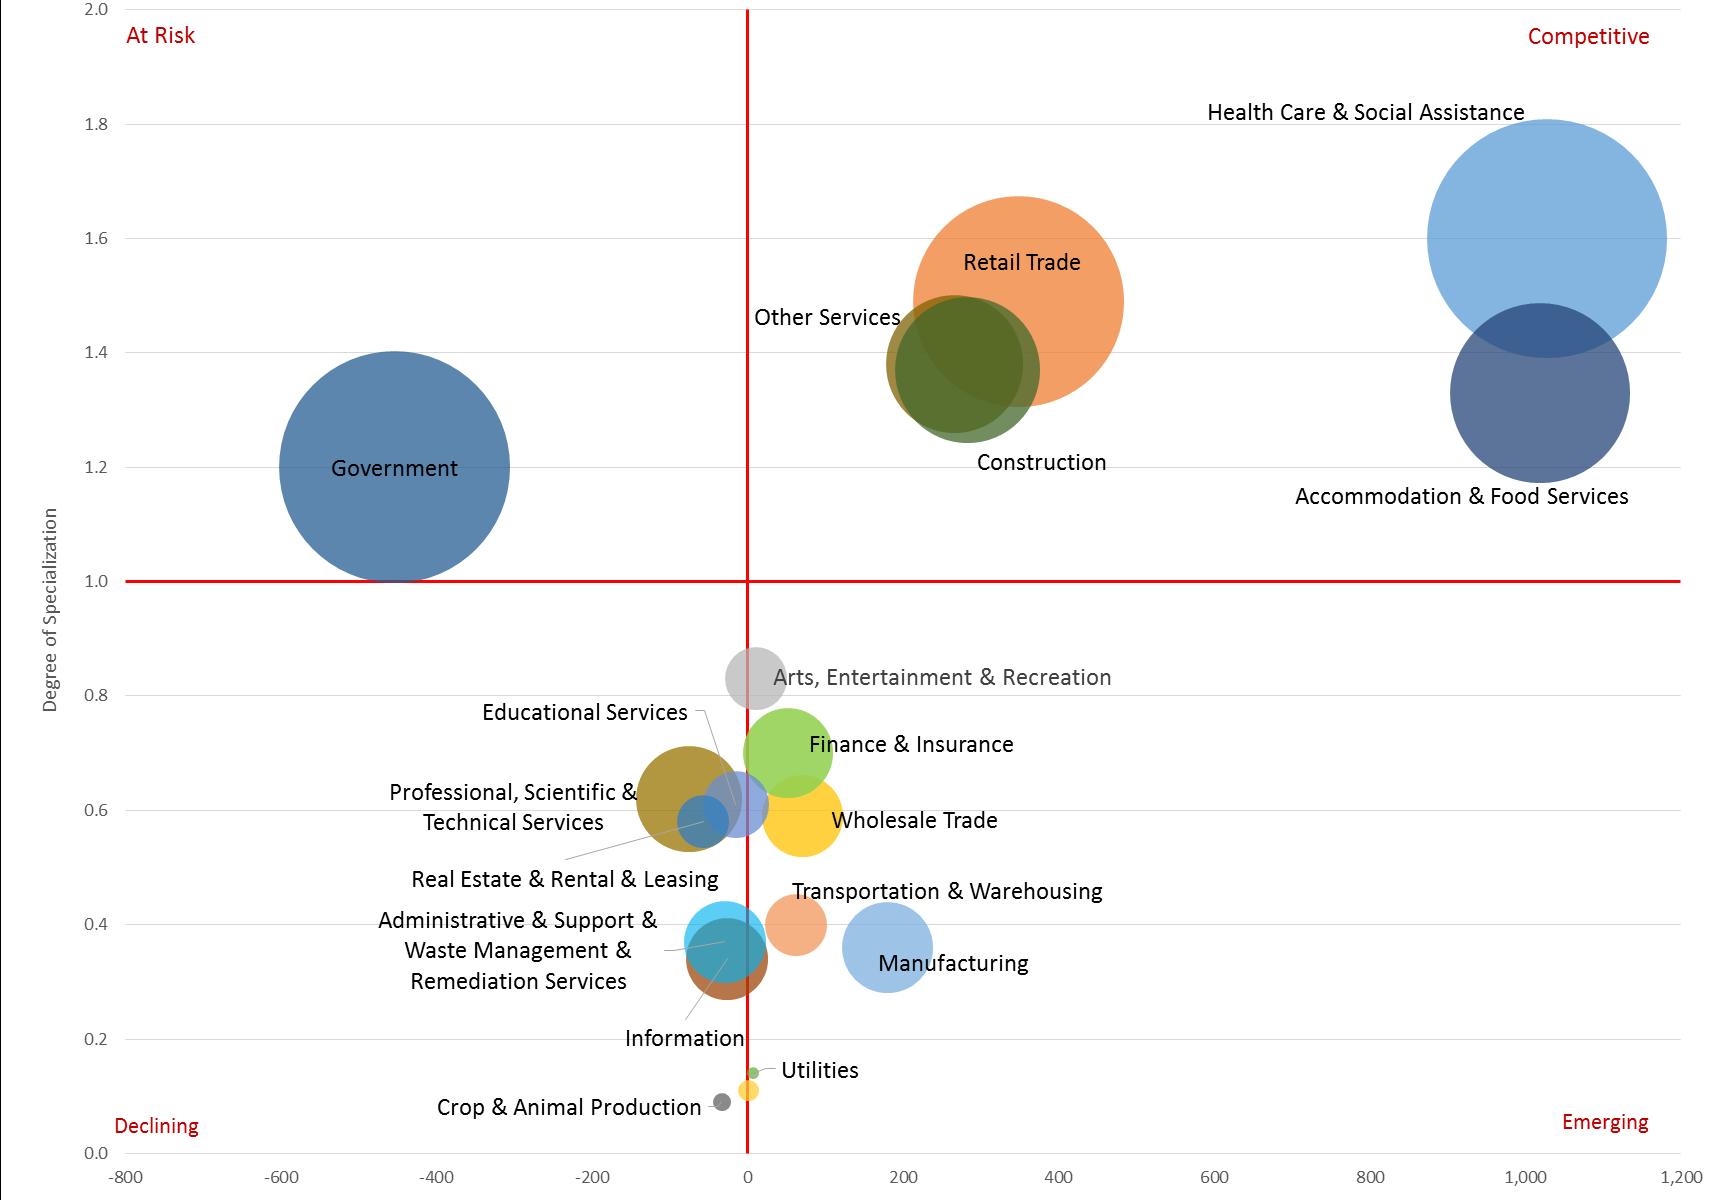
Since 2010, the largest absolute industry jobs gains in Fayetteville came from Health Care & Social Assistance, up 1,028 jobs or 27 percent, followed closely by Accommodation & Food Services, up 1,019 jobs or 61 percent.
There were significant job losses in Government (-454 jobs or 9 percent); Professional, Scientific & Technical Services (-75 jobs or 7 percent); Real Estate & Rental & Leasing (-57 jobs or 20 percent); and Crop & Animal Production (-33 jobs or 56 percent).
Industrial average earnings in Fayetteville are above the national same-industry average in two major sectors: Manufacturing (10.3 percent higher) and Transportation & Warehousing (8.8 percent higher).
Over the last five years, the single largest absolute occupational gains in Fayetteville came from Food Preparation & Serving Related, up 909 jobs or 48 percent.
Fayetteville’s median hourly earnings are above the nation for Military and Farming, Fishing & Forestry, but below the nation for the other 22 occupational sectors.
Five industry sectors in Fayetteville have a level of local specialization above 1.0 (which indicates a larger percentage than the national average) and have grown within the last five years: Health Care & Social Assistance, Accommodation & Food Services, Retail Trade, Construction, and Other Services. The single industry at risk is Government, which has a strong local specialization at 1.2 but experienced a loss of 454 jobs over the past five years.
Motion Picture and Video Production, a sub-sector of the Information category, may be classified as an Emerging industry due to new studios in Fayetteville. Using the Atlanta MSA and the State of Georgia as comparisons, both show this sub-sector as Emerging.
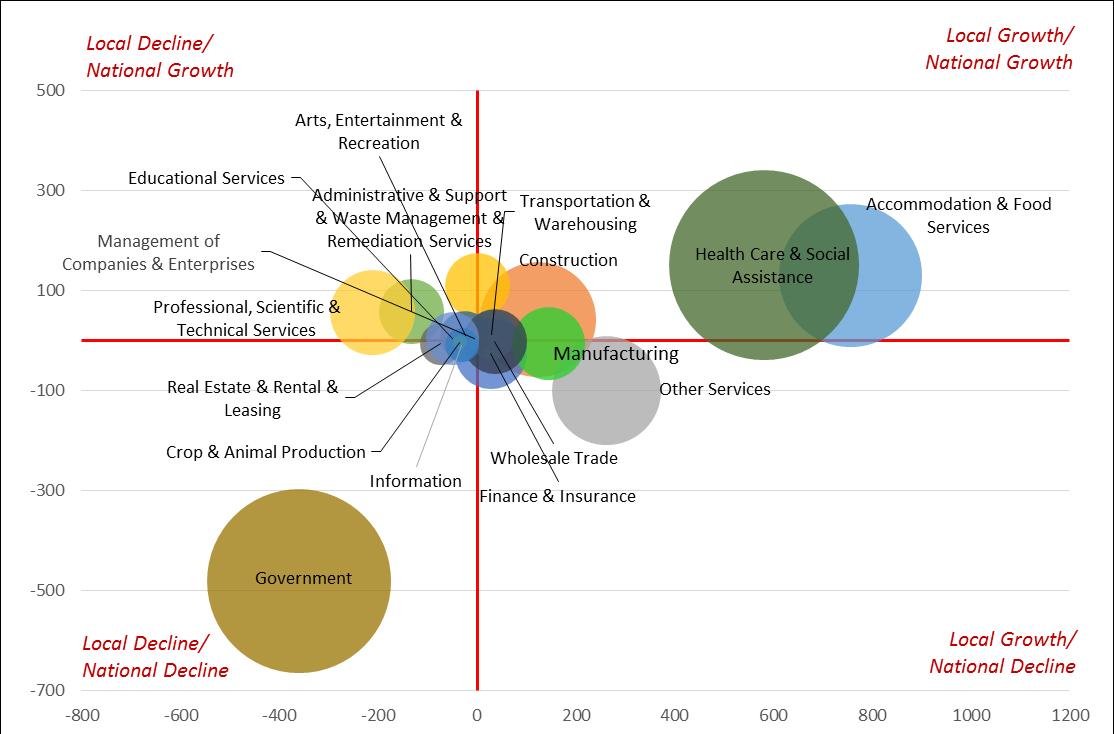
Four main industry sectors with strong local competitive effects were Accommodation & Food Services, Health Care & Social Assistance, Construction, and Transportation & Warehousing.
Over the last five years, the occupational groups of Food Preparation & Serving Related, Healthcare Practitioners & Technical, Sales & Related, Healthcare Support, Construction & Extraction, Personal Care & Service, and Community & Social Service each experienced job growth while exhibiting local specialization.

CHAPTER 4: DEMOGRAPHIC & LABOR DYNAMICS

Population Growth
The rate of population growth can be a significant factor in local economic health and is often a key consideration in business expansion and site-selection decisions. Most firms are wary of areas with population declines, very slow growth rates, or significant amounts of domestic out-migration.
Fayetteville’s population has grown by 2,698 (to 16,725 residents) over the past decade. This marks an increase of 16.1 percent, which is above Opelika, Fayette County, the state, and the nation, but below the benchmark city of Woodstock (Figure 8 and Table 1).
As with most areas in the nation, the pace of population growth in Fayetteville has been slowing over the past decade. Over the last five years, the annual rate of population growth in Fayetteville has been 1.5 percent, while over 10 years, the rate averaged 2.2 percent (Table 2). Fayetteville’s 5- and 10-year annual pace of population growth is above the County, the state, and the nation. The rate of change falls below Woodstock and Opelika’s 5-year growth rate.

Source: US Census Bureau Population Estimates, Garner Economics
Source: US Census Bureau Population Estimates, Garner Economics

Sources of New Residents
Attracting new residents from a diversity of outside locations can reflect a community’s broader appeal and provide an indicator of economic dynamism to businesses.
Fayetteville attracted 36.5 percent of its new residents from a Different County in Same State, a higher proportion than was experienced in both benchmark cities, the state, and the nation (Figure 9 and Table 3). Fayetteville attracted the lowest relative proportion of new residents from a Different State. Both Fayetteville and Fayette County attracted a higher proportion of new residents from Abroad—slightly below Fayette County, however more than other benchmarks, the state, and the nation.
Table 3
2009–2013 Five-Year Estimates Previous Location of Residents That Had Moved One Year Earlier
Source: US Census Bureau
Figure 9
2009–2013 Five-Year Estimates

Population by Race and Hispanic Origin
By itself, racial diversity is not a determinant factor in local economic competitiveness, although some firms may prefer higher rates of diversity in order to attract and retain certain workers. This is particularly true for multinational firms looking to attract workers from outside the United States.
Relative to the benchmark cities, the County, the state, and the nation, Fayetteville has a higher proportion of residents classifying themselves as Asian and Two or More Races (Table 4). Among all of the study areas, Fayetteville has the second most racially diverse population.
Table 4
2009–2013 Five-Year Estimates
Race & Hispanic Origin by Percentage of Total Population (Highest Relative Figure Shaded)
Source: US Census Bureau American Community Survey, Garner Economics

Age
The age composition of a local population can be an important determinant in business decisions and competitiveness. The lack or underrepresentation of younger workers may deter firms from considering some communities for their long-term plans. Low proportions of middle-aged workers may prevent firms from initiating expansions requiring quick startup operations. A high proportion of older workers may indicate certain incumbent skills or the need to replace soon-to-retire workers.
Table 5
Median Age
At 41.2 years, the median age in Fayetteville is higher than both benchmark cities, the state, and the nation, but slightly lower that the county average (Table 5 and Figure 10).
Source: US Census Bureau American Community Survey, Garner Economics

Source: US Census Bureau American Community Survey, Garner Economics

Age Group Composition
Fayetteville’s highest proportion of residents is in two age groups: 35–44 and 45–54 (Figures 11 & 12 and Table 5). Fayetteville has the highest proportion of those aged 85 and older. Both Fayetteville and
11
Five-Year Estimates
Fayette County are below all other geographies in the Ages 25–34 category.
Figure 12 2009–2013 Five-Year Estimates
Groups by Percentage of Total Population
of Population
Groups
Groups
Source: US Census Bureau American Community Survey, Garner Economics

Crime
Crime rates may seem outside the typical measures of economic competitiveness, but they represent a widely accepted objective gauge used by firms. Crime rates generally reflect underlying economic conditions and may signal deeper systemic problems better than standard economic measures.
In 2014, Fayetteville’s violent crime incidents reported were well below Opelika and slightly below Woodstock. The crime rate per 10,000 residents for Fayetteville is higher than Woodstock and Fayette County but lower than Opelika, the state, and the nation (Figure 13, 14 and Table 6).
Source: FBI Uniform Crime Reports, Georgia Bureau of Investigation, Garner Economics
*Fayette County rate consists of reported crime from the Fayette County Sheriff’s office, Fayetteville, Peachtree City, and Tyrone police

Education
Increasingly, the level of education of a community’s population is becoming a decisive factor in economic competitiveness. Firms understand the need to operate in economies that offer a sufficient supply of workers that meet or exceed their demands. They also know that the lack of an educated workforce can significantly affect business performance.
Educational Attainment
Educational attainment among the majority of Fayetteville’s population ages 25+ holds at least a high school diploma, with 42 percent holding a Bachelor’s Degree or Graduate or Professional degree. (Figure 15, Figure 16, and Table 7). With the exception of Woodstock, Fayetteville has the lowest proportion of residents whose educational attainment was Less than 9th Grade.
Table 7
2009–2013 Five-Year Estimates
Educational Attainment, Percentage Total Population Age 25+ (Highest Relative Figure Shaded)
Source: US Census Bureau American Community Survey, Garner Economics


SAT Scores
The SAT exam is a standardized test for college admissions in the United States and a widely accepted measure of education quality. SAT scores are especially relevant to businesses because they provide a measure of the “final product” of public schools and the educational quality of those entering the workforce.
At 1379, Fayetteville’s 2015 composite SAT total score is below all of the comparison study areas (Table 8 and Figure 17).

High School Graduation Rates
The share of high school students graduating within four years of beginning 9th grade is another important measure of the performance of local school districts. Fayette County School District has the second highest graduation rate at 89.5 percent, behind Opelika High School, the only high school within the City’s school district. Fayette County High School ranks above Woodstock High School and Cherokee County School District (including Woodstock), as well as the state and the nation. (Table 9 and Figure 18).
Source: Georgia Department of Education; Alabama State Department of Education, National Center for Education Statistics *2013 data
Source: Georgia Department of Education; Alabama State Department of Education, National Center for Education Statistics *2013 data

Population In-Migration by Educational Attainment
Among Fayetteville’s new residents ages 25 and over, 42.3 percent hold a bachelor’s degree or higher. This is greater than Opelika, the state, and the nation, but only slightly lower than Woodstock and the entire County (Table 10 and Figure 19). Conversely, the area attracts a lower relative proportion of new residents whose highest level of educational attainment is Less than High School Graduate than all of the study areas other than Woodstock and the County as a whole.
Table 10
2013 Educational Attainment by Percentage of New Resident Population Ages 25 and over (Highest Percentage Shaded)
Source: US Census Bureau American Community Survey, Garner Economics

Figure 19
2009–2013 Five-Year Estimates
Educational Attainment by Percentage of New Resident Population Ages 25 and over
Percentage of New Residents
Less than High School Graduate High School Graduate Some College or Associate Degree Bachelor's Degree Graduate or Professional Degree
Source: US Census Bureau American Community Survey, Garner Economics

Median Earnings by Level of Educational Attainment
Among Fayetteville residents ages 25 and over, median earnings are higher than the category averages for Less than High School Graduate, Bachelor’s Degree and Graduate or Professional Degree. Although neither the highest nor lowest in any individual category, median earnings are the second highest for Less than High School Graduate and Graduate or Professional Degree. (Table 11, Figure 20, and Figure 21).
Table 11
2009–2013 Five-Year Estimates
Median Earnings by Educational Attainment Ages 25+
(Inflation-Adjusted 2013 Dollars, Highest Relative Number Shaded)
Source: US Census Bureau American Community Survey, Garner Economics

Figure 20
2009–2013 Five-Year Estimates
Median Earnings by Educational Attainment Ages 25+
(Inflation-Adjusted 2013 dollars)
Figure 21
2009–2013 Five-Year Estimates
Median Earnings By Educational Attainment Ages 25+
(Inflation-Adjusted 2013 dollars)
Source: US Census Bureau American Community Survey, Garner Economics
Source: US Census Bureau American Community Survey, Garner Economics

Worker Flows
Worker flows help define the size of a local economy’s labor draw, and trends help describe attraction and regional competition. Worker flows represent both daily commuters and short-term, away-from-home assignments (major construction projects, on-site consulting, etc.).
In 2013, of those working in Fayetteville, 749 or 4.2 percent of the total workforce also lived in Fayetteville. More significantly, 10,377 or 58.8 percent of workers in Fayetteville lived outside the area (incommute). Another 6,519 or 36.9 percent of workers that lived in Fayetteville traveled outside the area for employment (outcommute) (Table 12 and Figure 22).
Over the last 10 years, the number (and proportion) of workers who both live and work in Fayetteville has decreased 5.5 percent or 44 workers (Table 12 Figure 23, and Figure 24). Over the same period, the number of workers Employed in Fayetteville but Living Outside (in-commuters) increased by 23.1 percent or 1,945 more workers. Most significantly, the number of workers Living in Fayetteville but Employed Outside (out-commuters) increased 40.8 percent or 1,890 more workers.
In 2013, 18.9 percent of Fayetteville’s resident workforce (1,371) was employed in the City of Atlanta (Table 13).
*The Census Bureau counts one primary job per worker.
Source: US Census Bureau, LHD, Garner Economics
*The Census Bureau counts one primary job per worker. Source: US Census Bureau, Garner Economics
*The Census Bureau counts one primary job per worker.
Source: US Census Bureau, Garner Economics

24 Fayetteville Worker Flows

Effective Labor Draw
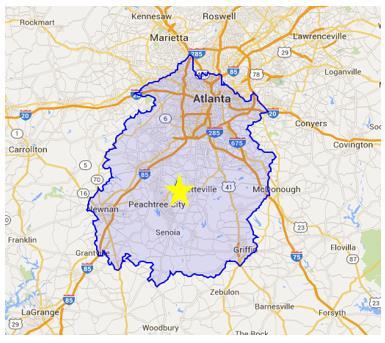
The effective labor draw considers the documented labor pool for a particular geographic location based on the existing residential workforce and local road network. The analysis considers the pool of active workers residing within representative drive-time radiuses from a site. The analysis does not rely on broad aggregates, but instead on actual demonstrated worker behavior within the established street and highway system.
According to a calculation of a 45-minute drive-time from Fayetteville, the United States Census Bureau estimates a total active residential workforce of 2,475,397 people as of 2015 (Figure 25 and Table 14). A more constrained 30-minute drive-time from the site shows a total active residential workforce of 1,374,518 people.
The number of active residential workers in the 45-minute and 30minute drive-time labor draw areas has grown over the last 10 years. The 10-year change was 10.2 percent within the 45-minute drive-time area and a total increase of 229,326 workers overall. Within the 30-minute drive-time area, the change was 8.8 percent and an 111,735 worker increase over 10 years (Table 14).
Source: STATS Indiana, Garner Economics
Figure 25
Effective Labor Draw
45-Minute Drive-Time
Source: Georgia Power Company–Economic Development Department, Garner Economics

CHAPTER 5: ECONOMIC DYNAMICS

Estimated Average Weekly Wage
The 2015 estimated average weekly wage in Fayetteville is $719. The average wage applies to employees that work in Fayetteville regardless of residence. This average wage is the third lowest among the study areas, with the lowest in Opelika. (Table 15 and Figure 26).
Over the five-year period of 2010 to 2015, the estimated average weekly wage in Fayetteville increased by $26 or 3.7 percent. This increase is well above Opelika and Fayette County, but behind Woodstock, the state, and the nation. (Table 15, Figure 27). Table 15
Source: EMSI 2nd Quarter 2015, Garner Economics


Per Capita Income
Per capita income is the mean annual income computed for every man, woman, and child, derived by dividing the aggregate income by the total population. Unlike the previously examined estimated weekly wage, per capita income is a measure for all residents of Fayetteville, regardless of where they work.
For 2013, the per capita income in Fayetteville was $30,036, which was higher than Opelika, the state, and the nation, but lower than Woodstock and Fayette County (Table 16 and Figure 28). Table 16
Figure 28
Source: US Census Bureau, Garner Economics
Source: US Census Bureau American Community Survey, Garner Economics

Self-Employment
Measuring the relative proportion of workers who are selfemployed is a rough means to gauge entrepreneurial activity, which, in turn, can provide a view of local risk-taking and economic dynamism.
In 2013, 11.2 percent of workers in Fayetteville were self-employed. This proportion is the second highest of all of the study areas. (Table 17 and Figure 29). Opelika had the lowest percentage at 6.8.
However, median earnings among those Fayetteville workers classified as Self-Employed in Own Not Incorporated Business were the lowest among the study areas (Figure 30 and Table 18) at $18,049.
Table 17
2009–2013 Five-Year Estimates
Self-Employed as a Percentage of Workers 16 Years+ (Highest Relative Number Shaded)
Percentage of Workers
Figure 29
2009–2013 Five-Year Estimates
Self-Employed as a Percentage of Workers 16 Years+
Source: US Census Bureau, Garner Economics
Self-Employed in Own Not Incorporated Business Workers and Unpaid Family Workers
Self-Employed in Own Incorporated Business Workers
Source: US Census Bureau, Garner Economics


Labor Force Participation
Among residents ages 16 and over in Fayetteville, 58.1 percent are employed, which falls between the two benchmark cities and is below the County, but above both the state and nation. Fayetteville has the second highest percentage of its population not in the labor force, below Opelika (Table 19 and Figure 31).
Fayetteville’s proportion of families with two income earners (Married, Husband and Wife in Labor Force) is 43.3 percent, which is higher than Opelika, the state, and the nation, but lower than Woodstock and the County (Table 20 and Figure 32). Fayetteville has the highest proportion of unmarried males in the labor force at 5.7 percent (Unmarried Male in Labor Force, No Wife Present).
Table 19
2009–2013 Five-Year Estimates Employment Status (Highest Relative Rates Shaded)
Source: US Census Bureau, Garner Economics

Source: US Census Bureau American Community Survey, Garner Economics

Married-Couple Families
Other Families
Source: US Census Bureau American Community Survey, Garner Economics

2009–2013 Five-Year Estimates
Employment Status
Percentage
of All Families
Married, Husband & Wife in Labor Force
Married, Husband in Labor Force, Wife Not
Married, Wife in Labor Force, Husband Not
Unmarried Female in Labor Force, No Husband Present
Unmarried Male in Labor Force, No Wife Present
Percentage of All Families
Source: US Census Bureau American Community Survey, Garner Economics

Household Income
Household income reflects income for residents regardless of where they work, which is different than employment-based wages paid to workers, regardless of where they live. Compared to the nation and the state, Fayetteville has the total highest share of households with incomes in the $15,000 to $24,999 category (Figure 33, Figure 34
and Table 21). Among the benchmark cities, Woodstock has the highest share of households with incomes between $50,000 and $99,999 (34.9 percent). Fayetteville’s proportion of those above $100,000 is 26.4 percent, which is below the overall county average of 38.5 percent and Woodstock’s average of 28.5 percent.
Figure 33
2009–2013 Five-Year Estimates
Household Income by Percentage of Total
$10,000
$200,000 or more
$150,000 to $199,999
$100,000 to $149,999
$75,000 to $99,999
$50,000 to $74,999
to $14,999
to $24,999 $25,000 to $34,999
$35,000 to $49,999
Fayetteville Fayette County Georgia United States
Source: Census Bureau American Community Survey, Garner Economics
Figure 34
2009–2013 Five Year Estimates
Household Income by Percentage of Total
$10,000
$200,000 or more
$150,000 to $199,999
$100,000 to $149,999
$75,000 to $99,999
$50,000 to $74,999
Woodstock Opelika
Source: US Census Bureau American Community Survey, Garner Economics

$50,000
Relative Rates Shaded)
Source: US Census Bureau American Community Survey, Garner Economics

Major Industry Sector Composition
A comparison of major industry employment provides a broad relative assessment of differences among economies and may help indicate areas of uniqueness. Of 20 major industry categories, Fayetteville, in terms of zip codes 30214 and 30215, has the highest relative percentage in one industry: Health Care and Social Assistance. Conversely, Fayetteville had the lowest percentage of employment in six industry categories: Crop and Animal Production; Mining, Quarrying & Oil & Gas Extraction; Manufacturing; Transportation & Warehousing; and Real Estate & Rental & Leasing. Overall, the largest industry sectors for employment in Fayetteville are: Health Care and Social Assistance (19.9 percent), Government (18.6 percent), Retail Trade (15.5 percent), and Accommodation & Food Services (11.2 percent) (Table 22).
A detailed analysis of Fayetteville’s industrial and occupational specialization relative to the nation can be found in Chapter 7: Local Specialization, Competitiveness & Growth as well as the Appendices.

2015 Major Industry Sector Composition
of Total Employment (Highest Relative Percentages Shaded) (Lowest Relative Percentages Shaded)
Source: EMSI Q2 2015 Data Set, Garner Economics

Cost of Living
The 2015 composite cost-of-living index for Fayetteville is 93.4 (the national average is set at 100). Compared to Opelika, the other benchmark city available in this data set, Fayetteville-Fayette County has a low cost-of-living index. However, the Health Care index is higher than Opelika and the national average (Table 23 and Figure 35).
*Woodstock–data not available.
Source: Council for Community and Economic Research
Source: Council for Community and Economic Research

Broadband
According to the National Telecommunications and Information Administration, households in Fayetteville have the greatest access to DSL compared to the benchmark cities, the County, state, and nation, with 98.5% of households having access (Table 24). Small businesses in Fayetteville have median download speeds slower than the County, state, and nation and upload speeds in-line with Woodstock, the state, and nation.
Table 24 2014 Broadband Availability & Speed (Highest Relative Percentages Shaded)
*Mbps–Megabytes per second
**No data available
^Only one cumulative test
Sources: National Telecommunications and Information Administration, Garner Economics

CHAPTER 6: RETAIL LEAKAGE ANALYSIS

To determine specific industries with retail potential, a retail leakage analysis was conducted. Retail leakage represents the dollar amount that shoppers from Fayetteville spent outside of the region. In other words, it is the dollars that "leaked" out of the economy. If leakage is a high proportion of Fayetteville residents’ total dollars spent in a particular trade area, the community could potentially support more businesses in that area. Zip code data for 30214 and 30215 were used to measure retail leakage in Fayetteville.
Overall, Fayetteville’s average percentage of retail leakage is 59.4, indicating that shoppers from Fayetteville spend less than half of their disposable income in the City (40.6 percent). A review of each of the 14 major retail categories in Fayetteville shows seven industries with 50 percent or higher leakage:
o Accommodation*
o Motor Vehicles & Parts Dealers
o Nonstore Retailers
o Gasoline Stations
o Food Service & Drinking Places
o Health & Personal Care Stores
o Electronic & Appliance Stores
The largest dollar leakage is in the category Accommodation* with 91.8 percent leakage. The highest actual retail gap for Fayetteville is the category of Motor Vehicle and Parts Dealers, which leaked 81.2 percent of sales or $212.9 million out of a total of $262.3 million sales (Figure 36 and Table 25). The other industries with the largest dollar leakage are General Merchandise Store with $86.2 million leakage and Food & Beverage Stores with $73 million leakage.
Figure 36
Fayetteville Residents (Zip codes 30214 and 30215) 2013 Sales in the Region and Leakage (in Millions)
General Merchandise Stores
Food and Beverage Stores
Food Services and Drinking Places*
Gasoline Stations
Health and Personal Care Stores
Nonstore Retailers
Accommodation*
Electronics and Appliance Stores
Building Material and Garden…
Clothing and Clothing Accessories Stores
Miscellaneous Store Retailers
Furniture and Home Furnishings Stores
Sporting Goods, Hobby, Musical…
Indicate Leakage
Technically, these are not


* Industries belonging to NAICS 72: Accommodation and Food Services have been included as a
Source: EMSI, Garner Economics

CHAPTER 7: LOCAL SPECIALIZATION, COMPETITIVENESS & GROWTH

The following section provides a more detailed and in-depth assessment of the Fayetteville area economy. The analysis examines the local economy from several different perspectives, each adding a supporting layer of information. The assessment’s main goals are to provide historic context, reveal areas of unique specialization, gauge competitiveness, and help uncover emerging trends and opportunities.
The two main areas of analysis are: major industries and occupational groups. For each area, there are relative measures of specialization, growth, local competitiveness, and earnings. Zip code data for 30214 and 30215 were used to measure major industries and occupational groups in Fayetteville.
Major Industry Sector Change
Since 2010, the largest absolute industry jobs growth in Fayetteville came from Health Care & Social Assistance (1,028 jobs or 27 percent) and Accommodation & Food Services (1,019 jobs or 61 percent) (Figure 37 and Table 26). There were job losses in Government (-454 jobs or 9 percent); Professional, Scientific & Technical Services (-75 jobs or 7 percent); Real
& Rental & Leasing (-57 jobs or 20 percent); and Crop & Animal Production (-33 jobs or 56 percent).
Figure 37
Fayetteville (Zip codes 30214 and 30215)
Employment Change by Major Industry 2010-2015
Source: EMSI 2nd Quarter 2015, Garner Economics

Fayetteville (Zip codes 30214 and 30215) Employment Change by Major Industry 2010–2015 Ranked by Absolute Change
Source: EMSI 2nd Quarter 2015, Garner Economics

Industry Earnings
A comparison of Fayetteville’s average industry earnings to national averages may offer insights into areas of unique expertise or costsaving opportunities. Industrial average earnings in Fayetteville are above the national same-industry average in two major sectors: Manufacturing (10.3 percent higher) and Transportation & Warehousing (8.8 percent higher) (Table 27, Figure 38). This section reflects earnings, which differ slightly from wages, in that they reflect employer-paid supplements.
Source: EMSI, Garner Economics

Source:

Major Occupational Change
Over the last five years, the single largest absolute occupational gains in Fayetteville came from Food Preparation & Serving Related, up 909 jobs or 48 percent (Figure 39 and Table 28). The greatest job losses were in the occupational areas of Education, Training & Library (-216 jobs or 8 percent).
Figure 39
Fayetteville (Zip codes 30214 and 30215)
Employment Change by Major Occupational Groups 2010–2015
Source: EMSI, Garner Economics
Fayetteville (Zip codes 30214 and 30215)

Occupational Earnings
A comparison of the same-occupation median hourly earnings in Fayetteville to the national medians may offer insights into areas of unique expertise or cost-saving opportunities. Fayetteville’s median hourly earnings were above the nation for Military and Farming, Fishing & Forestry. However, seven occupational sectors were above the national hourly average of $20.35: Legal; Management; Healthcare Practitioners & Technical; Architecture & Engineering; Computer & Mathematical; Life, Physical & Social Science; and Business & Finance Operations (Figure 40, Table 29).
Figure 40
Fayetteville (Zip codes 30214 and 30215)
2015 Median Hourly Occupational Earnings Comparison
Healthcare Practitioners and Technical
Architecture and Engineering
Computer and Mathematical
Life, Physical, and Social Science
Business and Financial Operations
Education, Training, and Library
Arts, Design, Entertainment, Sports, and Media All
Community and Social Service
Installation, Maintenance, and Repair
Protective Service
Construction and Extraction Military
Office and Administrative Support Production
Transportation and Material Moving Sales and Related
Healthcare Support
Farming, Fishing, and Forestry
Building and Grounds Cleaning and Maintenance
Personal Care and Service
Food Preparation and Serving Related
Fayetteville United States
Source: EMSI 2nd Quarter 2015, Garner Economics

29
Fayetteville (Zip codes 30214 and 30215)
2015 Median Hourly Occupational Earnings Comparison Earnings above national rate in green
Source: EMSI 2nd Quarter 2015, Garner Economics

The following assessment tools include a series of bubble or scatter charts and tables. Axis and quadrant labels should be read as only general guides resulting from purely quantitative analysis, not definitive conclusions. Each chart and table is meant as only one piece of a multiple-part analysis. To assist the reader in interpreting the bubble charts, each axis and quadrant is labeled with broad descriptives.
Chart axis definitions:
Specialization: measured using location quotient (LQ).1 Reflects the level of relative concentration of a particular occupation or industry in Fayetteville to the nation. In simple terms, a high LQ (above 1.2) indicates what a local economy is good at doing and implies there are unique skills, institutions, raw materials, etc., that support this position.
Industry Effect: The portion of growth or decline attributed to a particular industry nationwide. For example, if hospital employment grew by five percent nationwide in 2011, we would expect to see the same percentage increase locally, assuming that the forces driving nationwide growth would have a similar local impact.
Local Effect: The proportion of growth or decline not captured by the industry effect, indicating unique local performance. The local effect measures local activity outside the expected nationwide trend. A consistent positive local competitive effect signals superior local performance.
Chart quadrant label definitions:
At-Risk: Locally specialized and recent local job losses.
Declining: Not locally specialized and recent local job losses.
Competitive: Locally specialized and recent local job gains.
Emerging: Not locally specialized and recent local job gains.
1To measure local specialization, location quotients (LQs) for each occupation or industry are derived. LQs are ratios of an area's distribution of employment for a specific occupation or industry compared to a reference or base area's distribution. In this analysis, the reference area is the United States. If an LQ is equal to 1, then the industry has the same share of its area employment as it does in the reference area. An LQ greater than 1 indicates an industry with a greater share of the local area employment than is the case in the reference area and implies local specialization. LQs are calculated by first dividing local industry employment by the all-industry total of local employment. Second, reference area industry employment is divided by the all-industry total for the reference area. Finally, the local ratio is divided by the reference area ratio.

Major Industry Sector Specialization & Growth
Major industry sector specialization focuses on the geographic concentrations of similarly classified industries. For many industry sectors, there exists interconnectedness among suppliers, occupations, and associated supporting institutions.
Observations: Five industry sectors in Fayetteville have a level of local specialization above 1.0 and have grown within the last five years: Health Care & Social Assistance, Accommodation & Food Services, Retail Trade, Construction, and Other Services (Table 30 and Figure 41). The single industry at risk is Government, which has a strong local specialization at 1.2 but experienced a loss of 454 jobs over the past five years.
(Zip codes 30214 and 30215)
Source: EMSI, Garner Economics
*See Motion Picture & Video Production on next page

Motion Picture and Video Production
The newly launched Pinewood Studios in Fayetteville provides a substantial opportunity for the City. With an employment multiplier of 1.65 for the Motion Picture and Video Production sector in the Atlanta MSA, if employment increases by 100, the local economy can expect to gain 65 additional jobs for a total of 165 new jobs. Further, with an average annual salary of $51,720, which is the industry average for the Atlanta MSA, the local economy will gain just over $8.5 million in additional earnings. However, with a NAICS code of 51211, Motion Picture and Video Production falls into the Information sector, which is categorized as Declining in Fayetteville.
A better representation of Fayetteville’s Motion Picture and Production industry is captured by examining that of larger local geographies. Georgia and the Atlanta MSA have an Emerging film industry (Table 31).

Fayetteville (Zip codes 30214 and 30215)
Industry Specialization & Growth
2010-2015 Change in Employment
Size of the bubble represents total employment
Source: EMSI, Garner Economics

Major Industry Competitiveness
The competitiveness screen seeks to reveal local competitive advantages (i.e., unique growth beyond predicted industry trends).
Observations: By this measure, four main industry sectors with strong local competitive effects are Accommodation & Food Services, Health Care & Social Assistance, Construction, and Transportation & Warehousing (Table 31 and Figure 42). Fayetteville’s least competitive sectors are Crop & Animal Production, Real Estate & Rental & Leasing, Information, and Government.
(Zip codes 30214 and 30215)

Fayetteville (Zip codes 30214 and 30215)
Industry Relative Components of Growth, 2010–2015
2010-2015 Change in Employment
Size of the bubble represents total employment
Source: EMSI, Garner Economics

Occupational Specialization & Growth
Occupational groupings represent similar skills and educational qualifications, but not necessarily specific industry sectors.
Observations: The occupational groups of Food Preparation & Serving Related, Healthcare Practitioners & Technical, Sales & Related, Healthcare Support, Construction & Extraction, Personal Care & Service, and Community & Social Service each experienced growth while exhibiting local specialization (Table 32 and Figure 43).
Eight occupations are Emerging and three—Military; Life, Physical & Social Science; and Education, Training & Library—are At-Risk. Five of the occupational groups are: Protective Service; Legal; Computer & Mathematical; Architecture & Engineering; and Farming, Fishing & Forestry.

Figure 43
Fayetteville (Zip codes 30214 and 30215)
Occupational Specialization & Growth
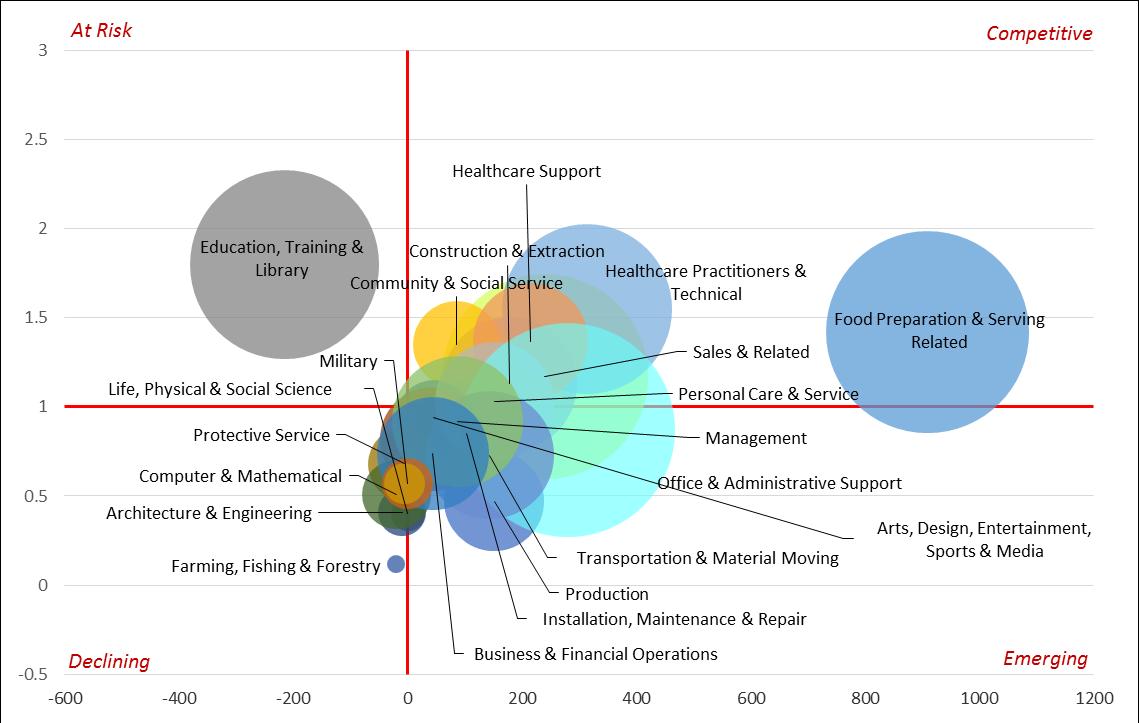
2010-2015 Change in Employment
Size of the bubble represents total employment.
Source: EMSI, Garner Economics

ABOUT OUR COMPANY

Garner Economics, LLC provides innovative economic and community development solutions in a competitive global market. We offer site selection, analytical research, industry targeting, strategic planning, and organizational development with a wealth of expertise to companies, communities, and organizations globally. Garner Economics is based in Atlanta (Fayetteville), Georgia and has representative offices in both Europe and Asia.
Since 2003, Jay Garner, a 36-year internationally recognized expert in the economic development, chamber of commerce, and site location consulting professions has headed our team, which is rounded out by talented experts.
Cyndi Dancy, a research analyst for Garner Economics, served as the author of the economic and labor analysis. Tina Valdecanas, Senior Associate and Strategist for Garner Economics, led the stakeholder input sessions and analysis. Jay Garner conducted the Assets and Challenges Assessment.

APPENDIX A: FOCUS GROUP PARTICIPANTS
Shelly Anthony, This Is It BBQ
Dave Barlow
Bob Barnard, Home Builders Association of Midwest Georgia
Dr. Joseph Barrow, FCBOE
Darrell Bingham, Primary Residential Mortgage
Jack Bowdoin, Heritage Bank
Kathaleen Brewer, K. Brewer Studio
Deborah Britt, Piedmont Fayette Hospital
Steve Brown, Fayette County
Sam Burch, Fayetteville DDA
Mike Burnett, Piedmont Fayetteville
Kathy Choran
Dr. David Campbell, Fayetteville First United Methodist Church
Brian Cooper, Pinewood Studios
Roch DeGolian, Ravin Homes
Larry Dell
Mickey Edwards, City of Fayetteville
Irma Ellington, Head Start/Reach Services
Danny England, Liberty Tech School
Tony Ferguson, Georgia Power
Ray Gibson, City of Fayetteville
Steve Gulas, City of Fayetteville P/Z
Patsy Gullett, Fayetteville Main Street
Rick Halbert, Halbert Construction
Darryl Hicks, Development Authority
Rich Hoffman, Hoffman Tire Pros
Alan Jones, City of Fayetteville
Ernie Kearns, Nationwide Insurance
Addison Lester, Property Owner/Fayetteville DDA
Jim Lynch, Liberty Tech School
Phil Mallon, Fayette County
Doug Mickey, Chick-fil-A
David Mowell, C.J. Mowell Funeral Home
Sarah Murphy, Fayetteville DDA
David Murray, King's Watch Repair/Scoops
Clark Ninneman, Fayetteville DDA
Charles Oddo, Fayette County
Jim Pace, Group VI Development
Steve Rapson, Fayette County
Alex Rodriguez
Charles Rousseau, Fayette County
Harlan Shirley, Retired
Scott Stacy, City of Fayetteville
Vicki Turner, Fayetteville Main Street
Carlotta Ungaro, Fayette Chamber of Commerce
Michelle Warren, Fayette County Realtors
Geneva Weaver, Fayette County News
Jim Williams, City of Fayetteville
Brian Wismer, City of Fayetteville
Jamie Wyatt, Fayetteville DDA
Joan Young, Fayette County Development Authority
Pam Young, Southern Conservation Trust


