
PENNSYLVANIA
GIONA L Community Health Needs Assessment FOR SOUTHEASTERN
GIONA L Community Health Needs Assessment FOR SOUTHEASTERN
Identifying and addressing the unmet health needs of local communities is a fundamental responsibility of hospitals and health systems across the United States. The Affordable Care Act (ACA) formalized this role by requiring tax-exempt hospitals to conduct a Community Health Needs Assessment (CHNA) every three years and implement strategies to address the most pressing priorities identified. This assessment serves as a cornerstone of community benefits planning and social accountability for not-for-profit hospitals and health systems. By gaining deeper insights into service needs and gaps, organizations can develop ACA-mandated implementation plans that respond effectively to high-priority concerns.
Recognizing that many hospitals and health systems serve overlapping communities, a group of local hospitals and health systems has again collaborated on a Southeastern Pennsylvania (SEPA) Regional CHNA (rCHNA), covering Bucks, Chester, Delaware, Montgomery, and Philadelphia Counties. This ongoing collaboration ensures a consistent, data-driven approach while offering opportunities to refine and enhance the assessment process. By working together, participating organizations aim to strengthen the impact of the CHNA, fostering multi-sector partnerships and community-driven solutions that drive meaningful and sustainable change. Additionally, this collaborative model reduces the burden on community members while leveraging shared knowledge and resources.
The 2025 rCHNA is specifically designed to advance health equity and foster authentic community engagement. Beyond guiding hospital and health system strategies, the rCHNA plays a vital role in amplifying the voices of community members and providing localized health indicators that are essential for nonprofits and community-serving organizations. These data and insights support grant writing, program development, and evaluation efforts, ensuring that organizations working to improve community health have the evidence they need to advocate for funding and implement impactful initiatives.
• Children’s Hospital of Philadelphia
– Children’s Hospital of Philadelphia
– Middleman Family Pavilion at CHOP, King of Prussia
• ChristianaCare – West Grove
• Doylestown Health
• Grand View Health: Grand View Hospital
• Jefferson Health
– Jefferson Einstein Montgomery Hospital
Jefferson Einstein Philadelphia Hospital
– Jefferson Abington Hospital
Jefferson Bucks Hospital
– Jefferson Frankford Hospital
– Jefferson Hospital for Neuroscience
Jefferson Lansdale Hospital
– Jefferson Methodist Hospital – Jefferson Torresdale Hospital
– Jefferson Moss Magee Rehabilitation Center City (Magee Rehabilitation)
– Jefferson Moss Magee Rehabilitation – Elkins Park (Moss Rehab)
– Rothman Orthopedic Specialty Hospital
Thomas Jefferson University Hospital
• Main Line Health
– Bryn Mawr Hospital
– Bryn Mawr Rehabilitation Hospital
– Lankenau Medical Center – Paoli Hospital
– Riddle Hospital
• Penn Medicine
– Chester County Hospital
– Hospital of the University of Pennsylvania
– Hospital of the University of Pennsylvania – Cedar Avenue
– Penn Presbyterian Medical Center
– Pennsylvania Hospital
• St. Christopher’s Hospital for Children
• Temple University Health System
– Fox Chase Cancer Center
– Temple University Hospital
Temple University Hospital – Episcopal Campus
– Temple University Hospital – Jeanes Campus – Temple University Hospital – Northeastern Campus
• Trinity Health Mid-Atlantic
– Mercy Catholic Medical Center, Mercy Fitzgerald Hospital Campus – Nazareth Hospital
– St. Mary Medical Center and St. Mary Rehabilitation Hospital
• Wills Eye Hospital
In collaboration with the Steering Committee—comprising representatives from partnering hospitals and health systems—the project team, consisting of staff from the Health Care Improvement Foundation (HCIF) and the Philadelphia Association of Community Development Corporations (PACDC), developed a collaborative, community-engaged approach. This methodology involved collecting and analyzing both quantitative and qualitative data while incorporating secondary data sources to comprehensively assess the region’s health status.
The HCIF team and quantitative consultant compiled, analyzed, and aggregated over 70 health indicators encompassing: access to care, community demographic characteristics, chronic disease and health behaviors, disabilities, injuries, maternal, infant and child health, mental and behavioral health, and social and economic conditions. Additionally, HCIF, in collaboration with hospitals, health systems, and community-based organizations (CBOs), conducted a general population survey with six core questions and demographic queries to better understand community health experiences across all counties. The survey was offered in English and seven additional languages and analyzed at county and subgeography levels to reflect diverse community perspectives.
HCIF, guided by a Qualitative Team composed of Steering Committee representatives, led the qualitative components of the assessment, which included:
• General Population Focus Groups: 30 community conversations engaging residents from geographic communities across five counties.
• Diverse Language Focus Groups: Two sessions facilitated in partnership with SEAMAAC to engage Latine and Asian populations.
• Youth Engagement: 15 focus groups capturing insights from youth across all counties.
• Spotlight Topic Discussions: 10 discussions with community organizations and government agencies on key topics, such as health and social services integration, aging, primary care access, maternal health, caring for uninsured and undocumented populations, culturally appropriate mental health care, and housing.
• Targeted Focus Groups: 10 discussions on specific health concerns, including cancer care, vision care, disabilities, and maternal health.
• Key Informant Interviews: 15 interviews with subject matter experts from health systems, local government, and CBOs to explore spotlight topics in-depth.
A qualitative data expert facilitated adult discussions, analyzed findings, and synthesized key themes. Additionally, a trained youth facilitator led youth conversations to ensure meaningful engagement of young voices in the assessment process.
The project team also conducted or supported targeted primary data collection to address specific community needs, focusing on:
• Cancer
• Disability/Rehabilitation
• Maternal Health
• Older Adults
• Vision
• Youth Voice
Reports and summaries from other community engagement efforts were integrated into the assessment. For example, findings from a local PCORI grant initiative (PC3) informed the cancer focus area section.
HCIF staff aggregated top priorities from general community conversations, youth engagement, and survey data. These findings were presented to the Steering Committee, which conducted a grouping exercise to categorize concerns into 12 general population priorities and 8 youth-focused priorities.
Using the Hanlon ranking method, each participating hospital and health system rated the identified needs. Average ratings were calculated, and community health priorities were organized based on:
• Magnitude of the health issue based on population impact
• Severity of the issue within hospital and health system catchment areas
• Effectiveness of potential interventions
• Feasibility of implementing solutions
Potential solutions for each of the community health priorities, based on findings from the qualitative data collection, were also included. Using this updated information, the Steering Committee and project team developed a collaborative, community-engaged approach that involved collecting and analyzing quantitative and qualitative data and aggregating data from a variety of secondary sources to comprehensively assess the health status of the region.
The assessment resulted in a list of priority health needs that will be used by participating hospitals and health systems to develop implementation plans outlining how they will address these needs individually and in collaboration with other partners. In the below summary, participant solutions are provided for insight on community driven ways to address the priorities.
COMMUNITY
1. Trust and Communication
• National surveys (from ABIM, AcademyHealth, and IHI) indicate declining patient trust in healthcare institutions, often due to provider burnout, high turnover, disparities in treatment, and financial barriers, which disproportionately affect uninsured and minoritized communities. Community conversations reinforced this issue in the region.
• Patients feel rushed during short appointments and unheard by providers, leading to concerns about potential medical errors, particularly with conflicting prescriptions.
• ER staff have the most pronounced communication issues, which are closely linked to long wait times and patient frustration.
• Poor front-desk interactions, including last-minute appointment cancellations and unprofessional behavior, contribute to negative patient experiences and decreased trust.
• Desire for more empathetic, respectful, and culturally responsive care and support staff.
• Suggestions included more social workers in hospitals and improved communication about healthcare changes.
• Ensure benefit notices and appointment information are received on time, not after due dates, and provide regular updates on healthcare changes and medication protocols.
• Adjust mechanisms for healthcare and social service staff to provide consequences when institutions or workers drop the ball on paperwork or communication.
• A dream solution expressed by multiple participants was a system where everyone receives the same quality of care, regardless of insurance status.
2. Racism and Discrimination in Health Care
• People of color, immigrants, people with disabilities, people with mental illness, people with substance addiction, LGBTQ+ individuals, and other minority groups continue to experience discrimination and institutional barriers to health care.
• Insufficient health care staff from diverse and representative backgrounds play a major role in this issue – people do not see themselves reflected in the healthcare workforce; can lead to not “feeling seen.”
• Intersecting identities lead to exponential impacts on discrimination and racism, and subsequent trauma.
• The political climate in the United States contributes to feelings of vulnerability within marginalized communities.
3. Chronic Disease Prevention and Management
• Community gyms and recreation spaces that are well maintained and free/affordable, were recognized as desirable neighborhood resources, along with safe neighborhoods, and support disease prevention & management.
• Limited access to healthy food options and limited food education were noted as some of the greatest barriers to maintaining health and preventing or improving health conditions.
• Some participants shared knowledge of and experiences with Long COVID, while a significant number were unfamiliar with the condition. Millions of adults in the U.S. have been affected by Long COVID. Participants are still generally concerned about acute COVID-19 infection.
• People with disabilities, who are not all older adults, face barriers to disease prevention and management due to accessibility issues and require greater advocacy.
• Participants called for healthcare professionals to update their knowledge and attitudes beyond outdated textbooks.
• Strong calls for in-person translation services and recruitment of bilingual providers. Languages mentioned: Spanish, Arabic, French, several African languages.
• Participants suggested that providers should reflect the communities they serve — racially, culturally, and linguistically.
• Address the way patients with substance use or mental health needs are often denied full treatment, especially pain management.
• Recognize and address structural racism — such as how funding, communication, and service offerings exclude or deprioritize certain communities.
• Increase access to local fitness centers and programs that accept health insurance.
• Promote community gardens and green spaces for physical activity and healthy eating.
• Provide consistent access to nutritional education for both children and adults.
• Offer more accessible chronic disease screenings and follow-up care, especially for older adults.
• Ensure health centers and providers are open during evenings/weekends to improve access.
4. Access to Care (Primary and Specialty)
5. Healthcare and Health Resources Navigation
• Prevailing barriers in accessing care include: inadequate health insurance coverage (insurance not accepted, high out-of-pocket costs, no dental coverage), limited transportation/accessibility of offices/hospitals (primarily an issue in non-urban settings and amongst older adults), extended wait times for appointments (prompting use of ER and urgent care more often), closures of local hospitals, and specialists not covered by insurance or not available for appointments/too far
• In addition to hospital closures, pharmacy closures present challenges related to obtaining prescriptions, resulting in increased utilization of prescription deliveries.
• Some pandemic-era changes to access have persisted, including more pervasive telehealth services, increased interaction with health portals, and virtual health-related programming.
• Community members’ lack of awareness of resources is reflective of both community needs and a lack of knowledge.
• The perception of a lack of resources where some might exist is indicative of a need to improve information dissemination and methods of accessing that information. Participants frequently felt compelled to share resources and experiences with one another, when needs and complaints arose about health services among the focus group members.
• Navigating insurance policies, coverages, web platforms, related resources and healthcare costs prove challenging – especially for older adults who feel less confident with technology use and the transition to Medicare.
• Mentorship for medical decision-making, particularly for older adults who live alone, can promote social support, advocacy, and safety.
• Extend clinic hours to evenings and weekends.
• Reduce wait times for appointments, especially for urgent needs.
• Simplify the referral and authorization process, which often delays care.
• Provide local urgent care and dental options, especially in rural or underserved areas.
• Address insurance instability (frequent changes to accepted plans or providers).
• Expand non-emergency medical transportation options, particularly for older adults and rural residents.
• Provide help navigating insurance plans, applications, and renewals (e.g., inperson or phone-based support).
• Create centralized, updated lists of services and locations (e.g., food vouchers, clinics).
• Provide tech support or training for those who struggle with using healthcare portals or telehealth.
• Community members shared the quantity and availability of mental health providers are insufficient to meet ever increasing needs (particularly post-pandemic).
• Additionally, health insurance coverage for mental health services and providers is inadequate.
• Stigma around this topic was cited as a barrier –especially in ethnic minority communities.
• The intersection of mental illness, substance use, and/or homelessness was recurring concern.
• The general population expressed significant concerns related to youth mental health – which is reflected in the youth prioritization.
• Mental health needs for older adults focus on grief support and opportunities for community-based social engagement.
• Community members shared concerns about substance use in their communities, co-occurring mental illness, the potential implications on youth, and the association with poor neighborhood safety
• Drug overdose rates continue to be high due to opioid epidemic
• Community-based services to treat substance use are perceived as insufficient in number by some, and/or are not well-known by others.
• Prevention and education measures can serve as protective factors against misuse and abuse; questions arose regarding the usefulness and impact of policing related to substance use.
• Increase the number of behavioral health providers, especially in rural areas.
• Reduce wait times and eliminate long delays between referrals and services.
• Normalize seeking help by reducing cultural stigma around mental health through community education.
• Offer telehealth mental health options for those without transportation.
• Provide trauma-informed mental health support tailored to children, youth, and families.
• Expand community-based rehabilitation programs as alternatives to incarceration.
• Provide trauma-informed care and education during health visits, especially for youth.
• Increase provider training to eliminate bias toward individuals with histories of substance use.
• Offer drug education at the provider level (not just in schools) with resources for both youth and families.
• Reduce stigma through culturally competent and empathetic behavioral health care.
8. Healthy
• Community members raised concerns about older adult isolation, impacting mental health, food access, and healthcare interactions. Senior centers and community services were frequently mentioned.
• Transportation barriers contribute to food insecurity and limited community engagement. Free ride programs often involve long waits, indirect routes, and lengthy travel.
• Limited digital literacy and unfamiliarity with technology restrict older adults’ access to healthcare and social services.
• Medicare transitions are often confusing, causing missed benefits
9. Culturally and Linguistically Appropriate Services
• Language barriers are the greatest contributing factor to healthcare access issues for immigrants and ASL speakers. Language issues lead to misunderstandings between patients and healthcare providers or can dissuade patients from attending appointments altogether.
• Provision of high-quality language services (oral interpretation and written translation) is critical for providing equitable care to these communities; inquiring of patients at the time of appointmentsetting about interpreter needs is ideal.
• Beyond language access, cultural and religious norms influence individual beliefs about health; stigma can create barriers to seeking help, particularly mental health services.
• Undocumented individuals may be discouraged from seeking medical help due to fear or lack of health insurance
• Improve transportation services for older adults to attend appointments, social events, and access groceries.
• Provide free or subsidized exercise classes (e.g., Tai Chi) to support mobility and wellness.
• Increase availability of nutritious foods by offering more options and ability to share restrictions in senior food distribution programs.
• Establish or re-open senior centers and day programs for social engagement and resource access.
• Offer help with documentation and paperwork (e.g., birth certificates, benefits forms).
• Create anonymous and accessible reporting systems for elder abuse or neglect.
• Hire bilingual/multilingual providers and translators (languages mentioned: Spanish, Arabic, French, African dialects).
• Provide in-person interpreters, especially during complex or urgent health interactions.
• Ensure all signage, forms, and digital tools are translated into key community languages.
• Train providers in culturally responsive care that respects beliefs and traditions of immigrant communities.
• Maintaining diets consisting of fresh produce and healthy foods is consistently difficult and cost prohibitive. Cheaper fast food and corner store options are also more convenient, readily accessible, and more prevalent – particularly in urban neighborhoods. Likewise, large grocery stores may require transportation to access them.
• A lack of food literacy and longevity of poor dietary habits over time also contribute to food choices.
• Local food banks/pantries serve as an indispensable community resource. When available, community gardens offer neighborhoods opportunities to grow their own food in the company of neighbors.
• Older adults have enjoyed meal delivery services, as a part of their benefits.
• Immigrants and ethnic minorities face challenges with finding foods that are culturally relevant to them
• The overall health of homeless individuals was also of concern to community members, feeling as though resources were not readily available and that homeless individuals contributed to sentiments around neighborhoods being unsafe.
• A growing lack of affordable housing has led to a year’s long waiting list for subsidized housing, as well as evictions, and individuals sleeping in places not meant for human dwelling (e.g., cars, outdoors). This phenomenon is pervasive across counties, but particularly in Philadelphia.
• Housing for certain sub-groups, such as older adults and veterans, was also noted as priorities.
• Maintain and expand community gardens, fresh food access, and local markets.
• Offer nutritional education for both children and parents.
• Increase oversight of food stamp benefit security (e.g., prevent theft and fraud).
• Improve quality of food provided at pantries or senior meal programs – not just quantity.
• Invest in affordable housing and shelters, especially for people experiencing homelessness or with substance use challenges.
• Improve transitional housing and reentry programs to prevent homelessness post-incarceration.
• Ensure stable housing for vulnerable groups to support health management (e.g., medication, food access).
(e.g., blight, green space, air/water quality, etc.)
• Availability of green spaces, dog parks, libraries, and health centers (with parks, walking trails, gyms, pools) contribute significantly to positive perceptions about neighborhood conditions; named as desired neighborhood features.
• Lack of overall neighborhood safety, caused by criminal activity, community violence, or road conditions, are risk factors for poor mental health and limited physical activity outside.
• Uncollected trash build-up and littered streets negatively impact neighborhood morale and contribute to air pollution that can preclude some from opening their windows
• Community events were praised as opportunities to foster neighborly connections and cohesion.
• Local pride from residents who have lived in the area for several decades, particularly in Philadelphia, contribute to vested interests in improvement, and informed perspectives on neighborhood history and nature of changes.
• Increase investment in neighborhood clean-up efforts (e.g., trash removal, illegal dumping).
• Expand tree canopy and green spaces to reduce heat and support walkability.
• Maintain and rebuild parks and rec centers to offer both safety and engagement for youth.
• Improve sidewalks and streets for better mobility and pedestrian safety.
• Recognize the mental health impacts of environmental stressors like blight and noise.
1.
Youth Mental Health
2.
Lack of Resources/ Knowledge of Resources
• Youth community members and partners recognize mental health as the primary health concern in the region.
• Youth mental health was prioritized at 12 of 15 youth meetings.
• The top issues raised in youth voice meetings included: access to mental health services, needing more support and resources related to coping skills, the negative impacts of social media, and overall feelings of loneliness.
• The age-adjusted suicide rate for the region is 11%, with 18% of youth across the five counties seriously considering suicide.
• Peer-led support spaces in schools like “Relationships First” circles where trained student leaders facilitate discussions.
• Early emotional support: Incorporating socialemotional learning (SEL) from a younger age, not just in high school.
• Accessible mental health resources in schools beyond overwhelmed counselors.
• Parent/community education on youth mental health, potentially offered at school events like backto-school nights.
• Mandated parenting education/training to better equip caregivers.
• Reducing stigma through community awareness and generational conversations.
• Youth prioritized help with health resources at 30% of youth meetings
• Youth community members and partners expressed that navigating healthcare services and accessing health resources, such as mental health programs and reporting outlets, is a significant challenge This difficulty arises from a general lack of awareness, fragmented systems, and resource constraints.
• Youth shared feelings of not having anyone to talk to, or report “bad things” to.
• Effective navigation involves not only providing information but also addressing transportation needs. Many individuals, especially youth, encounter substantial obstacles in finding a trusted adult and obtaining transportation to healthcare services.
• Community events (e.g., Healthy Kids Day) that attract families with incentives (bounce houses, food) while sharing resources.
• More community-based outreach instead of only web-based referrals.
• Increased transportation access or bringing services closer to communities (e.g., having more rec centers or clinics locally).
• Youth-friendly formats like social media campaigns to spread resource awareness.
• Cultural and language access: Hiring bilingual staff and making materials culturally relevant.
3. Substance Use and Related Disorders
• Youth community members and partners identified substance use as a health priority at 9 of the 15 youth community conversations.
• Substance use disorders frequently co-occur with mental health conditions, posing significant challenges for individuals and communities. These conditions are often linked to issues such as community violence and homelessness.
• Key issues raised include the prevalence of binge drinking, along with increasing use of cigarettes, marijuana, and vaping among young people.
• Youth noted increased exposure to, and trauma, due to drugs
• Discussions highlighted the need for better support in navigating drug and behavioral issues, accessing treatment, and addressing exposure to trauma related to substance use.
• Youth-focused recovery spaces: Suggestion of AAstyle meetings for adolescents.
• Safe reporting systems where youth can help others (e.g., calling for overdose support) without fear of punishment.
• Integrated recovery and workforce development programs: Pairing mental health support with skillbuilding and community service.
• CIT (Counselor-in-Training) programs and volunteer work for youth as alternatives to substance use and ways to build confidence and responsibility.
4. Bullying
• Youth community members and partners identified bullying as a prevalent issue. Bullying adversely impacts mental health and negatively affects youth’s academic performance and social well-being.
• Social media has a significant impact on youth, contributing to issues like cyberbullying and unrealistic comparisons
• Instances of racial profiling, discrimination, sexual harassment, and inappropriate behavior were mentioned highlighting the need for more inclusive and respectful youth interactions
• Social media etiquette education starting at young ages to combat online bullying.
• Safe spaces in schools to talk about feelings, led by peers or trained youth facilitators.
• Early interventions to prevent verbal and cyberbullying from escalating.
• Support for immigrant and bilingual children facing bullying due to language barriers.
• Youth community members and partners recognize gun violence as a significant concern in the region – with young people having easy access to guns and engaging in violent activities.
• Violence driven by community disadvantage disproportionately impacts various communities in Philadelphia. Poverty, lack of resources, and inadequate support systems are compounding threats to youth’s overall wellbeing and safety.
• Trauma associated with exposure to gun violence is widely felt among youth. Challenges in accessing the necessary mental health supports to address those negative impacts were also reported.
• Youth from immigrant communities, and LGBTQ+ communities are at higher risk of interpersonal violence, including intimate partner violence (IPV), sexual assault, and sex trafficking.
• Youth community members and partners widely associate the word “health” with exercise and physical activity.
• 6 out of 15 youth meetings prioritized physical activity and places to engage in physical activity.
• Access to outdoor green spaces and recreation areas like parks and trails are lower in some neighborhoods. The negative impact of such lack of spaces on mental and physical health was shared by youth community members.
• 13% of of general population community survey respondents reported that places to be active such as parks are rarely or never available
• Youth community members and partners emphasized the importance of extracurricular activities, which were a priority in 11 out of 15 meetings.
• About 92% of youth in the region participate in activities outside of class, but they expressed a need for more accessible programs, especially in underserved areas.
• Opportunities like summer camps, leadership programs, libraries and STEM clubs were highly desired across the five counties.
• Reallocation of funding: Instead of heavy spending in one area, directing more toward youth mental health and education.
• Safe community spaces where youth can express fears and ideas (e.g., community art like the “community plate” activity).
• Community involvement and cleanup events to reclaim and uplift neighborhoods.
• Critical feedback on ineffective policing and calls for greater investment in actual youth-centered prevention and safety measures.
• Community gardens and step challenges tied to school programs.
• Block parties and community clean-ups that include physical activity components.
• Rec centers and gym access where youth feel welcome and included.
• Peer involvement at gyms and modeling healthy physical routines in neighborhood spaces.
• Volunteering and leadership opportunities like CIT programs, community cleanups, or school clubs.
• Skills-based training with incentives (e.g., small stipends or “training pay”) even before official working age.
• Reviving youth programs (e.g., Girl Scouts, Boy Scouts) and emphasizing mentorship.
• Creative expression projects like community plates or mural work to connect youth to their environment and voice.
• Access to quality schools was discussed widely among youth. While some counties have ample funding, others have limited resources, affecting clubs, programs, and mental health support.
• Youth generally appreciate opportunities provided by their schools but highlight significant gaps in mental health resources, relevant education, teaching methods, and overall student well-being.
Key attributes of good schools discussed include:
Quality of Education
– Mental Health & Support Systems
Qualified Educators
– Supportive Environment & Policies
Resources and Facilities
– Diversity, Equity, and Inclusion
• Support for bilingual learners and anti-bullying efforts to ensure comfort in school environments.
• Creating welcoming and identity-affirming clubs for students of all backgrounds.
• Better sexual health and emotional learning programs that students feel engaged in.
• Training for teachers and school staff to be culturally competent and approachable.
Identifying and addressing unmet health needs of local communities remains a core aspect of the care provided by hospitals and health systems across the U.S. The Affordable Care Act (ACA) formalized this role by mandating that tax-exempt hospitals conduct a Community Health Needs Assessment (CHNA) every three years and implement strategies focused on emergent priorities from the assessment. Federal requirements for the CHNA include:
• A definition of the community served by the facility and a description of how the community was determined.
• A description of the process and methods used to conduct the CHNA.
• A description of how the facility solicited and took into account input received from persons who represent the broad interests of the community it serves.
• A prioritized description of the significant health needs of the community identified through the CHNA and a description of the process and criteria used in identifying and prioritizing those needs.
• A description of resources potentially available to address the significant health needs identified through the CHNA.
This assessment is central to not-for-profit hospitals and health systems’ community benefit and social accountability planning. By better understanding the service needs and gaps in a community, an organization can develop implementation plans—also mandated by the ACA—that more effectively respond to high-priority needs.
At the request of local non-profit hospitals and health systems, the Health Care Improvement Foundation (HCIF) continued its effort to collaboratively develop a regional Community Health Needs Assessment (rCHNA) for the Southeastern Pennsylvania (SEPA) region in 2025. Building on the success of previous assessments in 2019 and 2022, the 2025 rCHNA maintains the regional collaborative model while integrating new partners and expanding its data collection approach to enhance community representation.
The 2025 rCHNA includes all five counties of the SEPA region— Bucks, Chester, Delaware, Montgomery, and Philadelphia Counties. Notably, this year’s assessment includes the participation of ChristianaCare - West Grove, St. Christopher’s Hospital for Children, and Wills Eye Hospital, further strengthening the breadth and depth of regional collaboration. As in prior years, participants recognize the CHNA as a key tool for health systems, multi-sector partners, and communities to work together toward meaningful and positive community change.
Several enhancements distinguish the 2025 rCHNA from previous iterations:
• Community-Based Survey Expansion: A communitybased survey was conducted in eight languages to improve accessibility and inclusivity, ensuring a broader representation of community voices in the assessment process.
• Piloting of Diverse Language Sessions: In response to the diverse linguistic needs of SEPA communities, the 2025 rCHNA piloted facilitated discussions in multiple languages, increasing engagement and cultural responsiveness.
• Youth-Focused Priorities: Recognizing the unique challenges faced by young people, the 2025 rCHNA includes a dedicated youth-focused priority list, incorporating input from youthserving organizations, schools, and young residents.
• Expansion of Spotlights: The assessment features an expanded set of Spotlights, providing in-depth analyses of specific health topics, populations, or geographic areas. These Spotlights highlight key trends, disparities, and innovative community initiatives addressing pressing health concerns.
While the basic structure and format of the report remain consistent with prior assessments, the 2025 rCHNA reflects an evolving and deepening commitment to health equity, community engagement, and data-driven decision-making.
The continued collaborative approach allows for shared learning, increased efficiencies, and a reduced burden on communities participating in multiple assessments.
As the SEPA region continues to navigate ongoing public health challenges and disparities, the 2025 rCHNA serves as a vital resource for guiding collective efforts toward improved health outcomes and a stronger, more equitable healthcare system for all.

MISSION:
ChristianaCare’s mission, the ChristianaCare Way, is to serve our neighbors as expert, caring partners in their health. We do this by creating innovative, effective, affordable, and equitable systems of care that our neighbors value.
VISION:
Creating health together so every person can flourish.
VALUES:
We serve together guided by our values of love and excellence.
For more than 130 years, ChristianaCare has served the health needs of its communities. Today, that reach extends through Delaware, Maryland, Pennsylvania, and New Jersey.
Headquartered in Wilmington, Delaware, ChristianaCare is one of the country’s most dynamic health care organizations, centered on improving health outcomes, making high-quality care more accessible and lowering health care costs. ChristianaCare is also one of the largest community-based teaching hospitals conducting research in the United States. Robust partnerships in clinical, translational and outcomes research boost ChristianaCare’s national reputation and speed new ideas, technologies and treatments to communities challenged by today’s most pressing health concerns.
As a nonprofit health system, our mission is one of service. We believe that the key to providing truly great health care is to partner with our patients and their families, building a system of care that is effective, affordable and valuable to everyone who is touched by it. BEDS: 10 EMPLOYEES: 41 PHYSICIANS 12 INPATIENT ADMISSIONS: 1,424*
*Anticipated by year 5
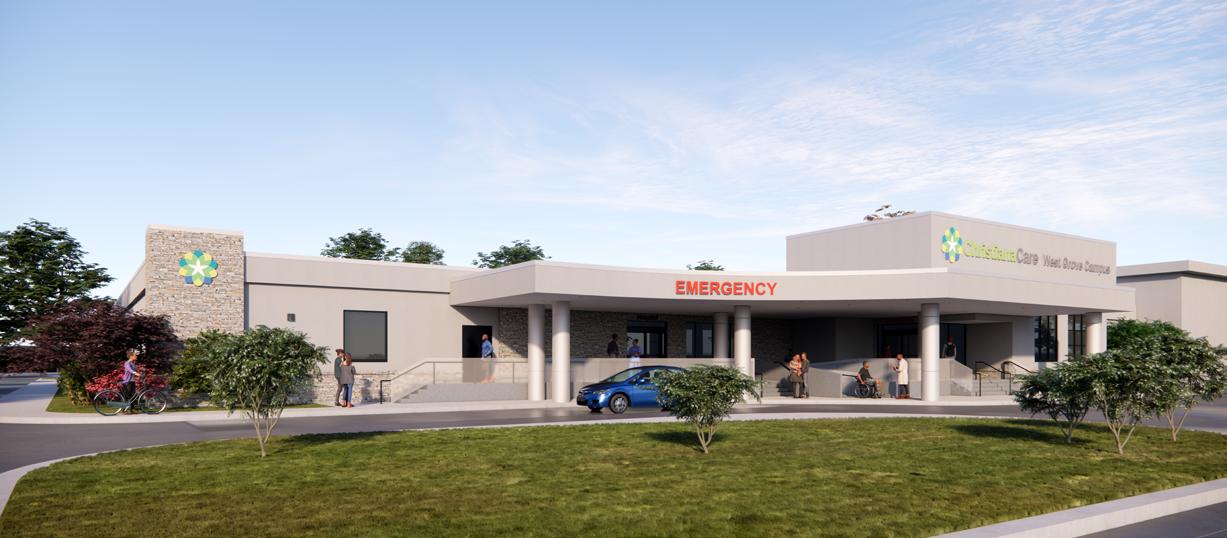
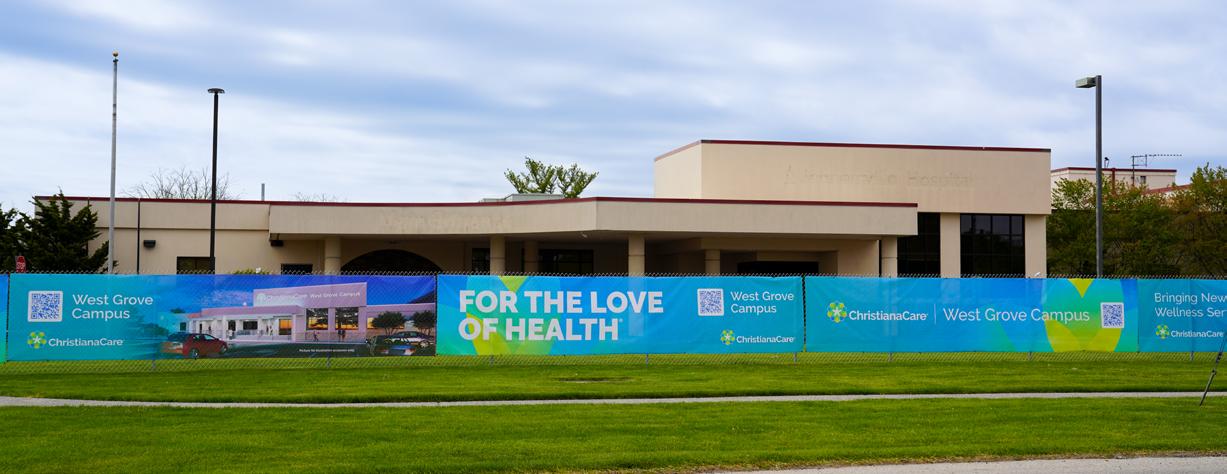
ChristianaCare expects to open its West Grove Campus Hospital in the summer of 2025 to bring new and needed health and wellness services to the West Grove, Pennsylvania community. ChristianaCare’s West Grove Campus will house a micro hospital also known as a neighborhood hospital. Neighborhood hospitals provide a new model of care that will help us deliver the right care at the right place and in the right time. Neighborhood hospitals are acute care hospitals that offer emergency services and maintain facilities for at least ten inpatient beds with a narrow scope of inpatient acute care services.
Our new 22,000-square-foot neighborhood hospital facility will be open 24 hours a day, 7 days a week. In addition to the 10-bed emergency department, we will have a 10-bed inpatient unit and provide diagnostic radiological/imaging services such as x-ray, CT scan, and ultrasound as well as lab services and a pharmacy.
Adjacent to the neighborhood hospital, the West Grove Campus can also host a new medical office building. The medical office building is not yet open and will develop as we learn more about our neighbors’ needs. We expect to offer primary care, women’s health, outpatient diagnostics, and cardiology among other services.
Since 2020, ChristianaCare has been serving southern Pennsylvania residents through three Chester County primary care practices in Jennersville, Kennett Square, and West Grove and in Delaware County in our Concord Health Center multispeciality site.
ChristianaCare is rated by Healthgrades as one of America’s 50 Best Hospitals and continually ranked among the nation’s best by U.S. News & World Report, Newsweek and other national quality ratings. ChristianaCare is also nationally recognized as a great place to work, rated by Forbes as the 2nd best health system for diversity and inclusion, and the 29th best health system to work for in the United States, and by IDG Computerworld as one of the nation’s Best Places to Work in IT.
Patients at the West Grove Campus will benefit from ChristianaCare’s extensive network of primary care and outpatient services, home health care, urgent care centers, three hospitals (1,336 beds), a freestanding emergency department, a Level I trauma center and a Level III neonatal intensive care unit, a comprehensive stroke center and regional centers of excellence in heart and vascular care, cancer care and women’s health. Further, we are partnering with Ermerus Holdings Inc, the nation’s leading developer of neighborhood hospitals, to build and operate our West Grove neighborhood hospital.
ESTIMATED POPULATION
100,041
MEDIAN HOUSEHOLD INCOME
$121,760 NOT FLUENT IN ENGLISH 5.88%
RACIAL COMPOSITION
TARGETED SERVICE AREA FOR COMMUNITY HEALTH IMPROVEMENT
The targeted service area of the West Grove Campus is southern Chester County. Once our neighborhood hospital begins operations, we will gain more insight into our neighbors and service area.
Zip codes in our service area are:
19311 - Avondale; 19330 - Cochranville; 19350 - Landenburg; 19347 - Kemblesville; 19351 - Lewisville; 19352 - Lincoln University; 19360New London; 19362 - Nottingham; 19363 - Oxford; 19318 - Chatham; 19346 - Kelton; 19348 - Kennett Square; 19357 - Mendenhall; 19375Unionville; 19374 - Toughkenamon; 19390 - West Grove
In addition to the participating hospitals and health systems, the organizations below provided support to the rCHNA process in significant ways – through the provision of data, offering county and community specific insight, informing plans for community engagement, hosting community conversations, community survey translation, outreach, and dissemination.
Local Health Departments
• Chester County Health Department
• Delaware County Health Department
• Montgomery County Office of Public Health
• Philadelphia Department of Public Health
Community Hubs
• Bucks County Health Improvement Partnership (BCHIP)
• HealthSpark Foundation
• Philadelphia Association of Community Development Corporations (PACDC)
• SEAMAAC
• The Foundation for Delaware County
Community Conversation Host Sites
• Bucks
– Bucks County Opportunity Council
– Family Service Association of Bucks County
– Immigrant Rights Action
– United Way of Bucks County
– YWCA Bucks County
• Chester
– Brandywine Valley Active Aging
– Charles A. Melton Center
– Honey Brook Food Pantry
– The Garage Community and Youth Center
– United Way of Southern Chester County
• Delaware
– ChesPenn Health Services
– Middletown Free Library
– Multicultural Community Family Services
– The Helen Kate Furness Free Library
– Wayne Senior Center
• Montgomery
– Abington Township Public Library
– Bethel Deliverance International Church
– George Washington Carver Community Center
– Lansdale Area Family YMCA
• Philadelphia
– ACHIEVEability
– Awbury Arboretum
– Congregation Temple Beth ‘El
– Esperanza College of Eastern University
– Friends Center
– Greener Partners
– Netter Center for Community Partnerships
– New Kensington Community Development Corporation
– Northeast Family YMCA
– Paseo Verde South
– Philadelphia Association of Community Development Corporations
– Philadelphia Chinatown Development Corporation
– Southwest Community Development Corporation
– Tacony Mayfair Sons of Italy
Hospitals/health systems and supporting partners collaboratively developed the community health needs assessment process and report to identify regional health priorities and issues specific to each participating institution’s service area. Based on these priorities and issues, hospitals/health systems produce independent implementation plans to respond to unmet health needs. These plans may involve further collaboration or coordination to address shared priorities.
HCIF leads the collection and analysis of quantitative indicators for five-county region. Indicators are reported for counties and geographic communities.
Health systems provide information about their services, recognitions, and impact of prior implementation plans.
HCIF synthesizes findings to provide inputs for prioritization process using a modified Hanlon method. Priorities summarized in final report.
HCIF, PACDC, community partners in the five-county region, and qualitative leads collaborate on qualitative data collection for geographic communities and key topics and populations.
July 2024 to June 2025
Developed by each institution based on findings from the collaborative rCHNA.
June 2025 to November 2025
A Steering Committee, composed of representatives from participating hospitals/health systems and supporting partner organizations, guided the development of the rCHNA. The Steering Committee met regularly to plan, provide feedback, and reach consensus on key decisions about approaches and strategies related to data collection, interpretation, and prioritization. Staff from the Health Care Improvement Foundation (HCIF) and Philadelphia Association of Community Development Corporations (PACDC) comprised the project team.
Name Title
Jeanne Franklin, MPH, PMP
Falguni Patel, MPH
Kathleen Lane, MPH
Public Health Director
Director, Community Impact
Associate Director, Government Affairs
Sarah Ingerman, MSW Policy Manager
Katie W. Coombes
Erin Booker
Jacqueline Ortiz, M.Phil.
Pauline M. Corso
Community Benefit Program Manager
Institution
Chester County Health Department
Children's Hospital of Philadelphia
Children's Hospital of Philadelphia
Children's Hospital of Philadelphia
ChristianaCare
Chief Biopsychosocial Officer ChristianaCare
VP Health Equity and Cultural Competence ChristianaCare
Regional Executive Director SEPA ChristianaCare
Rosemarie Halt, MPH President
Monica Taylor, PhD, MS Vice Chair
Kellye Remshifski, MS, CHES, NBH-HWC Director of Community Health & Wellness
Laura Steigerwalt
Millie Johnson, CHES*
Joanne Craig
Jill Laudenslager
Senior Director of Human Resources
Education Outreach Liaison
Chief Impact Officer
Delaware County Board of Health
Delaware County Council
Doylestown Health
Doylestown Health
Doylestown Health
Foundation for Delaware County
Vice President and Chief Nursing Officer (CNO) Grand View Health
Wendy Kaiser Director of Marketing and Communications
Cassidy Tarullo Burrell, MPP
Kelly Rand, MA CPH
Lauren Eckel, MPH, CHES
Meghan Smith, MPH
Sehrish Rashid, MPH, MA
Abigail O. Akande, PhD, CRC
David Martin, PhD
Dani Perra, MPH
U. Tara Hayden, MHSA
Katie Farrell
Sue Smith Lamar, M Ed., RN
Brandi Chawaga, M.Ed.
Joan Boyce
Project Manager
Senior Director, Community Health and Impact
Project Manager
Senior Project Manager
Senior Project Manager
Qualitative Consultant
Quantitative Consultant
Program Manager, Community Health Benefits & Engagement, Jefferson Collaborative for Health Equity
Vice President, Community Health Equity, Jefferson Collaborative for Health Equity
Chief Administrative Officer
Ambulatory Nurse Manager, Community Health
Director, Community Wellness
Senior Director, Government Relations & Public Affairs
Grand View Health
Health Care Improvement Foundation
Health Care Improvement Foundation
Health Care Improvement Foundation
Health Care Improvement Foundation
Health Care Improvement Foundation
Health Care Improvement Foundation
Health Care Improvement Foundation
Jefferson Health
Jefferson Health
Jefferson Health (Abington – Lansdale)
Jefferson Health (Abington – Lansdale)
Jefferson Health (Einstein Montgomery)
Jefferson Health (Einstein Philadelphia)
Name Title
Tricia Nichols MSN, RN, NEA-BC, CPXP Patient Experience Director
Debbie Mantegna, MSN, RN
Debbie McKetta, MS, CLSSGB
K.C. Maskell
Rosangely Cruz-Rojas, DrPH
Feba Cheriyan, MPH
Ruth Cole, RN, MPH
Ajeenah Amir
Courtney Summers, MSW
Heather Klusaritz, PhD, MSW
Kristen Molloy
Laura Kim
Rose Thomas, MPH, CHES
Chad Thomas, MPH, PMP
Michele Francis, MS, RD, CDCES, LDN
Garrett O’Dwyer, MPH
Frank Franklin, PhD, JD, MPH
Megan Todd, PhD
Claire Alminde, MSN, RN, CPN, NEA-BC
Ed Bleacher II, MBA, CHFP, CRCR, FHFMA
Joanne Ferroni
Maura Heidig
Renee Turchi, MD, MPH
Lakisha Sturgis, RN, BSN, MPH, CPHQ
Marybeth Taylor, MPH
Allison Zambon, MHS, MCHES
Joann Dorr, RN, BSN
Stacy Ferguson, MHSc
System Director, Community Health & Outreach
System Director, Diversity, Respect & Inclusion (DRI)
Director, Strategy & Business Development
VP and Chief Diversity & Equity Officer
Epidemiology Research Associate
Director, Division of Clinical Services
Director of Civic Engagement and Community Partnerships
Administrator, Division of Community Health
Chief, Division of Community Health Department of Family Medicine and Community Health
Corporate Director, Government and Community Relations
Associate Director, Community Relations
Director of Operations, Center for Health Equity Advancement and Program for LGBTQ+ Health
Community Health Education Coordinator
Director, Community Health & Wellness Services
Associate Policy Director
Deputy Health Commissioner
Chief Epidemiologist
Chief Nursing Officer
Chief Financial Officer
Assistant Vice Provost for Anchor Partnerships, , Office of University and Community Partnerships of Drexel University
Director of Population Health
Pediatrician-in-Chief
Director, Community Care Management, Temple Center for Population Health
Community Benefit & Special Projects Manager
Program Manager, Office of Community Outreach and Engagement
Regional Director, Community Health and Well-Being
Regional Senior Community Benefit Director, CHWB Director South, Project Manager, The Healthy Village at Saint Francis
Institution
Jefferson Health (North)
Main Line Health
Main Line Health
Main Line Health
Main Line Health
Montgomery County Office of Public Health
Montgomery County Office of Public Health
Penn Medicine
Penn Medicine
Penn Medicine
Penn Medicine
Penn Medicine
Penn Medicine
Penn Medicine (Chester County Hospital)
Penn Medicine (Chester County Hospital)
Philadelphia Association of Community Development Corporations
Philadelphia Department of Public Health
Philadelphia Department of Public Health
St. Christopher's Hospital for Children
St. Christopher's Hospital for Children
St. Christopher's Hospital for Children
St. Christopher's Hospital for Children
St. Christopher's Hospital for Children
Temple Health
Temple Health
Temple Health (Fox Chase Cancer Center)
Trinity Health Mid-Atlantic
Trinity Health Mid-Atlantic
* Some institutions experienced staffing transitions during the year; this list represents all those who represented an entity during the rCHNA planning process.
HCIF and the Steering Committee reviewed and finalized the list of quantitative health indicators. The list of indicators from the 2022 report provided a starting point, and indicators were removed and added based on the following considerations:
• Availability of the data source. Some indicators were not included due to discontinued data sources, lack of updated data, or inaccessibility of the data.
• Uniqueness. Some indicators that were redundant with other measures were removed.
• Granularity and quality of the data. For new indicators, those with data available at the ZIP code level for all five-county ZIP codes and for which data quality and completeness could be verified were prioritized. For some indicators of strong interest, if only county-level data were available, those estimates were included as well.
• Current interest. Additional indicators related to disability, housing, and youth were added to this assessment.
Data were gathered, cleaned, organized and analyzed primarily by quantitative data consultant, David Martin, PhD; University of Virginia, with support from the Pennsylvania Department of Health, Philadelphia Department of Public Health and HealthShare Exchange.
Data collection began with the use of the United States Census Bureau’s American Community Survey (ACS) data. This dataset provided essential demographic and population information, enabling the calculation of rates and proportions for various indicators. ACS data was particularly useful for deriving rates requiring total population values (e.g., total population, population by age group, population by race/ethnicity, etc.). Where available, estimates were collected in both absolute numbers and percentages/rates, along with accompanying measures of error, such as margins of error (MOE) and confidence intervals (CI), ensuring robust statistical backing for any subsequent analysis. Data sources were accessed between June 2024 through April 2025.
Data was gathered and analyzed at both the Zip Code Tabulation Area (ZCTA) and county levels to allow for comparisons and aggregation to the hospital service area (HSA) and geographic community area (GCA) levels. The most recent 5-year estimates were utilized (2018–2022 and 2019–2023).
Following the compilation of census data, additional indicators were sourced from the Behavioral Risk Factor Surveillance System (BRFSS), CDC/ATSDR Social Vulnerability Index, Pennsylvania Department of Health, County Health Rankings, and others. If data was missing for either the estimates or measures of variation, estimates were calculated using available data from the source and census data.
When aggregating data to HSA or GCA, indicator values were calculated with weights based on the size of the affected population in each ZIP Code (e.g., age groups such as 65+, 18-64, or total population).
Depending on the availability of the data, indicators were summarized at these levels:
• County level – For all five counties
• Geographic community level – These represent clusters of ZIP codes grouped into 46 distinct geographic communities, based on guidance from Steering Committee members. Geographic communities were developed for the 2022 assessment, with no changes made to the groupings in 2025.
Community survey results were analyzed to ensure all respondents were eligible due to age and provided ZIP codes included in the rCHNA service area. Survey responses were assessed for quality and completeness. One survey option was removed from reported results due to unreliable response counts: Question - “Thinking about the community where you live, how available are the following resources?”, Response: Public Transportation.
For the GCA profiles, responses were aggregated into the corresponding geography based on respondents ZIP code. GCAs with fewer than 35 responses were combined with adjacent GCAs, prioritizing those with similar demographics. Combined responses are noted within the respective profile. Lastly, each survey question was examined by calculating the percentage of respondents selecting each response, ranking the top three most selected responses by percentage, and reporting those values.
Data was either manually transposed in Microsoft Excel, downloaded directly from data sources websites, or gathered from the tidycensus (1.6.7) package (a product which uses the Census Bureau Data API) in R (4.4.1) and RStudio (2024.09.0). All Excel files were then merged and appended in RStudio using the tidyverse package (Version 1.3.0).
This assessment features over 70 health indicators from varied data sources, aggregated at various levels. The table below presents information about the included indicators.
Indicator Details
Population Total population size
Age distribution by sex
Race/ethnicity
Year(s) Source
2023
2022
Educational attainment High school as highest education level (26+ years)
Income Median household income
Social Vulnerability Index Percentile ranking of 4 socioeconomic indicators
Foreign-born status Born outside of United States
Ability to speak English Speak English less than "very well" (5+ years)
Disability status With a disability
Leading causes of death Top 5 causes
All-cause mortality
Rate per 100,000
Life expectancy by sex Years
Years of potential life lost before
75 Years
American Community Survey, Census Bureau (5-yr)
American Community Survey, Census Bureau (5-yr)
2022 American Community Survey, Census Bureau (5-yr)
2022 American Community Survey, Census Bureau (5-yr)
2022
American Community Survey, Census Bureau (5-yr)
2022 CDC/ATSDR Social Vulnerability Index
2022
2022
American Community Survey, Census Bureau (5-yr)
American Community Survey, Census Bureau (5-yr)
2022 American Community Survey, Census Bureau (5-yr)
2023 Vital Statistics, PA Department of Health, County Health Rankings **
2022 Vital Statistics, PA Department of Health **
2022 Vital Statistics, PA Department of Health **
2022 Vital Statistics, PA Department of Health **
Indicator Details
Adult obesity prevalence
Year(s) Source
Body mass index 30-99.8 among adults 18+ years
Diabetes prevalence Told by a doctor that they have diabetes
Diabetes-related hospitalization
Chlamydia
Flu vaccinations
Rate per 100,000
Rate per 100,000
Adults
Hypertension prevalence Told by a doctor that they have high blood pressure
Hypertension-related hospitalization
Potentially preventable hospitalization
Premature cardiovascular disease mortality
Major cancer incidence
Major cancer mortality
Mammography screening
Colorectal cancer screening
Disability status
Hearing difficulty
Vision difficulty
Cognitive difficulty
Ambulatory difficulty
Self-care difficulty
Independent living difficulty
Poverty status
Rate per 100,000
Rate per 100,000
Death before 65 years, rate per 100,000
Prostate, breast, lung, colorectal cancers; rate per 100,000
Prostate, breast, lung, colorectal cancers; rate per 100,000
Mammogram in the past 2 years among women 50-74 years
Fecal occult blood test, sigmoidoscopy, or colonoscopy among adults 50-75 years
DISABILITIES
With a disability
Deaf or having serious difficulty hearing
Blind or having serious difficulty seeing, even when wearing glasses
Because of a physical, mental, or emotional problem, having difficulty remembering, concentrating, or making decisions
Having serious difficulty walking or climbing stairs
Having difficulty bathing or dressing
Because of a physical, mental, or emotional problem, having difficulty doing errands alone such as visiting a doctor’s office or shopping
Poverty status of those with a disability in the past 12 months
2021 Behavioral Risk Factor Surveillance System
2021 Behavioral Risk Factor Surveillance System
20212023
20202022
Pennsylvania Health Care Cost Containment Council *
Pennsylvania Department of Health, Bureau of Communicable Diseases
2021 County Health Rankings, Mapping Medicare Disparities Tool
2021 Behavioral Risk Factor Surveillance System
20212023
20212023
Pennsylvania Health Care Cost Containment Council *
Pennsylvania Health Care Cost Containment Council *
2022 Vital Statistics, PA Department of Health **
2022 Vital Statistics, PA Department of Health **
2022 Vital Statistics, PA Department of Health **
2022
2022
2022
2022
2022
2022
2022
2022
2022
2022
Behavioral Risk Factor Surveillance System
Behavioral Risk Factor Surveillance System
American Community Survey, Census Bureau (5-yr)
American Community Survey, Census Bureau (5-yr)
American Community Survey, Census Bureau (5-yr)
American Community Survey, Census Bureau (5-yr)
American Community Survey, Census Bureau (5-yr)
American Community Survey, Census Bureau (5-yr)
American Community Survey, Census Bureau (5-yr)
American Community Survey, Census Bureau (5-yr)
Indicator Details
Asthma hospitalization Children <18 years, rate per 100,000
Infant mortality
Deaths before age 1 per 1,000 live births
Lead levels in children >=5 µg/dL
Low birthweight births
Pre-term births
Percent low birthweight (<2,500 grams) births out of live births
Percent preterm (before 37 weeks gestation) births out of live births
Child Opportunity Index Composite score, measures and maps the quality of resources and conditions, at the census tract level, that matter for children’s healthy development.
Adult binge drinking 5+ (men) or 4+ (women) alcoholic drinks on one occasion in past 30 days
Adult smoking
Current smoker status
Drug overdose mortality Rate per 100,000
Opioid-related hospitalization Rate per 100,000
Substance-related hospitalization Rate per 100,000
Poor mental health (adults)
Suicide mortality
Poor mental health for 14+ days in past 30 days (adults)
Rate per 100,000
Youth binge drinking 5+ alcoholic drinks in a row on >1 days in past 30 days among teens
Youth ever attempted suicide
Youth mental health
Youth smoking
Suicide attempt ever among teens
Depressed/sad most days or sad/hopeless almost every day 2+ weeks in past 12 months among teens
Smoked cigarettes in past 30 days among teens
Youth vaping Used electronic vapor products in past 30 days among teens
Fall-related hospitalization Ages <64; rate per 100,000
Gun-related emergency department utilization
Homicide mortality
Mortality due to gun violence
Rate per 100,000
Rate per 100,000
Rate per 100,000
Year(s) Source
20212023 Pennsylvania Health Care Cost Containment Council * +
2022 Vital Statistics, PA Department of Health **
2021 CDC
2022 Vital Statistics, PA Department of Health **
2022 Vital Statistics, PA Department of Health **
2021 Institute for Equity in Child Opportunity & Healthy Development at Boston University School of Social Work; diversitydatakids.org
2021 Behavioral Risk Factor Surveillance System
2021 Behavioral Risk Factor Surveillance System
2022 Vital Statistics, PA Department of Health **
2023 Pennsylvania Health Care Cost Containment Council *
2023 Pennsylvania Health Care Cost Containment Council *
2021 Behavioral Risk Factor Surveillance System
2022 Vital Statistics, PA Department of Health **
2023 Youth Risk Behavior Surveillance System, Pennsylvania Youth Survey
2023 Youth Risk Behavior Surveillance System, Pennsylvania Youth Survey
2023 Youth Risk Behavior Surveillance System, Pennsylvania Youth Survey
2023
Youth Risk Behavior Surveillance System
2023 Youth Risk Behavior Surveillance System
20212023 Pennsylvania Health Care Cost Containment Council *
2023 HealthShare Exchange
2022 Vital Statistics, PA Department of Health **
2021 Vital Statistics, PA Department of Health **
Indicator Details
Health insurance (public) status - Adults Adults 19-64 years with Medicaid
Health insurance (public) statusChildren Children <19 years with public insurance
Health insurance statusPopulation Population without insurance
Health insurance status - Children Children <19 years without insurance
Year(s) Source
2022
2022
2022
2022
High emergency department utilization 5+ visits in 12 months, rate per 100,000 2023
Poverty status - Population Population in poverty
Poverty status - Children Children <18 years in poverty
Commute Commute greater than 60 minutes
Employment status
Adults 19-64 years unemployed (not in labor force)
Food insecurity Population experiencing food insecurity, county-level only
Homeownership Proportion of households that are owneroccupied
Household type – older adults Householders living alone who are 65+ years
Household type – same sex couples
Household type – single parent
Households receiving food assistance
Same sex couple households; rate per 1,000
Single parent households
Households receiving Supplement Nutrition Assistance Program (SNAP) benefits
Housing cost burden - severe Households who spend >50% of income on housing
Housing occupancy status
Income Inequality
Violent crime rate
Vacant housing units
Assesses income or wealth distribution within a population
Rate per 100,000
* Data analysis conducted by the Philadelphia Department of Public Health.
2022
2022
2022
2022
American Community Survey, Census Bureau (5-yr)
American Community Survey, Census Bureau (5-yr)
American Community Survey, Census Bureau (5-yr)
American Community Survey, Census Bureau (5-yr)
HealthShare Exchange
American Community Survey, Census Bureau (5-yr)
American Community Survey, Census Bureau (5-yr)
American Community Survey, Census Bureau (5-yr)
American Community Survey, Census Bureau (5-yr)
2022 Feeding America
2022
2022
2022
2022
2022
2022
2022
2022
American Community Survey, Census Bureau (5-yr)
American Community Survey, Census Bureau (5-yr)
American Community Survey, Census Bureau (5-yr)
American Community Survey, Census Bureau (5-yr)
American Community Survey, Census Bureau (5-yr)
American Community Survey, Census Bureau (5-yr)
American Community Survey, Census Bureau (5-yr)
American Community Survey, Census Bureau (5-yr)
2022 PA Uniform Crime Reporting System
** These data were supplied by the Bureau of Health Statistics & Registries, Pennsylvania Department of Health, Harrisburg, Pennsylvania.
+ Data only available for geographic communities in Philadelphia County.
A critical complement to the quantitative data represented by the health indicators is qualitative data that capture the perspectives, priorities, and ideas of those who live, learn, work, and play in local communities. Building on the qualitative data collection approach developed for the 2019 and 2022 rCHNA, the Steering Committee and project team sought to expand, enhance, and refine strategies to thoughtfully gather and incorporate community input into the 2025 rCHNA. A subset of the Steering Committee, as well as several additional representatives from participating health systems, formed a Qualitative Team to guide the planning process. HCIF also engaged an expert in qualitative data collection and analysis as a consultant to serve as Qualitative Lead, Abigail Akande, PhD; Penn StateAbington College, as well as a trained youth facilitator, Briana Bronstein, PhD; Widener University.
Recognizing that no single data collection effort could comprehensively reflect the unique experiences and specific needs of all communities in the region, the approach was grounded in mixed methods which incorporated focus group discussions, interviews, surveys, and a wide array of secondary sources. The core of the primary data collection process again focused on hearing from community residents and staff from local organizations who serve these communities, as well as more closely examining particular topics and populations. However, several changes were made in order to accommodate situational realities, as well as increase the depth and breadth of coverage:
• Primary data collection was undertaken by the project team June 2024 – April 2025. To offer the greatest level of accessibility, both in person and virtual sessions were held in each county.
• Focus group-style, 90-minute “community conversations” were held to gather input from residents of the region. Building on the trust built through prior rCHNAs, the team used a “trusted messenger” approach. The Steering Committee guided the selection of community-based organizations reaching important populations within the region. The identified organizations were then compensated with a small stipend for their help with the recruitment of eight to ten individuals. The organizations were also provided with organizationally specific write ups of qualitative data and geographic information from the community survey for use in evaluation and grant efforts. The number of conversations increased to 30: Bucks (5), Chester (4), Delaware (5), Montgomery (4), and Philadelphia (12). This method also increased engagement and diversity of participants.
• To capture the insights of those who provide important health, human, and social services in each of the counties, 60-minute group discussions centered on “spotlight” topics were conducted with organization and local government agency representatives. A list of topics was generated by the Steering Committee based on priorities from past CHNAs. Spotlights were divided into two categories – Care and Community. Two meetings were held in each county concurrently except for Montgomery County where only one meeting was held. An additional 15 key informant interviews were held with community-based organization leaders and subject matter experts. Additional questions were asked to each group on community-based organizations capacity to handle the increase in social needs screening occurring due to new federal requirements. A special session with new mothers and expecting mothers was held to better understand the community perspective on maternal health.
Care
Community Issues
Maternal Health Housing
Older Adults and Aging in Place
Caring for Uninsured and Undocumented Individuals
Culturally Appropriate Mental Health
Primary Care Access
Better Integration of Health and Social Services in the Community
Increase Community Member Capacity to Serve as Care Navigators
Involve Community in Solutions and Implementation
Preventative Care and Education in the Community
• The project team either undertook directly or supported partners with targeted primary data collection to better understand the needs of particular communities or populations. These focus areas and communities were specific to different types of facilities within participating health systems (i.e., cancer centers, rehabilitation facilities) and other areas identified by the steering committee:
– Cancer: In addition to cancer-related information gathered from community conversation and spotlight discussions described above, partner cancer center board members they conducted.
– Disability: HCIF worked with a subcommittee of rehabilitation facilities to develop and administer an online survey of people with disabilities and held three focus groups with individuals living with disabilities.
– Older Adults: New to the rCHNA in 2025, HCIF thematically analyzed the community conversations held in senior centers and communities as well as the community conversations. Responses from adults over 65 were extracted from a larger dataset of the general population to better identify their specific needs and were compared with broader community trends.
– Vision: New to the rCHNA in 2025, HCIF staff held three community conversations with people specifically focused on vision care. Support for the qualitative guide came from the Wills Eye hospital.
– Youth Voice: In the 2025 round, HCIF staff again used the trusted partner approach and provided a small stipend to youth serving organizations to help with recruitment. Additionally, a trained youth facilitator led each of the 15 conversations.
• Secondary data in the form of reports and summaries from other community engagement efforts were important inputs for this report. A full list of sources incorporated is included in the “Resources” section.
• Community Survey: As part of this assessment, an additional quantitative component was incorporated to complement community input, providing a more comprehensive picture of local health needs and priorities. HCIF, in collaboration with hospital systems and community-based organizations (CBOs), conducted a general population survey consisting of six core questions along with demographic information to ensure broad representation across all counties. To enhance accessibility and inclusivity, the survey was administered in English and seven additional languages. The data collected was then analyzed at both the county and sub-geographic levels, allowing for a deeper understanding of the diverse experiences and needs of different communities.
The Qualitative Team guided the development of discussion guides (see online Appendix) for both the community conversations and the spotlight discussions. These were adapted from those used for the 2022 rCHNA and included questions addressing community assets; community health challenges and barriers (including those related to social determinants of health, access to care, COVID-19); specific needs of older adults, children and youth, and additional underrepresented groups; and potential solutions for particular needs.
Values guiding participant engagement included respecting community members’ time and expertise (one expression of this was providing community members with $25 Visa gift cards for their participation) and ensuring that voices of minoritized communities were well-represented in the discussions. With these values in mind, Steering Committee members contributed suggestions of partner organizations for outreach (to participate in meetings themselves or assist with community member engagement), which were organized into a centralized partner database. HCIF conducted outreach based on this database, researched additional organizations, and employed a snowball technique to elicit other potential partners for Town Hall meetings, which were larger gatherings held for the entire county and in some Philadelphia meetings. However, for most Philadelphiabased meetings, a trusted messenger approach was prioritized. This approach involved partnering with embedded community organizations to engage participants who might not typically attend such meetings.
When meetings were held in person, they took place in trusted community venues, ensuring accessibility and cultural relevance. Culturally appropriate food was provided, and incentives were offered not only to individual participants but also to the hosting venues. This strategy enabled engagement in settings such as YMCAs, food pantries, homeless shelters, and other spaces serving minoritized populations, fostering a more inclusive and participatory process.
To promote these discussions, Steering Committee members, PACDC, partner organizations, and HCIF utilized varied outreach methods, including phone and email outreach, social media posts, intranet outreach, listserv posts, and community flyer distribution. The Qualitative Lead facilitated all community conversations and the Maternal Health conversation, with technical support provided by the HCIF team. These discussions were recorded and transcribed for later analysis, with access to the recordings and transcripts limited to the project team and the Qualitative Lead. Transcripts were imported as Word documents into NVivo software to manage, code, and interpret qualitative data.
The Qualitative Lead consultant identified recurrent themes from these transcripts, created a set of codes, coded for these themes, and generated summaries featuring themes and accompanying quotes. To ensure confidentiality, participants were assigned numbers in the transcripts to replace names, and care was taken to avoid disclosing any individual’s identity in the summaries. Participant quotes are presented verbatim to preserve authenticity and reflect the diverse ways participants express their experiences and perspectives. While Philadelphia’s individual meetings are represented in the full report, Bucks, Chester, Delaware, and Montgomery’s discussions were analyzed at a county level. Individual write ups of the conversations held in those counties can be found in the appendix.
For Spotlight and Focus Area discussions, transcripts were also coded using deductive coding based on the qualitative guides. Coding teams, made up of HCIF masters or doctorly prepared staff, met regularly to ensure agreement on codes, and summaries were generated featuring key themes and illustrative quotes.
Based on the coding, consultants identified significant overlap in common themes across geographic communities and spotlight topics. To minimize redundancy and ensure summaries were based on an adequate sample size, the Qualitative Leads developed the following summary structure for inclusion in the report:
• Geographic Communities – County-level summaries for Bucks, Chester, Delaware, and Montgomery Counties, as well as five summaries for distinct geographic sections of Philadelphia County (individual summaries for each of the 26 Community Conversations are available in the online Appendix).
• Spotlight Topics – Aggregated topic summaries across counties.
Summaries are organized around key sections of the discussion guide. Within each section, themes are generally presented in order of greatest frequency of mention. However, in some cases, related topics are grouped together for clarity and coherence. The themes are accompanied by illustrative quotes to capture participants’ voices as authentically as possible.
Top priorities gathered in the general community conversations, youth conversations and extrapolated from the general population survey were aggregated by HCIF staff and presented to the Steering Committee for voting on how best to group concerns. This grouping exercise led to 12 general population priorities and 8 youth focused priorities, representing three categories: health issues, access and quality of healthcare and health resources, and community factors.
Once the grouping process was completed, the Steering Committee used the Hanlon Method to prioritize the categories. The Hanlon Method is a structured and systematic approach widely used in public health to prioritize community health needs based on severity, impact, feasibility, and resource availability. Below is a detailed account of the process used to implement the Hanlon Method for prioritization in this assessment.
The first step involved identifying and listing key community health priorities. These priorities were determined through extensive engagement with community members via live meetings and a community needs survey. The resulting priority list was recorded in Column A of the assessment spreadsheet.
To understand the extent of each health issue, we assessed the proportion of the population affected by each identified priority. A quantitative consultant provided statistical data, which was used to populate Column B. The detailed data sources and calculations were available to health systems for reference. This step involved evaluating how serious each identified issue is for the population served by the health system. The assessment was conducted on a 0 to 10 scale, where 0 represents a minimally serious issue, 5 represents moderate seriousness, and 10 represents the most serious health concerns. The ratings were entered in Column C of the assessment tool. This rating process helped determine the urgency and potential health impact of each problem.
An essential component of the Hanlon Method is assessing the feasibility of addressing each issue. In this step, we evaluated the level of difficulty in implementing solutions for each problem. Using a predetermined scale:
• 0.5 was assigned if the problem is very difficult to solve.
• 1 was assigned if the problem requires moderate effort to solve.
• 1.5 was assigned if the problem has an easy solution.
These ratings were recorded in Column D to reflect the complexity of addressing each issue.
To further refine our prioritization, we performed a PEARL assessment, which considers the following feasibility factors:
Propriety: Is intervention appropriate and relevant?
Economics: Is there economic feasibility or financial support?
Acceptability: Will the community accept and engage with the intervention?
Resources: Are sufficient resources (funding, staffing, infrastructure) available?
Legality: Can the intervention be legally implemented?
Each factor was rated as 0 (No) or 1 (Yes) and documented in Columns E through I to determine the feasibility of each intervention. This assessment ensured that selected priorities were not only urgent but also actionable.
• The final CHNA report was drafted by the HCIF team and presented to the hospital/health systems for review and revision.
With all relevant data entered, the final score for each health priority was calculated using an embedded formula. This final step provided a ranked list of community health needs based on magnitude, severity, feasibility, and potential for intervention. The scoring process ensured that decision-makers had a clear, evidence-based understanding of the most pressing and actionable health issues in the community. Those scores were then aggregated and shared back with the Steering Committee with their ranking and standard deviation.
The Hanlon Method provided a transparent and data-driven approach to prioritizing community health needs in the 2025 rCHNA. By integrating quantitative data, expert assessments, and community perspectives, this approach facilitated an equitable and strategic prioritization process. The final prioritized list will guide the allocation of resources, program development, and policy initiatives to address the most significant health challenges in the region.
This structured prioritization process ensures that health interventions are both impactful and feasible, ultimately improving health outcomes for the communities served by the regional health system.
• This report was presented and approved by the Board of Directors of each hospital/health system.
The overall service area includes Bucks, Chester, Delaware, Montgomery, and Philadelphia and represents a diverse population of 4,206,741. All ZIP codes in the five counties were grouped into 46 distinct geographic communities, as shown below. In the next section, each quantitative county profile is followed by relevant summaries of qualitative data collected through geographic community conversations in that county, as well as quantitative profiles of the geographic communities within each county.
Upper Perkiomen Valley
Central Perkiomen Valley
Pottstown
Lower Perkiomen Valley
Audubon
North Penn and Lansdale
Blue Bell
Upper Dublin
Willow Grove
Greater Abington
Lower Eastern Montgomery Norristown
Conshohocken
King of Prussia
Main Line East
Southern Chester
Central-West Chester
Kennett
West Chester
Downingtown/Glenmoore
Northern Chester
Northwest Chester
Central-East Chester
Airport Corridor
Central Delaware County
Chester/I-95 Corridor
Main Line Central
Route 3 Corridor
Upper Darby and Lansdowne
Western Delaware County
Upper Bucks BUCKS
Central Bucks
Lower Central Bucks
Lower Bucks
Center City
Far North Philadelphia
Far Northeast Philadelphia
Lower Northeast Philadelphia
North Philadelphia-East
North Philadelphia-West
Northwest Philadelphia
River Wards
South Philadelphia-East
South Philadelphia-West
Southwest Philadelphia
West Philadelphia
There are 5 hospitals and 4 health centers in Chester County.* *ChristianaCare - West Grove anticipated opening Summer 2025
*SVI is a measure developed by the CDC to identify communities that may need support before, during, or after disasters. This measure is made up of a combination of 16 different U.S. Census variables, which are grouped into four themes (socioeconomic status, household charateristics, racial & ethnic minority status, and housing type & transportation), and cover major areas of social vulnerability.
AGE DISTRIBUTION
Chester County has an estimated population of 540,896 with the largest proportion of residents between the ages of 45 - 64.
Median Household Income $107,826 Homeownership 75%
Severe Housing Cost Burden % spending >50% of household income 11%
77% of residents are non-Hispanic White. Hispanic/Latine residents make the next largest population, comprising about 7.6% of the county’s residents.
Nearly 10% of residents are foreignborn and about 4% speak English less than “very well.”
High School as Highest Education 19.3% Household Food Insecurity 8.1%
Single Parent Households 18.2%
Same Sex Couples per 1,000 households 2.8
Commute Greater than 60 minutes 9.2%
3.1
This measure reflects limited access to primary care as individuals may rely on emergency departments non-emergency health needs due to barriers like insurance, trust, clinician shortages, etc.
Vaccinations (Adult) 60.0%
This measure is a strong indicator of overall community vaccination levels because they reflect access to healthcare, public trust in vaccines, and the effectiveness of outreach efforts in promoting immunization.
Chlamydia per 100,000 212.3
This measure is a good marker for STIs in a community because it is the most commonly reported bacterial infection, often asymptomatic, and indicates the overall level of STI transmission, screening, and prevention efforts in a population.
Income Inequality
0.45
This measure is often used to assess income or wealth distribution within a population. It ranges from 0 to 1, where 0 indicates perfect equality (everyone has the same income) and 1 signifies maximum inequality (one person has all the income while others have none).
Thinking about yourself or other ADULTS in the community where you live, what are the top 3 HEALTH problems?
Thinking about the community where you live, which barriers prevent access to health care?
(Select all that apply) Costs associated with getting healthcare
Scheduling
Language
Number of Respondents: 658
Fear (such as fear of doctors or not ready to discuss a health problem) 12.9%
Don’t know how to find healthcare services or providers 9.0%
Cultural / religious beliefs 6.7% None
Mistrust of the health systems
Don’t feel welcome or respected 5.2%
Not sure 2.4%
Thinking about the community where you live, how available are the following resources?
Some residents shared that they appreciated having access to parks and walking paths. Opportunities for physical activity contributed to overall positive health experiences.
ON GREEN SPACE & RECREATION
“…there’s a lot of group walking and people doing things. It’s not just individuals from the house, it’s people who together to do some form of activity.”
“I’ll say the area that I live in which is Kennett Square, Southern Chester County, there are a number of health and fitness facilities and some of them are very affordable and you can take advantage of a number of different health facilities from swimming, physical activity, Pilates, pickleball, everything like that. So it’s a good way to maintain a level of health.”
“And we have a great department of parks and recs. The borough does music in the park to bring the community together, the township does sporting activities and things.”
Community members have recognized social and health benefits related to the availability of fresh, local produce. Food banks also provided a variety of options to residents.
ON HEALTHY FOOD
“I live in Chadds Ford for which is close to Kennett Square in Southern Chester County, and we have a lot of local farmers and local produce and there’s been some nice sharing of that, especially in the summertime with raised beds and that sort of thing. We’re starting a co-op in Kennett Square because we want to be able to have local food all year round and local products. But I feel like there’s a commitment to having space for agriculture, which is the food we need.”
“The food pantry, serves hundreds of people a distribution and they do that twice a month, once in the daytime, once in the evening…”
Community members valued relationships with neighbors and the support that they provided for one another.
“I live in… a retired community, and walking, conversations and talking about how your day is going and we form bonds and then… when we see somebody that is needy in terms of physically, mentally or anything like that, we rise to the occasion and do what it is we need to do and it’s reciprocal. So it’s a good feeling and that is good for your spirit, your mind, your health.”
“I know every community has some problems, but for the most part, I always feel safe walking.”
“I think I can speak, for, like the Hispanic community, I feel like Southern Chester County is really inclusive…”
Air and noise pollution improvements were referenced by community members as playing active roles in an enhanced quality of life.
“I think one thing that may have helped the community health wise is the local steel company… for many years they’ve had a new system they use it with the electric furnace and they don’t produce the pollution.”
“We have not had the smell from the treatment plant which is in South Coatesville. And it seemed like every Wednesday you have to feel, it was bad. But it has gotten better because I haven’t noticed it in maybe a couple of years now.”
“The quiet rural atmosphere, it is calming.”
Respondents noted the importance of local health education opportunities, and access to medical specialists.
“I think the local hospital community department provides a lot of education around different topics that are great into the community that we tend to spread to the community that there’s access in education as well.”
“I think we have many high-quality healthcare providers in Chester County. I know we have the cancer center, we have all these specialties that I feel like a lot of communities do not have. I’m grateful for that in the specialist that you can take referrals to, and that we partner with Philadelphia and their resources. So there’s that kind of partnership too.”
“I was really happy to find how easy it was to find a dentist, a foot doctor, a chiropractor. In this small community, there are many ways to take care of yourself, that are easily accessible.”
Hospitals were not readily accessible to all residents, which could prove harmful in emergency situations. There were further implications related to where ambulances were allowed to transport patients. There were also no urgent care centers that were close enough. There were concerns about dental neglect, for residents of all ages, and a lack of oral health literacy.
A respondent, and nurse, spoke to the need for patients to be assisted in the navigation of health services, needs, and options. Language barriers could limit access, particularly Portuguese and Eastern European languages.
Lastly, certain hospitals and mental health providers didn’t accept Medicaid and it was believed that “they’re just trying to find a way to cut those who are most expensive off their list.”
“…we are far from a local hospital, pretty much have to decide. Where I work, we had to call for ambulances and you don’t know where to tell people to take them…”
“I mean you look at someone and they have rampant decay and they go to the dentist… some of them have the fear, lack of transportation, lack of funds, if they do have insurance, they really don’t have money for the copay.”
“It’s very hard to find the Medicaid dentist – anywhere. Other than the FQHCs, there’s one in Coatesville, one in Pottstown.”
“You’re talking about technology but not everybody has access to the technology or the knowledge of how to use it.”
“I also feel that we really don’t have health navigators that help people through the system, and I think hospitals could do so much better with that in helping people see what are the steps they go through… I don’t feel like we’re navigating through those steps that you have to take to get the treatment and to finish and mental health, all the things that you need when you’ve been diagnosed with something.”
“I drive my son to Philly for his doctor, for someone who knows how to work with people with disabilities, but you know not everybody can do that…”
Insufficient public transportation made access to health services, grocery stores, and recreation activities difficult for people who didn’t live near them. Many areas did not have sidewalks, or the sidewalks were in disrepair.
“So transportation can become a huge issue if you have like an elderly person that needs the power of attorney or needs support, those resources are not available without going out of town.”
“So they either live adjacent to them or they’ve got to drive because public transportation in Chester County is not good.”
Residents found it difficult to find mental health services. When they did, there tended to be long waits for appointments. There seemed to be a lack of access to information or efficient dissemination of information about local services.
The mental health of residents of all ages was a concern, particularly that of parents who should be emotionally well-equipped in their roles.
“…we have groups that meet here that finding psychiatric or emotional support is a desert around here.”
“…to go back to what she was saying, I think it is also a lack of education, for the fact that people here probably could video chat with a therapist or a psychiatrist or emotional support like that, they just don’t know that that’s like an option. So I think that’s probably something that’s worth talking about.”
“From reading historically, in the 70s, we opened up psychiatric facilities, said nobody should be in here, they should be out and amongst people and, but we didn’t build resources, not like we have resources for other parts, good resources for here down in healthcare.”
“We have a shortage of counselors and we have a shortage of psychiatrists. We really do, and then Spanish-speaking or other language ones, we are really short.”
“I see that in my work as a police chaplain, you know, I get called out on emergencies and stuff, and there’s just no place to put anybody. We just are so short of beds.”
High housing costs, and long waiting lists for affordable housing exacerbated the problems of “the poorest of the poor.”
“…the rents and the lot rents all that’s going up, they can’t afford it, they can’t meet, they get evicted, they’re living in their cars. It’s a cycle of poverty.”
“And especially if they’re in the trailer parks, they think their costs aren’t going to change, but the trailers need new roofs or the plumbing goes or something catastrophic. I know many of them with space heaters because their regular heating is not working.”
“There’s even people and I don’t know if you’ve ever heard, but like in my community when I first moved there, with the homelessness and that. There’s people living in the tree line of the forest back there, there’s tents in the woods.”
Participants were complimentary of the schools in their communities. But “right now, there’s disparity. Those that can afford pre-K go, those that can’t, don’t go.”
Concerns raised by community members revolved around parents needing support with childrearing, navigating services for children with disabilities, the mental health of youth, and hungry children. Also, for those “living in poverty, with parents in jail or gone, or raised by grandparents,” support was needed.
Different activities and resources, such as youth centers, vacation bible school, and swim lessons were appreciated.
“I think we have a great public school system. We have locally, we have Honey Brook Elementary Center, multiple preschool options here that serves an underserved area of the community. So we have after school programs, there’s people to people that does a youth center right here in the borough.”
“Also you have a lot of one household. So these kids are basically raising themselves. So they’re not eating healthy and that’s a problem and they’re the ones that you might find out on the street late at night because nobody’s looking after our babies.”
“I lived in a area where we had three suicides at the high school level and my grandson went to that school. I saw firsthand what he went through, so I think that that needs to be addressed at a high level because there are so many things and peer pressure is going on with the students, with the kids, the Internet and those types of things and how can they be that be serviced for their needs?”
“…children that have been identified to be at risk for not eating properly over the weekend will get a backpack every Friday when they go home from school. With food that they can prepare themselves…”
Senior residential communities provided a myriad of resources and activities, that also helped to foster connectedness. Those living alone (mostly women), lacking transportation, and located far from resources were more vulnerable. Limited technology use with this population not only served as a barrier to health services, but also for taking advantage of grocery delivery services through apps. Residents have sought help from the Department of Aging, but responses were delayed.
“[Name] and I live in a 55 community here… where they let us know of all the activities and events that are going on. We have access to the pool, with the membership and a fitness room. So it is nice that there are things to do for the seniors as well.”
“I think there’s a concern too for support as aging residents of the community get older, because a lot of support services are either in larger cities or they’re around hospital settings, neither of which is Honey Brook.”
“We don’t have a senior center. We used to have Honey Brook Senior Club and everybody just faded away. But we don’t have a senior center like Coatesville, and Downingtown and places like that.”
“We fund Meals on Wheels, and we are seeing that the number of people that are accessing those services is growing.”
“I think it’s very lonely for some seniors who are not part of a community…”
Families with low-income faced issues with childcare, health insurance coverage and other benefits, and maintaining full-time employment.
Members of the Amish community faced unique barriers to health care related to being disengaged with modern technologies, such as motor vehicles and phones. The nature of their work also put them at greater risk for injuries.
Immigrants required culturally and linguistically appropriate services.
Veterans needed assistance with housing, health, and dental services. Residents noted that the VA hospital offered some assistance, but they “fix them up and send them back on the street, on Lincoln Highway.” Greater awareness of services was needed.
“…she has to go do Instacart with a baby with her, in order to make enough to try to pay a rent.”
“And they’re like, ‘Well, you should just get a full time job and you have benefits.’ And I’m like, ‘I would rather not have the benefits and be able to pay rent and everything else compared to getting health insurance.’”
“I think there’s no daycare options for families in need either. We have daycare in the area but it’s expensive.”
“…what do you do when your kid’s sick and daycare sends them home? It says, would it have to be fever-free for 24 hours before they come back?”
“Amish customers have a lot of accidents. I was at a home yesterday and I tried not to cry but their nephew is two and he’s in a body brace… They’re not going to have a car to put them in there and take them anywhere. They have to walk to find a phone to call for help, somebody has to come and take them to the hospital. Now, the kid’s in a hospital, miles and miles away from home, you can’t even get there by horse and carriage.”
“There’s a huge Spanish-speaking population…”
“A number of years ago for Thanksgiving, people would distribute turkeys. At least in this particular situation, Latinos and turkeys didn’t mix. What they wanted was chicken. So now we get chicken, the food banks distributing chicken. So it’s kind of understanding the cultural differences and whether you’re talking about eating better or whether you’re talking about certain diseases, which might be unique to a certain culture…”
“My husband is a veteran and you have to know the inroads. He gets everything he needs. But if you don’t know about the program and you don’t go to find out, then you suffer. But my husband, he gets what he needs.”
Geographic residence near county borders is sometimes complicated where community members could and could not receive health coverage, inconveniently increasing travel time and prolonging 911 responses. Residents didn’t understand why some hospitals remained “decaying” and abandoned when they were needed. Some relied on urgent care centers, which health insurance may not have covered in full.
Waiting for appointments with specialists took months. Respondents expressed the desire for more transparency with health costs and billing. Neighborhood pharmacies were closing. Lastly, people with disabilities who relied on medical transportation services had long wait times for pick up and drop off. Transit services through Medicaid were further complicated when patients needed to travel to different counties.
Longevity was a common factor in the patient/provider relationships where trust was present. One respondent explained that trust could be difficult to foster when there were language barriers.
“A lot of facilities are like 45 minutes away. I have County insurance and I can’t go anywhere in here.”
“And there’s even been fire trucks that ran medical… ran as an ambulance. There’s not enough to go around.”
“But I know people who tried to get an appointment with someone in mental health services. It’s a long time.”
“My son needed physical therapy. So we went and I said, is there cost? No, no, don’t worry about it. Health insurance will cover it. Eight appointments later -- You get the bill. We have a $3,500 deductible. We wouldn’t have made eight appointments in a row if we knew that.”
“I will tell you that the folks in the disability community what they call para transit, they call it Para-stranded.”
“We lost a large community pharmacy. They delivered to the elderly.”
“I think they could have appointments on the portal… they’re trying to get all their clients trained on the portal. And then you can go in for an appointment. Wouldn’t it be wonderful just to set up your appointment on the portal…”
“The only one that I have is my gynecologist and she will go back to talking to me about my grandmother who raised me. And my mother and I’s relationship, like she generally takes time and that’s the only person that takes time with me.”
“Well, yes, again, because I have the same doctors and so forth that I’ve had for years and years and years and I trust them.”
For most, post-COVID technology use in healthcare presents convenience and accessibility. There were older individuals who preferred in-person and telephone access. There was a sense that the pandemic’s residual impact was a provider shortage.
Persistent concerns about COVID-19 were mixed, as was knowledge of Long COVID. There was a greater concern for older adults and people with disabilities. There were concerns about symptoms and contagion and how they continued to negatively interfere with work and childcare.
ON COVID-19 PANDEMIC
“It makes it more accessible. I don’t have to leave work for hours, just 15 minutes.”
“They don’t know how to do it and they’re afraid because they’ve heard of all the scams and everything. They’re afraid to put any personal information online if they did not grow up that way and that’s very difficult for the older population.”
“People are scared to say that they have it, because of that. Like to not be able to go to work... or working in the daycare.”
“I just didn’t know what it was called. So my sister-in-law has [Long COVID]. But she has it into where it’s like anxiety and stuff.”
“…we’re in a crisis. We’re so far behind, the system is overwhelmed and the only way to get under it is to spend more resources with preventative care.”
What is already working well to improve health in your community?
Telehealth is convenient and facilitates treatment planning.
“…I have access to a portal that I can go into, it’s very convenient for me and the portal works so well because all my data is in there and looking at my data, I can make decisions and I can go to my doctors and they can make decisions, we can make decisions together. I can easily access them through that portal, and I just find it amazing because I can do this all from sitting at home and it really works well, especially after you are 65 years old and you’re retired…”
What are the most important issues to address to improve health in your community?
More can be done to make telehealth services more accessible.
“There’s a lot of health care services where someone does not have to be in person or they might not want to be in person, especially if you’re talking about mental health or behavioral health issues, they might be much more comfortable doing that in their home. So what is Chester County’s digital health component of its health strategy and how is it going to execute that so that the people who really need those services can get those services? There’s many, many people in Chester County who have excellent Internet, can afford subscription costs, have devices.”
Artificial intelligence can be explored to help remediate language barriers.
Long-term support and resources for parents/families is needed.
“I’m taking an AI course right now just to understand more about AI and there are the same things. People are saying it’s dangerous, but there is so many advantages to it too. One of the advantages, by the way, is it can interpret languages so perfectly. I work with the Guatemalans and we could not find an interpreter to speak the languages of the Guatemalans and for healthcare. You can get AI to get the perfect accent and the perfect script that they will totally understand what you’re saying and you don’t have to hire an interpreter. You’ve got this wonderful voice coming through that sounds like them.”
“So what kind of services are we giving to those parents? How are we finding them? How do we keep track of them after they have babies? Ten years [later], are we checking in on them? Are we giving them resources? Are we empowering to connect with other people in the community to help support them? So many people feel like they just have to do it on their own and they don’t, we weren’t raised to raise a village. We were raised to be in a village where we were.”
Community and faith leaders can be leveraged to meet community health needs across cultures.
Community health navigators and advocates can support patients with accessibility issues, such as older adults living alone, non-English speakers, and people with disabilities.
“I was going to say there’s one positive thing that happens here and it’s Pastor [omitted], once a month, they have a meal here. And it’s just by their age and there’s so many older people that come out and they sit around these tables and they talk. And if more churches could do that, and we have a Baptist church in town. We have a Baptist church and if we can get together with some of those ministers and talk to them, then maybe, they can do a service, a meal…”
“In our area, I’d like to see the availability of advocates for all these people that don’t know where to go, what to do. And even if we have them, the people have to be aware that we have them, and know how to get the help. So I’d really like to see advocates of filling out forms, just all those things that we take for granted too.”
ZIP Codes: 19311, 19348, 19374, 19375
This community is served by:
• Bryn Mawr Rehab Hospital
• Chester County Hospital*
• Children’s Hospital of Philadelphia
• ChristianaCare - West Grove*
• Main Line Health
• Wills Eye Hospital
* ChristianaCare - West Grove Campus anticipated opening Summer 2025
36,429
CAUSES OF DEATH – All Ages
*Estimates are unavailable or unreliable due to low sample size within a community
“--” Estimates are unavailable or unreliable due to low sample size within a community
* “Major” cancer defined as: prostate, breast, lung, colorectal cancers
**The Child Opportunity Index (COI) measures and maps the quality of resources and conditions, at the census tract level, that matter for children’s healthy development. It is a composite score of 44 indicators, and scores range from 1 (lowest opportunity) to 100 (highest opportunity).
Thinking about yourself or other adults in the community where you live, what are the TOP 3 HEALTH problems?
Age-related illnesses
Mental health
Heart conditions
Thinking about yourself or other adults in the community where you live, what are the TOP 3 MENTAL HEALTH and SUBSTANCE USE problems?
Depression
Anxiety
Alcohol use
Thinking about your or other children in the community where you live, what are the TOP 3 HEALTH problems?
Mental health
Intellectual / developmental disabilities
Obesity and maintaining healthy weight
Thinking about the community where you live, how available are the following resources? Results reflect the top 3 responses for “Never” and “Rarely Available”.
Safe neighborhoods
Affordable housing
Affordable healthy foods
Thinking about your or other children in the community where you live, what are the TOP 3 MENTAL HEALTH and SUBSTANCE USE problems?
Bullying
Anxiety
Depression
Thinking about the community where you live, which barriers prevent access to health care? Results reflect the top 3 choices.
Transportation (getting to and from doctor’s visits and appointments)
Costs associated with getting healthcare
Not enough health care services or providers
ZIP Codes: 19330, 19350, 19352, 19362, 19363, 19390
This community is served by:
• Bryn Mawr Rehab Hospital
• Chester County Hospital
• Children’s Hospital of Philadelphia
• ChristianaCare – West Grove*
• Main Line Health
• Wills Eye Hospital
* ChristianaCare - West Grove Campus anticipated opening Summer 2025
63,927
$123,681
ATTAINMENT 25.7% High school as highest education level PEOPLE WITH DISABILITIES 11.5%
LEADING CAUSES OF DEATH – All Ages
Heart Disease
Cancer
Accidents
*Estimates are unavailable or unreliable due to low sample size within a community
“--” Estimates are unavailable or unreliable due to low sample size within a community
* “Major” cancer defined as: prostate, breast, lung, colorectal cancers
**The Child Opportunity Index (COI) measures and maps the quality of resources and conditions, at the census tract level, that matter for children’s healthy development. It is a composite score of 44 indicators, and scores range from 1 (lowest opportunity) to 100 (highest opportunity).
Thinking about yourself or other adults in the community where you live, what are the TOP 3 HEALTH problems?
Age-related illnesses
Heart conditions
Chronic pain and pain management
Thinking about your or other children in the community where you live, what are the TOP 3 HEALTH problems?
Mental health
Intellectual / developmental disabilities
Obesity and maintaining healthy weight
Thinking about the community where you live, how available are the following resources? Results reflect the top 3 responses for “Never” and “Rarely Available”.
Safe neighborhoods
Affordable housing
Mental health services
Thinking about yourself or other adults in the community where you live, what are the TOP 3 MENTAL HEALTH and SUBSTANCE USE problems?
Anxiety
Depression
Loneliness
Thinking about your or other children in the community where you live, what are the TOP 3 MENTAL HEALTH and SUBSTANCE USE problems?
Anxiety
Bullying
Depression
Thinking about the community where you live, which barriers prevent access to health care? Results reflect the top 3 choices.
Not enough health care services or providers
Transportation (getting to and from doctor’s visits and appointments)
Costs associated with getting healthcare
*SVI is a measure developed by the CDC to identify communities that may need support before, during, or after disasters. This measure is made up of a combination of 16 different U.S. Census variables, which are grouped into four themes (socioeconomic status, household charateristics, racial & ethnic minority status, and housing type & transportation), and cover major areas of social vulnerability.
Delaware County has an estimated population of 576,195 with the largest proportion of residents between the ages of 45 - 64.
There are 4 hospitals and 4 health centers in Delaware County.
64% of residents are non-Hispanic White. Black residents make the next largest population, comprising 21.7% of the county’s residents.
Nearly 11% of residents are foreign-born and about 5% speak English less than “very well.”
Median Household Income $86,390 Homeownership 69% Severe Housing Cost Burden % spending >50% of household income 15% High School as Highest Education 27.6%
Household Food Insecurity 9.7%
Single Parent Households 27.1%
Same Sex Couples per 1,000 households 4.4
Commute Greater than 60 minutes 8.8%
This measure reflects limited access to primary care as individuals may rely on emergency departments non-emergency health needs due to barriers like insurance, trust, clinician shortages, etc.
Vaccinations (Adult) 57.0%
This measure is a strong indicator of overall community vaccination levels because they reflect access to healthcare, public trust in vaccines, and the effectiveness of outreach efforts in promoting immunization.
Chlamydia per 100,000 490.9
This measure is a good marker for STIs in a community because it is the most commonly reported bacterial infection, often asymptomatic, and indicates the overall level of STI transmission, screening, and prevention efforts in a population.
Income Inequality 0.48
This measure is often used to assess income or wealth distribution within a population. It ranges from 0 to 1, where 0 indicates perfect equality (everyone has the same income) and 1 signifies maximum inequality (one person has all the income while others have none).
Thinking about yourself or other ADULTS in the community where you live, what are the top 3 HEALTH problems?
or
Thinking about the community where you live, which barriers prevent access to health care?
(Select all that apply)
Costs associated with getting healthcare
Transportation (getting to and from doctor’s visits and appointments)
Scheduling problems (such as health services not open when available)
Number of Respondents:
Fear (such as fear of doctors or not ready to discuss a health problem) 16.2%
Don’t know how to find healthcare services or providers 14.5%
Don’t feel welcome or respected 12.1%
Cultural / religious beliefs
Language barriers
Mistrust of the health systems
Not sure 2.3%
None 1.7%
Thinking about the community where you live, how available are the following resources?
Some residents shared that they appreciated having access to parks and walking paths. Opportunities for physical activity contributed to overall positive health experiences.
ON GREEN SPACE AND RECREATION AREAS
“…a lot of centers within the surrounding communities that you’re able to participate.
“Activities that they offer like paint and sips and these things are free…center which offers sewing. Just the senior center within itself is something that can alleviate stress and anxiety. I love it.”
“My community, I’ve got a community center where they offer Zumba and yoga.”
“We’re lucky to have quite a few parks in this area and they’re well-spaced out.”
“I would also add on to the green spaces, especially the Chester Creek Trail is something that has been a really nice add to our community over the last few years. I would love to see more of that. But those are really positive.”
With the acknowledgement that this was not true everywhere, some residents of Delaware County had ready access to markets with high quality, healthy food.
ON HEALTHY FOOD RESOURCES
“So, in my community, there’s plenty of access to fresh fruits and vegetables and healthy food choices because there are some communities where it’s food desert and there’s corner grocers with probably not very fresh fruits and vegetables.”
“Grocery stores and particularly the people that-- if you’re really sticklers about whole foods and places where you can get. Also, farmers markets provide a lot of fresh produce.”
Most residents were able to identify areas for improvement here, and issues when accessing quality primary healthcare. Many who relied on medical transportation faced the inconvenience of long wait times, before and after their appointments. Navigating health systems could be challenging, sometimes the insured were not aware of how to inquire about their health needs or the availability of local resources. And there were language barriers and limited options for undocumented individuals. Medical appointments were harder to make, and women’s health needs were of particular concern. Residents were aware of local hospital closures and the subsequent limitations to emergency room access. There were also issues with certain providers not accepting certain types of health insurance.
“And I’ve heard about the medical transportation, they give you these wide windows and you pretty much have to block out your whole day.”
“I don’t know if any place people can call and ask, just ask questions like, what are the different transportation things? I run out of money and prescriptions. What do I do?”
“…we didn’t have a health department in Delaware County. Now we have one. But now like, where is it? How do I utilize it? What’s the phone number? What do you offer for seniors or disabled people?”
“…resources for groups, for women going through menopause… We can’t sleep at night. There’s no gynecologist available anywhere, you know, leaving or retiring and there’s no one taking their place to get it and they’re so busy…”
“I heard today of the closure of the surgical center at [Name] Hospital… And then there’s hospitals in certain regions of this county that are closing or… people can’t access. And so, there’s larger swaths of this community that… don’t have a hospital emergency room that’s close to them.”
“I think health departments can do a lot more educating and outreach to all the different parts of our community and make sure a lot more information gets out there.”
“Like people come in the country for a better life. But some people come, you don’t have the papers… where you will get insurance and stuff like that? It’s hard.”
“Some of the costs of the medications are skyrocketing.”
There were mental health support needs, but a lack of knowledge about the availability of resources and how to access them.
ON
“I was just going to add importance of exercise or some sort of community events where people can just be together that help them with their mental health. And to be able to socialize with people…”
“And also, mental health support groups. I’m wondering about what the networks of that are and I don’t perceive that there are a lot of those.”
“…it took me forever to find a mental health specialist, a therapist. Almost two years to find someone to be a therapist for me…”
ENVIRONMENTAL HAZARDS
Some neighborhoods required upkeep and better lighting to allow for safer navigating, especially for people with disabilities. Sidewalks and crosswalks should have been more accessible. Trash and litter build up presented hygienic concerns. Residents explained that there were not enough “sidewalks or available walking routes.”
ON ENVIRONMENTAL HAZARDS
“And the other thing is better lighting at night because I’m visually impaired due to glaucoma.”
“…when you’re walking, and the cars are not necessarily following along with speed limits or the traffic signals for a person who doesn’t have a mobility issue that can be hazardous. So, I can only imagine what it would be for someone who does.”
“I don’t know if all of Radnor Township is ADA, Americans with Disabilities Act compliant. But at every sidewalk nearing a street crossing, there should be an open curve so that people who are using walkers or wheelchairs have access to be able to cross over.”
“I think trash that’s not emptied is hazardous… it looks bad too but it’s unhealthy. Garbage smells, things like that. I don’t know why they’re not emptied more frequently… People just throw everything all over the place.”
There was concern for when youth were not provided with productive ways to spend their time and engaged in harmful behaviors.
Residents desired more extracurricular activities and opportunities for youth to learn life skills. Interventions were needed to meet the mental health, nutritional, and academic needs of youth. Caregivers were having trouble finding affordable childcare.
“And like I said, it takes a village to raise. And I used to teach in Upper Darby school district. I’m retired, of course, now. Special needs children, autistic children. And again, that’s an uptick too because when I was growing we never heard it was a different name, starting with the aura with special classes. Now, there’s a whole uptick in that. And I’m like, where is this coming from? Why is it like this? Why are our kids on medication? Why is there so many mental health issues?”
“I would say access to affordable childcare, especially for the under school age and preschool age that is there are pockets of that in places but it’s not affordable for some... And then I would also say access to more community kind of after school programs.”
“I think nutrition is a big thing. I think the school lunch program has to be upgraded to maybe a breakfast and lunch program and they have to think about getting all that food to kids during the summertime. I think that’s a huge problem in the summer when the school lunch program isn’t there.”
“I went to school in 90s and 80s or whatever, the things that we learned, basically, our children isn’t even learning the same thing. So how are we supposed to help them with their homework and things of that nature? We have our children looking at us like we’re stupid at this point.”
“They’re engaging in risky activities, dangerous activity.”
“Having some of the elderly population get to a doctor’s appointment” was difficult because of limited transportation options. At home support with activities of daily living could have been helpful for some older adults living alone. Residents believed that training older adults in the use of technology would be helpful also.
“Access to healthier foods. But that correlates to the transportation. My mother was at Ridley Park. She didn’t drive because of her diabetes. She lost her license and my father died. So, taking her up to Sharon Hill where Philabundance was distributing [food]. Well, she couldn’t carry all that because she was 85 years old.”
“I’ve heard of resources offering box fans for the elderly and disabled. But it’s a measure of getting to them, carrying them and I wish they would offer air conditioners if you don’t have it and have somebody come and help you install it. Not just like, here you go, good luck.”
“…nobody had seen her, and I left food at her door and the next day it was still there and I thought strange. She had to get her mail and stuff, and she goes out for the paper every day. I don’t know what you do with people like that. And she has a rotary phone. She won’t change. And she just had her 90th birthday so whatever she does, it’s working.”
“It should be a pharmacy for easily, for them to get to, or some type of delivery service to give them their medicine.”
“I think something that might help speaking as a senior citizen is help with computer stuff and e-mail stuff and technical stuff. Those of us who might not have a local grandchild that will come in and teach us all this stuff.”
Housing costs and the low minimum wage in Pennsylvania contributed to the homelessness problem. Residents believed that unused buildings could be repurposed for affordable housing units.
It was not uncommon for residents to provide support for older family members or neighbors. They sought resources to support themselves and those they were caring for. Likewise, grandparents raising grandchildren required legal and other types of support.
Adjustment services for people with newly acquired disabilities, such as vision loss, were needed. Also, education and awareness about the benefits and options related to medical marijuana might have helped to minimize the implications of some chronic health conditions.
“…as far as the public housing situation, the waiting lists are like forever. You have buildings just sitting and thinking that there’s nothing being done…”
“I go to one in person caretaker group… they have a nurse coach that you talk to every so many weeks so…I do [the] caretaking group online.”
“…I did go to a meeting they had several years back, and it was all caregivers and they presented us with a list of things to be aware of for your own health and then some organizations that would help you as well. And the interesting thing for me was that this meeting was actually sponsored by a church group that I was not familiar with. And even if you didn’t belong to this particular church they were saying, please feel free to contact us and we will help you.”
“So there’s a whole bunch but there’s no legal bearing on grandparents. In other words, no matter what that parent can all of a sudden, [say] I want my child back… You haven’t had them for 15 years.”
“And also with my visual impairment, I’m having trouble finding [help] even though there’s blind associations, Library of Blind. I want somebody to teach me braille while I can, yeah. And I can’t seem to find that help anywhere…”
Some participants spoke of generally positive experiences with accessing and the quality of primary healthcare services. Yet a lack of reliable transportation served as a barrier for older adults, individuals with smaller social networks, and those with low incomes. Social stigmas related to mental illness acted as a deterrent to seeking assistance.
“Well, one thing that I discovered when I came here, it has a very good health care. But I had no way to get there, and I am not good with computers at all.”
“It’s a huge issue for people whose friends either no longer drive or have moved away because if you want to go for a colonoscopy, you have to have someone take you there because they’re gonna put you under with Propofol and they want someone there to take you back. And it’s almost impossible for some people.”
“There’s a bigger issue here and that is that there is inadequate education as people are nearing the age of 65 to learn from an unbiased source about all options necessary that the government requires for when you sign up for Medicare. What level of care? What kind of prescription drug plan, PDP, is going to-- How do you even analyze any of this? Someone who is nearing the age of 65 needs to know how far in advance to start doing research. If they are unable to do that themselves, then who else is available? There are some community volunteers, and I don’t remember the acronym name for the group, but there are too few involved.”
“…think that there’s still such a stigma that comes with many mental health issues, even though we’ve made great strides in trying to accept that overall. But I still think that a lot of people are embarrassed or ashamed to come forward and admit to people that they have these issues.”
Responses were varied, with some trusting their providers, others skeptical, and others lacking trust. Reasons for not fully trusting medical professionals were related to experiences with incompetence, high turnover, poor communication, and malpractice.
“I haven’t had any bad experiences.”
“My son was in the trauma unit… we specified he has celiac, gluten-free and… he’s really hungry. And so, they contacted the dietary and they sent up a chicken sandwich and I said, well… he can’t have bread. And I said, I’m sorry, you can’t just take off the bun and give him the chicken. It’s not going to work. So, I had to go, I went home. I had to bring him food because I couldn’t trust that they were going to give him the right food. And that’s pretty basic.”
“I think they’re trying… After COVID everybody just up and left. So, you have a lot of, I don’t want to say inexperienced but people that are learning as they go along.”
“I take a lot of notes now, like before I go to the doctor. So, I know [what] to ask because sometimes… you go and they don’t tell you things.”
“I can only speak of a recent situation with a friend of mine who became ill several years back, something was detected but not acted upon and as a result now it’s become extremely serious. And I just can’t even imagine how she feels about this because she certainly realizes that this one particular physician really didn’t have her best interest at heart. And now, she might just have months left.”
Post-COVID, most respondents remained concerned about the implications of COVID-19 – especially older adults and those with preexisting conditions. There was a heightened awareness about one’s health and longer waits for appointments. Many people were aware of Long COVID and some residents had personal or family experiences with Long COVID symptoms.
“
“Since COVID, you’ll go into different clinics regardless again, of whatever health system, some of the employees are wearing masks and some of them are not. So for those of us who are older or people who are immunocompromised, who need to come into a place where there are all kinds of people congregating from different neighborhoods, each has his or her own health issues, there needs to be some consistency across the board what type of mask at least that health institution wants their employees to wear…”
“I lost a asthma doctor, gynecologist, my husband’s urologist and two of the primaries, they all stopped after the pandemic. They were so burned out.”
“I don’t know if it’s still a concern.”
“I feel like it is in a sense because it’s still out here so it can still be caught and things of that nature. And if either of us was to catch it, it would throw us completely off with working and things of that nature.”
“…ever since I had COVID, my taste never went back 100%.”
“I think I’m more willing to go to the doctor than I was before. I would put it off before.”
What is already working well to improve health in your community?
Delaware County’s green and recreational spaces are enjoyable and continue to improve.
During the pandemic, a local senior center was equipped to mitigate a crisis and support older adults.
“Green spaces supporting the little borough that I live in. They do a good job of making sure the parks are cut. They’re working on and waiting for funding to install playgrounds, additional playgrounds for younger families…”
“…when the pandemic hit and everybody was locked down, a lot of people turned to the senior center to provide meals. And they were, I think, at the forefront doing that. And if you couldn’t come and get them, they actually had a team of volunteers that delivered them. They also set up this iPad program they have to keep people connected. They absolutely started that in this area.”
Health Navigators have provided needed support.
“I think the availability of social workers to help people navigate the system and know what’s covered and where to go. I mean, they’re invaluable, you have to know to ask for them and then they have to be available.”
are the most important issues to address to improve health in your community?
Better dissemination of information about health services is needed.
Local dog parks could support the well-being of whole families and neighborhoods.
The minimum wage in Pennsylvania is not a livable wage.
“So, there are areas that still need help and a lot of people don’t know that the help exists so they need to be educated as to what’s out there and what’s available to them.”
“We need a dog park… Yeah, I mean animals for people is help, is therapy. So, if we have a place that we can go and feel comfortable with our dogs and things of that nature, that would be pretty cool. A lot of that is not feeling comfortable around other people or other dogs and things of that nature because we don’t know the next person and how they’re training their dogs…”
“And then the price of everything is going up, the price of food, everything. But they will not raise minimum wage. Minimum wage is crazy at $7.25 still. And if you have a job where you’re making tips, they can pay you at $2.37… how can you even live off of that?”
People who are homeless need greater access to resources, seven days a week.
There is a perceived lack of empathy in medical care.
“…the homeless community is completely forgot about on the weekends when we really need it. So, yeah, even if it was just the truck that comes out on Saturdays and Sundays, that would be pretty cool because they give out waters and clean underwear and things of that nature.”
“They need to put a human face to it… it’s business still but put your loved one in that position. How would you feel? What would you do with the cost and not getting what they need if your loved one was going through this and that you couldn’t afford it?”
ZIP Codes:
19014, 19015, 19017, 19052, 19063, 19064, 19070, 19081, 19086
This community is served by:
• Bryn Mawr Rehab Hospital
• Children’s Hospital of Philadelphia
• Jefferson Moss-Magee Rehabilitation Hospital
• Main Line Health
• Thomas Jefferson University Hospital
• Wills Eye Hospital
131,047
$114,917
ATTAINMENT 23.6% High school as highest education level PEOPLE WITH DISABILITIES 11.9%
LEADING CAUSES OF DEATH – All Ages
Heart Disease
Cancer
Cerebrovascular Diseases
Category Measure
“--” Estimates are unavailable or unreliable due to low sample size within a community
* “Major” cancer defined as: prostate, breast, lung, colorectal cancers
**The Child Opportunity Index (COI) measures and maps the quality of resources and conditions, at the census tract level, that matter for children’s healthy development. It is a composite score of 44 indicators, and scores range from 1 (lowest opportunity) to 100 (highest opportunity).
These results reflect responses from residents of the Central and Western Delaware County communities. Individual communities with 35 responses or less are grouped with adjacent areas to ensure inclusion of all responses.
Thinking about yourself or other adults in the community where you live, what are the TOP 3 HEALTH problems?
Age-related illnesses
Heart conditions
Mental health
Number of Respondents: 121
Thinking about yourself or other adults in the community where you live, what are the TOP 3 MENTAL HEALTH and SUBSTANCE USE problems?
Depression
Anxiety
Loneliness
Thinking about your or other children in the community where you live, what are the TOP 3 HEALTH problems?
Mental health
Intellectual / developmental disabilities
Injuries
Thinking about your or other children in the community where you live, what are the TOP 3 MENTAL HEALTH and SUBSTANCE USE problems?
Bullying
Anxiety
Depression
Thinking about the community where you live, how available are the following resources? Results reflect the top 3 responses for “Never” and “Rarely Available”.
Affordable housing
Mental health services
Good paying jobs
Thinking about the community where you live, which barriers prevent access to health care? Results reflect the top 3 choices.
Costs associated with getting healthcare
Transportation (getting to and from doctor’s visits and appointments)
Health insurance is not accepted
ZIP Codes:
19013, 19061, 19094
This community is served by:
• Bryn Mawr Rehab Hospital
• Children’s Hospital of Philadelphia
• Jefferson Methodist Hospital
• Jefferson Moss-Magee Rehabilitation Hospital
• Main Line Health
• Thomas Jefferson University Hospital
• Wills Eye Hospital
59,349
$54,570
LEADING CAUSES OF DEATH – All Ages
“--” Estimates are unavailable or unreliable due to low sample size within a community
* “Major” cancer defined as: prostate, breast, lung, colorectal cancers
**The Child Opportunity Index (COI) measures and maps the quality of resources and conditions, at the census tract level, that matter for children’s healthy development. It is a composite score of 44 indicators, and scores range from 1 (lowest opportunity) to 100 (highest opportunity).
These results reflect responses from residents of the Airport Corridor and Chester/I-95 Corridor communities. Individual communities with 35 responses or less are grouped with adjacent areas to ensure inclusion of all responses.
Thinking about yourself or other adults in the community where you live, what are the TOP 3 HEALTH problems?
Chronic pain and pain management
Age-related illnesses
Diabetes and high blood sugar
Thinking about your or other children in the community where you live, what are the TOP 3 HEALTH problems?
Abuse or neglect
Injuries
Mental health
Number of Respondents: 120
Thinking about yourself or other adults in the community where you live, what are the TOP 3 MENTAL HEALTH and SUBSTANCE USE problems?
Alcohol use
Drug use
Depression
Thinking about your or other children in the community where you live, what are the TOP 3 MENTAL HEALTH and SUBSTANCE USE problems?
Bullying
Anxiety
Depression
Thinking about the community where you live, how available are the following resources? Results reflect the top 3 responses for “Never” and “Rarely Available”.
Mental health services
Affordable housing
Affordable healthy foods
Thinking about the community where you live, which barriers prevent access to health care? Results reflect the top 3 choices.
Transportation (getting to and from doctor’s visits and appointments)
Costs associated with getting healthcare No health insurance
ZIP Codes: 19060, 19317, 19319, 19342, 19373
This community is served by:
• Bryn Mawr Rehab Hospital
• Chester County Hospital
• Children’s Hospital of Philadelphia
• ChristianaCare – West Grove*
• Jefferson Methodist Hospital
• Jefferson Moss-Magee Rehabilitation Hospital
• Main Line Health
• Thomas Jefferson University Hospital
• Wills Eye Hospital
*
45,975
Category Measure
*Estimates are unavailable or unreliable due to low sample size within a community
“--” Estimates are unavailable or unreliable due to low sample size within a community
* “Major” cancer defined as: prostate, breast, lung, colorectal cancers
**The Child Opportunity Index (COI) measures and maps the quality of resources and conditions, at the census tract level, that matter for children’s healthy development. It is a composite score of 44 indicators, and scores range from 1 (lowest opportunity) to 100 (highest opportunity).
These results reflect responses from residents of the Central and Western Delaware County communities. Individual communities with 35 responses or less are grouped with adjacent areas to ensure inclusion of all responses.
Thinking about yourself or other adults in the community where you live, what are the TOP 3 HEALTH problems?
Age-related illnesses
Heart conditions
Mental health
Number of Respondents: 121
Thinking about yourself or other adults in the community where you live, what are the TOP 3 MENTAL HEALTH and SUBSTANCE USE problems?
Depression
Anxiety
Loneliness
Thinking about your or other children in the community where you live, what are the TOP 3 HEALTH problems?
Mental health
Intellectual / developmental disabilities
Injuries
Thinking about your or other children in the community where you live, what are the TOP 3 MENTAL HEALTH and SUBSTANCE USE problems?
Bullying
Anxiety
Depression
Thinking about the community where you live, how available are the following resources? Results reflect the top 3 responses for “Never” and “Rarely Available”.
Affordable housing
Mental health services
Good paying jobs
Thinking about the community where you live, which barriers prevent access to health care? Results reflect the top 3 choices.
Costs associated with getting healthcare
Transportation (getting to and from doctor’s visits and appointments)
Health insurance is not accepted
All quantitative and qualitative inputs were organized into 12 community health needs that were categorized across three domains:
Physical and behavioral health issues significantly impacting the overall health and well-being of the region
• Chronic Disease Prevention and Management
• Healthy Aging
• Substance Use and Related Disorders
AND QUALITY OF HEALTHCARE AND HEALTH RESOURCES
Availability, accessibility, and quality of healthcare systems and other resources to address issues that impact health in communities across the region
• Access to Care (Primary and Specialty)
• Culturally and Linguistically Appropriate Services
• Food Access
• Healthcare and Health Resources Navigation (Including Transportation)
• Mental Health Access
• Racism and Discrimination in Health Care
• Trust and Communication
An additional list represents youth specific priorities:
• Substance use and related disorders
• Youth mental health
• Access to Physical Activity
• Lack of Resources/ Knowledge of Resources
Social and economic drivers of health as well as environmental and structural factors that influence opportunity and daily life
• Housing
• Neighborhood Conditions (e.g., Blight, Greenspace, Air and Water Quality, etc.)
• Access to Good Schools
• Activities for Youth
• Bullying
• Gun violence
Participating institutions’ ratings of the community health needs were aggregated and are listed below in order of priority: Potential solutions for each of the community health needs, based on all qualitative data collection and evidence interventions, are also included.
• National surveys indicate declining patient trust in healthcare institutions, often due to provider burnout, high turnover, disparities in treatment, and financial barriers, which disproportionately affect uninsured and minoritized communities. Community conversations reinforced this issue in the region.
• Challenges in Provider-Patient Communication: Patients feel rushed during short appointments and unheard by providers, leading to concerns about potential medical errors, particularly with conflicting prescriptions.
• Emergency Room (ER) Communication Gaps: ER staff have the most pronounced communication issues, which are closely linked to long wait times and patient frustration.
• Administrative & Customer Service Concerns: Poor front-desk interactions, including last-minute appointment cancellations and unprofessional behavior, contribute to negative patient experiences and decreased trust.
• Desire for more empathetic, respectful, and culturally responsive care and support staff.
• Suggestions included more social workers in hospitals and improved communication about healthcare changes.
• Transparent, Timely Communication: Ensure benefit notices and appointment information are received on time, not after due dates and provide regular updates on healthcare changes and medication protocols.
• Accountability Mechanisms for Healthcare and Social Service Staff to provide consequences when institutions or workers drop the ball on paperwork or communication.
• A dream solution expressed by multiple participants was a system where everyone receives the same quality of care, regardless of insurance status.
• Implement team-based care, including patient navigators, care coordinators, and longer appointments for complex cases.
• Expand and improve training of healthcare providers in active listening, shared decision-making, and cultural competency for all healthcare staff.
• Implement standardized communication tools and patient status boards to enhance transparency.
• Require front-desk staff to complete standardized training in customer service, de-escalation, and empathy-based communication.
• Expand appointment availability, reduce financial barriers for uninsured patients, and improve transparency in billing and treatment options.
• People of color, immigrants, people with disabilities, people with mental illness, people with substance addiction, LGBTQ+ individuals, and other minority groups continue to experience discrimination and institutional barriers to health care.
• Insufficient health care staff from diverse and representative backgrounds play a major role in this issue – people do not see themselves reflected in the healthcare workforce; can lead to not “feeling seen.”
• Intersecting identities lead to exponential impacts on discrimination and racism, and subsequent trauma.
• The political climate in the United States contributes to feelings of vulnerability within marginalized communities.
• Cultural Competency and Anti-Bias Training for Providers: Participants called for healthcare professionals to update their knowledge and attitudes beyond outdated textbooks.
• Bilingual and Multilingual Staff and Services: Strong calls for in-person translation services and recruitment of bilingual providers. Languages mentioned: Spanish, Arabic, French, several African languages.
• More Representation in Healthcare Staffing: Participants suggested that providers should reflect the communities they serve — racially, culturally, and linguistically.
• Trauma-Informed, Non-Stigmatizing Behavioral Health Care: Address the way patients with substance use or mental health needs are often denied full treatment, especially pain management.
• Systemic Reform for Equity in Access: Recognize and address structural racism — such as how funding, communication, and service offerings exclude or deprioritize certain communities.
• Expand and improve training of healthcare providers around anti-racism, structural racism, implicit bias, and trauma-informed care.
• Increasing number of people of color in healthcare leadership positions.
• Ensure diversity, equity, and inclusion efforts and plans at healthcare institutions include explicit focus on racism and discrimination.
• Create and fund ongoing forums for community leaders to work with health system partners to address issues of racism and discrimination in health care.
• Targeted, specialized services to meet culturally specific needs.
• Community gyms and recreation spaces that are well maintained and free/affordable, were recognized as desirable neighborhood resources, along with safe neighborhoods, and support disease prevention & management.
• Limited access to healthy food options and limited food education were noted as some of the greatest barriers to maintaining health and preventing or improving health conditions.
• Some participants shared about knowledge of and experiences with Long COVID, while a significant number were unfamiliar with the condition. Millions of adults in the U.S. have been affected by Long COVID. Participants are still generally concerned about acute COVID-19 infection.
• People with disabilities, who are not all older adults, face barriers to disease prevention and management due to accessibility issues and require greater advocacy.
• Increase access to local fitness centers and programs that accept health insurance.
• Promote community gardens and green spaces for physical activity and healthy eating.
• Provide consistent access to nutritional education for both children and adults.
• Offer more accessible chronic disease screenings and follow-up care, especially for older adults.
• Ensure health centers and providers are open during evenings/weekends to improve access.
• Engage trusted community leaders to spread key messages (for example, promoting cancer screening).
• Expand successful innovations from the pandemic, such as virtual and mobile wellness programs.
• Bring screenings and health education to faithbased institutions or where people are.
• Provide screening, referrals, and “warm hand-offs” to community-based health and social services.
• Offer support and services to people with Long COVID, providing education on this condition as well.
• Prevailing barriers in accessing care include: inadequate health insurance coverage (insurance not accepted, high out-of-pocket costs, no dental coverage), limited transportation/accessibility of offices/hospitals (primarily an issue in non-urban settings and amongst older adults), extended wait times for appointments (prompting use of ER and urgent care more often), closures of local hospitals, and specialists not covered by insurance or not available for appointments/too far.
• In addition to hospital closures, pharmacy closures present challenges related to obtaining prescriptions, resulting in increased utilization of prescription deliveries.
• Some pandemic-era changes to access have persisted, including more pervasive telehealth services, increased interaction with health portals, and virtual health-related programming.
• Extend clinic hours to evenings and weekends.
• Reduce wait times for appointments, especially for urgent needs.
• Simplify the referral and authorization process, which often delays care.
• Provide local urgent care and dental options, especially in rural or underserved areas.
• Address insurance instability (frequent changes to accepted plans or providers).
• Establish comprehensive health centers addressing physical and mental health, as well as dental care. Provide low-cost or free care options.
• Expand services in areas which have experienced closures.
• Embed social workers and patient navigators in primary care practices; continue utilization of community health workers (particularly focusing on sharing of community resources and health information)
• Provide on-site language interpreters and health education materials in diverse languages.
• Increase racial, ethnic, language diversity of staff and providers to better reflect communities served; offer increased training related to culturally appropriate care.
• Community members’ lack of awareness of resources is reflective of both community needs and a lack of knowledge.
• The perception of a lack of resources where some might exist is indicative of a need to improve information dissemination and methods of accessing that information. Participants frequently felt compelled to share resources and experiences with one another, when needs and complaints arose about health services among the focus group members.
• Navigating insurance policies, coverages, web platforms, related resources and healthcare costs prove challenging – especially for older adults who feel less confident with technology use and the transition to Medicare.
• Mentorship for medical decision-making, particularly for older adults who live alone, can promote social support, advocacy, and safety.
• Expand non-emergency medical transportation options, particularly for older adults and rural residents.
• Provide help navigating insurance plans, applications, and renewals (e.g., in-person or phone-based support).
• Create centralized, updated lists of services and locations (e.g., food vouchers, clinics).
• Provide tech support or training for those who struggle with using healthcare portals or telehealth.
• Increase public awareness of community resource directories that local health systems have invested in and support community members with using them.
• Increase the capacity of healthcare staff to assist community members with navigation by regular education on available resources.
• Grow the numbers of professionals serving as community resource or healthcare navigators
• Create permanent social service hubs that serve as “one-stop-shops” for commonly needed resources.
• Expand low-cost transportation options.
KEY FINDINGS:
• Community members shared the quantity and availability of mental health providers are insufficient to meet ever increasing needs (particularly post-pandemic).
• Additionally, health insurance coverage for mental health services and providers is inadequate
• Stigma around this topic was cited as a barrier –especially in ethnic minority communities.
• The intersection of mental illness, substance use, and/or homelessness was recurring concern.
• The general population expressed significant concerns related to youth mental health – which is reflected in the youth prioritization.
• Mental health needs for older adults focus on grief support and opportunities for community-based social engagement.
• Increase the number of behavioral health providers, especially in rural areas. Increased behavioral health workforce diversity (e.g., language, racial, and ethnic).
• Reduce wait times and eliminate long delays between referrals and services.
• Normalize seeking help by reducing cultural stigma around mental health through community education.
• Offer telehealth mental health options for those without transportation.
• Provide trauma-informed mental health support tailored to children, youth, and families.
• Improved care coordination in integrated care model.
• Co-located prevention and behavioral health services in community settings (“one stop shop”).
• Increased training for healthcare providers, communitybased organizations, schools, law enforcement, and others in Mental Health First Aid, traumainformed care, and cultural competence.
• Increased individuals with lived experience in the behavioral health workforce.
Key Findings:
• Community members shared concerns about substance use in their communities, co-occurring mental illness, the potential implications on youth, and the association with poor neighborhood safety.
• Drug overdose rates continue to be high due to opioid epidemic.
• Community-based services to treat substance use are perceived as insufficient in number by some, and/or are not well-known by others.
• Prevention and education measures can serve as protective factors against misuse and abuse; questions arose regarding the usefulness and impact of policing related to substance use.
• Expand community-based rehabilitation programs as alternatives to incarceration.
• Provide trauma-informed care and education during health visits, especially for youth.
• Increase provider training to eliminate bias toward individuals with histories of substance use.
• Offer drug education at the provider level (not just in schools) with resources for both youth and families.
• Reduce stigma through culturally competent and empathetic behavioral health care.
• Sustain and expand prevention programs, ranging from school-based educational programs to community drug take-back programs.
• Expand Narcan training and distribution.
• Increase medical outreach and care for individuals living with homelessness and substance use disorders
• Encourage use of Certified Recovery Specialists and Certified Peer Specialists in warm handoffs for drug overdose and other behavioral health issues.
• Enhanced utilization of medication-assisted treatment initiatives, in coordination with behavioral therapies and social support.
• Community members raised concerns about older adult isolation, impacting mental health, food access, and healthcare interactions. Senior centers and community services were frequently mentioned.
• Transportation barriers contribute to food insecurity and limited community engagement. Free ride programs often involve long waits, indirect routes, and lengthy travel.
• Limited digital literacy and unfamiliarity with technology restrict older adults’ access to healthcare and social services.
• Medicare transitions are often confusing, causing missed benefits.
• Improve transportation services for older adults to attend appointments, social events, and access groceries.
• Provide free or subsidized exercise classes (e.g., Tai Chi) to support mobility and wellness.
• Increase availability of nutritious food through filtered senior food distribution programs.
• Establish or re-open senior centers and day programs for social engagement and resource access.
• Offer help with documentation and paperwork (e.g., birth certificates, benefits forms).
• Create anonymous and accessible reporting systems for elder abuse or neglect.
• Expanding services to help older adults age in place, including affordable home health care, home repairs, food delivery, and utility assistance.
• Increase access to safe, affordable housing, including subsidized options.
• Train community health workers to support vulnerable older adults aging in place.
• Create more opportunities for social interaction at home and in community spaces.
• Develop intergenerational programs for socialization and technology assistance.
• Improve methods of communicating available resources and benefits to increase awareness and utilization.
• Language barriers are the greatest contributing factor to healthcare access issues for immigrants and ASL speakers. Language issues lead to misunderstandings between patients and healthcare providers or can dissuade patients from attending appointments altogether.
• Provision of high-quality language services (oral interpretation and written translation) is critical for providing equitable care to these communities; inquiring of patients at the time of appointmentsetting about interpreter needs is ideal.
• Beyond language access, cultural and religious norms influence individual beliefs about health; stigma can make seeking help objectionable, particularly mental health services.
• Fear and not having health insurance discourage undocumented individuals from seeking medical help.
• Hire bilingual/multilingual providers and translators (languages mentioned: Spanish, Arabic, French, African dialects).
• Provide in-person interpreters, especially during complex or urgent health interactions.
• Ensure all signage, forms, and digital tools are translated into key community languages.
• Train providers in culturally responsive care that respects beliefs and traditions of immigrant communities.
• Increase racial, ethnic, and language diversity of staff/ providers to better reflect communities served.
• Develop organizational language access plans with protocols for identifying and responding to language needs.
• Explore development of formalized programs to train and credential bilingual staff (employed for other roles) to serve as medical interpreters.
• Provide on-site language interpreters and health education materials in diverse languages.
• Develop strong partnerships with community organizations serving diverse communities that involves providing financial support.
KEY FINDINGS:
• Maintaining diets consisting of fresh produce and healthy foods is consistently difficult and cost prohibitive. Cheaper fast food and corner store options are also more convenient, readily accessible, and more prevalent – particularly in urban neighborhoods. Likewise, large grocery stores may require transportation to access them.
• A lack of food literacy and longevity of poor dietary habits over time also contribute to food choices.
• Local food banks/pantries serve as an indispensable community resource. When available, community gardens offer neighborhoods opportunities to grow their own food in the company of neighbors.
• Older adults have enjoyed meal delivery services, as a part of their benefits.
• Immigrants and ethnic minorities face challenges with finding foods that are culturally relevant to them.
POTENTIAL SOLUTIONS:
• Maintain and expand community gardens, fresh food access, and local markets.
• Offer nutritional education for both children and parents.
• Increase oversight of food stamp benefit security (e.g., prevent theft and fraud).
• Improve quality of food provided at pantries or senior meal programs – not just quantity.
• Ensure more equitable access to food assistance programs/resources in region by collecting data.
• Before patients are discharged from the hospital, providing “warm handoffs” to connect them with community health and social service organizations that address hunger and other needs.
• Increase collaboration and resource-sharing between hospitals and community groups working on healthy and culturally relevant food access.
• Increase outreach to raise awareness and utilization of food assistance programs.
• Provide services that distribute food directly to people where they live.
• Homelessness was indicated to be a concern at 17% of the qualitative community meetings. The overall health of homeless individuals was also of concern to community members, feeling as though resources were not readily available and that homeless individuals contributed to sentiments around neighborhoods being unsafe.
• A growing lack of affordable housing has led to a year’s long waiting list for subsidized housing, as well as evictions, and individuals sleeping in places not meant for human dwelling (e.g., cars, outdoors). This phenomenon is pervasive across counties, but particularly in Philadelphia.
• Housing for certain sub-groups, such as older adults and veterans, was also noted as priorities
• Invest in affordable housing and shelters, especially for people experiencing homelessness or with substance use challenges.
• Improve transitional housing and reentry programs to prevent homelessness post-incarceration.
• Ensure stable housing for vulnerable groups to support health management (e.g., medication, food access).
• Increase investments by hospitals, managed care organizations, and others in supportive housing programs known to be effective in reducing housing insecurity and preventing homelessness.
• Explore strategies that aggregate funds to support rental assistance or develop an equitable acquisition fund to preserve and create affordable housing.
• Expand programs supporting habitability and raising awareness of resources for housing repair assistance.
• Increase Rapid Re-housing Programs.
• Invest in respite housing for individuals in urgent need of transitional housing.
• Availability of greens spaces, dog parks, libraries, and health centers (with parks, walking trails, gyms, pools) contribute significantly to positive perceptions about neighborhood conditions; named as desired neighborhood features.
• Lack of overall neighborhood safety, caused by criminal activity, community violence, or road conditions, are risk factors for poor mental health and limited physical activity outside.
• Uncollected trash build-up and littered streets negatively impact neighborhood morale and contribute to air pollution that can prevent some from opening their windows.
• Community events were praised as opportunities to foster neighborly connections and cohesion.
• Local pride from residents who have lived in the area for several decades, particularly in Philadelphia County, contribute to vested interests in improvement, and informed perspectives on neighborhood history and nature of changes.
• Increase investment in neighborhood clean-up efforts (e.g., trash removal, illegal dumping).
• Expand tree canopy and green spaces to reduce heat and support walkability.
• Maintain and rebuild parks and rec centers to offer both safety and engagement for youth.
• Improve sidewalks and streets for better mobility and pedestrian safety.
• Recognize the mental health impacts of environmental stressors like blight and noise.
• Support neighborhood remediation and clean-up activities.
• Collaborate with local advocates engaged in campaigns to improve air quality, especially in areas that have increased exposure to emissions.
• Invest in infrastructure improvements to support active transit near hospitals.
• Improve vacant lots by developing gardens and spaces for socialization and physical activity.
• Advocate for and implement responsible and equitable neighborhood development that avoids displacement and segregation.
• Youth and adult community members recognize mental health as the primary health concern in the region.
• Youth mental health was prioritized at 12 of 15 youth meetings.
• Top issues included: limited access to mental health services, lack of coping skill resources, harmful effects of social media, and widespread feelings of loneliness
• Addressing youth mental health in Southeastern Pennsylvania requires a multifaceted approach, including early intervention, increased access to care, community support, and targeted programs within educational settings.
• High Prevalence of Mental Health Issues: In 2022, approximately 12.88% of Pennsylvania youth (around 117,000 individuals) experienced a major depressive episode. Alarmingly, nearly 60% of these youths did not receive any mental health treatment.
• Impact of the COVID-19 Pandemic: The pandemic exacerbated mental health challenges among teens. A 2022 survey revealed that 37% of responding teens reported poor mental health during the pandemic, and 44% felt persistently sad or hopeless. This suggests that upwards of 35,000 teens in Philadelphia may require mental health support.
• Suicidal Ideation Among High School Students: The 2021 Youth Risk Behavior Survey indicated that 22% of high school students nationwide seriously considered attempting suicide in the past year, with 10% having attempted suicide. These figures underscore the critical need for accessible mental health resources for youth.
• Integrate mental and behavioral health services into primary care and school settings: Normalize mental health care and reduce stigma by embedding services where youth already go. Participants urged that schools have accessible mental health resources in schools beyond just overwhelmed counselors.
• Embed trauma-informed and healing-centered care into all services and programming: Recognize the impact of trauma and promote resilience in all youth-facing programs.
• Increase education and awareness of youth mental health services for families and caregivers: Equip trusted adults to recognize warning signs and access timely care. Participants recommended Parent/community education on youth mental health, potentially offered at school events like back-to-school nights. They also suggested mandated parenting education/training to better equip caregivers.
• Support extracurricular and peer-group activities to enhance social engagement: Reduce loneliness by fostering safe and inclusive environments for connection.
• Collaborative Care Model: Proven approach where primary care teams include behavioral health professionals to improve youth mental health outcomes.
• Trauma-Informed Schools Model: Builds supportive learning environments by training staff and embedding school-wide trauma practices. Programs like the Philadelphia school-based mental health initiative, supported by the Independence Blue Cross Foundation and Children’s Hospital of Philadelphia (CHOP), have been implemented to train school staff in screening and referring students at risk of mental health issues. This approach aims to create a comprehensive support system within schools.
• Mental Health First Aid Training: Prepares educators and youth leaders to identify, understand, and respond to mental health crises.
• Peer Support Programs (e.g., Youth MOVE National): Promote youth leadership and mutual support for mental health advocacy. Participants advocated for peer-led support spaces in schools like “Relationships First” circles where trained student leaders facilitate discussions.
• Community Resources for Youth: Organizations such as The Lincoln Center for Family and Youth offer services including school-based mental health counseling and alternative education programs to support youth mental health in the greater Philadelphia area.
• Community-Based Support Centers: Community Evening Resource Centers (CERC) in Philadelphia provide free, safe spaces and activities for children and teens aged 10 to 17, offering structured activities, homework assistance, and opportunities to build friendships. Youth encouraged reducing stigma through community awareness and generational conversations.
• Early emotional support: Participants advocated for incorporating socialemotional learning (SEL) from a younger age, not just in high school.
• 30% of youth meetings prioritized help with navigating health resources.
• Youth reported difficulty accessing services due to lack of awareness, system fragmentation, and limited transportation.
• Many felt they lacked trusted adults or safe reporting pathways.
• Complex Healthcare Systems: The intricacies of the healthcare system can be overwhelming for youth, making it difficult to identify appropriate services and navigate insurance processes.
• Stigma and Fear of Judgment: Concerns about stigma, particularly regarding mental health services, deter youth from seeking help due to fear of being judged or misunderstood.
• Transportation Barriers: Limited transportation options can prevent youth from accessing health facilities, especially in underserved areas.
• Financial Constraints: Even with insurance, out-of-pocket costs and uncertainties about coverage can discourage youth from pursuing necessary health services.
• Limited School-Based Support: While schools are pivotal in health education, not all institutions have adequate resources or programs to guide students toward appropriate health services.
• Cultural and Linguistic Barriers: Diverse populations may face challenges due to language differences and cultural misunderstandings within the healthcare system.
• Digital Divide: Not all youth have reliable internet access or digital literacy, hindering their ability to find and utilize online health resources.
• Fragmented Services: The lack of coordination among various health services can make it difficult for youth to receive comprehensive care.
• Engage healthcare providers and care coordinators: Help youth navigate complex systems through warm handoffs and follow-up.
• Partner with schools to enhance health education and resource sharing: Ensure youth know what services are available and how to access them.
• Community Health Worker (CHW) Models: Train CHWs to support youth and families in navigating care and building trust.
• School-Based Health Centers (SBHCs): Onestop access points for physical and mental health care, especially in underserved areas.
• Trusted Messenger Programs: Utilize culturally and age-relevant community members to relay information more effectively.
• Community Initiatives: Organizations like CORA Services have launched programs such as the Family Navigation Center to assist families in accessing and navigating health services effectively. Participants also encouraged community events (e.g., Healthy Kids Day) that attract families with incentives (bounce houses, food) while sharing resources.
• More community-based outreach instead of just web-based referrals.
• Increase transportation access or bringing services closer to communities (e.g., having more rec centers or clinics locally).
• Youth-friendly formats like social media campaigns to spread resource awareness.
• Cultural and language access: Hiring bilingual staff and making materials culturally relevant.
KEY FINDINGS:
• Identified in 9 of 15 youth meetings as a major concern.
• Key concerns: binge drinking, increased marijuana and vape use, and trauma due to drug exposure
• Youth reported a need for better navigation of behavioral and treatment services.
• In 2022 according to the National Center for Drug Abuse Statistics (NCDAS), approximately 7.22% of Pennsylvania adolescents aged 12 to 17 reported using drugs in the past month, with marijuana being the most commonly used substance. In the same study, 9.19% of Pennsylvania teens reported using alcohol in the last month, slightly higher than the national average for this age group.
• Youth experiencing depressive symptoms are significantly more likely to engage in substance use compared to their peers with a more positive outlook.
POTENTIAL SOLUTIONS:
• Youth-focused recovery spaces: Suggestion of AA-style meetings for adolescents.
• Safe reporting systems where youth can help others (e.g., call for overdose support) without fear of punishment.
• Integrated recovery and workforce development programs: Pairing mental health support with skill-building and community service.
• CIT (Counselor-in-Training) programs and volunteer work for youth as alternatives to substance use and ways to build confidence and responsibility.
• Develop and expand substance use prevention and education programs: Deliver age-appropriate, evidencebased curricula in schools and communities.
• Promote prescription drug take-back initiatives: Reduce misuse by encouraging safe disposal of medications.
• Botvin LifeSkills Training: Proven curriculum that builds personal and social skills to prevent substance use.
• SBIRT (Screening, Brief Intervention, and Referral to Treatment): Early intervention tool used in schools and health centers.
• Communities That Care (CTC): Data-driven framework engaging local stakeholders to reduce youth risk behaviors through tailored strategies.
• Treatment and Recovery Programs: Organizations such as the Anti-Drug & Alcohol Crusaders, Inc. (ADAC) provide substance misuse prevention and intervention services targeting youth and families in Philadelphia.
• Youth cited bullying—especially cyberbullying as a major issue impacting mental health.
• Discrimination, harassment, and social media toxicity were recurring themes.
• Among students aged 12–18 who reported being bullied during the 2021–2022 school year, 21.6% experienced cyberbullying, with a higher incidence among females (27.7%) compared to males (14.1%).
• The 2023 Pennsylvania Youth Survey (PAYS) highlighted a strong correlation between being bullied and experiencing depression or suicidal behaviors among youth in Philadelphia County.
POTENTIAL
• Social media etiquette education starting at young ages to combat online bullying.
• Safe spaces in schools to talk about feelings, led by peers or trained youth facilitators.
• Early interventions to prevent verbal and cyberbullying from escalating.
• Support for immigrant and bilingual children facing bullying due to language barriers.
• Build conflict resolution skills and outlets for emotional expression: Empower youth to manage emotions and resolve issues constructively.
• Provide digital citizenship education: Teach responsible online behavior and how to respond to cyberbullying.
• Co-create psychologically safe environments: Ensure schools and programs promote inclusion, equity, and support.
• Olweus Bullying Prevention Program: Evidence-based schoolwide program shown to reduce bullying.
• Second Step SEL Program: Social-emotional learning curriculum that builds empathy, emotion regulation, and decision-making.
• Restorative Practices in Schools: Shifts discipline from punitive to healing by fostering accountability and connection.
• Support for LGBTQ+ Students: The National School Climate Survey by GLSEN reports on the experiences of LGBTQ+ youth in schools, highlighting the need for supportive environments to reduce bullying and harassment.
KEY FINDINGS:
• Youth recognize gun violence as a top concern, driven by poverty and easy access to firearms
• Immigrant and LGBTQ+ youth face additional risks, including IPV and sex trafficking.
• Youth report trauma and limited access to supports for healing.
• In 2022, firearms were the leading cause of death among children and teens aged 1 to 17 in Pennsylvania.
• Studies indicate that Black youths and those residing in urban communities have higher rates of witnessing gun violence (21.4%) and hearing gunshots in public (51.6%) compared to their non-Black and non-urban counterparts.
• Stories from local youth highlight the profound personal impact of gun violence, emphasizing the need for community support and policy change to create safer environments.
POTENTIAL SOLUTIONS:
• Reallocation of city funding: Instead of heavy spending in one area, directing more toward youth mental health and education.
• Safe community spaces where youth can express fears and ideas (e.g., community art like the “community plate” activity).
• Community involvement and cleanup events to reclaim and uplift neighborhoods.
• Critical feedback on ineffective policing and calls for greater investment in actual youthcentered prevention and safety measures.
• Expand violence prevention and youth recreation programs: Offer safe spaces and constructive alternatives to violence.
• Integrate social and mental health supports: Provide trauma-informed care in schools, clinics, and community programs.
• Advocate for stronger gun safety and economic policies: Address root causes like poverty, firearm access, and structural inequality.
• Cure Violence Model: Treats violence like a contagious disease, using credible messengers to interrupt cycles.
• Trauma Recovery Centers (TRCs): Holistic support for youth who experience or witness violence.
• Youth Empowerment Solutions (YES): Engages youth in civic action and community transformation.
• City Initiatives: In November 2024, Philadelphia’s Office of Public Safety launched the Group Violence Intervention Juvenile (GVIJ) program, targeting individuals aged 12 to 17 who are at high risk of involvement in gun violence, aiming to foster positive outcomes and well-being.
• Youth associate health with movement and requested more opportunities for physical activity.
• Limited access to safe green spaces, parks, and recreation infrastructure in many neighborhoods.
• 13% reported parks or activity spaces are rarely or never available.
• Regular physical activity enhances cardiorespiratory fitness, supports healthy bone and muscle development, aids in weight management, and reduces symptoms of anxiety and depression among youth.
• The pandemic led to a decline in physical activity levels among children and adolescents, emphasizing the need for renewed efforts to promote active lifestyles.
• Challenges such as financial constraints, safety concerns, and limited access to facilities can hinder youth participation in physical activities. Addressing these barriers is essential to ensure equitable access for all communities.
• The American Public Health Association advocates for enhancing physical activity opportunities in out-ofschool programs and increasing accessibility to reduce disparities and promote health equity among youth.
• Community gardens and step challenges tied to school programs.
• Block parties and community clean-ups that include physical activity components.
• Rec centers and gym access where youth feel welcome and included.
• Peer involvement at gyms and modeling healthy physical routines in neighborhood spaces.
• Teach behavioral strategies for physical activity: Encourage small, daily changes to increase movement.
• Invest in active infrastructure: Expand sidewalks, bike lanes, and parks for safe and equitable access.
• Foster social networks that promote movement: Peer-led activities and group fitness can improve consistency and motivation.
• Safe Routes to School (SRTS): Enhances walkability and biking through community design and education.
• Play Streets: Temporarily convert streets into popup play zones in under-resourced neighborhoods.
• SPARK PE: Research-based program improving fitness and academic performance through quality physical education.
• 11 of 15 meetings highlighted a need for more extracurricular options.
• Though 92% of youth participate in some activity, accessibility—particularly in underserved areas—is a major barrier
• Programs like summer camps, leadership clubs, and STEM activities were top priorities.
• Promotes Mental and Emotional Health: Regular engagement in structured activities like sports, arts, music, and mentorship helps reduce stress, anxiety, and depression. It gives youth a positive outlet and builds emotional resilience.
• Prevents Risky Behaviors: Youth with access to afterschool and community programs are significantly less likely to engage in substance use, violence, or other high-risk behaviors. These programs offer supervision, structure, and positive role models.
• Builds Life Skills and Confidence: Participation in group activities teaches teamwork, leadership, time management, and responsibility—skills that are vital for success in school and life.
• Provides Safe Spaces: Especially in neighborhoods impacted by gun violence or under-resourced schools, community centers and rec programs can be sanctuaries where youth feel physically and emotionally safe.
• Supports Academic Success and Future Opportunity: Programs that blend academics, mentoring, and enrichment activities help close opportunity gaps, support college and career readiness, and connect youth with pathways to higher education and employment.
• Volunteer and leadership opportunities like CIT programs, community cleanups, or school clubs.
• Skills-based training with incentives (e.g., small stipends or “training pay”) even before official working age.
• Reviving youth programs (e.g., Girl Scouts, Boy Scouts) and emphasizing mentorship.
• Creative expression projects like community plates or mural work to connect youth to their environment and voice.
• Offer activities that foster connection and purpose: Design programs that build belonging and life skills.
• Partner with community orgs to expand access: Leverage existing networks to offer free or low-cost options.
• Support youth leadership and intergenerational initiatives: Promote mentorship and civic engagement across age groups.
• Positive Youth Development (PYD): Strengths-based approach helping youth thrive emotionally, socially, and academically.
• 21st Century Community Learning Centers: Federally funded programs offering afterschool and summer learning.
• Youth Mentoring Programs: Build trusted, supportive relationships through structured mentor models.
• Out-of-School Time (OST) Programs: Philadelphia offers OST programs for young people in grades pre-K through 12, supporting working families and promoting children’s academic, social, and personal development. Activities include arts, sports, and academic enrichment.
• Youth emphasized disparities in school quality across counties.
• Needs include improved mental health support, updated teaching methods, and equitable funding
• Desired school traits include diversity, inclusion, quality educators, and modern facilities
• Students in the School District of Philadelphia have demonstrated varied academic performance. In the 2021-2022 school year, approximately 34% of third- to eighth-grade students met reading standards, a 2% decrease from 2018-2019. Math proficiency was at 17%, down 5% from the same period.
• Access to high-quality schools directly affects a young person’s ability to learn, graduate, pursue higher education or vocational training, and secure stable employment. Education is one of the most powerful tools for breaking cycles of poverty and inequity.
• When students fall behind in reading and math—as is happening post-pandemic—they are more likely to struggle academically in later years, drop out of school, or face limited job prospects. Early gaps often widen over time without intervention.
• Schools are not just for academics—they provide mental health support, meals, social-emotional learning, and connection to services. Quality schools help meet the basic needs of youth and families, especially in under-resourced communities.
• Communities with strong public schools often have lower crime rates and greater social cohesion Good schools attract families, increase civic engagement, and help neighborhoods thrive.
• Support for bilingual learners and anti-bullying efforts to ensure comfort in school environments.
• Creating welcoming and identity-affirming clubs for students of all backgrounds.
• Better sexual health and emotional learning programs that students feel engaged in.
• Training for teachers and school staff to be culturally competent and approachable.
• Advocate for fair funding and staffing: Reduce disparities by directing resources to underserved schools.
• Provide interdisciplinary mental health teams in schools: Normalize mental wellness as part of academic success.
• Support mentoring, counseling, and career readiness programs: Prepare students holistically for life after graduation.
• Community Schools Model: Integrates academics with health, social services, and community engagement.
• Multi-Tiered System of Supports (MTSS): Datainformed framework addressing academic and behavioral needs at varying intensities.
• School-Based Mental Health Services: Aligns with pediatric guidance to offer accessible care within the school setting.
Many health resources and services are available to address the needs of SEPA communities. A list of organizations serving Bucks, Chester, Delaware, Montgomery, and Philadelphia Counties was developed based on those included in the 2019 rCHNA report, as well as community organizations identified by Steering Committee members as partners. Organizations were coded into categories based on types of services provided, and contact information was verified in April 2022 for all included organizations. Descriptions of the categories are below, and a searchable list of organizations with contact information, organized by category and county, is included in the online Appendix.
Behavioral Health Services
Benefits & Financial Assistance
Disability Services
Food
Housing/Shelter
Income Support, Education, & Employment
Material Goods
Senior Services
Substance Use Disorder Services
Utilities
Veterans Services
• Services, including treatment, to address mental health or substance use issues
• Assistance with enrollment in public benefits or provision of emergency cash assistance
• Services for individuals with disabilities
• Food pantries or cupboards, as well as assistance with Supplemental Nutrition Assistance Program (SNAP) benefits
• Assistance with emergency shelter, rental payment, or support services for individuals experiencing homelessness
• Support for tax assistance, adult education, and employment
• Material goods including clothing, diapers, furniture
• Services for seniors
• Treatment for substance use disorders
• Assistance with utility payment
• Services for veterans
The participating hospitals and health systems would like to acknowledge the following organizations for access to data and reports to inform the rCHNA.
ORGANIZATION/SOURCE
Academy Health
American Board of Internal Medicine (ABIM) Foundation
Centers for Disease Control and Prevention
County Health Rankings & Roadmaps
Feeding America
HealthShare Exchange
Institute for Health Care Improvement
Montgomery County Office of Public Health
National Center for Health Statistics
National Equity Atlas
Pennsylvania Department of Health
Pennsylvania Office of the Attorney General
Pennsylvania Health Care Cost Containment Council
Philadelphia Communities Conquering Cancer
Philadelphia Department of Public Health
Pennsylvania Commission on Crime and Delinquency, Pennsylvania Department of Drug and Alcohol Programs, and Pennsylvania Department of Education
U.S. Census Bureau
Walker Data
Notes
Vital records data were supplied by the Bureau of Health Statistics and Research, Pennsylvania Department of Health, Harrisburg, Pennsylvania. The Pennsylvania Department of Health specifically disclaims responsibility for any analyses, interpretations or conclusions.
Data for selected indicators is provided by HealthShare Exchange (HSX), the Delaware Valley’s health information organization, based on data contributed from its healthcare provider members.
DESCRIPTION
• Building Trust and Mutual Respect to Improve Health Care
• Building Trust Initiative
• Behavioral Risk Factor Surveillance System Data (PLACES)
• CDC/ATSDR Social Vulnerability Index
• WONDER
• Youth Risk Behavior Surveillance System Data
• Health Data by Location
• What Works for Health
• Map the Meal Gap
• Emergency Department High-Utilizers
• Gun-related Emergency Department Utilization
• Organizational Trustworthiness in Health Care
• 2024 Community Health Assessment
• NCHA Data Query System
• Income Inequality
• Vital Statistics (Birth, Cancer, and Death Records)
• Pennsylvania Uniform Crime Reporting System
• Hospital Inpatient Discharge Data
• Listening Session Summaries
• Syndromic Surveillance Data
• Pennsylvania Youth Survey Data
• American Community Survey 5-Year Data Decennial Census
• Tidycensus
The Pennsylvania Health Care Cost Containment Council (PHC4) is an independent state agency responsible for addressing the problems of escalating health costs, ensuring the quality of health care, and increasing access to health care for all citizens regardless of ability to pay. PHC4 has provided data to the Philadelphia Department of Public Health in an effort to further PHC4’s mission of educating the public and containing health care costs in Pennsylvania. PHC4, its agents and staff have made no representation, guarantee, or warranty, express or implied, that the data—financial, patient, payer and physician specific information—provided to this entity, are error free, or that the use of data will avoid differences of opinion or interpretation. This analysis was not prepared by PHC4. This analysis was done by the Philadelphia Department of Public Health. PHC4, its agents and staff bear no responsibility or liability for the results of this analysis, which are solely the opinion of this entity.
An online appendix of resources used to inform and produce this CHNA is available at: RCHNA-SEPA.org