SAFE ACCESS TO… From Vision to Planning to Funding


Florida APA Conference
September
2023


 Alana Brasier, AICP, Safe Streets guru
Lisa K Silva, PLA, AICP, Project Manager
Kathrin Tellez, AICP, PTP, RSP2B, Principal
OUR CURRENT REALITY
TRAFFIC FATALITIES ARE A PUBLIC HEALTH CRISIS AFFECTING ALL ROAD USERS.
1.35M
42,915
7,485
Lives lost globally each year from traffic crashes.
Lives lost in the US in 2021 from traffic crashes.
Source: Centers for Disease Control Source: NHTSA
Pedestrians Killed in US traffic crashes in 2021.
Source: NHTSA
3
TOTAL US TRAFFIC FATALITIES
2012 - 2021
0 5,000 10,000 15,000 20,000 25,000 30,000 35,000 40,000 45,000 50,000 2012 2013 2014 2015 2016 2017 2018 2019 2020 2021 Vehicle Occupants Motorcyclists Pedestrians Bicyclists & Other Vulnerable Roadway Users
TOTAL US PEDESTRIAN DEATHS
2009 - 2021
1,000 2,000 3,000 4,000 5,000 6,000 7,000 8,000 2009 2010 2011 2012 2013 2014 2015 2016 2017 2018 2019 2020 2021
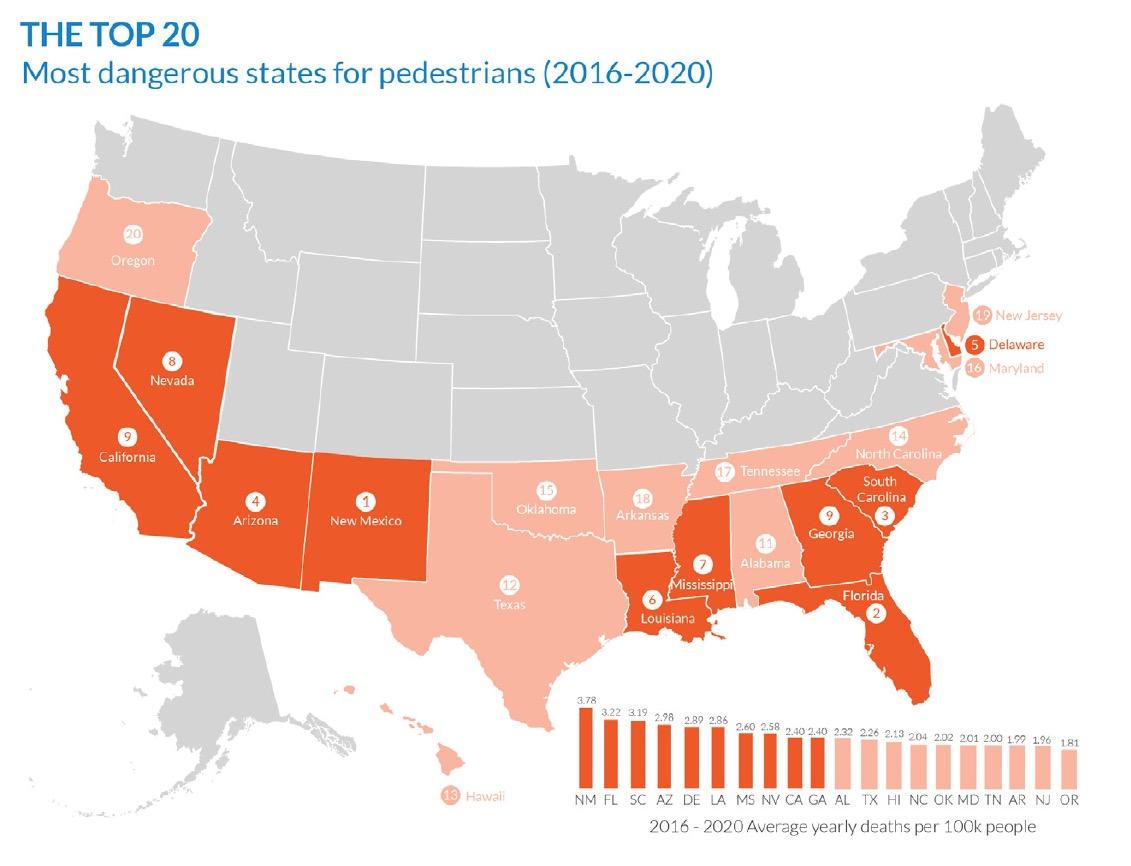
IT’S A NATIONAL PROBLEM
49 STATES AND 84 OF THE 100 LARGEST METROS HAVE BECOME MORE DANGEROUS TO PEDESTRIANS IN THE PAST DECADE
.
Source: Dangerous by Design
WHAT ABOUT FLORIDA?
2012 - 2021
500 1,000 1,500 2,000 2,500 3,000 3,500 4,000 2012 2013 2014 2015 2016 2017 2018 2019 2020 2021 Motorist Pedestrian Bicyclist
FLORIDA PEDESTRIAN FATALITY TRENDS
2009 - 2021
100 200 300 400 500 600 700 800 900 2009 2010 2011 2012 2013 2014 2015 2016 2017 2018 2019 2020 2021 Pedestrians
WHY IS THIS FATALITY TREND HAPPENING?

LAND USE AND TRANSPORTATION CONTEXT MATTER
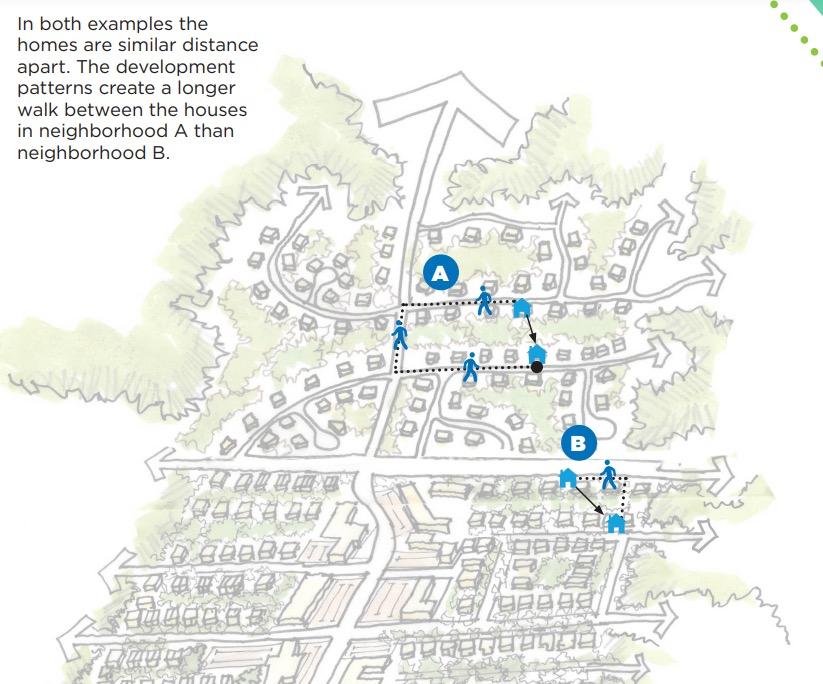

ROADWAY DESIGNS & POLICIES
THAT FAVOR UNCONGESTED HIGH - SPEED TRAVEL IN PRIVATE VEHICLES
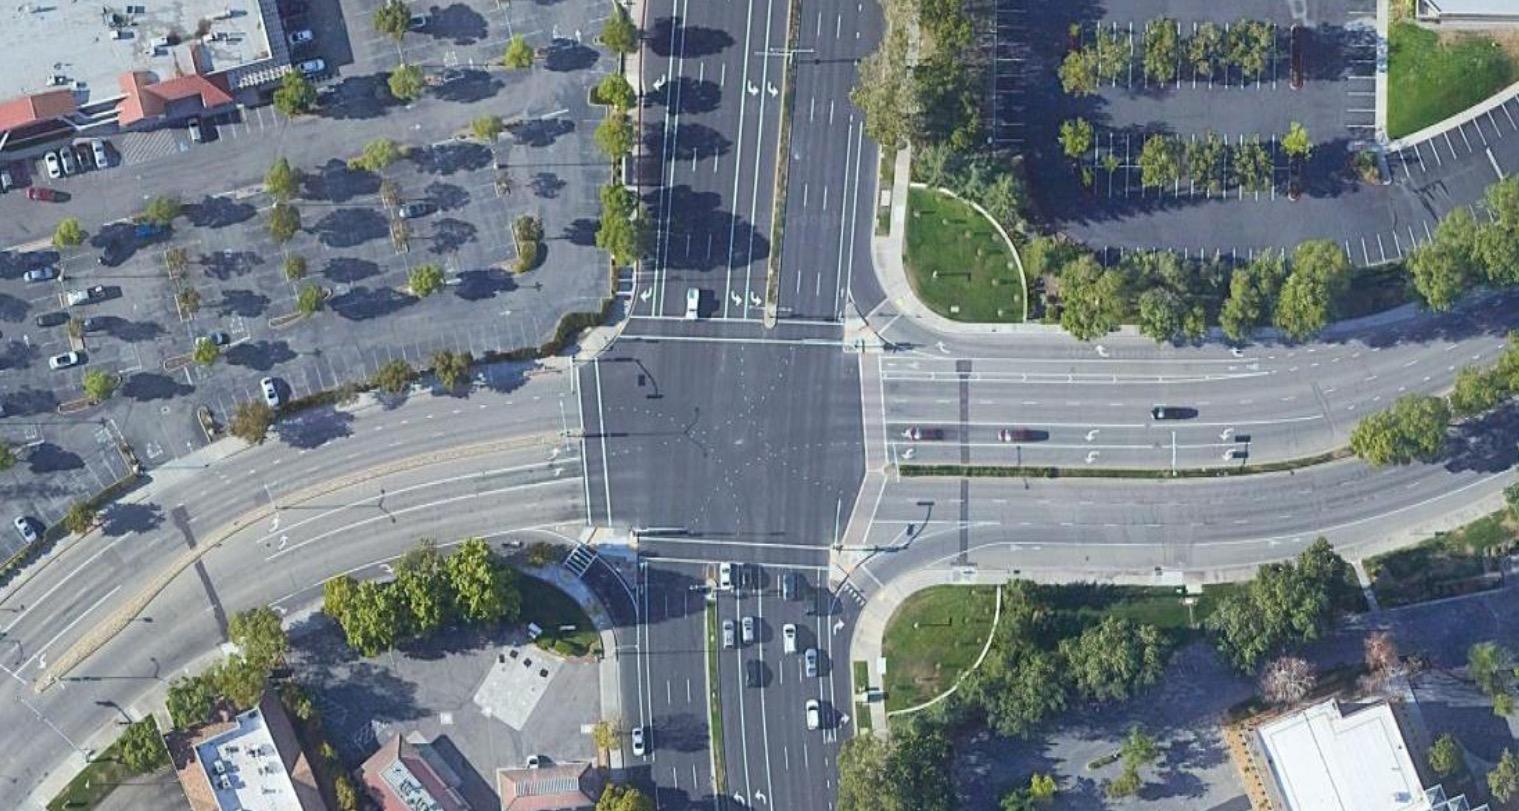
HOW DO YOU GET TO:
…school?
…the bus stop?
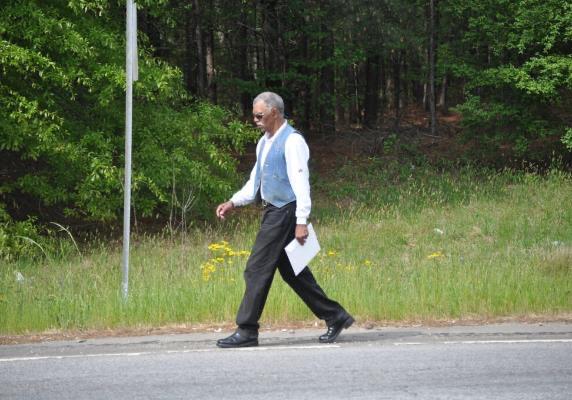
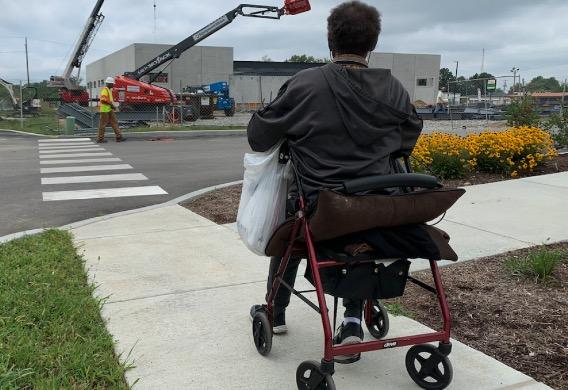

…the park?
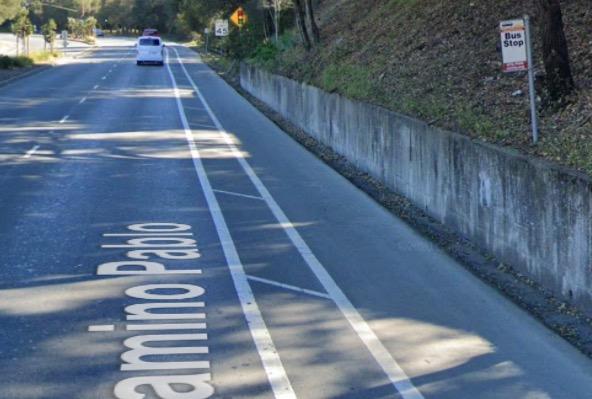
…the grocery store?
AND WE WONDER WHY PEOPLE DO THIS:
Source: Fehr & Peers
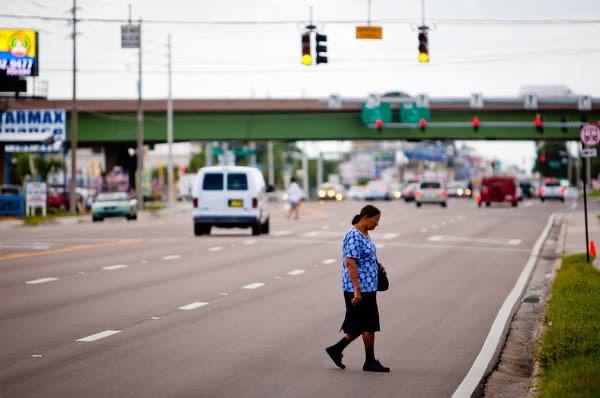
13
WHY DOES SAFE ACCESS TO PLACES MATTER?
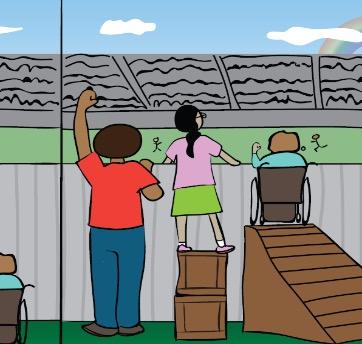

SUSTAINABILITY EQUITY

HEALTH

ECONOMIC

VIABILITY
LIVABILITY
WHAT CAN WE DO ABOUT IT?
AWARENESS
LAND USE & TRANSPORTATION PLANNING
SAFER STREET DESIGN & POLICIES





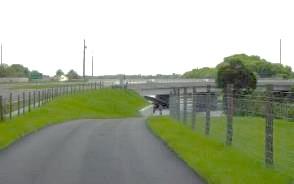
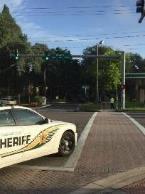
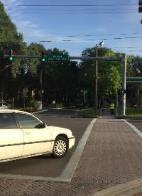
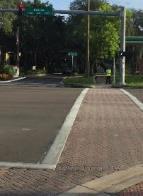
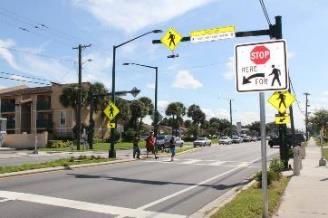
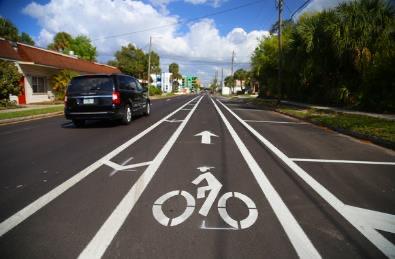
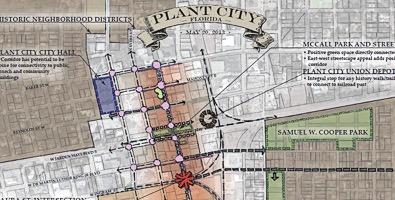
Great work underway, but deaths still increasing Start LPI 5 seconds later Leading Pedestrian Interval (Bearss Ave & 22nd St) End LPI • Complete Streets • Intersection Lighting • Midblock Crossing • Trails Program Platt Street, City of Tampa
Lessons from VISION ZERO Communities
Victim blaming is not helpful
Storytelling is central
ZERO is the right number
Needs to be a Data – driven approach
Traffic violence is a public health crisis
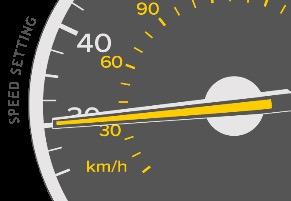
Reducing speeds is critical
Diverse coalition needed for diverse approaches …and systemwide implementation
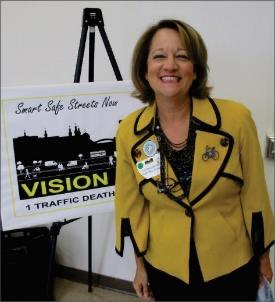
Hillsborough County first TPO to adopt TPO-led Vision Zero plan in the country.

• One message, many voices
• Consistent & Fair
• Paint Saves Lives
• Future will not be like the past
*Adopted 2017
Not the usual long-range process, we focused on low cost, quick solutions
TPO Implementation Studies
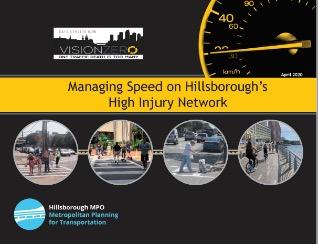
Speed Management Action Plan (2020)
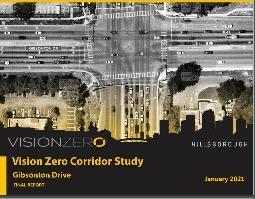
Corridor Studies of 8 of top 20 HIN (2021)
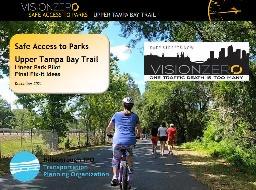
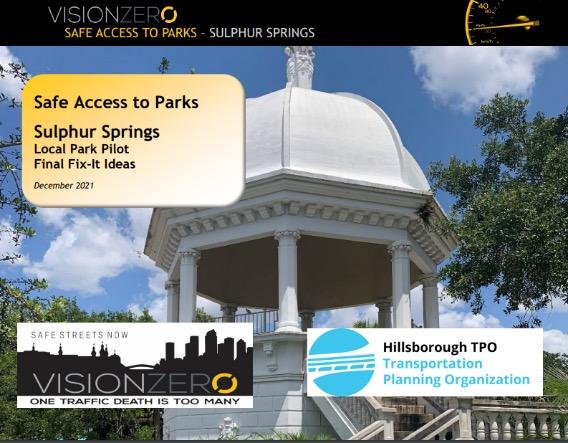
Safe Access to Parks (2021)
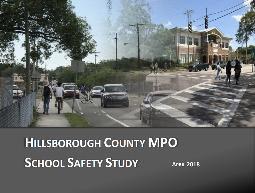
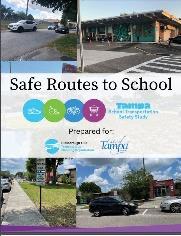
School Transportation Safety Studies (2018, 2023)
Vision Zero Streets –Waters and Sligh
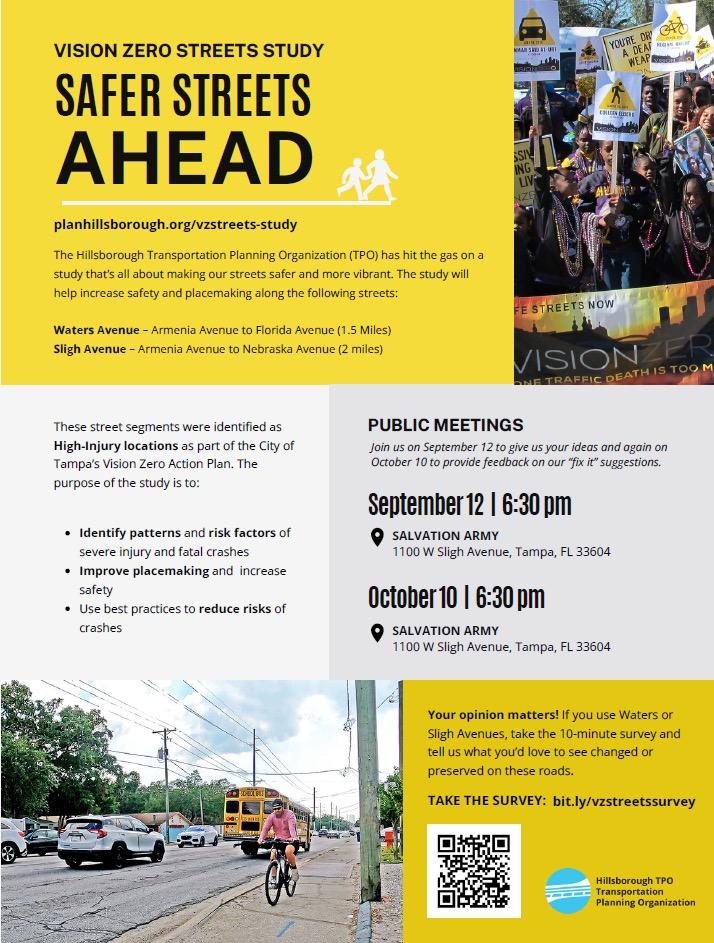

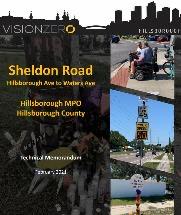
Aves
21
Implementation of SAFE ROUTES TO PLACES
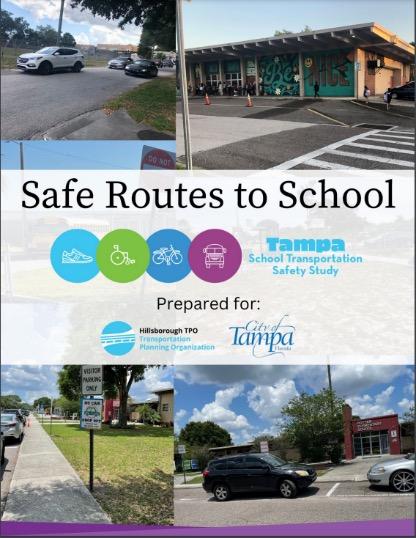
SPEED MANAGEMENT IMPLEMENTATION –
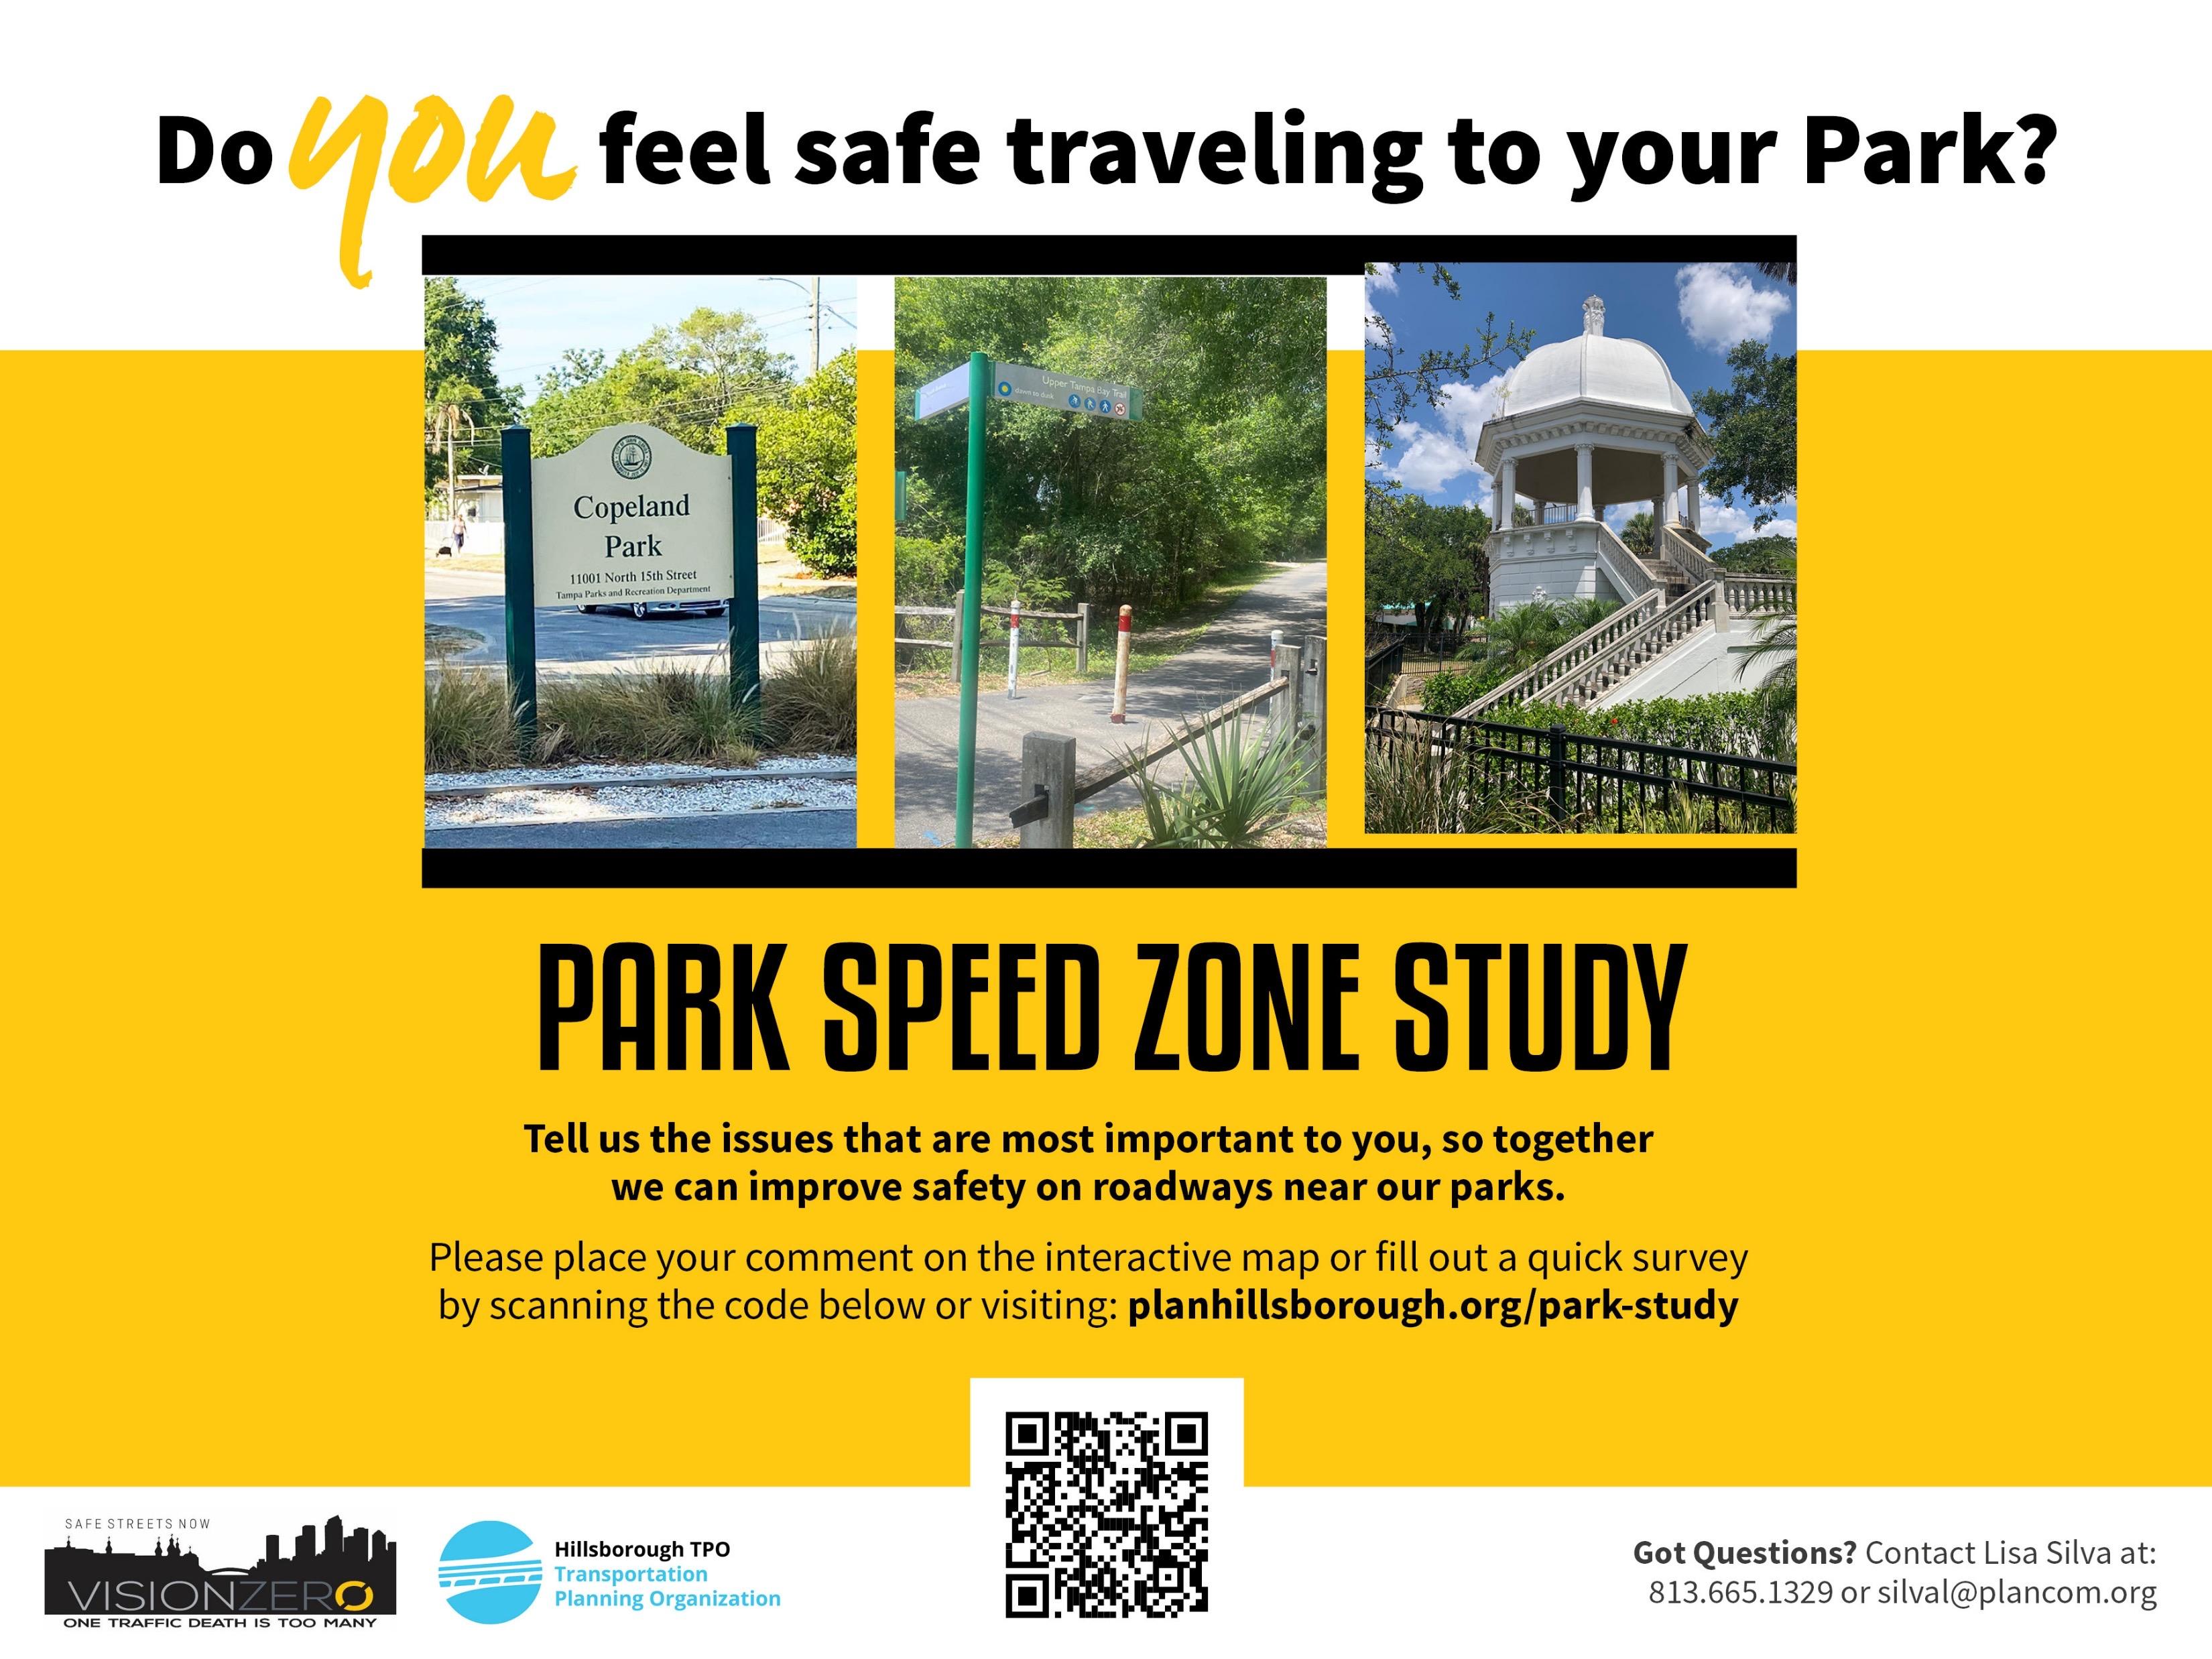
Park Speed Zone Scope
• Task 1 – Park Selection
• Task 2 – Preliminary Existing Conditions
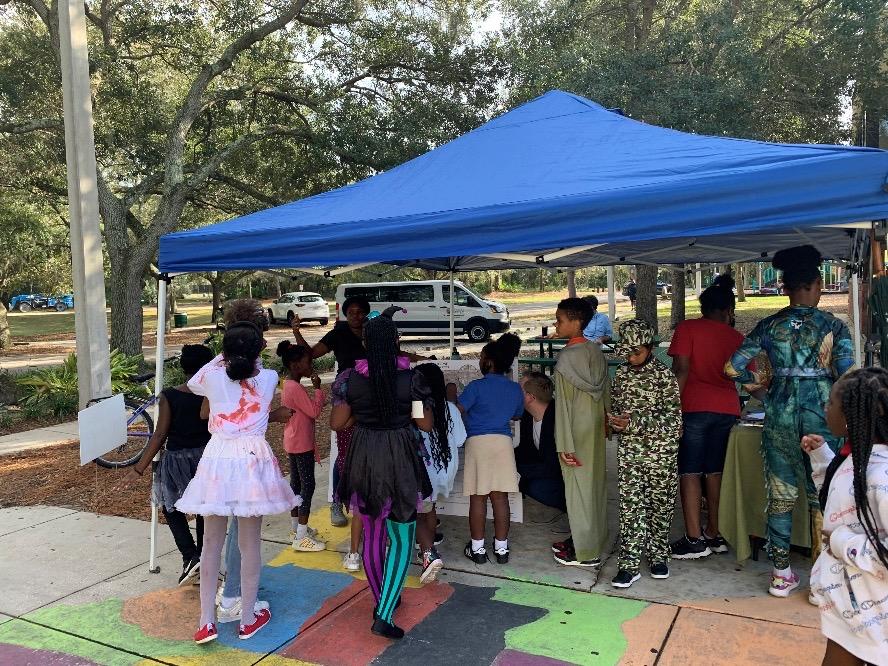
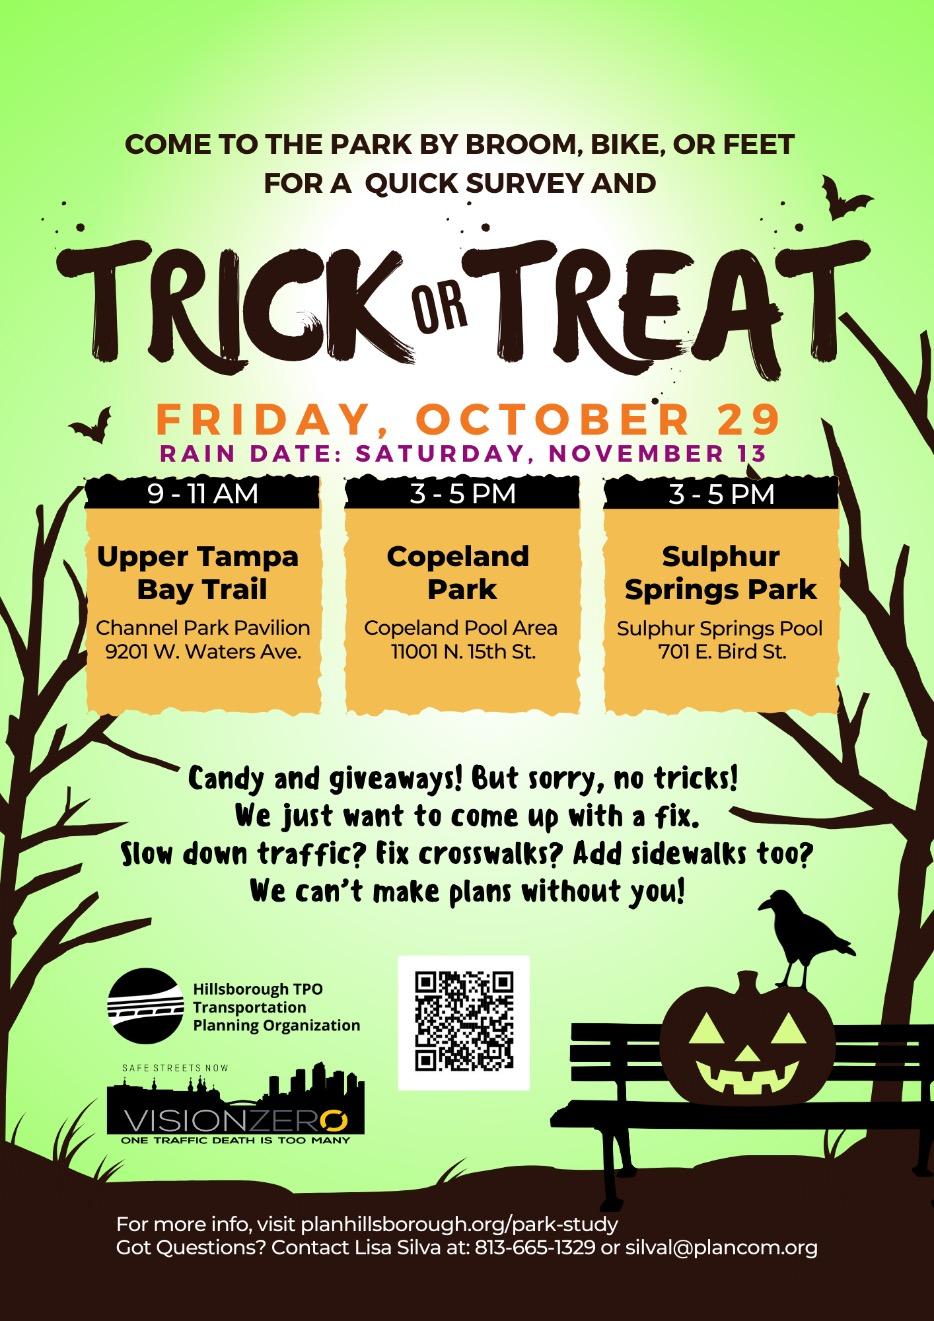
• Task 3 – Public Outreach
• Task 4 – Countermeasure Toolbox
• Task 5 – Recommendations and "How to Guide"

Task 1 – Park Selection
Data Driven Process
§ Define different types of parks within the County
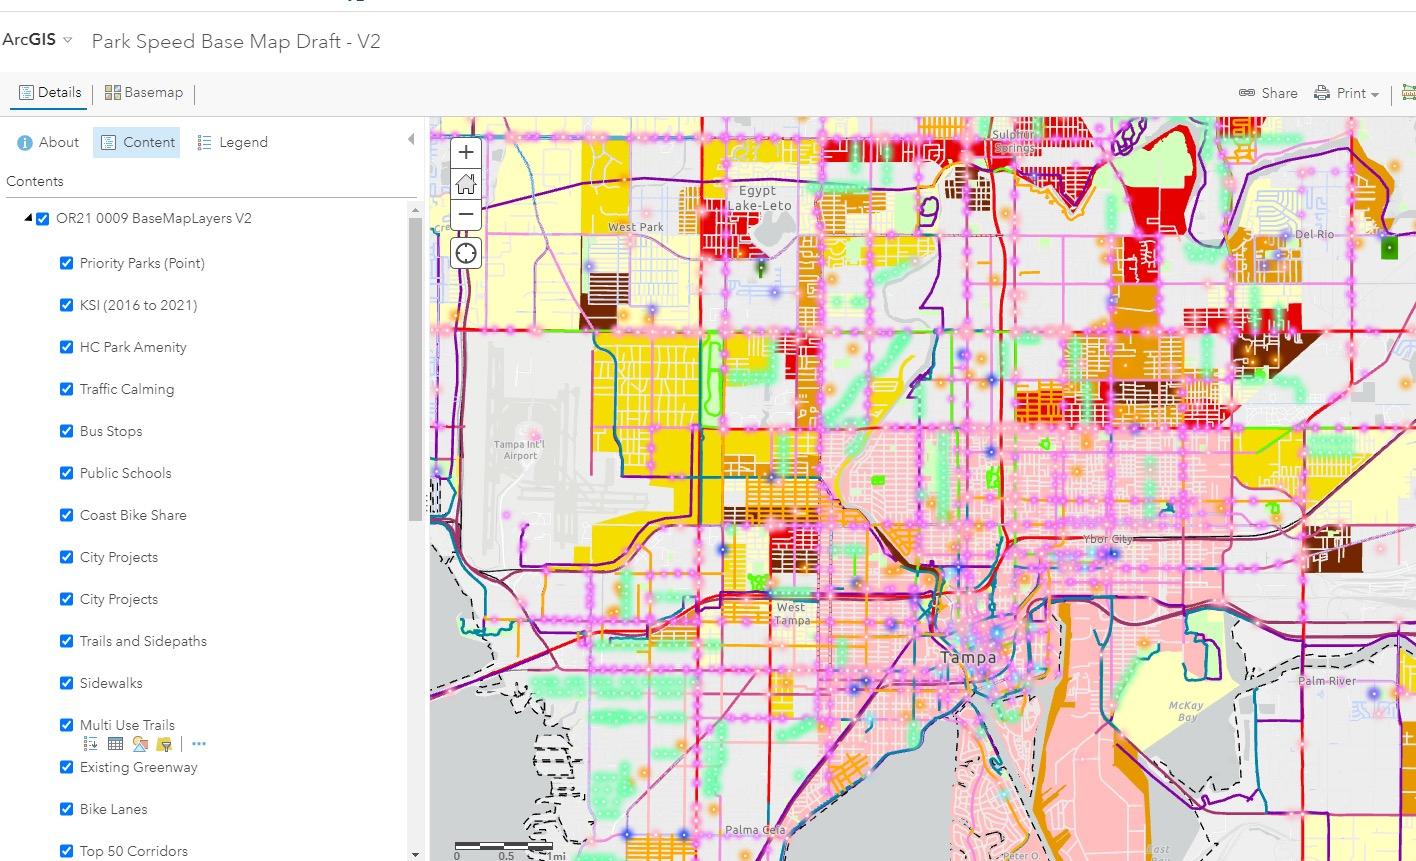
§ Develop Evaluation criteria
§ Initial Ranking
§ Final Selection – 3 parks
Evaluation Criteria
Criteria Max Points/ Category 1. Within a community of concern 35 / Equity 2. Limited prior investment 5 / Equity 3. Within a half mile of a Top 50 Corridor 20 / Safety 4. Number of Bike/Ped KSIs within a half mile 15 / Safety 5. Proximity to more than 50 hard braking events in a month 5 / Safety 6. Density of residents within a half mile 5 / Other 7. Density of jobs within a half mile 5 / Other 8. Within a half mile of a school/library/community activity hub 5 / Other 9. Ease of public engagement during project time frame 5 / Other (allocated after initial ranking)
TASK 2 – Existing Conditions
§ Park Setting
§ Transportation Setting
§ Collisions
§ Catchment Area
§ Speed
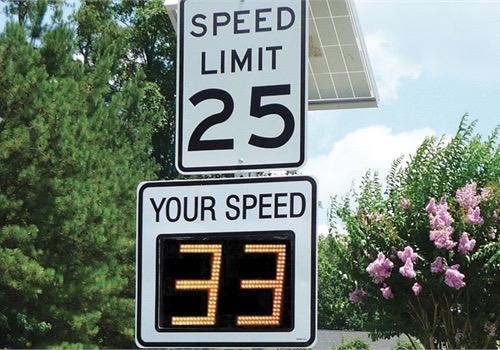
§ Comfort
§ Other Area Studies

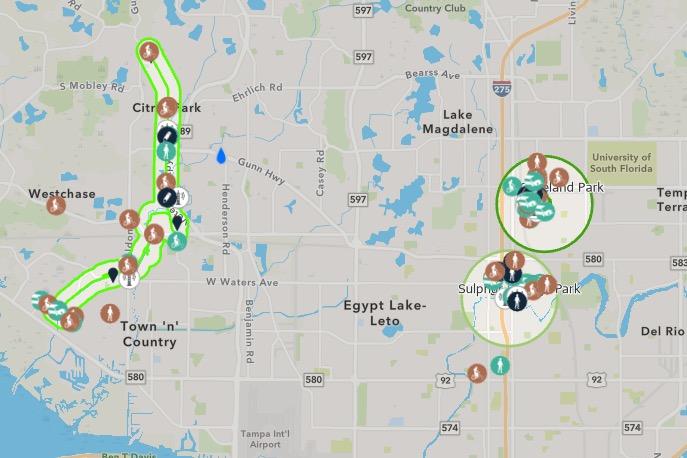
Copeland Park
Key Findings
§ Most people come from within a 1 to 3-mile radius of the park

§ Inconsistent and uncomfortable pedestrian facilities connecting to the park
§ No bicycle facilities connect to the park
§ Barriers to walking and bicycling are created by Fowler Avenue and railroad crossings
TASK 3 – Public Feedback
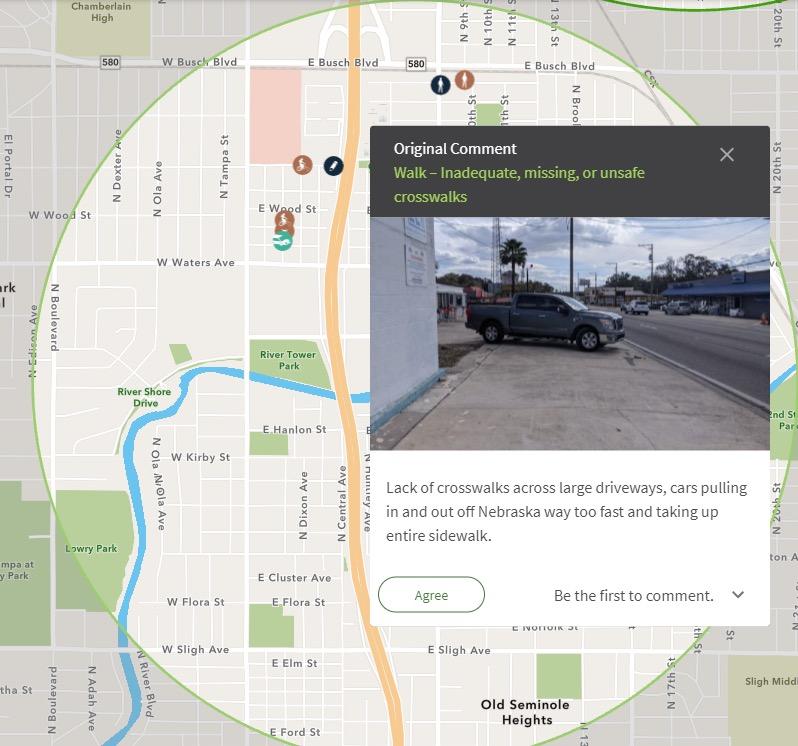
§ On-line Feedback (English and Spanish)

§ Survey
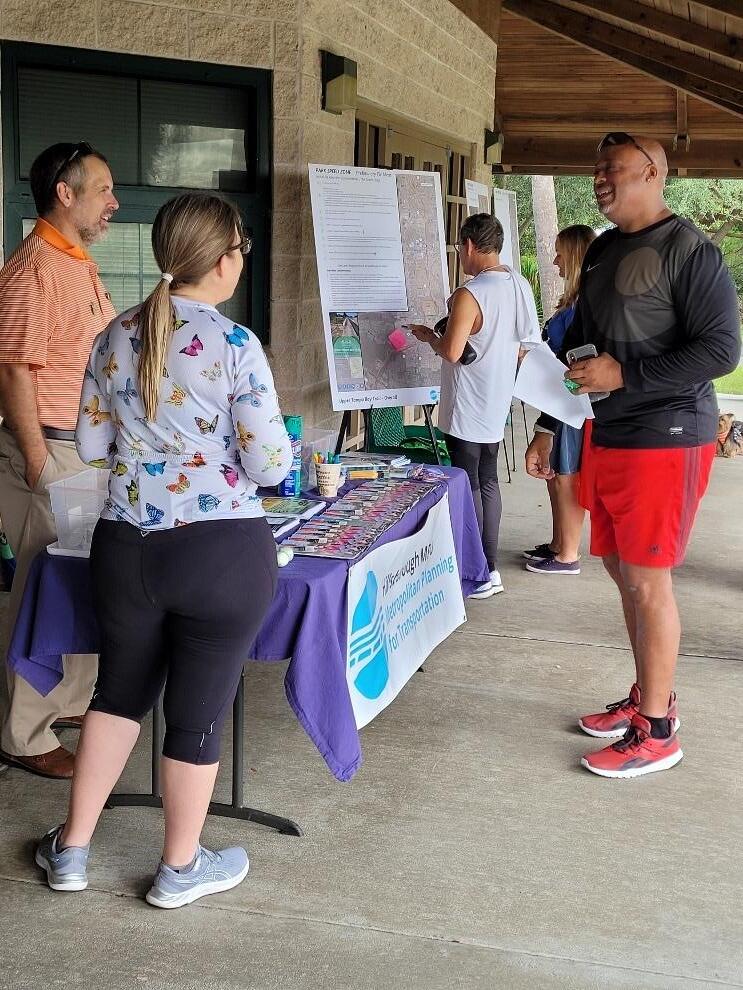
§ In person outreach
Sulphur Springs Park
What are people saying?
§ Lots of speeding especially on streets without sidewalks or sidewalks adjacent to the travel lane
§ Lack of sidewalks and large driveway areas
§ Bus stops need protection from the elements
§ Need dedicated bicycle facilities
§ More street lighting is needed

TASK 4 – Toolbox Development
§ Building on Speed Management Action Plan
§ Speed Management and Safety Countermeasures in the following categories:
§ Signal timing and phasing
§ Intersection and roadway design

§ Signs and markings
§ Bikeway design
§ Walking facility design
§ Crossing treatments
§ Lighting
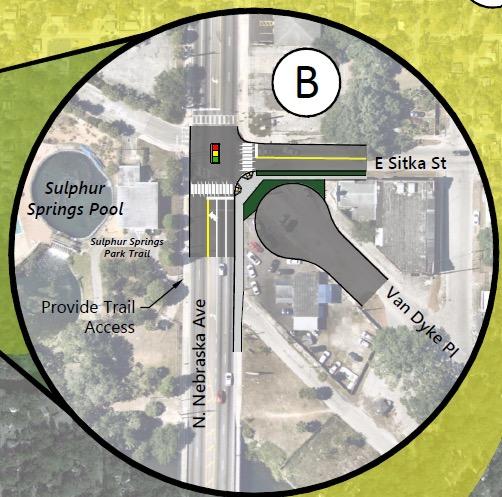
Fix-It Ideas: Sulphur Springs
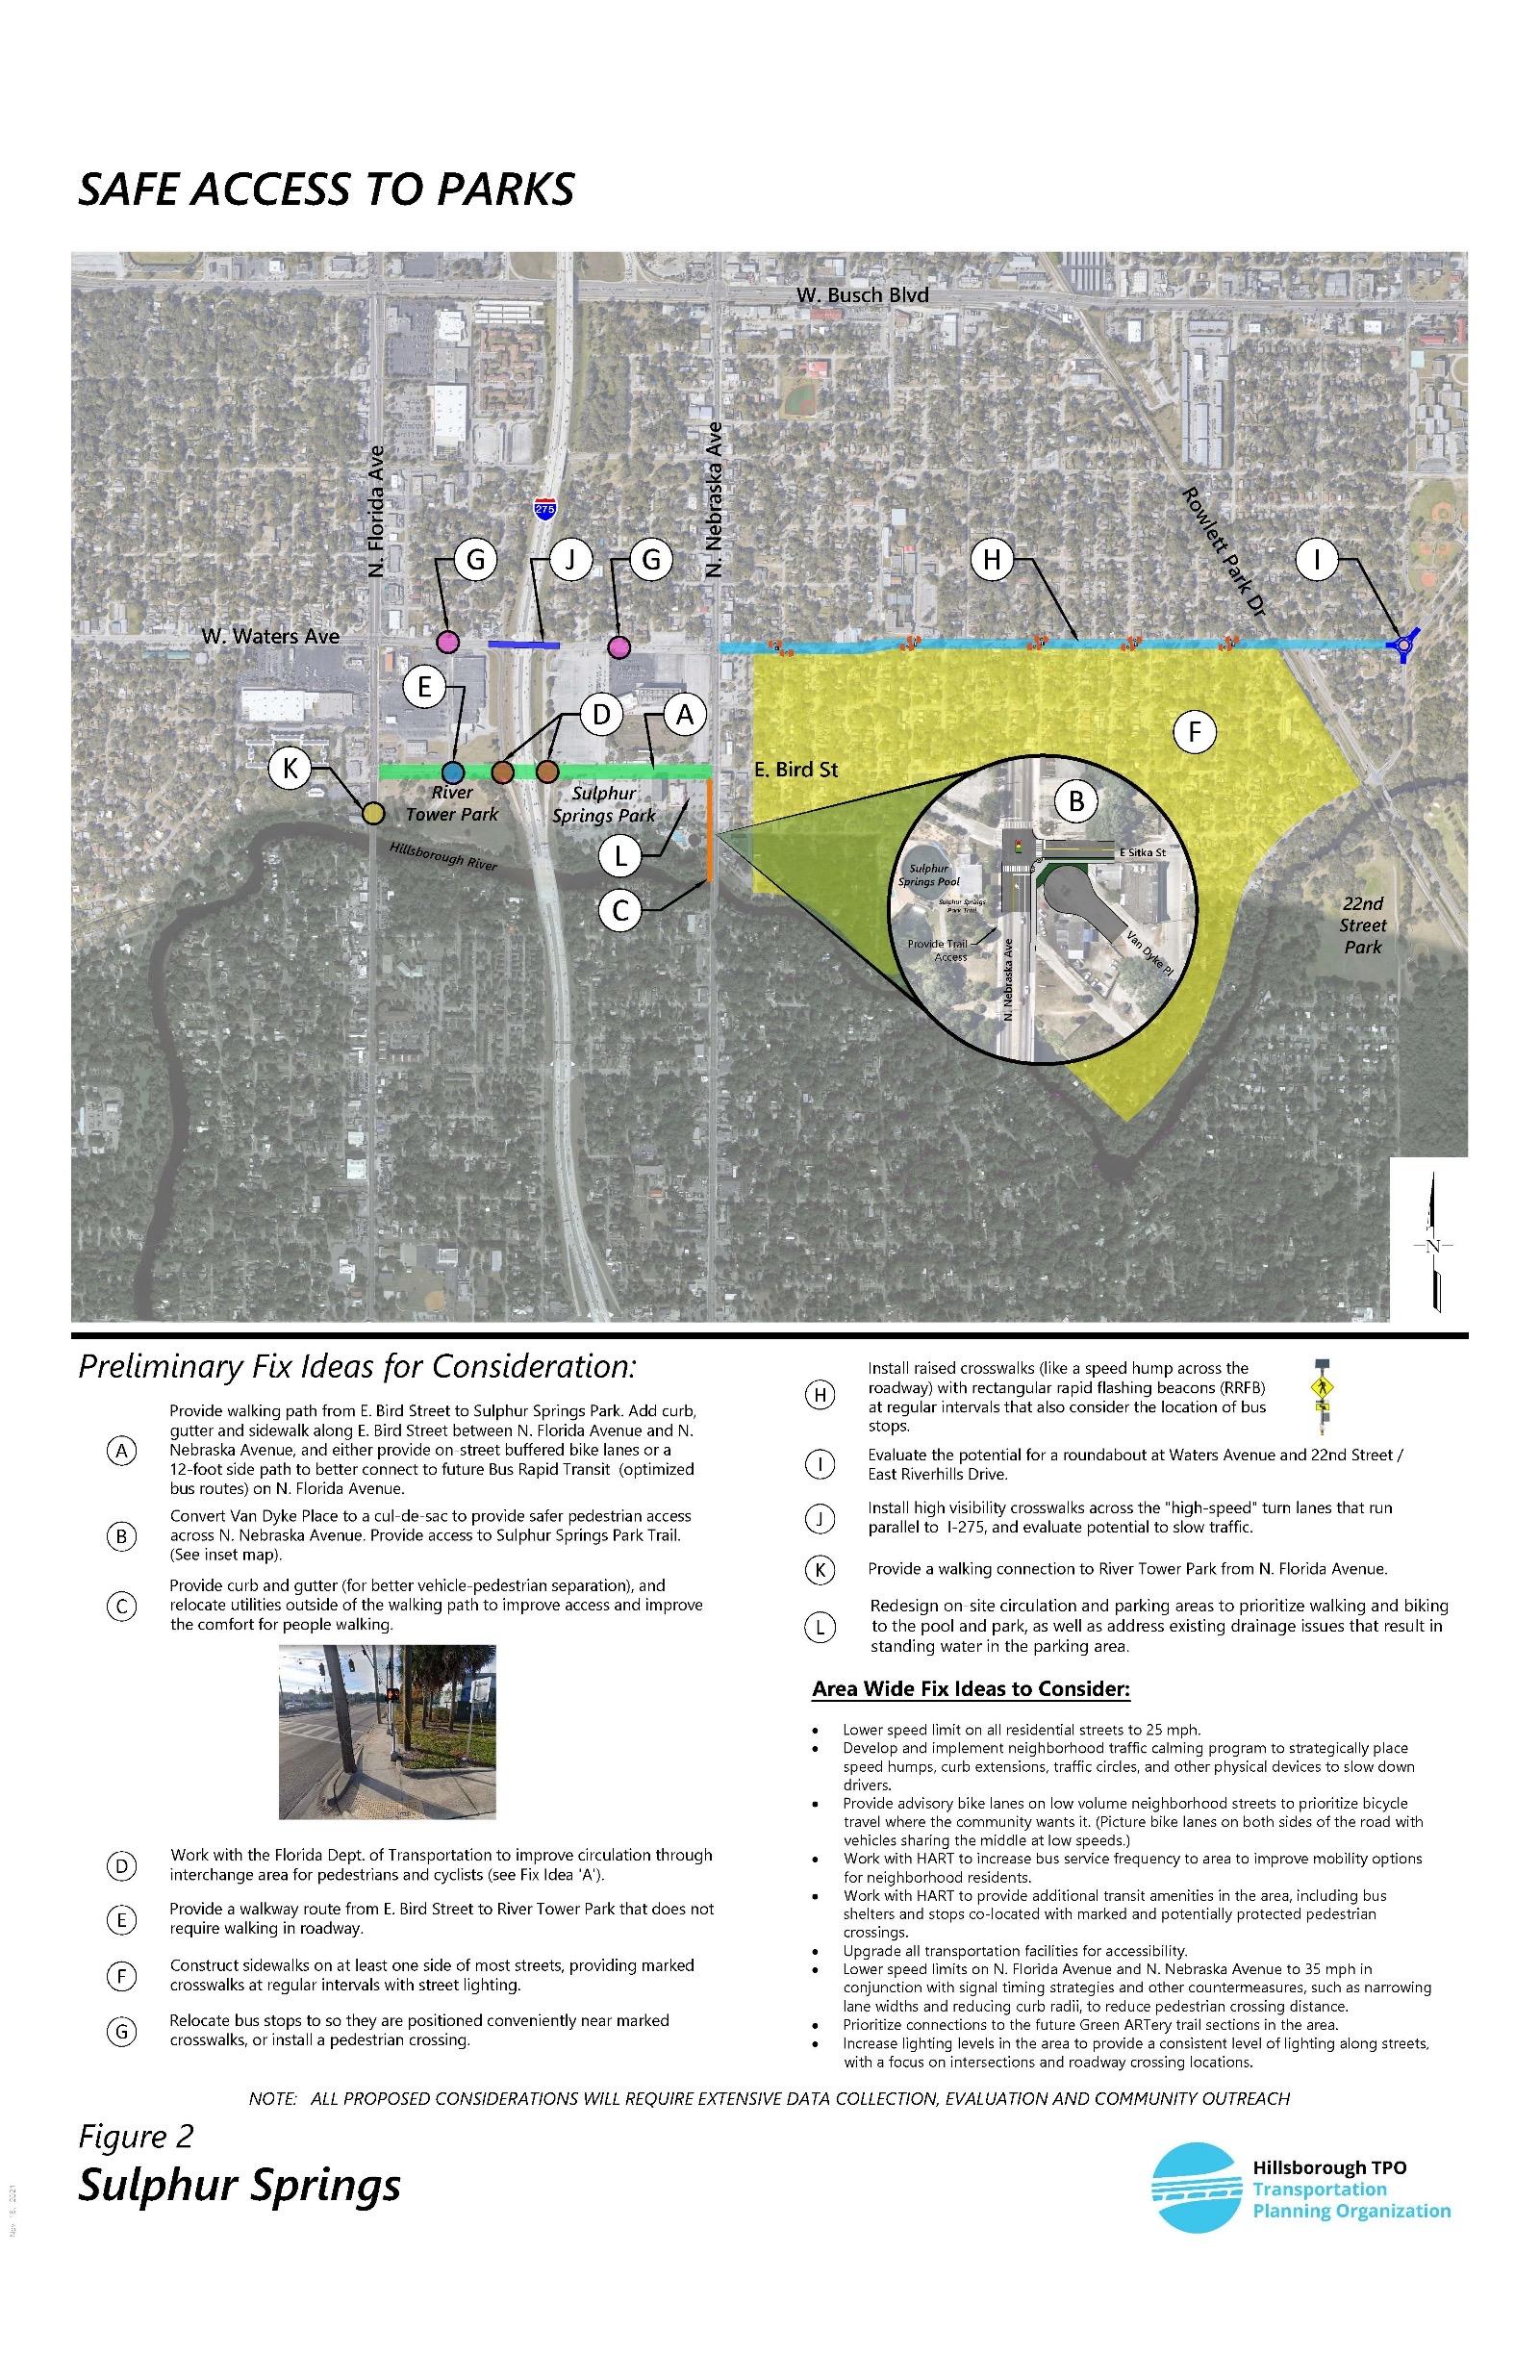

Sulphur Springs Fix-It Overview
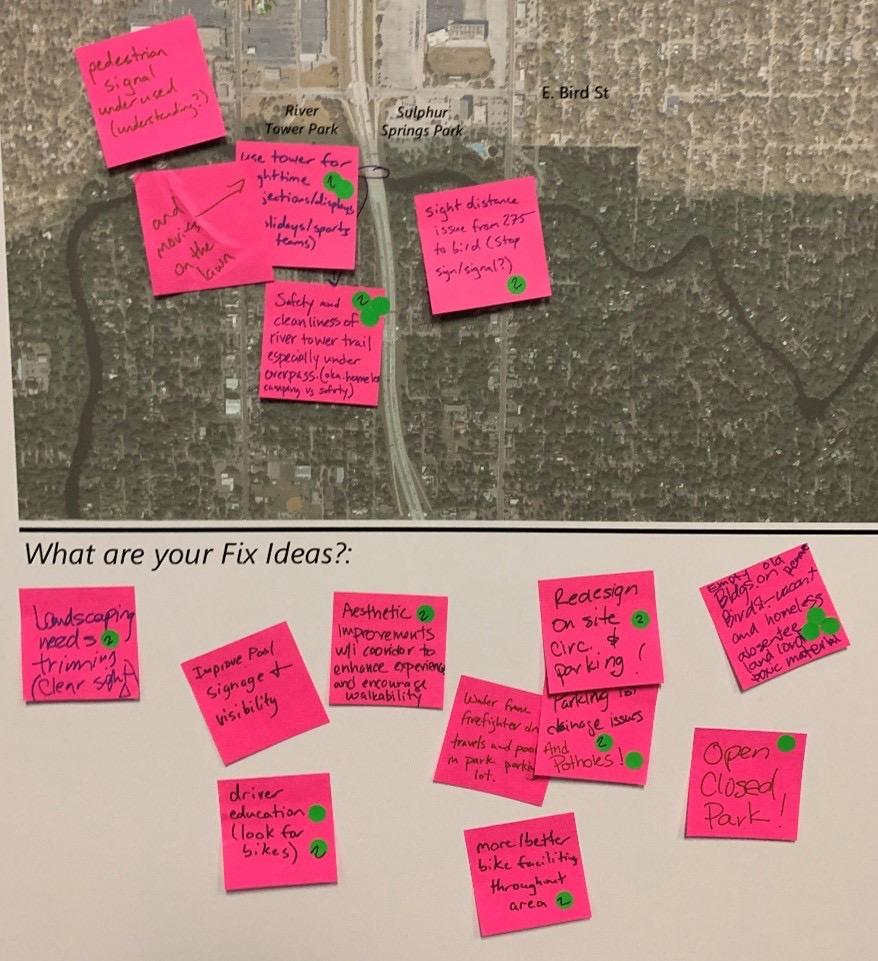
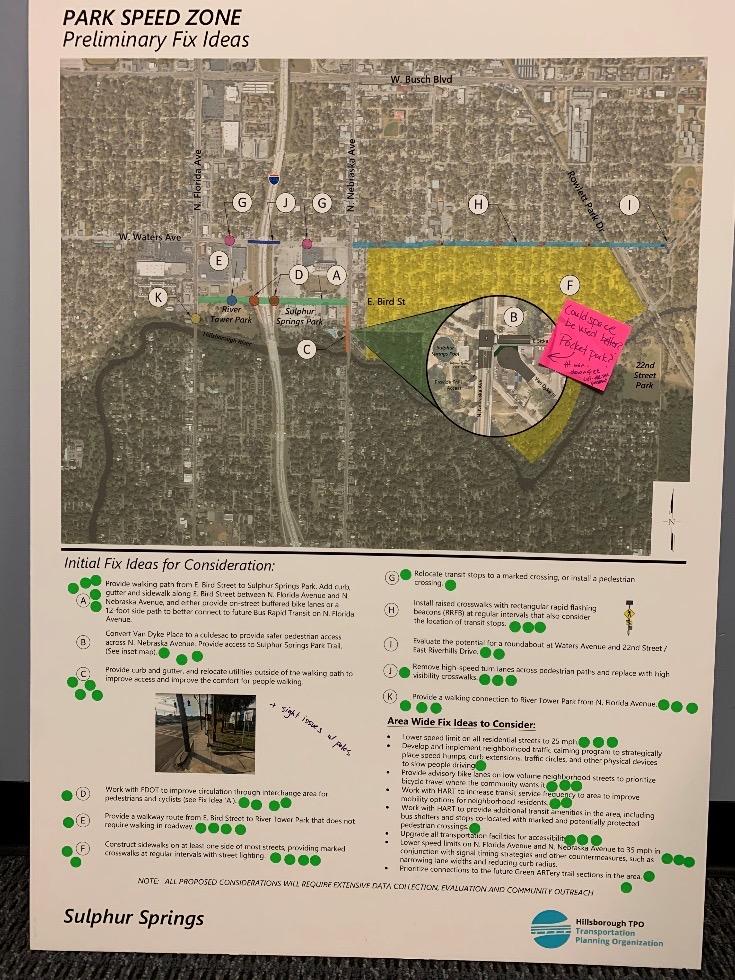
What was changed as a result of feedback?
§ Changed the project name
§ Added additional Fix-it Ideas to the draft document:
§ Widen portion of the trail to 12-feet minimum, ideally 15-feet (this portion of trail is currently 8-feet) (UTBT)
§ Identify opportunities to connect to the Double Branch Trail and Pinellas Trail System (UTBT)
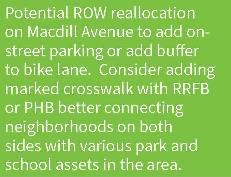
§ Add a marked crosswalk and evaluate for other enhancement such as rectangular rapid flashing beacon (RRFB) at the Champions Forest entrance (UTBT)
§ Add way-finding signage and trail enhancements to connect UTBT to the Dog Park, Park and Ride Lot, and Bus Transfer on the other side of the river (UTBT)
§ Improve maintenance of the Ehrlich Trailhead to improve visibility of the parking area from trail and surrounding businesses (UTBT)
§ Add and enforce a 15 mile per hour speed limit on the trail (UTBT)
§ Redesign on-site circulation and parking areas to prioritize walking and biking to the pool and park, as well as address existing drainage issues that result in standing water in the parking area (Sulphur Springs)
How to Guide
§ Select your park location
§ Conduct existing conditions assessment
§ Solicit feedback from the public and other stakeholders
§ Identify potential Countermeasures
§ Think big and small
§ Monitor Outcomes and Identify Potential Funding Sources
Approval of Planning Study/Project Implementation
• TPO Committees Provided feedback


• Approved by TPO Board Jan 2022
• Fix-it Ideas incorporated by both City of Tampa and Hillsborough County into their SS4A Grant Application


Project Goals
• Building on the School Safety Study completed in 2018, and implementation of Vision Zero
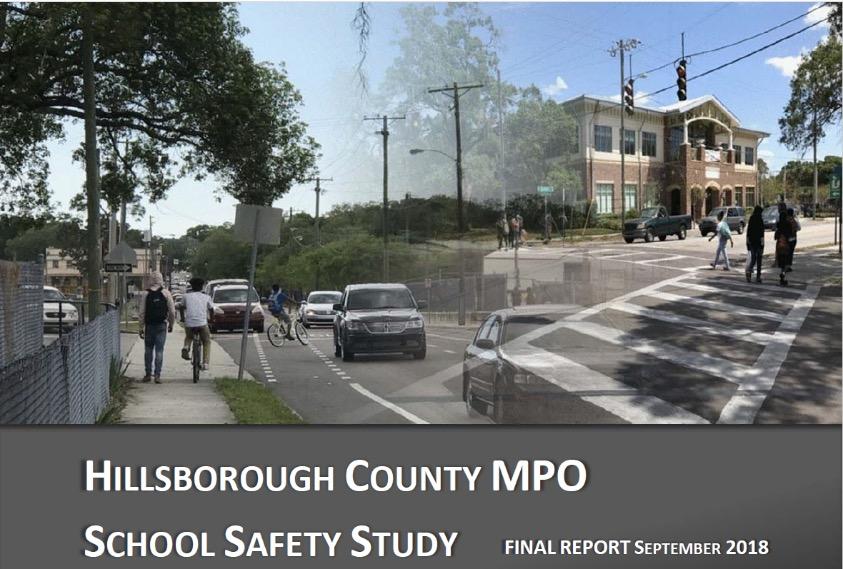
• Identification of physical transportation system improvements around and connecting to a set-of schools
• Development of school specific education and encouragement strategies and a template/process that can be used for other schools in the district
Project Overview
• Assemble Stakeholder Group
• Survey District Families and School Administration
• Update School Prioritization List
• Assess Existing Safe Routes to School Programs at Area Schools

• Develop Educational and Encouragement Materials for Select Schools
• Identify Physical Improvements for Select Schools
School Site Selection
Evaluation Criteria
• School location and enrollment
• Size/dimensions of enrollment boundary area

• Underserved community designations
• Percent of students qualifying for free or reduced lunch
• High Injury Network
• Bicycle and Pedestrian fatality and serious injury locations (2017-2021)
• All Traffic crashes that involve school aged people during travel to/from school times and other times
• Roadway network characteristics
• Proximity to other schools, libraries, and recreation centers
School Site Selection Details
Scoring
1. Within a designated underserved community (20 points / equity)
2. Percent of students who receive a free or reduced cost lunch (20 points / equity)
3. Enrollment area includes Top 50 Corridor (5 points / safety)
4. Number of Bike/Ped KSIs within school enrollment boundary (20 points / safety)
Scoring
5. Number of Total KSIs within school enrollment boundary (15 points / safety)
6. Density of students within enrollment area (5 points / other)
7. Roadway network characteristics (5 points / other)
8. Within a half mile of a school/ library/community activity hub (10 points / other)
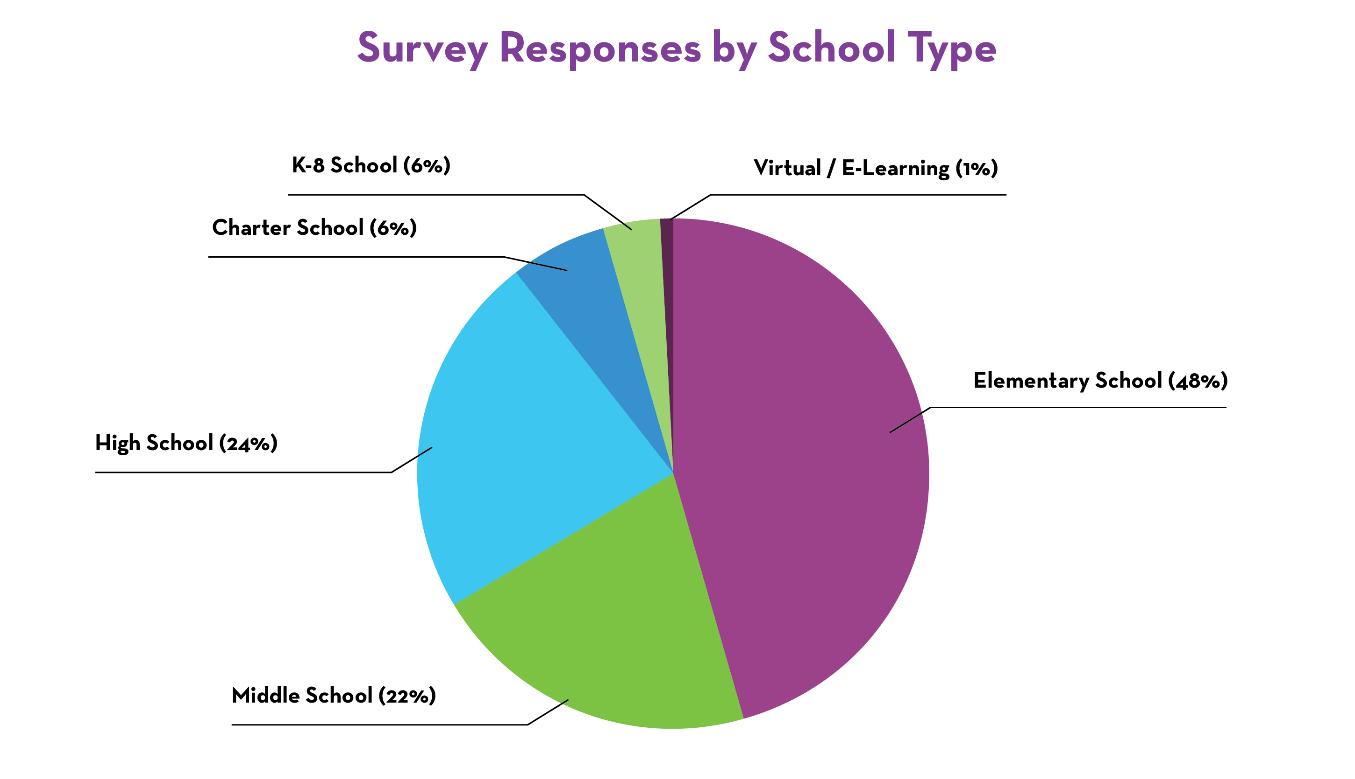
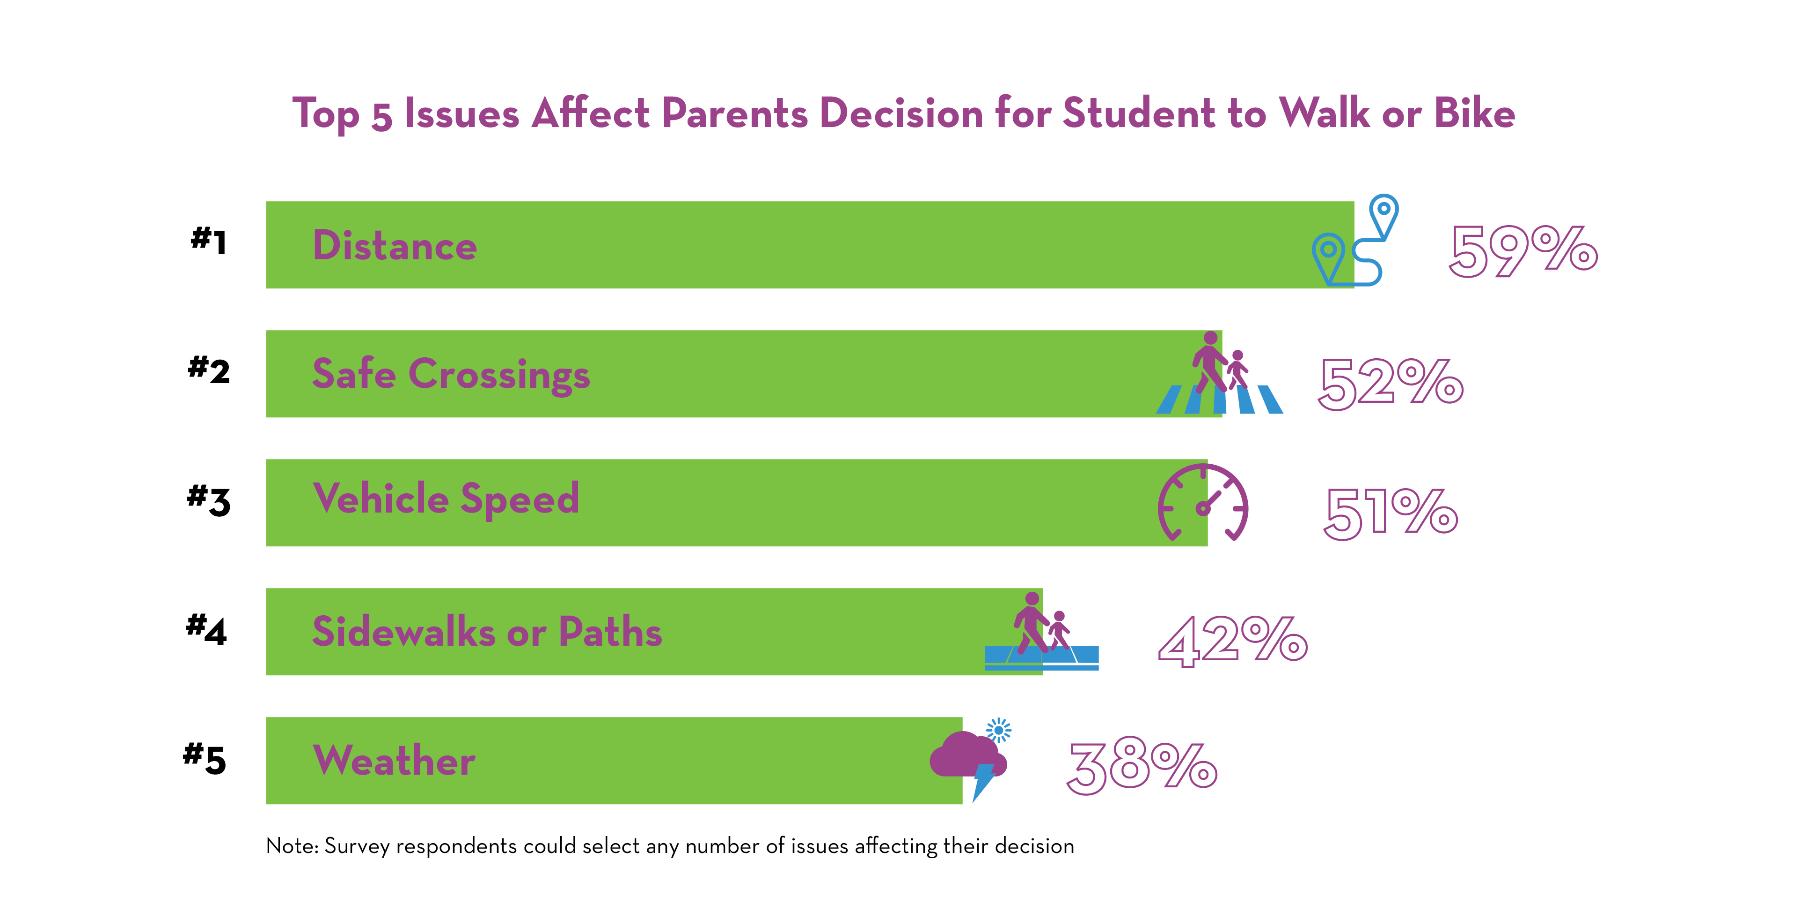
High Level Survey Results – Family Surveys
Barriers to Walking/Biking
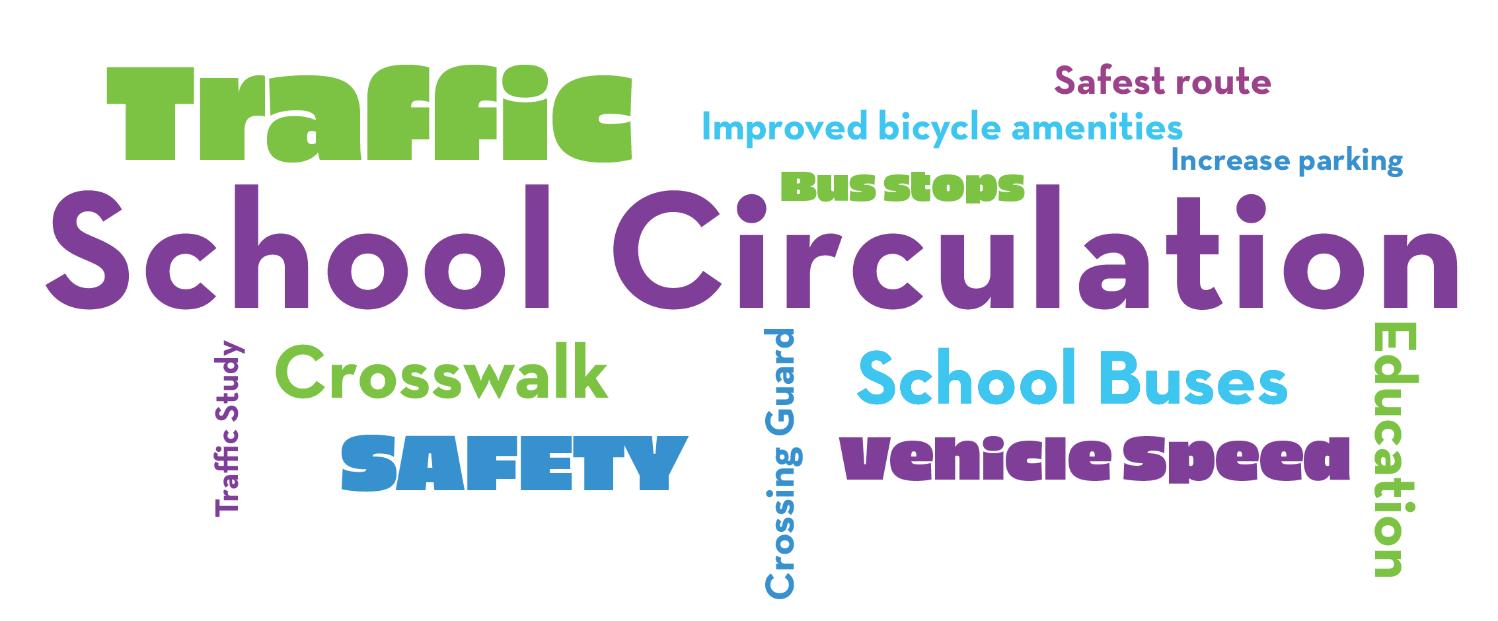
High Level Survey Results – Schools
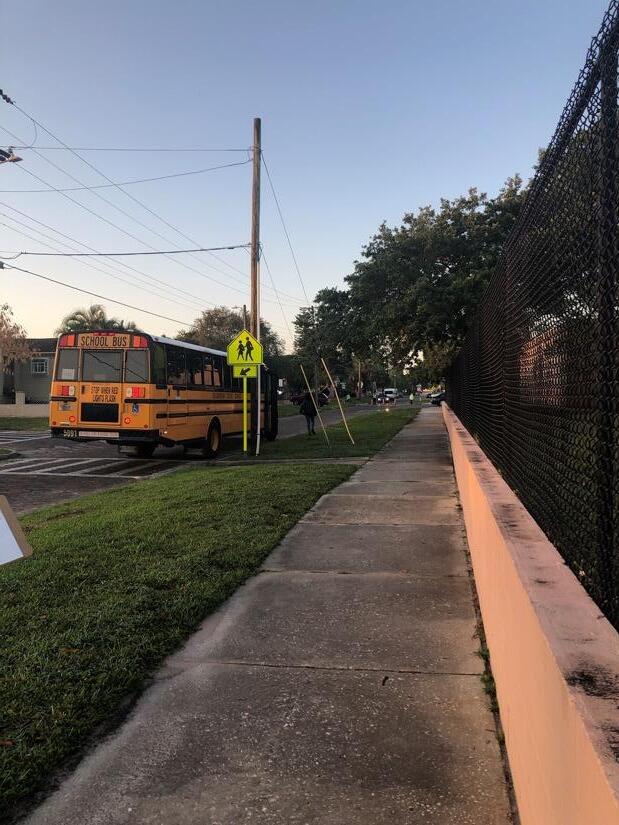
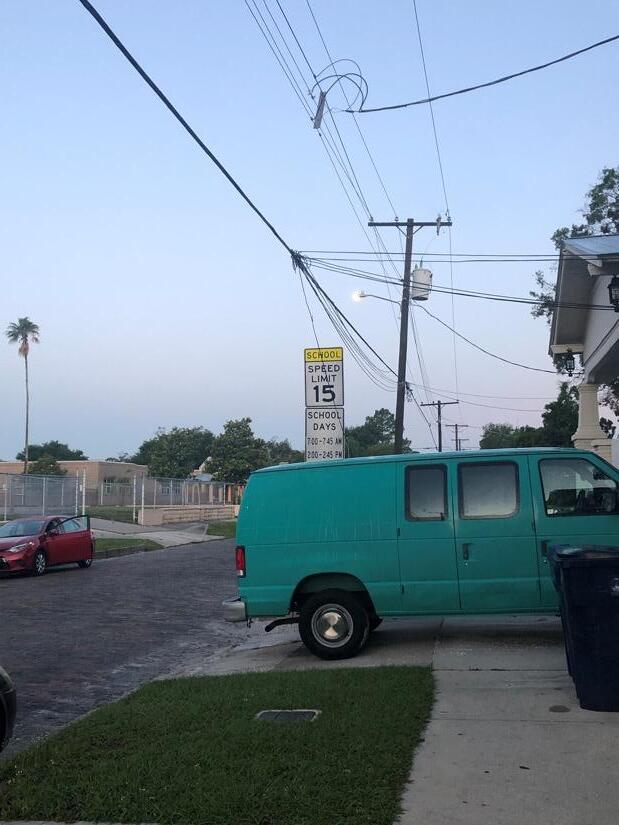
Transportation Safety Audit
• Morning drop afternoon pick observations
• On-site Circulation
• Queue management strategies
• Infrastructure around campus
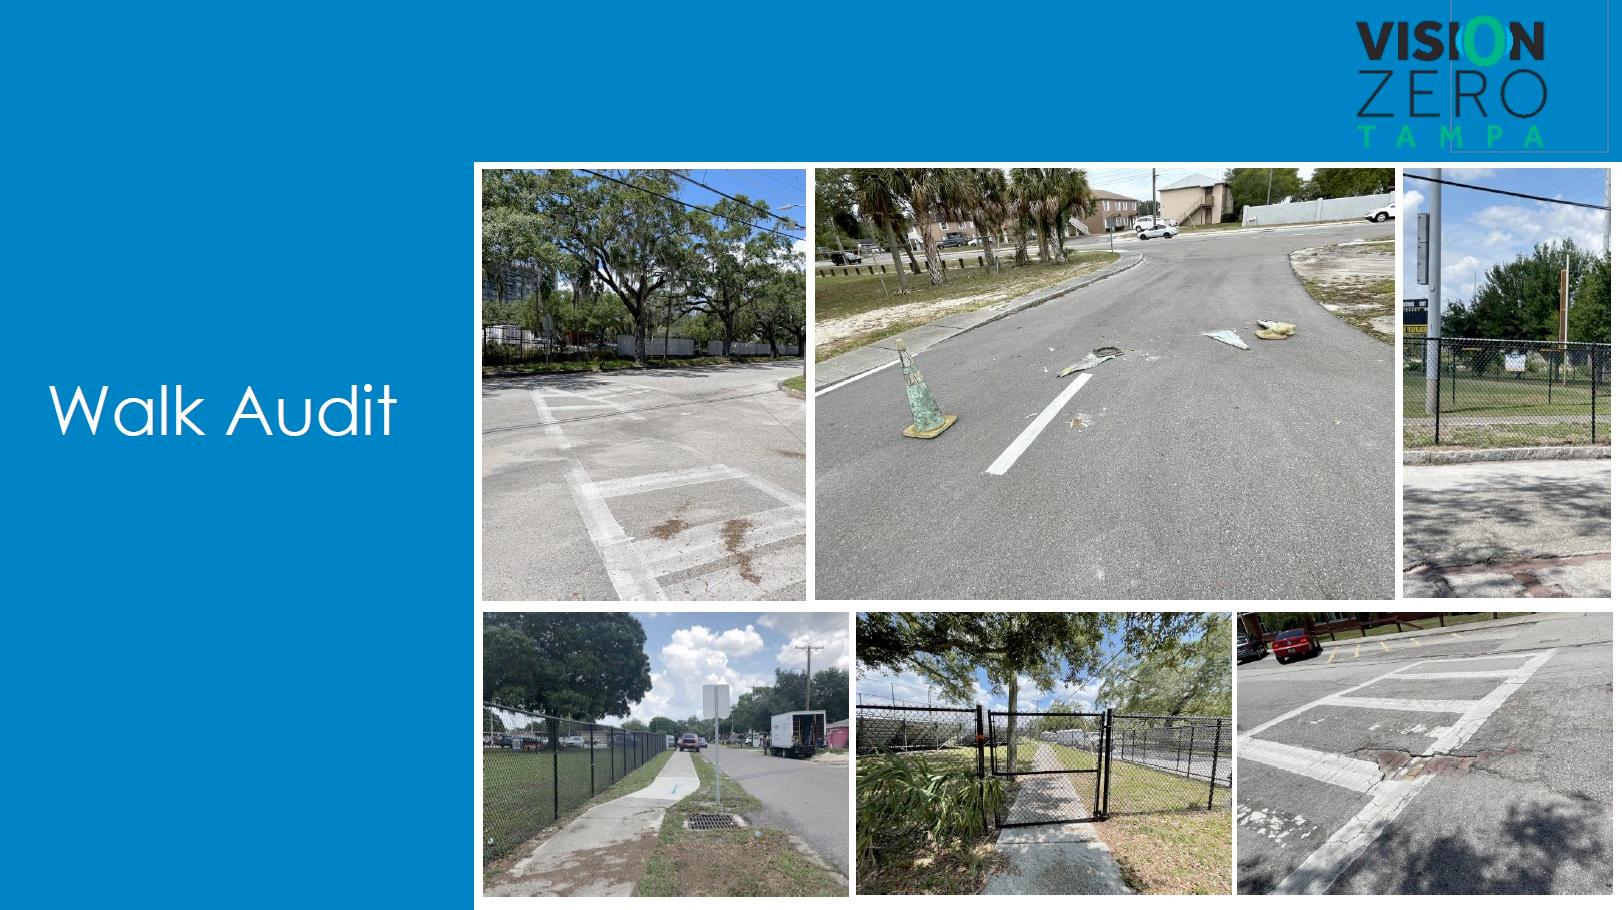
• Incomplete or poorly maintained
• Driver behavior
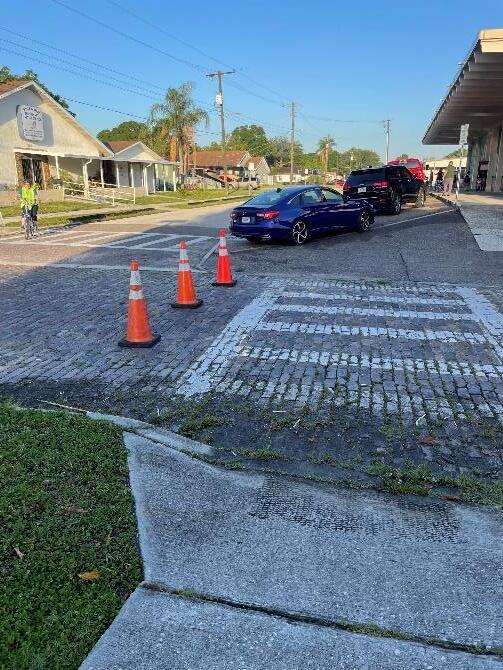
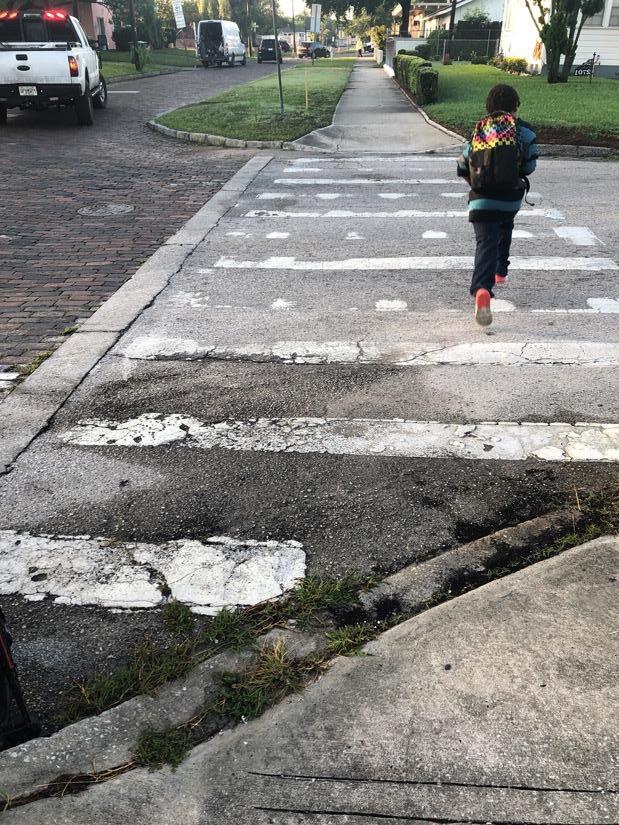
Faded
Crosswalk Markings
Cone fatalities
Inaccessible
Sidewalk
Sidewalk “jail”
Parents park ON sidewalk
Exposed Brick
Transportation Safety Audit
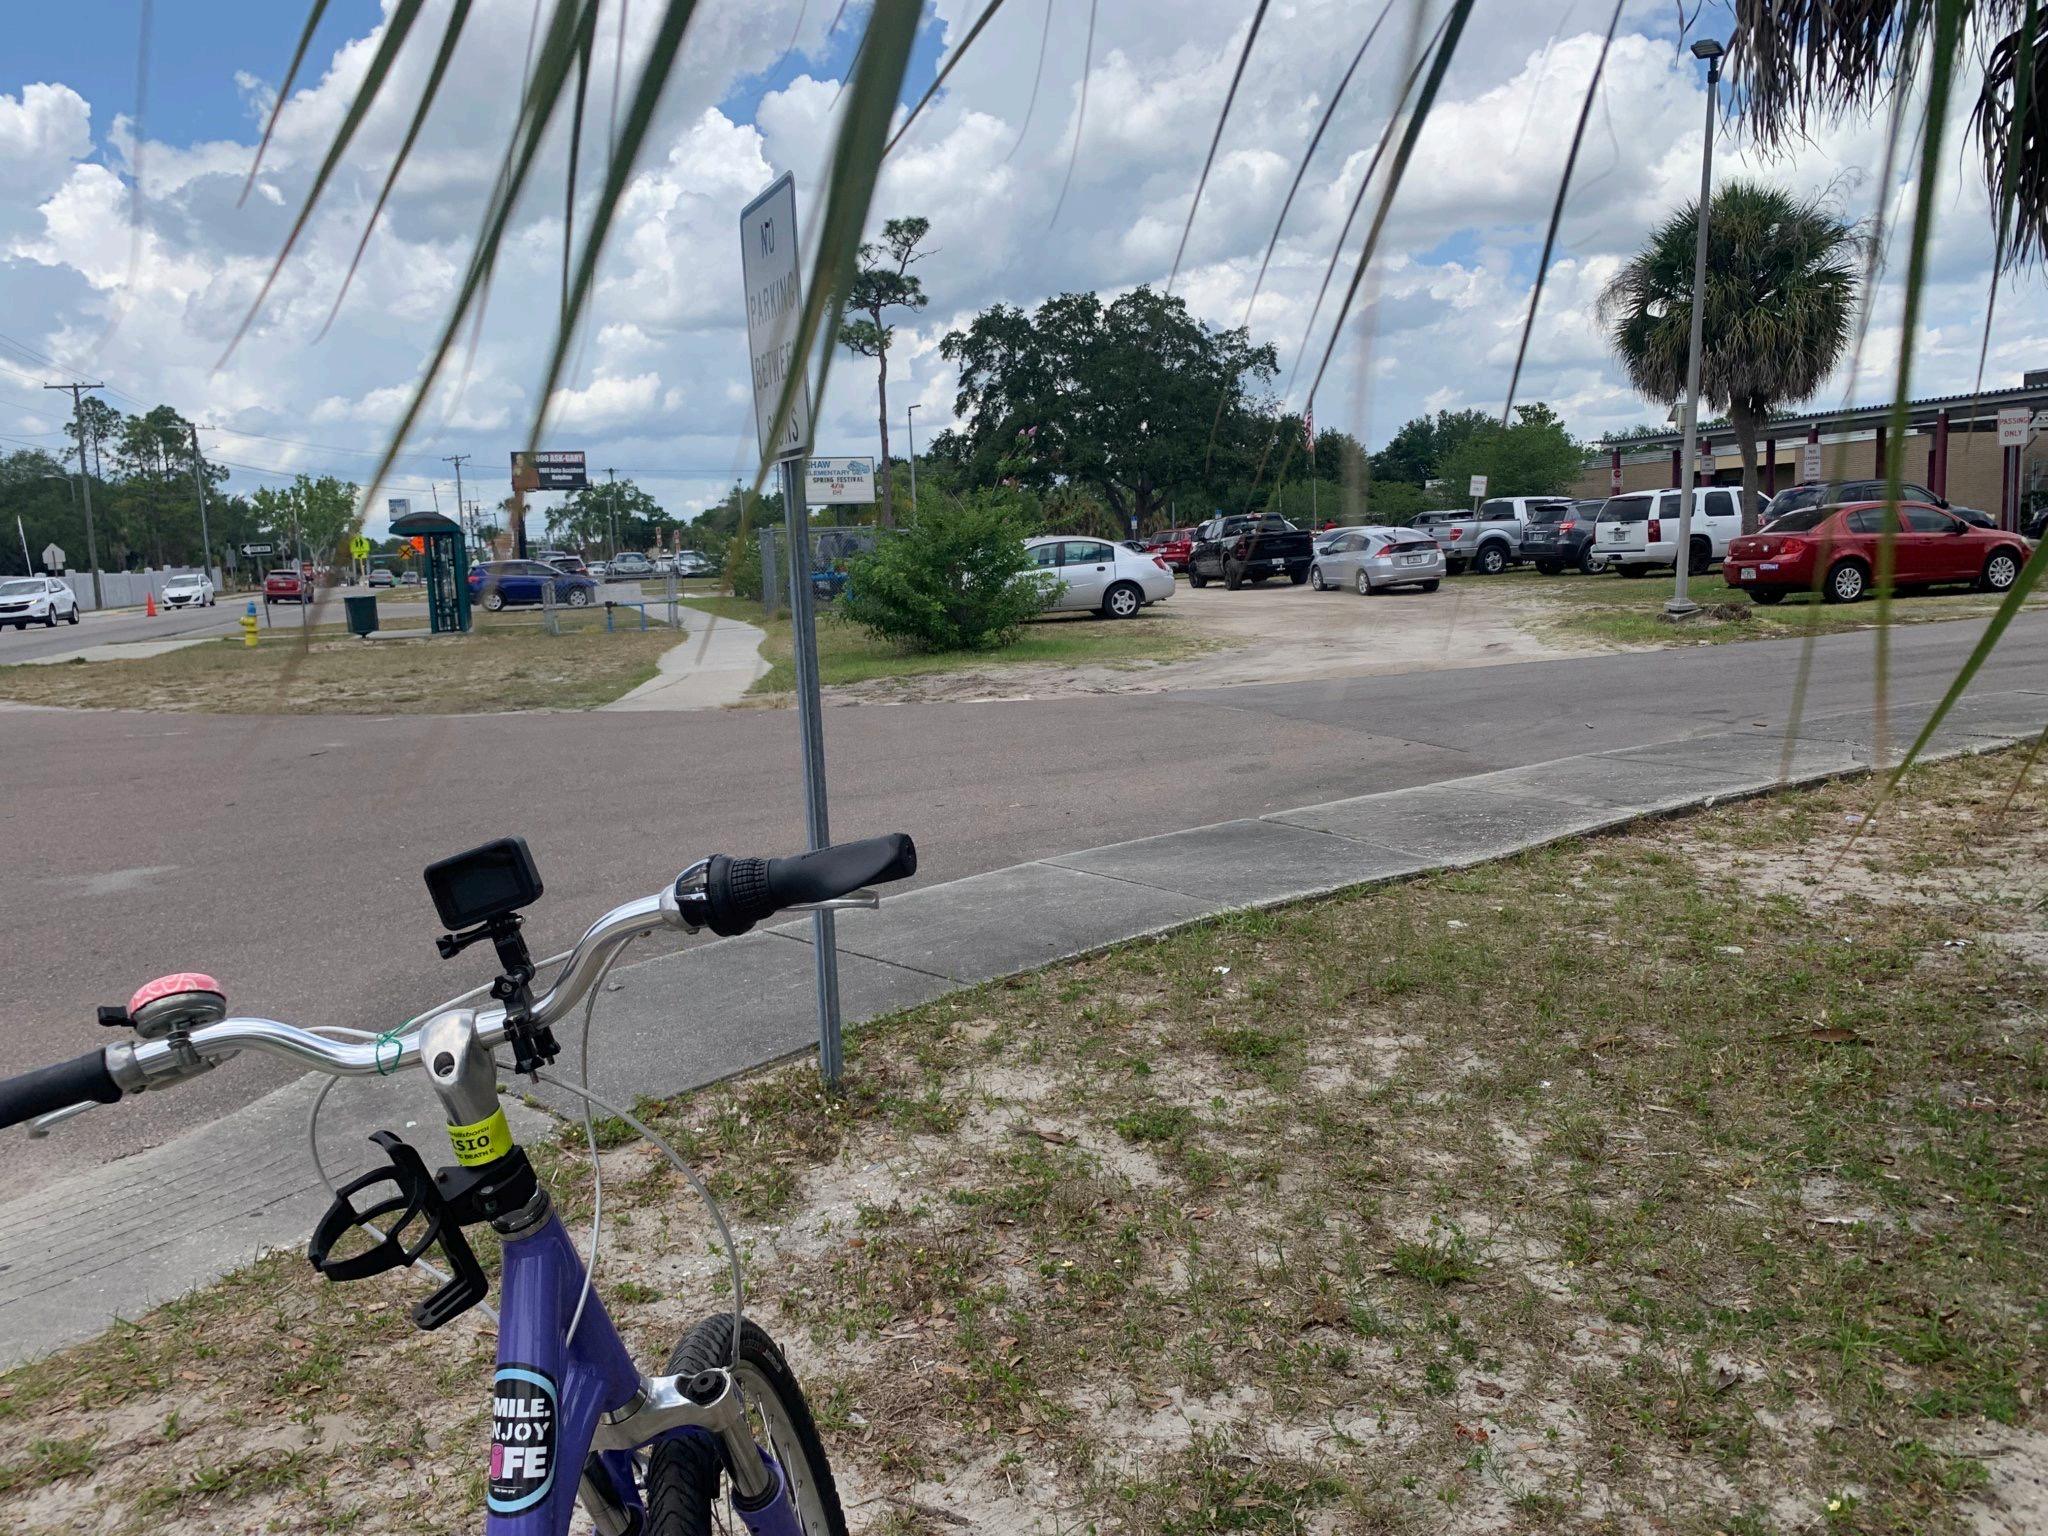
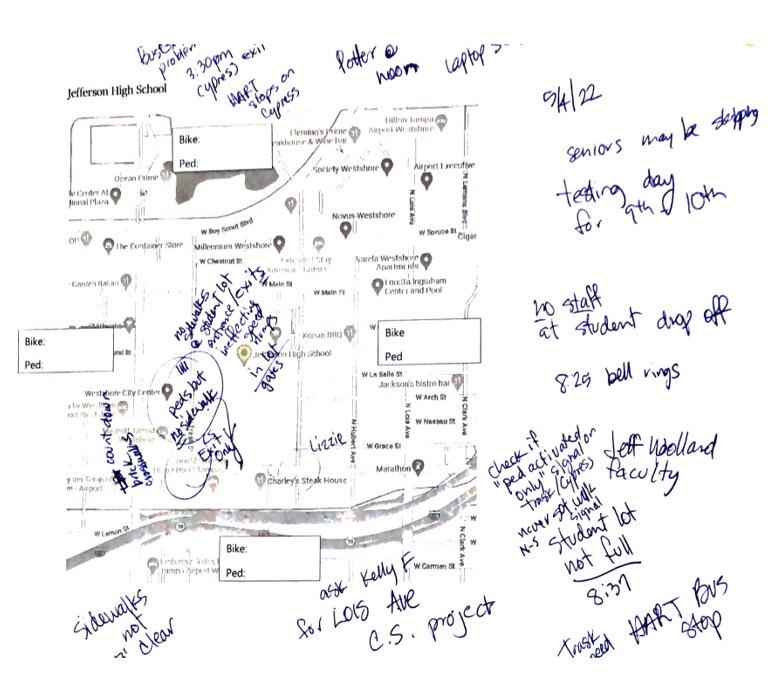
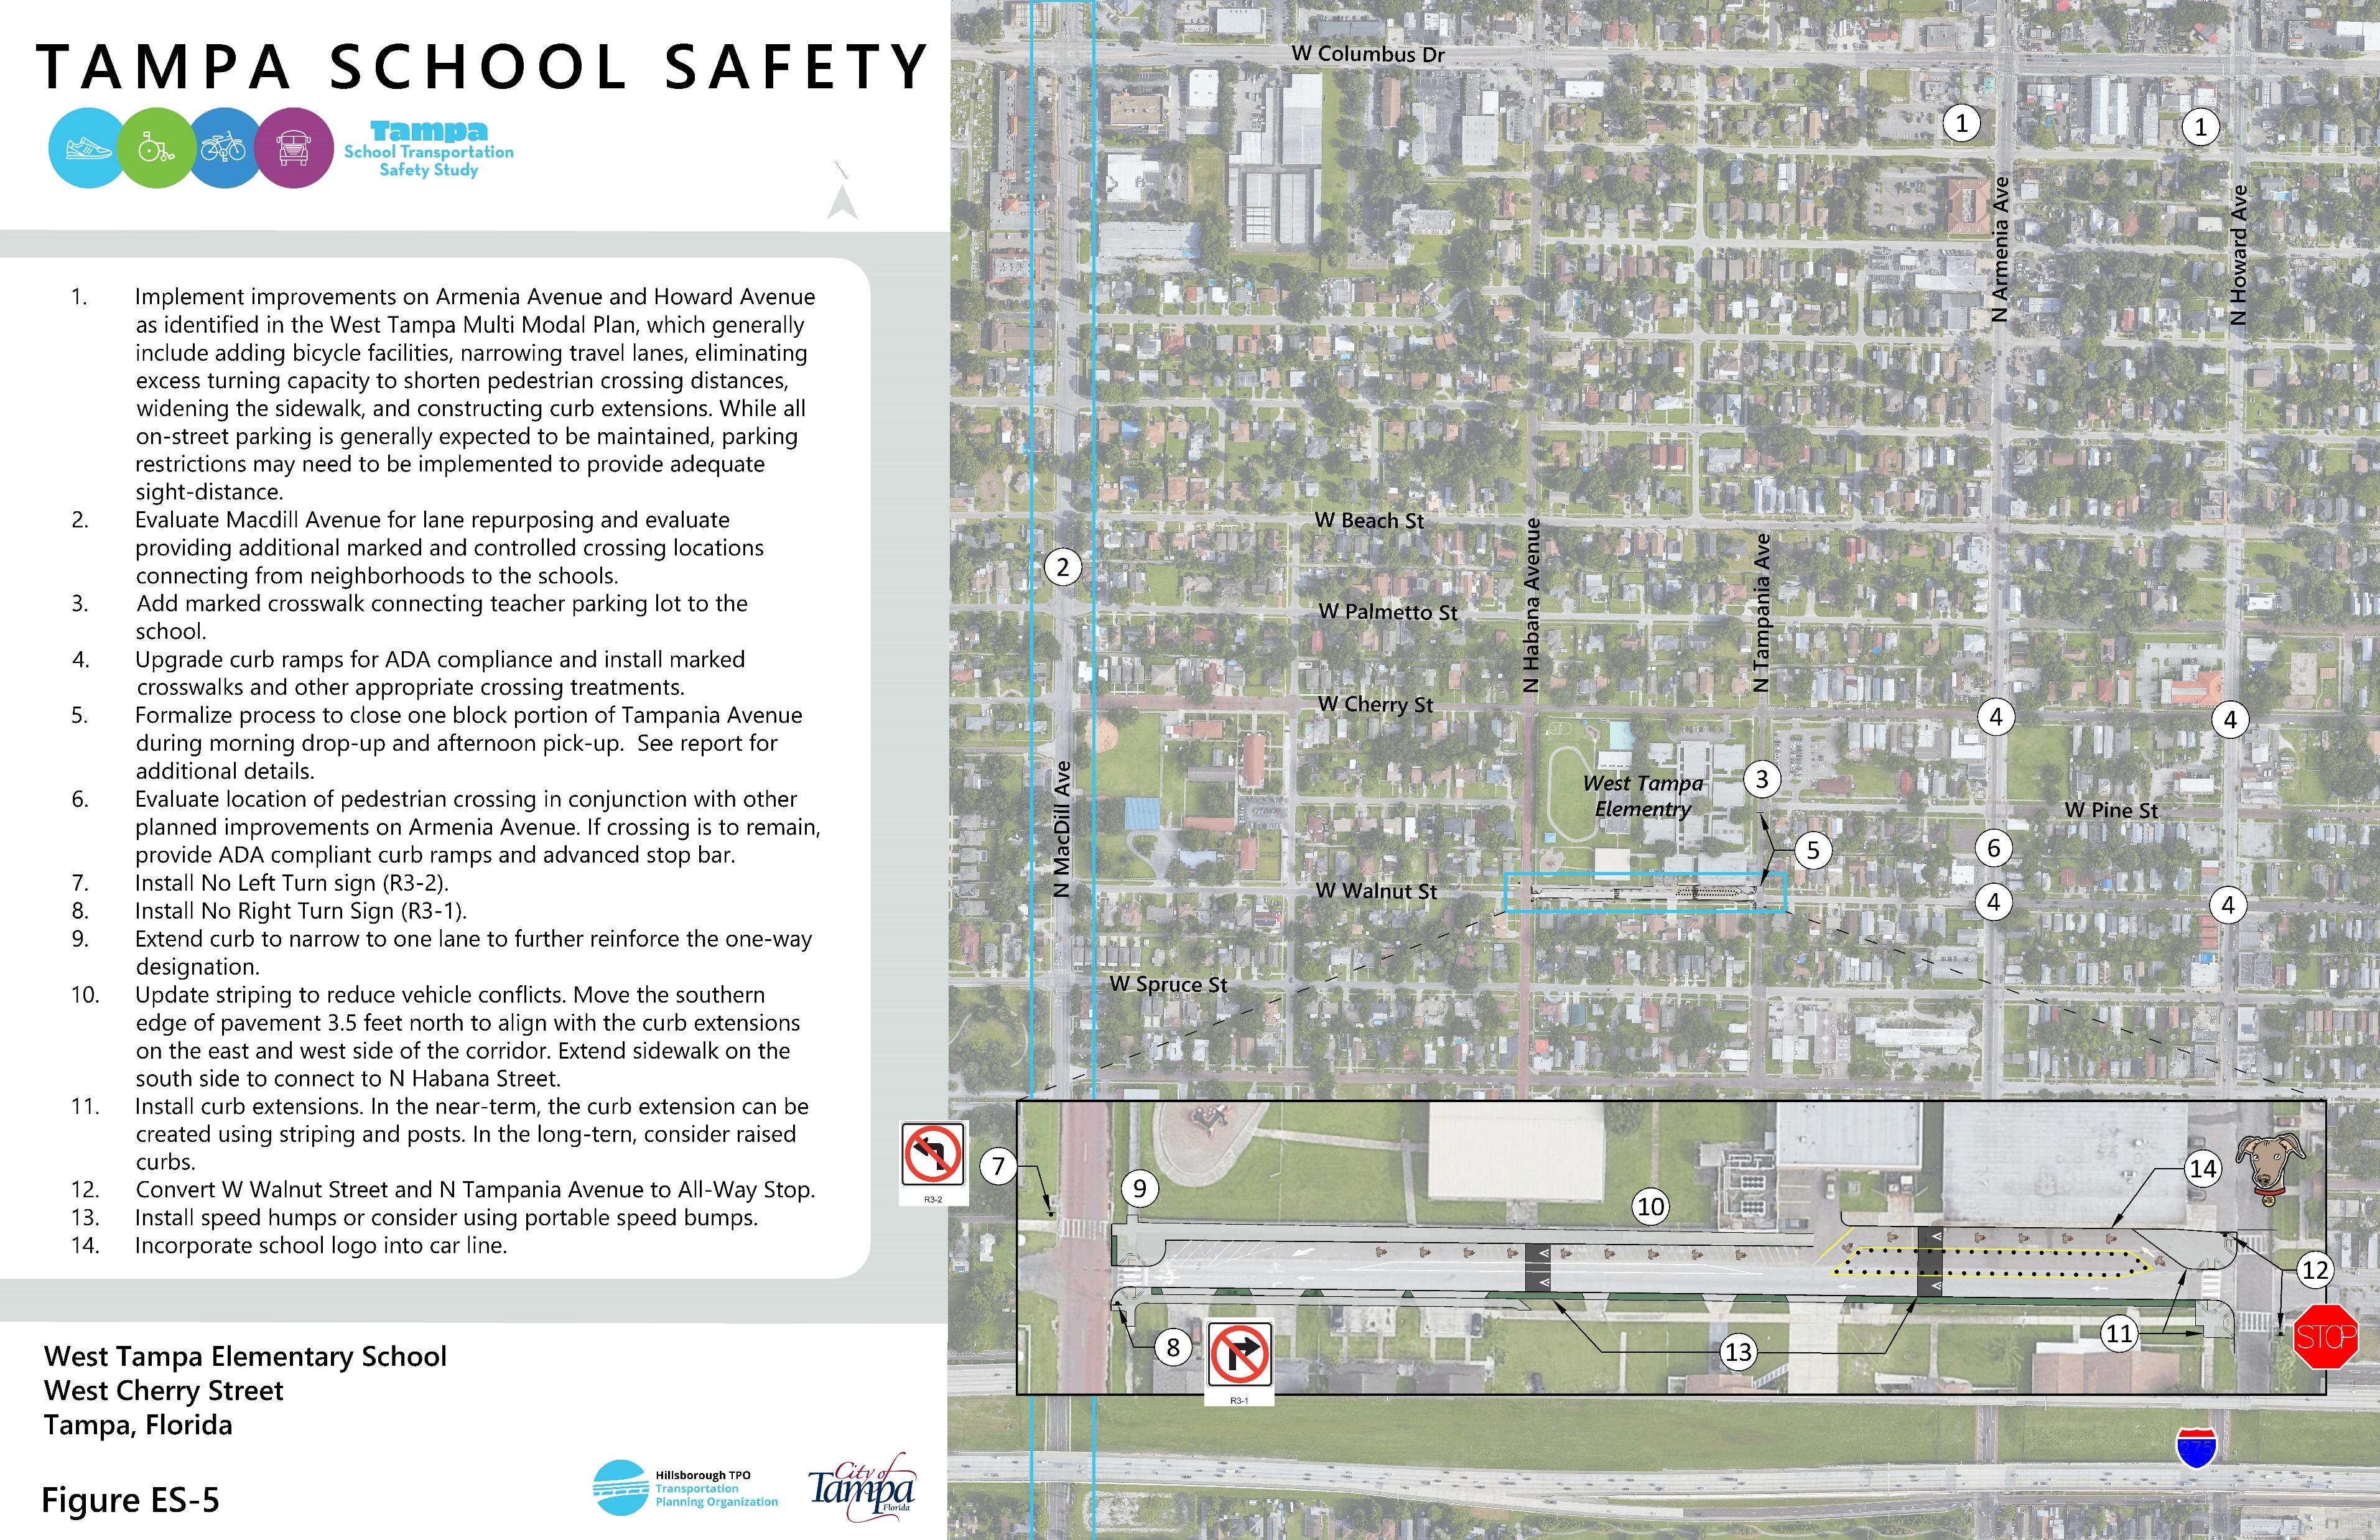
West Tampa Elementary
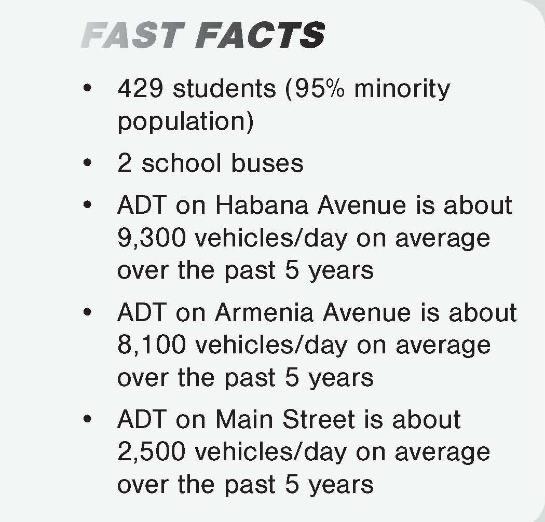
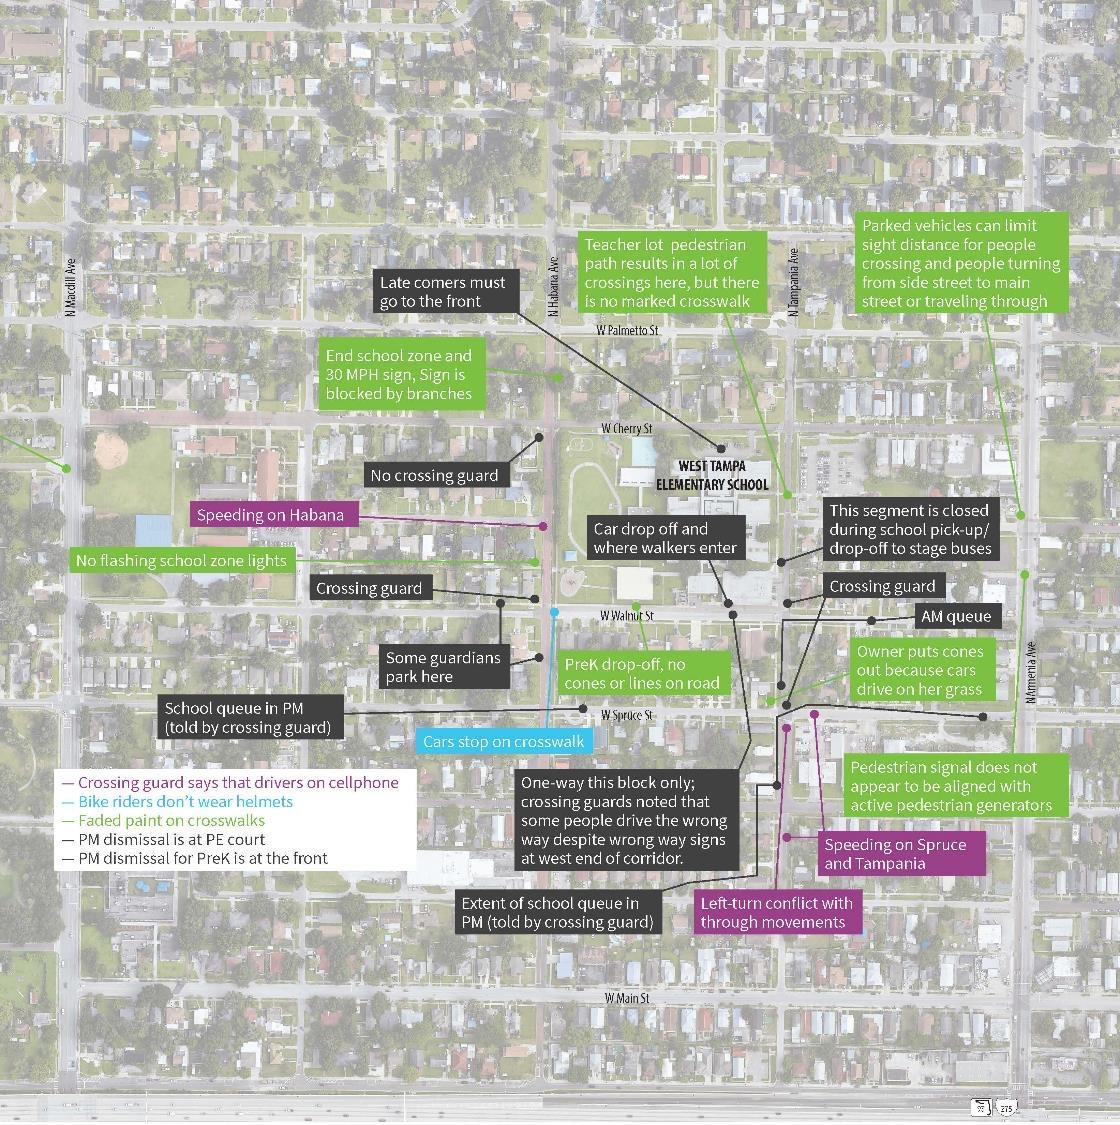
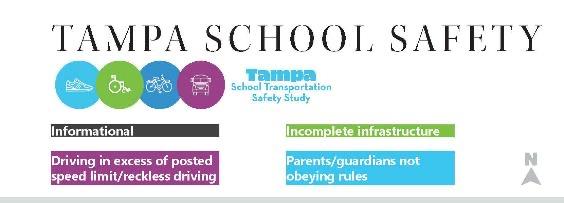
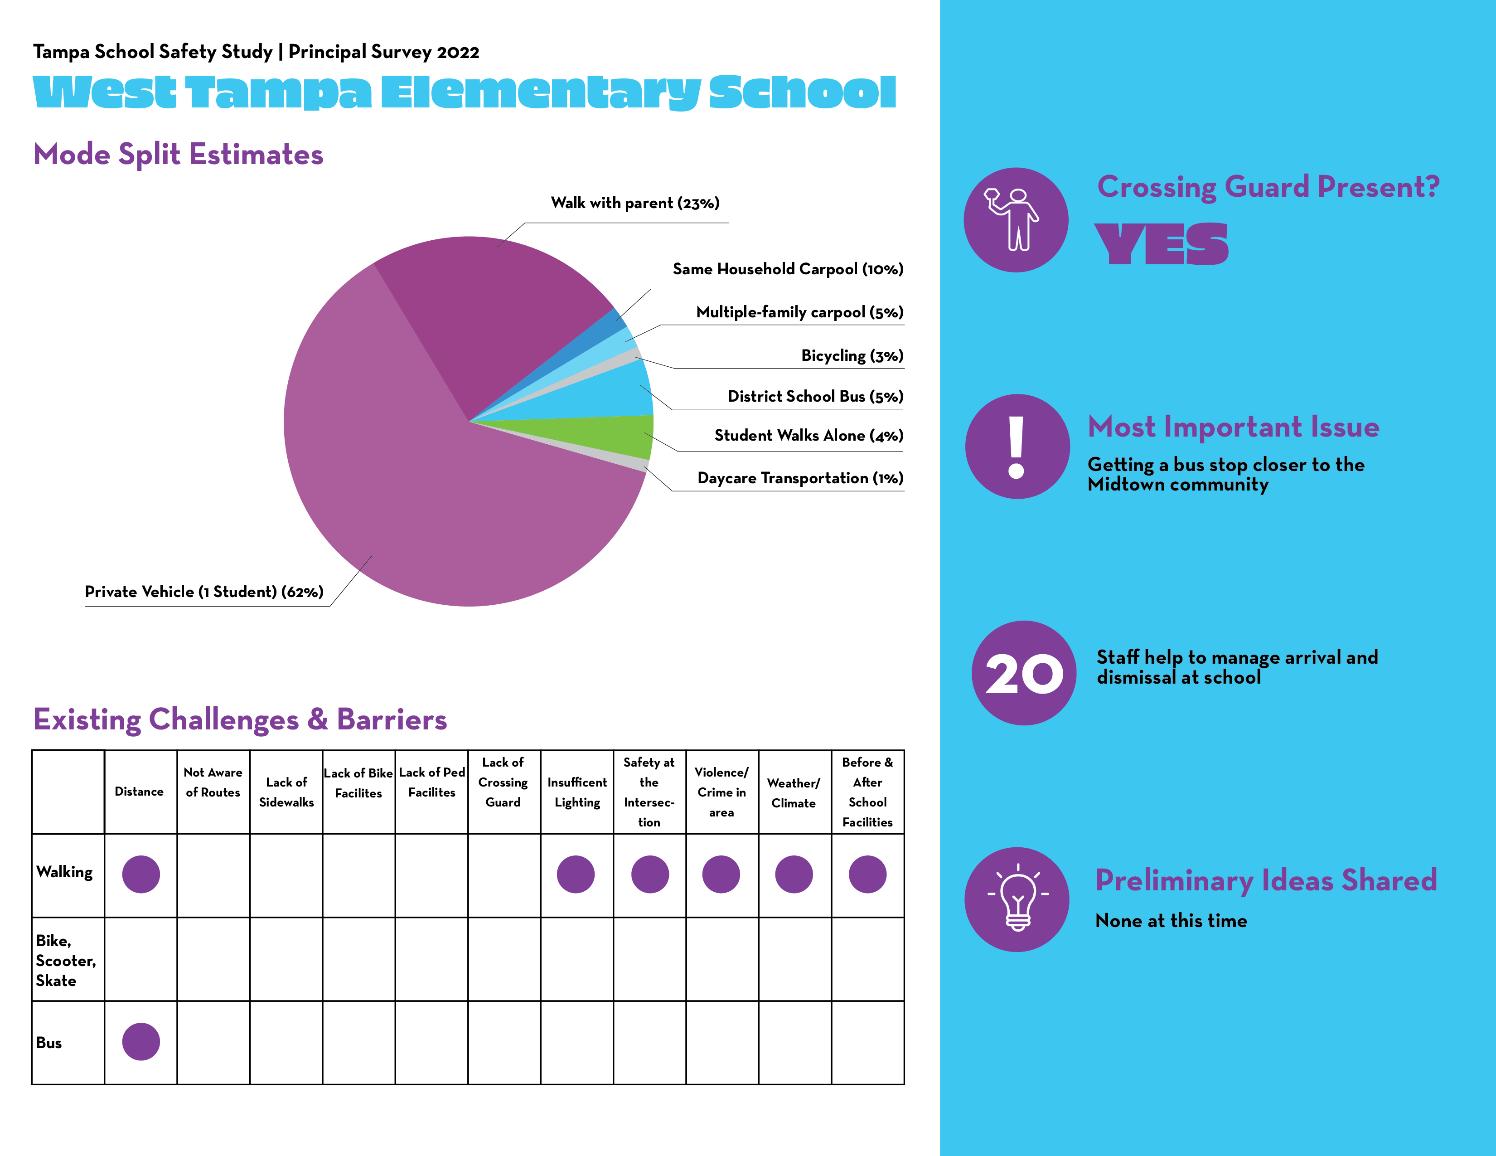
West Tampa Elementary – Survey Results
Family Survey
• Eight families completed survey, some with multiple children at the school
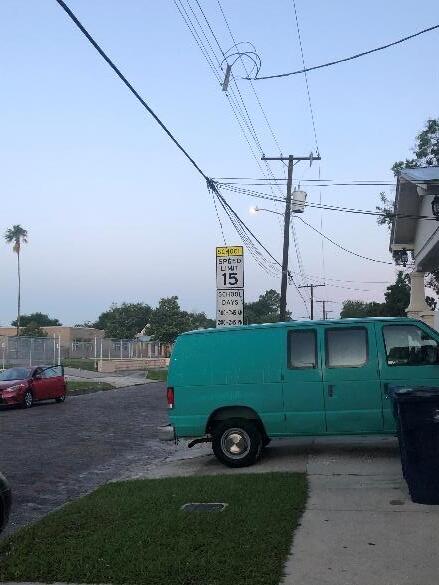
• These families represent:
• Personal vehicle
• Walks alone
• Walks with parent
• 75 percent would not feel comfortable allowing their child to walk in any grade
• Half cited distance as a barrier to walking to school
• Speed of traffic, the safety of intersections, and presence of crossing guards (lack of) are all factors that affect their decision to let their student walk / bike to school
• Some are also concerned about crime in the area
• Specific mention of challenges crossing Armenia and Howard, as well as parked cars on major streets impeding visibility when trying to cross
West Tampa Elementary Survey Results
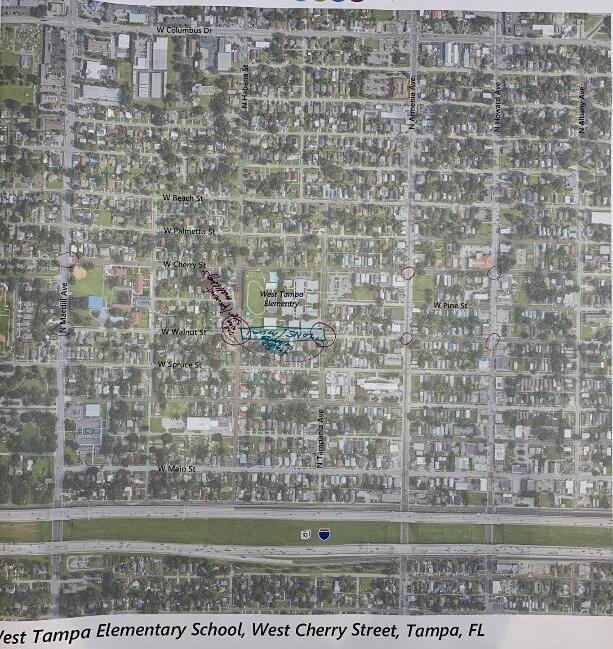
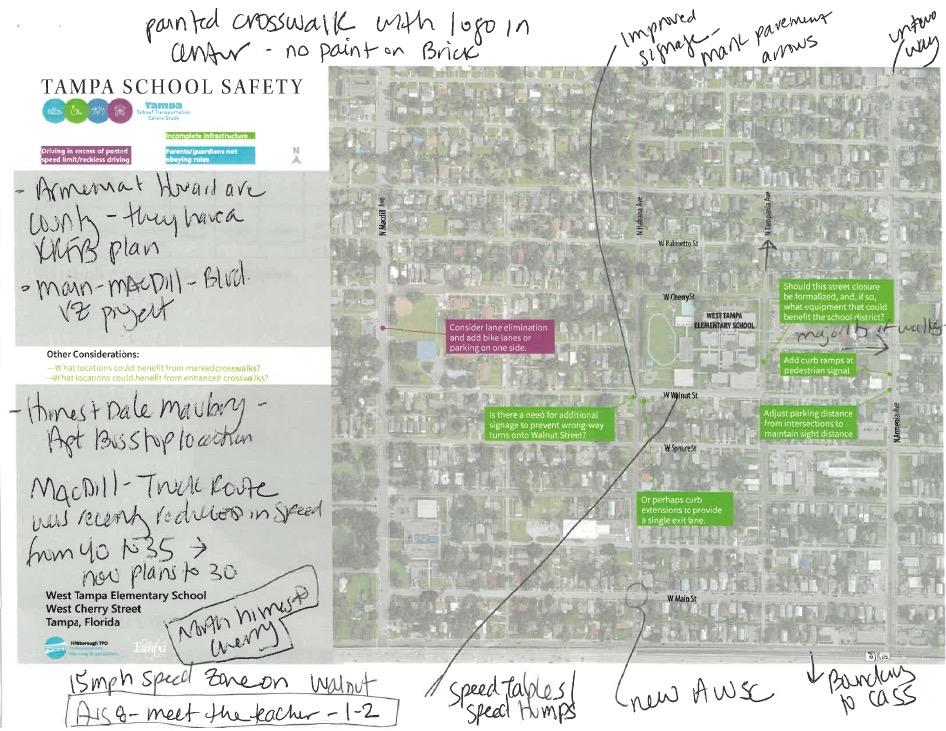
West Tampa Elementary (in person principal charrette)
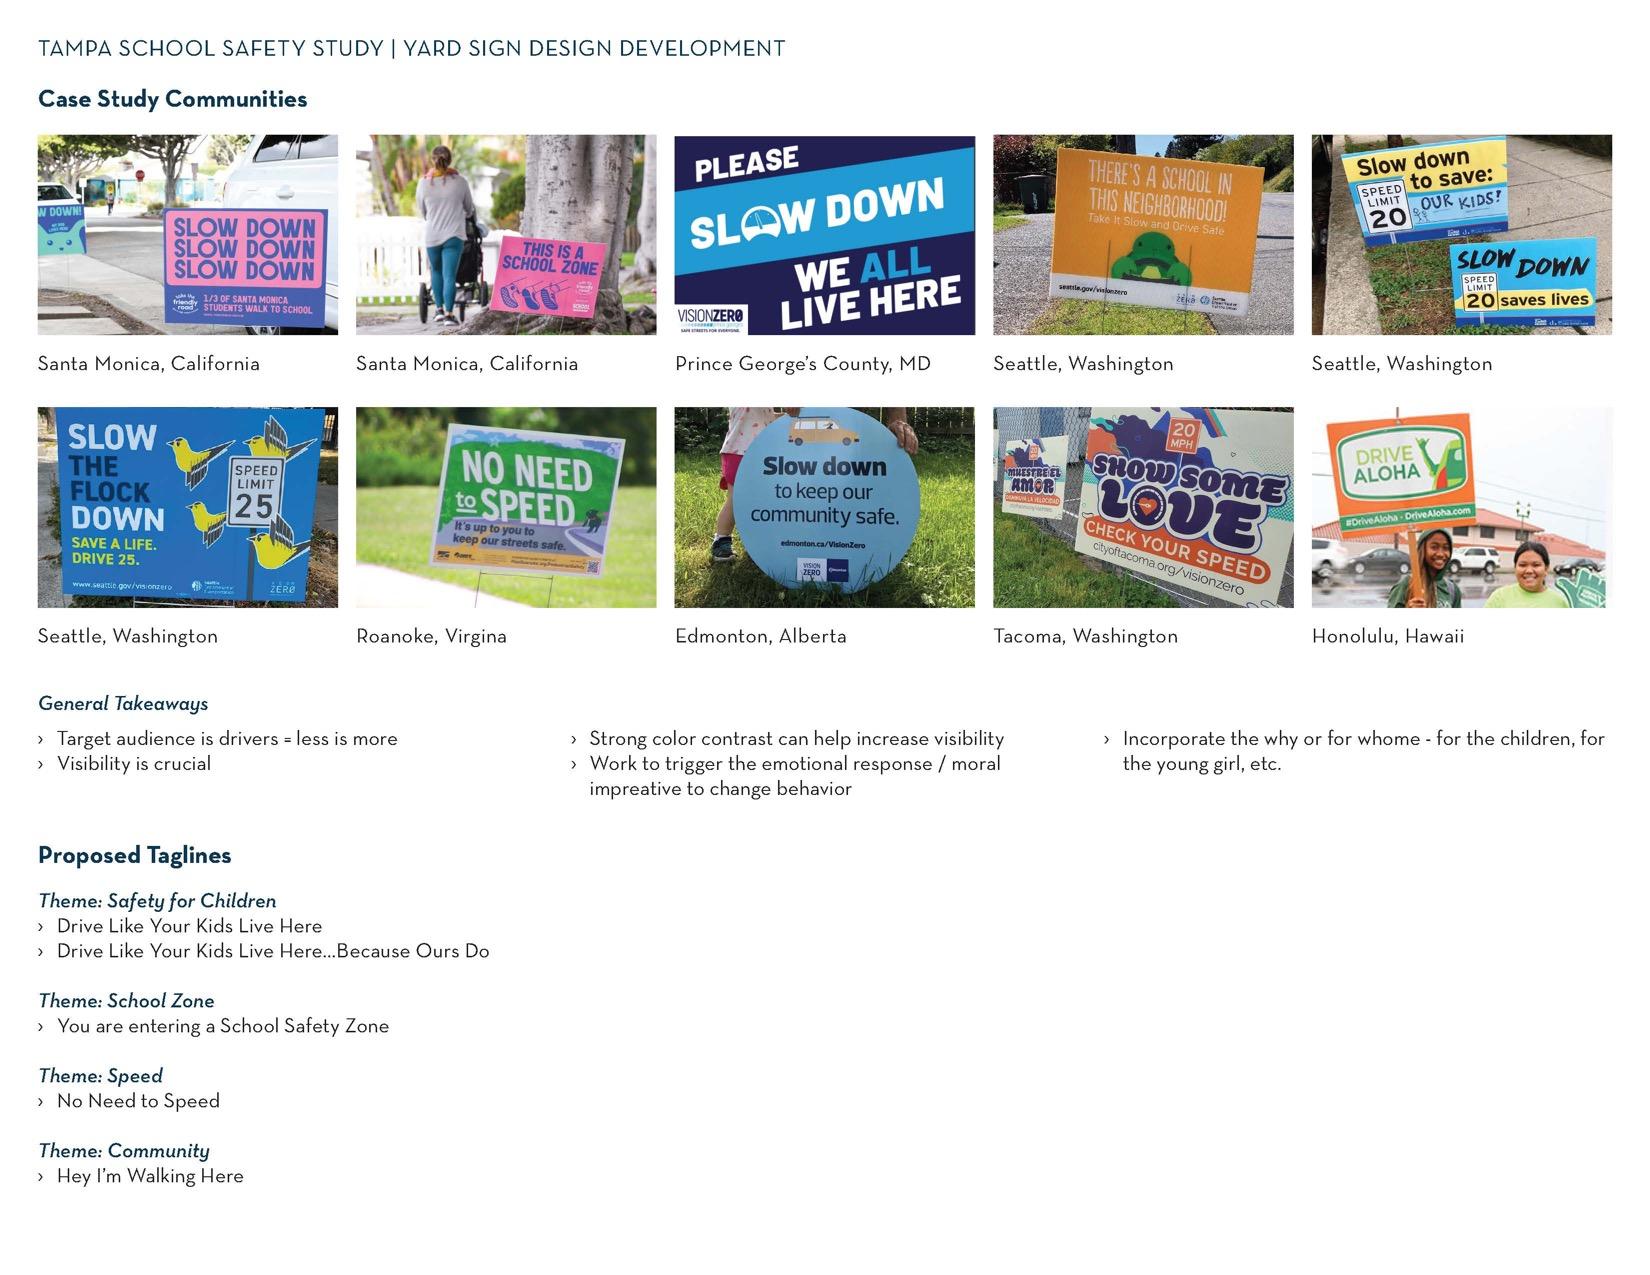
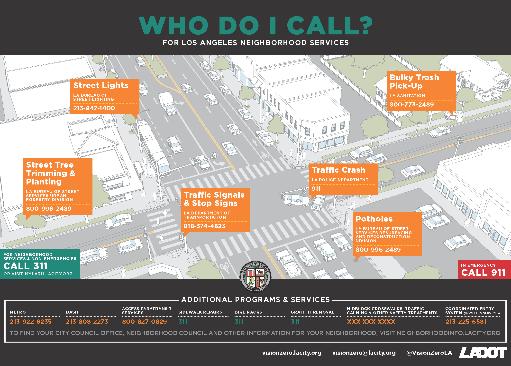
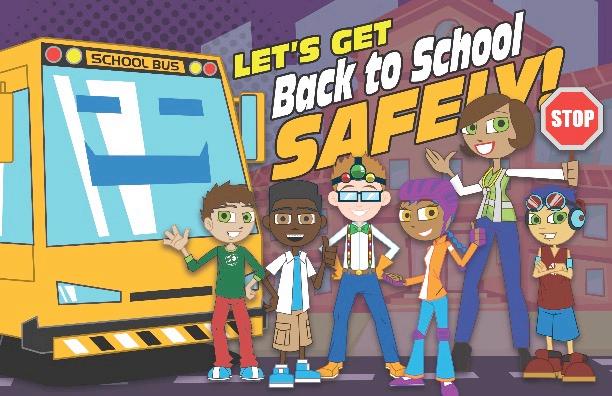
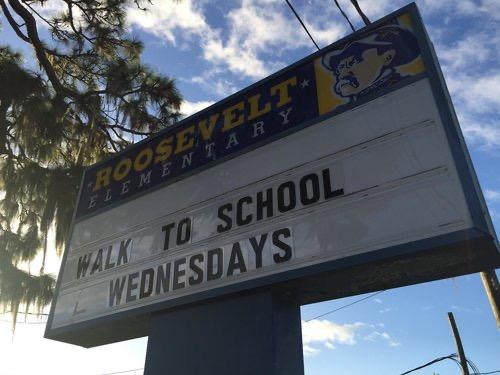
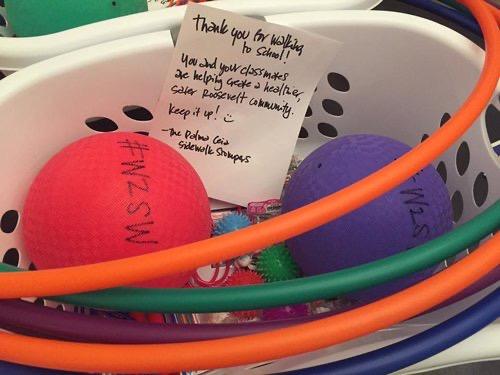
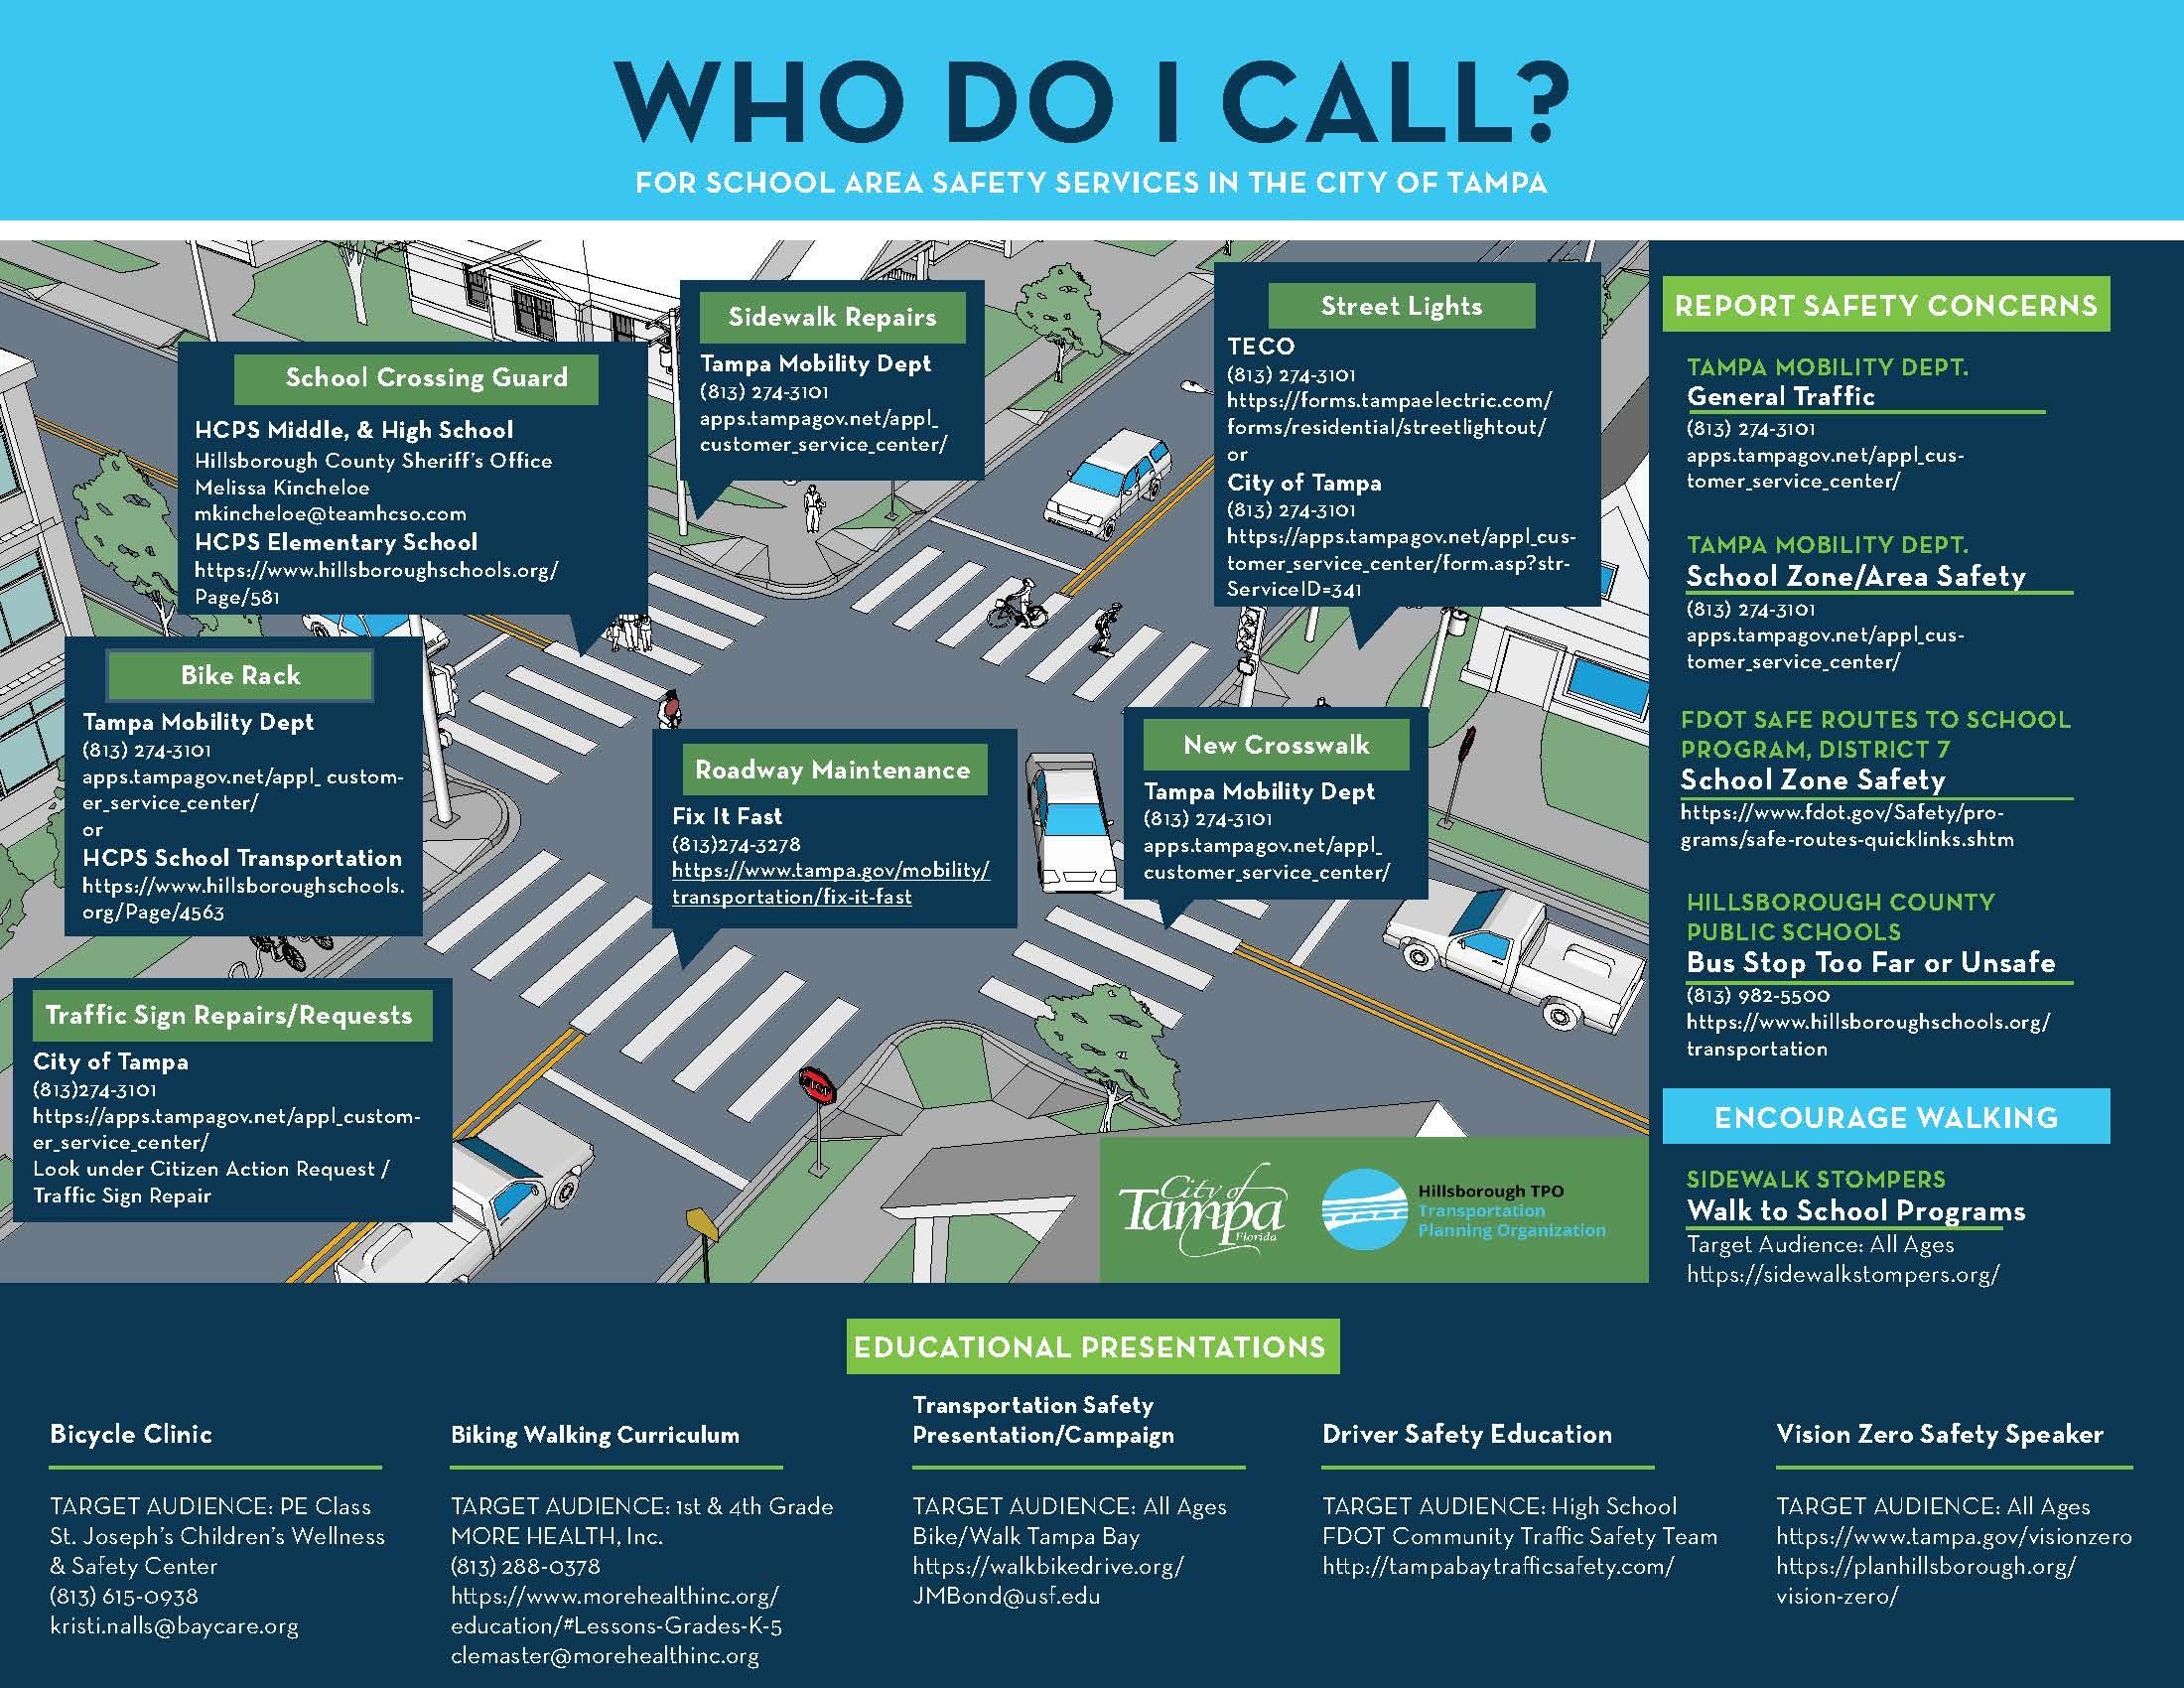
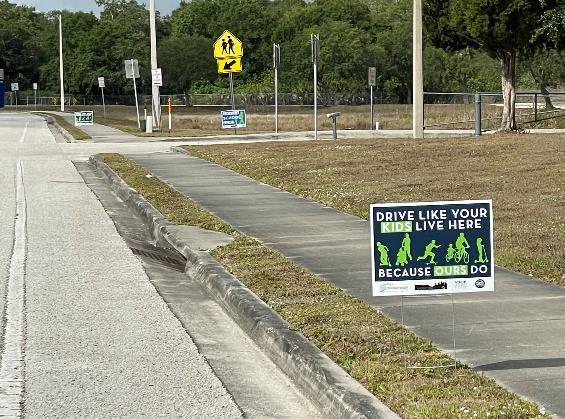
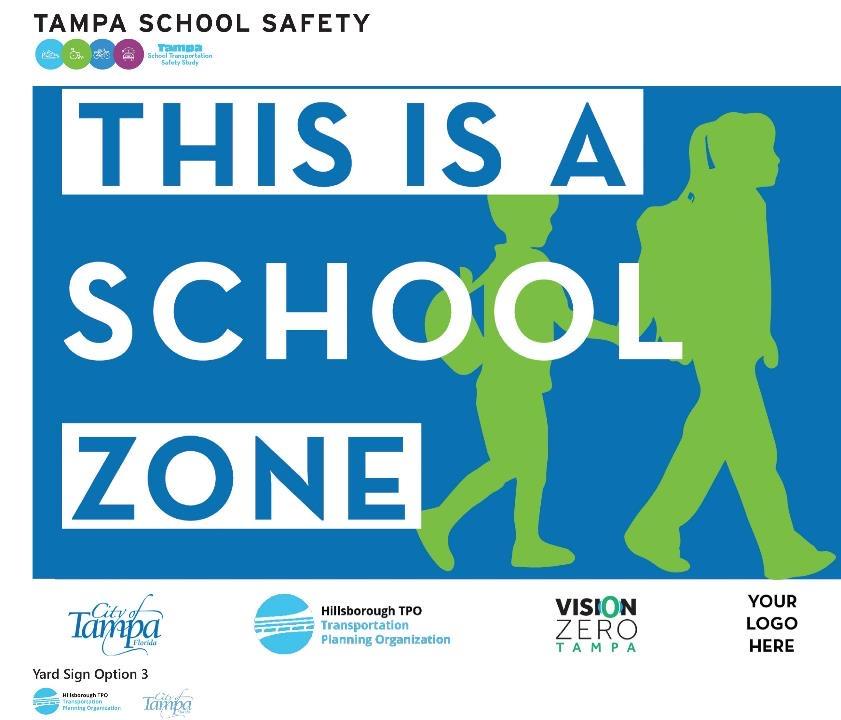
Encouragement and Educational Ideas
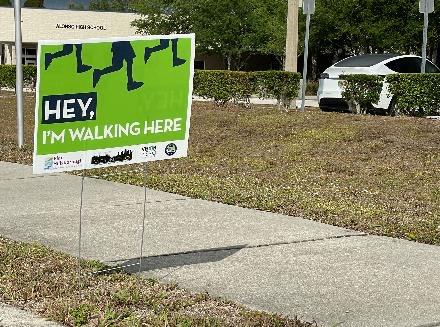
55
Funding Strategies


Other People’s Money
Good Repair and Resilience
Vision Zero
Smart Cities


Real Choices When Not Driving
Major Investments for Economic Growth


p l a n h i l l s b o r o u g h . o r g TPO funding UPWP/LRTP/TIP
TPO Actions to fund Vision Zero


Transportation Improvement Prioritizing for Safety


Vision Zero Performance Measures
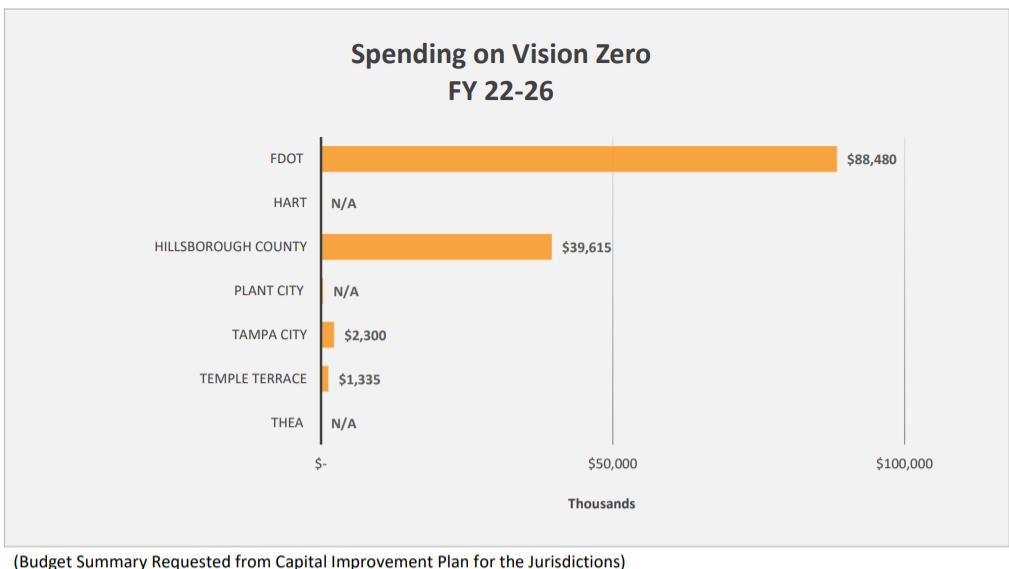
Goal: Reduce Fatal and Serious Injury Crashes
FY 2022-26 Total allocated by Jurisdictions - $27 million/ year
Trend Spending ($18m/year)
to complete about 5 miles of Complete Streets each year

To reduce 1% fatal & injury crashes per year for projects on the high-injury roads

p l a n h i l l s b o r o u g h . o r g
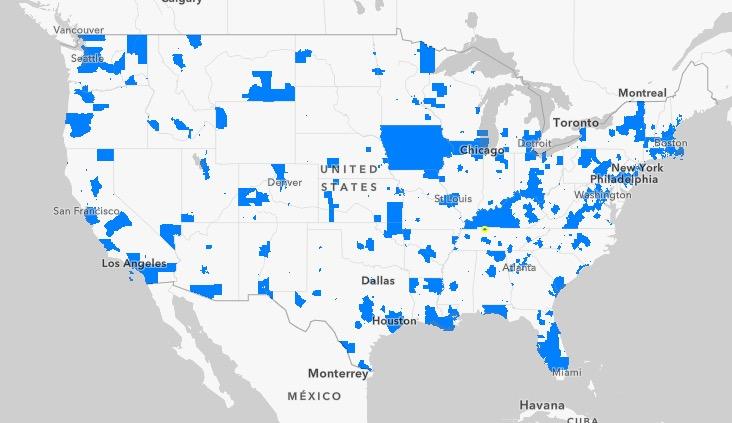
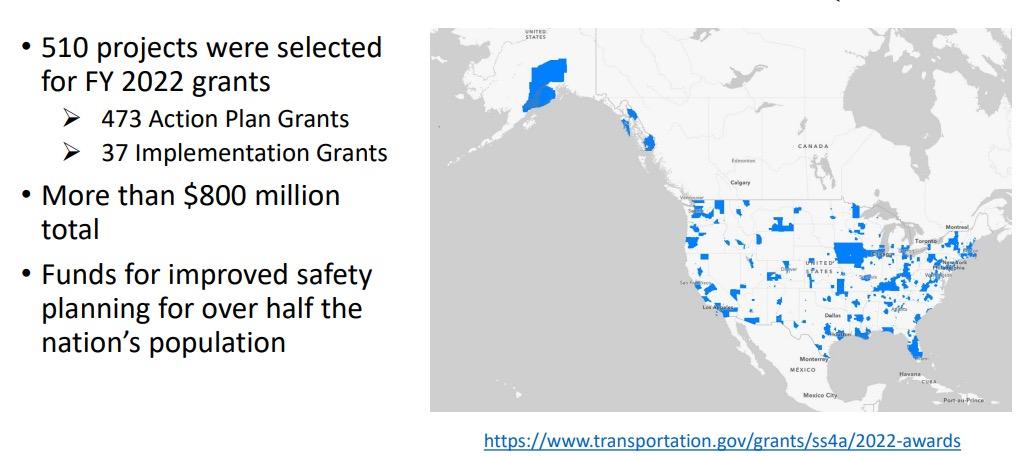
Nationally
FY 2022 Safe Streets for All Grant Awards




Funding Strategies


SS4A $20 million award each to City of Tampa and Hillsborough County success
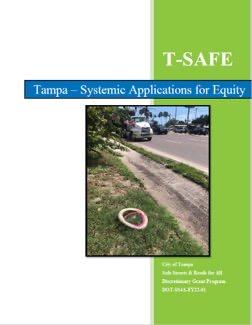
§ Action Plans and Studies complete
§ Grant Ready–cost estimates in scope
§ Focus on Quick Build of Safety projects on HIN
§Demonstrated 74% of funding spent on projects in underserved communities (equity built in)
§Implementation of studies near parks and schools! #saferoutestoplaces
61 Other People’s Money
Alana Brasier, AICP abrasier@nacto.org
Lisa K Silva, PLA, AICP, Project Manager, Hillsborough TPO silval@plancom.org

Kathrin Tellez, AICP, PTP, RSP2B, Fehr & Peers k.tellez@fehrandpeers.com


Questions? Contact us!


 Alana Brasier, AICP, Safe Streets guru
Lisa K Silva, PLA, AICP, Project Manager
Kathrin Tellez, AICP, PTP, RSP2B, Principal


