Periodico mensile registrato presso il Tribunale di Firenze al n. 6215 in data 10/03/2025
Iscrizione al ROC n. 42813
Spedizione in Abbonamento Postale Aut. n° CN-NE/00754/04.2025
Art Direction and layout Pilar Roca – pilarroca.com
Printer
Faenza Printing Via Vittime Civili di Guerra, 35 48018 Faenza (RA), Italy
All rights of reproduction and translation of the published articles are reserved. Any reproduction, even partial, is strictly prohibited without the publisher’s prior written authorization. All content is protected under copyright law. The editorial board assumes no responsibility for the opinions expressed by the authors of editorial and advertising texts.
Zootecnica ensures the confidentiality of personal data collected for subscriptions and purposes related to specialized publishing, in compliance with the General Data Protection Regulation (GDPR – EU Regulation 2016/679). Subscribers have the right to access, modify, or delete their personal data by submitting a written request to the publisher. Personal data will not be shared with third parties without explicit consent.
Scan to visit our website
EDITORIAL
➤ Marianna Caterino
Animal welfare has become one of the key parameters for assessing the quality of poultry production systems. It is no longer just an ethical or regulatory matter, but a factor closely linked to animal health, productive performance, and the overall sustainability of the supply chain.
The article in this issue dedicated to welfare indicators for laying hens and broilers makes a valuable contribution by addressing the topic from both a scientific and practical perspective. It highlights the importance of an integrated approach that combines structural, management‑related, and animal‑based indicators. Direct observation of the animals, together with an assessment of the environment and management practices, is what enables a truly objective and realistic assessment of welfare conditions on the farm.
In an increasingly complex production context, animal welfare cannot be reduced to a single requirement; rather, it must become an integral part of everyday decision‑making. Investing in reliable assessment tools helps improve rearing conditions, prevent critical issues, and strengthen the technical and economic sustainability of the poultry sector.
FEBRUARY 2026
NEWS
REPORTAGE
EU poultry sector outlook to 2035: production, consumption and trade trends
REPORT
EFSA annual report on avian influenza
TECH COLUMN
Impact of hatchery climate control and ventilation on hatchability and post hatch chick quality
MANAGEMENT
How to correctly load incubators with eggs from different flocks
DOSSIER
Adding value into the poultry food chain
FOCUS
Welfare indicators for hens and chickens
MARKETING
The dynamics of global meat production. An analysis of the period from 2000 to 2023 — Part 1
MANAGEMENT
On farm hatching: an innovative early feeding strategy that improves welfare and reduces antimicrobial use in a sustainable way
VETERINARY
Continuous monitoring and control of mycoplasma for sustainable poultry production
MARKET GUIDE UPCOMING EVENTS
INDONESIA INTRODUCES NEW ANIMAL WELFARE REGULATION FOR LAYING HENS
Indonesia has approved a new national regulation aimed at improving animal welfare standards in egg production, marking a significant step for one of Asia’s largest poultry-producing countries. The regulation, supported by the Indonesian Ministry of Agriculture, introduces minimum welfare requirements for laying hens and promotes a gradual transition away from conventional cage systems.
The new framework aligns Indonesia with a broader global trend toward cage free egg production, already well established in Europe and increasingly adopted in North America and parts of Asia. According to the Lever Foundation, which has been actively involved in supporting the transition, the regulation is expected to contribute to improved animal welfare, reduced disease pressure and enhanced food safety outcomes.
Indonesia is a key player in the global egg sector, producing more than 5 million tonnes of eggs annually. Changes in production standards in such a large market are therefore closely monitored by international stakeholders, including food companies, retailers and food service operators with global supply chains. Several multinational companies operating in Indonesia have already made commitments to source cage free eggs as part of their global animal welfare policies.
Beyond welfare considerations, the regulation also highlights potential links between production systems, antimicrobial use and food safety. Cage free systems, when properly managed, are increasingly viewed as part of integrated strategies to improve flock health and reduce reliance on antibiotics, although they also require careful management to control biosecurity risks.
For international poultry professionals, Indonesia’s decision represents an important signal of how welfare driven regulations are expanding beyond traditional Western
markets. While the transition poses technical, economic and management challenges, it also reflects growing alignment between animal welfare expectations, market requirements and long term sustainability goals.
The Indonesian regulation is expected to be implemented progressively, giving producers time to adapt housing systems and management practices. Its development will be closely watched as a case study for other emerging markets considering similar policy paths.
BRAZILIAN CHICKEN EXPORTS HIT RECORD HIGHS IN 2025 AMID AVIAN FLU RESILIENCE
Brazil’s poultry sector ended 2025 on a high note, with chicken meat exports achieving an unprecedented record that validated the optimistic projections from the Brazilian Association of Animal Protein (ABPA). The country exported a total of 5.324 million tonnes, marking a 0.6% increase from the 5.294 million tonnes shipped in 2024, reinforcing Brazil’s position as the world’s top chicken exporter. Despite a slight revenue dip of 1.4% to US$9.79 billion from US$9.928 billion the previous year — attributable to softer global pricing and currency fluctuations — the volume milestone underscores the industry’s operational strength and unwavering buyer demand across diverse markets.
The final stretch of the year exemplified this momentum, particularly in December, when exports surged 13.9% year over year to 510.8 thousand tonnes, generating US$947.9 million in revenue. This strong close highlighted the sector’s ability to capitalize on seasonal demand peaks and restored market access. Leading destinations played a pivotal role in this success. The United Arab Emirates topped the list with 479.9 thousand tonnes, up 5.5%, reflecting sustained appetite in the Middle East. Japan followed with 402.9 thousand tonnes, a marginal 0.9% decline but still a vital anchor market due to its rigorous quality standards. Saudi Arabia imported 397.2 thousand tonnes, boasting a 7.1% gain, while South Africa contributed 336 thousand tonnes with a 3.3% rise. The Philippines rounded out the top performers at 264.2 thousand tonnes, surging 12.5% and signalling robust growth in Southeast Asia. This performance gains even greater significance against the backdrop of Brazil’s first commercial outbreak of highly pathogenic avian influenza (HPAI), which emerged as a major test for the industry. The incident prompted temporary trade restrictions from discerning partners like the European Union and China, yet Brazil’s swift response — bolstered by advanced biosecurity measures, rapid containment, and transparent reporting — facilitated quick reopenings. Notably, EU import volumes rebounded dramatically by 52% in December, a testament to restored confidence in Brazil’s traceability systems and veterinary protocols. Such agility not only minimized disruptions but also enhanced Brazil’s competitive edge over rivals facing similar outbreaks elsewhere in the Americas and Europe. ABPA President Ricardo Santin celebrated these results as evidence of the sector’s "remarkable adaptability and strategic foresight." He attributed the success to years of investment in production capacity expansions, feed efficiency improvements, and sustainable practices that align with global ESG expectations. These efforts have
positioned Brazil to meet rising international demand for affordable, high quality protein, especially as consumers worldwide shift toward poultry amid inflation pressures on red meats.
Looking ahead to 2026, the outlook remains bright. Favourable real exchange rates, anticipated global protein consumption growth, and deepening ties with emerging markets in Africa and Asia are expected to propel volumes beyond 5.5 million tonnes. Brazil’s diversified portfolio — spanning traditional strongholds and new frontiers — provides a buffer against geopolitical risks, protectionist policies, and supply chain volatilities like feed cost spikes from climate events.
For professionals in poultry and livestock, such as content managers tracking avian health and trade trends, these developments signal stability and opportunity. They affirm the value of ongoing innovations in flock management, disease surveillance, and logistics, while highlighting Brazil’s role in feeding a growing planet. As the industry eyes further milestones, stakeholders can draw confidence from a track record of turning challenges into triumphs.
EU POULTRY SECTOR OUTLOOK TO 2035: PRODUCTION, CONSUMPTION AND TRADE TRENDS
According to the EU Agricultural Outlook 2025-2035, poultry and eggs are the only meat sectors in the European Union projected to expand in both production and consumption over the coming decade, despite persistent uncertainty linked to animal disease outbreaks and geopolitical factors.
Poultry meat production
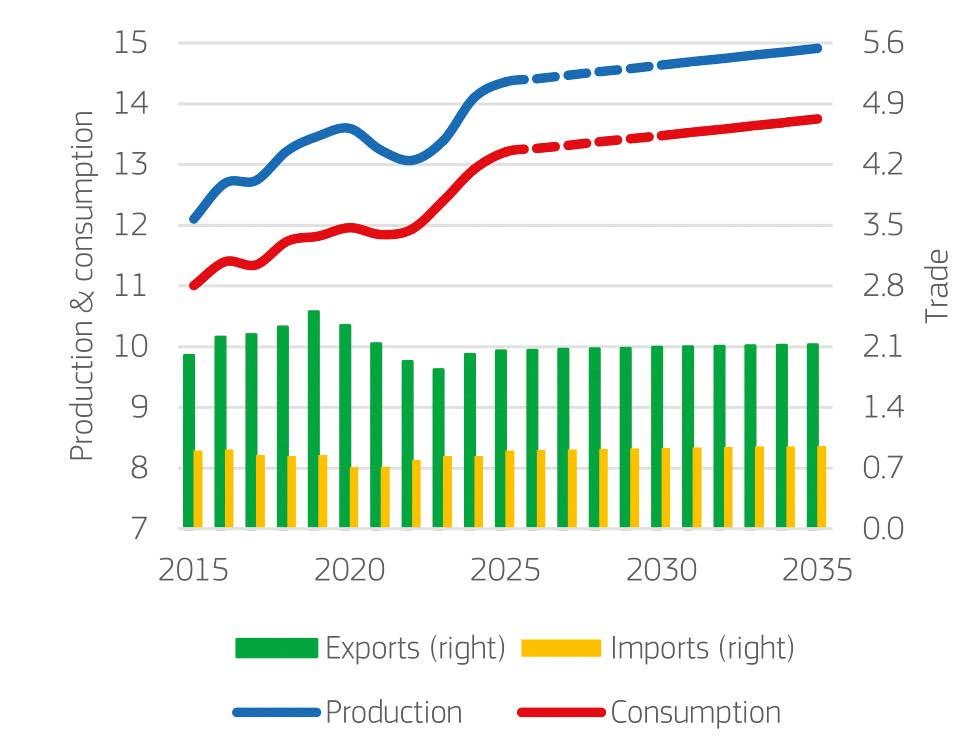
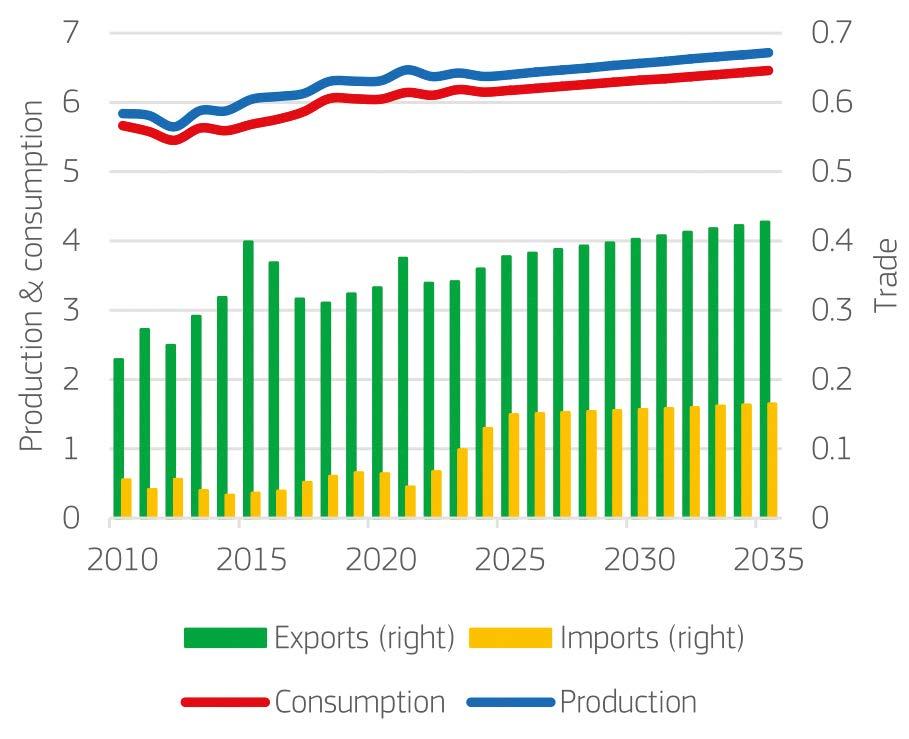
In 2025, EU poultry meat production is estimated to continue increasing slightly compared with 2024, supported by solid consumer demand and favourable feed cost and output price conditions. Over the period to 2035, EU poultry production is projected to rise by 965,000 tonnes, corresponding to an average annual growth rate of +0.7%.
The report notes that future production growth may be uneven across regions, as stricter environmental legislation and the transition towards more sustainable production systems could limit expansion in certain Member States. In addition, unlike previous years, highly pathogenic avian influenza (HPAI) is expected to remain present throughout the year rather than as a seasonal phenomenon, posing an ongoing challenge for the poultry sector.
Exports
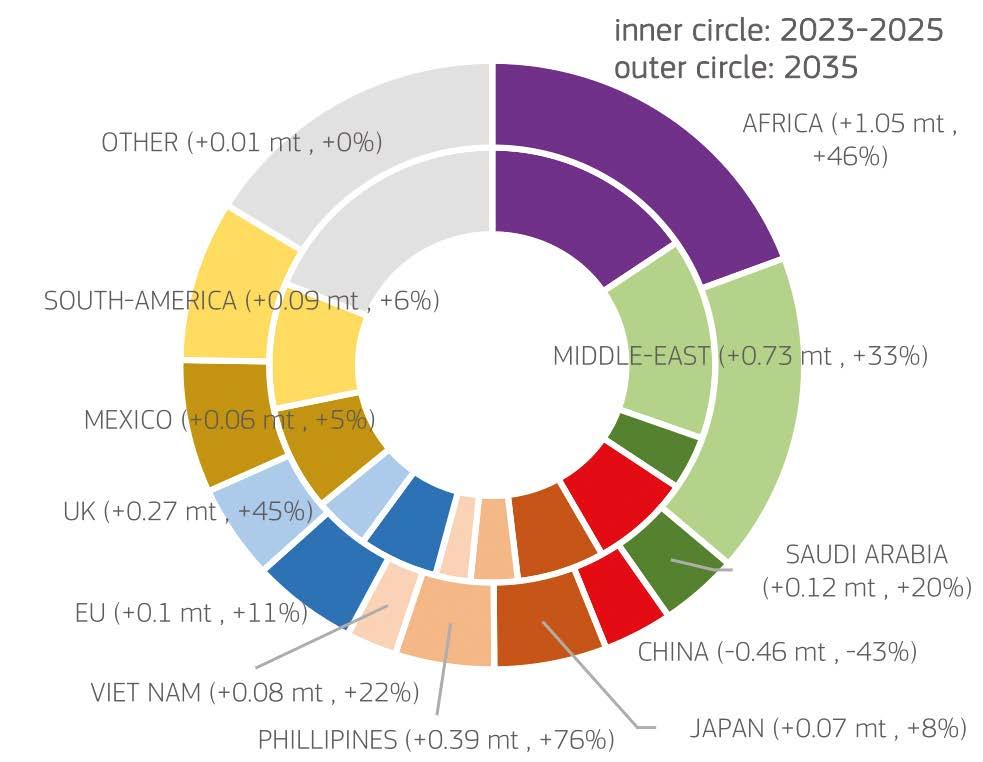
Global import demand for poultry meat is expected to increase by 2.5 million tonnes by 2035, driven mainly by growth in the Middle East, Africa and Asia. Following a period of decline, EU poultry exports are projected to regain momentum, growing at an average rate of +0.8% per year to reach more than 2.1 million tonnes by 2035.
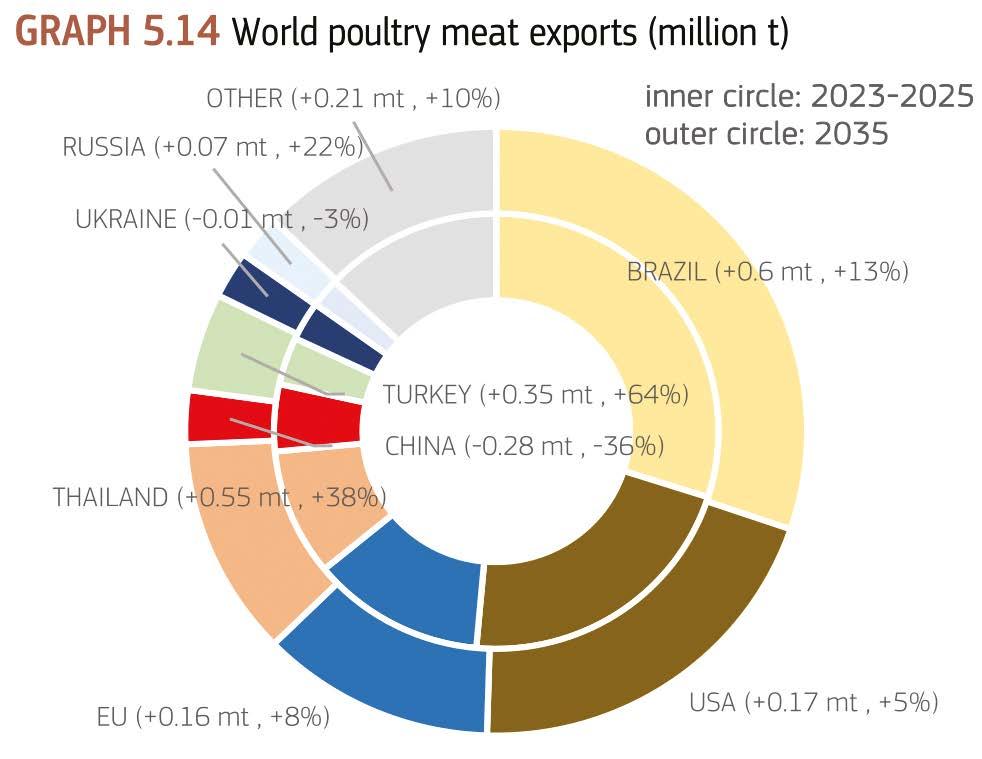
Exports to the United Kingdom are expected to remain strong, while shipments to Africa, Asia and the Middle East are projected to increase. However, the EU’s share of global poultry exports is expected to remain broadly stable at around 12.5%, as competition from lower cost producers such as Brazil, the United States, Thailand and Ukraine intensifies.
Poultry consumption
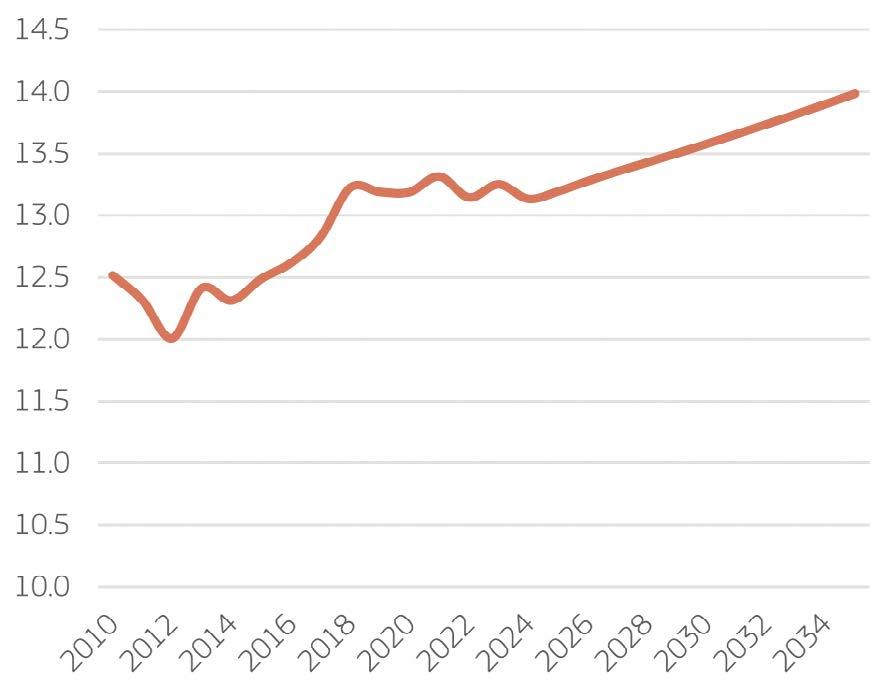
EU poultry consumption is expected to continue increasing between 2025 and 2035. Per capita poultry consumption is projected to rise from 15.1 kg per year (2023–2025 average) to 16.5 kg per year by 2035. The outlook attributes this increase to consumer preferences for poultry as a convenient, affordable and widely perceived healthy protein source, as well as higher demand from food service and food processing sectors. At the same time, overall EU meat consumption is projected to decline marginally over the outlook period, with a continued shift away from beef and pigmeat towards poultry.
Imports
Source: DG Agriculture and Rural Development, based on OECD-FAO Outlook.
Note: Middle East includes Egypt.
To meet rising demand, EU poultry meat imports are projected to increase by +1.1% per year, reaching approximately 955,000 tonnes by 2035. Imports are supported by relatively higher poultry prices in the EU compared with world markets. In 2025, increased imports from Brazil, the United Kingdom and Thailand were already observed.
Prices
EU poultry prices reached historically high levels in 2025. The average EU price for chicken broiler carcasses exceeded EUR 3,000 per tonne for the first time, reflecting tight supply and strong demand. Over the longer term, EU poultry prices are projected to increase gradually to around EUR 2,850
▲ Figure 1 – EU poultry meat market balance (million t) Note: Production corresponds to gross indigenous production.
▲ Figure 2 – World poultry meat imports (million t)
▲ Figure 3 – World poultry meat exports (million t)
Source: DG Agriculture and Rural Development, based on OECD-FAO Outlook.
per tonne by 2035, in line with sustained EU demand and developments on world markets.
Egg Sector Outlook
Egg production
Between 2015 and 2025, EU egg production grew by an average of +0.8% per year. Over the 2025–2035 outlook period, egg production is projected to continue increasing, but at a slower average annual rate of +0.5%. This moderation reflects forecasts of declining population growth and potential supply challenges linked to HPAI. Productivity gains in the egg sector may come from automation, digitalisation and genetic progress, including improvements in laying persistence and hen longevity. However, these gains could be partly offset in the short term by the implementation of animal welfare policies and the gradual phase out of the killing of day old male chicks, with in ovo sexing increasingly adopted as a welfare friendly alternative rather than as a practice being discontinued.
Egg consumption
trends are driven by the ease of preparation of eggs, their role as a relatively affordable source of protein, increased health awareness among consumers, and an ageing population, as older consumers tend to consume more eggs. Demand from the egg processing industry is also expected to remain strong, particularly for eggs used as ingredients in bakery products, desserts, sauces and ice cream. With rising incomes, demand for organic and free range eggs is projected to increase.
Egg imports
Due to the perishability of eggs, the EU sources most imports from neighbouring countries, mainly Ukraine and the United Kingdom. Over the past three years, imports from Ukraine increased significantly,
▲ Figure 4 – EU egg market balance (million t)
Note: the market balance contains only eggs for consumption.
accounting for around 60% of total EU egg imports in 2023 and 2024. EU egg imports are projected to grow by +2.7% per year over the coming decade, assuming imports from Ukraine remain at levels similar to those observed in 2025.
Egg exports
EU per capita egg consumption is projected to grow by +0.5% per year, reaching 14 kg per capita by 2035. Consumption
Global egg consumption is expected to grow by 13% between 2025 and 2035, particularly in India and emerging markets in
South East Asia such as Vietnam and Indonesia. While global egg trade remains limited—representing around 1.5% of total global production due to transport costs, perishability and HPAI restrictions—the expansion of egg processing in emerging markets could support future trade opportunities.
In 2025, EU egg exports are expected to increase by +5% in volume compared with 2024. Over the longer term, EU egg exports are projected to grow by around +1.7% per year, supported by demand in neighbouring countries and exports of albumin, particularly to Japan.
Source
EC (2025), EU agricultural outlook, 2025 2035. European Commission, DG Agriculture and Rural Development, Brussels
▲ Figure 5 – EU per capita egg consumption
EFSA ANNUAL REPORT ON AVIAN INFLUENZA
In November 2025, the European Food Safety Authority (EFSA) presented the annual report on avian influenza covering 2024. Data were collected from all EU Member States, by European Free Trade Association countries (Iceland, Norway, Switzerland), EU candidate countries (Georgia, North Macedonia) and other countries in Europe or at the Europe–Asia interface, including the United Kingdom (Northern Ireland), Ukraine, Moldova and Türkiye, required to implement surveillance programs for the avian influenza virus (AIV) in both poultry and wild birds, collectively known as the Union Surveillance Programme (USP), in accordance with Regulation (EU) 2016/429 ("Animal Health Law").
Avian influenza (AI) is a contagious viral disease caused by a virus from the Orthomyxoviridae family, primarily affecting poultry and wild waterbirds. Avian influenza viruses are classified as highly pathogenic (HPAIV) or low pathogenic (LPAIV) based on their molecular characteristics and ability to cause disease and mortality in chickens. In poultry, LPAIV infections often cause mild respiratory signs or remain asymptomatic, while HPAIV infections, particularly in chickens and turkeys, typically result in severe disease and high mortality. Poultry with LPAI may show mild or no symptoms, while HPAI causes severe illness and death. Both spread rapidly through farms, making strict biosecurity measures
crucial. LPAI viruses can mutate into highly pathogenic strains, making surveillance of LPAIV strains essential.
In poultry production systems, this mutation potential is a major concern, as it can lead to sudden HPAI outbreaks, though so far only H5 and H7 subtypes have mutated to become HPAIV.
What is concerning is that highly pathogenic viruses are increasingly affecting wild birds and now appear to be adapting to mammals as well. Animal to human spillover, however, has occurred only occasionally.
The EFSA report provides an overview of HPAI spread from 2016 2023, highlighting how the virus showed a rather
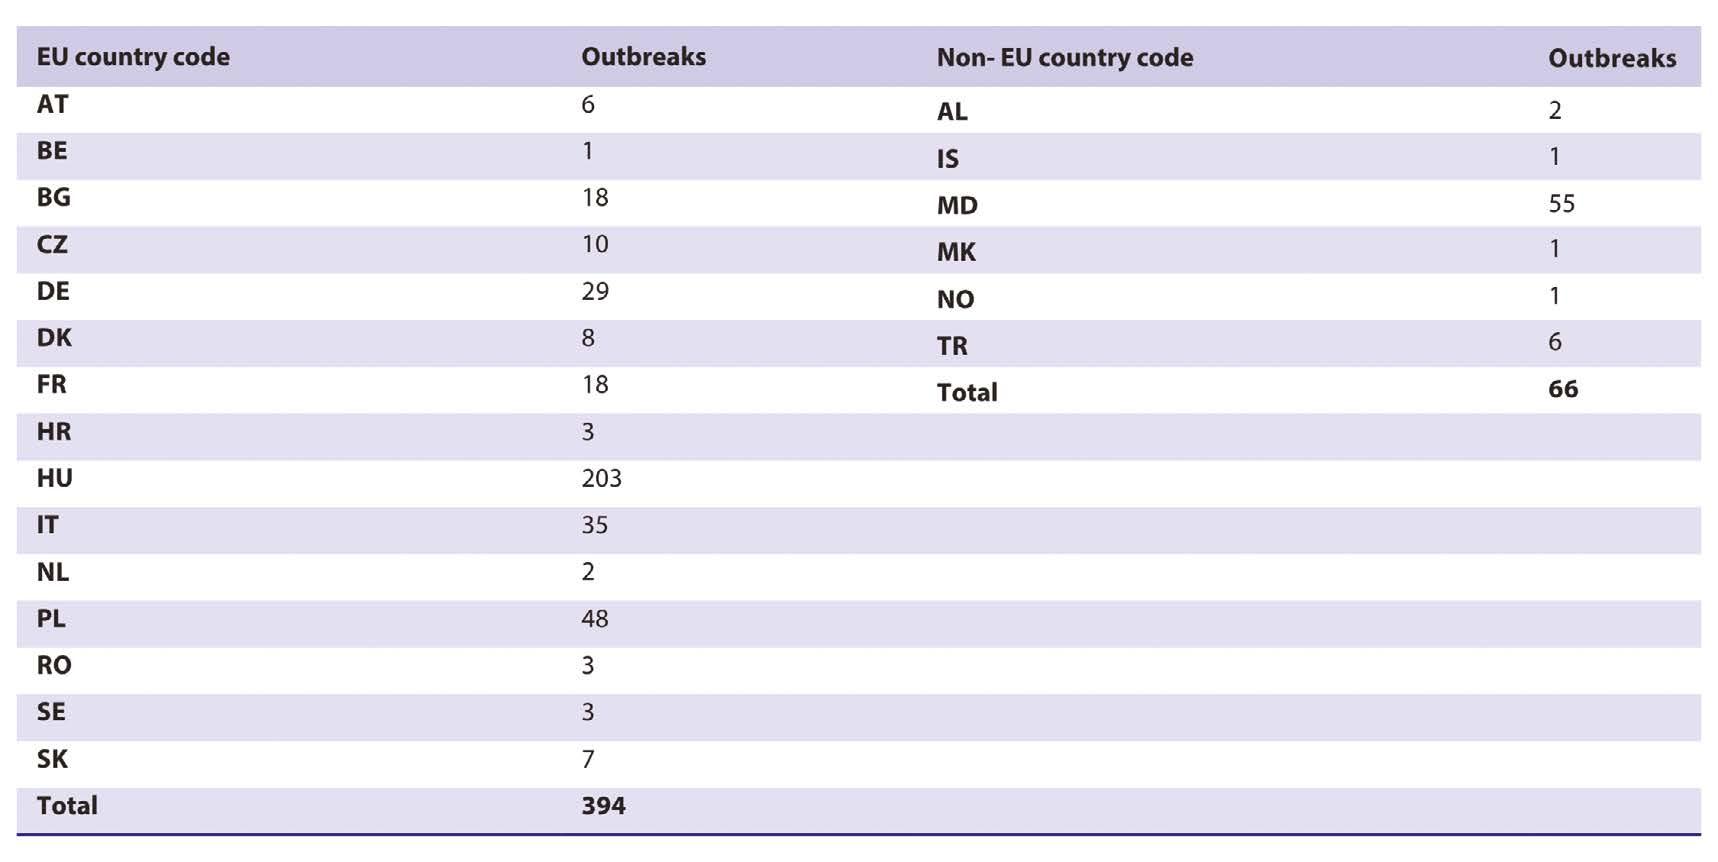
■ Table 1 – Countries affected (EU and non-EU) and number of HPAI outbreaks in poultry, per country.
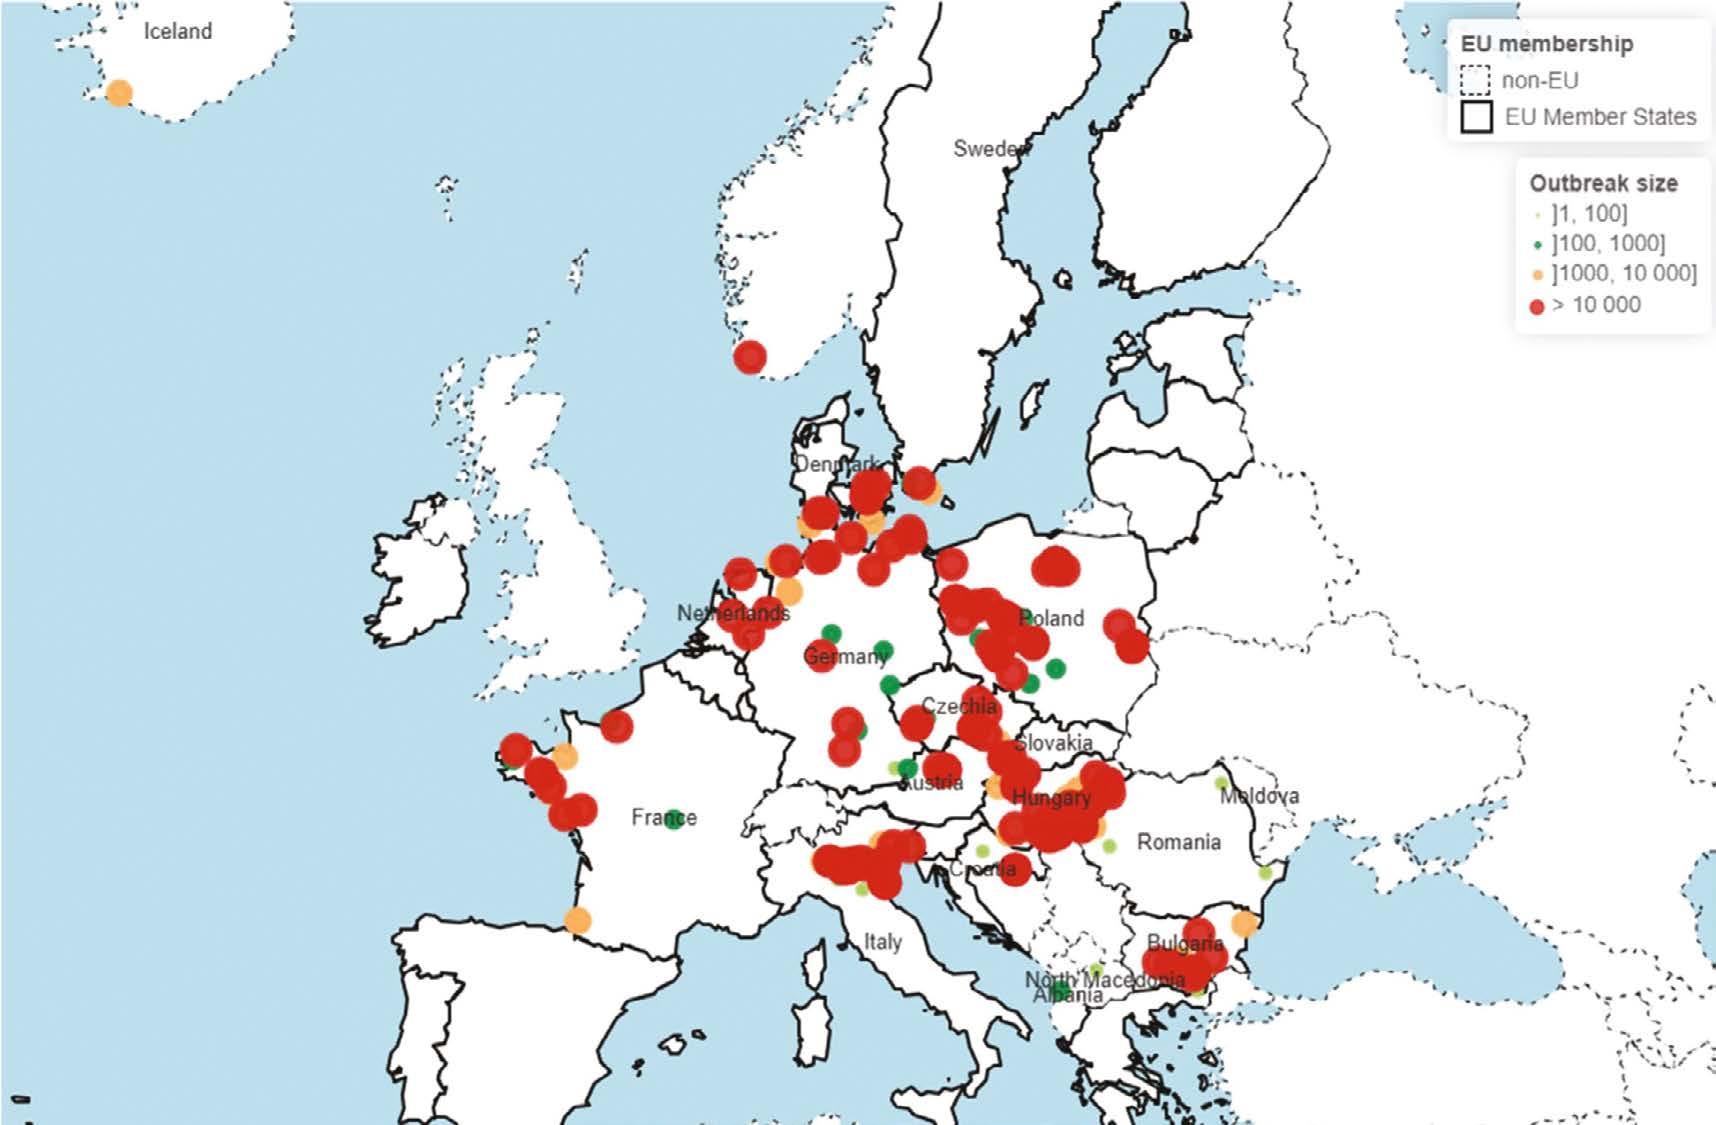
▲ Figure 1 – Geographical distribution of the outbreaks in poultry submitted in ADIS and estimated outbreak size
The outbreak size was estimated considering the number of animals potentially present in the affected establishment, as reported in the ’Susceptible’ field in ADIS data.
Any designation of Kosovo is without prejudice to positions on status and is in line with United Nations Security Council Resolution 1244 and the International Court of Justice Opinion on the Kosovo Declaration of Independence.
dynamic pattern with changing subtypes, host ranges, and epidemiological characteristics, reviewing each year’s epidemic and its peculiarities. Data show that the 2021 2022 epidemic was the most severe ever recorded in Europe, dominated by H5N1, with additional detections of H5N8 and H5N5. Meanwhile, the 2022 2023 epidemic massively affected wild birds and, as mentioned, was also observed in mammals, including wild carnivores, fur farming animals, marine mammals, and pets, though not frequently.
The report continues by presenting sampling data divided into four sections: poultry sector, captive birds, wild birds, and mammals. Regarding the poultry sector, 27,739 establishments were sampled, with a total of 40,555 sampling events and 218,667 samples collected.
ADIS (Animal Disease Information System), the EU information system for animal diseases, recorded 394 outbreaks in EU countries and 66 in non EU countries in 2024 (Table 1 and Figure 1). In detail, fifteen EU countries (Austria, Belgium, Bulgaria, Czech Republic, Germany, Denmark, France, Croatia, Hungary, Italy, Netherlands, Poland, Romania, Sweden, Slovakia) and six non EU countries were affected (Albania, Iceland, Moldova, North Macedonia, Norway, Turkey).
ADIS (Animal Disease Information System), the EU information system for animal diseases, recorded 394 outbreaks in EU countries and 66 in non-EU countries in 2024
Source
European Food Safety Authority (EFSA), Abrahantes, J. C., Aznar, I., Boom, M., Catalin, I., Dórea, F., Grant, M., Mulligan, K. F., & Zancanaro, G. (2025). Avian Influenza annual report 2024. EFSA Journal, 23(12), e9761. https://doi.org/10.2903/j.efsa.2025.9761
ADDING VALUE INTO THE POULTRY FOOD CHAIN
Enhancing efficiency, sustainability and consumer engagement are three cornerstones to increase profitability by adding value into the poultry food chain. All together are necessary across the whole production stages to assemble a solid value chain for poultry products.
➤ Aitor Arrazola Research biologist, Ph.D. in Animal Behaviour & Welfare
Seeking efficiency
Most businesses aim to deliver high quality products at the lowest cost and the same applies to the poultry industry. Yet, attaining this milestone requires a multifactorial approach to stay profitable throughout all stages and achieve economic sustainability in the long run. Husbandry conditions and management must align with breed requirements to accomplish high yield performance objectives. Indeed,
producers should look for poultry breeds that achieve high survival rates and good health and welfare under local conditions for high investment return and profitable flock performance. This includes low feed intake per production outcome, resilience to potential threats (pathogens, climate conditions, etc.) and soundness to husbandry conditions and management practices. Indeed, when all these metrics aren’t considered, high performing layers and fast growing broilers may underperform under suboptimal conditions due to high culling rates, mortality, and/or stress sensitivity (leading to growth checks, laying cessation, and immunosuppression) compared to more resilient and robust breeds. Precision feeding also becomes an ally to boost feed efficiency by implementing strategies
that meet nutritional requirements throughout rearing and production phases tailored to breed specific background, intended to reduce feed waste and improve health status. In addition to previous remarks, adopting strong biosecurity practices can help producers prevent disease outbreaks and associated losses in case of pathogen entry. Weak biosecurity protocols not only pose a risk for birds’ performance and survival but also raise food safety concerns, particularly in the case of food borne diseases such as salmonellosis and campylobacteriosis. In this context, barn digitalization can advance record keeping of environmental conditions, monitor flock health status and track performance which, in turn, can improve birds’ health, welfare and productivity. All these advancements in efficiency not only aid in managing resources efficiently but also spot gaps for improvements as well as pioneering procedures already implemented on site that are useful for strategic, brand positioning and differentiation within the sector.
Embracing sustainable practices
Recent concerns about environmental sustainability are pressuring the poultry industry to mitigate its footprint by improving efficiency, optimizing resource use, and reducing waste. Beyond feed efficiency, there is a growing need for cutting down the amount of energy and water required for the production and processing of poultry products. Advocating for innovative solutions that use clean energy and water saving technologies along the production line can demonstrate commitment in this regard. Road distribution of poultry products is associated with high CO₂ emissions into the atmosphere, and optimizing logistics and transportation procedures can further help mitigate carbon emissions. Also, sourcing feed ingredients from local producers and certified suppliers can support that sustainable practices are implemented early in the supply chain. Another important aspect to improve is reducing waste from barns, processing facilities and retailers, turning poultry byproducts into valuable opportunities and adopting sustainable packaging made from biodegradable and/or recyclable materials. In the context of circular economy, composting poultry manure to produce high quality crop fertilizer can bring additional revenue to producers and reduce production costs. Data market analytics can additionally help match expected short and mid term consumer demand with actual barn performance to avoid overproduction and optimise logistics. Furthermore, investing in strategies to capture human produced pollutants (such as greenhouse gases) demonstrates environmental stewardship to shape a future in which the poultry industry plays a crucial role satisfying the rising demand for meat and eggs sustainably and integrated within the environment. All these approaches ultimately aim to reduce greenhouse gas emissions and the carbon footprint, and promoting these actions illustrates the poultry industry’s commitment to integrating green practices across the supply chain, which brings value along the way.
Road distribution of poultry products is associated with high CO₂ emissions into the atmosphere, and optimizing logistics and transportation procedures can further help mitigate carbon emissions
Engaging with consumers
All these efforts to attain better process efficiency and become more environmentally friendly must be communicated to consumers, stakeholders, policymakers, and non governmental organizations. Transparency, traceability and knowledge transfer are essential for educational purposes and farm to fork visibility. Indeed, sharing this information with the end consumer is key to illustrating how day to day practices safeguard food safety, support animal health and meet animal welfare standards while the sector also becomes more environmentally conscious and integrated into a circular economy that promotes local economic growth. In this context, directional education and proper marketing should deliver clear, straightforward messages to consumers so they can understand: 1) the commitment of the poultry industry to take good care for animals and food products, and 2) how it contributes to the wellbeing and livelihood of neighbouring communities. Promoting the nutritional value of poultry products as well as the quality control along the supply chain can further reinforce the trust of consumers in the poultry industry. All together can bridge consumer expectations with current value adding activities by the industry while acknowledging the routine efforts to secure the health of birds, people and environment.
WELFARE INDICATORS FOR HENS AND CHICKENS
The evaluation of animal welfare in poultry farms requires a multidimensional approach that encompasses resource-, management-, and animal-based indicators. This combined approach allows for the accurate identification of key issues such as locomotor problems, skin lesions and abnormal behaviours. The joint use of these parameters provides an objective, scientifically robust measure of animals’ welfare status and represents an essential tool for guiding targeted interventions and improving management practices.
➤ Francesca Leone
Degree in Animal Science PhD student in Environmental Sciences
Introduction
In the recent years, animal welfare has become a key focus in poultry farming. Consumers have shown growing interest in sustainable and animal friendly products, demonstrating a
willingness to pay more for food perceived as healthier, safer, tastier and more authentic (Alonso et al., 2020; Mazzocchi et al., 2022). However, animal welfare is relevant not only for ethical reasons, but also because of its direct impact on human health and environment, in line with the One Health concept (Verkuijl et al., 2024). Moreover, animals raised under optimal conditions show better productive performance and greater feed efficiency (Velarde and Dalmau, 2012). Consequently, being able to evaluate welfare objectively and scientifically is essential.
Several indicators have been studied to enable a comprehensive and objective assessment of the farm animals’ welfare. This evaluation is complex and multidimensional, including physical, behavioural, environmental, and managerial aspects that must be analysed in a holistic and coordinated manner. In particular, three different types of welfare indicators have been identified:
• Resource based indicators: evaluate the structural and environmental characteristics of the farm.
• Management based indicators: evaluate the management practices adopted by the farmer.
• Animal based indicators: provide direct information on animals’ condition (EFSA, 2012; EFSA, 2023a).
Indicators
Resource based indicators concern the structural and environmental aspects that influence the living conditions and welfare of hens and chickens. Key indicators include stocking density, bedding quality and quantity, the number and configuration of nests and perches, the space or number of feeders and drinkers, microclimate control (ventilation, temperature, relative humidity), and lighting (Sherwin et al., 2010; Nicol et al., 2013).
Management based indicators evaluate the quality of practices adopted by the farmer, such as cleaning and maintenance of facilities, litter management, sanitary protocols, biosafety plans, management of sick or injured animals, and staff training (Blokhuis et al., 2010; Campbell et al., 2018). In broilers, genetic selection also plays a fundamental role, as the intense selective pressure applied over recent decades has contributed to the emergence of major welfare issues observed today on farms (EFSA, 2023b). The first two types of indicators make it possible to identify risk factors and/or causes of poor welfare, providing a basis for implementing improvement strategies (Welfare Quality®, 2009).
Animal based indicators directly describe the condition of the animals, their health and their behaviour. For laying hens, key indicators include mortality rate, comb abnormalities that may reflect discomfort, footpad dermatitis caused by unsuitable litter, fractures of the toes and/or keel bone which indicate bone fragility, nutritional imbalances, and inadequate facilities. Other aspects considered are the presence of red mites, which are widespread in hen populations, and the observation of species specific behaviours, such as dustbathing and foraging. Additionally, the human animal relationship is evaluated, and behaviours like panting and huddling are used to detect thermal discomfort (Welfare Quality®, 2009; Nasr et al., 2012; Haas et al., 2014).
Among the most important animal based indicators are feather condition and the presence of skin lesions, both closely related to feather pecking, one of the most widespread problems in hen farms. Feather pecking is an abnormal behavioural disorder, in which an individual pecks at the feathers of a conspecific until they are pulled out, causing pain, injuries, until cannibalism. This multifactorial behaviour is
caused mainly by high stocking density, excessive lighting, nutritional deficiencies (particularly in soluble fibre and/or essential amino acids), lack of environmental enrichment, genetic predispositions, and limited ability to perform natural behaviours like exploration and foraging. As a result, these behaviours may be redirected towards conspecifics (Dixon, 2008; Rodenburg et al., 2008).
Feather pecking negatively impacts productivity by increasing stress and mortality, thereby compromising both animal welfare and egg production (Schreiter et al., 2019). Prevention strategies focus on optimal microclimate and lighting management, a balanced diet and providing manipulable and explorative materials (such as straw or ropes), which promote natural behaviours and reduce the risk of pecking directed on other hens. Additionally, genetic selection is increasingly oriented towards less reactive and predisposed hybrids to develop feather pecking (Rodenburg et al., 2013). This multifactorial behaviour exemplifies how the three types of indicators interact in the identification and correction of welfare issues.
For broiler chickens, animal based indicators mainly focus on locomotor problems, which represent a critical issue linked to intensive genetic selection for the rapid growth and the feed conversion efficiency (Zuidhof et al., 2014). The accelerated muscle tissue growth, in particular of the pectoral muscle (Pectoralis major), has not been accompanied by a proportional development of the skeletal and cardiovascular systems. This imbalance causes biomechanical alterations that affect posture, walking and cardiovascular function (Julian, 2005; Knowles et al., 2008). Environmental factors also play a key role; high stocking density, moist or poorly absorbent litter and an unbalanced diet can worsen locomotor issues (Bradshaw et al., 2002; Shim et al., 2012; van der Sluis et al., 2021).
Physiological consequences include chronic pain, reduced mobility, limited access to resources like food and water, and, in some cases, increased mortality (Weeks et al., 2002). Consequently, the most widely used animal based indicators include gait score, which assesses walking ability, pododermatitis (inflammatory skin lesions on the footpads) and hock burns, which reflect broader environmental conditions. Other commonly used indicators include mortality, feather condition, skin lesions, and species specific behaviours such as exploration, thermal comfort and human animal interaction. These indicators indirectly provide information about fear levels and adaptation to human presence and contact (Welfare Quality®, 2009; EFSA, 2023; de Jong et al., 2012).
In addition, for broiler chickens there are various parameters assessed at slaughterhouse, which reflect breeding conditions: ascites such as a fluid buildup in the abdomen due to cardiac and respiratory failure related to excessive muscle growth; breast lesions (breast blister) caused by contact with hard surfaces or wet litter; septicaemia and abscesses, which are indicative of infections and hygiene issues; hepatitis and pericarditis (metabolic and health problems), and dehydration that is a sign of inadequate water access. All these indicators provide further insight into rearing conditions
and farm management with a direct impact on animal health and welfare (Manning et al., 2007; Welfare Quality®, 2009; Petracci et al., 2019).
Preventive strategies include not only a less extreme genetic selection, but also management interventions such as the use of dry and absorbent litter, optimisation of stocking densities and dietary formulations to support skeletal and cardiovascular development, the addition of environmental enrichment to stimulate movement and natural behaviours, contributing to stronger bone development. Also the continuous monitoring of temperature, ventilation and humidity can reduce thermal stress and improve tissue oxygenation, helping to decrease cardiopulmonary and metabolic complications (Julian, 2005; Olkowski et al., 2008; Petracci et al., 2019).
Conclusion
In conclusion, only the combined use of three types of indicators allows for a comprehensive and reliable assessment of poultry welfare (Louton et al., 2018). While resource and management based indicators are valid, they offer only a partial view of animals welfare status, as they evaluate environmental conditions but not animals’ responses to them (Blokhuis et al., 2010). Conversely, animal based indicators directly reflect physical condition, health, behaviour and animals’ ability to cope with the environment in which they live (Burgstaller et al., 2022). When integrated, these parameters offer a scientifically valid and reliable representation of animals’ welfare and rearing conditions, in order to guide improvements and corrective actions.
Bibliography
Alonso ME, González Montaña JR, Lomillos JM. 2020. Consumers’ Concerns and Perceptions of Farm Animal Welfare. Animals, 10(3):385. https://doi.org/10.3390/ ani10030385
Blokhuis HJ, Veissier I, Miele M, Jones B. 2010. The Welfare Quality® project and beyond: Safeguarding farm animal well being. Acta Agriculturae Scandinavica, Section A Animal Science, 60(3):129–140. https://doi.org/10.1080/09064702.2 010.523480
Bradshaw RH, Kirkden RD, Broom DM. 2002. A Review of the Aetiology and Pathology of Leg Weakness in Broilers in Relation to Welfare. Avian and Poul Biolog Rev, 13(2):45–103. https://doi.org/10.3184/147020602783698421
Burgstaller J, Wittek T, Sudhaus Jörn N, Conrady B. 2022. Associations between Animal Welfare Indicators and Animal Related Factors of Slaughter Cattle in Austria. Animals, 12(5):659. https://doi.org/10.3390/ani12050659
Campbell YL, Walker LL, Bartz BM, Eckberg JO, Pullin AN. 2025. Outdoor access versus conventional broiler chicken production: Updated review of animal welfare, food safety, and meat quality. Poultry Science, 104(4):104906. https://doi. org/10.1016/j.psj.2025.104906
De Haas EN, Bolhuis JE, Kemp B, Groothuis TGG, Rodenburg TB. 2014. Parents and Early Life Environment Affect Behavioral Development of Laying Hen Chickens. Barendse W, editor. PLoS ONE, 9(3):e90577. https://doi. org/10.1371/journal.pone.0090577
Dixon LM. 2008. Feather Pecking Behaviour and associated Welfare issues in Laying Hens. Avian Biology Research, 1(2):73–87. https://doi.org/10.3184/175815508X363251
EFSA AHAW Panel (EFSA Panel on Animal Health and Welfare), Nielsen SS, Alvarez J, Bicout DJ, Calistri P, Canali E, Drewe JA, Garin Bastuji B, Gonzales Rojas JL, Schmidt CG, et al. 2023. Welfare of broilers on farm. EFS2, 21(2). https:// doi.org/10.2903/j.efsa.2023.7788
EFSA Panel on Animal Health and Welfare (AHAW). 2012. Scientific Opinion on the use of animal based measures to assess welfare of broilers. EFSA Journal, 10(7). https://doi. org/10.2903/j.efsa.2012.2774
EFSA Panel on Animal Health and Animal Welfare (AHAW), Nielsen SS, Alvarez J, Bicout DJ, Calistri P, Canali E, Drewe JA, Garin Bastuji B, Gonzales Rojas JL, Gortázar Schmidt C, et al. 2023. Welfare of laying hens on farm. EFSA Journal, 21(2). https://doi.org/10.2903/j.efsa.2023.7789
de Jong I, Berg C, Butterworth A, Estevéz I. 2012. Scientific report updating the EFSA opinions on the welfare of broilers and broiler breeders. EFSA Supporting Publications, 9(6). https://doi.org/10.2903/sp.efsa.2012.EN 295
Julian RJ. 2005. Production and growth related disorders and other metabolic diseases of poultry – A review. The Veterinary Journal, 169(3):350–369. https://doi.org/10.1016/j. tvjl.2004.04.015
Knowles TG, Kestin SC, Haslam SM, Brown SN, Green LE, Butterworth A, Pope SJ, Pfeiffer D, Nicol CJ. 2008. Leg Disorders in Broiler Chickens: Prevalence, Risk Factors and Prevention. Callaerts P, editor. PLoS ONE, 3(2):e1545. https://doi.org/10.1371/journal.pone.0001545
Louton H, Bergmann S, Reese S, Erhard M, Bachmeier J, Rösler B, Rauch E. 2018. Animal and management based welfare indicators for a conventional broiler strain in 2 barn types (Louisiana barn and closed barn). Poultry Science, 97(8):2754–2767. https://doi.org/10.3382/ps/pey111
Manning L, Chadd SA, Baines RN. 2007. Key health and welfare indicators for broiler production. World’s Poultry Science Journal, 63(1):46–62. https://doi.org/10.1017/ S0043933907001262
Mazzocchi C, Orsi L, Zilia F, Costantini M, Bacenetti J. 2022. Consumer awareness of sustainable supply chains: A choice experiment on Parma ham PDO. Science of The Total Environment, 836:155602. https://doi.org/10.1016/j. scitotenv.2022.155602
Nasr MAF, Nicol CJ, Murrell JC. 2012. Do Laying Hens with Keel Bone Fractures Experience Pain? Taylor B, editor. PLoS ONE, 7(8):e42420. https://doi.org/10.1371/journal. pone.0042420
Nicol CJ, Bestman M, Gilani A M, De Haas EN, De Jong IC, Lambton S, Wagenaar JP, Weeks CA, Rodenburg TB. 2013. The prevention and control of feather pecking: application to commercial systems. World’s Poultry Science Journal, 69(4):775–788. https://doi.org/10.1017/S0043933913000809
Olkowski AA, Wojnarowicz C, Nain S, Ling B, Alcorn JM, Laarveld B. 2008. A study on pathogenesis of sudden death syndrome in broiler chickens. Research in Veterinary Science, 85(1):131–140. https://doi.org/10.1016/j.rvsc.2007.08.006
Petracci M, Mudalal S, Soglia F, Cavani C. 2015. Meat quality in fast growing broiler chickens. World’s Poultry Science Journal, 71(2):363–374. https://doi.org/10.1017/ S0043933915000367
Rodenburg TB, Komen H, Ellen ED, Uitdehaag KA, Van Arendonk JAM. 2008. Selection method and early life history affect behavioural development, feather pecking and cannibalism in laying hens: A review. Applied Animal Behaviour Science, 110(3–4):217–228. https://doi. org/10.1016/j.applanim.2007.09.009
Rodenburg TB, Van Krimpen MM, De Jong IC, De Haas EN, Kops MS, Riedstra BJ, Nordquist RE, Wagenaar JP, Bestman M, Nicol CJ. 2013. The prevention and control of feather pecking in laying hens: identifying the underlying principles. World’s Poultry Science Journal, 69(2):361–374. https://doi. org/10.1017/S0043933913000354
Schreiter R, Damme K, Von Borell E, Vogt I, Klunker M, Freick M. 2019. Effects of litter and additional enrichment
elements on the occurrence of feather pecking in pullets and laying hens – A focused review. Veterinary Medicine & Sci, 5(4):500–507. https://doi.org/10.1002/vms3.184
Sherwin CM, Richards GJ, Nicol CJ. 2010. Comparison of the welfare of layer hens in 4 housing systems in the UK. British Poultry Science, 51(4):488–499. https://doi.org/10.1080/0007 1668.2010.502518
Shim MY, Karnuah AB, Mitchell AD, Anthony NB, Pesti GM, Aggrey SE. 2012. The effects of growth rate on leg morphology and tibia breaking strength, mineral density, mineral content, and bone ash in broilers. Poultry Science, 91(8):1790–1795. https://doi.org/10.3382/ps.2011 01968
Van Der Sluis M, Ellen ED, De Klerk B, Rodenburg TB, De Haas Y. 2021. The relationship between gait and automated recordings of individual broiler activity levels. Poultry Science, 100(9):101300. https://doi.org/10.1016/j.psj.2021.101300
Velarde A, Dalmau A. 2012. Animal welfare assessment at slaughter in Europe: Moving from inputs to outputs. Meat Science, 92(3):244–251. https://doi.org/10.1016/j. meatsci.2012.04.009
Verkuijl C, Smit J, Green JMH, Nordquist RE, Sebo J, Hayek MN, Hötzel MJ. 2024. Climate change, public health, and animal welfare: towards a One Health approach to reducing animal agriculture’s climate footprint. Front Anim Sci, 5:1281450. https://doi.org/10.3389/fanim.2024.1281450
Weeks CA, Knowles TG, Gordon RG, Kerr AE, Peyton ST, Tilbrook NT. 2002. New method for objectively assessing lameness in broiler chickens. Vet Rec., 151(25):762 4. PMID: 12521248.
Zuidhof MJ, Schneider BL, Carney VL, Korver DR, Robinson FE. 2014. Growth, efficiency, and yield of commercial broilers from 1957, 1978, and 2005. Poultry Science, 93(12):2970–2982. https://doi.org/10.3382/ps.2014 04291
THE DYNAMICS OF GLOBAL MEAT PRODUCTION
An analysis of the period from 2000 to 2023 — Part 1
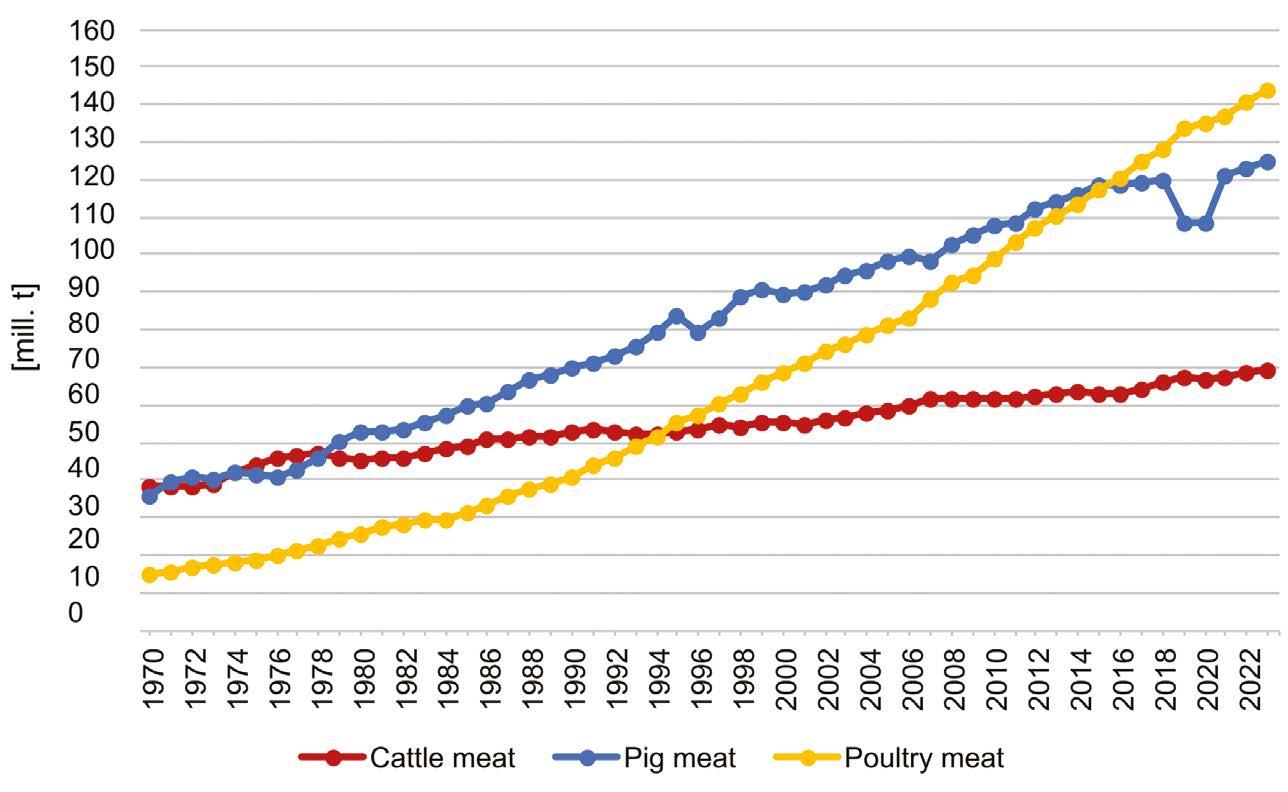
Global meat production increased by almost 270 million mt1, or 268% between 1970 and 2023. Examining the development by meat type reveals that the dynamics was primarily driven by the rapid increase in poultry meat production. However, it is worth noting that this meat type has not dominated between 2020 and 2023. This article analyses the longer-term trends and the dynamics since 2000 in detail.
➤ Hans-Wilhelm Windhorst Professor Emeritus at the University of Vechta, Germany
Long-term trends. The success story of poultry meat
Analysing the long term development for the three most important meat types and time periods reveals some striking
1 mt: metric tonne (= 1,000 kg)
changes. Obviously, poultry meat production has grown significantly faster than red meat production. The author has characterised this dynamic as a ’red white shift’ (Windhorst, 2021). Table 1 shows that between 1970 and 2023 the absolute growth in poultry meat production was nearly as high as that of the two most important types of red meat combined. The same applies to the period from 2000 to 2023. However, the picture changes when only the short term development between 2020 and 2023 is considered. Here, pig meat production grew significantly faster than that of poultry meat. This can be explained by the rapid increase of production in
■ Table 1 – The differing development of global meat production between 1970 and 2023, broken down by meat type
■ Table 2 – The changing share of cattle meat, pig meat and poultry meat in the global meat production between 1970 and 2023
Source: FAO data.
Source: FAO data.
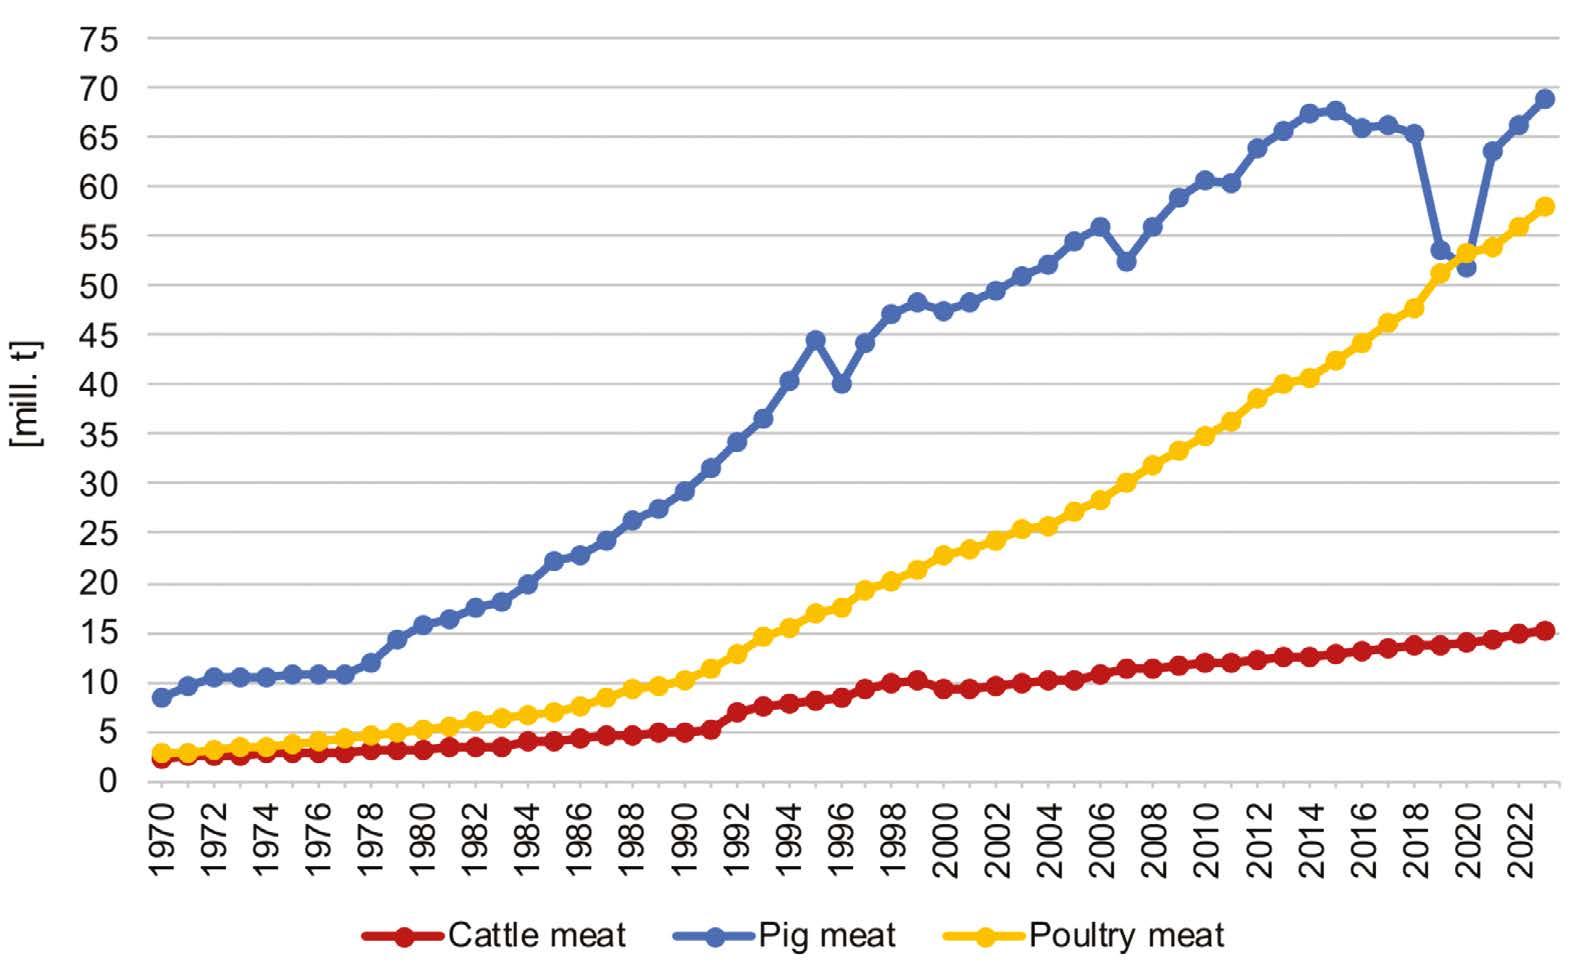
China and Brazil. Following the containment of African swine fever, Chinese production rose by 16.8 million mt over four years, and Brazilian production increased by almost 1 million mt due to a greater focus on exports. A more detailed analysis will follow in a later section. When examining the long term change of the share of beef, pork and poultry in global meat production, a shift towards white meat becomes apparent (Table 2, Figure 1). Between 1970 and 2023, beef lost 19.3% of its original share. In contrast, pig meat has remained relatively stable. Poultry gained 23.9%, making it the big winner, although it lost 0.8% between 2000 and 2023.
▲ Figure 1 – The development of the global production of cattle meat, pig meat and poultry meat between 1970 and 2023 Design: A. S. Kauer based on FAO data.
Medium-term development. The growing dominance of Asia
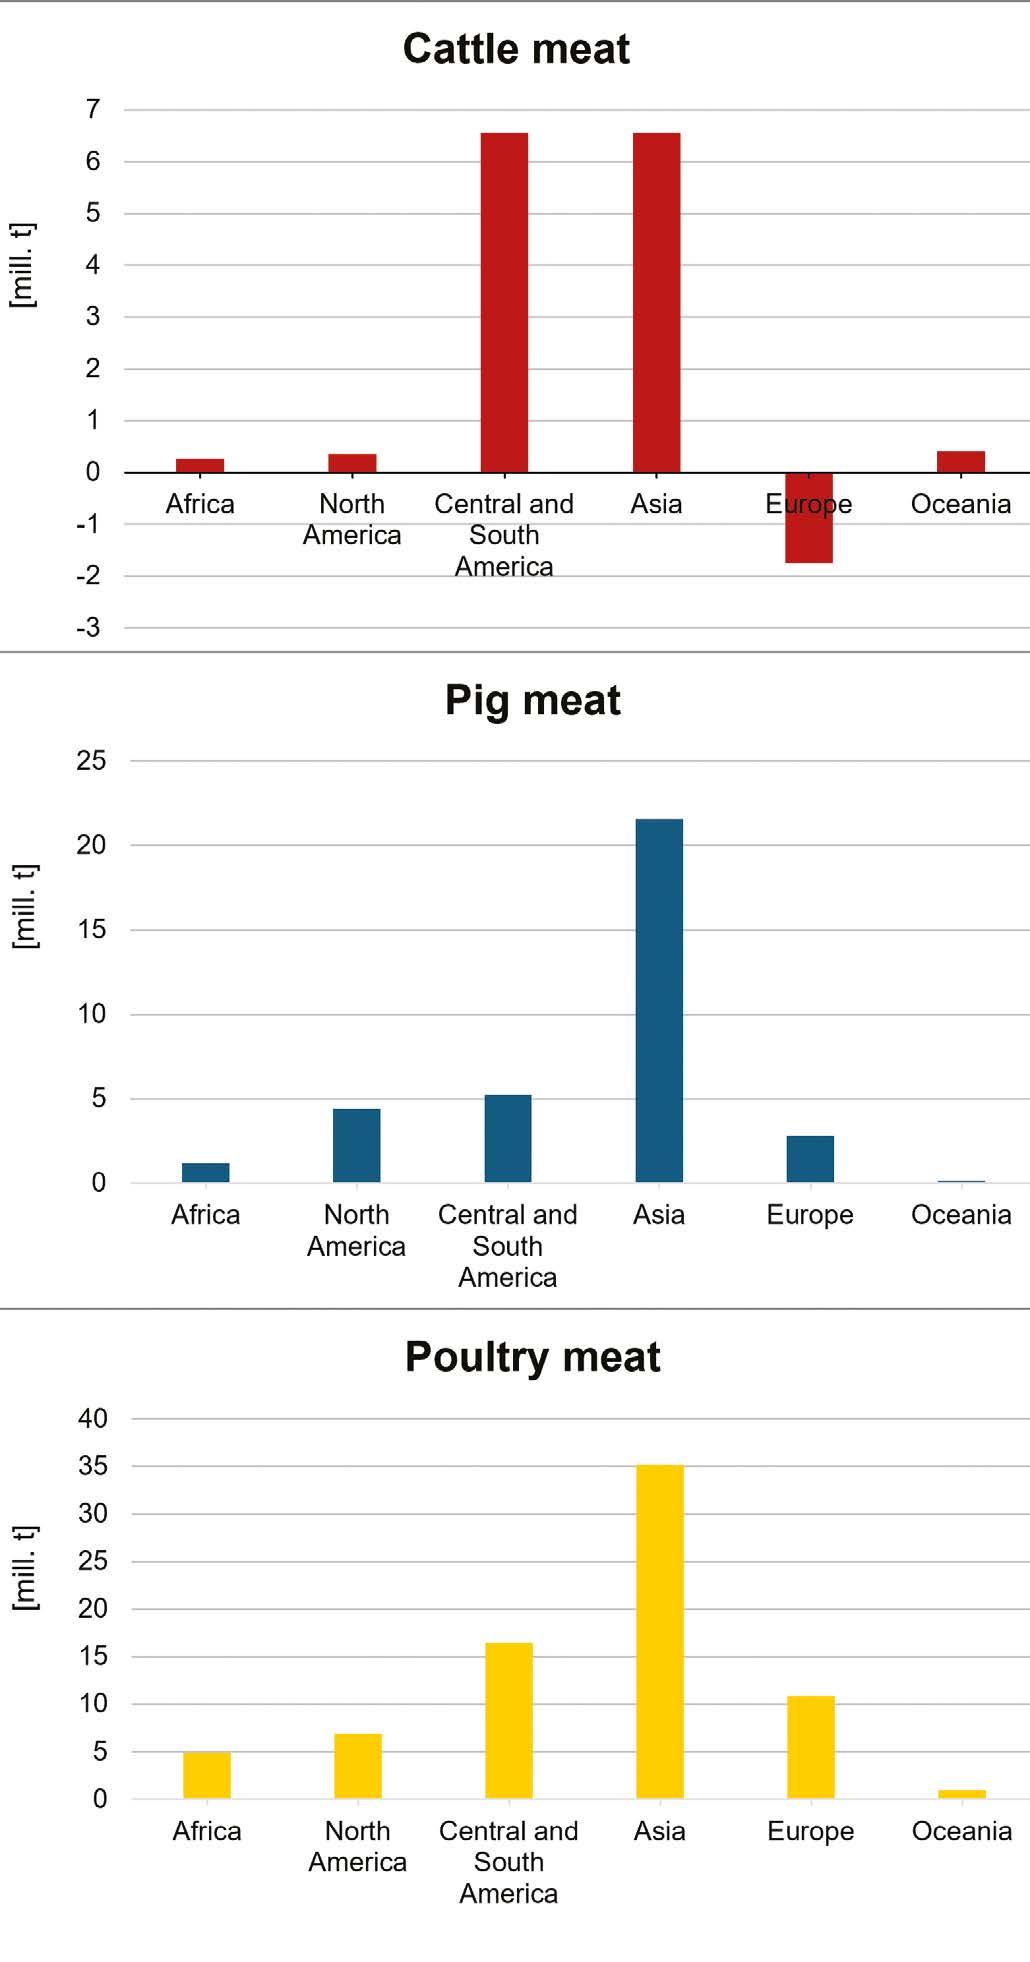
This part of the analysis analyses how meat production developed by meat type and continent between 2000 and 2023. Figure 2 shows that the contribution by the individual continents to this development varied considerably. For
beef, the absolute increase in Asia and Central and South America was almost the same. The contribution of the other continents was comparatively insignificant, with Europe even recording a decline of 1.8 million mt. Asia was an exception with pork production increasing by 21.5 million mt. It was followed by North and South America and Europe. Although Africa continued to account for only a small proportion of global production, its share doubled between 2000 and 2023. Pig meat remained of minor importance in Oceania. At 35.2
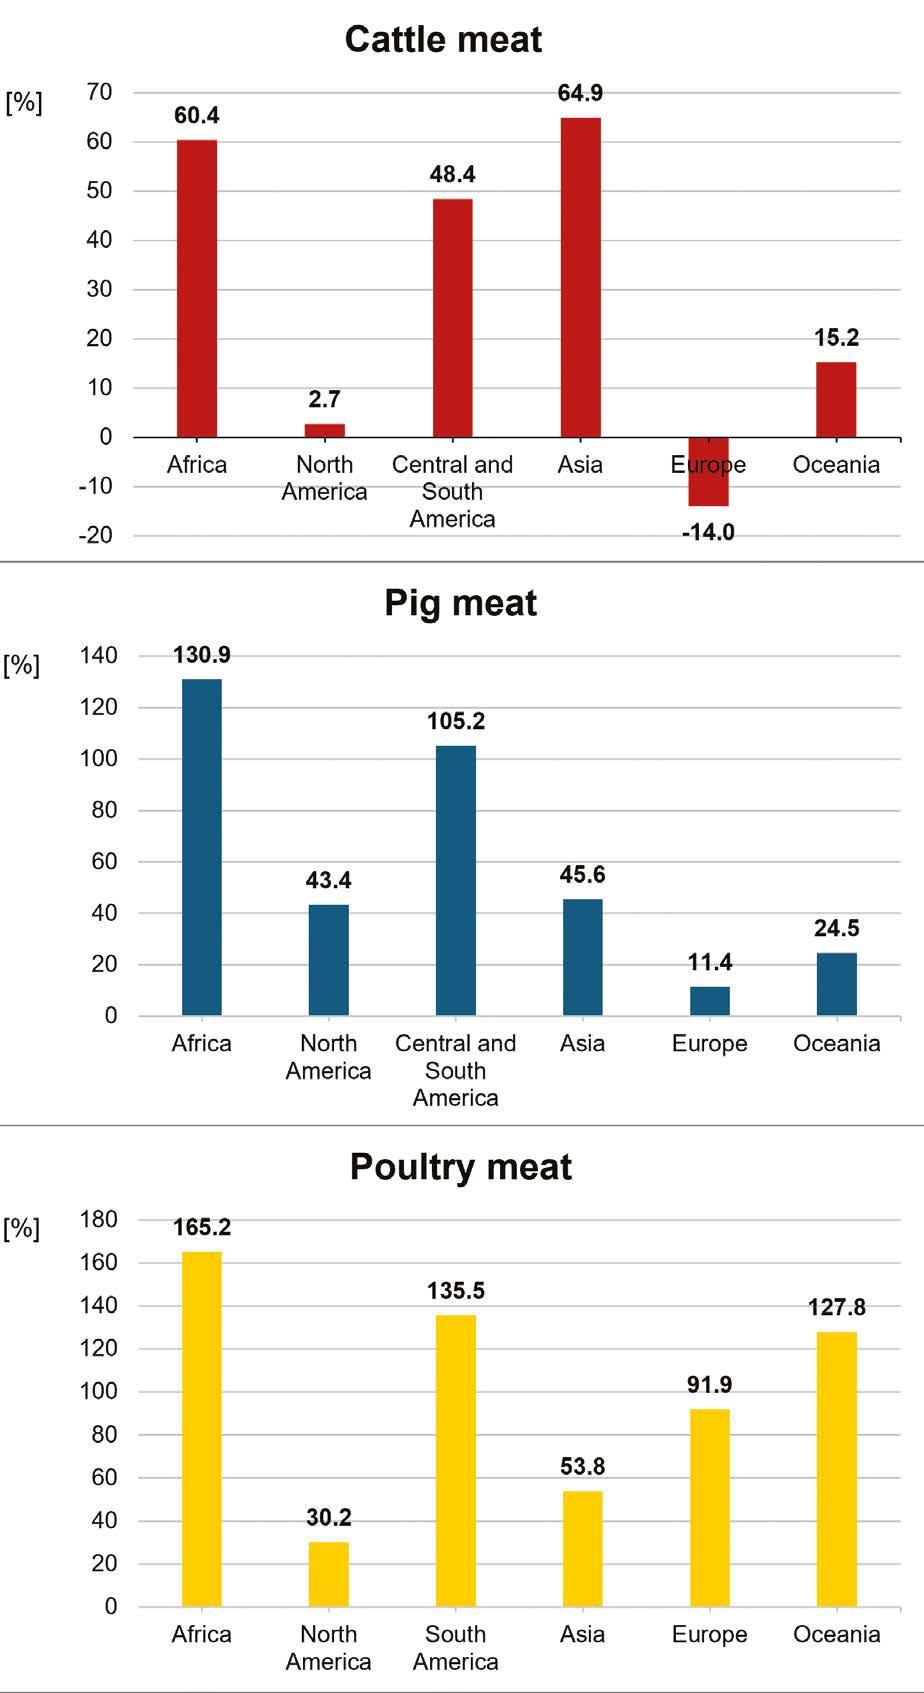
million mt, Asia showed the largest growth in poultry meat production, followed by Central and South America at 16.9 million mt, and Europe at 10.9 million mt. At first glance, the significantly lower increase in North America seems surprising. However, it has to be noted that the two North American countries accounted for already 17.9% of the global production volume in 2000. Africa showed a remarkable dynamic, increasing its production by around 5 million mt. Oceania lagged far behind the other continents in terms of this meat type, reflecting its small population. A different picture emerges when the relative change in meat production is analysed (Figure 3). Asia and Africa achieved relative growth rates of over 60% for beef, followed by Central and South America with 47.8%. North America recorded the lowest growth rate of only 2.7%, apart from Europe’s downward trend. North America’s low growth rate reflects the declining per capita beef consumption in the USA. While it had been as high as 30 kg in 2000, it had fallen to 27 kg by 2023. The high retail price compared to pig meat and, in particular, broiler meat was the decisive steering factor.
Africa showed the highest relative increase in pork production at 130.9%, followed by Central and South America at 105.2%. Growth was much lower in Asia and North America, here, the already high baseline figures for 2000 must be taken into account. Europe ranked last with an increase of only 11.4%, reflecting the slight increase in per capita consumption. In some countries, consumption has been stagnating or even declining for years, because consumers preferred poultry meat for its lower retail price, while that of beef had risen sharply.
Poultry meat achieved the highest relative growth rate in Africa at 165.2%, followed by Asia at 153.8%, and Central and South America at 142.1%. Oceania’s high figure must be viewed in the context of its low baseline of just 0.77 million mt produced in 2000.
In summary, Africa and Central and South America showed a remarkable dynamic. Asia was only in the top position for beef production. The comparatively low momentum in North America is surprising at first glance. Here, meat consumption has obviously reached a saturation point in the USA, and growth can only be achieved through population growth or higher exports. Africa’s dynamic development is due to the rising per capita income of a growing middle class in some North African countries and South Africa. Central and South America demonstrated a remarkable growth across all three meat types, with Brazil’s increased exports playing a pivotal role.
▲ Figure 2 – The absolute change of global meat production at continent level and by meat type between 2000 and 2023 Design: A. S. Kauer based on FAO data.
■ Table 3 – The development of global meat production between 2020 and 2023 at continent level and by meat type continent Source: FAO data.
What about short-term trends, a resurgence of pork?
Looking at the short term trend in global meat production between 2020 and 2023 reveals some remarkable developments. The fact that consumption options were restricted in many countries during the Covid 19 pandemic resulted in changing preferences of the consumers for meat types.
Between 2020 and 2023, global production of the three main meat types increased by 27.5 million mt. Approximately 16 million mt or 58.1% of this was pork, 8.8 million mt respectively 32.1% was poultry, and 2.7 million mt or 9.8% was beef. Does this development spell the end of poultry meat’s success story? Examining the data for individual continents (Table 3) reveals that the increase in pork production was primarily driven by developments in Asia and, to a much lesser extent, in Central and South America. In contrast, the production volume in Europe and North America fell by around 2.6 million mt in total, with Europe accounting for 2.1 million mt of this decline. The containment of African swine fever boosted pork production in Asia, offsetting the 16 million mt slump between 2015 and 2020. A comparison of the production volumes in 2015 and 2023 reveals that production increased by only 1.5%. In contrast, beef production grew by 18.3%, and poultry meat even by 36.9%. While beef production in Asia and Central and South America increased by a combined 2.7 million mt, it declined by 0.6 million mt in Europe and North America. Of all meat types, only poultry
▲ Figure 3 – The relative change of global meat production at continent level and by meat type between 2000 and 2023
Design: A. S. Kauer based on FAO data.
▲ Figure 4 – The development of cattle meat, pig meat and poultry meat production in Asia between 1970 and 2023 Design: A. S. Kauer based on FAO data.
showed positive growth across all continents. Figure 4 clearly documents that in Asia the dynamic of this meat type remained unaffected. The sharp increase in pork production since 2020 was merely a short term response to the significant losses caused by the African swine fever outbreaks in China and several other Asian countries between 2018 and 2020.
Conclusion. Asia and Central and South America dominated
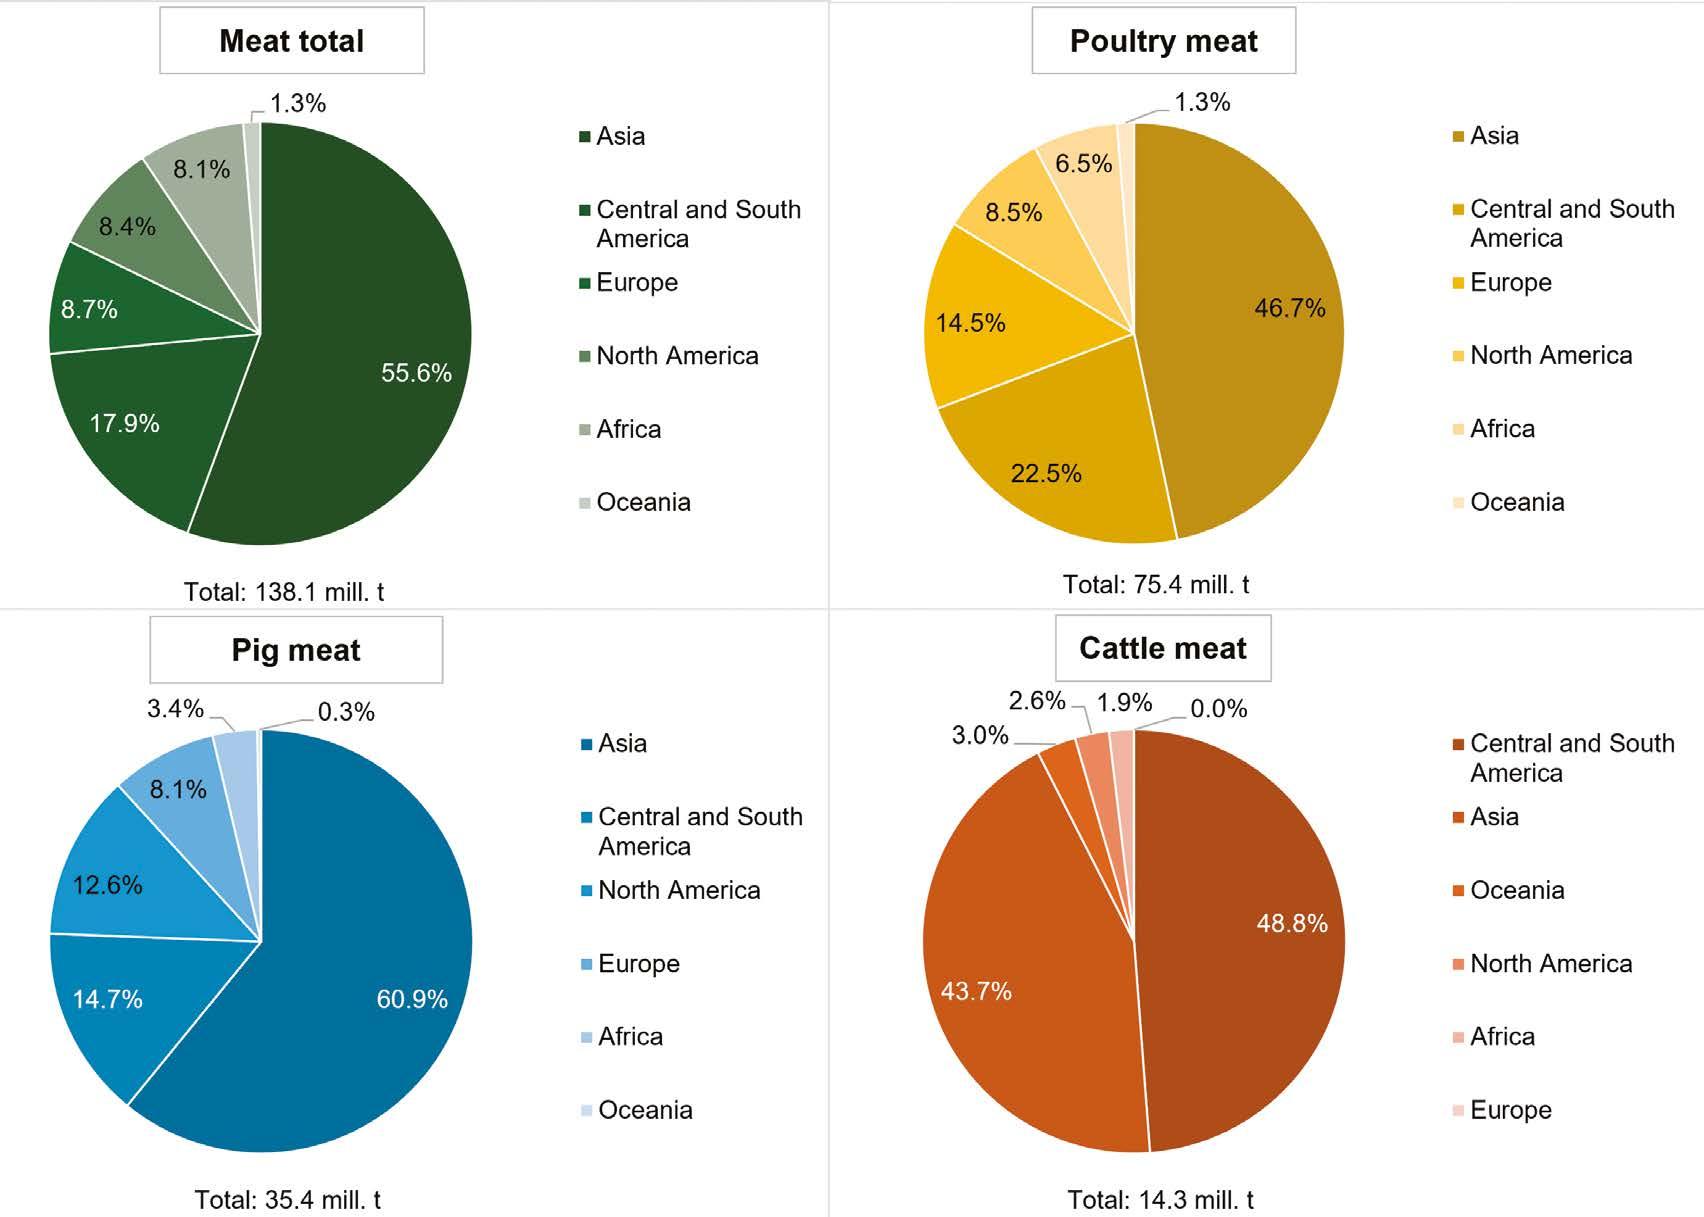
Besides comparing the absolute and relative growth of global meat production, it is of interest to examine how much each continent contributed to the total production as well as to the production of the three most important meat types. Figure 5 provides a summary of this.
Between 2000 and 2023, Asia contributed 55.6% to the 138.1 million mt growth in global meat production, with Central and South America contributing a further 17.9%. These two continents thus accounted for almost three quarters of the increase. In contrast, the significantly lower growth in Europe and North America is reflected in their combined share of only 17.1%.
At 35.2 million mt, Asia showed the largest growth in poultry meat production, followed by Central and South America at 16.9 million mt, and Europe at 10.9 million mt.
A similar pattern emerges when looking at individual meat types. Once again, Asia and Central and South America were in the leading positions. During this period, the two continents contributed 69.2% to the increase in poultry meat production, 75.6% to pork production, and 92.5%
▲ Figure 5 – The share of the continents in global meat production between 2000 and 2023 Design: A. S. Kauer based on FAO data.
to the increase in beef production. It is worth noting that Oceania had an even higher share in beef production than Europe or North America. The dynamics of global meat production reflect both population size and the continents’ respective shares in the world population. In 2023, Asia accounted for 59% of the world’s population, while Central and South America accounted for 8% and Europe and North America for 14%. Africa achieved the highest relative population growth between 2000 and 2023, at 83%, while Europe had the lowest, at only 2.8%. Given the emerging population dynamics and economic development, it is reasonable to assume that Asia and Central and South America will increase their shares in global meat production, while Europe and North America will lose shares.
Data sources and supplementary literature
FAO. FAOSTAT. https://www.fao.org/faostat World Population Review. Continents. https:// worldpopulationreview.com/continents
Windhorst, H. W. (2021). The red white shift in global meat production. Zootecnica International, 43(5), 32–37.
Windhorst, H. W. (2024). Was it the decade of Asia? The dynamics of global meat and egg production between 2012 and 2022. Meatingpoint, (54), 60–64.
Windhorst, H. W. (2024). South America – the continent of cattle and chickens. Meatingpoint, (55), 12–15.
Windhorst, H. W. (2025). Oceania – disadvantage of peripheral location. Fleischwirtschaft International, (1), 14–21.
Windhorst, H. W. (2025). ASEAN – The dynamics of the meat industry. Fleischwirtschaft International, (2), 46–51.
IMPACT OF HATCHERY CLIMATE
CONTROL AND VENTILATION ON HATCHABILITY AND POSTHATCH
CHICK QUALITY
Climate control and ventilation are two of the most important factors affecting hatchery performance, which have an impact on both embryonic development and post-hatch chick quality. A hatchery is an artificial replication of the natural brooding environment where the embryo’s normal physiological development is ensured by careful regulation of temperature, humidity, airflow, CO2 and oxygen. In order to produce healthy, uniform chicks with high vitality and lower first week mortality as well as to achieve optimal hatchability, it is vital to maintain a stable microclimate throughout the incubation and hatching process.
➤ Rasel Ahmed Incubation & hatchery management specialist
What is climate control and ventilation in a hatchery?
The systematic control of temperature, relative humidity, air pressure and gas balance (O2 and CO2) in the incubation (setter and hatcher) and fresh air chambers or rooms is known as climate control in a hatchery.
On the other hand, ventilation involves continuous movement and exchange of air to maintain uniform temperature distribution, provide enough oxygen, remove metabolic heat and CO2 generated by developing embryos. When combined, these systems provide a clean, balanced air environment that prevents embryos from suffocation, dehydration and heat stress.
Relationship with embryonic development and chick quality
The embryo produces CO2 and metabolic heat during incubation. Without proper ventilation, CO2 level rises, oxygen availability decreases and as a result embryonic metabolism slows. Prolonged exposure to these conditions leads to delayed development and higher late embryonic mortality. Humidity and temperature are equally important. Variations of even ±0.3 °C can change metabolic rates, which can lead to poor chick vitality, unabsorbed yolk sacs and early or delayed hatching.
Excessive humidity inhibits the growth of air cells and excessive dryness speeds up eggs moisture loss, which lowers hatchability and chick uniformity.
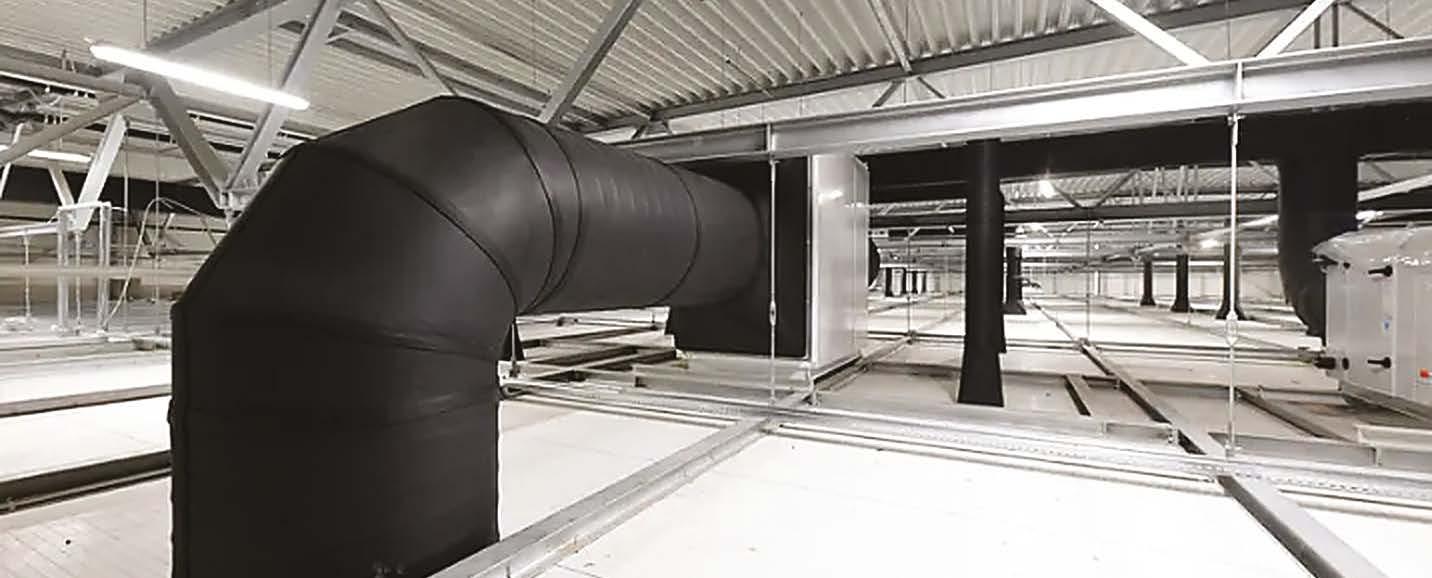
Fresh air supply duct
Proper climate controls therefore support not only embryonic respiration but also organ formation, muscle development and thermoregulatory capacity of the newly hatched chick.
The biology behind airflow
During incubation, embryonic metabolism depends on aerobic respiration. Eggshell contains as many as 7,000 17,000 small holes called "pores" through which oxygen passes from the air to the developing embryo and CO2 diffuses outward. The efficiency of this exchange is driven by partial pressure differentials between the egg’s internal environment and the surrounding air.
If the air surrounding the eggs becomes saturated with CO2 or lacks oxygen due to poor ventilation, then gas exchanges slow leading to hypoxia and acidosis. These physiological imbalances affect cardiac development, organ function and muscular growth, ultimately compromising chick vitality. Furthermore, inadequate air circulation results in temperature layering, where the top trays may overheat while the lower ones remain cool, leading to asynchronous embryo development and reducing hatch uniformity.
How does poor ventilation affect hatch results?
Inadequate or unbalanced ventilation is one of the leading hidden causes of hatch variability. Its impact is both physiological and mechanical:
• High CO₂ concentration reduces
oxygen availability, causing delayed hatching and increased embryo mortality.
• Uneven air temperature produces hot and cold zones within incubators, resulting in early or late hatches and uneven chick sizes.
• Low air exchange fails to remove metabolic heat and moisture, increasing condensation, bacterial load and chick dehydration.
• Excessive air exchange leads to low humidity, excessive weight loss and poor hatch uniformity.
Inconsistent air management often manifests as sticky chicks, unhealed navels, malpositions, and weakened post hatch performance, all of which translate into financial losses for the hatchery.
The ideal ventilation strategy
An ideal ventilation strategy in a hatchery is built on three interdependent principles: air quality, air distribution, and air pressure control, each working together to maintain a stable, uniform environment for developing embryos.
First, air quality control ensures a constant supply of clean, oxygen rich air and the removal of excess CO₂ and heat. Fresh air entering the hatchery should contain at least 20.6% oxygen, while CO₂ levels inside setters must stay below 0.5%.
Air handling units (AHUs) condition and filter the incoming air to 24–26 °C and 60–70% relative humidity before delivery, maintaining a steady air exchange rate of about 2.5–3.0 m³/h per 1,000 eggs to support healthy embryonic respiration. Second, achieving uniform air distribution is essential for temperature balance. Air velocity inside setters should remain around 0.3–0.5 m/s, enough to mix air evenly but not to dry eggs, while in hatchers it can be slightly lower. Proper duct design and diffuser placement prevent dead zones or short circuits, ensuring every egg experiences the same conditions. Finally, directional airflow and pressure control protect both embryo health and biosecurity. Positive pressure of +5 to +15
Air distribution inside incubator
Eggshell pores
Parameter Setter Hatcher Biological purpose
Temperature 37.5-37.8 °C (99.5-100 °F) 36.8–37.2 °C (98.2-99 °F)
Maintains metabolic balance and optimal embryonic enzyme activity
Relative humidity 50-60% 65-70% Controls egg moisture loss and supports membrane hydration during hatch
CO2 level 0.3-0.5% <0.6% Regulates respiratory stimulation and chick hatching activity
O2 level ≥20.6% ≥20.4% Supports aerobic metabolism and cellular oxygenation
Air velocity 0.3-0.5 m/s 0.2-0.3 m/s
Air exchange rate 2.5-3.0 m³/h per 1,000 eggs
Standard hatchery climate and ventilation parameters
Ensures uniform air temperature and gas distribution
Removes metabolic heat and CO2 and maintains fresh air balance
Hatchery ventilation system
Pa in clean areas keeps air moving from incubation zones toward service or the chick rooms, avoiding contamination. Regular maintenance cleaning filters, calibrating sensors and checking ducts keep the system balanced and reliable.
When these elements are correctly synchronized, ventilation becomes more than mechanical movement; it becomes a biological safeguard that translates precision engineering into strong, uniform and healthy chicks.
A sound ventilation strategy must therefore:
1. Supply fresh, oxygen rich air evenly across all machines.
2. Remove heat and metabolic gases produced by embryos.
3. Maintain uniform air distribution within and between incubators.
4. Preserve optimal humidity by controlling air exchange rates.
Equipment and maintenance
essentials
Efficient climate and ventilation management rely on:
1. Air handling units (AHU) with integrated heating, cooling and filtration modules.
2. Sensors for CO2, humidity and temperature calibrated regularly.
Hatchery
If the air surrounding the eggs becomes saturated with CO₂ or lacks oxygen due to poor ventilation, then gas exchanges slow leading to hypoxia and acidosis
3. Chillers and heaters to stabilize incoming air temperature.
4. Humidifiers/dehumidifiers to manage relative humidity precisely.
5. Fans and diffusers with adjustable dampers to direct airflow evenly.
6. PLC based automation systems for control, alarms, and data recording.
Routine preventive maintenance such as clean filters, checking fan bearings and belts, calibrating probes and verifying duct seals is essential to prevent system drift and maintain climate uniformity.
Conclusion
Ventilation is the biological regulator of the hatchery environment and is much more than just air movement. Proper climate control and ventilation strategy translate engineering precision into biological success. When the hatchery atmosphere remains stable, clean, cool and balanced, then every embryo has the same opportunity to develop into a strong, uniform chick. Consistency in climate means consistency in performance. For every hatchery aiming to convert potential into profitability, climate control is not optional, it is fundamental.
ON-FARM HATCHING: AN INNOVATIVE EARLY-FEEDING
STRATEGY THAT IMPROVES WELFARE AND REDUCES
ANTIMICROBIAL USE IN A SUSTAINABLE WAY
On-farm hatching is an innovative hatching technique that provides early feeding post hatch to newborn chicks. Several experimental studies and field trials show that flocks hatched on-farm have better intestinal health and health in general, resulting in fewer antibiotic treatments and better welfare.
➤ Hilde Van Meirhaeghe1,2, Giuditta Tilli1, Maarten De Gussem1,2
2Faculty of Veterinary Medicine, University of Ghent, Salisburylaan 133, 9820, Merelbeke, Belgium
It is a challenge for the poultry industry today to meet consumer demands for more welfare and less antimicrobial use in a sustainable way with good return on investment (ROI) for the producers.
The main indications for antimicrobial use (AMU) in broilers occur during the first week of life, against bacterial translocation and septicemia (e.g., E. coli, Enterococci) and after three to four weeks for intestinal problems such as coccidiosis and dysbacteriosis (Joosten et al., 2019).
Why early feeding?
Hatching chicks in a hatchery was a great invention that made the expansion of the poultry industry possible. To do this successfully all chicks must hatch within a narrow hatch window, to avoid earlyhatched chicks becoming dehydrated. After hatch, chicks need to be transported to the farm before they have access to feed and water. Nature has provided the chick with a reserve of nutrients inside the yolk sac for three days. Therefore, chicks will not starve if not fed, but they use all the energy, fat and protein from the yolk to survive. By providing early feeding, additional nutrients can be used to start
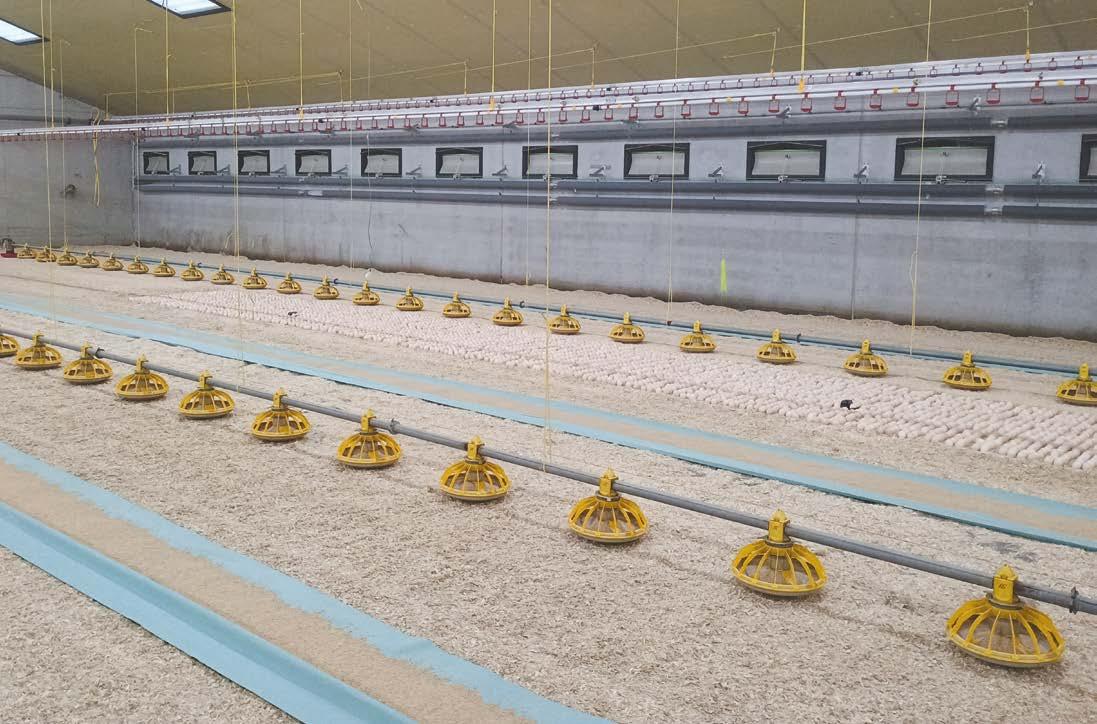
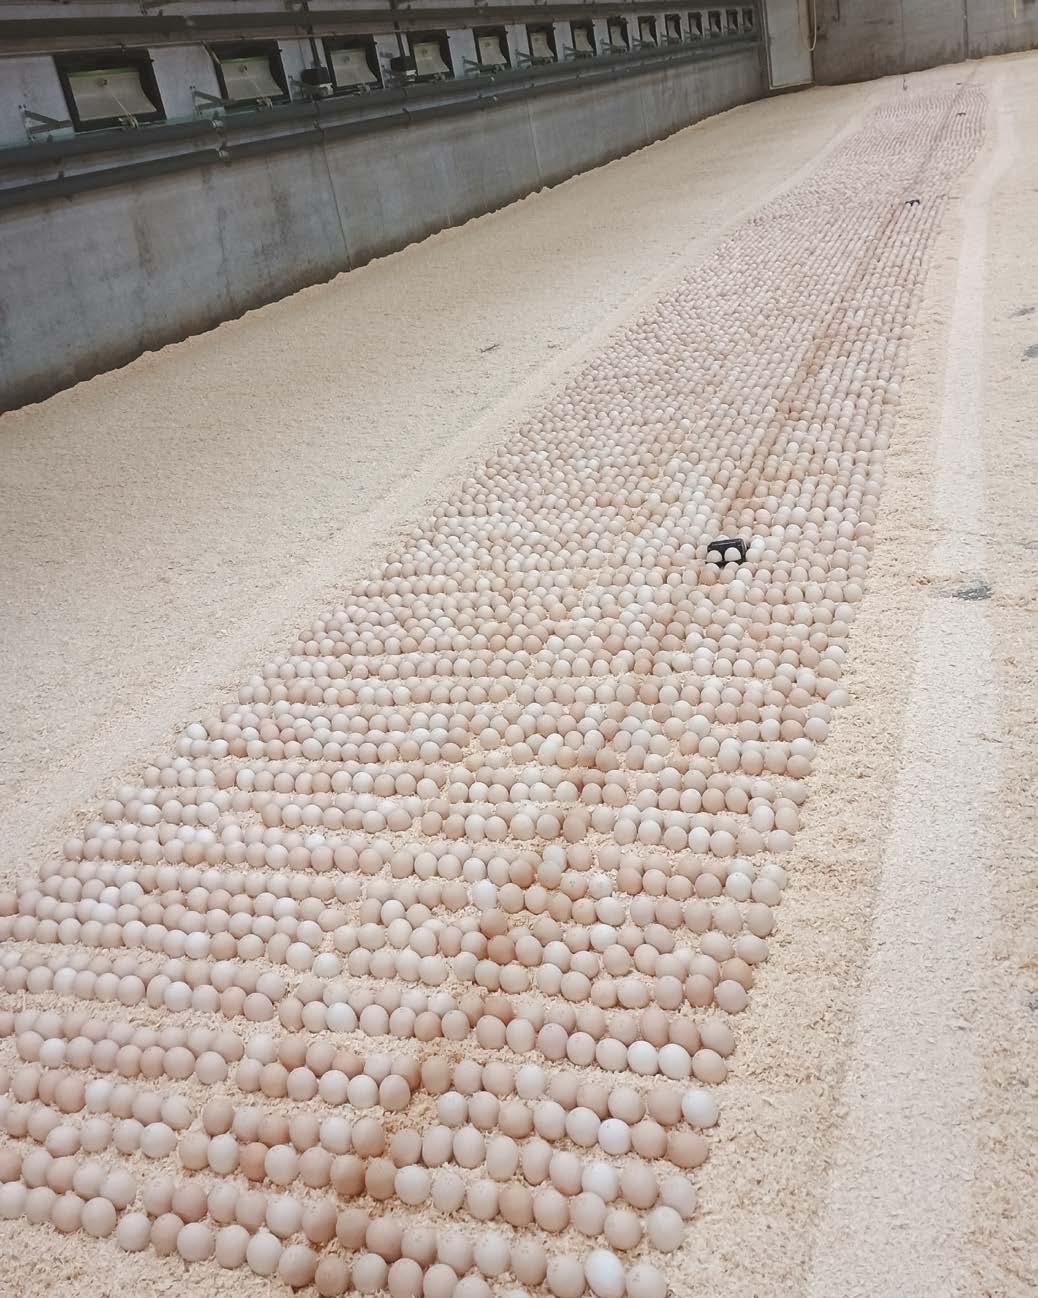
Examples of on-farm hatching eggs in a Belgian broiler farm
early development, maturation and growth: chicks get a better start. Early feeding will enhance the development of intestines and the immune system. The intestinal villi have greater capacity to absorb nutrients. Early establishment of the intestinal microbiome and faster closure of tight junctions make a more functional gut barrier to avoid bacterial translocation. It seems controversial but with early feeding the yolk sac is reabsorbed faster, so maternal antibodies are more effective. Early feeding makes the metabolic level higher so chicks can keep up their body temperature. To get most of the genetic potential in performance, intestinal health is very important. The effect of early feeding on performance is most significant in the first weeks (de Jong et al., 2020). Early feeding makes the intestinal tract better equipped to resist intestinal diseases like coccidiosis and dysbacteriosis, resulting in fewer wet litter problems and consequently fewer painful conditions like footpad dermatitis, hock burn and breast blisters.
Early feeding can be done pre- and post- hatch. Several experimental studies have shown benefits of in-ovo early feeding at transfer (Uni et al., 2005), but none of these studies resulted in practical applications until now. After hatching, early feeding can be done in the hatcher or by hatching the eggs on the farm. In this article we focus on the latter.
On-farm hatching
On-farm hatching is not only a system to deliver early feeding, but also to hatch chicks in a more comfortable environment with less stress. Eggs are incubated in the hatchery until transfer at D18. After candling, infertile eggs are removed, and instead of being placed in the hatcher are transported to the farm and placed in the house in trays or on the litter to hatch. Just as in the hatcher the environment in the house needs to be controlled and eggshell temperature is measured with ovoscans. The house is heated to 34 °C with floor and litter temperature 28 °C. About 50 g of feed per chick is put on paper close by where eggs are placed. The chicks start hatching as from D19 until D21 like in the hatchery, but feed and water are immediately available, so no risk of dehydration of the early hatched chicks. Another advantage is that there is less stress for the chicks, no
Examples of on-farm hatching eggs in a Belgian broiler farm
handling of the chicks and no transport. The infection pressure of pathogens and dust is lower in the house compared to the hatcher machine and less risk of crosscontamination. Challenges for the farmer are that it is more labor intensive: three days extra care, non-hatched eggs need to be removed, and non-viable chicks need to be selected in the first week. Empty eggshells can remain in the litter. Hatchability is comparable or even better than conventional hatching, taking into account selection of second grade chicks. The number of chicks is calculated at D7 based on number of eggs placed, removed non-hatched eggs and first week selection. Compared to conventional hatching, there is a higher cost for three days extra heating and if the farmer wants to do the same number of cycles per year, sanitary void is shorter.
Reduced antimicrobial use
■ Table 1 – Summary of pros and cons of on-farm hatching
Pros Cons
• Welfare:
• Less stress
• Larger hatching window
• No handling, no transport
• Performance first weeks improved
• Better gut health → less antibiotic use
• Better coccidiosis control
• Less Enterococci
• Better footpad scores
• No effect of formalin
A recent study (Jerab et al., 2023) compared antimicrobial use in flocks hatched conventionally and flocks hatched on farm. There was a reduction in the use of antimicrobials in on-farm hatched flocks, mainly because there was less AMU in first week and for locomotory problems (Enterococcus spp.) and fewer intestinal diseases. In the study 15% of all flocks were raised without antibiotics, 48% of these were on-farm hatched versus only 12% conventionally hatched.
What are the practical issues?
It is important that the climate in the house is well controlled, especially from ED18-ED21, just like in the hatchery eggshell temperature has to be monitored, so the farmer can adjust at all times.
Special attention is needed to clean the waterlines, because of high temperatures for three days the waterlines need to be flushed regularly.
Non hatched eggs can contain live embryos, so for welfare reasons they need to be removed and euthanized in a humane way. Depending on the system, this can be easier and faster if they remain in a tray, than if each egg has to be picked up manually.
Biosecurity risks need to be avoided: all equipment -trays, support system, robots used on different farms and going back to the hatchery have to be properly cleaned and disinfected.
Vaccination of the day-old chicks on farm can be challenging. Many vaccines (e.g. Newcastle disease, Gumboro, coccidiosis) can be administered in-ovo at transfer in the hatchery. Some vaccines (infectious bronchitis) need to be sprayed at the farm, with special spray machines that can reach more than 4 meters so the chicks can be reached from the side without walking through them.
• Lower infection pressure at hatching
• Motivation for the farmer
Conclusions
• Short sanitary void
• Labour intensive for the farmer
• ED18-ED21 extra time to care
• Removal unhatched eggs and selection
• Water in drinking lines at 34 °C
• Expertise hatchery – farmer?
• Higher cost for heating
• Cost of infrastructure?
• Vaccination can be a challenge
On-farm hatching is an innovative technique to hatch chicks with less stress and reduced risk of infection. Chicks have immediate access to feed and water, this improves early development of a healthy gut and a strong immune system to resist diseases in general, so fewer antimicrobial treatments are needed.
On-farm hatching is a promising innovative strategy to improve welfare and performance and reduce antimicrobial use (Table 1).
Today on-farm hatching is mainly used in broilers, but maybe in the future, combined with early sexing techniques, it could also be used in layers and breeders.
Bibliography
Joosten, P., Timmerman, A., & Van den Broek, J. (2019). Quantitative and qualitative analysis of antimicrobial usage at farm and flock level on 181 broiler farms in nine European countries. Journal of Antimicrobial Chemotherapy. https:// doi.org/10.1093/jac/dky498
de Jong, I. C., van Riel, J. W., & van Krimpen, M. M. (2020). Effects of early feeding on broiler performance and gut health. Poultry Science, 99(7), 3456–3468. https://doi. org/10.1016/j.psj.2020.06.052
Uni, Z., Ganot, S., & Sklan, D. (2005). In-ovo feeding improves early growth and gastrointestinal development in chicks. Poultry Science, 84(5), 764–770. https://doi. org/10.1093/ps/84.5.764
Jerab, J. C., Smith, L., & Kovac, M. (2023). Impact of on-farm hatching on antimicrobial use and broiler welfare. Animals, 13(32), 3270. https://doi.org/10.3390/ ani13203270
HOW TO CORRECTLY LOAD INCUBATORS WITH EGGS FROM DIFFERENT FLOCKS
Incubators are ideally loaded with eggs from one single flock that have all been stored for the same period of time. In modern, large-scale hatcheries, however, egg batch mixing is often inevitable. This article explains how to load incubators with eggs from different flocks and, at the same time, minimize losses in hatchability and chick uniformity.
➤ Fien Vanlerberghe
R&D project engineer– Petersime NV
Temperature and embryo development
Temperature differences in the incubator contribute to a wider hatch window and, consequently, negatively affect hatch results. When the eggshell temperature is maintained at approximately 100 °F (37.8 °C), the embryos will develop at the ideal rate, resulting in the chicks hatching at around 21 days. If the temperature deviates from that ideal situation, it will impact the rate of embryonic development and hatching time. Therefore, by keeping the difference between the highest and lowest temperatures inside the incubator as small as possible, the highest percentage of healthy, uniform day-old chicks can be reached.
Each incubator is different
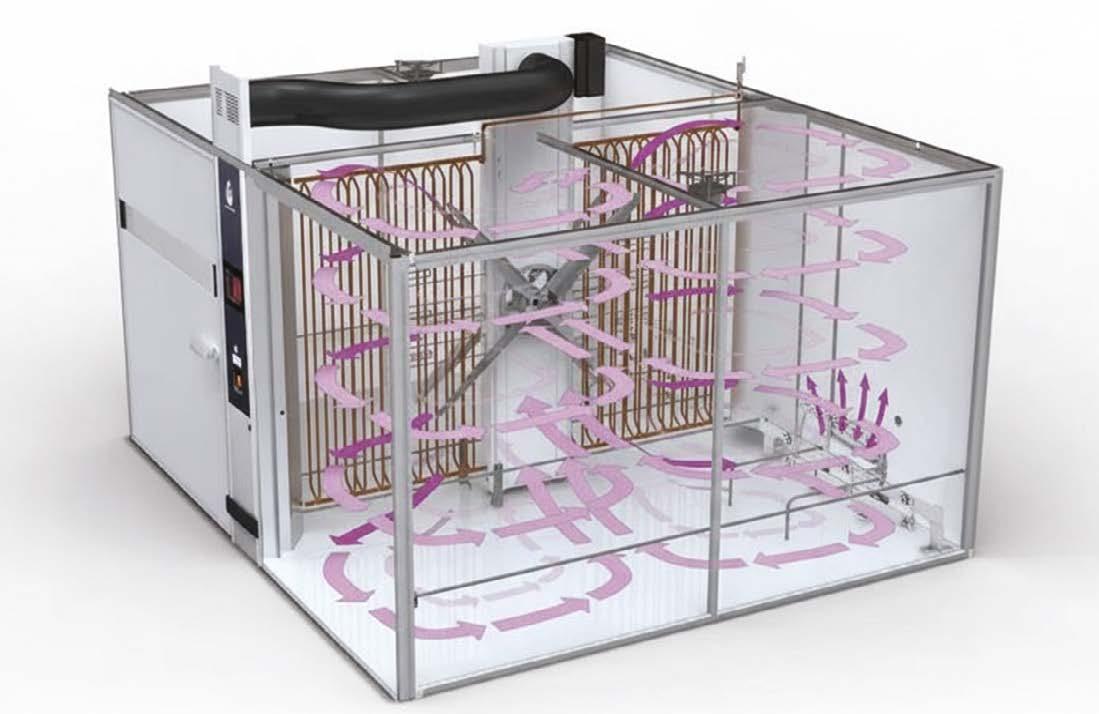
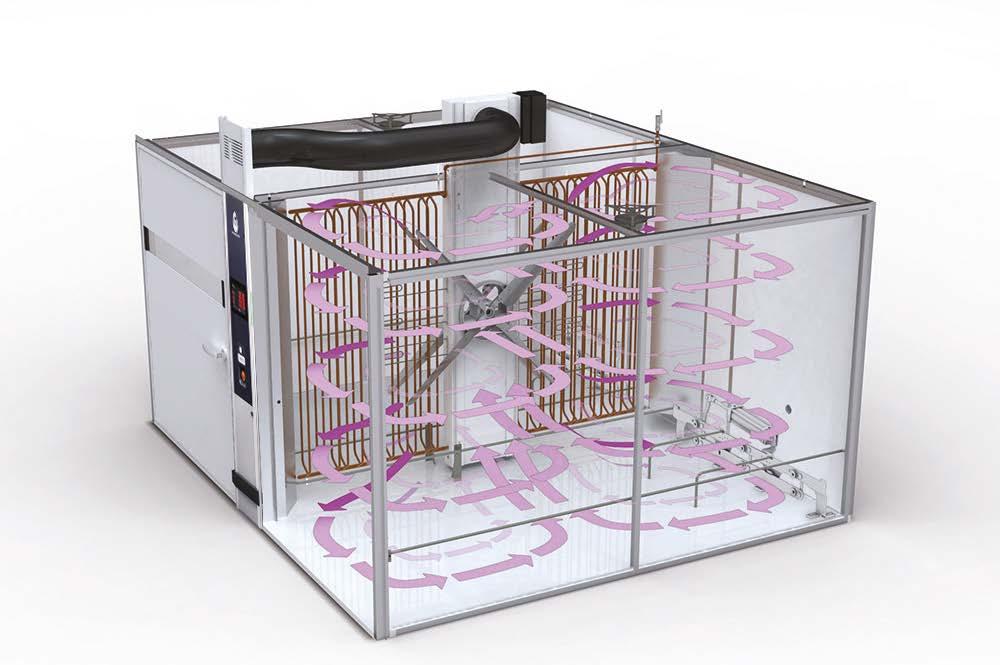
Each incubator manufacturer has its own way of monitoring and regulating the micro-environment around the eggs in setters and hatchers. Everything depends on the machine layout and design in relation to heating and cooling patterns and airflow dynamics. In Petersime incubators, an optimal spiral airflow distribution is guaranteed (Figure 1). The setter’s and hatcher’s central mixing fan ensures that the airflow is the same on the left and right side of the fan. This means the cooling, heating and ventilation conditions are perfectly mirrored in each incubator.
Loading eggs from different flocks
Hatchery staff should ideally load the setters with eggs from one single flock that have all been stored for the same
period of time. Those eggs will have about the same size and produce about the same amount of heat at about the same moment in time. However, if not enough eggs from the same source are available to fill a setter, egg batch mixing will be unavoidable.
To prevent that egg batch mixing leads to uneven temperatures inside the machine and, consequently, results in a wide hatch window and poor chick uniformity, using the technique of balanced loading to achieve optimal thermal uniformity is important.
Thermally balanced loading
Balanced loading is all about setting a mix of eggs with different backgrounds while taking into account their level of heat production and the point in time at which that heat is produced, along with the airflow distribution and location of the cooling elements inside the setter. There are three factors to consider: flock fertility, flock age and storage time. Based on those factors, three general rules of thumb are:
1. An egg mass from a “prime” flock with high fertility (between 30 and 44 weeks of age) will produce more heat than an egg mass from a low fertility flock.
2. Large eggs (from older flocks) contain yolk that has a higher energy value, causing the embryos to grow more, which produces more heat.
3. Eggs that have been stored for a longer period of time will produce heat at a later point than eggs that have been stored only a short time.
When taking these rules of thumb into account, the following general setter loading scheme can be drawn:
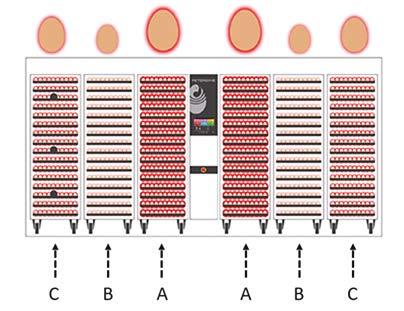
• Positions C: middle fertility, middle-aged flock, middle storage time
Important note: setter trolleys equipped with Petersime’s OvoScan™ technology are always loaded with eggs with
▲ Figure 1 – Petersime single-stage incubator with central mixing fan and spiral airflow distribution
▲ Figure 2 – Correct setter loading pattern according to differences in heat production
medium heat production and are positioned near the left wall of the setter (see Figure 2: 3 OvoScan™ sensors, position C on the left)
Some further points of attention are:
• Generally, it is advised not to exceed more than 10 weeks of difference in flock age, 7 days of difference in storage time and 10% difference in fertility.
• Never start an incubation cycle when the machine is not fully loaded. If you do, any measures taken regarding balanced loading will be ineffective.
Following the above guidelines will result in an optimal heat balance distribution of the eggs in the setter.
Transfer from setter to hatcher
Correctly loading the hatcher starts where it ends for the setter: at transfer. During the hatching process, the embryos undergo the most critical biological transitions (internal pipping, external pipping and shell emergence), which demands very specific environmental conditions. By loading the hatchers with eggs that are as uniform as possible, each hatcher can use a specific incubation profile according to the heat production of the eggs inside and the embryos’ needs.
As one single hatcher should ideally be loaded with uniform eggs, they should all come from the same specific positions in the balanced loaded setter. The example
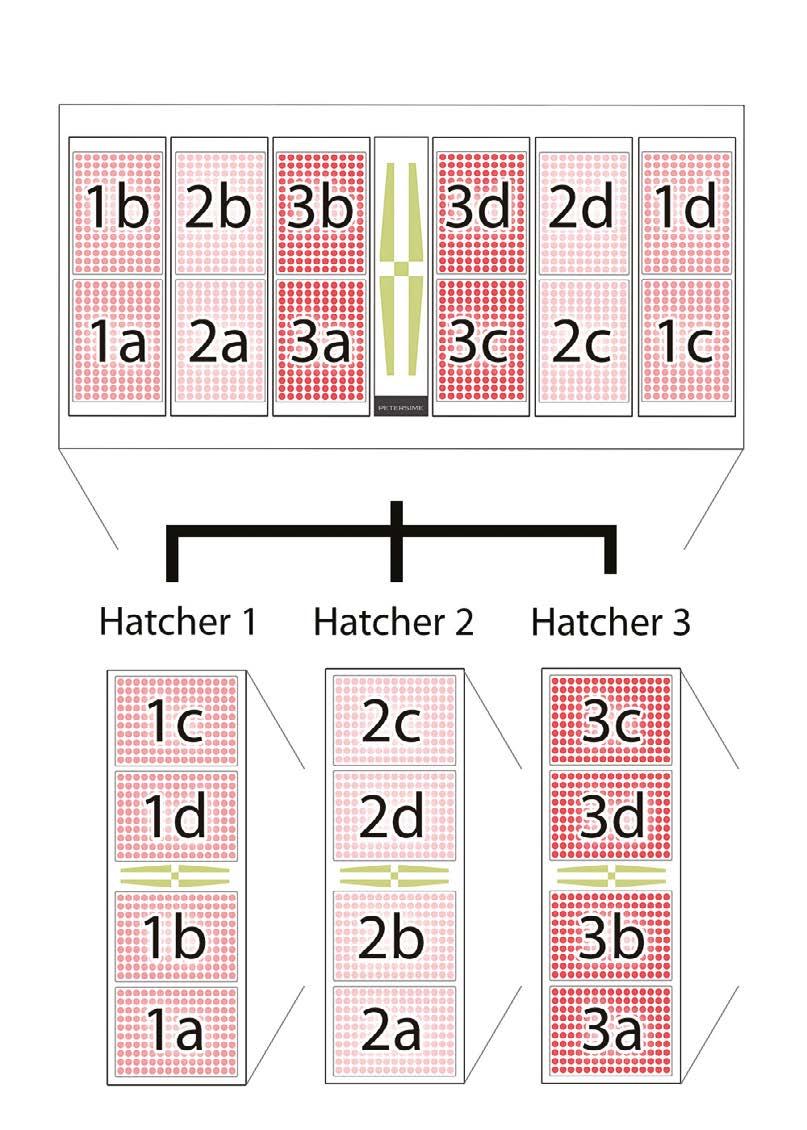
▲ Figure 3 – Example of transfer pattern for one setter of 12 trolleys to three hatchers of 4 trolleys each
below ( Figure 3 ) shows how to put that theory into practice, taking the example of transferring one setter of 12 trolleys to three hatchers of 4 trolleys each:
• Hatcher 1: all eggs with medium heat production (positioned near the wall – 1a 1b 1c 1d)
• Hatcher 2: all eggs with low heat production (positioned in the centre – 2a 2b 2c 2d)
• Hatcher 3: all eggs with high heat production (positioned near the central mixing fan – 3a 3b 3c 3d)
The same principle applies for configurations of setters and hatchers with other capacities.
Optimal heat balance for optimal hatch results
Successful incubation depends on an optimal heat balance and, as such, the trolleys’ position inside the incubator. By keeping the difference between the highest and lowest temperatures inside the machine as small as possible, the highest percentage of healthy day-old chicks with high uniformity can be obtained.
During the hatching process, the embryos undergo the most critical biological transitions (...), which demands very specific environmental conditions
CONTINUOUS MONITORING AND CONTROL OF MYCOPLASMA FOR SUSTAINABLE POULTRY PRODUCTION
Mycoplasma gallisepticum (MG) and Mycoplasma synoviae (MS) remain persistent pathogens in poultry, causing respiratory disorders, synovitis, uneven growth, and reduced egg production. Determining the true source and timing of infection is critical for targeted interventions. Continuous monitoring using serology (ELISA) and molecular diagnostics (PCR and sequencing) enables differentiation between vertical transmission, hatchery contamination, and farm-level infection. Combining antibody kinetics and PCR results allows estimation of infection timing, improving decision-making for control measures. This article presents practical surveillance strategies, source analysis, and integrated control measures to sustain poultry production.
➤ Nader Rangsaz
Poultry Veterinarian (DVM), Faculty of Veterinary Medicine, Islamic Azad University, Shahrekord, Iran, Member of the Young Researchers Club n.rangsaz@gmail.com
Introduction
MG and MS infections remain major challenges in commercial poultry. The production pyramid from GGP to broilers creates multiple points of potential contamination. A positive test alone does not indicate the source or timing of infection. Understanding whether infection originates from:
hatchery contamination > during incubation or handling
farm-level infection > within the parent stock farm is essential for effective interventions, reducing unnecessary culling, and preserving production efficiency.
Economic impact in both breeders and broilers
MG and MS reduce growth rate, feed efficiency, egg production, and hatchability, leading to significant
■ Table 1 – Recommended mycoplasma surveillance plan
Production stage Initial screening Routine monitoring Test/ Sample type
GGP 300 birds at 16 wks 40 birds every 28 days (~150/ quarter)
GP 150 birds at 16 wks
75 birds per house every 90 days
Parent Stock 30 males before transfer 30 birds at 36–38 and 48–50 weeks
ELISA + PCR (tracheal swabs)
ELISA + PCR
ELISA + PCR; sequencing if positive
Hatchery 5 samples per location Each production cycle Swabs; FTA cards for PCR
Broilers 5 samples per house As needed (suspected cases) PCR; tracheal/choanal swabs
■ Table 2 – Source analysis of mycoplasma infection
Production stage Sample type
Result (ELISA/PCR) Possible source Evidence / Reasoning
GGP Tracheal swabs Negative –
No infection detected; source unlikely to be top-level
GP Tracheal swabs Negative –GP negative; vertical transmission unlikely
Parent Stock ELISA 36–38 weeks Positive Hatchery or farm
performance losses across the poultry industry. In broiler breeders, infection compromises reproductive efficiency, reduces egg quality, and lowers hatchability, while also producing weaker day-old chicks with reduced viability. These consequences not only decrease productivity but also may lead to trade restrictions, since certification programs often require Mycoplasma-free status. In broilers, infection is associated with airsacculitis, uneven growth, poor feed conversion, and higher carcass condemnations at processing plants. Although mortality may remain relatively low, the cumulative impact on flock uniformity and market weight is considerable. Importantly, co-infections with pathogens such as E. coli, Newcastle disease virus, or infectious bronchitis virus often exacerbate the clinical and economic effects of mycoplasmosis. Vertical transmission perpetuates infection down the production pyramid, while hatchery or farm-level contamination can trigger sporadic outbreaks. Therefore, accurate source tracking and infection timing
■ Table 3 –
Interpretation of M. Gallisepticum ELISA titers 6-12 weeks post vaccination with live M. Gallisepticum vaccine*
*A titer of ≥ 668 is positive.
estimation are crucial to minimize economic losses and to implement effective corrective measures.
Monitoring plan and source analysis across the production pyramid
Monitoring should cover all pyramid levels, with key periods at pre-vaccination, pre-transfer, and peak production. Serology (ELISA) identifies immune response, PCR detects the pathogen, and sequencing confirms strain identity to determine the true source. A structured monitoring program must align with the expected antibody response after vaccination. In practice, blood samples collected at different ages help confirm maternal antibody transfer. Sampling at around three weeks of age provides baseline data to document the natural decline in maternal antibodies. Baseline testing at 10 weeks ensures that the flock remains negative, while an additional test at 15 weeks, before transfer to the production site, confirms the negative status prior to movement.
Positive in chicks from GP, GP negative > likely hatchery or farm-level
Contamination detected in hatchery samples > supports hatchery as source
PCR strain matches parent stock or hatchery > confirms source
With vaccination commonly performed at six weeks, marking the start of active immunity, post-vaccination monitoring at 21 weeks, prior to peak lay, is critical. Using ELISA, typical titers following MG F-strain vaccination range between 2,000–8,000, while ts-11 usually produces 1,000–3,000 (30–70% positives). For MS-H vaccine, mean titers are expected in the range of 500–3,000 without wild challenge. Any values significantly above these levels (e.g. >5,000–23,000 with 90–100% seropositive samples) strongly suggest field infection rather than vaccine response. Additional monitoring at 32 weeks (to detect breakthrough
■ Table 4 –
Interpretation
M. Synoviae
ELISA titers
6-12 weeks post vaccination with live M. Synoviae vaccine*
*A titer of ≥ 668 is positive.
infections), 44 weeks (to evaluate vaccine duration), and 55 weeks (for end-of-lay cycle status) provides mid- and late-production surveillance, ensuring that no breakthrough infections occur. This approach allows managers to clearly separate normal vaccine serology from true Mycoplasma challenge and to implement corrective actions in time. Monitoring for antibodies must be carried out prior to vaccination with live vaccines.
Enzyme-linked immunosorbent assays can be used to differentiate vaccinated flocks from those undergoing a challenge.
Timing of infection using antibody kinetics
Key points
Maternal antibodies decline over time; a positive titer at day 1 reflects maternal transfer;
a rising titer after the decline indicates natural infection; the slope helps estimate infection timing;
comparison with vaccination differentiates vaccine response from natural infection;
serial sampling is required for precise estimation;
PCR confirmation supports timing estimate and identifies the strain.
Diagnostic approaches
ELISA: large-scale flock screening;
PCR: rapid detection and strain differentiation;
culture and immunofluorescence: gold standard, but it is costly and slow (up to 4 weeks), typically reserved for certification and research.
At least two independent positive results are recommended for confirmation; titers > 1:80 (or kit cutoff) indicate infection.
Control and prevention
Elimination: cull positive breeders to prevent vertical spread;
vaccination: live (F, 6/85, TS-11, and MS-H) or inactivated vaccines; PCR differentiates vaccine from field strains;
antibiotics: mycoplasmas are generally susceptible to macrolides, tetracyclines, fluoroquinolones and the combination of
lincomycin and spectinomycin to reduce clinical signs; biosecurity and sourcing: hygiene, audits, certified Mycoplasma-free source;
continuous monitoring: ensures early detection and source identification.
Conclusion
Identifying the true source and approximate timing of infection is critical. Combining ELISA kinetics, PCR, sequencing, clinical observation, and necropsy allows differentiation between vertical, hatchery, and farm-level infection. Accurate source and timing identification prevent unnecessary culling, focuses interventions, and improves flock sustainability. MG and MS threaten flock health and productivity. Continuous monitoring, molecular and serological diagnostics, biosecurity, and vaccination are essential. Source identification and timing estimation enable targeted control, reducing economic losses and sustaining poultry production.
Mycoplasma colonies
References
1. Achari, R., & Morrow, C. (2018). Diminishing Control of Avian Mycoplasmas. Association of Avian Health Professionals, India.
2. BioChek. (s.d.). Live Mycoplasma Vaccines and the Use of Monitoring: Interpretation of BioChek MG ELISA titers 6–12 weeks post vaccination with Live MG vaccines. BioChek Application PDF.
3. Ferguson-Noel, N. (2014). Control of Avian Mycoplasmosis. The Poultry Informed Professional, University of Georgia.
4. Kleven, S.H. (2000). Mycoplasma Update. The Poultry Informed Professional, University of Georgia.
5. Morrow, C.J. (2017). Practical Mycoplasma Control for Poultry Production in Asia. International Production Poultry, 25(1), 35–37.
6. Rosales, A.G. (2019). Mycoplasmosis Prevention and Control in Broiler Breeders and Broilers. Aviagen.
Structure of mycoplasma
Tracheal swab
Hatcheries
Breeders
◗ Upcoming Events 2026
APRIL, 28 to 30
NIPOLI EXPO 2026
Nigeria Poultry and Livestock Expo
MARCH, 10 to 12
TSPC 2026
18th Turkey Science and Production Conference
Carden Park Hotel and Golf Resort
Chesire, United Kingdom Web: www.tspc turkeys.com
MARCH, 10 to 12
Victam Asia 2026
BITEC Exhibition Center
Bangkok, Thailand
Email: expo@victam.com Web: www.victamasia.com
MARCH, 16 to 18
WPDC 2026
Western Poultry Disease Conference
Hyatt Regency Mission Bay Spa and Marina
San Diego, CA, USA Web: www.wpdcfoundation.org
APRIL, 14 to 16
PEAK 2026
Minneapolis Convention Center Minneapolis, MN, USA