ACTA FACULTATIS XYLOLOGIAE ZVOLEN
VEDECKÝ ČASOPIS
SCIENTIFIC JOURNAL
Vedecký časopis Acta Facultatis Xylologiae Zvolen uverejňuje pôvodné recenzované vedecké práce z oblastí: štruktúra a vlastnosti dreva, procesy spracovania, obrábania, sušenia, modifikácie a ochrany dreva, termickej stability, horenia a protipožiarnej ochrany lignocelulózových materiálov, konštrukcie a dizajnu nábytku, drevených stavebných konštrukcií, ekonomiky a manažmentu drevospracujúceho priemyslu. Poskytuje priestor aj na prezentáciu názorov formou správ a recenzií kníh domácich a zahraničných autorov.
Scientific journal Acta Facultatis Xylologiae Zvolen publishes peer-reviewed scientific papers covering the fields of wood: structure and properties, wood processing, machining and drying, wood modification and preservation, thermal stability, burning and fire protection of lignocellulosic materials, furniture design and construction, wooden constructions, economics and management in wood processing industry. The journal is a platform for presenting reports and reviews of books of domestic and foreign authors.
VEDECKÝ ČASOPIS DREVÁRSKEJ FAKULTY, TECHNICKEJ UNIVERZITY
VO ZVOLENE 68 1/2026
SCIENTIFIC JOURNAL OF THE FACULTY OF WOOD SCIENCES AND TECHNOLOGY, TECHNICAL UNIVERSITY IN ZVOLEN 68 1/2026
Redakcia (Publisher and Editor’s Office): Technická univerzity vo Zvolene (Technical university in Zvolen); TUZVO Drevárska fakulta (Faculty of Wood Sciences and Technology)
T. G. Masaryka 2117/24, SK-960 01 Zvolen, Slovakia
Redakčná rada (Editorial Board):
Predseda (Chairman): prof. Ing. Mariana Sedliačiková, PhD., TUZVO (SK)
Vedecký redaktor (Editor-in-Chief): prof. Ing. Ladislav Dzurenda, PhD., TUZVO (SK) Členovia (Members): prof. Bc. RNDr. Danica Kačíková, MSc. PhD., TUZVO (SK) prof. Ing. Ivan Klement, CSc., TUZVO (SK) prof. Ing. Ján Sedliačik, PhD , TUZVO (SK) doc. Ing. Iveta Čabalová, PhD., TUZVO (SK) doc. Ing. Richard Kminiak, PhD., TUZVO (SK) doc. Ing. Rastislav Lagaňa, PhD. et PhD., TUZVO (SK) doc. Ing. Miroslava Mamoňová, PhD., TUZVO (SK) doc. Ing. Hubert Paluš, PhD., TUZVO (SK) doc. Ing. Zuzana Tončíková, ArtD., TUZVO (SK) Jazykový editor (Proofreader): Mgr. Žaneta Balážová, PhD. Technický redaktor (Production Editor): Ing. Michal Dudiak, PhD.
Medzinárodný poradný zbor (International Advisory Editorial Board): Antov Petar Yordanov (Univ of Forestry, BG), Bekhta Pavlo (Ukrainian Nat Forestry Univ, UA), Deliiski Nencho (Univ of Forestry, BG), Hua Lee Seng (UiTM Cawangan Pahang, MY), Jelačić Denis (Univ Zagreb, HR), Kasal Bohumil (Tech Univ Carolo Wilhelmina Braunschweig, DE), Lubis Muhammad Adly Rahandi (Kyungpook Nat Univ, ID), Marchal Remy (Arts & Metiers ParisTech, FR), Németh Róbert (Univ Sopron, HU), Niemz Peter (Bern Univ Appl Sci, Architecture Wood & Civil Engn, CH), Orlowski Kazimierz A.(Gdansk Univ Technol, PL), Pohleven Franc (Univ Ljubljana, SI), Rogoziński Tomasz (Poznań Univ of Life Sci, PL), Teischinger Alfréd (Univ Nat Res & Life Sci, BOKU, AT), Smardzewski Jerzy (Poznań Univ of Life Sci, PL), Vlosky Richard P. (Louisiana State Univ, USA), Wimmer Rupert (Univ Nat Res & Life Sci, AT).
Vydala (Published by): Technická univerzita vo Zvolene, T. G. Masaryka 2117/24, 960 01 Zvolen, IČO 00397440
Náklad (Circulation) 50 výtlačkov, Rozsah (Pages) 133 strán, 9,04 AH; 11,22 VH
Tlač (Printed by): Vydavateľstvo Technickej univerzity vo Zvolene
Vydanie I. – jún 2026
Periodikum s periodicitou dvakrát ročne
Evidenčné číslo: 3860/09
Acta Facultatis Xylologiae Zvolen je registrovaný v databázach (Indexed in): Web of Science, SCOPUS, ProQuest, AGRICOLA, Scientific Electronic Library (Russian Federation), China National Knowledge Infrastructure (CNKI)
Za vedeckú úroveň tejto publikácie zodpovedajú autori a recenzenti. Rukopis neprešiel jazykovou úpravou. Všetky práva vyhradené. Žiadna časť textu ani ilustrácie nemôžu byť použité na ďalšie šírenie akoukoľvek formou bez predchádzajúceho súhlasu autorov alebo vydavateľa.
© Copyright by Technical university in Zvolen, Slovak Republic. ISSN (print) 1336–3824, ISSN (online): 2730-1176
01. CSILLA MÁRIA CSIHA: EVALUATION OF BONDING CHARACTERISTICS OF GREY POPLAR (POPULUS X CANESCENS) .. 5
02. LADISLAV DZURENDA – MICHAL DUDIAK – ALENA OČKAJOVÁ: COLOR CHANGE OF BEECH MATURE WOOD AND FALSE HEARTWOOD THROUGH ACCELERATED AGEING PROCESS 17
03. PAVLO BEKHTA – IRYNA LYTVYN – JÁN SEDLIAČIK: THE IMPACT OF SODIUM AND MAGNESIUM LIGNOSULFONATES ON AMINO RESIN ADHESIVES FOR WOOD-BASED PANELS PRODUCTION ............................................................................................... 27
04. VERONIKA ŠUGÁROVÁ – LUKÁŠ ADAMČÍK – RICHARD KMINIAK: ANALYSIS OF THE INFLUENCE OF STEAMING TEMPERATURE ON THE SURFACE ROUGHNESS OF CNC-MILLED BEECH SAPWOOD AND FALSE HEARTWOOD ..................................... 39
05. SERGEY ELISEEV – SERGEY ZHILA – SERGEY KAZITSIN –VLADIMIR ERMOLIN – MIKHAIL BAYANDIN EVGENIYA AKININA – TATYANA STREKALEVA: DYNAMICS OF CHANGES IN THE PHYSICAL AND MECHANICAL PROPERTIES OF SIBERIAN FIR (ABIES SIBIRICA LEDEB.) WOOD IN DEAD STANDS DAMAGED BY THE FOUR-EYED FIR BARK BEETLE (POLYGRAPHUS PROXIMUS BLANDF.) 49
06. JIŘÍ BRICH – ANTONÍN NOVOTNÝ – PETR FARÁŘ – JOSEF ŠINDELÁŘ – JITKA BERÁNKOVÁ: THE EFFECT OF INTERIOR AIR- AND VAPOR-CONTROL LAYERS ON ENVELOPE AIRTIGHTNESS IN LOW-ENERGY TIMBER-FRAME HOUSES 65
07. ELENA KMEŤOVÁ – MATEJ BABIC – DANICA KAČÍKOVÁ –MARTIN ZACHAR: DETERMINATION OF FIRE CHARACTERISTICS OF SPRUCE WOOD BY NEW MEDIUM-SCALE LABORATORY METHOD ........................................................................... 79
08. MARTINA NOSÁĽOVÁ – HANA MAŤOVÁ: PAPER PACKAGING: CONSUMER PERCEPTION AND SUSTAINABILITY TRENDS ............. 91
09. PAVOL GEJDOŠ – JARMILA SCHMIDTOVÁ: BENCHMARKING OF ENTERPRISES IN THE WOOD-PROCESSING SECTOR WITH OTHER SECTORS OF THE NATIONAL ECONOMY IN THE CONTEXT OF IMPROVING THEIR PERFORMANCE THROUGH QUALITY MANAGEMENT SYSTEMS ......................................................
10. MIRIAM OLŠIAKOVÁ: EVALUATION OF CONSUMER PREFERENCES AND SATISFACTION IN A FURNITURE RETAIL CHAIN: A CASE STUDY FROM SLOVAKIA 121
ACTAFACULTATIS XYLOLOGIAE ZVOLEN, 68(1): 5 16, 2026
Zvolen,Technická univerzita vo Zvolene
DOI: 10.17423/afx.2026.68.1.01
EVALUATION OFBONDING CHARACTERISTICS OFGREY POPLAR (POPULUS X CANESCENS)
Csilla Mária Csiha
ABSTRACT
Coniferous forests are drying out due to climate change, creating a need for alternative species. Grey poplars (Populus × canescens) are underutilized in Hungary, with about 12 millionm³reachingharvestingagebytheendof2026 anddecayingduetolimitedindustrial use. The bondability of grey poplar with structural polyurethane (PUR) and nonstructural polyvinyl acetate (PVAc) adhesives, comparing it with Scots pine (Pinus sylvestris) and beech(Fagus sylvatica)underbothdryandwetconditions,inaccordancewithENstandards is evaluated in the study. Beech met the minimum dry tensile shear strength requirements for both adhesives, whereas grey poplar and Scots pine did not. Grey poplar bonded with PVAcshowedhigherdrystrengththanScotspine,whileScotspinewithPURoutperformed greypoplar. Despiteitshigherdensity,grey poplarheartwood exhibitedlowerstrength than sapwood. Overall, grey poplar’s adhesive performance was comparable to Scots pine, suggesting it could serve as a viable alternative to coniferous species in both load-bearing and non-load-bearing applications.
Keywords: grey poplar; shear strength; PVAc; PUR structural adhesive, CLTpanel
INTRODUCTION
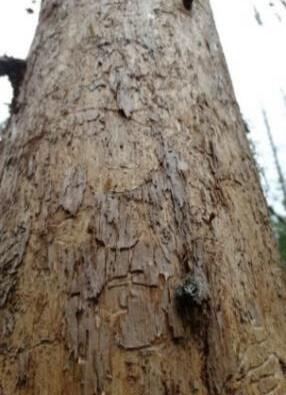
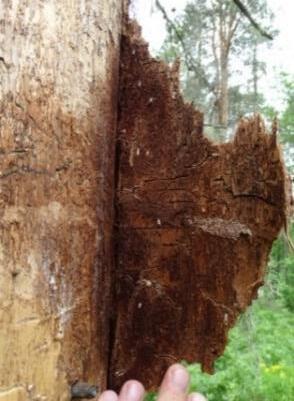
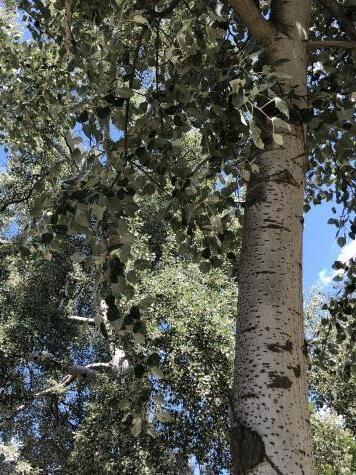
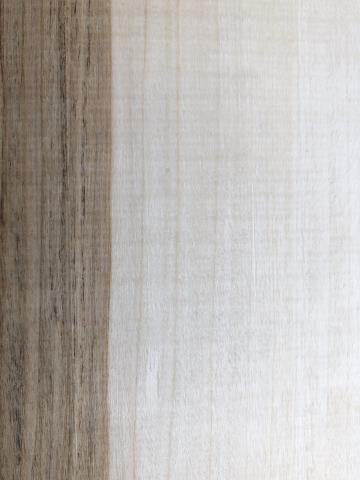
Due to climate change, the composition of forests in Hungary is changing. The population of traditionally used pine species is decreasing, and many coniferous forests are drying out (Borovics et al., 2025). Therefore, the wood industry requires new, alternative treespeciesthattolerate changingenvironmental conditionsandcould replacepinespecies, either in their current form or after suitable modification. In recent decades, the timber industry has mainly worked with coniferous species, while many deciduous tree species have remained underutilized (Király et al., 2024), including grey poplar. Grey poplar (Populus × canescens), a natural hybrid between white poplar (Populus alba) and common aspen (Populus tremula), was historically described as a variety of P. alba byAiton (1789) andlaterrecognizedasafullspeciesbySmith(1804).Itisintermediatebetweenitsparents, with a thin, grey, downy coating on the leaves, which are less deeply lobed than those of P. alba. Avigorous tree with marked hybrid vigor, it can reach 40 meters tall and 1.5 m trunk diameter (Populus × canescens, 2025). The visually appealing grey poplar (white bark, silvery leaves, Figure 1) grows well on sandy soils of the Hungarian Great Plain (Alföld) and tolerates extremely dry sites. It belongs to the South Eurasian flora, found in Europe andAsia between 25° and 52° latitudes. The stem usually contains false heartwood (Figure
2), and ring shakes are frequent. Molnár and Bariska (2002) reported that research at the time aimed to propagate grey poplar hybrids developing colorless heartwood. They also highlighted key physical properties of grey poplar, noting that density strongly influences dry matter content and, consequently, strength and flexibility. Grey poplar was classified intothethirddensitycategory(ρ>401kg/m³),amongthehighestforpoplarhybrids.While there is extensive literature on hybrid and plantation poplars, research specifically on grey poplar remains limited (Kánnár and Csiha, 2021).
In November 2024, the Council of the European Union announced the “EU Carbon Removal Certification Framework” (2025), promoting durable goods, including woodbased construction materials, to enhance long-term carbon storage. Increasing the use of wood as an alternative to conventional materials such as concrete or brick offers the potentialtosequestercarbonforover100years.Prefabricatedcross-laminatedtimber(CLT) panels are currently the most advanced wood building materials, with European CLT production relying primarily on spruce and pine in mid-layers, followed by larch and Douglasfir.HardwoodssuchasbeechandbircharerareincommercialCLT,typicallybelow 5% and mostly limited to experimental or niche applications (Illgin et al., 2023).
AlthoughCLTproductionfocusesonconiferousspecies,forecastsfromtheHungarian Forest Research Institute predict a decline in coniferous availability due to climate change. Industrialprocessingisalsooptimizedforlong,straightlogs,whereasgrey poplarnaturally develops strong lateral branches, resulting in shorter trunks if unpruned. Other industrial limitations related to its appearance are documented by manufacturers (Types of Poplar wood,2025).GiventheEuropeanCommission’srecommendationstoincreasewoodusefor long-termcarbonstorageandconsideringthe12millionm³harvestablestockofgreypoplar inHungaryanditsextremedroughttolerance,researchintothisspeciesishighlywarranted. Processing parameters for grey poplar require thorough investigation, as many criticisms can be addressed by optimizing kiln drying and handling.
This study focuses on the bondability of grey poplar using two major adhesives: structural polyurethane (PUR) adhesives for loadbearing applications, and non-structural polyvinyl acetate (PVAc) adhesives typically used for doors and windows. The main objectiveofthestudywastodeterminewhethergreypoplarcanserveasasuitablesubstitute for Scots pine as a representative of coniferous species in terms of bonding performance Clarifying its bonding behavior provides essential technical data for evaluating its processing potential and integration into wood construction. Simultaneously, this research addresses the broader need to diversify the raw material base and promote sustainable use
Fig. 1 Grey poplartree.
Fig. 2 Heartwood and sapwood of grey poplar.
of available wood resources, thereby assessing grey poplar’s suitability and justifying its potential role as an alternative construction material.
MATERIALSAND METHODS
Tree species: grey poplar (Populus x canescens), Scots pine (Pinus sylvestris), and beech (Fagus sylvatica) wood specimens were prepared. Grey poplar wood was sourced from KEFAG Zrt. (Hungary) as kiln-dried boards of 3000 mm × 150 mm × 24 mm, while beech and Scots pine were provided by Németh-Fa Ltd. (Hungary) in kiln-dried boards of 900 mm × 1300 mm × 24 mm.
Adhesives: two types were used: a non-structural D3 water-based PVAc Technobond 3000 by Szolvegy Ltd. (Hungary) and a close-contact structural polyurethane (PUR) adhesive, Jowapur 686.20, by Jowat (Germany).The applied amount of structural adhesive for the tested tree species is not specified by the adhesive producer; only a general recommendation is available between 100 – 230 g/m2, with a pressure recommended between 0.3-1.2 N/mm2, and an open time of 10 minutes.
For the non-structural adhesive, the general recommendation of the manufacturer on the applied amount is between 120-180 g/m2, with an open time of 5 minutes and pressure recommended between 0.2 – 0.8 N/mm2. For complete curing of the adhesive, 24 hours are necessary.
Adhesive application: Prior to the current tests, it was observed that grey poplar specimens tended to absorb more adhesive from the bond line than beech wood. This observation aligns with previous research, which reported that lower-density wood specimens/species allow for greater adhesive penetration (Konnert et al., 2008; Follrich et al., 2008; Hass et al., 2012).Given thebroad range ofthemanufacturer's recommendations and the varying densities of the wood specimens which required different adhesive amounts to achieve comparable bond line thicknesses both adhesives were applied in excess to both sides of the bonded assembly at a rate of 250 g/m². During pressing, the surplusadhesivewassqueezedout,allowingeach treespeciesthesameamountofadhesive in the bondline. The beech, Scots pine, grey poplar heartwood (GpHW), grey poplar sapwood (GpSW), and grey poplar combination wood (GpCW) boards bonded with PVAc adhesive were pressed layered on top of each other, between two 28 mm thick solid wood boards(todissipatethepressure),usingF-clamps(Ellix–OBI,700mm),for48hoursunder a similar pressure of 0.38–0.5 N/mm². Eight F-clamps were applied along the length of the boards one positioned at each side and the remaining six spaced at 80 mm intervals between them.
The same arrangement was also used for boards bonded with PUR adhesive. Specimen preparation for tensile shear strength testing: Beech,greypoplar,andScotspinespecimenswerepreparedbybondingtogethertwolayers of 32 oversized panels of 630 mm × 160 mm × 5 mm, in accordance with EN 205:2016. Each panel was free of visible defects, conditioned in an interior climate at 22 ± 2 °C and 65 % RH, and planed before bonding. After cutting with a circular saw, a total of 478 specimens were obtained, each measuring 150 mm × 20 mm and 2 × 5 mm thick, as shown in Fig. 3
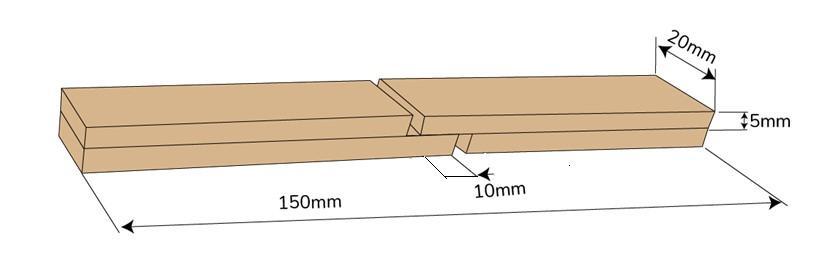
Each specimen had a surface area of 200 mm² exposed to shear, following the principles outlined in EN 205:2016 and EN 302-1:2023. Both standards specify the use of beech wood specimens with growth ring angles relative to the surface between 30° and 90° and are intended for the classification of non-structural and structural adhesives, respectively. To evaluate the adhesion performance of grey poplar, specimens of different tree species were compared. Tests on PVAc-bonded specimens followed EN 204 durability classes D1, D2, and D3.
- D1 involved testing under standard climate conditions (20 °C / 65% RH),
- D2specimens weretested dryafterstored in 20 °C waterfor3 h, thenreconditionedfor 7 days at standard atmosphere,
- D3 involved two separate procedures:
- D3-1: tested wet after storage in 20 °C water for 4 days,
- D3-2: tested dry after reconditioning from storage in 20 °C water for 7 days. These conditioning steps simulate increasing levels of moisture exposure and are used to assess the adhesive’s resistance and performance in interior and semi-exterior conditions. SpecimensbondedwithPURstructuraladhesiveweretestedbasedontheproceduresofEN 302-1:2023:
- A1: specimens tested in a dry condition after being stabilized under standard atmospheric conditions,
- A2: specimens tested in a wet condition after immersion in cold water for 4 days,
- A3: specimens tested dry, afterbeing conditionedagain, following 4 days ofimmersion in cold water,
- A4: specimens tested in a wet condition after being immersed for 6 hours in boiling water, followed by 2 hours in cold water,
- A5: specimens reconditioned to a dry state and tested after undergoing the same treatment as inA4 Thenumberofspecimenspreparedfortensileshearstrengthtestswithnon-structuralPVAc and structural PUR adhesive can be found inTable 1.
Tab. 1 Numberof specimens prepared fortensile shearstrength tests.
Density measurements were performed right after testing the specimens for shear, from intact portions of the tested specimens. Density measurement of specimens: both the
Fig 3 Dimensions of the specimens prepared forsheartests
densityattesting(ρn)andtheabsolutedrydensity(ρ0)ofthespecimensforall3treespecies were determined with the equation ρ = m/V(g/cm3), and the density belonging to 12% MC (ρ12)was calculatedaccording to ISO 13061-2: 2014. Density measurements ofgrey poplar werecarriedoutonselectedspecimenbatches,including11GpSW,15GpHW,and15GpC, for a total of 41 grey poplar specimens. Density determination was performed on 12 beech specimens, and for Scots pine, the same.
Moisture content (MC) of the specimens was measured according to ISO 130611:2014 for 12 beech, 12 Scots pine, and 41 grey poplar specimens.
Tensile shear strength tests of PVAc bonded lap joints: following the required pretreatment, the specimens were tested at a rate of traverse of 50 mm/min using an Instron 5566 universal testing machine (Instron Corporation, USA), applying tensile force parallel to the bond line until failure. PUR-bonded lap joints were tested similarly, using the same device, but with a load increase rate of 2 kN/min in accordance with EN 302-1.
Statistical analysis was performed to evaluate the significance of the differences by using independent two-sample t-tests (also called Student’s test). One-way ANOVA tests were also performed to assess the significance of the differences between groups of specimens,followedbyTukey’sHSD(HonestlySignificantDifference)testwhereveritwas reasonable. Pearson’s correlation analysis was also performed to examine the relationships between variables.
RESULTSAND DISCUSSION
Moisture content:
TheaverageMC(%)ofthreetreespeciesatthetimeoftestingisshowninTable2,withthe standard deviation and the variance (the mean of the squared deviations from the mean).
The MC of the tested wood specimens ranged around 10%, with no significant difference between the tree species, according to Student’s test. Beech specimens showed the greatest variation in MC, with somespecimens having MC values around6%, whilst others reached up to 12.6%. Grey poplar sapwood was the most uniform in moisture content, with all specimens following the same preconditioning at the standard atmosphere.
Density:
The average density of specimens at testing (ρn), the absolute dry density (ρ0), and the calculateddensitybelongingto12%MC(ρ12)werecalculatedforalltreespecies,andthey areshown inTable3. Beech specimens had thehighest density ofall, with 36%higherthan Scots pine, 61.9% higher than GpHW, 68.6% higher than GpSW, and 58.4% higher than GpC. TheabsolutedrydensityoftheGpSWwasdifferentandlowerthanthedensityofthe
Tab 2 Moisture content of the specimens
GpHWasshowninTable3.ThedensityoftheGpCwas6.3%higherthanthedensityofthe GpSW.ThedensityofGpHWwas4.0%higherthanthedensityofGpSW.Theabsolutedry density of the GpSWwas the lowest among all tested specimens.
Tab 3The density of the specimens
A one-way ANOVA was performed to assess the differences in density among the different grey poplar specimens.At a 0.05 significance level, no significant difference was found between the density values of the 3 different grey poplar specimen types (F(2, 42) = 1.01,p>0.05).However,thiswasnotthecasewhenthesametestwasperformed,including Scots pine density. A one-way ANOVA indicated a significant difference among the four groups (F(3, 56) = 10.33, p < 0.05). Post-hoc analysis using Tukey’s HSD revealed that the density of Scots pine specimens and beech specimens differs significantly from all other groups, whilst the density of the beech specimens was the highest.
Evaluation of tensile shear strength of specimens bonded with non-structural PVAc adhesive
Tensile shear tests were performed to evaluate grey poplar in comparison with Scots pine anddeterminewhetheritcanserveasapossiblesubstituteforScotspineregardingbonding properties. The test standards specify beech wood for specimen preparation; as a result, beech specimens were also prepared. Beech has a dense wood with a firm predisposition to shrinkageandwarping,withanaverageporosityof55%.Scotspinewarpslessthanspruce, but compression wood might be problematic; its porosity is reported to be 67% in average. Porosity is not reported for grey poplar, but is reported at 78% for its close relative, aspen (Populus tremula) (Kärki, 2001). Grey poplar’s indicative mechanical properties are reported based on literature (Molnár and Bariska, 2002): bending strength of 67.5 MPa, tensile strength of 82.3 MPa, shear strength of 7.8 MPa, and compressive strength of 38.3 MPa. The same source specifies for Scots pine bending strength of 40-205 MPa, tensile strength of 35-196 MPa, shear strength of 6 1 – 14.6 MPa, and compressive strength of 35 - 94 MPa. These values for Beech are reported: bending strength of 74 - 210 MPa, tensile strength of 57 - 180 MPa, shear strength of 6.5 - 19 MPa, and compressive strength of 4199 MPa
Table 4 shows the average tensile shear strength values of the tested beech, Scots pine, and grey poplar specimens for the D1 condition of a non-structural water-based PVAc adhesive, along with the standard deviation
Tab. 4Average tensile shear strength of specimens bonded with a non-structural PVAc adhesive (tested forD1, D2 and D3 conditions).
EN 204 specifies that test specimens should be prepared from beech wood, as the standard is intended for the classification of thermoplastic wood adhesives used in nonstructural applications.
D1 condition requires a minimum tensile shear strength of 10 N/mm² of beech specimens under dry conditions. While the tested beech specimens met this requirement, neither the grey poplar nor the Scots pine specimens achieved this threshold. The fact that beech specimens achieved therequired shearstrength with this adhesive indicates that both thebondingconditionsandtheadhesiveweresuitablefortheexperiment.Tocheckwhether the average shear strength value of Scots pine falls within the typical range, a literature searchwasconducted.Doruk(2021)measuredanaverageof6.25MPafortheD1drytensile shear strength of PVAc-bonded Scots pine specimens.Astudy by Li et al. (2015) reported shearstrengthvaluesof4.12–10.28N/mm2 forScotspinebondedwithPVAcnon-structural adhesive, depending on adhesive spread, press time, and applied pressure. Although the adhesives came from different manufacturers, the values we measured for Scots pine are consistent with previously published data. In the absence of shear strength data for grey poplar, its tensile shear strength is evaluated against the same measured values for Scots pine. Despite the higher Scots pine density, the dry D1 tensile shear strength of the tested grey poplar specimens was higher than that of the Scots pine specimens, with the highest values recorded for GpSW; however, the difference was not significant at the 5% significance level according to the t-test. However, these values should not be considered the absolute shear strength of Scots pine or grey poplar; rather, they provide a useful basis for comparing whether grey poplar can perform similarly or better than Scots pine when prepared and tested under comparable conditions.
A one-way ANOVA performed on the tensile shear strength averages of the grey poplar specimens resulted in a statistically significant difference among the three groups (F(2, 107) = 26.28, p < 0.01), whilst Tukey’s HSD revealed that GpHW has significantly lower D1 tensile shear strength than the other two. The density values of the grey poplar specimens were not aligned with the achieved D1 tensile shear strength: the specimen groupsGpSWandGpCexhibitedsignificantlyhighertensileshearstrengththantheGpHW, whilst there was no significant difference in their density. This indicates that density alone is not the main influencing factor of the adhesion. This observation is further supported by the results for Scots pine, which exhibited a significantly higher density than grey poplar specimens, while showing the lowest D1 tensile shear strength.
During the analysis of the shear strength results of the grey poplar specimens, the question arose as to whether the grey poplar specimens could reach a D1 tensile shear strength of 10 N/mm² at all. By checking the measured data for all grey poplar D1
specimens, it was found that among 110 specimens tested, only one heartwood–sapwood combination exceeded this threshold, while seven additional specimens achieved values above 9.48 N/mm².This leads to the conclusion that there may be bonding parameters that, inthepresentstudy,wereonlypartiallymetbut,ifidentifiedandconsistentlyapplied,could resultinstable,high adhesion.Thisassumptionis alsosupportedby thefindingsofLi et al. (2015), who indicated that adhesive spread and applied pressure were the primary factors influencingshearstrength,whichincreasedwithagivenincreaseinthesetwo.Theseresults suggest that, by optimizing pressing time, adhesive spread, temperature, surface quality, and, furthermore, by using pressure tailored specifically to grey poplar, it may be possible to achieve higher, more consistent tensile shear strength.
The average D2 tensile shear strength of the beech specimens exceeded the expected minimum value of 8 N/mm², whereas the Scots pine and grey poplar specimens did not. Moreover, theD2tensileshearstrengthofgreypoplarwas lowerthantheaverageforScots pine. Grey poplar exhibited elevated sensitivity to D2-type short-term soaking, performing the weakest compared to beech and Scots pine.
WhentestedundertheD3firstcondition(after4daysofsoaking),onlytheScotspine specimens reached the required minimum tensile shear strength of 2 N/mm², but the performance of grey poplar was similar to that of beech specimens. Under the D3 second condition regaining a strength above 8 N/mm² after 7 days of reconditioning this criterion was met exclusively by the beech specimens. However, the reconditioned grey poplarspecimensrecoveredtensileshearstrengthabove5N/mm²,whichcorrespondstothe average dry strength previously observed in Scots pine specimens
Tensile shear strength of specimens bonded with a structural PUR adhesive: Under theA1 condition, only the beech specimens met the expected minimum dry tensile shear strength of 10 N/mm². For theA3 condition, beech specimens also recovered to the required8N/mm².Inallothercases,however,thespecimensremainedbelowtheminimum values specified in EN 301, as shown inTable 5.
Tab. 5 Average tensile shear strength of specimens bonded with a structural PUR adhesive (tested for A1,A2,A3,A4 andA5 conditions).
(N/mm2)
Grey poplar consistently showed the lowest average tensile shear strength across both dry and wet tests under conditionsA1 throughA5 compared to Scots pine. However, their performancewasnotsignificantlylower(t-test,5%significancelevel)thanthatoftheScots pine specimens.
Grey poplar specimens outperformed the average tensile shear strength of beech specimens under theA2, A4, andA5 conditions. The grey poplar showed a better bonding potential with a PUR structural adhesive than with a non-structural PVAc.
For the PUR structural adhesive, the A1 dry shear strength results aligned with the density values of the tree species. Higher density was associated with higher dry strength. TherelationshipbetweenthedensityofthespecimensandtheirA1drytensileshearstrength wasanalyzed usingPearson’scorrelationcoefficientandsimplelinearregression.Pearson’s correlation indicated an almost perfect positive correlation (r =0.999),showing that higherdensity specimens consistently exhibited higher tensile shear strength. Linear regression analysis further quantified this trend, resulting in the model:
This model suggests that an increase of 100 kg/m³ in density corresponds to an approximate increase of 1.6 MPa in tensile shear strength. These results support the conclusion that, for a reactive adhesive, higher density is associated with higher bond strength, as denser materials provide more reactive sites per unit volume.
Thepositiverelationshipobservedbetweenwooddensityandthetensileshearstrength of PUR adhesive-bonded specimens is consistent with results reported in the literature. Follrich et al. demonstrated that the tensile strength of bonded end-grain joints increases withwooddensity,suggestingthatgreatercellwallmaterialimprovesadhesionperformance (Follrich et al., 2008). Similarly, Wagenführ found that tensile shear strength generally increaseswithspeciesdensityacrossEuropeansoftwoodandhardwoodspecies(Wagenführ et al., 2016). More recently, Meethaworn, Srivaro, and Khongtong reported that the shear strength of adhesive joints for densified wood increased progressively with density within the range of 1.05 to 1.30 g/ cm³, indicating that higher density substrates consistently exhibited higher shear performance (Meethaworn et al., 2022).
Grey poplar exhibited significantly lower tensile shear strength than beech; however, unlike beech, it remained mostly intact after soaking in water, similar to Scots pine, and regained its dry strength after soaking. Only after boiling in water and testing wet did its shear strength decrease; even then, it was roughly twice that of beech and comparable to Scots pine.The highest dry tensile shear strength measured for GpC was 6.7 N/mm². These results suggest that, by optimizing bonding parameters, higher tensile shear strength can be achieved while remaining as stable to water soaking as Scots pine.
During the tensile shear tests, the phenomenon was observed that dry grey poplar specimens mostly failed in the wood. This observation subsequently led to two additional tests.
On the one hand, the specimens were examined microscopically to identify possible cracks, as grey poplar has been described by Molnár and Bariska (2002) as a tree species prone to cracking during kiln drying.
On the other hand, a hypothesis was proposed that the wood material may possess an intrinsic characteristic of low tensile resistance, which could explain why higher shear strengthvaluescannotbeachievedduringadhesivebonding.Therefore,thespecimens were tested under uniaxial tension parallel to the grain, which provides a suitable method for evaluating the tensile properties of solid wood specimens
CONCLUSION
The adhesive strength of the specimens was assessed under dry and wet conditions, in comparison with beech wood and Scots pine specimens, using concepts derived from EN standards. While beech specimens met the minimum dry strength required by the standards forbothadhesivetypes,neithergreypoplarnorScotspineachievedthisthreshold.However, greypoplarspecimensbondedwiththenon-structuralPVAcadhesiveexhibitedsignificantly higheraveragedrytensileshearstrengththanScotspine,particularlyinsapwoodspecimens. Conversely, when bonded with the structural PUR adhesive, Scots pine generally outperformed grey poplar, although in certain moisture-exposed conditions (A2, A4, A5), grey poplar matched or even exceeded the performance of beech. Notably, grey poplar heartwood,despiteitshigherdensity,showedlowerdryadhesivestrengththanthelessdense sapwood,indicatingthatfactorsbeyonddensity suchasanatomicalstructureplayacrucial role.
Thedensityvaluesofthegreypoplarspecimenswerealsonot alignedwith theachieved D1 tensileshearstrength:twospecimen groups, GpSWandGpC, exhibitedsignificantlyhigher tensile shear strength than GpHW, whilst there was no significant difference in density between the groups.
However, when the specimens were bonded with a structural PUR reactive adhesive, a very strong, statistically significant correlation was found between density and the A1 tensile shearstrengthofthebondedspecimens.TheA1dryshearstrengthresults werealignedwith thedensityvaluesofthetreespecies.Higherdensitywasassociatedwithhigherdrystrength, with an almost perfect positive correlation (r = 0.999).These results support the conclusion that,forareactiveadhesive,higherdensityisassociatedwithhigherbondstrength,asdenser materials provide more reactive sites per unit volume.
Alimitationoftheworkisthatonlytwoadhesivesystemsandshort-termstrengthproperties were evaluated, with long-term durability not considered. Even so, the results underline the broader implication that grey poplar could reduce reliance on declining pine resources and contribute to a more sustainable diversification of raw materials in the wood industry. Although grey poplar did not reach the adhesive strength levels of beech, its overall performance was comparable to Scots pine across several test conditions, despite its significantly lower density. This suggests that, with proper adhesive selection and process optimization, grey poplar especially its sapwood could be a viable alternative to coniferous species like Scots pine in both non-load-bearing and selected load-bearing applications.
REFERENCES
Aiton,W., 1789. Hortus Kewensis.Vol. 3. George Nicol, London, Great Britain, 405 pp. Borovics, A., Király, É., Kottek, P., 2025. Climate change mitigation strategies at the level of a forestry company in the light of age class legacy effects.Annals of Forest Science, 82, 10, 1–17. https://doi.org/10.1186/s13595-025-01282-x
Büyüksarı, Ü.,As, N., Dündar,T., 2017. Mechanical properties of earlywood and latewood sections of Scots pine wood. BioResources, 12, 4004–4012. https://doi.org/10.15376/biores.12.2.40044012
Doruk,Ş.,2021.Determiningtheeffectofsyntheticbasedvarnishandimpregnationonwood’sshear strength under cold climate conditions. BioResources, 16(2), 3377–3390. https://doi.org/10.15376/biores.16.2.3377-3390
EN 205:2016. Adhesives Wood adhesives for non-structural applications Determination of tensile shear strength of lap joints.
EN 302-1:2023. Adhesives for load-bearing timber structures Test methods Part 1: Determination of longitudinal tensile shear strength.
EU Carbon Removal Certification Framework, 2025. Available online: https://climate.ec.europa.eu/eu-action/carbon-removals-and-carbon-farming_en (accessed 30 July 2025)
Follrich, J., Teischinger,A., Gindl, W., Müller, U., 2008.Adhesive bond strength of end grain joints insoftwoodwithvaryingdensity.Holzforschung,62(2),1–12.https://doi.org/10.1515/HF.2008
Hass,P.,Wittel,F.K.,Mendoza,M.,Niemz,P.,Herrmann,H.J.,2012.Adhesivepenetrationinbeech wood: experiments. Wood Science and Technology, 46, 243–256. https://doi.org/10.1007/s00226-011-0410-6
Ilgın, H.E., Karjalainen, M., Mikkola, P., 2023. Views of Cross-Laminated Timber (CLT) manufacturer representatives around the world on CLT practices and its future outlook. Buildings, 13, 2912. https://doi.org/10.3390/buildings13122912
Kánnár,A., Csiha, C., 2021. Comparative analysis of static and dynamic MOE of Pannónia poplar timber from different plantations. Wood Research, 66, 195–202. https://doi.org/10.37763/wr.1336-4561/66.2.195-202
Kärki,T.,2001.VariationofwooddensityandshrinkageinEuropeanaspen(Populustremula).Holz als Roh- undWerkstoff, 59, 79–84. https://doi.org/10.1007/s001070050479
Király, É., Forsell, N., Schulte, M., Kis Kovács, G., Börcsök, Z., Kocsis, Z., Kottek, P., Mertl, T., Németh, G., Polgár, A., Borovics, A., 2024. Climate change mitigation potentials of wood industry relatedmeasuresin Hungary.MitigationandAdaptation Strategiesfor Global Change, 29, 62, 1–24. https://doi.org/10.1007/s11027-024-10161-1
Konnerth,J.,Kluge,M.,Schweizer,G.,Miljković,M.,Gindl-Altmutter,W.,2016.Surveyofselected adhesive bonding properties of nine European softwood and hardwood species. European Journal of Wood and Wood Products, 74, 809–819. https://doi.org/10.1007/s00107-016-1087-1
Li, R., Guo, X., Ekevad, M., Marklund, B., Cao, P., 2015. Investigation of glueline shear strength of pinewoodbondedwithPVAcbyresponsesurfacemethodology.BioResources,10,3831–3838. https://doi.org/10.15376/biores.10.3.3831-3838
Meethaworn, B., Srivaro, S., Khongtong, S., 2022. High performance adhesive joint made from densified wood.Polymers, 14(3), 515. https://doi.org/10.3390/polym14030515
Molnár,S.,Bariska,M.,2002.WoodspeciesofHungary.1sted.SzaktudásKiadóHázZrt,Budapest, Hungary, 143 pp. https://doi.org/10.1007/s40725-018-0071-x
Parresol, B.R., Cao, F., 1998.An investigation of crystalline intensity of the wood of poplar clones grown in Jiangsu Province, China. Research Paper SRS-11, U.S. Department of Agriculture, Forest Service, Southern Research Station,Asheville,NC, 1–7 pp.
Populus × canescens, 2025.Available online:
https://en.wikipedia.org/wiki/Populus_%C3%97_canescens (accessed 30 July 2025)
Shen, H., Xing, X., Guan, Y., Zhou, L., Liu, S., Gao, H., 2021. Radial variation studies on wood properties of Populus deltoides parents and their hybrids. BioResources, 16(3), 4905–4923. https://doi.org/10.15376/biores.16.3.4905-4923
Smith, J.E., 1804. Flora Britannica. Vol. 3. London, Great Britain, 1080 pp. Available online: https://archive.org/details/b22038735_0003/page/1080/mode/2up (accessed 30 July 2025)
Types of Poplar wood, uses, advantages, and disadvantages, 2025. Available online: https://www.timberblogger.com/poplar-wood (accessed 30 July 2025)
Wagenführ, R., Niemz, P., Schmidt, M., Schweizer, G., Kluge, M., Miljković, M., Gindl-Altmutter, W., 2016. Survey of selected adhesive bonding properties of nine European softwood and hardwood species. European Journal of Wood and Wood Products, 74(6), 809–819. https://doi.org/10.1007/s00107-016-1087-1
ACKNOWLEDGEMENT
ThisarticlewasmadeinframeoftheprojectTKP2021-NKTA-43whichhasbeenimplementedwith the support provided by the Ministry of Culture and Innovation of Hungary from the National Research,DevelopmentandInnovationFund,financedundertheTKP2021-NKTAfundingscheme. The author acknowledges the technical support provided by the staff of the Faculty’s Central Workshop and Central Laboratory, as well as the preparation of Figure 3 by Bence Sándor.
AUTHORS’ADDRESSES
Csilla Mária CSIHAPhD. University of Sopron Faculty ofWood Engineering and Creative Industries Institute ofApplied Sciences Bajcsy Zsilinszky 4., H-9400, Sopron csiha.csilla@uni-sopron.hu
ACTA FACULTATIS XYLOLOGIAE ZVOLEN, 68(1): 17 25, 2026
Zvolen, Technická univerzita vo Zvolene
DOI: 10.17423/afx.2026.68.1.02
COLOR CHANGE OF BEECH MATURE WOOD AND FALSE HEARTWOOD THROUGH ACCELERATED AGEING PROCESS
Ladislav Dzurenda – Michal Dudiak – Alena Očkajová
ABSTRACT
Thedifferencesinthesurfacecolorofbeechmaturewoodandfalseheartwoodintheprocess of simulated aging induced by UV radiation in a Q-SUN Xe-3-HS xenon test chamber for 360 hours are presented in the paper Color measurement in the color space CIE L*a*b* on exposed surfaces of beech wood samples was performed with a Color Reader CR-10 colorimeter. During exposure, the course of changes in individual coordinates (L*, a*, b*) of the color space CIE L*a*b* was recorded. The resulting change in wood color was evaluated through the overall color change. The surface of mature beech wood darkened fromalightwhite-graycolorwithayellowtingetoared-browncolorshadeduringexposure to UV radiation in a xenon test chamber. On the contrary, the surface of beech false heartwood slightly lightened from the original red-brown color to its paler shade. The magnitude of color changes on the surfaces of beech mature wood and false heartwood caused by UV radiation indicates the values of the total color difference for mature wood ∆Emw* = 15.8 and for false heartwood ∆Efhw* = 10.
Keywords:beechwood; falseheartwood;maturewood;woodcolor;colordifference;color dispersion;accelerated aging
INTRODUCTION
The color of wood is a basic physical-optical property, which belongs to the group of macroscopicfeaturesonthebasisofwhichthewoodofindividualwoodspeciesdiffersfrom each other in appearance. The color of wood is created by chromophores, i.e., functional groups of the type: >C=O, –CH=CH–CH=CH–, –CH=CH–, aromatic nuclei found in the chemical components of wood (lignin and extractives such as dyes, tannins, resins and others). Chromophores absorb certain wavelengths of daylight and thus create the color of the wood surface perceived by human vision (Hon and Shiraishi 2001; Rowell 2013; Dzurenda et al., 2023)
Theoriginalcolorofwoodchangestovaryingdegreesduetoabioticfactors (sunlight, humidity, temperature, contact with metals), biotic factors (bacteria, fungi), or targeted thermal treatments (drying, steaming, thermowood production).
From the perspective of atmospheric degradation of wood, the most important influence on color change is ultraviolet radiation (UV) and part of sunlight (wavelength < 380 nm), which induces photochemical reactions in wood (Tolvaj et al., 2001; Müller et al., 2003; Evans et al., 2005; Dudiak et al., 2022). The change in wood color is mostly caused by the absorption of UV radiation by lignin, the chemical cleavage of its bonds and the
formation of reactive free radicals (e.g., phenoxyl), which are transformed into chromophores containing carbonyl, carboxyl and quinoid structures, responsible for the changes in wood color (Fengel and Wegener 1989; Müller et al , 2003; George et al., 2005; Evans et al., 2005; Teacă et al., 2013). Extractives also participate in the photodegradation of wood, which, in addition to color changes of wood, also affect the rate of wood degradation (Chang et al., 2010). Someextractives present in woodalso act as antioxidants, protecting it from photodegradation (Nzokou and Kamdem 2006). Photochemical reactions within the atmospheric degradation of wood are carried out only in the surface layers of wood. UV radiation and visible light can only penetrate to depths of 75 μm and 200 μm, respectively.
The aim of the work is to compare the color changes of beech mature wood and false heartwood in the process of simulated ageing induced by UV radiation in the Xenotest QSUN Xe-3-H. The analyses include both changes in the individual color coordinates of the CIE L*a*b* color space at an air temperature of t = 20 °C and a relative air humidity of φ = 60%, as well as differences in the total color difference ∆E* during UV radiation.
MATERIAL AND METHODS
Lumber was produced by cutting eight beech logs with a healthy, round false heartwoodbylongitudinalandtransversemanipulation.Blankswithawidthof100mmand alengthof800 mmwereproduced fromthecentralbeech lumberwithathicknessofh =40 mm. From each central lumber with a thickness of h = 40 mm, a blank with wood around theborder lineofthefalse heartwood was randomly selected, containing both maturebeech wood and false heartwood.
In order to eliminate the influence of temperature during hot air drying on the change in the color of the beech wood, the blanks were dried in a closed air-conditioned room at an air temperature of t = 20 °C and a relative air humidity of φ = 60% to a moisture content of w = 10 ± 2%.
TomeasuretheeffectofUVradiationonphotodegradation,sampleswithdimensions: 100 × 50 × 15 mm (L × R × T) were made from beech wood, with the border line marked, and the content of mature wood and false heartwood was determined.
In the xenon test chamber Q-SUN Xe-3-HS, (Q-Lab Corporation, USA) the beech wood samples were irradiated for τ = 360 hours. During the exposure, the color of the irradiated surface was measured regularly at τ = 24 hour intervals. The dry mode was used, which simulates indoor conditions: the wood is exposed to radiation but protected from rain. The simulationofthemeasurementconditionswasensuredbyQ-windowFilters,whichprovided outdoordaylightindoors.Thesamplesplacedinthexenotestchamberwereregularlymoved within the irradiated area of the xenotest to ensure uniform irradiation intensity and surface temperature of the irradiated sample (Kúdela and Kubovský 2016).
Measurement of wood color in the color space CIE L*a*b* was performed with a Color Reader CR-10 colorimeter (Konica Minolta, Japan), with a reflection spectrum of wavelengths in the range of 400 - 700 nm. A certified D65 light source with an optical sensingdevicediameterof8mmwasused.Measurementofthecolorofmaturebeechwood and the color of false heartwood before UV radiation and during irradiation was performed on a radial surface created by milling. Each measured wood color value in the color space CIE L*a*b* coordinates was checked by a second measurement with the requirement that thetotal color difference between individual measured values was not greaterthan∆E* =2.
The measured values in the color space CIE L*a*b* coordinates are presented in the form of the average measured value xand the standard deviation sx.
Where: x – average value, sx – standard deviation.
The difference between the color of mature beech wood and the color of the false heartwood before irradiation, expressed as the total color difference ΔE0*, is described by the equation:
Where: L*MW, a*MW, b*MW – values in the color space coordinates of the surface of dried milled mature beech wood before exposure;
L*FHW, a* FHW, b* FHW – values in thecolor space coordinates ofthesurfaceofdried milled false heartwood beech wood before exposure.
The total color difference ΔE* of the surface color change of mature beech wood samples in the UV radiation process is determined according to the following equation:
Where: L*0, a*0, b*0 – values in the color space coordinates of the surface of dried milled mature beech wood before exposure;
L*τ a*τ, b*τ – values in the color space coordinates of the surface of dried milled mature beech wood during UV radiation exposure.
ThetotalcolordifferenceΔE*ofthesurfacecolorchangeofbeechwoodsampleswith false heartwood in the UV irradiation process is determined according to the following equation:
Where: L*0, a*0, b*0 – values in the color space coordinates of the surface of dried milled beech wood with a false heartwood before exposure;
L*τ a*τ, b*τ – values in the color space coordinates of the surface of dried milled beech wood with a false heartwood during exposure to UV radiation.
RESULTS AND DISCUSSION
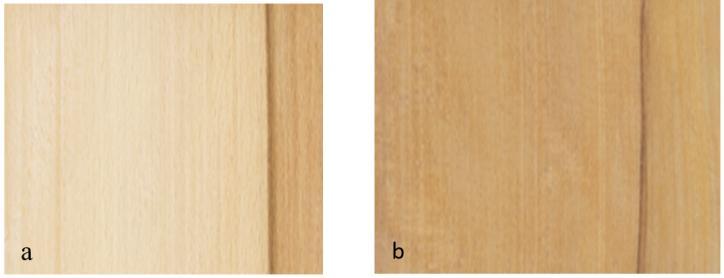
The visual difference between the color of dry beech wood in the mature wood zone and in the false heartwood zone before and after UV irradiation is shown in Fig. 1.
Fig. 1 View of the color of beech wood with false heartwood before (a) and after (b) UV irradiation in a xenotest.
The color of mature beech wood and false heartwood in the color space CIE L*a*b* beforeUVirradiationandafter360hoursofUVirradiationintheQ-SUNXe-3-HSxenotest is shown in Table 1.
Tab. 1 Values in the CIE L*a*b* color space coordinates of beech wood. Beech wood
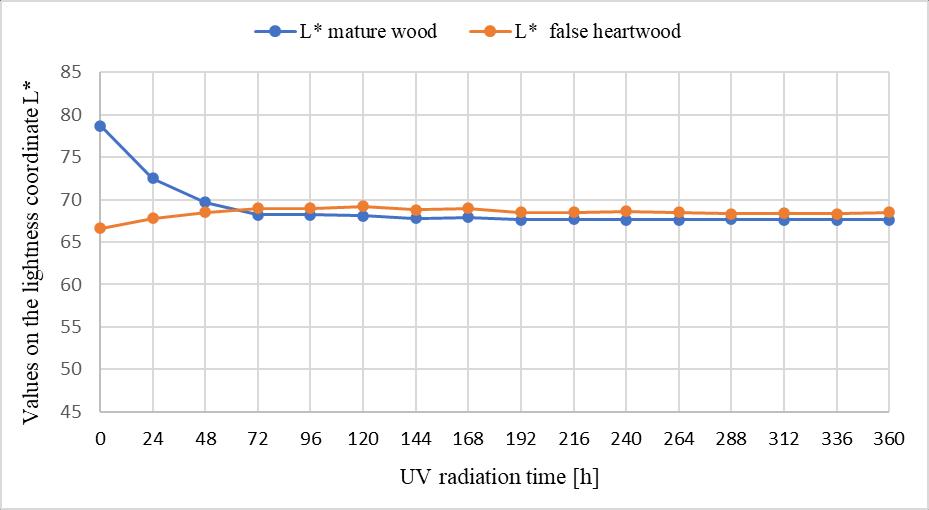
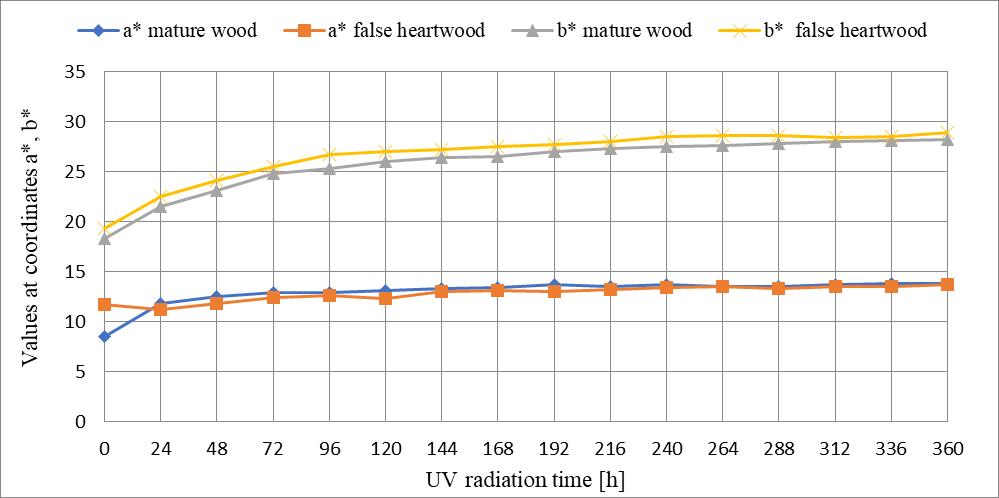
Thecourseofchanges in thelightnesscoordinateL*and thechromaticitycoordinates of red a* and yellow b* induced by UV radiation for 360 hours in the Q-SUN Xe-3-HS Xenotest are shown in Fig. 2 and Fig. 3.
Fig. 2. Effect of UV radiation on changes in the lightness of unsteamed beech mature wood and false heartwood on the lightness coordinate L*.
Fig. 3 Effect of UV radiation on color changes of unsteamed beech mature wood and false heartwood on chromatic coordinates a* and b*.
Thecolor ofbeech maturewoodis light white-gray with ayellowtinge. Thevalues in the CIE L*a*b* color space coordinates given in Table 1 are similar to those given by the authors (Babiak et al., 2004; Meints et al., 2017; Dzurenda 2022).
The false heartwood has a different color: red-brown. In the CIE L*a*b* color space, it is givenbythevaluesintheindividualcoordinates:L*=64.9±4.9;a*=12.9±2.1;b*=19.6 ± 1.9 (Dzurenda 2023).
Thedarkerred-browncolorofbeech falseheartwooddiffersfromthelight white-gray color with a yellow tinge of mature wood by a significant difference between the values of the lightnesscoordinateby∆L*=-11.9andanincreaseinthevaluesofthechromaticcoordinate of the red color by ∆a* = +3.4 and of the yellow color by ∆b* = +1.0. The difference in the colorofbeech falseheartwoodcomparedto thecolorofmaturewoodexpressedbythetotal color difference is ∆E* = 12.8. According to the categorization of wood color changes presented by Cividini et al. (2007), the stated value of the total color difference places such the difference in wood color category ∆E > 12, i.e., different colors.
Photochemical reactions in mature beech wood and beech heartwood under UV radiation result in opposing color changes: a significant darkening and a red-brown color shade in mature beech wood, and a slight lightening of the red-brown color in beech heartwood.ThemagnitudeofchangesinducedbyUVradiationonindividualcoordinatesof the color space CIE L*a*b* of mature beech wood and false heartwood induced by UV radiation is documented in Table 2.
Tab. 2 The magnitude of changes induced by UV radiation on L*a*b* coordinates.
Beech wood Changes in values in the color space CIE L*a*b* coordinates ∆E*
The total color difference ∆EMW* = 15.8 during darkening and obtaining a red-brown shade of mature beech wood caused by UV radiation was achieved by significantly reducing the value on the lightness coordinate to the value L* = 67.6 ± 1.5 and increasing the value on the yellow color coordinate to b* = 28.2 ± 0.9. The red-brown shade is complemented by increasing the value of the red color to the level a* = 13.8. Similar color changes on the surface of beech wood caused by UV radiation, or. long-term exposure to daylight is presented in the works of the authors: (Kúdela and Kubovský 2016; Laskowska 2020; Dzurenda and Dudiak 2022; Vidholdová et al., 2025).
ThecolorofthefalseheartwoodfadedduetoUVradiation.Thelighteningofthered-brown color of the false heartwood to a lighter shade was not achieved by a decrease in the value ofthelightness coordinate, but by its increaseby ∆L* =+1.9, an increasein thevalueofthe red color coordinate by ∆a* = +2.3 and a significant increase in the value of the yellow chromatic coordinate by ∆b* = +9.6, which is mainly manifested by the yellowing of the red-brown color of the false heartwood. The value of the total color difference of the false heartwood∆EFHW*=10.1,is1/3lowerthanthetotalcolordifferenceofthesapwoodcaused by UV radiation.
The cause of the lightening of the red-brown color of the beech false heartwood is the chromophores ofpolyphenoliccompoundsthatwereformedby enzymatic processesduring the formation of the false heartwood (Albert et al., 2003). These chromophores undergo photochemical reactions under UV irradiation, similar to the quinone-type chromophore systems formed in steamed beech wood during the steaming process (Chen et al., 2014; Timar et al., 2016; Hofmann et al., 2025; Dzurenda 2022; Dzurenda and Dudiak, 2025).
The color changes on the surfaces of mature beech wood and false heartwood after UV irradiation are characterized by a decrease in the color contrast between the two. This is
numerically documented by low differences in the lightness (∆L* = 0.9) and chromaticity coordinates–intheredcomponent(∆a*=0.2)andyellowcomponent(∆b*=0.7).Thetotal color difference reaches a value of ∆E0* = 1.2. According to the color difference evaluation scale by Cividini et al. (2007) this value falls into the category ∆E* = 0.2–2.0, which represents small color changes.
A characteristic feature of the surface of mature beech wood and false heartwood after UV irradiationisalmostzeroabsorptionofelectromagneticradiationintheredregion(630–750 nm) and a significant decrease in absorption in the yellow region (570–590 nm).
The course of changes in the individual coordinates of the CIE L*a*b* color space during360hoursofirradiationinFig.2and3documentsboththedifferenceintheirsizeon the brightness coordinate ∆L*, red color ∆a* and yellow color ∆b*, as well as the temporal non-uniformityoftherealizations,manifestedbyvisiblechangesinthecolorofbeechwood in the zone of mature wood and false heartwood with the naked eye.
The contradiction of color changes, darkening of mature beech wood, or lightening of false heartwood wood is shown in Fig. 2. The continuous decrease in the values on the lightness coordinate L* of sapwood is documented by a decrease from the value L0* = 78.7 to the value L72* = 68.2 and, conversely, the increase in the values on the coordinates of false heartwood,manifestedbyalighteningofthewoodcolor,isfromthevalueL0*=66.6tothe value L72* = 69.0. The above changes are realized in the first 72 hours.
Theoppositecourseofcolorchangesisalsoonthechromaticcoordinateoftheredcolora*. In mature beech wood, the values on the red color coordinate increase in the first 72 hours from the value a0* = 8.5 to the value a72* = 13.9. On the red color coordinate of false heartwood,thereisadecreaseinthevaluesby∆a*=-0.5inthefirstτ=24hoursandduring the following τ = 48 hours, there is an increase not only to the original value, but also an increase by ∆a* = 2.0 to the final state a* = 13.5.
On the yellow color coordinate, the values of both mature beech wood and false heartwood increase simultaneously over 144 hours. The magnitude of the changes in the yellow color coordinates is ∆b* ≈ 9.8.
The development of changes in the individual coordinates L*, a* and b* of mature beech wood and false heartwood during irradiation in the Q-SUN Xe-3-HS Xenotest shows that the lightness coordinate L* and the red color coordinate a* are realized in the first 72 hours and theyellowcolor coordinateb* within 144 hours.Subsequently, both sapwoodand false heartwood were resistant to UV radiation. The fact that color changes on the wood surface due to UV radiation during testing in the xenotest is reported to occur within a time not exceeding the value τ ≤ 150 hours is mentioned by several authors (Kúdela and Kubovský 2016; Baar and Gryc 2011; Dudiak et al., 2022). Oltean et al., (2008), based on the investigation of the effect of UV radiation on softwood and hardwood of trees growing in theclimaticconditionsofthetemperatezoneofEuropeconcluded, thatrapidchangesoccur during the first 24 hours of UV exposure and most of the measured wood species reached stable values after 120 hours of exposure. Subsequent irradiation caused only a slight, practically invisible to the naked eye, increase or decrease in the value of the total color difference.
CONCLUSION
The paper presents the results of color changes in beech mature wood and false heartwood induced by UV radiation in the Q-SUN Xe-3-H Xenotest. The results of the
analysis of the effect of UV radiation on wood showed that:
- Theexposedsurfaceshowedchangesvisibletothenakedeyeupto144hoursofUV radiation.
- The surface of mature beech wood darkened from a light white-gray color with a yellow tinge to a red-brown color shade with values in the color space CIE coordinates L*a*b*, lightness L* = 67.6 ± 1.5, red color a* = 13.8 ± 1.2 and yellow color b* = 22.8 ± 0.9. The mentioned change in wood darkening is indicated by a decrease in the value of the lightness coordinate by ∆L* = - 11.6 and an increase in the values of the red chromatic coordinate by ∆a* = +5.5 and the yellow by ∆b* = + 9.9.
- The surface of the beech wood with a false heartwood, on the other hand, lightened the original red-brown color to a lighter shade due to UV radiation. The mentioned changewasachievedbyaslightpositiveshiftofthevalueonthelightnesscoordinate by ∆L* =+1.9, thered color coordinatea* =2.3 and asignificant shift oftheyellow chromatic coordinate by ∆b* = + 9.6.
- The color changes on the surface of the beech wood with a false heartwood in the mature and false heartwood zones caused by UV radiation are not the same. This is evidencedbythechangeinthetotalcolordifference∆E*,whichis∆EMW*=15.8for mature wood and ∆EFHW*= 10.1 for the false heartwood.
- UV radiation contributes to a significant reduction in the color contrast between the color of mature wood and false heartwood. This is numerically documented by the differences in the lightness coordinate ∆L* = 0.9 and the chromatic coordinates: red color ∆a* = 0.2 and yellow color ∆b* = 0.7. The difference in color after irradiation between mature beech wood and heartwood expressed by the total color difference is ∆E* = 1.2, which, according to the authors' scale (Cividini et al., 2007) ranks it in the small color change category (0.2 - 2.0).
REFERENCES
Albert, L., Hofmann, T., Németh, Zs. I., Rétfalvi, T., Koloszár, J., Varga, Sz., Csepregi, I., 2003. Radial variation of total phenol content in beech (Fagus sylvatica L.) wood with and without red heartwood. Holz als Roh- und Werkstoff 61, 227–230. https://doi.org/10.1007/s00107-0030381-x
Baar, J., Gryc, V., 2011 The analysis of tropical wood discoloration caused by simulated sunlight. EuropenJournal of woodand Wood Products,70(1-3),263-269. https://doi.org/10.1007/s00107011-0551-1
Babiak,M., Kubovský,I.,Mamoňová,M., 2004 Color spaceof selectedlocalwoods Interactionof wood with variousForms of Energy.Technickáuniverzita voZvolene. pp. 113 –117. ISBN80228-1429-6.
Cividini, R., Travan, L., Allegretti, O., 2007 White beech: A tricky problem in drying process. InternationalScientificConferenceonHardwoodprocessing2007.September24-25-26.Quebec City, Canada.
Dudiak, M., Dzurenda, L., Kučerová, E., 2022. Effect of Sunlight on The Change in Color of Unsteamed and Steamed Beech Wood with Water Steam. Polymers 14, 1697. https://doi.org/10.3390/polym14091697
Dzurenda,L.,2022.RangeofColorChangesofBeechWoodintheSteamingProcess.BioResources 17(1), 1690-1702. https://doi.org/10.15376/biores.17.1.1690-1702
Dzurenda, L., Dudiak, M., 2022. Effect of UV Radiation on Change in Color of Steamed Beech Wood. Wood Research 67(3):361-371.
Dzurenda,L.,2023 NaturalVariabilityoftheColorofBeechWoodintheColorSpaceCIEL*a*b*. Forests 2023, 14(6), 1103 https://doi.org/10.3390/f14061103
Dzurenda, L., Dudiak, M., 2025. Elimination of color differences between beech sapwood and false heartwood through the steaming process [Eliminácia rozdielov farby bukového dreva bele
a nepravého jadra procesom parenia] Technical University in Zvolen, 117 p. ISBN 978-80228-3498-8.
Evans, P., Chowdhury, MJ., Mathews, B., Schmalzl, K., Ayer, S., Kiguchi, M., Kataoka, Y., 2005. Weathering and surface protection of wood. Kutz M (ed) Handbook of environmental degradation of materials. William Andrew Publishing, pp. 277–297.
Feist,WC ,Hon,DNS.,1984 Chemistryofweatheringandprotection.RowellR(ed)Thechemistry of solid wood. Advances in chemistry, vol 207. American Chemical Society, Washington, pp 401–451
Fengel, D., Wegener, G., 1989. Wood: Chemistry, Ultrastructure, Reactions; Walter de Gruyter: Berlin, 613 p
George, B., Suttie, E., Merlin, A., Deglise, X., 2005. Photodegradation and photostabilisation of wood The state of the art. Polym. Degrad. Stab. 88, 268–274.
Hofmann,T.,Visi-Rajczi,E.,Albert,L.,2025 RoleofExtractableandNon-ExtractablePolyphenols in the Formation of Beech (Fagus sylvatica L.) Red Heartwood Chromophores. Forests 2025, 16(10), 1557 https://doi.org/10.3390/f16101557 Hon,D.S.N.,Shiraishi,N.,2001 WoodandCellulosicChemistry.NewYork:MarcelDekker, 513–546.
Chen, Y., Tshabalala, M. A., Gao, J., Stark, N. M., and Fan, Y., 2014. Color and surface chemistry changes of extracted wood flour after heating at 120 °C Wood Science and Technology 48, 137-150. https://doi.org/10.1007/s00226-013-0582-3
Kúdela, J., Kubovský, I., 2016. Accelerated-ageing-induced photo-degra-dation of beech wood surface treated with selected coating materials. Acta Facultatis Xylologiae Zvolen, 58(2), 2736. https://doi.org/10.17423/afx.2016.58.2.03
Laskowska, A., 2020 The influence of ultraviolet radiation on the colour of thermo-mechanically modified beech and oak wood. Maderas, Cienc. Tecnol. 2020, 22, 55-68.
Meints, T., Teischinger, A.,Stingl, R., Hassmann, C., 2017. Wood colour of central European wood species: CIELAB characterisation and colour intensification European Journal of Wood and Products 75, 499-509. https://doi.org/10.1007/s00107-016-1108-0
Müller, U., Rätzsch, M., Schwanninger, M., Steiner, M.; Zöbl, H., 2023 Yellowing and IR-changes of spruce wood as result of UV-irradiation. J. Photochem. Photobiol. B Biol 2003, 69, 97–105
Nzokou, P , Kamdem, DP., 2006 Influence of wood extractives on the photo-discoloration of wood surfaces exposed to artificial weathering. Color Res Appl 31, 425–434
Oltean, L , Teischinger, A , Hansmann, C., 2008 Wood surface discolouration due to simulated indoor sunlight exposure. Holz Roh-Werkst 66, 51–56
Rowell, R. M. (Ed.)., 2013. Wood chemistry and wood composites. Boca Raton, FL: CRC Press. Varga, D., Tolvaj, L., Preklet, E., 2021 Colour stability of steamed black locust, beech and spruce timbers during short-term photodegradation. Wood Research 66(4), 544-555. https://doi.org/10.37763/wr.1336-4561/ 66.4.5544555
Vidholdová, Z., Slabejová, G., Výbohová, E., 2025. Colour Homogenisation and Photostability of Beech Wood (Fagus sylvatica L.) as Affected by Mild Steaming and Light-Induced Natural Ageing. Forests 2025, 16(7), 1104 https://doi.org/10.3390/f16071104
Teacă, C.A., Roşu, D., Bodîrlău, R., Roşu, L., 2013. Structural Changes in Wood under Artificial UV Light Irradiation Determined by FTIR Spectroscopy and Color Measurements A Brief Review. BioResources, 8, 1478–1507.
Timar, M. C., Varodi, A., Hacibektasoglu, M., Campean, M., 2016. Color and FTIR analysis of chemical changes in beech wood (Fagus sylvatica L.) after light streaming and heat treatment in two different environments, BioRes. 11(4), 8325-8343.
Tolvaj, L , Preklet, E , Barta, E , Papp, G., 2001. Dependence on light sources of the artificial photodegradation of wood. Workshop within COST action E-18, high performance wood coatings, Paris.
ACKNOWLEDGMENT
This experimental research was prepared within the grant project: APVV 21-0051 Research of false heartwood and sapwood of Fagus sylvatica L. wood in order to eliminate color differences by the
process of thermal treatment with saturated water steam as the result of work of author and the considerableassistanceoftheAPVVagency,theKEGA015TUZ4/2025projectCreationofsupport toolsforfurtherandupdatetrainingofworkersinthewoodworkingindustryfortheneedsofIndustry 4.0
AUTHORS’ ADDRESSES
prof. em. Ing. Ladislav Dzurenda, PhD. Ing. Michal Dudiak, PhD. Technical University in Zvolen T. G. Masaryka 24 960 01 Zvolen, Slovakia dzurenda.ladislav@gmail.com xdudiak@tuzvo.sk
prof. Ing. Alena Očkajová, PhD. Matej Bel University in Banská Bystrica Faculty of Natural Sciences Tajovského 40 974 01 Banská Bystrica, Slovakia alena.ockajova@umb.sk
ACTA FACULTATIS XYLOLOGIAE ZVOLEN, 68(1): 27 38, 2026
Zvolen, Technická univerzita vo Zvolene
DOI: 10.17423/afx.2026.68.1.03
THE IMPACT OF SODIUMAND MAGNESIUM LIGNOSULFONATES ON AMINO RESIN ADHESIVES FOR WOODBASED PANELSPRODUCTION
Pavlo Bekhta – Iryna Lytvyn – Ján Sedliačik
ABSTRACT
In the study, the effects of sodium lignosulfonate (NaLS) and magnesium lignosulfonate (MgLS) on urea-formaldehyde (UF) and melamine-urea-formaldehyde (MUF) adhesives wereevaluated.Lignosulfonateswereincorporatedat2.5%,5.0%,and7.5%(basedonresin solids),and theirinfluenceon solids content, viscosity, gel time,pH,and freeformaldehyde content was analysed. Both NaLS and MgLS reduced solids content and viscosity. Gel time in UF adhesives increased moderately from 53.7 s to 57–60 s (+6–12%), indicating slight curing retardation, whereas MUF systems showed a small decrease to ~81 s (−6.6%) with MgLS and minimal changewith NaLS. Lignosulfonates also affectedpHand formaldehyde content.Sodiumlignosulfonateprimarilyenhancedadhesiveflowandreducedviscositydue to weaker ionic interactions, whereas magnesium lignosulfonate influenced curing kinetics and pH through stronger electrostatic and coordination interactions. Free formaldehyde content decreased by approximately 10% in UF systems. In MUF adhesives, MgLS led to a slight reduction, whereas NaLS increased free formaldehyde by up to 30.8–32.1%. These results highlight a clear counterion-dependent behavior and demonstrate the potential of lignosulfonates as multifunctional, bio-based modifiers for wood adhesive systems.
Keywords: urea-formaldehyde resin; melamine-urea-formaldehyde resin; sodium and magnesiumlignosulfonates;viscosity;curingkinetics;formaldehydereduction; wood-based panel
INTRODUCTION
Wood-based composite materials, including particleboard and medium-density fiberboard (MDF), play a crucial role in the modern wood-processing industry by enabling the efficient utilization of wood resources and the production of value-added products. The performance of these composites largely depends on the adhesive system used during manufacturing. With the continuous growth in global production of wood-based panels, the demand for industrial adhesives has also increased significantly. Although the resin content in panels typically accounts for only 2–14% of the oven-dry wood mass, adhesives account foramajorshareoftotalmaterialcosts,rangingfrom30–50%(Solt et al.,2019).Evenminor variations in resin consumption or price can substantially affect the overall production cost of wood-based panels (Maloney, 1993). This enhances the importance of optimizing adhesive systems from both economic and technological perspectives.
For several decades, wood-based panels have been produced primarily using thermosetting adhesives from three main classes: aminoplasts, phenolics, and isocyanates (Pizzi, 2014). About 95% of these adhesives are formaldehyde-based (Kumar and Pizzi, 2019), with urea-formaldehyde (UF) resins dominating the market (~85%; ~11 million tons annually) (Pizzi et al., 2020). Their widespread use is driven by low cost, high reactivity, strong adhesion to wood, short curing times, low pressing temperatures, water solubility, and a colorless bond line (Dunky, 2003). Consequently, UF resins are widely used in particleboard and MDF for interior applications.
However, UF adhesives have a major limitation: the emission of volatile organic compounds, particularly formaldehyde. Formaldehyde exposure can cause irritation of the eyes and respiratory tract and poses long-term health risks (Mantanis et al., 2018). This has ledtostrictemissionregulationsinEurope,theUnitedStates,andJapan.Inparallel,reliance on petroleum-derived raw materials raises concerns about cost stability and resource sustainability, driving the search for bio-based alternatives. Formaldehyde emissions are primarily determined by the free formaldehyde content of the resin rather than its total amount. Emissions can be reduced through process optimization and chemical or physical modification of adhesive systems. As a result, increasing attention is paid to renewable modifiers, e.g., underutilized by-products of the pulp and paper industry, such as technical lignin (including Kraft lignin) and lignosulfonates (LS).
Lignin-based materials are promising bio-based alternatives to conventional formaldehyde-containing resins. Lignin is the second most abundant natural biopolymer aftercellulose,withanestimatedtotalcontentof3×10¹¹tonsinthebiosphereandanannual biosynthesis of about 2 × 10¹⁰ tons (Hu et al., 2011). The pulp and paper industry generates 50–75 million tons of technical lignin annually, mainly as Kraft lignin and lignosulfonates (Mandlekar et al., 2018), most of which remains underutilized and is typically used for energy recovery.
The polyphenolic structure of lignin enables its application as a partial substitute for phenolinphenol-formaldehyde(PF)resins.Substitutionlevelsof20–30%phenolhavebeen achieved without significant loss ofpanel performance (Çetin and Özmen, 2002; Kouisni et al., 2011), and in some cases, up to 80% replacement has been reported (da Silva et al., 2017). Chemically modified lignin, such as phenolated or glyoxalated derivatives, further improves adhesive performance (El Mansouri et al., 2007; Lei et al., 2008). Among lignin derivatives, lignosulfonates, which account for up to 90% of commercially available lignin products, are attractive due to their industrial availability and functional versatility.
However, lignin reactivity remains limited, often requiring modification or the use of crosslinkingagents(Pizzi,2006;Hu et al.,2011;Hemmilä et al.,2019;Bekhta et al.,2021).
In UF and MUF systems, lignosulfonates have been shown to reduce viscosity, act as plasticizers,andpartiallyscavengeformaldehyde(Hemmilä et al.,2017,2019;Antov et al., 2020, 2021; Bekhta et al., 2021). Nevertheless, the influence of counterion type on these effects remains insufficiently studied, although it may significantly affect interactions with water, resin components, and formaldehyde.
WhilemostresearchhasfocusedonlignininPFresins,itsapplicationinUFandMUF adhesives remains less explored despite their dominant industrial use in particleboard production. In this context, lignosulfonates represent promising multifunctional additives capableofpartiallyreplacingsyntheticresincomponents,reducingformaldehydeemissions, and maintaining adhesive performance.
Thenoveltyofthepresentstudyliesinthefirstsystematicinvestigationofsodiumand magnesiumlignosulfonatesasadditivestoUFandMUFresinsforparticleboardproduction. In particular, their effects on adhesive viscosity, acidity of the adhesive system, curing
kinetics,andfreeformaldehydecontentwereexamined.Byintegratingperformance-related andenvironmentalaspects,thisapproachcontributestothedevelopmentofmoresustainable adhesive formulations.
The objective of this study is to evaluate the feasibility of using sodium (NaLS) and magnesium (MgLS) lignosulfonates as additives in UF and MUF resins. Specifically, the study aimsto determinehowdifferent levels ofresin substitution affect theproperties ofthe modified adhesives and to provide mechanistic insights into the role of counterions in lignosulfonate-modified adhesive systems. In addition, the potential of these additives to improve adhesive performance and reduce formaldehyde emissions is assessed. The results are expected to provide new insights into the mechanisms of interaction between lignosulfonates and aminoplast resins, thereby supporting the development of more environmentally friendly adhesive systems for the production of wood-based panels. The present study is limited to adhesive system characterization, while the evaluation of the mechanical properties of wood-based panels will be the subject of future work.
MATERIALS AND METHODS
Materials
AdhesiveformulationswerepreparedaccordingtotherecipessummarizedinTable1. First, the required amount of lignosulfonate solution was added to the UF or MUF resin under continuous mechanical stirring. The mixture was then homogenized using a mechanicalstirrerforaspecifiedtimetoensureuniformdistributionoflignosulfonatewithin the adhesive system. All preparations were performed at room temperature.
Tab. 1 Adhesive composition.
The UF (solid content 66.1 ± 0.06%, dynamic viscosity 440.7 ± 0.6 mPa.s) and MUF (solid content 64.9 ± 0.20%, dynamic viscosity 232.7 ± 3.5 mPa.s) resins were used to prepare the adhesive systems. Magnesium lignosulfonate (MgLS; Borregaard, Germany) and sodium lignosulfonate (NaLS; Domsjö Lignin, Sweden) were applied as lignin-based additives. Thelignosulfonates wereused as aqueous solutionswith aworking concentration of 50%. The lignosulfonate addition levels corresponded to the replacement of 2.5%, 5.0%, and 7.5% of the UF or MUF resin in the adhesive formulations. MgLS had the following characteristics: total solids content > 90%; pH (10% solution) 4.0 ± 1.0; insoluble matter ≤
0.8%; Mg content 3%; Cl ≤ 0.1%; sucrose 6%; and density 450 – 600 kg/m3. NaLS exhibited the following properties: total solids content > 95%; pH (10% solution) 6 ± 1; Na 9%; S 8.5%; Ca 0.12%; Cl 0.01%; insoluble substances < 0.1%; sulphate 7.5% (in the form of sulfate ions); and sucrose 2.0%.
Adhesive analysis
For each adhesive formulation prepared according to the specified recipe (Table 1), the following properties were determined: solids content, dynamic viscosity, curing time, hydrogen ion concentration (pH), and free formaldehyde content. The solids content of the preparedadhesivemixtureswasdeterminedgravimetricallybytheweightmethod.Dynamic viscosity was measured using a rotary viscometer “ROTAVISC hi-vi I“ (IKA Viscometers, Germany), while pH was determined with an І-315 pH meter. The curing time (gel time) of theadhesivemixtureswasdeterminedat100°C.Thefreeformaldehydecontentoftheresin was determined by titration. All measurements were performed in triplicate. Due to the limited number of replicates, only descriptive statistics (mean and standard deviation) were applied in this study.
RESULTS AND DISCUSSION
The properties of UF and MUF adhesives with varying levels of NaLS and MgLS are summarized in Table 2. The results presented in Table 2 show consistent trends in adhesive properties with increasing lignosulfonate content. Although the absolute changes in some parametersarerelativelymoderate,thedirectionofchangeissystematicacrossbothUFand MUF systems. The gradual decrease in solids content and viscosity with increasing lignosulfonate concentration suggests that the observed effects are not random but are directly related to the incorporation of lignosulfonate solutions into the adhesive matrix.
Tab. 2 Properties of adhesives.
0.59 (0.01)
5.0 65.3 (0.06) 378.0 (1.0) 56.7 (0.58) 6.9 (0.06) 0.54 (0.01) 7.5 64.7 (0.58) 358.7 (1.2) 59.7 (0.58) 6.8 (0.06)* MUF 0 64.9 (0.20) 251.0 (1.7) 86.7 (0.58) 9.4 (0.06) 0.078 (0.001) MUF + MgLS 2.5 63.3 (0.17) 244.3 (2.1) 84.0 (0.58) 8.3 (0.06) 0.077 (0.002)
Notes: LS = lignosulfonate; UF = urea-formaldehyde resin; MUF = melamine-urea-formaldehyde resin; MgLS = magnesium lignosulfonate; NaLS = sodium lignosulfonate. Values are presented as mean ± standard deviation (n = 3). *Free formaldehyde content could not be determined by titration due tointerference from the solution color
The relatively small standard deviations obtained for viscosity, gel time, and pH indicate good reproducibility of the measurements and confirm the stability of the prepared adhesive formulations. Themonotonicreduction in viscosity particularly in NaLS-modified systems suggests that the dispersing effect of lignosulfonates increases proportionally with concentration. In contrast, MgLS-modified adhesives show slightly smaller changes in viscositybutmorenoticeablechangesincuringbehaviorandpH,indicatingthatthedivalent magnesium cation influences chemical interactions within the system rather than only its rheological behavior.
Suchsystematictrendssupporttheinterpretationthattheobserveddifferencesbetween NaLS and MgLS adhesives are primarily related to the different ionic characteristics of Na⁺ and Mg²⁺ counterions and their interactions with lignosulfonate functional groups and resin components.
Rheological properties and solids content
The incorporation of lignosulfonates affected both the solids content and the rheological behavior of the UF and MUF adhesive systems. In all formulations, an increase in lignosulfonate content resulted in a gradual decrease in solids content. For UF adhesives modified with MgLS, the solids content decreased from 66.1% in the reference adhesive to 64.0% at a 7.5% substitution level. A comparable, but slightly less pronounced, reduction was observed for UF adhesives containing NaLS, with the solids content decreasing from 66.5%to64.7%.Similartrendswereobservedin MUFsystems,whereMgLSreduced from 64.9% to 62.8%, while NaLS decreased to 64.1%.
The reduction in solids content is primarily due to the addition of lignosulfonates in aqueous form, which increases the water fraction of the adhesive. The observed differences betweenMgLSandNaLSsystemsmaysuggestthatthecounterioninfluenceshydrationand intermolecular interactions. In particular, Mg²⁺ could form stronger electrostatic and coordination interactions with sulfonate groups than Na⁺, potentially promoting more strongly hydrated structures and contributing to the slightly greater reduction in solids content in MgLS-based adhesives. Although lignosulfonates introduce additional dissolved and colloidal matter, their contribution appears to depend on ion type. NaLS (9% Na), with higher solubility and ionic content, may integrate more uniformly into the aqueous phase, contributing more effectively to the measured solids. In contrast, MgLS (3% Mg), possibly due to stronger ionic associations and a higher insoluble fraction, may partly behave as a dispersed phase, resulting in a somewhat lower effective contribution to solids content.
The addition of lignosulfonates influenced the viscosity of the adhesive mixtures. In UFsystems,viscositydecreasedfrom394.7to373.0 mPa.s(4.5%)withMgLSandto358.7 mPa.s(9.1%)withNaLS.AsimilartrendwasobservedforMUFadhesives,whereviscosity decreased from 251.0 to 227.3 mPa.s (9.4%) with MgLS and to 227.0 mPa.s (9.6%) with NaLS. This reduction is commonly attributed to the amphiphilic nature of lignosulfonates, which can act as dispersing and plasticizing agents, improving resin distribution and reducing intermolecular interactions. Similar behavior was reported in previous studies (Hemmilä et al.,2019;Li et al.,2023;AitBenhamou et al.,2025;Nafisah et al.,2025;Paez and Fatehi, 2025).
The slightly stronger effect observed in NaLS-modified adhesives may be related to differencesinioniccharacteristics.Na⁺,as amonovalention,mayformweakerassociations with sulfonate groups, allowing greater molecular mobility and more effective dispersion. In contrast, Mg²⁺ could promote limited ionic bridging between lignosulfonate chains, potentially leading to some degree of association that moderates the viscosity reduction. Althoughlignosulfonatesintroduceadditionalmacromolecularcontentandcaninteractwith
the resin through hydrogen bonding and ionic interactions, their overall effect in these systems appears to be dominated by their dispersing and plasticizing action. Differences betweenNaLSandMgLSmaythereforereflectabalancebetweendispersionefficiencyand intermolecular association.
The influence of the ionic form of lignosulfonates has also been highlighted in recent studies on lignin-modified UF and MUF adhesives. It has been shown that counterions can affect molecular aggregation, electrostatic interactions, and water retention within adhesive systems (Wu et al., 2021; Li et al., 2023). Antov et al. (2020) further reported that lignosulfonates containing different metal cations can modify adhesive viscosity and curing behavior due to differences in ionic interactions and coordination effects.
Gel time and curing behavior
The influence of lignosulfonates on curing behavior differed between UF and MUF adhesivesystems.InUF-basedadhesives,lignosulfonateadditionledtoamoderateincrease in gel time, from 53.7 s to about 57–60 s (≈6–12%), indicating slight retardation of curing. This effect may be associated with the presence of phenolic hydroxyl groups, which can react with formaldehyde, temporarily reducing its availability for polycondensation. In addition,therelativelylargelignosulfonatemacromoleculesmayintroducestericconstraints thatslowtheformationofmethylenelinkages.Similareffectshavebeenreportedinprevious studies (Hemmilä et al., 2019; Li et al., 2023; Ait Benhamou et al., 2025; Nafisah et al., 2025; Paez and Fatehi, 2025).
In contrast, MUFadhesives showed adifferent responsedepending on thecounterion. MgLS-modified systems exhibited a slight decrease in gel time, from 86.7 s to ~81 s (≈6.6%),suggestingamildaccelerationofcuring.Thismayindicateacatalyticcontribution of Mg²⁺ ions, which could facilitate condensation reactions or interactions with oxygencontainingfunctionalgroups.ForNaLS-modifiedMUFadhesives,geltimeremainedlargely unchanged, suggesting a weaker influence on curing kinetics.
Overall, these trends point to a counterion-dependent effect. Lignosulfonates may influence curing through interactions with formaldehyde and reactive intermediates, as well asbymodifyingtheacidityofthesystem. NaLS,typicallyassociatedwith higher alkalinity, may slightly retard acid-catalyzed curing, whereas MgLS, being more acidic, may reduce this effect or even promote curing to a limited extent.
pH of adhesive systems
Theincorporation oflignosulfonates resulted in asystematicdecreasein pH across all adhesive formulations. In UF adhesives modified with MgLS, the pH decreased from 7.5 to 6.3(16%reduction)asthelignosulfonatecontentincreasedto7.5%.Similarly,“UF+NaLS” adhesives showed a decrease from 7.7 to 6.8 (11.7% reduction). A comparable trend was observed in MUFadhesives, where thepH decreased from approximately 9.4 to 7.6 (19.1% reduction) in MgLS-containing systems and to 8.1 (13.8% reduction) in NaLS-modified adhesives.
This pH reduction can be attributed to the acidic character of lignosulfonates, which contain sulfonic acid groups that partially dissociate in aqueous solution. The more pronounced pH decrease in MgLS-modified systems may be related to differences in ionization behavior and complexation ability between Mg²⁺ and Na⁺ ions. Magnesium ions may interact with oxygen-containing functional groups through coordination or ionassociation effects, which could influence the acid–base equilibrium of the system and contribute to a greater shift toward more acidic conditions. In contrast, NaLS, with higher
sodium content (Na⁺ 9%), may provide greater buffering capacity, helping to moderate the pH decrease compared to MgLS systems with lower magnesium content (Mg²⁺ 3%).
Changes in pH are particularly relevant for amino resin adhesives, since the curing reactions of UF and MUF resins are strongly influenced by acidity. Therefore, the presence of lignosulfonates may indirectly modify curing kinetics by altering the pH of the adhesive mixture.
Free formaldehyde content
The incorporation of lignosulfonates resulted in a reduction in free formaldehyde content in both UF and MUF adhesive systems. In UF adhesives modified with MgLS, the free formaldehyde content decreased from 0.64% in the reference formulation to 0.58% (9.4% reduction) at a lignosulfonate content of 5%. Similarly, in UF adhesives containing NaLS, the free formaldehyde content decreased from 0.60% to 0.54% (10% reduction).
In MUF adhesives, the effect was less consistent. In the “MUF + MgLS” systems, a slight reduction was observed (1.3–3.8%), whereas in the “MUF + NaLS” systems, the free formaldehyde content increased by 30.8–32.1%. This behavior may be attributed to the higher sodium content (9%) and the more alkaline character of NaLS, which can shift the system toward higher pH values, thereby reducing the efficiency of formaldehyde scavenging reactions and slowing the incorporation of free formaldehyde into the polymer network. In contrast,MgLS,withalowermetal content(3%)and amoreacidiccharacter,is less disruptiveto curing conditions and thus retains alimitedformaldehyde-reducing effect.
The reduction in free formaldehyde can be explained by the inherent reactivity of lignosulfonates. Phenolic hydroxyl groups present in lignin structures may react with formaldehyde via electrophilic substitution, forming methylolated derivatives and methylene bridges. As a result, lignosulfonates can act as partial formaldehyde scavengers, reducing the amount of unreacted formaldehyde while becoming incorporated into the adhesive network. Similar effects have been widely reported for lignin-based additives in aminoresinsystems(Antov et al.,2021;Bekhta et al.,2021;Li et al.,2023;Pizzi,2024;Ait Benhamou et al., 2025; Nafisah et al., 2025; Paez and Fatehi, 2025). For example, Pizzi (2024)demonstratedthatlignin-derivedmaterials participateincondensationreactionswith formaldehyde through phenolic hydroxyl groups, forming methylene bridges within the polymernetwork.Likewise,Hemmilä et al. (2019)reportedthatligninincorporationreduces formaldehyde emissions and alters curing behavior due to interactions with formaldehyde intermediates during polymerization.
The presence of metal cations may also influence this process. Magnesium ions can form coordination complexes with lignosulfonate functional groups, thereby partially restricting the accessibility of reactive phenolic sites. In contrast, sodium ions form weaker ionic associations, allowing greater molecular mobility; however, in MUF systems, their stronger alkalizing effect appears to dominate, reducing the efficiency of formaldehyde scavenging.
Mechanistic interpretation: influence of Na⁺ and Mg²⁺ cations
The observed differences between NaLS- and MgLS-modified UF and MUF systems can be attributed not only to the nature of the counterions but also to their different ionic contents and physicochemical behavior in aqueous media. NaLS, characterized by higher sodium content (Na: 9%) and greater alkalinity, more strongly affects system pH, viscosity, and gel time, while simultaneously enhancing dispersion and accessibility of reactive functionalgroups.Incontrast,MgLS,withalowermagnesiumcontent(Mg:3%)andamore acidiccharacter,exhibitsaweakerbufferingcapacityandamorelimitedinfluenceonsystem
reactivity. These differences collectively influence solid content, rheological behavior, curing kinetics, and formaldehyde scavenging efficiency of the adhesive systems.
From a rheological perspective, NaLS exhibited a stronger viscosity-reducing effect compared with MgLS. This behavior may be explained by differences in the valence and association behavior ofthetwo cations. Sodium ions (Na⁺) are monovalent and are likely to interact weakly with negatively charged sulfonate groups. As a result, NaLS molecules remain relatively dispersed in aqueous systems and exhibit higher molecular mobility. This may promote better dispersion of resin components and reduce intermolecular interactions, therebycontributingtolowerviscosityoftheadhesivemixture.Incontrast,magnesiumions (Mg²⁺) are divalent and may form stronger electrostatic interactions with sulfonate groups on lignosulfonate chains. The presence of Mg²⁺ may therefore promote ionic bridging between lignosulfonate molecules, leading to partial aggregation or the formation of weak supramolecular networks. These interactions may reduce the dispersing efficiency of lignosulfonates and result in slightly higher viscosities compared with NaLS-modified systems.
The influence of cation type is also reflected in the curing behavior of the adhesive systems. In UF adhesives, lignosulfonate addition generally increased gel time, indicating a mild retardation of curing. However, MUF adhesives modified with MgLS showed a slight decreaseingeltime,suggestingthatmagnesiumionsmayinfluencecondensationreactions, potentially through coordination or acid–base effects. Divalent metal ions such as Mg²⁺ can act as Lewis acid centers, facilitating the formation of methylene bridges between methylol groupsinaminoresins.However,this effectshouldbeconsidered asapossiblecontribution rather than a confirmed catalytic mechanism in the present study. In contrast, sodium ions are less likely to participate in such coordination interactions due to their lower charge density and weaker complexation ability. Consequently, NaLS is likely to influence the adhesive system primarily through physical effects, such as dilution, dispersion, and plasticization, rather than through catalytic interactions during curing.
Another important factor is the impact of the cation type on the acid–base properties of the adhesive system. MgLS solutions typically exhibit slightly lower pH compared with NaLS, which may contribute to a greater reduction in pH when incorporated into UF and MUF adhesives. Since the curing of amino resins is strongly pH-dependent, this pH shift may further influence reaction kinetics and network formation.
Taken together, these effects help explain the distinct roles of the two lignosulfonate types observed in the present study. Sodium lignosulfonate primarily acts as a rheological modifier and dispersing agent, leading to greater viscosity reduction and improved flow properties. In contrast, magnesium lignosulfonate appears to exhibit stronger ionic interactions, potentially influencing curing behavior and the chemical environment of the adhesive system.
Implications for wood composite manufacturing
From a technological perspective, the modification of UF and MUF adhesives with lignosulfonatesmayofferseveraladvantagesforwood-basedpanelproduction.Thereduced viscosity observed in NaLS-modified adhesives may improve adhesive spreading and penetration into the porous wood structure. Improved flow properties are particularly beneficial in processes such as particleboard and fiberboard manufacturing, where uniform adhesive distribution is critical for achieving consistent bonding performance.
At the same time, the slight reduction in free formaldehyde content observed in lignosulfonate-modified systems may contribute to lower formaldehyde emissions from finished wood-based panels. The ability of lignin-derived materials to act as partial
formaldehyde scavengers has been widely recognized as an important strategy for developing more environmentally friendly wood adhesives.
The influence of MgLS on curing behavior may also be technologically relevant. The slight acceleration of curing observed in MUF adhesives containing MgLS suggests that divalent magnesium ions may facilitate condensation reactions in amino resin systems. Faster curing kinetics can potentially improve press productivity and reduce the pressing time required during panel production, provided that adhesive viscosity and penetration remain within acceptable limits.
Although the results demonstrate promising potential, the industrial applicability of lignosulfonate-modified adhesive systems has not been validated in this study and requires further investigation under pilot- and industrial-scale conditions.
Practical interpretation of NaLS vs MgLS performance
The differences observed between sodium and magnesium lignosulfonates indicate that the choice of lignosulfonate type should be carefully considered based on the targeted adhesive performance.
Sodium lignosulfonate appears to function primarily as a rheological modifier and dispersing agent, resulting in greater reductions in viscosity and improved flow properties oftheadhesivesystem.Thesecharacteristicsmaybeadvantageousinapplications requiring enhanced adhesive spreading and penetration.
In contrast, magnesium lignosulfonate appears to exert a stronger influence on curing kinetics and pH adjustment, likely due to its higher charge density and greater association capability with Mg²⁺ ions. The divalent magnesium cation may form ionic bridges between sulfonate groups and interact with oxygen-containing functional groups within the resin system, thereby influencing the development of the polymer network during curing.
Consequently,sodiumlignosulfonatesmaybemoresuitableforapplicationsrequiring improved rheological behavior. In contrast, magnesium lignosulfonates may provide additionalbenefitsin formulationswheremodificationofcuringbehavior orresin reactivity is required. The results, therefore, highlight the importance of considering the counterion chemistry of lignosulfonates when designing lignin-modified adhesive systems.
Overall assessment
Overall, the results demonstrate that both sodium and magnesium lignosulfonates can be incorporated into UF and MUF adhesive systems without significantly compromising their fundamental physicochemical properties. However, the type of counterion appears to play a measurable role in determining the magnitude of the observed effects.
Sodium lignosulfonate tends to induce stronger reductions in viscosity, likely due to weaker ionic interactions between lignosulfonate molecules, thereby increasing molecular mobility within the adhesive system. In contrast, magnesium lignosulfonate may engage stronger electrostatic and coordination interactions due to the divalent nature of Mg²⁺ ions, which could more noticeably influence water retention, pH reduction, and curing behavior. These findings highlight the importance of considering the ionic form of lignosulfonates when designing lignin-based modifiers for amino resin adhesives and demonstrate the potential of lignosulfonates as multifunctional additives that can influence rheological behavior, curing characteristics, and formaldehyde content.
CONCLUSION
Sodium (NaLS) and magnesium (MgLS) lignosulfonates exhibited distinct effects despite sharing the same lignosulfonate backbone, highlighting the role of counterions and their content (Na: 9%; Mg: 3%) in governing adhesive behavior. Both sodium and magnesium lignosulfonates reduced the solids content and dynamic viscosity of adhesives while maintaining acceptable gel time and pH for industrial applications. NaLS primarily actsas arheologicalmodifier,resultingingreaterviscosityreductionandimprovedflow. In contrast, MgLS appears to influence curing behavior and pH, likely through ionic interactions and coordination effects. Lignosulfonates reduced the free formaldehyde content in most adhesive systems (except the “MUF + NaLS” systems), likely due to the reactivityofphenolichydroxylgroups,demonstratingtheirpotentialaspartialformaldehyde scavengers. The observed differences between NaLS and MgLS may be related to the distinctbehaviorofNa⁺andMg²⁺ions:Mg²⁺maypromotestrongerelectrostaticinteractions, whereas Na⁺ enables greater molecular mobility and dispersion within the adhesive system. Overall, modifying UF and MUF adhesives with lignosulfonates offers dual benefits: improved rheological behavior for enhanced adhesive spreading and reduced formaldehyde content. These effects may contribute to process optimization, such as improved coating uniformity and potentially adjusted pressing parameters in wood-based panel production. Lignosulfonates, as renewable, lignin-based additives, represent a promising approach for partial substitution of petrochemical resin components in wood adhesives, contributing to more sustainable adhesive systems
REFERENCES
Ait Benhamou, A., Abid, L., Calvez, I., Cloutier, A., Nejad, M., Stevanovic, T., Landry, V., 2025. Advances in Lignin Chemistry, Bonding Performance, and Formaldehyde Emission Reduction in Lignin-Based Urea-Formaldehyde Adhesives: A Review. ChemSusChem 18, e202500491. https://doi.org/10.1002/cssc.202500491
Antov, P., Savov, V., Krišťák, Ľ., Réh, R., Mantanis, G.I., 2021. Eco-friendly, high-density fiberboards bonded with urea-formaldehyde and ammonium lignosulfonate. Polymers 13(2), 220. https://doi.org/10.3390/polym13020220
Antov, P., Savov, V., Neykov, N., 2020. Sustainable bio-based adhesives for eco-friendly wood composites. A review. Wood Research 65, 1, 51–62. https://doi.org/10.37763/wr.13364561/65.1.051062
Bekhta, P., Noshchenko, G., Réh, R., Krišťák, L., Sedliačik, J., Antov, P., Mirski, R., Savov, V., 2021. Properties of eco-friendly particleboards bonded with lignosulfonate-urea-formaldehyde adhesives and pMDI as a crosslinker. Materials 14(17), 4875. https://doi.org/10.3390/ma14174875
Çetin, N.S., Özmen, N., 2002. Use of organosolv lignin in phenol-formaldehyde resins for particleboard production: II. Particleboard production and properties. International Journal of Adhesion and Adhesives 22, 6, 481–486. https://doi.org/10.1016/S0143-7496(02)00059-3
daSilva,M.A.,dosSantos,P.V.,Silva,G.C.,Lelis,R.C.C.,doNascimento,A.M.,Brito,E.O.,2017. Using lignosulfonate and Phenol-Formaldehyde adhesive in particleboard manufacturing. Scientia Forestalis/Forest Sciences 45, 115, 423–433. https://doi.org/10.18671/scifor.v45n115.01
Dunky, M., 2003. Adhesives in the wood industry. In Handbook of Adhesive Technology, 2th ed.; RevisedandExpanded.Pizzi,A.,Mittal,K.L.,Eds.;MarcelDekker,Inc.:NewYork,NY,USA; Basel, Switzerland, 2003; 71p, https://doi.org/10.1201/9780203912225.ch47
El Mansouri, N.E., Pizzi, A., Salvado, J., 2007. Lignin-based wood panel adhesives without formaldehyde. Holz als Roh- und Werkstoff 65, 65–70. https://doi.org/10.1007/s00107-0060130-z
Hemmilä, H., Adamopolus, St., Hosseinpourpia, R., Ahmed, Sh.A., 2019. Ammonium Lignosulfonate Adhesives for Particleboards with pMDI and Furfuryl Alcohol as Crosslinkers. Polymers 11, 10, 1633. https://doi.org/10.3390/polym11101633
Hemmilä, V., Adamopoulos, S., Karlsson, O., Kumar, A., 2017. Development of sustainable bioadhesives for engineered wood panels – A Review. RSC Advances 7, 61, 38604–38630. https://doi.org/10.1039/C7RA06598A
Hu, L., Pan, H., Zhou, Y., Zhang, M., 2011. Methods to Improve Lignin's Reactivity as a Phenol Substitute and as Replacement for Other Phenolic Compounds: A Brief Review. BioResources 6, 3, 3515–3525. https://doi.org/10.15376/biores.6.3.3515-3525
Kouisni, L.,Fang, Y., Paleologou, M., Ahvazi, B., Hawari, J., Zhang, Y., Wang,X.-M., 2011. Kraft lignin recovery and its use in the preparation of lignin-based phenol formaldehyde resins for plywood. Cellulose Chemistry and Technology 45, 7-8, 515–520
Kumar, R.N., Pizzi, A., 2019. Environmental Aspects of Adhesives–Emission of Formaldehyde. In: AdhesivesforWoodandLignocellulosicMaterials,Wiley-ScrivenerPublishing:Hoboken,NJ, USA, 2019; pp. 293–312
Lei, H., Pizzi, A., Du, G., 2008. Environmentally friendly mixed tannin/lignin wood resins. Journal of Applied Polymer Science 107, 1, 203–209. https://doi.org/10.1002/app.27011
Li, D., Yu, L., Li, L., Liang, J., Wu, Z., Xu, X., Zhong, X., Gong, F., 2023. Melamine–Urea–Formaldehyde Resin Adhesive Modified with Recycling Lignin: Preparation, Structures and Properties. Forests 14(8), 1625. https://doi.org/10.3390/f14081625
Maloney, T.M., 1993. Modern particleboard and dry process manufacturing. San Francisco: Miller Freeman Inc.; 1993.
Mandlekar, N., Cayla, A., Rault, F., Giraud, S., Salaün, F., Malucelli, G., Guan, J.-P., 2018. An overviewontheuseofligninanditsderivativesinfireretardantpolymersystems,lignin-trends and applications, 2018, InTech.Matheus Poletto, IntechOpen. Lignin Trends Appl. https://doi.org/10.5772/intechopen.72963
Mantanis,G.I.,Athanassiadou,E.T.,Barbu,M.C.,Wijnendaele,K.,2018.Adhesivesystemsusedin theEuropeanparticleboard,MDFandOSBindustries.WoodMaterialScienceandEngineering 13(2), 104–116. https://doi.org/10.1080/17480272.2017.1396622
Paez, J., Fatehi, P., 2025. Incorporation of lignin into adhesives: a review. Green Chemistry 27, 12499–12537.https://doi.org/10.1039/D5GC02998H
Nafisah, P.M., Wibowo, E.S.,Mubarok,M., Darmawan, W., Lubis,M.A.R., Santoso, A., Kusumah, S.S., Afif, S., Park, B.D., 2025. The role of lignin in enhancing adhesion performance and reducing formaldehyde emissions of phenol-resorcinol-formaldehyde resin adhesives. International Journal of Biological Macromolecules 323(2), 147251. https://doi.org/10.1016/j.ijbiomac.2025.147251
Pizzi, A., 2006. Recent developments in eco-efficient bio-based adhesives for wood bonding: Opportunities and issues. Journal of Adhesion Science Technology 20, 8, 829–846. https://doi.org/10.1163/156856106777638635
Pizzi, A., 2014. Synthetic Adhesives for Wood Panels: Chemistry and Technology - A Critical Review. Reviews of Adhesion and Adhesives 2(1), 85–126. https://doi.org/10.7569/RAA.2013.097317
Pizzi, A., Papadopoulos, A.N., Policardi, F., 2020. Wood Composites and Their Polymer Binders. Polymers 12(5), 1115. https://doi.org/10.3390/polym12051115
Solt, P., Konnerth, J., Gindl-Altmutter, W., Kantner, W., Moser, J., Mitter, R., 2019. Technological performanceofformaldehydefreeadhesivealternativesforparticleboardindustry.International Journal of Adhesionand Adhesives 94, 99e131. https://doi.org/10.1016/j.ijadhadh.2019.04.007
Wu, Z., Chen, S., Liang, J., Li, L., Xi, X., Deng, X., Zhang, B., Lei, H., 2021. Plasma treatment induced chemical changes of alkali lignin to enhance the performances of lignin-phenolformaldehyde resin adhesive. Journal of Renewable Materials 9, 1959–1972. https://doi.org/10.32604/jrm.2021.016786
ACKNOWLEDGMENT
This work was supported: by the EU NextGenerationEU through the Recovery and Resilience Plan for Slovakia under project No. 09I03-03-V01-00124. This work was supportedbytheSlovakResearchandDevelopmentAgencyunderthecontractsNo.APVV18-0378, and APVV-22-0238.
AUTHORS’ ADDRESSES
prof. Ing. Pavlo Bekhta, DrSc. Department of Wood-Based Composites, Cellulose and Paper Ukrainian National Forestry University 79057 Lviv, Ukraine; Department of Furniture and Wood Products Technical University in Zvolen 960 01 Zvolen, Slovakia; Department of Wood Science and Technology Mendel University in Brno 613 00 Brno, Czech Republic bekhta@nltu.edu.ua
Ing. Iryna Lytvyn Department of Wood-Based Composites, Cellulose and Paper Ukrainian National Forestry University 79057 Lviv Ukraine iryna.lytvyn@nltu.edu.ua
prof. Ing. Ján Sedliačik, PhD. Department of Furniture and Wood Products Technical University in Zvolen 960 01 Zvolen Slovakia jan.sedliacik@tuzvo.sk
ACTA FACULTATIS XYLOLOGIAE ZVOLEN, 68(1): 39 47, 2026
Zvolen, Technická univerzita vo Zvolene
DOI: 10.17423/afx.2026.68.1.04
ANALYSIS OF THE INFLUENCE OF STEAMING TEMPERATURE ON
THE SURFACE
ROUGHNESS OF CNC-MILLED BEECH
SAPWOOD AND FALSE HEARTWOOD
Veronika Šugárová – Lukáš Adamčík – Richard Kminiak
ABSTRACT
A comparative analysis of the surface roughness of false heartwood and sapwood zones of beech wood (Fagus sylvatica L.) after thermal treatment by steaming, followed by CNC milling, is presented in the paper. The samples were treated in four steaming modes (95 °C, 115 °C, 125 °C, and 135 °C) simulating industrial conditions. The milled surfaces were evaluated using the roughness parameters Ra and Rz using a Keyence VHX-7000 digital microscope. The results show that thermal treatment reduces surface roughness in both zones, with the most significant improvement observed at medium temperatures (115–125 °C). The false heartwood zone consistently exhibited lower roughness values, indicating a denser, more stable structure during milling. Statistical analysis confirmed the significant influence of the treatment mode and wood zone on surface roughness. These findings provide guidance on optimizing heat-treated beech machining parameters, thereby increasing efficiency in furniture production.
Keywords: beech wood; thermal modification; CNC milling; surface roughness; sapwood; false heartwood.
INTRODUCTION
CNC wood milling is a key research topic in wood science (Atanasov 2021). With ongoingtechnologicalprogress,theirindustrialapplicationscontinuetogrow,leadingtothe wider use of CNC machines in woodworking enterprises (Červený et al., 2022). However, toensurehighprocessingquality,anoptimalprocesssetupisessential.Fromatechnological standpoint, it is important to optimize machining parameters to achieve the desired surface quality. Incorrect selection of these parameters not only leads to increased roughness or waviness, which prolongs subsequent sanding, but can also cause deep defects due to torn fibres. Such damage is often impossible to remove by conventional sanding and requires repairwithfillerorcompleterejectionoftheworkpiecefromproduction.Therefore,several authorsfocusondeterminingtheoptimalparametercombinationtoachievethetargetquality of the machined surfaces (Cota et al., 2017; Gurău et al., 2021; İşleyen and Karamanoğlu 2019; Pelit et al., 2021).
Themodernization ofthewoodindustry hasledtotheuseofnewmaterials,including wood treated by steaming or hydrothermal processes. or thermal processes. Hydrothermal processes are carried out above 160 °C. Such modification changes several properties of wood – it improves dimensional stability (Damay et al., 2024), reduces swelling, moisture
content, and surface hydrophobicity (Keržič et al., 2021; Huang et al., 2023), increases resistance to rot, and extends biological durability (Bi et al., 2024; Anish et al., 2023). At the same time, density and hardness are reduced, thereby affecting the surface quality after milling. Several studies confirm that appropriately selected heat treatment reduces the roughness of the milled surface (Korkut et al., 2012; Shukla, 2019). In the case of steammodified beech wood, it is necessary to investigate not only the effect of the heat treatment temperature on the surface roughness after milling, but also how the roughness changes in thesapwoodandfalseheartwoodareas.Falseheartwoodisacommondefectinbeech wood andcanoccupyasignificantpartofthesawntimber.Therefore,fromaprocess-optimization perspective, it is essential to determine the achievable surface roughness levels in two different parts of the wood.
Inthiswork,thesurfacetextureassessmentwasperformedusingthesurfaceroughness parameterRa,whichisconsideredoneofthemostconsistentandrobustindicatorsofsurface quality (Ružová and Haddadi 2025). In addition, the Rz parameter was evaluated as a complementary indicator because it provides information on the height of the most significant surface irregularities, thereby helping characterize surfaces where localized defectsmayoccur.Theprimaryobjectiveoftheresearchistoanalyzethechangesinsurface topographyafterCNCmillingunderheattreatmentconditionsinthetemperaturerangefrom 95 °C to 135 °C, and to compare the resulting differences between two structural zones of beech wood - the outer sapwood, which represents the peripheral part of the trunk, and the false heartwood, which forms its inner core area.
MATERIALS AND METHODS
Sample preparation:
Samples of European beech wood (Fagus sylvatica L.) with a tangential surface were preparedfromboardsthathadpreviouslyundergonethermalmodificationbysteamingunder defined industrial regimes. From the boards, specimens with final dimensions of 20 mm in thickness, 70 mm in width, and 400 mm in length were made. In total, 20 specimens were prepared and subsequently divided into five groups of four pieces each. On every sample, 20 surface roughness measurements were performed.
The first group served as the untreated control and was prepared from non-steamed boards. The remaining four groups were derived from boards steamed under distinct industrialconditions.Materialforthesecondgrouporiginatedfromboardssteamedinmode Iatamaximumtemperatureof95°C;materialforthethirdgroupwasobtainedfromboards steamed in mode II at 115 °C; group 4 samples originated from boards steamed in mode III at125°C;andthelastgroupsampleswerepreparedfromboardssteamedinmodeIVat135 °C.
All steaming processes were performed under industrial conditions at Sundermann s.r.o.inBanskáŠtiavnica,Slovakia,usingsaturatedwatersteaminapressureautoclavetype APDZ 240 (Himmasch AD, Haskovo, Bulgaria), except for samples treated in mode I, saturatedmoistairatatmosphericpressurewasusedat95°C.Thesteamingregimesapplied totheboardsprecededthepreparationofindividualtestspecimensandrepresentedtheactual technological conditions employed in industrial practice.
Theparameterstmin andtmax definethetemperaturerangewithinwhichsaturatedwater steam (or saturated moist air) is introduced into the autoclave during the steaming process. The value t4 represents the temperature corresponding to the steam pressure level in the
autoclave,atwhichtheinternalpressuremustbeloweredtoallowsafeopeningofthedevice after the steaming cycle has been completed.
Tab. 1 Modes of thermal modification of beech boards using saturated moisture content or saturated water steam.
Mode
Untreated
Note: Theparameterstmin and tmax definethetemperaturerangewithinwhichsaturated watersteam(or saturatedmoist air) is introduced into the autoclave during the steaming process. The value t4 represents the temperature corresponding to the steam pressure level in the autoclave, at which the internal pressure must be lowered to allow safe opening of the device after the steaming cycle hasbeen completed.
Before the steaming process, the initial moisture content of the boards ranged from 54.7% to 58.2%. Non-thermally treated and thermally modified boards were conditioned in alow-temperaturedryingmode,ensuringnoimpactonwoodcolorchange,achievingafinal moisture content of w = 12 ± 0.5 %, using a conventional hot-air kiln, Suzar KC 1/50 (SUZAR s.r.o., Považany, Slovakia).
CNC Sample Milling:
From the boards, test specimens with final dimensions of 20 mm × 70 mm × 400 mm (thickness×width×length)wereproducedusingacirculartablesaw,ajointer,andaplaner equipped with a helical cutterhead. For the purposes of this experiment, specimens were extracted both from the false heartwood zone and from the outer sapwood zone. Following the drying process, the samples were conditioned under indoor ambient conditions to stabilize their equilibrium moisture content within the range of 8 ± 2 %. After conditioning, the equilibrium moisture content was re-verified immediately before the surface roughness measurements using the gravimetric method. The milling was performed on a 5-axis CNC machiningcentreSCMTechZ5 (SCMGroupS.p.A.,Rimini,Italy). Sampleswereclamped using a VCMC-S4 12-80 combined mechanical-vacuum system (Schmalz GmbH, Glatten, Germany), ensuring stable fixation. The milling tool used was a finishing positive spiral cutter T143 (Sistemi S.r.l., Pesaro, Italy) from WOOD-B (WOOD-B, Nové Zámky, Slovakia), with a diameter of 20 mm and 3 cutting edges. Milling was carried out under constant cutting conditions with spindle speed n = 18,000 min⁻¹, depth of cut ae = 1 mm, andfeedratevf=14m·min⁻¹.Eachsamplewas milledinasinglepass,correspondingtothe finishingmillingstep.Thisshallowcutminimizescuttingforces,reducesfibrechippingand surface roughness
Surface Roughness Measurement:
The roughness was evaluated with a Keyence VHX-7000 digital microscope (Keyence Corporation, Osaka, Japan). The milled edge of the samples was scanned by 20 evenly spaced scans measuring 3 mm × 18 mm. All scans were taken at 100× zoom using a VHZ100R lens (Keyence Corporation, Osaka, Japan). Two profile traces were evaluated per image, resulting in 20 measurements for each parameter in both directions perpendicular
to the board plane and parallel to the tool feed. The profile evaluation length was 12.5 mm. Roughness profiles were filtered according to STN EN ISO 21920 (2022) using an L-filter (λc = 2.5 mm) and an S-filter (λs = 8 μm). Surface roughness was assessed based on Ra and Rz parameters. Ra was chosen for its stability and common use in literature, enabling comparison with other studies. However, since surfaces with different topographies can sharethesame Ra(MusolffandMalburg2021), Rzwasalsoanalyzedtocapturedifferences between the highest and lowest surface points, reflecting total unevenness.
Statistical Evaluation:
TheobtaineddatasetwasevaluatedusingSTATISTICA14software(TIBCOSoftwareInc., Palo Alto, California). In the first step, outliers were detected in the dataset. Then the measured data were subjected to analysis of variance (ANOVA) at the α = 0,05 level of significance. Before applying the ANOVA method, three key statistical assumptions were tested to ensure the validity of the results. The Shapiro-Wilk test was performed on the distribution of the random variable values for all factor combinations (groups). The test confirmedthatthevaluesfollowaGaussiandistribution.Levene'stestwasusedtocheckthe equality of variances across the individual factor levels. The results indicated that the null hypothesis of equal variances was not confirmed. This violation is likely attributable to the significantinherentheterogeneityofthewoodstructurebeinganalyzed.Thefinalandcrucial assumption was the independence of the measured quantity's values (surface roughness). This assumption was deemed sufficient based on a logical assessment of the experimental procedure and data collection.
RESULTS AND DISSCUSION
The quality of the milled surface in the central false heartwood is lower compared to the peripheral sapwood zone, as might be seen in Tab. 2, where the roughness parameters are evaluated for unmodified (UM) samples as well. This difference reflects the natural anatomicalvariabilityofwood:sapwoodgenerallyhasalowerdensitythanfalseheartwood, leading to increased surfaceroughness even in unmodified, non-steamedwood (Adamčík et al., 2024). At the same time, hardness and density tend to decrease towards the peripheral parts of wood, as reported by Dzurenda et al. (2023). As a result, the sapwood tends to exhibit a higher degree of fibre tearing under identical machining conditions. Furthermore, its lower density often results in protruding fibres on the surface after milling, creating a characteristic fuzzy texture (Landry et al., 2013).
Tab. 2 Arithmetic averages of the parameters Ra and Rz for non-steamed and all steaming modes (n = 40; the values in parentheses represent the standard deviation).
Steaming mode
Based on the statistical analysis, it can be confirmed that thermal modification has a significanteffectonthesurfacequalityofmilledbeechboards,withboththetreatmentmode andthewoodzonebeingkeyfactorsinfluencingsurfaceroughness.Theinteractionbetween these factors was found to be not significant, as might be seen in Tab. 3. These findings emphasize the importance of thermal modification in enhancing the quality of beech wood intended for use in the furniture industry.
Tab. 3 Statistical significance of individual factors affecting surface roughness.
Theresults, shown in Fig. 1, indicatean overall decreasein roughness withincreasing steaming temperature, confirming the positive effect of the treatment on the quality of the milled surface (p-value < 0.000). The observed reduction in surface roughness with increasingsteamingtemperaturecanbelinkedtothephysical–chemicalprocessesoccurring during thermal treatment. Steaming initiates partial hydrolysis of hemicelluloses, reducing theirstructural rigidityandcontributingtoadecreaseinwoodstiffness and density(Esteves and Pereira 2009).
At the same time, it was shown that the false heartwood shows lower Ra values than the sapwood, which is related to its higher density caused by lignification of the cell walls and a more homogeneous structure. Narrower confidence intervals at higher temperatures indicate more stable results and less variability of the measured samples, while larger deviations in untreated wood may be due to its natural inhomogeneity.
Fig. 1 Development of the Ra parameter depending on the change in steaming mode, with emphasis on the difference between the sapwood and false heartwood.
The statistical relevance of these variations confirms that the roughness of the machinedsurfacemaydecreaseeven atcomparativelymoderatemodificationtemperatures,
below 160 °C. Several researchers have likewise observed a statistically significant reduction in surfaceirregularity at elevatedtreatment temperatures abovethis limit(Corleto et al., 2020; Kamboj et al., 2020). According to the study by Vančo et al. (2017), who evaluated the surface quality of thermally treated pine wood, the surface roughness parameter Ra was lower at a modification temperature of 160 °C than in untreated pine wood; however, beyond this temperature, roughness began to increase again. Similar findings were reported by Korčok et al. (2019), who also observed a reduction in surface roughness of spruce wood up to 160 °C, followed by a subsequent rise at higher temperatures. Further investigations focused on beech wood milling under milder steaming conditions and also indicate that increasing the steaming temperature makes the surface smoother (Dzurenda and Dudiak 2025).
As in theprevious graph, aconsistent decreasein Rzvalues is observed when moving frommode0toIV,particularlyinthesapwoodzone.TheseresultsareshowninFig.2.This trend indicates that, with increasing steaming temperature, the maximum profile height of surface roughness decreases, resulting in a reduction in the highest surface peaks. The comparisonbetweenthesapwoodandfalseheartwoodzonesshowsthatthefalseheartwood generally exhibits lower Rz values than the sapwood across most treatment modes.
Fig. 2 Development of the Rz parameter depending on the change in mode, with emphasis on the difference between the sapwood and false heartwood.
Kučerka et al. (2022) reported comparable findings, noting that at a modification temperatureof160°C,surfaceroughnessdecreased,butathighertemperaturesbetween160 °C and 200 °C, it gradually increased, showing a pronounced rise above 210 °C. Likewise, Kaplan et al. (2018b) addressed this phenomenon, stating that roughness values began to increase at 160 °C compared to untreated wood and continued to increase, thereby reducing surface quality within the 160-210 °C temperature interval. These measurements were obtained using a laser profilometer.
CONCLUSION
Initial differences in surface roughness between sapwood and false heartwood (untreated wood):
In untreatedbeech wood(UM),thenatural variability between theperipheral sapwoodzone and the central false heartwood was clearly reflected in the quality of the milled surface.
Sapwood exhibited higher Ra and Rz values, attributed to its inherently lower density and, consequently,lowerhardnesscomparedtofalseheartwood.Asaresult,evenbeforethermal modification, false heartwood produced a smoother machined surface with fewer height irregularities.
Effect of steaming temperature on surface roughness:
The results indicate that thermal modification of beech wood by steaming improves milled surface quality. Compared to untreated material (UM), the average surface roughness Ra in sapwood decreased up to 20 %, and Rz up to19 % in the optimal steaming modes. In false heartwood, the reduction was similar, with Ra decreasing by a maximum 16 % and Rz by 7 %.ThemostfavorableresultswereachievedintheI.andIV.steamingmodes,corresponding to temperatures of a maximum of 95 °C and 135 °C, where both Ra and Rz reached their lowestvalues.Statisticalanalysisconfirmedthatboththemodificationmodeandwoodzone significantly affect surface roughness (p < 0.05), with false heartwood consistently yielding lower Ra and Rz values than sapwood across all treatment modes. These findings support the conclusion that moderate steaming conditions, particularly those below 130 °C, yield smoother cutting and reduced surface irregularities. From a practical perspective, this paper demonstrates that mild thermal steaming can be an effective pre-treatment to improve the machinability of beech wood in CNC milling. The reduction in surface roughness achieved throughsteamingcan lowerpost-processingrequirements(sandingintensity,toolwear)and enhance the quality of final surfaces in industrial production, particularly in furniture and interior components where smoothness and uniformity are important.
REFERENCES
Adamčík, L., Kminiak, R., Banski, A. Pavella, F.T., 2024. Comparison of surface roughness of milled surface of false heartwood, mature wood and sapwood within beech wood. Acta Facultatis Xylologiae Zvolen, vol. 66 (2), pp. 73–82.
Anish,M.C.,Giridhar,B.N.,Nair,S.,Anantha,N.S.Pandey,K.K.,2023.Influencesofextractives andthermalmodificationontheUVresistanceofAlbizialebbeckwood.WoodMaterialScience & Engineering, Taylor & Francis, 18(2), 540–548. https://doi.org/10.1080/17480272.2022.2053586
Atanasov, V., 2021. Experimental research on the cutting force during longitudinal milling of solid wood and wood-based composites. Acta Facultatis Xylologiae 63, 73–84.
Bi, Z., Zhou, X., Chen, J., Lei, Y. Yan, L., 2024. Effects of extracts on color, dimensional stability, and decay resistance of thermally modified wood. European Journal of Wood and Wood Products 82(2), 387–401. https://doi.org/10.1007/s00107-023-02024-4
Corleto, R., Gaff, M., Niemz, P., Sethy, A. K., Todaro, L., Ditommaso, G., Razaei, F., Sikora, A., Kaplan, L., Das, S., Kamboj, G., Gašparík, M., Kačík, F. Macků, J., 2020. Effect of thermal modification on properties and milling behaviour of African padauk (Pterocarpus soyauxii Taub.) wood. Journal of Materials Research and Technology 9(4), 9315–9327. https://doi.org/10.1016/j.jmrt.2020.06.018
Cota, H., Dritan, A. Besnik, H., 2017. The influence of machining process on wood surface roughness. Agricultural Sciences 16(7), 277–283.
Červený, L., Sloup, R., Červená, T., Riedl, M. Palátová, P. Industry 4.0 as an Opportunity and Challenge for the Furniture Industry - A Case Study. Sustainability, 2022, vol. 14, no. 20, art. 13325. https://doi.org/10.3390/su142013325
Damay, J., Bender, T., Munk, C., Jousserand, M., Creton, M., Fredon, E., Rémond, R., Meausoone, P. J., Pfriem, A. Gérardin, P., 2024. Properties improvement of seven hardwood species by combination of thermal and chemical modifications. European Journal of Wood and Wood Products 82(1), 93–106. https://doi.org/10.1007/s00107-023-02000-y
Dzurenda, L., Dudiak, M., 2025. Elimination of differences in the color of beech sapwood and false heartwood by the steaming process [Eliminácia rozdielov farby bukového dreva bele a nepravéhojadraprocesomparenia].TechnicalUniversityinZvolen,2025.117p.ISBN978-80228-3498-8.
Dzurenda, L., Dudiak, M. Kučerová, V., 2023. Differences in Some Physical and Chemical Properties of Beechwood with False Heartwood, Mature Wood and Sapwood. Forests 14(6): 1123. https://doi.org/10.3390/f14061123
Esteves, B., Pereira, H., 2009. Wood modification by heat treatment: A review. Bioresources, 4(1), 370–404.
Gurău, L.,Coşereanu, C. Paiu I., 2021. Comparative Surface Quality of Larch (Larix decidua Mill.) Fretwork Patterns Cut through by CNC Routing and by Laser. Applied Sciences 11(15), 6875. https://doi.org/10.3390/app11156875
Huang, Y., Yu, Y., Zhang, C., Wang, X., Yang, Z. Yang, Y., 2023. Investigation of the relationship between surface colour, contact angle and chemical properties of heat-treated bamboo. Wood Material Science & Engineering 18(3): 783–791. https://doi.org/10.1080/17480272.2022.2070029
İşleyen,Ü.K.Karamanoğlu,M.,2019.Theinfluenceofmachiningparametersonsurfaceroughness of MDF in milling operation. BioResources 14(2): 3266–3277. https://doi.org/10.15376/biores.14.2.3266-3277
Kamboj,G.,Gašparík,M.,Gaff,M.,Kačík,F.,Sethy,A.K.,Corleto,R.,Rezaei,F.,Ditommaso,G., Sikora, A., Kaplan, L., Kubš, J., Das, S. Macků J., 2020. Surface quality and cutting power requirement after edge milling of thermally modified meranti (Shorea spp.) wood. Journal of Building Engineering 29: 101213. https://doi.org/10.1016/j.jobe.2020.101213
Kaplan, L., Kvietková, M., Sikora, A. Sedlecký, M., 2018. Evaluation of the effect of individual parameters of oak wood machining and their impact on the values of waviness measured by a laser profilometer. Wood Research 63(1), 127–140. ISSN 2729-8906.
Keržič, E., Lesar, B. Humar, M., 2021. Influence of weathering on surface roughness of thermally modified wood. BioResources 16(3), 4675–4692. https://doi.org/10.15376/biores.16.3.46754692
Korkut, S., Korkut, D. S., Kocaefe, D., Elustondo, D., Bajraktari, A. Çakıcıer, N., 2012. Effect of thermal modification on the properties of narrow-leaved ash and chestnut. Industrial Crops and Products 35(1): 287–294. https://doi.org/10.1016/j.indcrop.2011.07.016
Korčok, M., Koleda, P., Barcík, Š., Očkajová, A. Kučerka, M., 2019. Effect of Technological and Material Parameters on Final Surface Quality of Machining When Milling Thermally Treated Spruce Wood. BioResources 14: 10004–10013. https://doi.org/10.15376/biores.14.4.1000410013
Kučerka, M., Kminiak, R., Krištak, L., Rogozinski, T.,2022. Theinfluence of thermal modification of oak, spruce and meranti blanks on surface roughness during sanding. Innovations in Forest Industry and Engineering Design (INNO 2022). Sofia: Faculty of Forest Industry – University of Forestry, pp. 113–122. ISBN 978-619-7703-01-6.
Landry, V., Blanchet, P. Cormier, L. M., 2013. Water-Based and Solvent-Based Stains: Impact on the Grain Raising in Yellow Birch. BioResources 8(2), 1997–2009. https://doi.org/10.15376/biores.8.2.1997-2009
Musolff, F. C. Malburg, C. M., 2021. The Surface Texture Answer Book. Digital Metrology Solutions, Indianapolis, 423 pp.
Pelit, H., Korkmaz, M. Budakçı, M., 2021. Surface roughness of thermally treated wood cut with different parameters in CNC router machine. BioResources 16(3), 5133–5147. https://doi.org/10.15376/biores.16.3.5133-5147
Ruzova, T.A., Haddadi, B., 2025. Surface roughness and its measurement methods – Analytical review. Results in Surfaces and Interfaces 19: 100441. ISSN 2666-8459. https://doi.org/10.1016/j.rsurfi.2025.100441
Shukla, S. R., 2019. Evaluation of dimensional stability, surface roughness, colour, flexural properties and decay resistance of thermally modified Acacia auriculiformis. Maderas. Ciencia y tecnología 21(4), 433–446. https://doi.org/10.4067/S0718-221X2019005000401
STN EN ISO 21920:2022. Geometrical product specifications (GPS) – Surface texture: Profile method – Terms, definitions and surface texture parameters. Bratislava: Slovak Office of Standards, Metrology and Testing, 2022.
Vančo, M., Mazáň, A., Barcík, Š., Rajko, Ľ.,Koleda, P., Vyhnáliková, Z. Safin, R., 2017. Impact of SelectedTechnological, Technical,andMaterial Factors ontheQuality ofMachined Surface at Face Milling of Thermally Modified Pine Wood. BioResources 12: 5140–5154. https://doi.org/10.15376/biores.12.3.5140-5154
ACKNOWLEDGMENT
This experimental research was prepared within the grant project VEGA 1/0256/23 Research on the sapwood and the false heartwood of Beech wood for the purpose of eliminating the differences in the color of the wood by steaming with saturated water steam, the KEGA 015TU Z4/2025 project Creationofsupporttoolsfor furtherand updatetraining of workersinthe woodworking industryfor theneedsofIndustry4.0,andalsowiththesupportoftheAPVVgrantagencywithintheframework of the APVV 21-0051 project.
AUTHORS' ADDRESSES
Ing. Veronika Šugárová
Ing. Lukáš Adamčík, PhD.
doc. Ing. Richard Kminiak, PhD.
Technical University in Zvolen, Faculty of Wood Sciences and Technology Department of Woodworking
T. G. Masaryka 24, 960 01 Zvolen, Slovakia xsugarova@tuzvo.sk xadamcikl@tuzvo.sk richard.kminiak@tuzvo.sk
ACTA FACULTATIS XYLOLOGIAE ZVOLEN, 68(1): 49 64, 2026
Zvolen, Technická univerzita vo Zvolene
DOI: 10.17423/afx.2026.68.1.05
DYNAMICS OF CHANGESIN THE PHYSICAL AND MECHANICAL PROPERTIES OF SIBERIAN FIR (ABIES SIBIRICA LEDEB.) WOOD IN DEAD STANDS DAMAGED BY THE FOUR-EYED FIR BARK BEETLE (POLYGRAPHUS PROXIMUS BLANDF.)
Sergey Eliseev – Sergey Zhila – Sergey Kazitsin – Vladimir Ermolin – Mikhail
Bayandin Evgeniya Akinina – Tatyana Strekaleva
ABSTRACT
Under changing climate conditions in the Russian Federation, the four-eyed fir bark beetle (Polygraphus proximus Blandf.) is causing widespread mortality of Siberian fir (Abies sibirica Ledeb )stands. Dueto thescaleofmortality and thepatchynatureofdamageto the stands, dead stands remain in a stable state for extended periods. This raises the question of the feasibility of industrial use of deadwood, given the time since stand death. This study examined changes in the physical and mechanical properties of A. sibirica wood across different periods after tree death. The study revealed that in the first 3-5 years after their death, dead trees experience a sharp decrease in the impact strength of wood, while most of the physical and mechanical properties of stem wood remain at levels similar to those of standing trees fordecades. It is caused by thereduced moisturecontent ofdeadwood,which falls below 20%, making it unsuitable for the development of wood-destroying fungi. Intensive wood decay is observed only at the base of the stem. Also, as the time since death increases, dead trees are selected based on their physical and mechanical properties. By 20 yearsofdeath,remainingtreesinthestandhavewooddensityandstrengthvaluesabovethe average for A. sibirica. Based on the data obtained, stem wood from dead trees could be a valuable raw material for a wide range of wood processing industries.
Keywords: Siberian fir (Abies sibirica); four-eyed fir bark beetle (Polygraphus proximus); wood; physical and mechanical properties of the Abies sibirica wood; dead standing tree; deadwood; use of deadwood.
INTRODUCTION
In the context of climate change, natural ecosystems are undergoing radical changes. In large areas of the planet's northern regions, climate change has led to improved forest growth conditions, and the timberline is shifting northwards (Rotbarth et al., 2023). At the same time, in more southern regions, changes in growing conditions and climate imbalance have led to the mass death of ligneous plants resulting from the changes in the hydrological regime(Zhuravlev, 1960;Stocks,1998;Johnstone,2006;Allen et al.,2010;Groisman et al., 2018; Kharuk et al., 2020; Pavlov et al., 2020; Roberts et al., 2020; Voronin et al., 2020; Kozlov et al.,2023),largeforestfires(Сhetverikov,1903;Zhuravlev,1960;Rozhkov,1963; Kharuk et al., 2017; Hansen et al., 2021), widespread outbreaks of pests and forest diseases
(Kondakov, 1963, 1974; Lighthill et al., 1994; Aber et al., 2001; Zalomodchikov, 2009; Shvidenko and Schepaschenko, 2014; Gauthier et al., 2015), invasions of harmful species (Lighthill et al., 1994; Dale et al., 2001; Alexeyev and Svyazeva, 2009; Storozhenko, 2010; Sergienko et al., 2015; Shchurov, 2017; Baranchikov et al., 2021; Demidko et al., 2023)
The Krasnoyarsk Territory holds a leading position in the structure of the total forest area of the Russian Federation and is a key region in shaping the national forest potential Accordingtothestateforestregister(FederalForestryAgency,2025),thetotalareaofforest land in the region exceeds 168.1 million ha, with a total stock of timber of 14.4 billion m3 , which determines the strategic importance of the region for the country’s forest industry complex (Natural Resources of the Krasnoyarsk Region, 2025).
At present, in the Krasnoyarsk Territory, there is a massive dieback of natural stands ofSiberianfir(Abies sibirica Ledeb.)duetotheinfluenceof Polygraphus proximus Blandf, an invasive bark beetle (Krivets et al., 2024). The natural habitat of this species is in the far easternpartofRussia,wheretheclimateismilderandwarmerthaninSiberia.Nevertheless, in the context of global warming, P. proximus has successfully acclimatized to the Siberian region and, in the absence of natural biological barriers, has destroyed fir stands across vast areas (Krivets et al., 2024). An important factor in the successful attack on Siberian fir by P.proximus isacharacteristicfeatureofthisspecies.Siberianfirlackseffectivemechanisms of resistance to the complex of pathogenic ophiostoma fungi spread by this pest, leading to extremely rapid drying of trees affected by bark beetles (Pashenova et al., 2012, 2018; Baranchikov et al., 2014; Voronin et al., 2020). Contemporary predictive models indicate further expansion of the secondary area of P. proximus with the formation of new invasive foci (Soldatov et al., 2019).According to thelatest official dataofmonitoring conductedby theFederal Funded Institution “Russian CenterofForest Health”, thetotal areaoftheforest destroyed by the four-eyed fir bark beetle (P. proximus) in the Krasnoyarsk Territory exceeds 570,000 hectares (Branch of the Federal Budgetary Institution «Russian Forest Protection », 2022).
Since the stands’ mortality is patchy and often occurs in areas with underdeveloped transport infrastructure, it is virtually impossible to cut down dead stands within a short period of time. Therefore, clearing dead trees is a lengthy process, and a significant area occupied by dead trees creates a threat of mass reproduction of secondary pests and catastrophic forest fires.
At the same time, the issue of using and disposing of harvested deadwood poses several problems. Practical experience shows that the stem wood of dead trees rapidly loses its commercial value – already within 2-3 years after death (Belyea, 1952; Basham, 1986; Barrette et al., 2015). Moreover, there is currently virtually no data on changes in the physical and mechanical properties of A. sibirica wood depending on the period of death, which makes it extremely difficult to use deadwood rationally.
Themainreasonforthedeclineinthephysicalandmechanicalpropertiesofdeadwood is the development of rot caused by wood-destroying fungi (Basham, 1984; Barrette et al., 2015). However, the data found in the literature is quite contradictory. Based on these studies, it is unclear why, in some cases, physical and mechanical properties gradually decline with increasing time since death (Larinina et al., 2014). In contrast, in others, they remain virtually unchanged for a long time (Mukhortova et al., 2009). In some cases, the condition of wood depends on which part of the stem it is located in (Basham, 1984).
To solve the problem of predicting the condition of A.sibirica wood depending on the period of death and to develop scientifically robust approaches to the processing of deadwood, it was decided to study the dynamics of changes in the physical and mechanical
properties of deadwood during the mass death of stands caused by the impact of the foureyed fir bark beetle.
MATERIAL AND METHODS
For study purposes, in the first stage of the work, based on data from the Krasnoyarsk Territory Forest Protection Center, dead trees killed by the four-eyed fir bark beetle were selected. When selecting study objects, the period of death (PD) of a tree stand, its composition, age, and bonitet were taken into account.
Forthestudy,maturestandswiththepredominanceofSiberianfir(morethan7units) and the bonitet of at least 3 were selected. From the pre-selected sites, two dead stands that met all requirements were identified during on-site investigations. The selection of the sites was subjective. Siberian fir stands damaged by the four-eyed fir bark beetle were selected, taking into account the possibility of harvesting models with death periods of 5, 10, 15, and 20years,andacontrolwasalsoselected–standingtreesfromareasadjacenttotheoutbreak site.
To determine the condition of forest areas damaged by the invasion of the four-eyed fir bark beetle, a survey of stands was conducted on sample plots using generally accepted taxonomic methods (Zagreev et al., 1992).
Basedontheresultsofthetaxationofthestandsonthesampleplots,themostcommon deadtreesaccordingtotaxationindicatorswereidentified.Basedontheseparameters,model trees were selected from the stands being studied. The selected model trees should not have any visible defects in standing trees, such as frost cracks, dryness, sprouting, cancerous growth, or large splay knots. In addition, if heart rot was detected in the stem during the crosscutting of a felled tree, such models were rejected.
Thus, 100 model trees with the required parameters were selected in each plot. The cause of tree death was also monitored during the selection. A model tree had to have numerous exit holes made by the four-eyed fir bark beetle, which can reach a density of 6070 pieces per decimetre. The beetle's egg-laying tunnels had to be visible under the bark of the damaged trees (Fig. 1 b, c) (Baranchikov et al., 2011, 2014).
Tocross-dateeachsamplearea,100coreswerecutfromdeadmodeltreesand30coresfrom standing Siberian fir trees growing on adjacent forest plots. The selection of cores was carried out with the aid of Presler’s drill at a height of 1.3 meters.
(a)
(b)
(c)
Fig. 1 Stand damaged by the four-eyed fir bark beetle a – general view of the stand; b, c – characteristic tracesof bark beetle damage on fir tree stems.
The processing and analysis of the cores were performed using CooRecorder 9.3.1, while construction and cross-dating were performed using CDendro 9.3.1 (Cybis Elektronik & Data AB, 2025).
For further processing, we retained only those rows whose correlation coefficient with the master chronology, constructed via leave-one-out, was at least 0.4. Tree-ring statistics were calculated using the dplR package (Bunn, 2008). An example of the fragment of the core being processed is shown in Fig. 2.
Then, 10 model trees with the required death periods were selected from the models based on cross-dating results. The selected model trees were felled; and three 1-metre-long sections were cut from each model tree for physical and mechanical testing of wood from the lower part at a height of 1.3 metres, the upper part and the middle part of the full-length log(Fig.3).Inaddition,toobtainamoredetailedpictureofthedistributionofwoodmoisture content along theheight ofthestem, three10 cm thick discs weresawnfrom thebaseofthe stem and the middle sections of the stem between the logs.
Immediately after felling and crosscutting of the model trees in field conditions, the moisture content of the freshly harvested samples was measured using the Logica LG43 electric moisture meter. The measurements were taken on the end surface of the logs, and themoisturecontent ofthewood was determined from the centerto the periphery at 10 mm intervals.
Thelogs,cutfromthemodeltrees,weresawnintotheblanksoftherequiredsize.The samples were then dried in a drying chamber at a temperature of 40-45 °C to a moisture content of 12±2 %. Next, standard-sized samples were made from the dried blanks for physical and mechanical testing of the wood in accordance with the international standards ISO 13061-1:2014, ISO 13061-2:2014, ISO 13061-3:2014, ISO 13061-10:2017, and ISO 13061-17:2017.
(a)
(b)
Fig. 2 Study of radial growth in CooRecorder 9.3.1 (a) and cross-dating graphs (b).
The physical and mechanical properties of the wood were determined using the ABS ASIMETO317-06-0digitalcaliper,CASXE-300laboratoryscales,Bindered115dryingoven, and Testsystems UTS 110MN-30R-5 universal testing machine. The impact bending strength of the wood was determined using a pendulum hammer with a 15 mm radius.
RESULTS AND DISCUSSION
Wood moisture content is one of the key factors that influence not only the properties ofwoodbutalsothepossibilityofrotdevelopmentcausedbywood-destroyingfungi,which is the main reason for a sharp decrease in the physical and mechanical characteristics of wood (Basham, 1984). In accordance with the previously described methodology, measurements of deadwood moisture content under field conditions yielded the following results (Tab. 1, Fig. 4).
In the first 3-5 years after the death of trees, the moisture content of deadwood decreases by almost 37% compared to standing trees, but remains at a fairly high level, exceeding the saturation limit of wood cell walls. Such moisture parameters favor the development of wood-destroying fungi in deadwood (Schwarze et al., 2002).
By 8-10 years after the death of a stand, the moisture content of dead trees decreases by 60% relative to the initial values. It becomes unfavorable for the development of wooddestroyingfungi.Allthestudiedgroupswithaperiodofdeathofover8yearsshowmoisture parameters below the saturation limit of cell walls within the range of 23-27 %.
Fig. 3 Logs sawn from model trees.
Tab. 1 Deadwood moisture content.
During the research, uneven distribution of moisture in the stems of dead trees along their height was noted (Fig. 5).
The highest wood moisture values were predictably observed at the base of the stem, located at a low height from the ground, within 20-30 cm. Compared to standing trees, the highest moisture values were 11% higher in trees that had been dead for 12-14 years. The lowest moisture content values in the group with a period of death of 8-10 years were 18% lowerthanin standing trees. In general, themoisturecontent ofthelowerpart ofthestem in all the groups of dead trees, depending on the period of death, is in the range favorable for the development of wood-destroying fungi, at a level of 38-47 %.
Herewith,ataheightof1.3metersfromthebaseofthestem,themoisturedistribution pattern changes significantly. The moisture content of wood in standing trees increases by 27%, while in dead trees it decreases by 26-49%.
The only exception is the trees with a period of death of 3-5 years. At breast height, thedeadtreesinthisgrouphaveamoisturecontent ofabout50%,whichis17%higherthan at the base of the stem. In general, dead trees have a wood moisture content that is 16-59% lower than that of standing trees.
Ataheightof2.5mfromthebaseofthestem,standingtreescontinuetoshowaslight increase in wood moisture content, approximately 7 % higher than at a height of 1.3 m and 35%higherthanatthebaseofthestem.Bycomparison,indeadtrees, allgroups,regardless of the period of death, continue to experience a decrease in moisture content of 20–38 %. Compared to the base of the stem, the moisture content of deadwood at this height is 13–68 % lower, and when compared to standing trees, it is 44–74 % lower. It should be noted that when the period of death is 8–10 years and 12–14 years, wood at a height of 2.5 m has a moisture content of less than 20%. This moisture content is critically low for wooddestroying fungi, leading to their death (Gavrilov and Stankevich, 2022).
At a height of 5 meters and above, the wood moisture in standing trees remains approximately at the same level, corresponding to the moisture content of fresh wood. Deadwoodwithaperiodofdeathofmorethan8yearsataheightof5metershasamoisture content of less than 20% and is therefore unsuitable for wood-destroying fungi. The most favorablewoodmoisturecontentforxylotrophsisfoundindeadtreeswithaperiodofdeath of3-5years.Ataheightof2.5meters,themoisturecontentremainsapproximatelythesame (30-35%), exceeding the saturation limit of the wood cell walls.
Fig. 4 Deadwood moisture content.
Fig. 5 Change in dry wood moisture content along tree height.
The density and strength of A. sibirica deadwood was studied in the next phase of the research under laboratory conditions (Tab. 2, Fig. 6-10).
Tab. 2 Physical and mechanical properties of deadwood.
Period of death, years
Compressive strength along the grain, MPa
static bending strength, MPa
Density is one of themost important indicators characterizing the technical properties of wood. A reduced wood density is one of the signs of its destruction by wood-destroying fungi (Broda, 2020).
Thestudy ofthechangein wooddensity inthestand that diedduetotheeffects ofthe four-eyed fir bark beetle showed the following (Fig. 6). Over the 14 years since the trees died, wood density has remained virtually unchanged. The density of the test wood and the wood with all the periods of death, except for the group with the period of death of 19-20 years, does not have significant differences. At the same time, in the group with the highest period of death, there is an increase (not a decrease) of the mean wood density by about 10 % compared to the control. The increase in the mean wood density of trees with the highest death rates appears to be due to selection. Up to 20 years from the moment of death, only those trees that have a higher original wood density than the mean density in the stand are kept upright, because it takes more time for fungi to destroy the roots of tree stems with higher density.
The study of changes in density along the stem height in almost all groups, according to the period of death, was insignificant within the limits of experimental error. The model trees showed a small decrease in wood density along the stem height only in the group with a period of death of 12-14 years. The difference between the apex and the base of the stem was about 9%.
Mechanical testing of the selected model trees showed the following results. The impact strength of deadwood already in the first 3-5 years after death has a sharp 40% decrease(Fig.7).Thisindicatesthatthestemwoodofadeadtreeisbeingactivelyexploited by wood-destroying fungi (Troxell et al., 1980). After 5 years from the moment of death, the rate of decline slows, and over the next 5 years, the tree is in a dead state; the impact strengthisreducedbyonly9 %.Onthecontrary,inthegroupswithdeathagesof12-14and 19-20years,theselectedmodelsshowedanincreaseinimpactstrength.Theirvaluesexceed those of the group with a period of death of 8-10 years by 13.8% and 24%, respectively. Nevertheless, in comparison with the control, their performance is 33-39% lower than that of standing trees. Such patterns of change, as already mentioned, seem to be explained by selectivetreefelling,whichismostevidentinthegroupwithaperiodofdeathof8-10years. Accordingly, by 20 years after the moment of death, only the trees with higher density and wood strength remain upright.
Fig. 6 Dependence of wood density on the period of death.
Fig. 7 Dependence of impact bending stress on the period of death.
The study of the change in the impact stress of wood along the height of the stem showed (Fig. 8) that in standing trees, higher impact strength is observed in the lower and upper parts of the stem, while the central part of the stem has an impact strength of 15-18% lower compared to the base and apex. The same pattern of distribution is observed in the modeltreeswithaperiodofdeathof3-5years,despitetheoveralldecreaseinthisindicator. In models with a 8-10-year period of death, there is a reduction in impact strength from the base to the top of the stem. In this case, the difference between the lower and central part of the stem by this period of death is practically leveled (within the limits of experimental error). The upper part of the stem shows an impact strength 14% lower than the central one and 17% less than the lower part of the stem. The increase in the fragility of the upper part of the stem may cause intense flattening of the apices in the dead stand observed for this period of death
In the group with a period of death of 12-14 years, the impact strength in the central part of the stem was approximately 20% lower than in the lower part and 7% lower than in the upper part. In the group with a period of death of 19-20 years, the impact strength in the central part of the stem was almost 8 % higher than in the lower part and 17 % higher than in the upper part.
Fig. 8 Dependence of the change in the impact strength of wood on the period of deathalong tree height.
The study of the compressive strength of dead trees along the grain revealed the following characteristics (Fig. 9). In the range of the period of death from 3 to 14 years, all the model trees had a similar strength index of 36 MPa. All minor deviations in the index observed across the individual groups by period of death were within the limits of experimental error and did not show significant differences.
Fig. 9 Dependence of the compressive strength of dead trees along the grain on the period of death.
The group with the period of death of 19-20 years stood apart from the others. In this group,themodeltreeshadwoodcompressivestrengththatwasalmost15%higherthanthat of the non-biologically damaged control wood. This feature once again confirms the assumption that only trees with above-average physical and mechanical properties remain upright by the age of 19-20.
Studies ofchanges in wood compressivestrength along thegrain andalong theheight of the stem showed that, in most groups of model trees, compressive strength tended to decreasefromthebaseofthestemtothetop.Overall,thechangeinstrengthalongtheheight was insignificant and within the limits of experimental error. The exception among all the variantsstudiedwasthegroupwithaperiodofdeathof8-10years,which showedaslightly greater decrease in strength.
Duringstudiesofthestrengthofdeadwoodunderstaticbending,thefollowingfeatures were identified (Fig. 10). The mean bending strength values for the groups with periods of death of 3-5 years and 12-14 years, and the control samples, did not differ. The model trees from the group with the period of death of 8-10 years had a slightly lower index than the groups under consideration, but the difference was less than 7%. The model trees from the group with a period of death of 19-20 years had a bending strength 10% higher than that of the control group. In general, the results obtained correspond to the previously made assumption about the natural selection of trees with high technical wood properties.
Fig. 10 Dependence of the static bending strength of wood on the period of death.
The study of bending strength in dead trees along the stem height showed that, across almost all model tree groups, depending on the period of death, bending strength decreases from the base to the top. While in the control group the change in strength is only observed as a trend within the limits of experimental error, in the group with theperiod of death of 35yearsthedifferencebetweenthelowerandupperpartsofthestemwasalready7 %;inthe groupwith theperiod of death of8-10 yearsit was 32%; and in thegroup with theperiod of deathof12-14yearsitwasabout15%.Thedistributionofstrengthalongheightdiffersonly in the group with a period of death of 19-20 years. Here, in the central part of the stem, the strength is approximately 7.5 % lower than the lower and upper parts of the tree stem.
Summarizing the results of the studies conducted on the physical and mechanical properties of deadwood, the following preliminary conclusions can be drawn. The destruction of the stem wood of dead trees begins during the period of tree death and continues until the moisture content of the wood decreases to 20% by the time of death, which occurs 8-10 years later. During this period, there is no significant decrease in the density and strength of wood. A significant decrease in mechanical properties is observed only in terms of wood impact strength, which is most sensitive to the activity of wooddestroying fungi. Similar results in terms of impact strength were noted in (Sinclair et al., 1979). A sharp decrease in impact strength in wood indicates that deadwood was affected by wood-destroying fungi, but the development of rot slowed and then stopped as the stem wood dried. The data that we obtained differ significantly from the results of the studies (Jelonek et al., 2020), where a 20-30% decrease in strength was recorded after three years forseveralindicators.Thepaper(Löwe et al.,2022)alsonotesthatthemechanicalproperties of wood decrease by 15-30% after just three years.
Meanwhile, the study (Gonzalez, 1990), as well as our work, does not report a significant decrease in wood density, even for trees with a period of death of 15 years. The preservation of deadwood properties over a long period of time is also reported in the work (Mukhortova et al., 2009). The contradictory data on the dynamics of deadwood decay across studies are apparently due to both the species being studied and the geographic location of the study region.
In our study, the sapwood width in the examined A. sibirica model trees ranged from 10 to 20 mm.
It is practically impossible to produce standard test samples from it, and themain part of the stem consists of mature wood, which has higher biostability. Based on this, it is obvious that the main volume of stem wood will be better preserved in this species than in species with wide sapwood. After all, researchers have noted significant sapwood destruction in dead trees (Basham, 1984). The climatic characteristics of the study region alsocontributesignificantlytothepreservationofdeadwood.Inourcase,ashorthotsummer in the Krasnoyarsk Territory provides a relatively short period with positive average daily temperatures. Under such conditions, wood-destroying fungi can develop for no more than 3-4 months a year. At the same time, high summer temperatures quickly dry out the main stem volume and make it unsuitable for xylophages to inhabit. And the third factor, which we believe also has a significant impact on the preservation of deadwood, is the reasons for tree death. For example, if a tree is damaged by needle-eating and leaf-eating insects, transpiration stops, the bark on the stem remains undamaged, and the stem wood retains a fairly high moisture content for alongerperiod of time. In the case oftreedeath due to bark beetles (as in our work), the tree crown does not die immediately; it continues to lose moistureforsometimeafterthelowerpartofthetreehasdied.Thisdriesoutthestemwood. In addition, due to insect damage to the bark layer, the stem loses its bark more quickly, accelerating the drying of the wood.
CONCLUSION
1) In the A. sibirica stands that died as a result of damage by P. proximus, selective selection of dead trees based on the physical and mechanical properties of the wood is observed as the time since death increases. Dead trees with indicators of wood density and strength above average values characteristic of Siberian fir remain in the forest stand. Meanwhile, trees with low and average physical and mechanical indicators fall out.
2)Themoisturecontent ofdeadwooddecreasestobelow20%eightyearsafterdeath, makingitunsuitableforthegrowthofwood-destroyingfungi.Atthesametime,themoisture contentinthewoodatthebaseofthestemremainshigh.Thiscontributestothedevelopment ofrotandthesubsequentfallingoutofdeadtreesduetothebiodegradationofthestembase.
3) In the first 3-5 years after the death of a tree stand, dead trees experience a sharp decrease in the impact strength of their wood. This makes deadwood more brittle than the wood of standing trees. Therefore, such wood should be used with caution in load-bearing structures.
4) Most of the physical and mechanical properties of stem wood in a deadwood stand remainatthesamelevelasinstandingtrees,withtheintensivedecayofwoodobservedonly atthebaseofthestem.Asaresult,thestemwoodofdeadtreescanbeavaluablerawmaterial for several wood-processing industries.
5) When predicting changes in the properties of deadwood over time, it is very importanttotakeintoaccountseveralkeyfactors,suchastheregionofgrowth,treespecies, and causes of tree death.
REFERENCES
Aber, J., Neilson, R.P., McNulty, S., Lenihan, J.M., Bachelet, D., Drapek, R.J., 2001. Forest processes and global environmental change: The effects of individual and multiple stressors on
forests. Bioscience Journal 51, 735–751. https://doi.org/10.1641/00063568(2001)051[0735:fpagec]2.0.co;2
Alexeyev, V.A., Svyazeva, O.A., 2009. Woody Plants of Russian Forests. A List of Species and the State Account of Biodiversity of Forest Resources; SB RAS, Sukachev Institute of Forest: Krasnoyarsk, Russia.
Allen, C.D., Macalady, A.K., Chenchouni, H., Bachelet, D., McDowell, N.,Vennetier, M, Kitzberger, T, Rigling, A, Breshears, D.D., Hogg, E.H., Gonzalez, P., Fensham, R., Zhang, Z., Castro, J., Demidova, N., Lim, J.H., Allard, G., Running, S.W., Semerci, A., Cobb, N., 2010. A global overviewof drought and heat-induced tree mortality reveals emerging climate change risks for forests. Forest Ecology and Management 259, 660–684. https://doi.org/10.1016/j.foreco.2009.09.001
Baranchikov, Y.N., Petko, V.M., Astapenko, S.A., Akulov, E.N., Krivets, S.A., 2011. Polygraphus proximus - a new aggressive invasive pest of firs in Siberia. Forestry bulletin 4, 78–81.
Baranchikov,Yu.N.,Demidko,D.A.,Laptev,A.V.,Petko,V.M.,2014.DynamicsofSiberianfirtree mortality in the Ussuri polygraph centre. Forestry bulletin 18, 132–138.
Baranchikov, Yu.N., 2021. Interaction of science and practice in the protection of taiga forests of KrasnoyarskKrai:theoutbreakoftheSiberianmothinthelate1960s.SiberianJournalofForest Science 5, 92–100. https://doi.org/10.15372/sjfs20210510
Barrette, J., Thiffault, E., Saint-Pierre, F., Wetzel, S., Duchesne, I., Krigstin, S., 2015 Dynamics of dead tree degradation and shelf-life following natural disturbances: can salvaged trees from boreal forests ‘fuel’ the forestry and bioenergy sectors? Forestry 88, 275–290. https://doi.org/10.1093/forestry/cpv007
Belyea,R.M.,1952.DeathanddeteriorationofBalsamFirweakenedbySprucebudwormdefoliation in Ontario. Journal of Forestry 1, 729–738. Basham,J.T.,1984.Degradationandlossofwoodfibreinsprucebudworm-killedtimber,andeffects on utilization. Forestry Chronicle 60, 10–14.
Basham, J.T., 1986. Biological factors influencing stem deterioration rates and salvage planning in balsam fir killed after defoliation by spruce budworm. Canadian Journal of Forest Research 16(6), 1217–1229. https://doi.org/10.1139/x86-217
BranchoftheFederalBudgetaryInstitution"RussianForestProtectionCentre""KrasnoyarskRegion Forest Protection Centre", 2022. The Ussuri polygraph continues to spread in the Krasnoyarsk Region [WWW Document]. URL https://krasnoyarsk.rcfh.ru/presscenter/novosti/poligrafussuriyskiy-prodolzhaet-rasprostranenie-v-krasnoyarskom-krae/ Broda,M.,2020.NaturalCompoundsforWoodProtectionagainstFungi -AReview.Molecules25, 3538. https://doi.org/10.3390/molecules25153538
Bunn,A.A.,2008.DendrochronologyprogramlibraryinR(dplR).Dendrochronologia26,115–124. https://doi.org/doi:10.1016/j.dendro.2008.01.002
Сhetverikov, S.S., 1903. Dendrolimus laricis Tschtv,sp. n.,einneuerschadlicher Spinner Ruslands. International Journal in Entomology 23, 89–90.
Cybis Elektronik & Data AB., 2025. Technical writing, software development, photography and dendrochronology software [WWW Document]. URLhttps://www.cybis.se/
Dale, V.H., Linda, A.J., McNulty, S., Neilson, R.P., Ayres, M.P., Flannigan, M.D., Hanson, P.J., Irland, L.C., Lugo, A.E., Peterson, C.J., Simberloff, D., Swanson, F.J., Stocks, B.J., Wotton, B.M., 2001. Climate Change and Forest Disturbances. Bioscience Journal 51, 723–734. https://doi.org/10.1641/0006-3568(2001)051[0723:ccafd]2.0.co;2
Demidko,D.A.,Goroshko,A.A.,Slinkina,O.A.,Mikhaylov,P.V.,Sultson,S.M.,2023.TheRoleof Forest Stands Characteristics on Formation of Exterior Migratory Outbreak Spots by the Siberian Silk Moth Dendrolimus sibiricus (Tschetv.) during Population Collapse. Forests 14, 1078. https://doi.org/10.3390/f14061078
Federal Forestry Agency, 2025. State Forest Register [WWW Document]. URL https://rosleshoz.gov.ru/activity/forest-register/
Gauthier, S., Bernier, P., Kuuluvainen, T., Shvidenko, A., Schepaschenko, D., 2015. Boreal forest health and global change. Science 349, 819–822. https://doi.org/10.1126/science.aaa9092
Gavrilov, T.A., Stankevich, T.B., 2022. The influence of natural and climatic factors on the wood biodestruction process. Journal of Agriculture and Environment 5, 1–6. https://doi.org/10.23649/jae.2022.5.25.01
Gonzalez, J.S., 1990. Wood Density of Canadian Tree Species, in Information Report NOR-X-315, Edmonton, Alberta: Forestry Canada, Northwest Region, Northern Forestry Centre. Groisman,P.,Bulygina,O.,Henebry,G.,Speranskaya,N.,Shiklomanov,A.,Chen,Y.,Tchebakova, N., Parfenova, E., Tilinina, N., Zolina, O., 2018. Dryland belt of Northern Eurasia: Contemporaryenvironmentalchangesandtheirconsequences.EnvironmentalResearchLetters 13, 115008. https://doi.org/10.1088/1748-9326/aae43c
Hansen, A.J., Neilson, R.P., Dale, V.H., Flather, C.H., Iverson, L.R., Currie, D.J., Shafer, S., Cook, R., Bartlein, P.J., 2001. Global change in forests: Responses of species, communities, and biomes. Bioscience Journal 51, 765–779. https://doi.org/10.1641/00063568(2001)051[0765:GCIFRO]2.0.CO;2
ISO13061-1:2014-Physicalandmechanicalpropertiesofwood-Testmethodsforsmallclearwood specimens - Part 1: Determination of moisture content for physical and mechanical tests.
ISO13061-2:2014-Physicalandmechanicalpropertiesofwood-Testmethodsforsmallclearwood specimens -Part 2: Determination of density for physical and mechanical tests.
ISO13061-3:2014-Physicalandmechanicalpropertiesofwood-Testmethodsforsmallclearwood specimens - Part 3: Determination of ultimate strength in static bending.
ISO 13061-10:2017 - Physical and mechanical properties of wood - Test methods for small clear wood specimens - Part 10: Determination of impact bending strength.
ISO 13061-17:2017 - Physical and mechanical properties of wood - Test methods for small clear wood specimens - Part 17: Determination of ultimate stress in compression parallel to grain.
Jelonek, T., Klimek, K., Kopaczyk, J., Wieruszewski, M., Arasimowicz-Jelonek, M., Tomczak, A., Grzywiński,W.,2020.InfluenceoftheTreeDecayDurationonMechanicalStabilityofNorway Spruce Wood (Picea abies (L.) Karst.). Forests 11, 980. https://doi.org/10.3390/f11090980
Johnstone,J.F.,2006.ChapinF.S.FireIntervalEffectsonSuccessionalTrajectoryinBorealForests of Northwest Canada. Ecosystems 9, 268–277. https://doi.org/10.1007/s10021-005-0061-2
Kharuk, V.I., Im, S.T., Ranson, K.J., Yagunov, M.N., 2017. Climate-Induced Northerly Expansion of Siberian Silkmoth Range. Forests 8, 301. https://doi.org/10.3390/f8080301
Kharuk, V.I., Im, S.T., Petrov, I.A., Dvinskaya, M.L., Shushpanov A.S., Golyukov A.S., 2020. Climate-driven conifer mortality in Siberia. Global Ecology and Biogeography 30, 543–556. https://doi.org/10.1111/geb.13243
Kondakov,Yu.P.,1963.ProtectionofForestPlantationsfromPestsandDiseases.Moscow,pp.81–84.
Kondakov, Yu. P., 1974. Ecology of populations of forest animals in Siberia. Novosibirsk: Nauka, pp. 206–265.
Kozlov,N.V.,Vais,A.A.,Varaksin,G.S.,Anuev,Y.A.,Kalachev,V.A.,2023.Anevaluationofdry wood in pine stands in the taiga and forest-steppe region of central Siberia. International Research Journal 5, 1–8. https://doi.org/10.23670/IRJ.2023.131.66
Krivets, S.A., Kerchev, I.A., Bisirova, E.M., Volkova, E.S., Astapenko, S.A., Efremenko, A.A., Kosilov, A.Yu., Kudryavtsev, P.P., Kuznetsova, Y.P., Ponomarev, V.I., Potapkin, A.B., Taraskin, E.G., Titova, V.V., Shilonosov, A.O., Baranchikov, Yu.N., 2024. Overeview of the current secondary range of the four-eyed fir bark beetle (Polygraphus proximus Blandford) in the Russian Federation. Russian Journal of Biological Invasions 15, 180–197. https://doi.org/10.1134/s2075111724700061
Larinina, Y.A, Blintsov, A.I., Khvasko A.V., Yermokhin M.V., 2014. Changes in mechanical properties of wood of dying and dead trees of Norway spruce. Proceedings of BSTU, Forestry 1, 221–224.
Lighthill,J.,Holland,G.,Gray,W.,Landsea,C.,Craig,G.,Evans,J.,Kurihara,Y.,Guard,C.,1994. Global climate change and tropical cyclones. Bulletin of the American Meteorological Society 75, 2147–2157.
Löwe,R.,Sedlecky,M.,Sikora,A.,Prokupkova,A.,Modlinger,R.,Novotny,K.,Turcani,M.,2022. HowBarkBeetleAttackChangestheTensileandCompressiveStrengthofSpruceWood(Picea abies (L.) H. Karst.). Forests 13, 87. https://doi.org/10.3390/f13010087
Mukhortova, L.V., Kirdyanov, A.V., Myglan, V.S., Guggenberger, G., 2009. Wood transformation in dead-standing trees in the forest-tundra of Central Siberia. Biology bulletin 36, 58–65. https://doi.org/10.1134/S1062359009010099
NaturalResourcesoftheKrasnoyarskRegion,2025.ForestsandForestry[WWWDocument].URL http://nature.krasn.ru/node/3
Overview of the sanitary and forest pathology conditions in the forests of the Russian Federation in 2016 and forecast of the forest pathology situation for 2017., 2016. Russian Forest Protection Centre. Branch of Roslesozashchita, Moscow.
Pashenova,N.V.,Pet'ko,V.M.,Kerchev,I.A.,Babichev,N.S.,2012.Transferofophiostomoidfungi by Polygraphus proximus blandf. (Coleoptera, Scolytidae) in Siberia. Bulletin of the Saint Petersburg Forest Engineering Academy 200, 114–120.
Pashenova, N.V., Kononov, A.V., Ustyantsev, K.V., Blinov, A.G., Pertsovaya, A.A., Baranchikov, Yu.N., 2018. Ophiostomatoid Fungi Associated with the Four-Eyed Fir Bark Beetle on the Territory of Russia. Russian Journal of Biological Invasions 9, 63–74. https://doi.org/10.1134/s2075111718010137
Pavlov, I., Litovka Y., Golubev, D., Astapenko, S., Chromogin, P., Usoltseva, Y., Makolova, P., Petrenko, S., 2020. Mass reproduction of Polygraphus proximus Blandford in fir forests of Siberia infected with root and stem pathogens: monitoring, patterns, biological control. Contemporary Problems of Ecology 13, 71–84. https://doi.org/10.1134/s1995425520010060
Roberts, M., Gilligan, C.A., Kleczkowski, A., Hanley, N., Whalley, A.E., Healey, J.R., 2020. The effect of forest management options on forest resilience to pathogens. Frontiers in Forests and Global Change 3, 1–21. https://doi.org/10.3389/ffgc.2020.00007
Rotbarth, R., Van Nes, E.H., Scheffer, M., 2023. Northern expansion is not compensating for southern declines in North American boreal forests. Nature Communications 14, 3373. https://doi.org/10.1038/s41467-023-39092-2
Rozhkov,A.S.,1963. Siberiansilkworm.Moscow:Publishing houseofthe Academy of Sciences of the USSR.
Schwarze, F.W.M.R., Engels, J., Mattheck, C., 2002. Fungal strategies of wood decay in trees. Mycopathologia 154, 155–156. https://doi.org/10.1023/A:1016087425684
Sergienko, V.G., Ivanov, A.M., Vlasov, R.V., Antonov, O.I., 2015. Dead wood and biodiversity in plots of selective cuttings in Leningrad region. Proceedings of the St. Petersburg Research Institute of Forestry 3, 1–19.
Shchurov V.I., 2017. Overview of the sanitary and forest pathology conditions in the forests of the Russian Federation in 2016 and forecast of the forest pathology situation for 2017. Russian Forest Protection Centre. Branch of Roslesozashchita, Moscow.
Shvidenko, A.Z., Schepaschenko D.G., 2014. Carbon budget of Russian forests. Siberian Journal of Forest Science 1, 69–92.
Sinclair, S.A., McLain, T.A., Ifju, G., 1979. Strength loss in small clear specimens of beetle-killed southern pine. Forest Products Journal 29, 35–39.
Soldatov,V.V., Golubev,D.V., Ostroshinskaya,E.M.,Gninenko, Y.I., 2019. Polygraphus proximus in the Krasnoyarsk territory. Invasive dendrophilous organisms: challenges and protection operations. Pushkino: VNIILM, pp. 104–109.
Stocks, B.J., 1998. Climate change and forest fire potential in Russian and Canadian boreal forests. Climatic Change 38, 1–13.
Storozhenko, V.G., 2010. Wood decay in the structures of a forest biogeocenosis. Conifers of the boreal area 27, 279–283.
Troxell, H.E., Tang, J.L., Sampson, G.R., Worth, H.E., 1980. Suitability of beetle-killed pine in Colorado’s front range for wood and fiber products. Rocky Mountain Forest and Range Experiment Station. USDA Forest Service. Fort Collins, CO. Resource Bulletin RM-2.
Voronin,V.I.,Sofronov,A.P.,Morozova,T.I.,Oskolkov,V.A.,Sukhovol’skii,V.G.,Kovalev,A.V., 2020. Natural risks of vulnerability of dark coniferous taiga of the Southern Baikal region
(Khamar-Daban ridge). Modern problems of forest protection and ways of their solution: Proc. of the II Int. scientific and practical. conf, Minsk: BSTU, pp. 73–77.
Zagreev, V.V., Sukhikh, V.I., Shvidenko, A.Z., Gusev, N.N., Moshkalev, A.G., 1992. All-Union standards for forest taxation. Kolos Publishing House, Moscow. Zalomodchikov, D.G., 2009. Assessment of the carbon pool of large wood residues in Russian forests,takingintoaccounttheinfluenceoffiresandlogging.RussianJournalofForestScience 4, 3–15.
Zhuravlev, G.P.,1960. Recommendations for monitoring the Siberian silkworm in the forests of the Far East, Khabarovsk: Far Eastern Scientific Research Institute of Forestry.
ACKNOWLEDGMENT
Thework was performed aspart ofthestateassignmentof the Ministry of Education and Science of Russia for the implementation of the project ,,Studying the patterns of biodegradation of wood from dead stands in order to develop scientifically robust approaches for obtaining new functional materials,, by the team of the Biorefining of Forest Resources research laboratory (theme № FEFE2024-0032).
AUTHORS’ ADDRESSES
Sergey Eliseev
Sergey Zhila
Sergey Kazitsin
Vladimir Ermolin
Mikhail Bayandin
Evgeniya Akinina
Tatyana Strekaleva
Reshetnev Siberian State University of Science and Technology 31 Krasnoyarsky Rabochy Av Krasnoyarsk 660037 Russian Federation
s-555s@yandex.ru getgain@mail.ru sergeikaz060890@yandex.ru vnermolin@yandex.ru mihailbayandin@yandex.ru eugeniya.mitina@yandex.ru strekaleva@mail.ru
ACTA FACULTATIS XYLOLOGIAE ZVOLEN, 68(1): 65 78, 2026
Zvolen, Technická univerzita vo Zvolene
DOI: 10.17423/afx.2026.68.1.06
THE EFFECT OF INTERIOR AIR- AND VAPOR-CONTROL LAYERS ON ENVELOPE AIRTIGHTNESSIN LOW-ENERGY TIMBER-FRAME HOUSES
Jiří Brich – Antonín Novotný – Petr Farář – Josef Šindelář – Jitka Beránková
ABSTRACT
Theeffectofinteriorair-andvapor-controllayersonenvelopeairleakageusingalargefield dataset of 450 low-energy timber houses in the Czech Republic is examined in the study. Two sealing concepts were evaluated: vapor-tight polyethylene or aluminum foils, and vapor-retarding board materials such as oriented strand boards and coated gypsum fibre boards. Airtightness was measured using the blower-door method according to ISO 9972 under both pressurization and depressurization. Houses with foil-based barriers reached a mean ACH50 of 1.09 h⁻¹, while houses sealed with board materials achieved values approximately 30% lower. Differences between pressurization and depressurization were primarily related to pressure-sensitive leakage paths in window and door assemblies and in non-adhered areas of foil membranes. Board-based systems exhibitedmore localized defect patterns, reducing their overall impact on ACH50 at the building scale. The findings highlight the decisive role of construction details and indicate that airtightness performance is more strongly influenced by system continuity and robustness than by nominal material properties.
Keywords: envelope airtightness; blower-door test; air- and vapor-control layer; timberframe buildings; construction details.
INTRODUCTION
Sustainable and energy-efficient housing has become a major focus of residential construction in recent decades. Timber, as a renewable material with a comparatively low environmental footprint, plays an increasingly important role in this context and is widely used in light-frame and prefabricated building systems. While some countries already make extensive use of timber for residential construction, others continue to rely predominantly on mineral-based technologies (Vinha et al., 2015; Linkevičius et al., 2023; Sikkema et al., 2023)
Recent international analyses highlight that the share of timber-frame houses is steadily increasing, driven by the need to reduce operational energy demand and embodied carbon, as well as by evolving consumer preferences for environmentally responsible housing (Gustavsson and Sathre, 2011; Hurmekoski et al., 2015; Ramage et al., 2017; Loučanová and Olšiaková, 2020; Sikkema et al., 2023).
In the Czech Republic, the share of timber buildings in new residential construction has historically been low, yet recent years have witnessed a substantial increase. According
totheCzechStatisticalOffice,timberhouseshaveaccountedforapproximately15%ofall newly built family houses in recent years. In 2023, a total of 2,595 timber-frame family houses were completed (CZSO, 2025). This development aligns with broader European trends, where timber-frame and prefabricated wood-based systems have gained prominence due to their low environmental footprint, rapid on-site assembly and favourable energy performance. Recent European reviews and market analyses report a consistent rise in the adoptionoftimberconstructionacrossvariouscountries,drivenbysustainabilitytargetsand technological progress in light-frame and panelised timber systems (Sikkema et al , 2023) Within the Czech market specifically, low-energy light-frame timber houses form the dominantsegmentofthetimberhousingsector,andsimilarpatternsinconstructionpractice and airtightness performance have been documented in previous national studies (Böhm et al., 2021).
Airtightness is a key performance parameter for low-energy timber-frame houses becauseuncontrolledairinfiltrationincreasesheatingdemand,decreasesthermalefficiency, and reduces the effectiveness of mechanical ventilation with heat recovery. In lightweight timber-frame assemblies, the effectiveness of the interior air- and vapor-control layer is particularly critical because the wall structure contains hygroscopic materials and thermal insulation that are highly sensitive to moisture accumulation. Although multiple construction-relatedfactorsinfluencetheoverallairtightnessofabuildingenvelope(Srba et al., 2016; Kalamees et al., 2017; Böhm et al., 2021), the type and execution of the interior air-andvapor-controllayerplayacentralrole.Acontinuousandwell-installedbarrierlimits convective moisture transfer into the wall assembly, thereby reducing the risk of interstitial condensation and subsequent degradation of insulation or timber components. Moisturetransport studies have shown that even relatively small leakage paths can significantly increase vapor movement and lead to hidden condensation within wood-based envelopes (Shrestha et al.,2019;Pobucká et al.,2025).Similarfindingswerereportedinhygrothermal simulations of wood-frame walls, where local leakages increased moisture accumulation under winter boundary conditions (Wang and Ge, 2017).
Moisture that condenses within the building envelope can be absorbed by fibrous thermal insulation, resulting in a substantial reduction of its thermal resistance, particularly during winter conditions. Even relatively small increases in moisture content may significantly increase the thermal conductivity (λ-value) of insulation materials, thereby reducing the overall energy performance of the wall assembly (Viitanen et al., 2010). Persistent moisture also creates an environment favorable for mould growth and wooddecaying fungi, both of which can compromise indoor air quality and accelerate the deterioration of load-bearing timber elements. Beyond microbial degradation, severe longterm moisture exposure has been shown to reduce structural capacity and may ultimately lead to premature structural failure (Viitanen et al., 2010; Mjörnell and Olsson, 2019; Loukou et al., 2024). These risks underscore the need for a continuous, well-executed interiorair-andvapor-controllayer,whichisessentialnotonlyformaintainingthedurability of timber structures but also for preventing interstitial condensation, as assessed using standard hygrothermal criteria such as EN ISO 13788 (ISO, 2012).
Interior air- and vapor-control layers in timber-frame constructions are most commonly implemented as either vapor-tight membranes (polyethylene or aluminum foil) orvapor-permeableboardmaterials,suchasorientedstrandboard(OSB)andcoatedgypsum fiber boards. Foil-based systems typically offer very high diffusion resistance and can achieve excellent airtightness when installed without discontinuities; however, their performance depends heavily on the quality of taping, adhesion, and mechanical protection during construction. In contrast, board materials act as rigid, airtight layers that are less
susceptible to local mechanical damage and facilitate easier visual inspection of joints. Previous studies have shown that both material type and installation quality strongly influence the resulting air-leakage characteristics and long-term durability of the envelope (Hodoušek et al., 2015, 2019b; Hallik et al., 2023).
Ensuring effective air exchange in low-energy timber houses requires that ventilation occurs predominantly through controlled pathways, such as windows, supply inlets, or mechanical ventilation with heat recovery, rather than through uncontrolled leakage in the buildingenvelope.Uncontrolledinfiltrationnotonlyreducestheeffectivenessofventilation systems but also increases the overall energy demand of residential buildings, as demonstrated in Mediterranean climates (Feijó-Muñoz et al., 2019b). Because even wellperforming air- and vapor-control layer materials cannot compensate for poorly executed junctions or service penetrations, achieving the required airtightness level depends not only on the performance of the primary air- and vapor-control layer, but also on the execution of a wide range of construction details. This is consistent with findings showing that detailed configuration can influence the thermal and overall envelope performance in lightweight timber systems (Brzyski et al., 2022).
These details include junctions between wall and ceiling elements, window and door installations, service penetrations, and panel-to-panel connections in prefabricated assemblies, where inadequate protection or execution can also lead to moisture-related failures in timber components (Kalamees et al., 2025). Previous studies have further demonstrated that poorly executed penetrations or junctions often form dominant leakage paths, sometimes contributing more to overall air leakage than the airtightness of the main barrier itself (Srba et al., 2016; Kysela et al., 2023). As a result, high-quality detailing and careful workmanship are essential prerequisites for durable, reliable airtightness in lightweight timber constructions.
Theprimaryaimofthisstudyistoquantifytheinfluenceoftwocommonlyusedtypes of interior air- and vapor-control layers, vapor-tight foil membranes and vapor-permeable boardmaterials, on the envelopeair leakageofnewly built low-energy timberframehouses intheCzechRepublic.Althoughbothsystemsarewidelyappliedinpractice,thereislimited published evidence comparing their in-situ airtightness performance across large building samples. Existing studies have typically focused either on laboratory testing, on small datasets, or on specific construction details (Hodoušek et al., 2015), leaving a knowledge gap regarding how different barrier types perform under real construction and installation conditions.
This study addresses this gap by analyzing blower-door test results from 450 completed timber-frame houses built in the Czech Republic. In addition to comparing overall air-leakage rates for the two barrier types, the study evaluates differences between pressurization and depressurization measurements. It identifies characteristic leakage paths associated with each system. These results contribute to a more detailed understanding of how barrier type and installation conditions influence airtightness performance in timber buildings and provide technically grounded findings relevant for improving detailing and construction practice.
MATERIALS AND METHODS
Characteristics of the Studied Buildings and Airtightness Systems:
Airtightness measurements from 450 low-energy, light timber-frame houses intended for family living is analysed in the study. The typical layout included one living room with a
kitchenette, three bedrooms, and standard auxiliary rooms. Approximately half of the houses were two-story, while the other half were single-story. All studied houses were located in the Czech Republic, where the mean annual air temperature is 7.9 °C according to the national climatological normal (CHMI, 2025).
All buildings were tested according to Method 2 (formerly Method B) defined in EN ISO 9972. Measurements were performed during the construction phase after completion of the primary airtight layer and installation of windows and doors, but before covering the airtight layer with insulation and gypsum board linings that typically form a service cavity.
Testingatthisstageallowsdirectidentificationofleakagepathswhiletheairtightlayer remains accessible. Only buildings measured at this construction stage were included in the dataset.Buildingstestedaftercompletion(Method1,formerlyMethodA)wereintentionally excludedbecauseofdifferencesinpreparationconditionsbeforemeasurement,whichwould prevent a reliable comparison of airtightness performance between barrier types. Two types of airtight and vapor-tight layers were represented among the measured houses:
1) Foil-based airtight layer
The first group consisted of houses equipped with polyethylene foil (or its alternative withareinforcinggrid,oraluminumfoil).Onlyfoilswithawatervapordiffusion-equivalent air layer thickness (Sd) greater than 1 500 m, determined according to EN ISO 12572 (ISO, 2016), were used. These foils are also classified as vapor-impermeable according to ASTM E96 (permeability ≤ 0.05 US perm) (ASTM, 2016)
2) Board-based airtight layer
The second group included houses where board materials served as the main sealing element, most commonly oriented strand board (OSB) or the gypsum fiber board Fermacell Vapor.Thisboardtypeincorporatesapaper-faced hydrophobicmoisturebarrier.According to EN ISO 12572, the Sd values for Fermacell Vapor are 3.1 m and 4.5 m for board thicknesses of10 mm and 18 mm. TheSd valueofOSB ranges from 2 to 9 m depending on theboardtype(permeability ≤1 USperm according to ASTME96). Plywood is notused as an air and vapor barrier layer in the Czech Republic.
Airtightness Measurement Procedure:
Air leakage of the building envelope at a pressure difference of 50 Pa was measured using the Blowtest 3000 device (LTM GmbH, Germany) and the TEC Minneapolis Blower Door System equipped with the DG-1000 pressure and flow gauge and TECTITE Express software (The Energy Conservatory, Minneapolis, MN, USA). All measurements were performed using the same standardized procedure, by the same trained personnel, and with calibrated and accredited equipment, ensuring methodological consistency across all 450 houses.
The measurements followed ISO 9972 Thermal performance of buildings –Determinationofairpermeabilityofbuildings–Fanpressurizationmethod(ISO,2015).All houses were evaluated according to Method 2 of this standard, meaning that the airtight layer,allconstructiondetails,andallbuilt-incomponents(windows,doors)werecompleted. Ventilation openings and other penetrations (chimney, drainpipe, water and cable routing) were temporarily sealed. Both pressurization and depressurization tests were carried out in accordance with the standard. All measurements were performed under meteorological conditions compliant with ISO 9972, avoiding high wind speeds and excessive indoor–outdoor temperature differences that could influence pressure stabilization
The test principle consists of measuring the airflow through the building envelope at different pressure-difference levels, which are artificially induced by a continuously controlled fan in both pressurization and depressurization modes. During the test, the fan is
typically installed in the main entrance door using a telescopic frame and an airtight membrane (see Figure 1). The air change rate at a pressure difference of 50 Pa is calculated using Equation (1) and serves as the reference parameter of the measurement.
ACH50 istheairchangerateat50Pa(h⁻¹), V50 istheairleakagerateat50Pa(m³·h⁻¹), V is the internal building volume (m³).
Figure 1. Blower-door test: Example of the measuring device installed in the door frame.
Basic data processing was performed in Microsoft Excel (Microsoft Corp., USA), while statistical analyses were performed in Statistica 13.3 Academic (TIBCO, USA). In addition to standard descriptive indicators, the dataset was further evaluated using correlationanalysistoexaminetherelationshipbetweenpressurizationanddepressurization measurements
RESULTS AND DISCUSSION
Overall Airtightness of Foil-Based and Board-Based Systems: ACH50 values were successfully determined for all 450 tested houses. The basic characteristics of the dataset, including mean, range and standard deviation for both airtightness systems, are summarized in Table 1. The lower number of board-based houses reflects theirlowerprevalencein current construction practicewithin themonitored dataset.
Tab. 1 Basic characteristics of the tested houses and ACH50 values.
The measured ACH50 values indicate that both systems achieved airtightness levels typical for modern lightweight timber construction, with results comparable to those reported for timber-frame houses in Finland and Estonia (Kalamees, 2007; Vinha et al., 2015; Hallik and Kalamees, 2019), while studies from Southern Europe generally report higher values (Almeida et al., 2017; Feijó-Muñoz et al., 2019a).
In this context, foil-based houses exhibitedawider distribution and highervariability, whereas board-based systems showed consistently lower and more tightly clustered results. GiventhecleardifferenceinthemeanACH50valuesbetweenthetwogroups,theinfluence oftheairtightnesssystemitself(foil-basedversusboard-based)wasexaminedinmoredetail. A graphical comparison of the two systems is presented in Figure 2.
Fig. 2 Air permeability (ACH50) of houses with foil-based and board-based airtightness systems. Error bars represent 95% confidence intervals calculated as mean ± 1.96 standard errors.
The comparison shows that houses with board-based airtight and vapor-tight systems achieved substantially lower ACH50 values than those with foil-based systems. Several factors may contribute to this difference. From a construction perspective, board materials are easier to install and allow more critical junctions to be sealed more reliably than foil. In addition, foil is more susceptible to mechanical damage during installation, increasing the likelihood of leakage.
The airtightness of foil-based systems is affected by several material and application parameters. These include foil thickness, which influences durability, as well as differences in manufacturing quality and adhesive tape performance. The effectiveness of these tapes depends on application temperature, substrate cleanliness, the pressure applied during installation, and the time required for adhesive curing. In practice, insufficient adhesion in any of these aspects often leads to discontinuities that significantly increase air leakage.
For board-based airtight layers, performance is primarily influenced by the board manufacturer,boardthickness,andboardtype.InthecaseofFermacellVapor,thelaminated vapor-tight layer must remain undamaged to function effectively. For OSB, a minimum thickness of 15 mm for OSB/4 or the use of coated OSB/3 is recommended to achieve adequateairtightness(Hodoušek et al.,2015,2019a).Boardmaterialsalsobenefitfromtheir rigidity, which reduces the likelihood of deformation or detachment during installation.
These material and installation aspects form the basis for the differences observed between the two airtightness systems. They are further reflected in their behavior during pressurization and depressurization, as described in the following section.
Although foil membranes exhibit substantially higher vapor diffusion resistance (Sd > 1 500 m) than board materials (typically 2–9 m), this intrinsic material property did not translateinto lowerACH50 values at thebuilding scale.Theresults indicatethat overall envelope airtightness was more strongly influenced by the continuity and robustness of the airtight system, including its sensitivity to workmanship-related defects and pressureinduced deformation, than by nominal material diffusion resistance alone.
Pressurization and Depressurization Behavior: ACH50 values were determined for both pressurization and depressurization, and the final reported value represents the average of these two measurements. As expected, the results obtained under positive and negative pressure differed. In most of the tested houses, higher values were recorded during depressurization. Specifically, depressurization resulted in higherACH50valuesin78.9%offoil-basedsystemsandin87.1%ofboard-basedsystems.
The observed difference between pressurization and depressurization is primarily related to the behavior of specific leakage paths. In foil-based systems, non-bonded or damaged sections of the membrane may temporarily separate under negative pressure, thereby increasing the effective leakage area. During pressurization, these locations tend to be pressed against the surrounding insulation or adjacent structural layers, reducing the resulting airflow through the leakage. This pressure-dependent response reflects the deformability of flexible membranes, which can alternately amplify or partially suppress airflow depending on the direction of the load.
The relationship between ACH50 values measured during pressurization and depressurization is shown in Figure 3
Fig. 3 Relationship between ACH50 values measured during pressurization and depressurization for foil-based and board-based airtightness systems.
Figure 3 shows that the differences between pressurization and depressurization are similar for houses with foil-based and board-based airtightness systems. The maximum ACH50 values ofboard-based houses remained below 2 h⁻¹ in both measurement modes, whilefoilbased houses reached values of up to approximately 4 h⁻¹. These higher values were mainly recorded in older measurements conducted before 2013.
The data also demonstrate that the relationship between pressurization and depressurization is highly consistent for both airtightness systems. The coefficients of determination were 89% for foil-based houses and 88% for board-based houses, indicating a stable, predictable response to positive and negative pressure regardless of the absolute ACH50 level.
In recentyears,ACH50valueshavedecreasedinbothgroups,reflectingtheimpactof subsidyprograms,stricternationalrequirements,andimprovementsinairtightnessmaterials (Böhm et al., 2021). Since 2018, all board-based houses in the dataset achieved ACH50 values below 1 h⁻¹, and for foil-based houses, only a single measurement exceeded 2 h⁻¹ after 2016.
Influence of Construction Details on Airtightness:
Constructiondetailsplayadecisiveroleinensuringthelong-termairtightnessoflightweight timberbuildings.Evenwhenhigh-qualitymaterialsareused,inadequateexecutionofjoints, penetrations or junctions between structural components can create significant air-leakage paths. Theseareas requireprecise workmanship and careful substratepreparation to prevent detachment,tearingorincompleteadhesionoftheairtightlayerduringpressurefluctuations.
Infoil-basedairtightnesssystems,executionerrorsoccurmostfrequentlyatlocations where the membrane must be bonded to adjacent components or wrapped around complex geometrictransitions.Typicalproblemsincludeinsufficientadhesionduetodustormoisture on the substrate, incomplete bonding of tape at corners and edges and local tearing or detachment caused by mechanical stress during installation. Examples of such defects are shown in Figure 4. These issues often create extended and continuous leakage paths, as flexible membranes are prone to movement and deformation under pressure differences during blower-door testing.
4 Examples of incorrectly executed airtightness details in foil-based systems: (a) insufficient sealing of an electrical penetration, (b) inadequate adhesion of the foil to a dusty base, (c) improper chimney penetration where the foil is applied directly to the chimney casing, leading to detachment (this configuration is also unsuitable from a fire-safety perspective).
Correctly executed foil-based airtightness details are illustrated in Figure 5. In these examples, the foil adheres uniformly to a clean substrate, the tape is properly pressed along the entire joint and the membrane remains flat without folds or localized tension. Such execution minimizes the likelihood of detachment during blower-door testing and ensures thattheairtightlayerperformsasintended.Photographicexamplesforboard-basedsystems are not included, as their defect patterns are more effectively represented by the statistical distribution shown in Figures 6 and 7.
5 Examples of correctly executed airtightness details in foil-based systems: (a) properly bonded polyethylene foil; (b) aluminum foil securely fixed and well sealed.
Fig.
Fig.
The behavior of board-based airtightness systems differs fundamentally from that of foil-based membranes. Dueto theirrigidity and dimensional stability, boardsdo not deform underpressureandarelesspronetosuddendetachmentortheformationofextendedleakage paths. Defects in board-based systems typically occur at joints between boards or at geometrically complex locations. However, these leaks tend to remain localized and therefore have a smaller impact on the final ACH50 value. The frequency and distribution of these defect types are illustrated in Figures 6 and 7
Frequency and Impact of Airtightness Defects:
To complement the qualitative assessment of construction details, Figures 6 and 7 present the relative frequency of individual airtightness defects identified during blowerdoor diagnostics. These categories reflect the most common leakage mechanisms in lightweight timber buildings and were classified consistently across all 450 tested houses. It is important to note that the frequency of a defect does not necessarily indicate its overall influence on airtightness, as the impact of an individual leakage path depends primarily on its geometry, continuity, and the pressure-driven airflow it enables. Even a relatively rare defect may dominate the resulting ACH50 value if it forms a continuous or pressure-sensitive flow path. Conversely, multiple localized discontinuities may have only a limited influence if they remain spatially confined and mechanically stable. This observation is consistent with large-scale analyses showing that airtightness performance is determined by the continuity and sensitivity of leakage paths rather than by their mere presence (Mélois et al., 2019).
The defect distribution further shows that the dominant leakage mechanisms are less governed by their occurrence and more by their ability to form continuous or pressuresensitive flow paths, which explains the higher resulting ACH50 in foil-based systems.
Fig. 6 Relative frequency of airtightness defects in foil-based systems. The most frequent leakage categories were window connection joints and foil joints, which together accounted for nearly half of all recorded defects.
Fig. 7 Relative frequency of airtightness defects in board-based systems. Defects were dominated by window connection joints and board joint execution, while most other categories occurred at consistently low frequencies.
In foil-based systems (Figure 6), leakage occurrences were dominated by window connection joints and taped foil joints, which together accounted for nearly half of all identified defects. These details depend strongly on theproper application ofadhesive tapes and surface preparation, making them highly sensitive to workmanship and on-site conditions. Foil-based systems also exhibited a wider variety of defect types, including several categories that were completely absent in board-based constructions.
The influence of window connection joints was more difficult to quantify precisely because part of the airflow may occur through secondary or concealed cavities that are not directlyaccessibleduringsealing.Inseveralcases,themeasuredimpactofthesedefectswas smaller than expected despite their high occurrence.
Otherleakagecategories, suchaspenetrationsfor electricalwiringorHVACsystems, showedsimilarlevelsofinfluence.Thesedefectstypicallyproducedsmall,localizedleakage paths that can be effectively controlled by using system-manufactured grommets orflexible sealing compounds. Large sliding HS doors represented a specific case in which the functional gap geometry limited the achievable airtightness. These systems rely on brush seals rather than continuous compression seals, which inherently limit the maximum airtightness achievable, even when installation is correct.
Inboard-basedsystems(Figure7),themostfrequentdefectsweresimilarlyassociated with window junctions and board joints. However, most other defect categories occurred at consistently low frequencies. Although board materials exhibit higher intrinsic material permeability than foil membranes, the joints between boards were consistently tighter and lesspronetoformingcontinuousleakagepaths.Asaresult,theoverallimpactofboard-joint defects on ACH50 was lower than that of the corresponding defects in foil-based systems.
Field diagnostics showed that although taped foil joints were not the most frequent defect category, they had the strongest influence on the resulting ACH50. During progressive sealing of identified leakages, the largest reductions in ACH50 occurred after repairing detached or insufficiently pressed tape joints. This confirms that continuous leakage paths formed along foil joints represent the dominant mechanism affecting air permeability.
Foil-based airtightness layers require careful handling during installation. The membranes may deform when tensioned, lose adhesion on dusty or cold substrates, and cannot be reliably pressed into tight or geometrically complex junctions. Connections
relying solely on sealants were particularly sensitive to aging and moisture, reducing their long-term reliability.
In contrast, defects in board-based systems typically affected only the joints between individual boards and did not compromise larger areas of the airtight layer. The rigidity and dimensional stability of the boards limited the potential size of leakage paths and reduced the likelihood of sudden detachment or deformation under pressure.
Thesefindingsareconsistentwithpreviousdiagnosticworkconductedbytheauthors, which identified similar defect patterns and emphasized the greater impact of foil-related failures on airtightness (Beránková, 2021; Brich, 2023). Comparable results have also been reported in peer-reviewed studies showing that flexible foil-based systems exhibit greater sensitivitytoworkmanship,climaticvariability,andlong-termdeformationthanrigidboardbased layers (Prignon and Van Moeseke, 2017; Kysela et al., 2023).
Taken together, the present findings indicate that airtightness performance at the building scaleis primarily afunction ofsystem continuity and mechanical robustness rather than nominal material properties alone. The ability of an airtight layer to maintain stable geometry and limit the formation of continuous leakage paths is more decisive than its intrinsic vapor diffusion resistance
CONCLUSION
Airtightnessperformanceof450low-energytimberhouseswasevaluatedinthestudy, and a clear difference between the two airtightness systems examined was confirmed. Houseswithboard-basedairtightandvapor-tightlayersachievedsignificantlylowerACH50 values than houses with foil-based layers.
Analysis of construction details demonstrated that the most frequent defects in foilbased systems occurred at window connection joints and taped foil joints, which also representedthemost influential leakagepaths. Thesedefects often formed extended airflow channels due to the membrane's flexible nature and its sensitivity to substrate conditions.
In contrast, defects in board-based systems were confined to relatively small junction areas, so their impact on the resulting ACH50 remained limited despite occurring in similar functional locations and despite the higher intrinsic permeability of rigid boards compared to high-Sd foils.
The results indicate that envelope airtightness at the building scale is primarily governed by the continuity and robustness of the airtight system rather than by nominal material diffusion resistance alone.
Overall, the findings show that the quality and configuration of construction details play a decisive role in the airtightness of timber buildings, and that rigid board materials provide a more robust, fault-tolerant airtight layer under real construction conditions. The resultshighlighttheneedforpreciseexecutionofjunctions,especiallyinfoil-basedsystems, and support the growing practical adoption of board materials for achieving reliable longterm airtightness performance.
REFERENCES
Almeida, RMSF., Ramos, NMM., Pereira, PF., 2017. A contribution for the quantification of the influenceofwindowsontheairtightnessofSouthernEuropeanbuildings.EnergyandBuildings 139,174–185. https://doi.org/10.1016/j.enbuild.2017.01.012
ASTM:2016, ASTM E96/E96M-16. Standard Test Methods for Water Vapor Transmission of Materials. ASTM International, West Conshohocken, PA, USA.
Beránková, J., 2021. Diagnostics and quality control of wooden buildings [Diagnostika a kontrola kvality dřevostaveb]. iMaterialy.cz. Available online at: https://imaterialy.cz/rubriky/drevenemontovane-konstrukce/diagnostika-a-kontrola-kvality-drevostaveb_48798-html/
Böhm, M., Beránková, J., Brich, J., 2021. Factors influencing envelope airtightness of lightweight timber-frame houses built in the Czech Republic in the period of 2006–2019. Building and Environment 194:107687. https://doi.org/10.1016/j.buildenv.2021.107687
Brich, J., 2023.How good is your house? An airtightness test will reveal defects. What are the most common? [Jak kvalitní máte dům? Chyby odhalí test vzduchotěsnosti. Jaké se vyskytují nejčastěji?] ESTAV.cz. Available online at: https://www.estav.cz/cz/12544.jak-kvalitni-matedum-chyby-odhali-test-vzduchotesnosti-jake-se-vyskytuji-nejcasteji
Brzyski,P.,Grudzińska,M.,Böhm,M.,Łagód,G.,2022.EnergySimulationsofaBuildingInsulated with a Hemp-Lime Composite with Different Wall and Node Variants. Energies 15(20). https://doi.org/10.3390/en15207678
CHMI., 2025. Czech Hydrometeorological Institute. Mean annual air temperature in the Czech Republic (1981–2010 climatological normal). Prague: CHMI. Available online at: https://www.chmi.cz/historicka-data/pocasi/uzemni-teploty
CZSO., 2025 Czech Statistical Office. Housing Construction 2023 – Completed dwellings by type of load-bearing structure (Table 16). Prague: Czech Statistical Office. Available at: https://csu.gov.cz/produkty/bvz_cr
Feijó-Muñoz, J , González-Lezcano, RA , Poza-Casado, I , 2019a Airtightness of residential buildings in the Continental area of Spain. Building and Environment 148:299–308. https://doi.org/10.1016/j.buildenv.2018.11.010
Feijó-Muñoz, J., Pardal, C, Echarri, V , 2019b Energy impact of the air infiltration in residential buildings in the Mediterranean area of Spain and the Canary islands. Energy and Buildings 188–189, 226–238. https://doi.org/10.1016/j.enbuild.2019.02.023
Gustavsson, L , Sathre, R., 2011. Energy and CO2 analysis of wood substitution in construction. Climatic Change 105, 129–153. https://doi.org/10.1007/s10584-010-9876-8
Hallik, J , Kalamees, T., 2019 Development of airtightness of estonian wooden buildings. Journal of Sustainable Architecture and Civil Engineering, 1, 36–43. https://doi.org/10.5755/j01.sace.24.1.22167
Hallik, J , Kalamees, T, Pikas, E., 2023 Airtightness of Estonian dwellings - Median and basevalues for heat loss estimation. Journal of Physics: Conference Series 2654, 0–8. https://doi.org/10.1088/1742-6596/2654/1/012063
Hodoušek,M ,Böhm,M ,Lemaster,RL ,2015 Airpermeationrateoforientedstrandboards(OSB/3 and OSB/4). BioResources10,1137–1148. https://doi.org/10.15376/biores.10.1.1137-1148
Hodoušek, M , Böhm, M , Součková, A , 2019a Application of paints to decrease air permeability of oriented strand boards. Maderas. Ciencia y tecnología 21(1), 105-112 https://doi.org/10.4067/s0718-221x2019005000110
Hodoušek, M , Böhm, M , Součková, A , Hýsek, Š., 2019b Effect of moisture content on the air permeability of Oriented strand boards. BioResources 13, 4856–4869. https://doi.org/10.15376/biores.13.3.4856-4869
Hurmekoski, E , Jonsson, R , Nord, T., 2015 Context, drivers, and future potential for wood-frame multi-storyconstructioninEurope.TechnologicalForecastingandSocialChange99,181–196. https://doi.org/10.1016/j.techfore.2015.07.002
ISO:2012,ENISO13788.Hygrothermalperformanceofbuildingcomponentsandbuildingelements - Internal surface temperature to avoid critical surface humidity and interstitial condensationCalculation methods. European Committee for Standardization (CEN), Brussels, Belgium.
ISO:2016, ISO 12572. Hygrothermal performance of building materials and productsDetermination of water vapour transmission properties - Cup method. International Organization for Standardization, Geneva, Switzerland.
ISO:2015, EN ISO 9972. Thermal performance of buildings - Determination of air permeability of buildings - Fan pressurization method. European Committee for Standardization (CEN), Brussels, Belgium.
Kalamees,T.,2007.Airtightnessandairleakagesofnewlightweightsingle-familydetachedhouses
in Estonia. Building and Environment 42(6), 2369–2377. https://doi.org/10.1016/j.buildenv.2006.06.001
Kalamees, T., Alev, Ü., Pärnalaas, M., 2017. Air leakage levels in timber frame building envelope joints. Building and Environment 116,121–129. https://doi.org/10.1016/j.buildenv.2017.02.011
Kalamees, T., Kalbe, K., Kodi, GM., 2025. Moisture Safety Strategies for Renovations of a Roof with Prefabricated Additional Insulation Elements: AWhole Building Heat, Air, and Moisture Simulation Approach. Lecture Notes in Civil Engineering 552 LNCE, 262–269. https://doi.org/10.1007/978-981-97-8305-2_36
Kysela, P., Ponechal, R., Michálková, D., 2023. Airtightness of a Critical Joint in a Timber-Based Building Affected by the Seasonal Climate Change. Buildings 13, 698. https://doi.org/10.3390/buildings13030698
Linkevičius,E.,Žemaitis,P.,Aleinikovas,M.,2023.SustainabilityImpactsofWood-andConcreteBased Frame Buildings. Sustainability 15:1560. https://doi.org/10.3390/su15021560
Loučanová,E.,Olšiaková,M.,2020.Identificationofcustomers’driversforthewoodbuildingasan ecological innovation in building construction in slovakia. Acta Facultatis Xylologiae Zvolen 62, 177–188. https://doi.org/10.17423/afx.2020.62.1.15
Loukou, E , Jensen, NF , Rohde, L , Andersen, B., 2024 Damp Buildings: Associated Fungi and How to Find Them. Journal of Fungi 10, 1–29. https://doi.org/10.3390/jof10020108
Mélois,AB ,Moujalled,B ,Guyot,G ,Leprince,V.,2019 Improvingbuildingenvelopeknowledge from analysis of 219,000 certified on-site air leakage measurements in France. Building and Environment 159, 106146. https://doi.org/10.1016/j.buildenv.2019.05.023
Mjörnell, K , Olsson, L., 2019 Moisture safety of wooden buildings – design, construction and operation. Journal of Sustainable Architecture and Civil Engineering 24, 29–35. https://doi.org/10.5755/j01.sace.24.1.23230
Pobucká, S , Kučírek, P , Šuhajda, K , Holešovský, J., 2025 Foundation of Timber Structures –Crawl Space Heat and Moisture Analysis With Air Age Simulation and Occurrence of Micromycetes. Acta Facultatis Xylologiae Zvolen 67, 109–124.
Prignon, M , Van Moeseke, G., 2017 Factors influencing airtightness and airtightness predictive models: A literature review. Energy and Buildings 146, 87–97 https://doi.org/10.1016/j.enbuild.2017.04.062
Ramage, MH , Burridge, H, Busse-Wicher, M , 2017 The wood from the trees: The use of timber in construction. Renewable and Sustainable Energy Reviews 68, 333–359. https://doi.org/10.1016/j.rser.2016.09.107
Shrestha, PM , Humphrey, JL , Barton, KE , 2019 Impact of low-income home energy-efficiency retrofits on building air tightness and healthy home indicators. Sustainability 11, 1–22. https://doi.org/10.3390/su11092667
Sikkema, R , Styles, D , Jonsson, R , 2023 A market inventory of construction wood for residential building in Europe – in the light of the Green Deal and new circular economy ambitions. Sustainable Cities and Society 90, 104370. https://doi.org/10.1016/j.scs.2022.104370
Srba, J., Böhm, M , Beránková, J , 2016 Estimation of air leakage rate of wood-based residential buildings constructed in the Czech Republic in the years 2006-2014 using blower door test. Wood Research 61, 599–605.
Viitanen,H.,Vinha,J.,Salminen,K.,2010. Moistureandbio-deteriorationriskofbuildingmaterials and structures. Journal of Building Physics 33, 201–224. https://doi.org/10.1177/1744259109343511
Vinha, J., Manelius, E., Korpi, M., 2015. Airtightness of residential buildings in Finland. Building and Environment 93, 128–140. https://doi.org/10.1016/j.buildenv.2015.06.011
Wang, L., Ge, H., 2017. Effect of air leakage on the hygrothermal performance of highly insulated wood frame walls: Comparison of air leakage modelling methods. Building and Environment 123, 363–377. https://doi.org/10.1016/j.buildenv.2017.07.012
ACKNOWLEDGMENT
This research was supported by the Internal Grant Agency of the Timber Institute Prague (Timber Research and Development Institute, Prague), project No. IGA 03/2025.
AUTHORS’ ADDRESSES
Ing. Jiří Brich
Ing. Antonín Novotný, MBA
Ing. Petr Farář
Ing. Josef Šindelář
Ing. Jitka Beránková, Ph.D. Timber Institute Prague Na Florenci 7-9, 111 71 Prague 1 Czech Republic brich@vvud.cz novotny@vvud.cz farar@vvud.cz sindelar@vvud.cz berankova@vvud.cz
ACTA FACULTATIS XYLOLOGIAE ZVOLEN, 68(1): 79 90, 2026
Zvolen, Technická univerzita vo Zvolene
DOI: 10.17423/afx.2026.68.1.07
DETERMINATION OF FIRE CHARACTERISTICS OF SPRUCE WOOD BY NEW MEDIUM-SCALE LABORATORY METHOD
Elena Kmeťová – Matej Babic – Danica Kačíková – Martin Zachar
ABSTRACT
The paper is focused on the evaluation of spruce wood (Picea abies L.) used in building construction using the new medium-scaled test method, which is a modification of the standard test method according to standard STN EN ISO 11925-2. The significance of the new medium-scale test method lies in its accessibility compared to standard test methods and in the ability to test samples of various dimensions (lengths up to 1 meter) at different angles of exposure to the heat source. The new medium-scale method is based on exposing the samples (300 × 100 × 100 mm) to a 1 kW flame source for 1800 s. The test setup was placed on the laboratory scale with thermocouples placed in the samples for the duration of thetest. This enabledus to measurethemass loss, temperaturecourses, charred layerdepth, and charring rate. With this method, the mentioned parameters were determined for three different angles of inclination (0°, 45°, 90°) for the samples, which simulate the actual placement of a wooden building element in a structure. Values of mass loss ranged from 3.33 ± 0.62% (0° angle) to 4.66 ± 0.33% (90° angle). The temperature courses at the angles of inclination 90° and 45° were similar. Nevertheless, at the 90° angle, the maximum temperaturereachedwas75.6℃lower.Thecharringratereacheditsmaximumvalueof0.49 mm·min-1 at an inclination angle of 45°. The results showed the influence of the angle of inclination and wood grain directions on fire characteristics.
Keywords: angles of inclination of the samples; charred layer; lignocellulosic material; mass loss; temperature courses.
INTRODUCTION
The paper is focused on the evaluation of spruce wood (Picea abies L.) Nowadays, many factors influence the choice of building materials. In addition to suitable physical and mechanical properties, environmental impact is essential in evaluating materials (Kadlicová et al., 2017). Wood, thanks to its unique combination of properties, such as easy processing and good physical and mechanical properties, has been and remains a very important lignocellulosic material used as a construction material (Popescu and Pfriem, 2020). It is a material characterized by a relatively inhomogeneous, anisotropic structure and consists of a complex of macromolecular substances (cellulose, hemicelluloses, lignin) and extractive substances (Dietenberger, 2002). The structures of the mentioned polymers can vary significantly depending on the type of wood. Wood polymers of coniferous trees have a different structure compared to those of deciduous trees (Lowden and Hull, 2013).
The main components of wood – cellulose, hemicelluloses, and lignin – are to some extent susceptible to damage by abiotic influences (UV radiation, water, sun, oxygen), biologicalpests(fungi,insects,bacteria),anddegradationprocesseswhenexposedtohigher temperatures – fire (Reinprecht, 2016). The use of wood in construction is often questioned precisely because of its flammability. Flammability is a general term that describes the properties of a material in response to fire. It cannot be expressed by a single value because it is influenced by several parameters (Giudice and Canosa, 2017; Quintiere, 2017).
Flammabilityassessmentmethodsareessentialinevaluatingmaterialsandflameretardants. Most experiments commonly used aim to determine the following fire properties of materials: ease of ignition; flame spread rate; heat release rate; and the rate of development, quantity, and composition of smoke released in individual phases of the fire. According to severalauthors,themostimportantparameterfordeterminingfirehazardistheHeatRelease Rate (HRR) (Friedman et al., 2003; Lyon and Walters, 2002).
Currently,fireprotection ofmaterialsisanintegralpartofthedesignandconstruction of a wide range of buildings and products. Medium-scale testing of materials and products is akey process for assessing performance and ensuring fire resistance. Thesetests provide valuable information on the reaction of materials to high temperatures and intense thermal loads, enabling them to be identified and optimized.
Alargenumberofstandardizedandnon-standardizedtestmethodsareusedfortesting materials. Standardized test methods are primarily used to demonstrate compliancewith the requirements imposed on a material or product by applicable legal regulations. Non-standardized test methods are primarily used in science and research, but also in determining the causes of fires (Martinka and Balog, 2014).
Flamespreadisafirecharacteristicthataffectstheentirecombustionprocess.Therate of fire development also depends on how quickly the flame can spread across the surface of aflammablematerial.Flamespreadcanbeconsideredasaprogressiveignitioninwhichthe leading edge of the flame acts as both a heat source and an initiation source. The rate of flame spread can depend on a material's physical properties and chemical composition. Unlike the surfaces of liquids, the surface of a solid can be oriented in any direction, which can significantly affect flame spread. This is especially true for flame spread, as it is controlledbythemechanismthattransfersheataheadoftheburningzone,whichisstrongly influenced by the surface geometry and slope (Drysdale 2011; Huang et al., 2015; Kobayashia et al., 2017; Pizzo et al., 2009).
Theflamespreadsoverthematerial'ssurfaceimmediatelyafterignition,butitspreads faster when it is an upward flame on a vertically oriented fuel surface. This is due to the change in the physical interaction between the flame and the unburned fuel when the fuel orientation changes, i.e., the direction of propagation of the released flammable gases changes (upward) relative to the direction of flame propagation (Quintiere, 2017; Drysdale, 2011).
Fig. 1 Flame propagation at different angles of inclination (Gollner et al., 2017).
One important fire property of wood is its charring rate. It is influenced by several parameters, such as wood density, moisture content, and wood type (Martinka et al., 2018; Salmen et al., 2011). The charring rate values are important because, according to STN EN 1995-1-2: Eurocode 5 (2010), the charring rate is a key factor in calculating the fire resistanceofwoodenstructures,whichisofinteresttobuildingsafetyexpertswhostudythe loss ofload-bearing capacity ofwooden beams and columns in post-fireconditions (Richter et al.,2019).Eurocode5,parts1–2,presentsseveralmodelsforcalculatingthefireresistance of wooden structures. These models are based on the hypothesis that wood charring occurs at temperatures above 300°C (Babrauskas, 2005). In addition to the charring rate, the charring depth is considered an important parameter of the fire resistance of wooden structures, as it allows determining the size of the residual cross-section of wood, which is used to determine the fire resistance of a wooden structure (Cachim and Franssen, 2009). The charring rate is defined as the ratio of the depth of the char layer formed on the timber tothefireduration(FrangiandFontana,2003).Thecharringrateisdeterminedbymeasuring the charring depth and the duration of thermal exposure.
In previous research, we used the test method according to Utility Model No. 9589 –“Devicefordeterminingthespeedofflamespreadoverthesurfaceofpolymermaterialsand a method for this determination” (Kmeťová et al., 2022). Based on the research results, a medium-scale test method was developed, and fire characteristics on larger samples were verified. The comprehensive assessment of the material is focused on its behavior under various conditions.
The aim of the work is an experimental comparison of the thermal resistance of the selectedlignocellulosicmaterial-sprucewood,whenloadedwithaflamesource,depending ontheangleofinclinationofthesample.Fortheexperiment,wechosethreedifferentangles of inclination for the sample (0°, 45°, and 90° relative to the tested flame).
MATERIALS AND METHODS
The experiment was conducted using Norway spruce (Picea abies L.) samples. The samples were collected from tree trunks harvested in the Forest Enterprise territory belonging to the Technical University in Zvolen, in the central part of the Slovak Republic, during April 2024. A total of 15 samples were used for the experiment, in the shape of a prism with dimensions of 300 mm (tangential) × 100 mm (radial) × 100 mm (transverse). Before the experiment, the moisture content of the samples was 10.19 ± 0.11% and the density 481 ± 2 kg·m-3. Moisture content and density were determined gravimetrically.
The new medium-scale non-standard test method represents another modification of STN EN ISO 11925-2. Using this method, samples can be exposed to the flame at different angles (0°, 45°, and 90°), which, in our case, simulates the effect of fire on various wooden structural elements in the structure (rafters, wooden beams, wooden columns). For each angle of inclination, 5 samples were tested. In the experiment, the sample is exposed to the flamefor1800 s, and thedetermined parametersarethenmonitored for120s without flame exposure.Theadvantageoftheproposedmethodismainlythepossibilityoftestingsamples of larger dimensions and changing angles, since the original STN EN ISO 11925-2 test method allows measurements only in the vertical orientation of the samples. Another advantage is the recording of weights and temperature curves during measurement.
The proposed test method allows for simultaneous measurement of multiple parameters(sampleweight, ambient temperature, temperatureinsidethesample),which are continuously recorded. From the measured values, we can calculate and determine other
selected fire characteristics of the material (relative mass loss, depth of the charred layer, charring rate, temperature courses in the sample cross-section). The designed device allows for making medium-scale tests; its scheme is shown in Figure 2.
Fig. 2 Scheme of aparature.
The method consists of exposing the tested material to a constant load from a flame source – a Bunsen burner, the power of which can be regulated using a propane flow regulator(VögtlinQ-flow140).Theburner'senergysourcewasapressurevesselfilledwith propane,withaflowratesetto0.65Nl‧min-1 (Nl‧min-1 standsfor“normalliterperminute”). The burner power was determined based on the equation (Rantuch et al., 2023):
Where: �������� ���������� – fuel flow; SLPM – Standard liter per minute; �������� – lower heating valueofthe fuel measured at 25 ℃and 101 325 kPa.We set thepowerof the flame source to approximately 1 kW, with a 20 cm flame in the transition area.
During the entire experiment, the sample weight was recorded using a precision balance (RADWAG WLC 60/120 C2/K), from these values we subsequently calculated the mass loss based on the equation:
Where: ����(��)–relativemasslossovertime(τ);��(��0)–sampleinitialweight(g);m (τ) – sample weight at time (τ) (g).
The temperature course was recorded using K-type thermocouples (NiCr-Ni thermocouples) with a measurement range of -40 ℃ to 1200 ℃. The location of the thermocouplesinthesamplesisshowninFigures3and4.Duringexposureofthesampleto theflameat90°and45°,thethermocouples'locationswithinthesampleremainedthesame. A total of 11 thermocouples (TC0 to TC10) were used (fig. 4). These thermocouples were placed from the side (300 × 100 mm) of the sample at a depth of 5 cm in the sample. The placement was on threelevels – two levels were3 cm away (on both sides) from themiddle of the side into which the thermocouples were inserted into the sample, and one level was always 0.5 cm away from the center of the sample. During exposure of the sample to the flame at 0°, the thermocouples' locations within the sample differed. A total of 15 thermocouples (TC0–TC14) were used (Fig. 3). Thermocouples were placed on both sides of the sample at a depth of 5 cm, so that the temperature was measured along the same line
as the flame. In addition, the ambient temperature was recorded during the experiment, reaching 19.5°C. An ALHBORN ALMEMO 2290-8710 V7 (Ahlborn Messund Regelungstechnik GmbH, Holzkirchen, Germany) was used to record the temperatures. Samples at angles of 90°and 45° were exposed to the surface, in the center of the sample in a tangential section, and samples at an angle of 0° were exposed to the lower edge of the sample in a tangential/transverse section.
3 Schematic of thermocouple placement at 0° inclination angle of sample
Fig. 4 Schematic of thermocouple placement at 45° and 90° inclination angle of sample
The depth of the char was measured after the experiment was completed and the char was scraped off, using a digital depth gauge (MarCal 30 EWRi) to determine the difference between the original dimensions of the sample and its dimensions after the experiment. The charring rate was determined by calculating the depth of the char and the time of exposure to thermal stress. Figure 5 shows a diagram of the locations where the char was measured.
Fig. 5 Charred layer measurement scheme
Fig.
RESULTS AND DISCUSSION
Figure 6 shows a visual representation of the samples after the experiment was performed, and Figure 7 shows photo documentation of the samples after the charred layer was scraped off.
During the experiment, the samples burned. The sample's angle of inclination affected the pattern of flame spread along its surface. According to the results (Figs. 6 and 7), when the samples were stressed at 0 °, the flame not only spread along the front side of the samples but also down the sides of the samples. Also, depending on the angle of inclination of the sample, we see an observable difference (in terms of burn-in), which was also in the charred layer. While at 90 ° the flame penetrated their inner layers, at 45 ° it remained on the surface and spread upwards. The spread of the flame was also influenced by the direction of the wood grain. Neither sample group continued to burn after the flame was removed.
Kmeťová et al. (2022) in a study aimed at comparing the thermal resistance of a selected lignocellulosicmaterial-sprucewood,applyingaprogressivelaboratorytestmethod.Using
Fig. 6 Photo documentation of samples after the experiment.
Fig. 7 Photo documentation of samples after scrapped of the charred layer (0°. 90°, 45°).
this method, the flame spreads over the surface of the selected material, and the mass loss when the sample is exposed to a small, directed flame is determined. The laboratory test results showed a significant effect of the sample's angle of inclination (0°, 45°, 90°) on the evaluation criteria.
Gollner et al. (2017),alsoaddressedtheeffectofsampleflowandinclinationonflame propagation across solid fuels. Upward flame spread is best studied, with various theories available to describe many aspects of the process. But even in this well-studied configuration, work is still needed to refine these results and address key areas of interest.
The relative mass loss trend (Fig. 8) was similar for the 45° and 90° sample angles. We noticed a greater difference at the 0° angle of inclination compared to the other two angles.Atthesametime,wecanstatethatallwoodyplantslostlessthan6%oftheiroriginal weight in 1920 seconds. We recorded the worst results for samples at a 90° angle of inclination, which lost up to 4,66% of their weight, which we attribute to the faster spread oftheflameintothesample.As expected,evenin thecaseofmassloss,the angleofsample inclinationsignificantlyinfluencedthethermaldegradationofwood.Inadditiontotheangle of inclination, the mass loss was also influenced by the wood grain directions.
The following figures 9-11 show the average temperature courses in samples exposed to a flame source at given angles. In all temperature profiles, after the flame was turned off (time 1800 s), the sample temperature decreased, indicating that the samples did not burn at any exposure angle. The temperature courses are significantly influenced by the location of the thermocouples, and it is clearly visible that the closer the thermocouples were to the exposed side of the sample, the higher the temperatures were.
Fig. 8 Relative mass loss of tested samples (average ± SE).
Fig. 9 Temperature courses at 90° sample inclination
Fig. 10 Temperature courses at 45° sample inclination.
Fig. 11 Temperature courses at 0° sample inclination.
At an exposure angle of 90°, temperatures of 300℃ were reached at the TC10, TC7, andTC2locationsattimes850s,880s,and1580s,respectively.Themaximumtemperature of 554.9℃ was reached at TC10 at time 1780 s. At an exposure angle of 45°, a temperature of 300℃ was reached at the TC10, TC7, and TC2 locations at times 850 s, 880 s, and 1270 s, respectively. The maximum temperature of 630.5℃ was reached at TC10 at time 1800 s. These results are comparable to those at a 90° exposure angle. At an exposure angle of 0°, temperaturesof300℃werereachedattheTC6,TC7,TC14,andTC3locationsattimes470 s, 1050 s, 1460 s, and 1730 s, respectively. The temperature of 293.3℃ was reached at thermocouple TC8 at 1800 s. This temperature can be considered as the temperature of formation of charred layer. The maximum temperature of 605.8℃ was reached by TC6 at 1390s.Duringtheexperiment,theTC6thermocouplewasobservedtofalloutofthesamples dueto its burnout.Thisisreflectedin thetemperaturefluctuations shown in Fig. 11. At 90°, thesamples reached loweroverall temperatures than at 45°and 0°. At an angleof90°, from the temperature course of TC10, TC7, TC6, and TC2, we can see that water evaporation occurred at 100 ℃. At angles of 45° and 0°, this phenomenon is not obvious from the temperaturecourse.This iscaused bytheangleat whichthesampleisexposedtotheflame. At an angle of 90°, water evaporation occurred predominantly perpendicular to the wood fibers, while at angles of 45° and 0°, water evaporation from the sample occurred predominantly parallel to the wood fibers. For this reason, water evaporation from the sample occurred more slowly at 90° than at 45° and 0°, which led to lower overall temperatures and was reflected in the thermocouple readings (Coolier, 1992).
AccordingtoEurocode5(2010),woodgraduallylosesitsstrengthpropertiesatanyincrease in temperature above 20 °C. At 100 °C, wood loses 35 % of its tensile strength, and at 300 °C, up to 100 %, as confirmed by several authors (Kuronen et al., 2021; König, 2005; Yue et al., 2022).
Thedepthofthecharred layeratpoints according tothetemplatein Figure5 wasmeasured. Table 1 shows the average values from all tested samples. At a 90° angle of inclination, the sample measured 18.9 mm; at a 45° angle of inclination, 22.6 mm; and at a 0° angle of
inclination, 34.4 mm. The values of the charred layer are identical to the description in Figure 6. These values are also influenced by the wood's cut. From the measured charred thickness, we calculated the charred rate at 1920 s. The highest average charred rate was recorded at a 45° angle of inclination. The measured values are within the range of values of the charred rate of spruce wood reported in the available literature.
Tab. 1 Charred layer.
The lowest charring rate was measured for an angle of 90°. This may be related to the temperature curves – the maximum temperature reached was the lowest for the 45° and 0 ° anglesofinclination.Furthermore,thisresultcanbeattributedtopermeability,whichaffects not only water evaporation (as mentioned above) but also the charring rate. Permeability along the grain is higher than across the grain. Increased permeability increases the flow of volatiles,therebyacceleratingpyrolysis.Assuch,itis expectedthatthecharringratewillbe greaterparalleltothegrainthanperpendicular(Bartlett,2018;Friquin,2011;Moore,2011). Based on experiments, Babrauskas (2005) found that in extensive room fires, hardwood or similar materials without gaps or joints char at rates similar to those in furnace tests, at approximately0.50–0.80mm·min−1,whicharesimilartothevaluesweobtained.Theauthor suggests that the charring rate in real fires should not exceed these test values.
CONCLUSION
Theaimofthepaperwastodeterminethefirepropertiesofthelignocellulosicmaterial -sprucewood(Picea abies L.),duetoitsuseasabuildingmaterial.Thefirepropertieswere determinedusingtheproposedmedium-scaletestmethod.Fromtheresults,wecanconclude that the best mass-loss results were achieved at an angle of exposure to the flame source of 0°, namely 3.33±0.62%. This value is more than 1% lower than at 45° and 90°. At an exposureangleof90°,thehighestmasslosswasmeasured–4.66±0.33%,and,nevertheless, the best results in terms of depth of the charred layer, charring rate, and temperature profile inthesamplewereachievedata90°angleofinclination.Atthisangle,thesamplesachieved loweroverall temperatures thanat 45°and 0°. This phenomenoncould havebeen caused by the angle of exposure of the sample to the flame, by the wood grain direction, and by differences in water evaporation rates depending on the sample's geometry relative to the flame.
REFERENCES
Cachim, P. B., Franssen, J. M., 2009. Comparison between the charring rate model and the conductive model of Eurocode 5. Fire and Materials: An International Journal, 33(3), 129-143. Collier, P. C. R., 1992. Charring rates of timber. Building Research Association of New Zealand Babrauskas, V., 2005. Charring rate of wood as a tool for fire investigations. Fire Safety Journal, 40(6), 528-554.
Bartlett,A.I.,Hadden,R.M.,Bisby,L.A.,2019.Areviewoffactorsaffectingtheburningbehaviour of wood for application to tall timber construction. Fire technology, 55(1), 1-49.
Dietenberger, M., 2002. Update for combustion properties of wood components. Fire and materials, 26(6), 255-267.
Drysdale, D., 2011. An Introduction to Fire Dynamics. UK: John Wiley & Sons.
Frangi, A., Fontana, M., 2003. Charring rates and temperature profiles of wood sections. Fire and materials, 27(2), 91-102.
Friedman, R., Friedman, J.,Linvelle, L., 2003. Principles of fire protection chemistry and physics: Part II – fire protection chemistry and physics. Fire Characteristics: Solid Combustibles, 3rd edition. London: Jones and Bartlett Publishers.
Friquin, K. L., 2011. Material properties and external factors influencing the charring rate of solid wood and glue‐laminated timber. Fire and materials, 35(5), 303-327.
Giudice, C. A., Canosa, G., 2017. Flame-retardant systems based on alkoxysilanes for wood protection. Wood in Civil Engineering.
Gollner, M. J., Miller, C. H., Tang, W., Singh, A. V., 2017. The effect of flow and geometry on concurrent flame spread. Fire Safety Journal, 91, 68-78.
Huang,X.,Liu,W.,Zhao,J.,Zhang,Y.,Sun,J.,2015.Experimentalstudyofaltitudeandorientation effectsonheattransferoverpolystyreneinsulationmaterial:Ignitionandcombustionbehaviors. Journal of Thermal Analysis and Calorimetry, 122(1), 281-293.
Kadlicová, P., Gašpercová, S., Osvaldová, L. M., 2017. Monitoring of weight loss of fibreboard during influence of flame. Procedia Engineering, 192, 393-398.
Kmeťová,E.,Zachar,M.,Kačíková,D.,2022.Theprogressivetestmethodforassessingthethermal resistance of spruce wood. Acta Facultatis Xylologiae Zvolen: vedecký časopis Drevárskej fakulty, 64, 2, 29–36.
Kobayashi, Y., Huang, X., Nakaya, S., Tsue, M., Fernandez-Pello, C., 2017. Flame spread over horizontal and vertical wires: Therole of dripping and core. Fire Safety Journal, 91, 112-122. König, J. 2005. Structural fire design according to Eurocode 5 design rules and their background. Fire and Materials, 29, 147-163.
Kuronen, H., E. Mikkola, Hostikka, S., 2021. Tensile strength of wood in high temperatures before charring. Fire and materials, 45, 7, 858-865.
Lowden, L. A., Hull, T. R., 2013. Flammability behaviour of wood and a review of the methods for its reduction. Fire science reviews, 2(1), 4.
Lyon, R. E., Walters, R., 2002. A microscale combustion calorimeter (No. DOT/FAA/AR-01/117). US Federal Aviation Administration, Office of Aviation Research.
Martinka, J., Balog, K., 2014. Fire engineering [Požiarne inžinierstvo]. Trnava : AlumniPress
Martinka, J., Rantuch, P.,Liner, M., 2018. Calculationof charring rate and char depth of spruce and pine wood from mass loss. Journal of thermal analysis and calorimetry, 132(2), 1105-1113. Moore, J., 2011. Wood properties and uses of Sitka spruce in Britain. Pizzo,Y., Consalvi, J.L.,Querre, P., Coutin,M., Porterie, B.,2009.Widtheffectson theearlystage of upward flame spread over PMMA slabs: Experimental observations. Fire safety journal, 44(3), 407-414.
Popescu, C. M., Pfriem, A., 2020. Treatments and modification to improve the reaction to fire of wood and woodbased products An overview. Fire and Materials, 44(1), 100-111. Quintiere, J.G., 2017. Principles of fire behavior. 2nd ed. Boca Raton: CRC Press, 2017 414 pp. Rantuch, P., Martinka, J., Štefko, T., Wachter, I., Bednarikova, M. Z., 2023. Characterization of the burning of oriented strand boards exposed to flame. Wood research 2023, 68, 3, p.547-557.
Reinprecht, L., 2016. Wood deterioration, protection and maintenance. John Wiley & Sons.
Richter, F., Atreya, A., Kotsovinos, P., Rein, G., 2019. The effect of chemical composition on the charring of wood across scales. Proceedings of the Combustion Institute, 37(3), 4053-4061. Salmén,L.,Olsson,A.M.,Stevanic,J.S.,SimonovićRadosavljević,J.,Radotić,K.,2012.Structural organisation of the wood polymers in the wood fibre structure. BioResources, 7(1), 521-532.
STN EN 1995-1-1 + A1; Eurocode 5: Design of Timber Structures Part 1-1: General Rules Common Rules and Rules for Buildings. European Committee for Standardization (CEN): Brussels, Belgium, 2010
STN EN ISO 11925-2: 2020: Reaction to fire tests. Ignitability of products subjected to direct impingement of flame. Part 2: Single-flame source test Utility model no. 9589: Device for
determining the flame spread rate on the surface of polymeric materials and method for this determination.
Yue, K., Wu, J., Wang, F., Chen, Z., Lu, W., 2022. Mechanical properties of Douglas fir wood at elevated temperatures under nitrogen conditions. Journal of Materials in Civil Engineering, 34, 2, 04021434.
ACKNOWLEDGMENT
Funded by the EUNextGenerationEUthrough the Recovery and Resilience Plan for Slovakia under the project No. 09I03-03-V05-00016. This work wassupported by IPANo. 10/2025. This work was supportedbythe ScientificGrantAgency oftheMinistry of Education, Science,ResearchandSport oftheSlovakRepublicandtheSlovakAcademyofSciencesundertheContractVEGAno.1/0115/22 A comprehensive approach to the study of changes in fire parameters using progressive analytical and testing methods.
AUTHORS’ ADDRESSES
Ing. Elena Kmeťová, PhD.
Ing. Matej Babic
prof. Bc. RNDr. Danica Kačíková, MSc., PhD. doc. Ing. Martin Zachar, PhD. Technical University in Zvolen Faculty of Wood Sciences and Technology Department of Fire Protection
T. G. Masaryka 24 960 01 Zvolen Slovakia xkmetovae@is.tuzvo.sk xbabicm1@is.tuzvo.sk kacikova@is.tuzvo.sk zachar@is.tuzvo.sk
ACTA FACULTATIS XYLOLOGIAE ZVOLEN, 68(1): 91 103, 2026
Zvolen, Technická univerzita vo Zvolene
DOI: 10.17423/afx.2026.68.1.08
PAPER PACKAGING: CONSUMER PERCEPTION AND SUSTAINABILITY TRENDS
Martina Nosáľová – Hana Maťová
ABSTRACT
The study focuses on current trends and innovations in product packaging that reflect consumers'growingemphasisonsustainabilityandeco-friendlymaterials.Thisstudy,based onaliteraturereviewandsecondaryanalysisofaquestionnairesurveyofasampleofSlovak respondents, examines consumer preferences, attitudes toward packaging materials, and motivations for recycling or reuse. The results show that paper and paper packaging are perceived as the most eco-friendly materials, with consumers appreciating their biodegradability, recyclability, and health safety. Nevertheless, the environmental parameters of packaging are only taken into account to a limited extent in purchasing decisions, and the willingness to pay more for environmentally friendly solutions remains rather moderate. The analysis also shows that generational differences were not statistically significant in most cases, except for a preference for paper packaging, which was strongest amongolderrespondents.Thestudyconcludesby presentingexamples ofinnovativepaperbasedpackagingandsuggeststhedirectionoffuturedevelopmentsinsustainablepackaging materials.
Keywords: eco-friendly packaging; consumer attitudes; paper-based packaging; ecoinnovation in packaging.
INTRODUCTION
From the perspective of sustainable resource management, the continuing trend of growingconsumptionisextremelyworrying.Sinceplasticsmakeupasignificantproportion of packaging materials, the need to find more environmentally friendly alternatives is becoming increasingly urgent (Młoda-Brylewska and Melski, 2024). There is a rapidly growing trend towards the use of sustainably produced raw materials, which are not only used as active ingredients in products but also in packaging. Cinelli et al. (2019) emphasize the value of green, compostable, and biodegradable packaging solutions that reflect the environmental attitudes of both consumers and producers. As companies innovate towards more natural products, they are also strengthening their brands through environmentally oriented packaging design that meets growing market demands. Recyclability and environmental friendliness make paper an attractive packaging material, with the paper packaging segment projected to grow at 5% per year between 2022 and 2030 (according to the Paper Packaging Market Report 2025, In Sharma, 2025). This development is also supported by consumers who perceive paper as a valuable and environmentally friendly choice (e.g., Lindh et al., 2016; Loučanová et al., 2017; Loučanová et al., 2022).
The growing problem of plastic waste in the food sector creates opportunities to develop more environmentally friendly packaging solutions (Horská et al., 2021). Health awareness,whichwasoriginallylinkedmainlytofood,hasgraduallyspreadtoothersectors, leading to growing interest in natural ingredients, sustainable packaging, and other environmental aspects (Lin et al., 2018; Štofková et al., 2017). Studies show that the motivationtoreduceplasticpackagingvariesbyproductcategory,whileconsumersstrongly support reducing plastic in food. This motivation is somewhat weaker, for example, in the caseofcosmeticproducts(Siddiqui et al., 2023). Thegrowth inenvironmentalawareness is also reflected in the willingness to pay more for products or packaging made from natural materials (Amberg and Fogarassy, 2019).
Research over the past three decades has repeatedly confirmed that packaging design significantly influences consumer behavior and purchasing decisions. Packaging not only increasestheattractivenessofaproduct,butalsoitsperceivedvalue(Kristanto et al.,2024). From the customer's perspective, the type of packaging material is the main indicator of a product's environmental friendliness (Resimovič et al., 2022). Their findings show that the materialhasthegreatestimpactontheperceivednaturalnessandenvironmentalfriendliness ofaproduct,whilevisualelements,suchasillustrations,labels,colors,andtypography,play asecondarybutstillsignificantrole.A2023survey(Beautipak,2023,InChen,2024)found that 72% of consumers prefer eco-friendly packaging and 65% favor paper-based options. This trend signifies a strong movement toward sustainability. Research by the Plant-Based Products Council (2021) also points to growing interest in products from renewablesources such as corn and bamboo, which represents significant potential for packaging innovation. Brands are therefore increasingly replacing plastic with alternative materials such as bamboo, seaweed, corn starch, mushroom fibers, and avocado seeds. Bioplastics, cellulose filmsmadefromwoodpulp(NatureFlex),andbiodegradableplasticsbasedonmilkproteins, which have properties similar to polystyrene, are also becoming more widespread (Drobac et al., 2020). In this context of material sustainability, companies are increasingly introducingpaperproductsinplaceofplasticones,reflectingthegrowingdemandfor"paper instead of plastic" solutions (Loučanová et al., 2024).
Another positive finding is the growing recognition of cartonboard as the most environmentally friendly and easily recyclable form of packaging among European consumers,as revealedin The2025 ProCarton European ConsumerPackaging Perceptions Study (2025), which surveyed more than 5,000 consumers in various European countries. Up to 52% of Europeans consider cartonboard the most environmentally friendly material, and45%consideritthemostrecyclable. Theenvironmentalimpactofpackaginginfluences the purchasing decisions of 75% of European consumers, with this proportion even higher insomecountries.Fouroutoffiverespondentsalsopreferredcartontoplastic,mostnotably inGermany(87%)andtheUnitedKingdom(85%).Theseresultsclearlyillustratethestrong publicsupportforeco-friendlypackagingsolutionsandthegrowingdemandforsustainable alternatives (Procarton, 2025).
However, the latest research conducted in Slovakia indicates a slightly lower level of growth in environmental awareness among Slovak respondents, especially in actively considering environmental aspects of packaging when making purchasing decisions. According to Conzoomer 2023 (a representative survey of more than 3,000 respondents), approximatelyone-thirdoftheSlovakpopulationisskepticalofsustainabilityandconsiders it an exaggerated trend. An equally large proportion of consumers distrust the concept of organic products and are unwilling to pay more for goods that are presented as environmentally friendly. Two-thirds of consumers do not pay attention to whether e-shops use biodegradable or recyclable packaging, considering this irrelevant. Nevertheless, it is
positive to note that for almost 80% of households, waste sorting is a natural part of everyday life, indicating that basic environmental habits arealready firmly rooted in society (Conzoomer 2023).
The later studies on the Slovak consumer market environment (Holotová et al., 2020; Smolka et al., 2021; Kádeková et al., 2021; Kopaničová et al., 2025) report positive trends. The study by Holotová et al. (2020) shows that environmental awareness among Slovak consumers is generally growing. The young generation of Slovak consumers (under 25; approximate generation Z) is more perceptive of packaging, and it plays an essential role in purchasing decisions and evaluations (Kádeková et al., 2020). Even in the long term, Kopaničová et al. (2025) confirm that between Generations X and Y in Slovakia, attention to sustainability has grown significantly over the last decade, including perceptions of packaging.Moreover,generationsYand Zaremostawareoftheneedtochangeand reduce packaging, and it can be assumed that in thefuturetheywill preferproducts in returnableor fully recyclable packaging. A positive finding is that this policy has also been supported by older generations (Smolka et al., 2021).
Asevidentfromtheabove,packagingplaysanimportantrolenotonlyinfunctionality butalsoinmarketingandqualityperception,witheco-friendlysolutionsbasedonrenewable, recyclable materials, especially paper-based ones, becoming increasingly popular. Simultaneously, consumer interest in healthier lifestyles, natural products, and reducing plastic waste is growing (though to varying degrees across age groups and consumer environments), putting pressure on brands to innovate their packaging portfolios. Scientific and practical discourse is therefore moving towards a better understanding of consumer motivations, their packaging preferences, and the factors influencing their willingness to support eco-friendly alternatives. This paper focuses on current trends and innovations in paper packaging. It supplements their findings with a secondary analysis of data from the Slovak consumer environment, aiming to contribute to the discussion on the future of sustainable packaging solutions. The aim of the paper is to statistically evaluate the relationshipsbetweenage,ecologicalattitudes,andpackagingmaterialpreferencesbasedon a secondary analysis of questionnaire data on paper packaging and ecological packaging trends.
For the purposes of this paper, analytical working questions were defined that reflect specific relationships tested using contingency tables and chi-square tests, in particular: the relationship between age group and environmental attitude, between age and the choice of the most eco- friendly packaging material, between environmental attitude and packaging material preference, between age and willingness to pay more for eco-friendly packaging, and between age and assessment of the trend of replacing plastic packaging with paper packaging.
MATERIALS AND METHODS
This paper is based on a secondary analysis of data obtained from a questionnaire survey on paper as a packaging material and consumer trends, originally conducted within the framework of a diploma thesis (Holčíková, 2025). While the diploma thesis primarily presented descriptive results in the form of frequency and contingency tables, the present paper extends the original dataset processing by applying Pearson’s chi-square tests of independence to selected relationships. The analysis, therefore, works exclusively with aggregated data.Thesurvey was conductedusing an onlinequestionnairecreatedin Google Forms. The questionnaire (Holčíková, 2025) contained 20 questions focused on
demographic characteristics (gender, age, and education), purchasing behavior, and perception of packaging, evaluation of paper packaging (perceived sustainability, advantages, and disadvantages), and perception of trends in eco-friendly packaging, includingwillingnesstopayextraformoreeco-friendlysolutions.Datacollectiontookplace in March 2025 via social media, with 186 respondents participating. Given the selection method, this is a purposeful non-probability sample, so the results cannot be considered representative of the entire population.
Respondents were originally classified into four generational cohorts based on commonly used definitions in demographic and marketing literature (Dimock, 2019): Generation Z (13–28 years), Generation Y / Millennials (29–44 years), Generation X (45–60 years), and Baby Boomers (61 years and older). In the subsequent statistical analyses, however, these original cohorts were merged where necessary to satisfy the assumptions of the chi-square test. In particular, Generation X and Baby Boomers were combined into a single 45+ category in those analyses that required a more robust table structure due to low expectedfrequencies.Forthisreason,theanalyticalpartofthestudyusesadjustedage-based groups rather than the original generational classification in all cases.
In addition to age, respondents were classified according to environmental attitudes using a framework adapted from Loučanová et al. (2024), which builds on the LOHAS (Lifestyle of Health and Sustainability) segmentation model. For the purposes of the questionnaire and the present analysis, this framework was operationalized into five categories:nointerest,practicalreasons,trendsandbenefits,healthmotivation,andstrongly engaged. Where required by low expected frequencies, these categories were subsequently merged into three broader analytical groups: Engaged (strongly engaged and health motivation), Rational (trends, benefits, and practical reasons), and Uninterested (no interest).The study addressed five analytical research questions reflecting specific relationships tested by contingency tables and chi-square tests:
➢ RQ1:Isthereanassociationbetweenage-basedgroupsandenvironmentalattitudes?
➢ RQ2: Is there an association between age-based groups and the perception of the trend from plastic to paper packaging?
➢ RQ3: Is there an association between age-based groups and willingness to pay more for eco-friendly packaging?
➢ RQ4: Is there an association between environmental attitudes and preferred ecofriendly packaging material?
➢ RQ5: Is there an association between age-based groups and the perceived most ecofriendly packaging material for food products?
ThestudydrewonabriefsummaryofdescriptiveresultsreportedinHolčíková(2025) and on a secondary statistical assessment of selected relationships using contingency tables andPearson'schi-squaretestofindependence.Thesignificancelevelwasset atα=0.05.To assess the suitability of the contingency tables, Cochran's criterion for expected frequencies was applied: no expected value was below 1, and fewer than 20% of cells had expected frequencies below 5 (Cochran, 1954; Kroonenberg and Verbeek, 2018).
Where the original tables contained very low frequencies (e.g., extreme responses, choice of plastic or metal as the most eco-friendly material), the response categories were merged (e.g. "positive" = rather positive and very positive and "non-positive" = neutral, rather negative, and very negative), paper vs. other materials, high/medium/low attention). In some analyses, the two older age groups were also combined into the 45+ category to meet the chi-square test's assumptions about expected frequencies (Cochran's condition).
Statistical calculations were performed using The jamovi program (The jamovi project, 2024), which is based on the R environment (R Core Team, 2024).
The limitation of the analysis is that it is based on aggregated data from an already completedsurvey,soitisnotpossibletotestcombinationsofvariablesbeyondthoseallowed bythequestionnaire'sstructure,nortoretrospectivelyinfluencethequestionnaire'sstructure or the method of data collection. However, secondary analysis allows a more systematic statistical assessment of the relationships between selected variables.
RESULTS AND DISCUSSION
The following overview briefly summarizes the main descriptive findings reported in Holčíková (2025) from a questionnaire survey on paper as a packaging material and consumer trends. The sample consisted of 186 respondents, predominantly women (78.49%). In terms of the original generational cohorts, Generation Z was the most representedgroup(n=71;38.17%),followedbyGenerationY(n=52;27.96%),Generation X (n = 42; 22.58%), and Baby Boomers (n = 21; 11.29%). For the purposes of the contingency analyses, Generation X and Baby Boomers were merged into a single 45+ category (n = 63; 33.87%) where necessary. In the descriptive results, paper/cardboard was most often perceived as the most environmentally friendly packaging material, being selectedbyapproximately60%ofrespondents.Atthesametime,glasswasthesecondmost frequent choice. Paper packaging was generally evaluated positively for sustainability, and biodegradability, recyclability, and food safety were identified as its main advantages. The principal disadvantages were low resistance to moisture and mechanical damage. The descriptive findings also suggested possible differences in environmental attitudes, willingness to pay more for eco-friendly packaging, and perceptions of replacing plastic packaging with paper alternatives (Holčíková, 2025).
These descriptive patterns formed the basis for the subsequent contingency analyses. For transparency, the merged categories used in the analyses are described below, while the full statistical results are presented in Table 1.
Chi-square tests showed that several findings from the frequency analysis were not confirmed by more detailed testing (e.g., the relationship between age and environmental attitude, frequency of packaging perception, willingness to pay extra, or the trend of transition from plastic to paper packaging). At the same time, a statistically significant correlation was found in the selection of the most environmentally friendly packaging material by age, which could be further interpreted. Given the non-probability nature of the sample, the findings should be interpreted as applying to the analyzed sample rather than to the population.
Tab. 1 Summary of contingency analyses and chi-square test results.
*Note: Categories were merged where necessary to meet the assumptions of the
only for the statistically significant association
1. Age-based groups and environmental attitudes
Toexaminetherelationshipbetweenageandenvironmentalattitudes,theoriginalfour generational cohortsweremergedintothreeage-basedgroups: GenZ,Gen Y,and45+.The originalattitudecategorieswerealsoreducedtothreebroadergroups:engaged,rational,and uninterested (see Materials and methods). As shown in Table 1, no statistically significant association was found between the adjusted age groups and environmental attitude.
At the descriptive level, respondents across all three age groups were concentrated mainly in theengaged and rational categories, which together accounted for morethan 97% of responses. In contrast, uninterested respondents accounted for only around 2% of the sample. Because the uninterested category remained very small, this result should be interpreted cautiously. Within the analyzed sample, the observed differences therefore suggest only limited variation in environmental attitudes across the adjusted age groups.
2. Perception of the trend from plastic to paper packaging across age-based groups
For this analysis, the original response categories were merged into two broader groups:positive(ratherpositiveandverypositive)andnon-positive(neutral,rathernegative, and very negative). The original four generational cohorts were again reduced to three agebased groups: Gen Z, Gen Y, and 45+. According to Table 1, no statistically significant association was found between age groups and perceptions of the transition from plastic to paper packaging.
Descriptively, positive evaluations clearly predominated in all three adjusted age groups: 87.32% in Gen Z, 90.38% in Gen Y, and 90.48% in the 45+ group. In the analyzed sample, support for the transition from plastic to paper packaging was therefore high across all compared groups, with only minor differences in intensity. Support for this trend is high and consistent across generations, indicating broad social acceptance of ecological changes in packaging.
3. Willingness to pay more for eco-friendly packaging across age-based groups
In the analysis of willingness to pay more for eco-friendly packaging, responses were merged into three categories: negative (definitely not and rather not), neutral, and positive
(rather yes and definitely yes). As in the previous analyses, the original four generational cohorts were merged into three age-based groups: Gen Z, Gen Y, and 45+. As reported in Table 1, no statistically significant association was observed between age groups and willingness to pay more for eco-friendly packaging.
At the descriptive level, the 45+ group showed the highest proportion of positive responses (33.33%), followed by Gen Z (30.99%) and Gen Y (26.92%). Neutral responses were most frequent in Gen Y (42.31%), while Gen Z recorded the highest proportion of negative responses (35.21%). However, within the analyzed sample, these differences were not statistically strong enough to support the conclusion that willingness to pay varied meaningfully across the compared age-based groups. The public's attitude is rather cautious but not rejecting. Respondents are not strongly opposed to paying extra for eco-friendly packaging, but they are not particularly convinced. This pattern suggests potential for positive change, provided that the importance and benefits of eco-friendly solutions are sufficientlycommunicatedtothepublic,especiallyiftheyareassociatedwithcredibilityand reasonable affordability
4. Preferred eco-friendly packaging material according to environmental attitude
The relationship between environmental attitude and the preferred eco-friendly packaging material for food products was examined using five attitude categories: no interest, practical reasons, trends and benefits, health motivation, and strongly engaged. To obtain a more robust analytical structure, packaging materials were reduced to two categories: Paper and Other (glass, plastic, and metal). As indicated in Table 1, no statistically significant association was found between environmental attitude and the preference for paper over other materials.
Descriptively, paper/cardboard remained the dominant option overall, accounting for approximately 59% of responses, while glass represented about 38%. Plastic and metal together accounted for less than 4% of responses. Within individual attitude categories, the paper reached its highest share among respondents who were strongly engaged and among those motivated by trends and benefits, accounting for approximately 64% of responses in both groups. Even in the no-interest group, responses were split evenly between paper and other materials. Within the analyzed sample, preference for paper therefore appeared to be broadly shared across respondents with different types of environmental attitude.
5. Perceived most eco-friendly packaging material for food products across age-based groups
The analysis of the perceived most eco-friendly packaging material for food products was based on three age-based groups: Gen Z, Gen Y, and 45+, with the latter created by merging the original 45–60 and 61+ categories. Packaging materials were again reduced to twocategories:PaperandOther(glass,metal, and plastic).Thiswastheonlyrelationshipin the analysis that proved statistically significant (Table 1), with a weak-to-moderate association.
At the descriptive level, paper accounted for 54.93% of responses among Gen Z, 46.15% among Gen Y, and 74.60% among the 45+ group. By contrast, other materials accountedfor45.07%ofresponsesamongGenZ,53.85%amongGenY,and25.40%among the45+group. Within theanalyzed sample, older respondents thereforeshowed amarkedly stronger preference for paper, whereas younger respondents more often selected other materials, especially glass.
The results therefore show that age groups differ statistically significantly in their choice of the most eco-friendly packaging, with older respondents showing a stronger
preference for paper. These interpretations cannot be understood as direct evidence, but rather as one of the possible frameworks for meaningfully interpreting the observed differences between age groups.
Overall, the contingency analyses showed that most of the differences suggested by thedescriptiveresultswerenotstatisticallyconfirmed.Withintheanalyzedsample,theonly statisticallysignificantassociationwasfoundbetweentheage-basedgroupandtheperceived most eco-friendly packaging material for food products. The following section discusses these findings in relation to previous research and the broader context of consumer perceptions of sustainable packaging.
Discussion
Thefindings ofthesecondaryanalysis indicatethe veryfavorableperception ofpaper and cardboard as the "most eco-friendly" packaging material, strong support for replacing plastics with paper packaging, and a rather cautious willingness to pay extra for more ecofriendly packaging. The relationship between age and the material perceived as most ecofriendlyprovedtobestatisticallysignificant.Olderrespondentsaged45+preferpapermore strongly, whileyoungercohorts aremorelikely toaccept glass and othermaterials. In terms of attitudes towards sustainability, packaging perception frequency, and willingness to pay more, generational differences in our sample were not statistically significant. However, at a descriptive level, there are slight shifts towards greater attention among older groups.
The strong symbolic position of paper corresponds to previous international findings. Otto et al. (2021) show that consumers evaluate the sustainability of packaging primarily basedonits"naturalappearance,"recyclability,andeaseofdisposal,oftenconsideringpaper tobeanenvironmentallyfriendlymaterial,whileunderestimatingplasticandoverestimating glassandbiodegradableplastics.OloyedeandLignou(2021)confirmthatpaperisperceived asthe"right"ecologicalchoice,butconsumersalsorecognizeitsfunctionallimitations.Our results, apositiveimage ofpaper,but also an awareness ofits weaknesses, complement this picture.Designplaysarolehere:accordingtoSteenis et al. (2017),therightcombinationof materials and graphics can increase a product's overall rating.
When it comes to willingness to pay more for eco-friendly packaging, our sample appears rathercautious; most respondents do not completely reject paying more, but remain neutral or only slightly positive. This corresponds to foreign findings on the "attitude–behavior gap." Herrmann et al. (2022) show that consumers only pay more for packaging that they clearly perceive as sustainable, while price sensitivity remains high. Duarte et al. (2024) add that purchase intent depends on a combination of willingness to pay extra, perceived benefits, and overall attitude toward sustainability. At the same time, research pointstopersistentinformationuncertainty.Consumersoftendonotunderstandmaterialsor labels (Boz et al., 2020; Norton et al., 2022; Chirilli et al., 2022), which makes the neutral or hesitant attitudes in our sample understandable.
A specific contribution of our paper is the placement of the results in the Slovak and post-socialist context. Research by Holotová et al. (2020) shows growing environmental awareness among Slovakconsumers,but also persistent barriers, including priceand habits. According to Kádeková et al. (2020), young Slovak consumers (under 25 years of age, approximately Gen Z) are more sensitive to packaging, which significantly influences their purchasingdecisions.GenerationsYandZ arealsothemostreflective oftheneed toreduce packaging. They are likely to prefer returnable or fully recyclable solutions in the future, with older generations also supporting these efforts (Smolka et al., 2021). The longitudinal study by Kopaničová et al. (2025) confirms that interest in sustainability, including packaging, is growing significantly among Generations X and Y, with Generation X
showing slightly greater concern for packaging sustainability, and women being more sensitivetothisissuethanmen.Horská et al. (2023)addthattheiGeneration(approximately Gen Z) is more likely to support recyclable packaging and to follow information on packaging than older cohorts, although the differences are not explicit.
Thepresentfindingsarebroadlycompatiblewiththisliterature,butonlypartly.Within the analyzed sample, a strong preference for paper as the most eco-friendly material was observed across all groups, with the clearest preference among respondents aged 45+. One possible interpretation of this age-related pattern is that older respondents may associate paper with familiarity, practicality, and reliability. In the Slovak and post-socialist context, such preferences may also reflect broader life experience shaped by thriftiness, reuse, and material durability. As Fehérváry (2009) suggested regarding the material culture of socialism, consumption practices were tied not only to product availability but also to ideas of order, modesty, and utility. Although the present data do not allow this interpretation to be tested directly, they suggest that differences in paper preferences may be linked not only to current sustainability discourse, but also to longer-term consumer habits and value orientations.
At the same time, price remains an important limiting factor in the practical adoption of more sustainable packaging. This is consistent with the representative Conzoomer 2023 survey, which foundthat approximately 70%of consumersswitched to cheaperoptions due to inflation and that 71% consistently compared prices. In this context, a favorable environmental image alone may not be sufficient. More sustainable packaging must also withstand the price pressure households face, which helps explain why willingness to pay more remained cautious in the analyzed sample.
From a practical perspective, the future of paper packaging should be considered in the broader context of material innovation, functional performance, and circularity. Althoughpaperisperceivedpositivelybyconsumers,itswideradoptiondependsonwhether itcanmeetbarrier,durability,andpricerequirementsalongsideenvironmentalexpectations. This is consistent with current work on innovative coated paper packaging, which emphasizes that functional performance and circularity must be addressed together (Nitkiewicz et al., 2024). At the same time, developments in the packaging industry show thatthisfieldisalreadyevolvingthroughconcretesolutions.Theseincludealternativefiberbased approaches such as Releaf Paper (Releaf Paper, 2025), which uses fallen leaves as a cellulose source, as well as broader material alternatives such as the Slovak bioplastic NonOilen®(NonOilen,2025).Furtherexamplesincludepaper-basedpackaginginnovations developedbycompaniessuchasAlbéaandToppanPrinting,whichillustrateongoingefforts to reduce plastic content, improve usability, and enhance environmental performance (Albéa,2024;ToppanPrinting,2020).Inaddition,market-orientedsourcesindicategrowing interest in eco-friendly packaging and renewable materials, including paper and other alternatives such as bamboo, algae, corn starch, mushroom fibers, bioplastics, and cellulose films (Chen, 2024; Plant Based Products Council, 2021). In this sense, the transition from plastic to paper packaging should not be understood solely as a symbolic ecological preference, but also as a technological and economic challenge, grounded in practical feasibility.
Overall,thefindingssuggestthatpaperpackagingoccupiesastrongsymbolicposition in consumer perceptions, but that does not guarantee behavioral change. Its practical potentialappearsgreatestwhenconsumersperceiveitasenvironmentallyfriendly,whenthe packaging meets functional expectations, and when the price premium remains acceptable. In this respect, the transition from plastic to paper packaging depends not only on attitudes
but also on the interaction of environmental communication, material performance, and affordability.
The limitation of the research is that we analyze a nonprobability sample of 186 respondents and use only secondary, aggregated data. The results should therefore be understood as an exploratory view of how Slovak consumers in our sample frame perceive paper packaging and sustainability. Future research should build on this by using representative data collection, adding objective knowledge indicators (e.g., a test of correct estimation of the environmental impact of materials), and experimentally verifying whether better information or specific innovations (e.g., paper from leaves or local bioplastics) actually change real purchasing behavior.
CONCLUSION
Theaimofthispaperwastoexamineselectedrelationshipsbetweenage-basedgroups, environmental attitudes, and consumer perceptions of paper packaging, with particular attentiontotheperceivedmosteco-friendlypackagingmaterial,willingnesstopaymorefor eco-friendlypackaging,andattitudestowardsthetransitionfromplastictopaperpackaging.
Regarding the analytical research questions, only one statistically significant association was confirmed in the analyzed sample: the relationship between age groups and the perceived most eco-friendly packaging material for food products. Respondents aged 45+selectedpapermoreoften,whereasyoungergroupsmorefrequentlychoseglassorother materials. By contrast, the relationships between age-based groups and environmental attitudes, willingness to pay more for eco-friendly packaging, and perceptions of the transition from plastic to paper packaging were not statistically confirmed. Likewise, no statisticallysignificantassociationwasfoundbetweenenvironmentalattitudesandpreferred eco-friendly packaging material.
The findings indicate that paper and cardboard were most often perceived as the most environmentally friendly packaging materials in the analyzed sample, whereas plastic was rarely viewed in this way. At the same time, the results suggest that the positive symbolic position of paper does not automatically translate into a clear willingness to pay more. Consumerevaluationofpackaging,therefore,dependsnotonlyonenvironmentalimagebut also on functional properties and affordability.
The contribution of the paper lies in extending the original descriptive processing of the dataset through contingency analysis and chi-square testing, while also placing the findingsintheSlovakcontextofsustainablepackagingperception. Inthisrespect,thestudy provides an exploratory insight into how paper packaging is perceived across the analyzed sample and shows that age-based differences are primarily evident in the choice of the material considered most eco-friendly.
Although the findings cannot be generalized to the population as a whole, due to the non-probability nature of the sample and the use of secondary aggregated data, they offer a useful basis for further research. Future studies could build on this by using representative sampling, incorporating measures of objective knowledge about packaging materials, and testing whether better information or packaging innovations influence actual purchasing behavior.
REFERENCES
Albéa, 2024. Sustainability Report.URL: http://www.albea-group.com
Amberg, N., Fogarassy, C., 2019. Green Consumer Behavior in the Cosmetics Market. Resources 8, 137. https://doi.org/10.3390/resources8030137
Boz, Z., Korhonen, V., Sand, C.K., 2020. Consumer considerations for the implementation of sustainable packaging: A review. Sustainability 12, 2192. https://doi.org/10.3390/su12062192
Cinelli,P.,Coltelli,M.B.,Signori,F.,Morganti,P.,Lazzeri,A., 2019.CosmeticPackagingtoSave the Environment: Future Perspectives. Cosmetics 6, 26. https://doi.org/10.3390/cosmetics6020026
Cochran, W. G., 1954. Some methods for strengthening the common χ² tests. Biometrics 10, 417–451. https://doi.org/10.2307/3001616
Conzoomer, 2023. Conzoomer 2023: Slovak consumer. Bratislava: 2muse. Internal research report [Slovenský spotrebiteľ. Bratislava: 2muse. Interný výskumný report].
Dimock, M., 2019. Where Millennials end and Generation Z begins. Washington, D.C.: Pew Research Center. URL: https://www.pewresearch.org/short-reads/2019/01/17/wheremillennials-end-and-generation-z-begins/.
Duarte, P., Silva, S.C., Roza, A.S., Dias, J.C., 2024. Enhancing consumer purchase intentions for sustainablepackagingproducts:Anin-depthanalysisofkeydeterminantsandstrategicinsights. Sustainable Futures, 7, 100193. https://doi.org/10.1016/j.sftr.2024.100193
Drobac, J., Alivojvodić, V., 2020. Green face of packaging – Sustainability issues of the cosmetic industry packaging. MATEC Web of Conferences 318, 01022. https://doi.org/10.1051/matecconf/202031801022
Fehérváry, K., 2009. Goods and states: The political logic of state-socialist material culture. Comparative Studies in Society and History 51, 426–459. https://doi.org/10.1017/S0010417509000188
Herrmann, C., Rhein, S., Sträter, K.F., 2022. Consumers’ sustainability-related perception of and willingness-to-pay for food packaging alternatives. Resources, Conservation and Recycling, 181, 106219. https://doi.org/10.1016/j.resconrec.2022.106219
Holotová, M., Nagyová, Ľ., Holota, T., 2020. The impact of environmental responsibility on changingconsumerbehaviour–sustainablemarketinSlovakia.Economics&Sociology,13(3), pp.84–96. https://doi.org/10.14254/2071-789X.2020/13-3/6
Holčíková, L., 2025. Paper as a packaging material – consumer perception and trends. Diploma thesis. Zvolen: Technical University of Zvolen [Papier ako obalový materiál – vnímanie zo strany spotrebiteľa a trendy. Diplomová práca. Zvolen: Technická univerzita vo Zvolene]
Horská, E., Šedík, P., Mušinská, K., Savitskaya, T., Grinshpan, D., Kačániová, M., 2021. AcceptabilityofediblefoodpackaginginSlovakia:Acasestudyonyounggeneration.Frontiers in Sustainable Food Systems, 5, 720700. https://doi.org/10.3389/fsufs.2021.720700
Chen, Ch., 2024. What eco-materials will lead the cosmetic packaging market by 2025? URL https://beautipak.com/eco-materials-cosmetic-packaging-2025/ Chirilli, C., Molino, M., Torri, L., 2022.Consumers’ awareness, behavior and expectations for food packaging environmental sustainability: Influence of socio-demographic characteristics. Foods 11, 2388. https://doi.org/10.3390/foods11162388
Kádeková, Z., Košičiarová, I., Vavřečka, V., Džupina, M., 2020. The impact of packaging on consumer behavior in the private label market – The case of Slovak consumers under 25 years of age. Innovative Marketing 16, 62–73. https://doi.org/10.21511/im.16(3).2020.06
Kopaničová, J., Klepochová, D., Vokounová, D., Korčoková, M., 2025. Generational shifts in sustainableconsumption:AlongitudinalstudyofGenerationsXandYinSlovakia.Centraland Eastern Europe in the Changing Business Environment: Proceedings of the 25th International Joint Conference, pp.170–184. https://doi.org/10.53465/CEECBE.2025.9788022552257.170184
Kristanto, D.D., Nugraha, H., Purwanto, E., Leksono, F.B., 2024. Unveiling Indonesian coffee identity: Developing packaging designs aligned with Japanese trends. Proceedings of the InternationalConferenceonMultidisciplinaryStudies(ICoMSi2023),474–488.AtlantisPress. https://doi.org/10.2991/978-2-38476-228-6_39
Kroonenberg, P.M., Verbeek, A., 2018. The tale of Cochran’s rule: My contingency table has so manyexpected valuessmallerthan5, whatam Ito do?TheAmerican Statistician72, 175–183. https://doi.org/10.1080/00031305.2017.1286260
Lin, Y., Yang, S., Hanifah, H., Iqbal, Q., 2018. An exploratory study of consumer attitudes toward green cosmetics in the UK market. Administrative Sciences 8, 71. https://doi.org/10.3390/admsci8040071
Lindh,H.,Olsson,A.,Williams,H.2015.Consumerperceptionsoffoodpackaging:Contributingto or counteracting environmentally sustainable development? Packaging Technology and Science. https://doi.org/10.1002/pts.2184
Loučanová, E., Kalamárová, M., Parobek, J., 2017. The innovative approaches to packaging –Comparison analysis of intelligent and active packaging perceptions in Slovakia. Studia Universitatis „Vasile Goldis” Arad – Economics Series 27. https://doi.org/10.1515/sues-20170007
Loučanová,E.,Nosáľová,M.,Olšiaková,M.,2024.Greeninnovationsandgreenconsumersoriented toward a lifestyle connected with nature. Achieving sustainability in forest-based industry: Scientific book (pp. 19–33). WoodEMA. ISBN 978-953-8446-03-0.
Loučanová, E., Olšiaková, M., Štofková, J. 2022. Ecological innovation: Sustainable development in Slovakia. Sustainability, 14(19), 12620.
Młoda-Brylewska, K., Melski, K., 2024. The use of disposable packaging in the aspect of environmental protection in the assessment of consumers' opinions. https://doi.org/10.56091/CTQS.Innov-13
Najdený, M., 2019. Consumer behaviour of seniors visiting shopping malls – Case study from Bratislava (Slovakia) [online]. Prešov: University of Prešov. URL https://www.unipo.sk/public/media/33748/536CONSUMER%20BEHAVIOUR%20OF%20SENIORS%20VISITING%20SHOPPING%20M ALLS%20%20CASE%20STUDY%20FROM%20BRATISLAVA%20%28SLOVAKIA%29.pdf
Nitkiewicz, T., Wiszumirska, K., Jachimowski, A., Rychwalski, M., 2024. Managing circularity of packaging for food products – Carbon footprint assessment of innovative coated paper packaging. CTQS.Innov-14. https://doi.org/10.56091/CTQS.Innov-14
NMI–NationalMarketingInstitute,2004.LOHASSegmentationReflectsIncreasingSophistication of Sustainability Marketplace. URL: https://www.google.com/url?sa=t&source=web&rct=j&opi=89978449&url=https://faunalyti cs.org/wpcontent/uploads/2015/05/Citation887.pdf&ved=2ahUKEwj56rfH2YeHAxWb_rsIHc 9QCD MQFnoECBwQAQ&usg=AOvVaw29kcXDS5YUohuncQYK7ZQq / Norton, V., Waters, C., Oloyede, O.O., Lignou, S., 2022. Exploring consumers’ understanding and perception of sustainable food packaging in the UK. Foods 11, 3424. https://doi.org/10.3390/foods11213424
NonOilen., 2025. Bioplastic from Slovakia. URL: https://dev.nonoilen.com/sk/nonoilen/nonoilencyklus/ Oloyede, O.O. Lignou, S., 2021. Sustainable paper-based packaging: A consumer’s perspective. Foods 10, 1035. https://doi.org/10.3390/foods10051035 Otto, S., Strenger, M., Maier-Nöth, A. Schmid, M., 2021. Food packaging and sustainability –consumer perception vs. correlated scientific facts: A review. Journal of Cleaner Production, 298, 126733. https://doi.org/10.1016/j.jclepro.2021.126733
Plant Based Products Council, 2021. Consumer trends. URL https://pbpc.com/consumer-trends/ ProCarton,2025.EuropeanConsumerPackagingPerceptionsStudy:Anindependentassessmentof the importance of packaging sustainability on consumers’ purchasing decisions. URL https://www.issuu.com/procarton/docs/european_consumer_packaging_perceptions_study_20 25
R CORE TEAM, 2024. R: A language and environment for statistical computing [computer program]. Version 4.4. Vienna: R Foundation for Statistical Computing. Available from: https://cran.r-project.org
Releaf Paper, 2025. Releaf Paper – manufacturer of paper made from fallen leaves. URL: https://www.releaf-paper.com/
Resimović, L., Brozović, M. & Kovačević, D., 2022. Design of sustainable packaging for natural cosmetics. Journal of Applied Packaging Research 14, Article 2. https://doi.org/10.13131/japr/18078
Sharma, A., 2025. Paper Packaging Market Report 2025 (Global Edition), 8th ed., Report ID: CMR219565.Manufacturing & Construction.
Siddiqui, S. A., Profeta, A., Decker, T., Smetana, S., Menrad, K., 2023. Influencing Factors for Consumers’ Intention to Reduce Plastic Packaging in Different Groups of Fast-Moving Consumer Goods in Germany. Sustainability 15, 7625. https://doi.org/10.3390/su15097625
Smolka, S., Smolková, E., Vilčeková, L., 2021. Sustainability as a factor of changing marketing strategies based on the customers’ preferences in context of different generations in Slovakia. Marketing Science & Inspirations, 16, 2–12. https://doi.org/10.46286/msi.2021.16.3.1
Steenis,N.D.,vanHerpen,E.,vanderLans,I.A.,Ligthart,T.N.,vanTrijp,H.C.M.,2017.Consumer response to packaging design: The role of packaging materials and graphics in sustainability perceptions and product evaluations. Journal of Cleaner Production 162, 286–298. https://doi.org/10.1016/j.jclepro.2017.06.036
Štofkova, J., Štofko, S., Loučanova, E., 2017: Possibilities of using e-learning system of education at universities. INTED2017 proceedings (pp. 6965-6972). IATED. THE JAMOVI PROJECT, 2024. jamovi [computer program]. Version 2.6. URL: https://www.jamovi.org
Toppan Printing, 2020. Toppan develops paper‑based tube pouch. Packaging Europe. URL: https://packagingeurope.com/toppan-develops-paper-based-tube-pouch/6585.article
ACKNOWLEDGMENT
This work was supported by the Slovak Research and Development Agency under the Contract no. APVV-23-0022 and the Scientific Grant Agency of the Ministry of Education, Research, Development and Youth of the Slovak Republic Grant No. 1/0513/25 and Grant No 1/0161/26.
AUTHORS’ ADDRESS
Ing. Martina Nosáľová, PhD.
Ing. Hana Maťová, PhD.
Technical University in Zvolen, Faculty of Wood Sciences and Technology Department of Marketing, Trade and World Forestry
T. G. Masaryka 24, 960 01 Zvolen, Slovakia nosalova@tuzvo.sk matova@tuzvo.sk
ACTA FACULTATIS XYLOLOGIAE ZVOLEN, 68(1): 105 120, 2026
Zvolen, Technická univerzita vo Zvolene
DOI: 10.17423/afx.2026.68.1.09
BENCHMARKING OF ENTERPRISES IN THE WOODPROCESSING SECTOR WITH OTHER SECTORS OF THE NATIONAL ECONOMY IN THECONTEXT OF IMPROVING THEIR PERFORMANCE THROUGH QUALITY MANAGEMENT SYSTEMS
Pavol Gejdoš – Jarmila Schmidtová
ABSTRACT
The aim of this paper is to analyze the performance of enterprises operating in the woodprocessing sector relative to those in other sectors of the national economy, with particular emphasis on the role of quality management systems in enhancing efficiency, competitiveness, and sustainability. The research is based on a quantitative analysis of selected performance indicators, such as revenues from own production, economic results, labor productivity, and sales profitability. Significant differences in the implementation of quality management systems across sectors of the national economy and within the woodprocessing industry are revealed by the findings. Moreover, the positive impact of these systemsonenterpriseperformanceisconfirmedbytheresults.Keyfactorsforthesuccessful implementation of quality management systems are identified and recommendations for strategicdecision-makinginthefieldofperformanceimprovementareprovidedinthepaper.
Keywords: performance; quality; quality management system; wood processing industry
INTRODUCTION
Currently, the business environment is facing increasing pressure to enhance efficiency, competitiveness, and sustainability.In this context, qualitymanagement systems are becoming a key tool for achieving strategic goals across various sectors of the national economy. Several authors (Ali and Rahmat, 2010; Lin and Jang, 2008) argue that quality management systems have the potential not only to increase an organization's competitiveness and efficiency, but also to improve product quality and overall organizational performance. Petrick (2017) states that the goal of implementing quality management systems is to reduce costs, deliver outstanding-quality services, achieve customer satisfaction, and enhance competitiveness. The focus of the research on industrial enterprises stems from their key role in the Slovak Republic's economic structure and their significantpotentialforimplementingqualitymanagementtechniques.Anargumentinfavor of this targeted focus on industrial enterprises is the particular attention given to companies in the wood-processing industry, which have historically formed an important segment of Slovak industry. These enterprises utilize the only domestic renewable natural resource –wood-, making them astrategically important sector not onlyfrom an economicperspective butalsofromasustainabilityperspective.Theirspecificpositionandenvironmentallinkage
also create space for applying quality management techniques to increase competitiveness and reduce negative environmental impacts.
AccordingtoGambi et al. (2021),benchmarkingisaneffectivemethodforcomparing enterpriseperformance, enabling theidentification ofbest practices and areas with potential for improvement. The use of benchmarking, combined with an analysis of the implementation of quality management systems, provides a comprehensive view of how these systems influence the performance of enterprises in the wood-processing sector compared to other industries.
Theaimofthispaperistoexaminethedifferencesinperformancebetweenenterprises in the wood-processing industry and those in other sectors of the national economy, with particular attention given to the role of quality management systems and their relationship to improving business performance. The research is based on a quantitative analysis of selected performance indicators, which enables an objective assessment of the impact of management quality on business outcomes.
To verify our assumption, the following research questions (RQ) were formulated: RQ1:Docompaniesinthewood-processingindustryrankamongthemostprofitablesectors within industrial enterprises in Slovakia? RQ2: Do companies in the wood-processing industry rank among the sectors with the highest labor productivity within industrial enterprises in Slovakia? RQ3: Are there differences in the use of the quality management techniques among industrial enterprises across various sectors in Slovakia?
In this analysis, quality management techniques are understood as a set of methods, tools, models, approaches, and philosophies aimed at improving the quality of processes, products, and services, enhancing customer satisfaction, and thereby contributing to the overall performance improvement of the enterprise.
The quality management system, often referred to as QMS, is a set of internal rules defined by a collection of policies, processes, documented procedures, and records (ISO 9001:2015). The international ISO standard requires that the adoption of a quality management system be a strategic decision of the organization. The design and implementation of the organization's quality management system are influenced by various factors, including its objectives, the products it provides, the processes it uses, and its size and structure (Fonseca et al., 2022). As noted by Elwardi et al. (2021) and Ribeiro et al. (2019), the ISO 9001 standard outlines the criteria for a quality management system in organizations that aim to consistently deliver products that meet applicable regulations and customerexpectations,whilealsoseekingto enhancecustomersatisfaction. ISO9000isthe most well-known and widely used quality management system (Ilkay and Aslan, 2017). It can be used by any institution, company, or organization, regardless of its size or field of activity (Bekele and Zewedie, 2017). This international standard encourages organizations to apply a process-based approach when designing, implementing, and enhancing the performance of a quality management system. By doing so, organizations can effectively manage the connections and dependencies between system processes, leading to improved overall organizational performance (Su et al., 2020). The main objective of ISO 9001 is to identify a set of requirements and practices that can be applied to organizations and institutions, regardless of the products or services they provide.
Theroots ofTotal Quality Management (TQM)can betraced back to theearly 1920s, when statistical theory was first applied to product quality control in manufacturing (Chen et al., 2022). This concept further evolved in the late 1940s and early 1950s, largely thanks to American engineers working in post-war Japan, especially W. Edwards Deming, Joseph M. Juran, and Armand V. Feigenbaum. Interest in TQM peaked in the early 1990s, but by the mid-1990s, its popularity began to decline in many developed countries as it was
gradually replaced by the ISO 9000 standard. In recent years, however, many companies have returned to TQM principles in search of effective models for achieving competitive success(Zaidi&Ahmad2020).TQMisamanagementphilosophythatfocusesoncontinual improvement of customer value by systematically designing and refining organizational processes and systems. It has been widely adopted as a strategic approach to enhance organizational performance and achieve competitive advantage (Babu and Thomas, 2021). Mehralian et al. (2017)statethatTQMisamanagementapproachthatenablesorganizations to effectively and efficiently meet the needs and expectations of stakeholders without compromising ethical values. TQM can be described as a management system centered on customer satisfaction, involving the active participation of all employees in ongoing improvement efforts. According to Alawag et al. (2020), a fundamental definition of TQM highlights it as a long-term management strategy aimed at achieving success through consistently meeting customer needs. It focuses on improving quality through the involvement of all members of the organization, aiming for long-term success through customersatisfactionandbenefitsforallorganizationalmembers(Fadera,2020).According to Kisel'akova et al. (2020), the primary aim of the process is to enhance the quality of an organization's output continuously improving its internal operations.
Sales are a key quantitative indicator of a company's production performance. Its amount, especially from sales of own outputs and goods, serves as a fundamental indicator of the company's efficiency and market success (Zalai et al., 2013). The economic result is anintegralindicatorofacompany'soveralleconomicperformance,reflectingthedifference between revenues and expenses. Its value is crucial for the return on investment for entities that participate in the company's share capital (Kotulič et al., 2018). Labor productivity is the most effective indicator of how efficiently human resources are utilized within a company. Based on the level of labor productivity, it is possible to assess the technological and organizational maturity oftheenterprise (Lisý et al., 2011). Among the basic indicators of a company's profitability are returns.
A preferred metric is Return on Sales (ROS), which expresses the efficiency of converting sales into profit (Zalai et al., 2013).This indicator provides insight into thecosteffectiveness of a company's operations and is defined as the ratio between economic result and sales (Kráľovič and Vlachynský, 2011).
Quality management systems have a significant and complex impact on business performance,whichisreflectedinkeyeconomicindicatorssuchassales,laborproductivity, and profitability. By implementing systematic, standardized procedures, a company improves the coordination of its processes, thereby achieving a more stable, higher-quality product or service (Lamine and Lakhal, 2018). Higher quality leads to more satisfied customers, a reduction in the number of complaints, and the strengthening of market trust, which subsequently translates into sales growth (Attia, 2016). In addition to their direct impact on revenues, quality management systems also increase labor productivity. Clearly defined responsibilities, work procedures, and control points eliminate unnecessary downtime, duplicate activities, and the disorder that often arises in non‑standardized work environments.Atthesametime,risingsalesand higherproductivitystrengthenprofitability and enable the company to achieve sustainable long‑term economic results (Kumar et al., 2018). Profitability therefore increases not only from higher sales but also from consistent cost savings and the more efficient use of financial, material, and human resources.
The main contribution of the work is benchmarking and examining performance differences between companies in the wood-processing industry and its individual subsectors,namelythefurnitureindustry,thepulpandpaperindustry,andthewoodworking industry, and companies in other sectors of the national economy, with special emphasis on
the role of quality management systems and their relationship to improving corporate performance.
MATERIALS AND METHODS
The paper preparation process was carried out in several stages. Initially, a literature review was performed of scholarly papers written by experts who have explored the relevant topic. For the actual data collection in quantitative research, a standardized questionnaire survey was used. It was conducted from the end of April to the beginning of June 2025 via the Google Forms online platform. The questionnaire was distributed to industrial enterprises in Slovakia, classified according to NACE, through individual email contacts. The link to the questionnaire is as follows: https://docs.google.com/forms/d/e/1FAIpQLSe01NVN7mLnMjC7Lw8b2bpzBhtriSTz4Hu rZKUJLWCkULrvA/viewform?usp=header A total of 3 585 companies were contacted, andtheresponseratewas11%.Aquestionnairewasdevelopedcontainingvariousquestions about the company, such as its size, financial performance, capital structure, and aspects relatedtotheimplementationofqualitymanagementsystems-forexample,whycompanies implement QMS, which methods and tools they use, what benefits they are able to identify fromusingQMS,whatproblemshavetheyidentifiedinconnectionwiththeimplementation of the QMS and similar aspects. Our primary aim was to gather information on the application of quality management techniques as well as the motivations for adopting these systems and thebenefits theybring. Following this, research questions were formulated and analysedthecollectedresponsesusingselectedstatisticaltechniques.Theresearchquestions wereformulatedbased on theoretical assumptions grounded in theideathat companies with high demands on the technologies they use, as well as sophisticated and automated management systems, including quality management systems will achieve better performanceasmeasuredbyindicatorssuchasreturnonsalesandlaborproductivity.Atthe sametime,ourintentionwastocomparethesubsectorsofthewood-processingindustrywith other sectors of the national economy and to confirm the assumption that there are differencesintheuseofqualitymanagementtechniquesamongindustrialenterprisesacross various sectors in Slovakia. Our findings were compared with those of other researchers studying the same issue, which allowed us to gain deeper insights and place our results in a broader context. Finally, conclusions were drawn and future directions for our research was proposed.
To determine the necessary sample size, a formula for a population of the finite size according to Yamane Taro (Lind, 2020) was followed.
To determine the population size of manufacturing enterprises, the information database of the Statistical Office of the Slovak Republic for the year 2025 was used as the reference source. To evaluate the representativeness of the research sample in terms of industry affiliation and enterprise size category, the Chi-square goodness-of-fit test and Pearson’s Chi-square test of independence were used. To determine the Chi-square level (χ²), the following formula was used
To evaluate the economic indicators, the theory of time series was applied. A time series is understood as a chronologically ordered sequence of data that are comparable in terms of content and location, referring to any quantitative random variable. For the decomposition of the time series, only the trend component will be applied, using a linear function with time t = 1, 2, ... n. Such a function of the form:
The parameter β₀ in the linear model is called the intercept constant, indicating the pointwheretheregressionlineintersectsthey-axis.Theparameterβ₁iscalledtheregression coefficient and represents the slope of the regression line. It shows the change in the mean value of the dependent variable Y corresponding to a one-unit increase in the independent variable t.
AllstatisticalanalyseswerecarriedoutusingsoftwareSTATISTICA14.Inhypothesis testing, an alpha level of 0.05 has traditionally been used as the decision rule. The output tables were edited in Microsoft Excel.
Forthepurposesofacomparativeanalysisoftheperformanceofindustrialenterprises, data from the Statistical Yearbooks of Industry of the Slovak Republic published by the Statistical Office of the Slovak Republic for the period 2014–2023 were analyzed. The selection of indicators was based on their availability, informative value, and relevance for evaluating performance within the SK NACE classification – Section C: Manufacturing.
To determine the minimum sample size, a formula for the finite population according to Yamane Taro (Lind, 2020) was applied. With a target population size of 3585 units and the selected error e = 0.05 was the minimum sample size derived as:
Since the target population was segmented by industry, a stratified sampling method was used to maintain the sample’s representativeness. Ultimately, 405 questionnaires were completed correctly and deemed suitable for analysis. To verify representativeness, the chisquare goodness-of-fit test was used. This test determines whether the distribution of observedfrequenciesinthesamplesignificantlydiffersfromtheexpecteddistributioninthe population. The testing was based on the null hypothesis that there is no statistically significantdifferencebetweentheobservedfrequencies(thestructureofthesample)andthe expected frequencies (the structure of the entire population). The results of the representativeness testing based on the industry structure of manufacturing enterprises (categorized according to the SK NACE classification) confirmed that the research sample represents and corresponds to the structure of the entire population and can therefore be considered representative (Tab. 1).
Tab. 1 Results of the representativeness testing according to the SK NACE classification. Industry sector
χ2 = 19 34 sv =15 p =0 199
RESULTS AND DISCUSSION
The results of time series analysis and the performance of industrial enterprises in Slovakia are presented in the next part. Tab.2 presents revenues from own performance and goods, categorized according to the SK NACE classification. As shown in the table, the automotive industry sector clearly dominates this indicator. The lowest revenues among the sectors are generated by the pharmaceutical industry, clothing and textile manufacturing, leather production, wood processing, and furniture manufacturing. A very similar pattern is observedintheindicatorofprofitbeforetax(Fig.1andFig.2),wheretheautomotivesector, metal processing, and the production of rubber and plastic products again dominate. Furniture manufacturing recorded a loss throughout the observed period, while the pharmaceutical industry, textile and clothing manufacturing, leather production, and wood processing sectors showed slight profits.
Tab. 2 Sales from own performance and goods in thousands of euros (€) according to SK NACE.
Fig. 1 Profit before tax by industry sectors according to SK NACE*, in €.
Fig. 2 Profit before tax by industry sectors according to SK NACE*, in €.
*SK NACE 10-11 - Food and beverage production, SK NACE 13-14 - Manufacture of textiles and wearing apparel, SK NACE 15 - Manufacture of leather and related products, SK NACE 16 - Manufacture of wood and of products of wood and cork, except furniture, SK NACE 17 - Manufacture of paper and paper products, SK NACE 20 - Manufacture of chemicals and chemical products, SK NACE 21 - Manufacture of basic pharmaceutical products, SK NACE 22Manufactureofrubberandplasticproducts,SKNACE23-Manufactureofothernon-metallicmineralproducts,SKNACE 24 - Manufacture of basic metals, SK NACE 25 - Manufacture of fabricated metal products, SK NACE 26 - Manufacture of computer, electronic and optical products, SK NACE 27 - Manufacture of electrical equipment, SK NACE 28Manufacture of machinery and equipment, SK NACE 29 - Manufacture of motor vehicles, trailers and semi-trailers, SK NACE 31 - Manufacture of furniture, SK NACE 32 - Other manufacturing
The first research question examined whether the wood-processing industry sector belongs among the most profitable sectors within industrial enterprises in Slovakia. From the data analysis (Tab. 3), we can conclude that, based on the Return on Sales indicator, the most profitable industrial sector in the Slovak Republic is the manufacture of rubber and plastic products (SK NACE 22). Above-average performance is also achieved by the manufacture of metal structures (SK NACE 25), other manufacturing (SK NACE 32), and the manufacture of textiles and apparel (SK NACE 13 and 14). Within the specific characteristicsofthewood-processingindustry(NACE16,17, and31),thepaperandpaper products sector is among the higher-performing sectors. However, performance has not yet reached levels from the pre-COVID period. On the other hand, the worst-performing sector
based on the Return on Sales indicator is the manufacture of furniture (SK NACE 31), which in the observed period shows negative values or values very close to zero
Tab. 3 Indicator Return on Sales in % by SK NACE.
SKNACE
10-112,40%2,01%4,05%2,54%3,34%3,02%3,77%4,27%3,98%4,85% 13-144,58%5,05%5,52%6,35%6,51%5,52%0,71%7,63%6,14%5,68% 154,03%3,54%3,67%3,24%3,59%2,85%2,26%3,66%3,69%1,31% 162,43%1,48%2,65%3,02%3,67%4,17%6,11%8,29%5,26%0,91% 176,24%9,95%11,00%9,50%10,92%8,35%4,73%2,57%3,49%1,47% 200,05%6,50%3,07%4,89%-0,05%2,45%4,53%3,62%8,18%1,10% 2113,40%8,68%2,99%2,73%6,19%3,61%7,49%8,18%5,94%11,06% 2211,13%10,88%11,37%8,86%7,95%7,15%8,14%7,72%7,59%8,79% 235,04%5,32%6,48%7,82%5,58%6,24%5,48%6,30%6,27%7,02% 243,33%5,00%7,65%8,15%7,22%-0,59%-0,05%15,05%9,81%1,41% 254,56%4,04%4,96%4,25%4,16%3,45%4,26%4,79%5,27%5,84% 263,29%3,61%3,17%3,34%4,09%2,34%2,97%3,65%2,93%3,80% 273,23%3,76%2,82%3,14%4,31%2,16%2,40%1,78%1,73%2,09% 283,83%4,26%4,99%4,06%4,59%4,37%3,73%5,21%3,02%2,27% 293,66%3,12%3,36%3,09%2,94%3,04%1,87%2,65%2,35%2,72% 31-5,06%-1,54%-0,68%2,89%-1,16%0,07%-1,00%-0,27%0,02%-2,88% 325,83%3,89%7,04%5,83%4,17%6,22%6,89%5,50%4,78%5,67%
Tab. 4 Resultsof the statistical significance testing of the trendby individual industry sectors according to SK NACE for the indicator “Return on Sales”.
ThetimeseriesanalysisusedtheindicatorReturnonSales.Basedontheresultsofthe time series analysis (Tab. 4), it can be stated that the parameters of the linear trend model for the indicator “Return on Sales” are statistically significant at the 5% significance level inthefollowingsectors:foodandbeverageproduction(p=0.005),paperandpaperproducts manufacturing(p=0.012),rubberandplasticproductsmanufacturing(p=0.011),electrical equipment manufacturing (p = 0.018), and motor vehicles, trailers, and semi-trailers manufacturing (p = 0.012). In the remaining analyzed sectors, the parameters of the linear model are not statistically significant, indicating that modeling sales profitability with a straight line is not appropriate.
Fig. 3 illustrates the linear trend model (y=11.73-0.89t) of the development of the “Return on Sales” indicator in the wood-processing industry sectors in Slovakia Based on the value of the regression coefficient b₁, it can be stated that in the paper manufacturing sector, sales profitability decreases on average by 0.89% per year. In the other sectors, the parameters are not statistically significant, which means that modeling sales profitability using a linear trend is not appropriate.
Fig. 3 Linear trend model of the development for SK NACE 16. 17. and 31 for the indicator “Return on Sales” .
The second research question examined whether the wood-processing industry sector belongs among the sectors with the highest Labor Productivity within industrial enterprises in Slovakia. For the labor productivity indicator, the manufacture of motor vehicles trailers, and semi-trailers (SK NACE 29) and the manufacture of computer, electronic and optical products (SK NACE 26) clearly dominate. From the perspective of labor productivity, the worst-rated sectors include the manufacture of textiles and apparel (SK NACE 13 and 14), which, compared to the most productive sector in this indicator, achieves approximately seven times lower values (Tab. 5). The wood-processing industry sectors are among the stableones in this indicator.showing agrowthtrend.Amongtheseanalyzed sectors,thepulp and paper industry again stands out as the most productive, achieving approximately 1.5 times the performance of wood processing and about twice that of the furniture manufacturing sector.
Tab. 5 Indicator Labor Productivity per Employee in € by SK NACE.
For the indicator Labor Productivity, the time-series analysis (Tab. 6) revealed a statistically significant trend in most observed sectors. Significance at the 5% level was confirmed, for example, in the food and beverage manufacturing sector (p = 0.000), textile and clothing manufacturing (p = 0.000), furniture manufacturing (p = 0.003), as well as in other sectors such as paper manufacturing, chemical products, rubber and plastic products, electrical equipment, machinery and equipment, and motor vehicles. These results indicate a consistent development of labor productivity over time, which can be reliably modeled using a linear trend.
Tab 6 Resultsof the statistical significance testing of the trendby individual industry sectors according to SK NACE for the indicator “Labor Productivity”.
Fig. 3 illustrates the linear trend model of the development of the “Labor Productivity” indicator in the wood-processing industry sectors in Slovakia. Based on the values of the regression coefficient b₁ (Fig. 4), it can be stated that in the wood-processing sector, employee labor productivity shows an average annual increase of 6804€ (y=87,098+6,804t; in the paper manufacturing sector, an average increase of 6938€ (y=184,053+6,938t); and in the furniture manufacturing sector, an average increase of 4240€ (y=60,182+4,240t) per year. These values represent the slopes of the trend lines, which quantify the rate of productivity growth in the respective sectors.
Fig. 4 Linear trend model of the development for SK NACE 16. 17. and 31 for the indicator “Labor Productivity”.
The third research question (RQ3) focused on determining whether there are statistically significant differences in the extent of use of quality management techniques across industrial enterprises operating in different sectors in Slovakia. For the analysis, the data were adjusted to allow classification and selection of enterprises based on the extent of their implementation of quality management techniques (QMT). In the paper, enterprises with a higher level of usage are considered those that apply two or more quality management tools. Conversely, enterprises using only one or none of the tools were classified into the lower-implementation category. As illustrated in Fig. 5, the level of use of quality management techniques varies significantly across industrial sectors. The red dashed line at the 50% level serves as a reference threshold, allowing for quick visual identification of sectors with above-average or below-average implementation of quality management techniques.
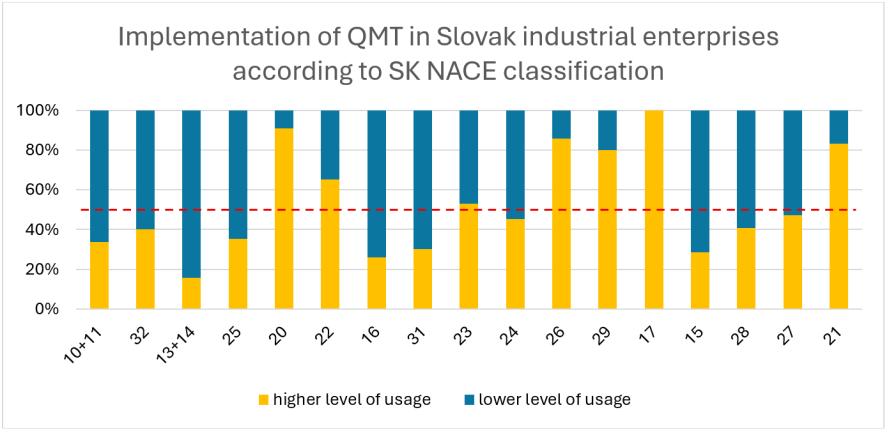
Fig. 5 Implementation of QMT in Slovak industrial enterprises according to SK NACE classification.
To verify the statistical significance of differences in the extent of using quality management techniques among individual industrial sectors. Pearson's Chi-square test was applied (Tab. 7). The test results showed that the null hypothesis was rejected at the 5% significance level. The p-value = 0.000 confirms that there is a statistically significant relationship between the two examined variables. The degree of dependence expressed by the contingency coefficient reached a value of 0.38. which can be interpreted as a moderate strength of the relationship.
Tab. 7 Results of Pearson chi-square test of contingency - Using Quality Management Techniques versus Industrial Sector.
From theperspectiveofsectoral structure, thesectors with thegreatest extent ofusing qualitymanagementtechniquesincludethosewithveryhightechnologicalcomplexity,strict legislative and regulatory requirements, a strong emphasis on product safety and reliability, andintensecompetitioninglobalmarkets.Therefore,intheseindustrialsectors,asystematic and continuous approach to quality management is practically a necessity. Quality plays a strategic and existential role here, as reflected in the more intensive implementation of quality techniques.
The first research question examined whether companies operating in the woodprocessing industry rank among the most profitable industrial enterprises in Slovakia. The resultsshowthatseveralinterconnectedfactorsmaybedrivingthedeclineinreturnon sales across many Slovak industrial sectors. First and foremost, the COVID-19 pandemic disruptedsupplychains,causedproductionoutages,andledtosharpfluctuationsindemand. Thesecondsignificantfactorwastheenergycrisis,which,followingtheoutbreakofthewar in Ukraine, has led to a steep rise in energy prices, especially gas and electricity, as key inputs for a large part of industrial production. Slovakia, as an energy-intensive economy, faced extreme cost pressures, significantly reducing business profitability. In addition to its impactonenergymarkets,thewarinUkrainealsocausedrawmaterialshortages,restrictions on exports to eastern markets, and further geopolitical tensions, all of which reduced companies’ willingness to invest and expand. These factors resulted in high inflation and tighter monetary policy. Another important factor is the weakening of global demand. Slowing economic growth among Slovakia’s main trading partners led to a decrease in orders and demand for Slovak exports. Besides these factors, we can also identify others, such as increasing social and tax burdens on businesses, rising costs, particularly strong pressure to raise wages, and transportation and other expenses, which companies, amid growing competition, cannot always pass on to product prices. Similar conclusions were reached by Sharma (2022), who argued that capital structure and managerial efficiency positivelyimpactprofitability.Similarly,YolandaandYanti(2022)arguethatcompanysize and management efficiency positively affect return on sales. The authors, Sahabuddin and KhanSynthia(2020),intheirscientificstudy,statethatwagecosts,industry-specificfactors (market concentration), and macroeconomic factors (inflation) significantly influence the profitability of manufacturing companies.
The second research question examined whether companies operating in the woodprocessing industry rank among the highest labor productivity industrial enterprises in Slovakia. Labor productivity in the Slovak industry shows significant intersectoral differences.Amongthesectorswiththehighestlaborproductivityaretheautomotive,metal processing, and chemical industries. These sectors are characterized by a high degree of automation and robotization, as well as strong integration into global supply chains. capitalintensive production with high efficiency. and a strong focus on research, which translates into higher labor efficiency and greater added value per employee.
At the opposite end of the spectrum are sectors with the lowest labor productivity, including the textile and clothing industry, leather goods manufacturing, and wood processing and furniture production. These sectors are characterized by a high share of manual labor, lower levels of technological modernization and automation, lower product
valueadded, and often a dependenceon cheap labor.These differences highlight structural imbalances within the industrial sector and indicate that increasing labor productivity is not merely a matter of individual employee performance but primarily the result of a systemic approach to production modernization, digitalization, and strategic human resource management. According to Kim et al. (2019), five main factors influence productivity growth: innovation, education, market efficiency, infrastructure, and institutional factors. They also state that these factors carry different weights depending on regional conditions. A similar study was conducted by Vu and Nguyen (2024) in Vietnamese enterprises, and they found that labor productivity is mainly influenced by technical equipment and wage costs. Ganguly (2024) emphasizes that, in addition to traditional factors (education, skills, wages), the impact on productivity is changing due to labor market flexibilization and production digitalization, while also highlighting the influence of labor market regulation and investment in technology
The third research question focused on whether there are statistically significant differences in the extent of use of quality management techniques across industrial enterprises operating in different sectors in Slovakia. The analyses' conclusions provide empirical support for the answers and assumptions of RQ3, indicating that there is a significantdifferenceintheextentofuseofqualitymanagementtechniquesacrossindustrial enterprises from different sectors in Slovakia. The research also revealed that some sectors systematicallyimplementqualitytools,whileotherscontinuetoexhibitarelativelylowlevel of their utilization. The observed differences may result from several factors, such as the technological complexity of production, regulatory and normative requirements, customer and supply chain pressure, or the level of market competition.
Despite positive trends in certain industries, the research also highlighted that many sectors still include enterprises that refuse to implement quality management systems. This indicates that there remain considerable room and potential within the Slovak industry for broader and more intensive adoption and implementation of these systems, particularly to improve performance and competitiveness. Similar findings have been reported by several authors who examined the use of quality management tools across various manufacturing sectors. Gambi et al. (2021) identified sectoral differences in the degree of quality tool implementation,dependingoncompanysizeandproductiontype.Garza-Reyes et al. (2015) and Attia (2016) emphasized the importance of organizational culture and managerial approach in decisions regarding the adoption of quality systems. Tarí et al. (2020) stressed thatthesuccessfulimplementationofqualitytoolsdependsnotonlyontechnicalfactorsbut also on strategic and human factors.
CONCLUSION
Performance disparities between companies in the wood-processing sector and those operating in other sectors of the national economy are analyzed in the paper focusing particularly on how business performance is enhanced by quality management systems. Inconclusion,thefindingsindicatethatenterprisesimplementingqualitymanagement techniques achieve superior performance outcomes, as measured by Return on sales and laborproductivity.Significantdifferenceswereobservedacrossindustries.Thesedisparities are also evident when considering firm size, with a general trend suggesting that smaller enterprises exhibit lower interest in adopting quality management techniques. The woodprocessing sector is among the traditional and regionally significant branches of the Slovak economy;however,despitetheseadvantages,enterprisesoperatinginthisindustryhavelong
recorded lower performance indicators than those in the most productive sectors of the Slovak economy. One of the fundamental reasons for this lower performance is the sector’s structural focus on processing primary raw materials and producing semi-finished goods with low added value. Consequently, the Return on sales in wood-processing enterprises remains lower than in industries characterized by higher technological and innovation intensity. Another significant factor is the relatively low level of technological modernization and automation of production processes. Compared to high-tech industries, enterprises in the wood-processing sector are less likely to implement robotic lines, digital productioncontrolsystems,orIndustry4.0principles.Thesectoralsofacesthechallengeof a fragmented size structure, as it is dominated by small- and medium-sized enterprises with limitedcapitalresourcesandlimitedcapacitytoundertakeextensivemodernizationprojects. A closer look at individual subsectors of the wood-processing industry in Slovakia reveals that performance is not uniform across subsectors. The lowest profitability and labor productivity are recorded by enterprises engaged in primary wood processing. Furniture manufacturing companies achieve slightly better results, while the highest performance is observed in the paper production sector. It follows that improving the performance of the wood-processingsectorrequiresasystematicshiftfromprocessingprimaryrawmaterialsto producing final products with higher added value, strengthening investments in automation and digitalization, and enhancing energy and process efficiency. A key prerequisite is also thesupportofresearchanddevelopmentactivitiesandtheimplementationofmodernquality management techniques, which will enable Slovak wood-processing enterprises to increase their competitiveness within the European context.
For future research, it is recommended to expand the sample to include more enterprises or to include companies from other countries to conduct international comparative analyses. It would also be appropriate to monitor long‑term developmental trends through longitudinal studies, which would allow for a more precise identification of causal relationships between the implementation of quality management systems and techniques and changes in performance indicators. Further research could focus on a more detailed examination of specific factors influencing business performance, such as the level ofdigitalization, innovation activity, thequality of humancapital, organizational culture, or the degree of integration of sustainability principles into corporate strategies. A promising direction is also the analysis of synergistic effects arising from the combination of various quality management tools and their impact on the long‑term competitiveness of enterprises
REFERENCES
Alawag, A.M., Salah Alaloul, W , Liew, M.S., Al-Aidrous, A.-H.M.H., Saad, S., Ammad, S., 2020. Total Quality Management Practices and Adoption in Construction Industry Organizations: A Review. 2nd International Sustainability and Resilience Conference: Technology and Innovation in Building Designs (Article number 9319992). Ali,A.,Rahmat,H ,2010.TheperformancemeasurementofconstructionprojectsmanagedbyISOcertified contractors in Malaysia. Journal of Retail & Leisure Property, 2010, 9(1), 25–35. Attia,A.M ,2016.Effectofqualitymanagementonsupplychainandorganisationalperformancein theEgyptiantextileindustry.Internationaljournalofbusinessperformancemanagement,17(2). 198–222, https://doi.org/10.1504/IJBPM.2016.075549
Babu. F., Thomas. S., 2021. Quality management practices as a driver of employee satisfaction: exploring the mediating role of organizational image. International Journal of Quality and Service Sciences 13(1). 157 – 174. https://doi.org/10.1108/IJQSS-10-2019-0124
Bekele, E., Zewedie, S., 2017. The Impacts of ISO 9001:2008 Implementation on Employees Job Satisfaction. Global Journal of Management and Business Research: Administration and Management, 17(3). 35-44, https://doi.org/10.1287/orsc.14.6.720.24873
Elwardi,B.,Meddaoui,A.,Mouchtachi,A., En-nhaili,A.,2021.Towardsanewmaturitymodelof industrial performance improvement based on ISO 9001: version 2015 and VDA6.3: version 2016. International Journal of Process Management and Benchmarking. 11(3). https://doi.org/10.1504/IJPMB.2021.115013
Fader,P.,2020.Customercentricity:Focusontherightcustomersforstrategicadvantage.University of Pennsylvania Press, 150 p., ISBN 978-1-61363-102-7.
Fonseca,L.,Domingues,P.,Nóvoa,H.,Simpson,P.,dosSáJ.G.,2022.“ISO9001:2015:TheView From the Conformity Assessment Community.” Total Quality Management & Business Excellence 34(5–6), 558–579s, https://doi.org/10.1080/14783363.2022.2073212.
Gambi,L.D.N.,Lizarelli,F.L.,Junior,A.R.R.,Boer,H.,2021.Theimpactofqualitymanagement practices on innovation: an empirical research study of Brazilian manufacturing companies. Benchmarking: An International Journal. 28 (3). 1059–1082. https://doi.org/10.1108/BIJ-042020-0168
Ganguly, C., 2024. Industry-specific determinants and their effect on workers' productivity in organizedmanufacturingsectorofIndia.TheJournalofInstituteofPublicEnterprise.47(1).1–20.
Chen, C.K., Reyes, L., Dahlgaard, J., Dahlgaard-Park, S.M., 2022. From quality control to TQM, service quality and service sciences: a 30-year review of TQM literature. International Journal of Quality and Service Sciences, 14(2), 217-237, https://doi.org/10.1108/IJQSS-09-2021-0128
Ilkay, M., Aslan, E., 2017. The Effect of the ISO 9001 Quality Management System on the Performance of SMEs. International Journal of Quality & Reliability Management, 29(7), 758778s, https://doi.org/10.1108/02656711211258517
ISO 9000: 2015: Quality management principles. ISO, Geneva, Switzerland. ISBN 978-92-6710650-2
Kim, Y. E., Loayza, N. V., Meza-Cuadra, C. M., 2019. Productivity growth: Patterns and determinants across the world. World Bank Policy Research Working Paper No. 8852. https://doi.org/10.1596/1813-9450-8852
Kisel'akova, D , Hairul, H., Gallo, P , Gallo, P, Cabinova, V , Onuferova, E , 2020. Total quality management as managerial competitiveness in enterprises worldwide. Polish Journal of Management Studies. 21(2). 195-209. https://doi.org/10.17512/pjms.2020.21.2.14
Kotulič, R., Király, P., Rajčaniová, M., 2018. Financial analysis of the company [Finančná analýza podniku], 3. vyd. Bratislava: Wolters Kluwer s. r. o., 2018. 232 s, ISBN 978-80-8168-888-1. Královič, J., Vlachynský, K., 2011. Financial management [Finančný manažment], 3. vyd Bratislava: Iura Edition, spol. s r. o., 2011. 468 s, ISBN 978-80-8078-356-3
Kumar, P , Maiti, J , Gunasekaran, A., 2018. Impact of quality management systems on firm performance, International Journal of Quality & Reliability Management, 35(5), 1034-1059, https://doi.org/10.1108/IJQRM-02-2017-0030
Lamine, K , Lakhal, L. 2018. Impact of TQM/Six Sigma practices on company’s performance: Tunisiancontext,InternationalJournalofQuality&ReliabilityManagement,35(9),1881-1906, https://doi.org/10.1108/IJQRM-05-2017-0097
Lin, C., Jang, W , 2008. Successful ISO 9000 implementation in Taiwan. International Journal of Productivity and Performance Management, 57(8), 600-622s, https://doi.org/10.1108/17410400810916044
Lind, D. A., 2020. Statistical Techniques in Business and Economics. McGraw-Hill. 880. Lisý, J. a kol. 2011.Economy [Ekonómia], 1. vyd. Bratislava: Iura Edition, spol. s r. o., 2011. 631s, ISBN 978-80-8078-406-5.
Mehralian, G., Nazari, J.A., Nooriparto, G., Rasekh, H.R., 2017. TQM and organizational performance using the balanced scorecard approach. International Journal of Productivity and Performance Management, 66(1), 111-125, https://doi.org/10.1108/IJPPM-08-2015-0114
Petrick, J., 2017. Total quality in managing human resources. Routledge. 388s, ISBN: 9781884015243
Ribeiro, L.H.M.D., Beijo, L.A., Salgado, E.G., Nogueira, D.A., 2019. Modelling of ISO 9001 certifications for the American countries: a Bayesian approach. Total Quality Management & Business excellence. 32(11-12). p.1290-1315. https://doi.org/10.1080/14783363.2019.1696672.
Sahabuddin, M., Khan, Synthia, S., 2020. Determinants of Firm Profitability: Evidences from Bangladeshi Manufacturing Industry. The Economics and Finance Letters. 7(2). 189–199. https://doi.org/10.18488/journal.29.2020.72.189.199
Sharma, I., 2022. Determinants of profitability: A study on ceramic industry in Bangladesh. Journal of Business and Entrepreneurship. 10(2). 161–169. https://doi.org/10.46273/jobe.v10i2.319
Su, HC., Kao, TW., Linderman, K., 2020. Where in the supply chain network does ISO 9001 improve firm productivity? European Journal of Operational Research. 283(2). 530-540. https://doi.org/10.1016/j.ejor.2019.11.042
Vu, H.P., Nguyen, D.T., 2024. Factors Affecting Labor Productivity in Manufacturing Enterprises in Vinh Phuc Province. Vietnam. Revista de Gestão Social e Ambiental. 18(6). e05145. https://doi.org/10.24857/rgsa.v18n6-040
Yolanda, Yanti., 2022. Factors affecting profitability in manufacturing sector. EAI Endorsed Transactions on Industrial Engineering Applications. 9(34). e1. https://doi.org/10.4108/eai.510-2022.2325855
Zaidi, Z.M., Ahmad, N., 2020. Total quality management (TQM) practices and operational performanceinmanufacturingcompany.ResearchinManagementofTechnologyandBusiness, 1(1), 13-27, https://doi.org/10.30880/rmtb.2020.01.01.002
Zalai, K., 2013. Financial and economic analysis of the company [Finančno-ekonomická analýza podniku], 8. vyd. Bratislava: Sprint 2 s. r. o., 2013. 471, ISBN 978-89393-80-0.
ACKNOWLEDGMENT
This contribution is part of the work on the project VEGA no. 1/0111/26 “Research on the potential of utilizing quality management approaches in industrial enterprises with a specific focus on the woodworking and furniture industry in the context of increasing their competitiveness.”
AUTHORS’ ADDRESSES
Ing. Pavol Gejdoš . PhD.
Technical University in Zvolen
Faculty of Wood Sciences and Technology. Department of Business Economics
T. G. Masaryka 24. 960 01 Zvolen. Slovakia gejdosp@tuzvo.sk
Mgr. Jarmila Schmidtová. PhD.
Technical University in Zvolen
Faculty of Wood Science and Technology. Department of Mathematics and Descriptive Geometry T.G. Masaryka 24, 960 01 Zvolen. Slovakia jarmila.schmidtova@tuzvo.sk
ACTA FACULTATIS XYLOLOGIAE ZVOLEN, 68(1): 121 133, 2026
Zvolen, Technická univerzita vo Zvolene
DOI: 10.17423/afx.2026.68.1.10
EVALUATION OF CONSUMER PREFERENCES AND SATISFACTION IN A FURNITURE RETAIL CHAIN: A CASE STUDY FROM SLOVAKIA
Miriam Olšiaková
ABSTRACT
This paperpresents the results ofa survey focused on customerpreferences and satisfaction levels within the furniture retail chain JYSK. The survey was conducted among 320 respondents across Slovakia, with a predominant representation from the Banská Bystrica region due to the sampling technique. Data collection focused on identifying the most frequently purchased product types, the preferred purchase method, the most common way of gaining information about retailers' offers and assessing satisfaction with key criteria: product availability in the store, staff expertise, store layout, product assortment, payment options,anddeliveryservices.Thestudysimultaneouslyidentifiesthemaindeterminantsof customer satisfaction and reveals current trends in the furniture retail market. This practical knowledge provides valuable guidance for optimizing marketing strategies, improving customer service, and adapting the product portfolio to meet consumer expectations and requirements as much as possible.
Keywords: furniture; retail chain; customer satisfaction; regression analysis; ANOVA
INTRODUCTION
Consumer behavior is the process by which individuals or households search for, evaluate,purchase,use,anddisposeofproductstosatisfytheirneeds(Solomon et al.,2014). This general process is also particularly relevant in the furniture segment, where highervalue products are usually offered, associated with long-term use and strong aesthetic and functional qualities. Buying furniture requires decision-making with a significant degree of involvement,wherenotonlyrationalfactors(price,quality,functionality)butalsoemotional factors, such as design, brand, or recommendations from acquaintances, play a significant role (Kotler and Keller, 2015).
Previous research shows that customer behavior in the furniture segment is changing in response to digitalization and the growth of online sales (Li et al., 2020; Zhang et al., 2022; Liu, 2023). Customers often combine online and offline channels they search for information onlinebut maketheir final decision in abrick-and-mortarstore, wherethey can physically try out the product (Wulandari and Jajuli, 2022). This trend of omnichannel shopping behavior is characteristic of chains such as JYSK and IKEA and requires harmonizing marketing activities across all channels.
Both aforementioned companies operate extensively in the Slovak furniture retail market, which is highly concentrated and dominated by major international players. In
addition to JYSK and IKEA, other key competitors in the multi-channel segment include globalchainssuchasMöbelixandXXXLutz.Thismarketenvironmentishighlycompetitive across all eight administrative regions of Slovakia, forcing retailers to constantly optimize their 7P marketing mix to maintain market share and effectively address the specific preferences of local consumers. Therefore, the Slovak market represents an interesting research setting due to its high presence of international furniture chains and rapidly developing omnichannel retail environment.
Inthiscompetitiveenvironment,retailersemployacomprehensivesetoftacticaltools to shape consumer behavior, integrated into the extended 7P marketing mix model (Kwok et al., 2020; Kusdiana and Yulita, 2024).
The marketing mix used in furniture sales consists of the following tools: product, price, place, promotion, people, processes, and physical evidence (Senna Ayrdelan and Ridanasti, 2024). The following elements are included:
• Product: quality of materials, furniture assortment, design, and additional services (assembly of the furniture, transport, guarantees);
• Price: pricing policy, discounts, perceived value, price/quality ratio;
• Promotion: various forms of communication with consumers (advertising, website, social networks, Public Relations and many others);
• Place: store location, online sales, logistics;
• People: staff, their experience, approach to customers;
• Processes: ordering, purchasing, complaint handling, and product delivery;
• Physical evidence: store layout, atmosphere, cleanliness, visual presentation.
Effective management of the 7P elements directly shapes the overall customer experience and consequently their level of satisfaction.
Understanding customer satisfaction is essential because it directly affects loyalty, repurchase intentions, and overall market performance. Therefore, understanding and satisfying consumer needs represents a fundamental prerequisite for long-term competitiveness (Girsang and Faadhil, 2025).
Most existing studies examine consumer behaviour and satisfaction in the furniture industry in relation to sustainability, the impact of digital platforms on purchase intentions, and the symbolic dimensions of furniture as a tool for identity expression (Yu et al., 2023; Pirc Barčić et al., 2021; Kim and Jin, 2019; Hakala et al., 2015). Despite the existing literature, there is a significant research gap specifically focused on the multidimensional interaction between consumer demographics and the complex perception of the 7P marketing mix within international furniture chains. Current studies often overlook how specific demographic segments prioritize individual attributes such as “physical evidence” or “processes” in an omnichannel environment. Filling this gap is essential for developing more targeted and effective marketing strategies in highly competitive markets.
Considering JYSK's strategic position in the furniture market and its extensive multichannelpresence,itisessentialtounderstandhowvariousaspectsofitsofferandoperational processes contribute to customer satisfaction. Specifically, focusing on purchasing preferences within product categories and identifying the lowest- and highest-satisfaction areas(suchaslogistics,complaints,orproductquality)willallowfortheformulationofkey strategic recommendations to improve the effectiveness of the company's marketing activities and increase overall customer satisfaction.
The scientific objective of this paper is to analyze the interrelationships between customer demographics and purchasing preferences, and to identify key determinants of
satisfaction within thefurnitureretail segment. Furthermore, the study aims to quantifythe impact of specific service attributes on overall customer satisfaction using multivariate statistical methods.
MATERIALS AND METHODS
Theempirical part ofthe research was conductedusing aquantitativeapproach via an online questionnaire. The questionnaire was created in Google Forms and distributed from February 1 to April 20, 2025. The questionnaire was distributed primarily via social networks (Facebook and Instagram) using the nonprobability snowball sampling technique. Thismethodrequiresrespondentstocompletethequestionnaireandtosharethelinkfurther.
To ensure the generalizability of the findings, the minimum required sample size was determined. The sample size was determined at a 95 % confidence level, with a maximum permissiblemarginoferrorof6%andastandarddeviationof0.5.Basedonthesestatistical parameters,theminimumrequired samplesizewas calculatedat 267 respondents. Sincethe survey obtained 320 valid responses, the sample size is considered sufficient to ensure the reliability and generalizability of the findings.
The aim of the survey was to obtain a comprehensive overview of JYSK's customer preferences and to identify the level of their satisfaction with the examined variables. For this purpose, a structured questionnaire was compiled comprising 14 closed and open questions. The initial part of the questionnaire contained demographic data (gender, age category, region, and economic situation), which enabled a differentiated assessment of satisfaction across individual groups of respondents. A questionnaire designed in this way providesadetailedpictureofcustomersatisfactionwithindividualaspectsofthepurchasing process. It allows comparisons of ratings across different demographic groups, thereby enabling identification of segments with different expectations or levels of satisfaction. As part of the survey, the testing of the following hypotheses was performed:
H0:Thereisnostatisticallysignificantrelationshipbetweengenderandpreferredtype of product purchased.
H1: There is a statistically significant relationship between gender and preferred type of product purchased.
H0: Age has no significant effect on the preferred method of purchase (physical store vs. online shopping).
H1: Age has a significant effect on the preferred method of purchase (physical store vs. online shopping).
H0: There are no statistically significant differences between men and women across the analyzed satisfaction variables.
H1: There are statistically significant differences between men and women across the analyzed satisfaction variables.
The first two hypotheses were formulated to determine whether basic demographic characteristics (age and gender) influence customer behavior in the monitored retail chain JYSK. The choice of these variables is supported by the marketing literature, which identifies demographics as one of the basic segmentation criteria that can influence preferences, purchasing methods, and the types of products purchased.
Withinthishypothesis,theinfluenceofgenderonproducttypechoicewasexamined. The objective was to determine whether differences exist between men and women in the types of goods purchased at JYSK, namely furniture, accessories, or both.
When formulating this hypothesis, it was assumed that gender can influence the purpose of store visits, which can affect marketing activities aimed at segmentation, the selection of the offered assortment, or the adaptation of marketing communication to the target segment.
The aim of the second hypothesis was to determine whether age influences shopping channelpreference thatis,whethercustomersprefershoppinginabrick-and-mortarstore oronline.Informulatingthishypothesis,itwasassumedthatolderagegroupstendtoprefer the traditional way of shopping. At the same time, younger generations are more likely to use online channels for their purchases. The answer to this hypothesis also has practical significance: it allows retail chains to allocate resources between offline and online sales channels more effectively, optimize digital investments, adapt promotional formats to specific age segments, and better target marketing communications to preferred shopping channels.
These two hypotheses (the influence of gender on the preferred type of product purchased and the influence of age on the preferred method of purchase) are tested using regression analysis. It is one of the most frequently applied statistical methods for determiningthequantitativerelationshipbetween twoormore(independentanddependent) variables (Kaper and Engler, 2013; Kumari and Yadav, 2018).
This method allows these correlations to be measured while controlling for other variables that could affect the outcome. In both cases, regression analysis offers a robust frameworkforunderstandingtheserelationships;therefore,itisconsideredthemostsuitable method for testing the hypotheses.
Thequalityandexplanatorypowerofaregressionmodelarecommonlyassessedusing the coefficient of determination (R²). In general, higher R² values indicate better model fit, indicating that the selected predictors explain a greater proportion of the variance in the dependent variable (Xu et al., 2022).
The statistical significance of the regression models and the relationships between variables were assessed at the p < 0.05 level. The model fit was evaluated using the coefficient of determination (R²), and the influence of individual predictors was assessed through regression coefficients and their respective confidence intervals (Kwak, 2023; Evans, 2025).
The third hypothesis assumes that females and males may differ in how they perceive and evaluate individual aspects of the customer experience. Testing this hypothesis, therefore, allows us to determine whether there are differences between males and females in evaluating areas such as store availability, promotion methods, store orientation, staff expertise, or delivery times, or whether these evaluations are homogeneous across genders. Its confirmation or refutation has marketing significance it may indicate whether differentiated communication or service adjustments based on gender are necessary within the examined retail chain.
To formally test this hypothesis and verify differences between demographic groups, we used ANOVA (analysis of variance) and MANOVA (multivariate analysis of variance). Both are statistical methods used to test for statistically significant differences in the means ofgroupsdefinedbyoneormoreindependentcategoricalvariables(factors),suchasgender or age. It is also common practice in behavioral and social sciences to calculate statistical power a priori. This standard method allows one to determine in advance the necessary
sample size to detect the predicted effect size with the desired probability (Langenberg et al., 2023).
MANOVA is used to test whether a categorical variable (gender) has a statistically significant effect on the entire set of dependent satisfaction variables (e.g., product range, deliverytimes,etc.).TheWilkstestgeneratestheWilks'lambda(Λ)value,whichrepresents a measure of variability unexplained by differences between groups (Statistics How To, 2025).
Wilks' lambda is calculated as follows:
Where:
E – determinant of the matrix of sums of squares and products of error (within-group variability).
H - determinant of the matrix of sums of squares and products of the hypothesis (variability between groups).
If H is large relative to E, then |H + E| will be large relative to |E|. Thus, we will reject the null hypothesis if Wilks' lambda is small (close to zero) (The PSU, 2025).
If MANOVA confirmed statistical significance (rejection of the null hypothesis), ANOVA was followed to locate this effect in detail on the individual satisfaction variables. All presented statistical analyses and calculations were performed using the Statistica 14 software.
RESULTS AND DISCUSSION
320 respondents from diverse genders, ages, and socio-economic statuses across differentregionswereinvolvedinthesurvey.Regardingthecompositionoftherespondents, the sample was characterized by a higher representation of female respondents (54.7 %), aged 18-30 (33 %), who currently held the economic status "employed" (59.7 %), and who came primarily from the Banská Bystrica region (40 %).
To verify the representativeness of the research sample, a Chi-square (χ²) goodnessof-fit test was conducted. Given that the research hypotheses and subsequent analysis primarily focused on gender-based differences in purchasing behavior and satisfaction, gender was selected as the primary indicator. The observed distribution (145 males and 175 females) was compared with the official demographic data of the Slovak Republic. The results (χ² =1.25; p =0.264)indicatedno significant deviation from thegenderdistribution, confirming that the sample was structurally balanced and representative. Other variables, such as age, were included as secondary factors to provide additional context for the analyzed trends, ensuring a comprehensive view of the furniture retail segment.
Following the verification of the sample’s representativeness, the subsequent analysis focused on the empirical findings gathered from the questionnaire. The first part of the evaluation provided a descriptive overview of the primary research data, focusing on the fundamental aspects of the 7P marketing mix, such as promotion, product preferences, and price perception. These descriptive results established the necessary context for the more complex statistical testing ofthehypotheses presentedin thelatersections. To establish this baseline,theinitialpartoftheanalysisexaminedthecoreoperationalelementsofthebrand's market presence.
The introductory questions in the questionnaire focused on promotion and its evaluation as the primary source of information about JYSK and its offer, the products customers primarily purchased at JYSK, the preferred purchase method, and perceptions of prices compared to JYSK's competitors on the Slovak market:
• The main marketing communication tools through which respondents obtained information about JYSK and its products were television advertising, mentioned by up to 50% of respondents. Each of the remaining evaluated communication tools (radio advertising, leaflets, recommendations from acquaintances, website, and socialnetworks)receivedfewerthan5%ofresponses.Theevaluationofthequestion aimedattheinfluenceofcommunicationtoolsusedbyJYSKshowedthattraditional televisionadvertising,whichrepresentedtheprimarysourceofknowledge aboutthe brand, can still be considered the most effective promotional tool at the moment. Leaflets and personal recommendations also play a smaller, albeit significant role, while digital channels, such as Internet search engines and social networks, had an additional, but, given current trends, ever-increasing importance.
• Based on the evaluation of respondents' answers about the products they purchased in JYSK, 59.06 % of respondents bought accessories in the monitored chain. Cases inwhichthemainreasonforvisitingJYSKwastopurchaseonlyfurnitureaccounted for 29.69 %. The remaining 11.25 % were respondents who made a combined purchase (furniture and accessories). These findings validated that accessories are a key, highly frequent category with a dominant position in purchases, while the purchaseoffurniture(eitherseparatelyorin combination)concernsasmallerpartof customers. Therefore, JYSK needs to maintain a wide and attractive range of accessories to generate volume, while furniture is an important but less frequent category in complex home furnishing.
• The evaluation of the preferred shopping channel showed that the majority of JYSK customers prefer brick-and-mortar stores, with 53.75 % of respondents stating they shop exclusively in brick-and-mortar stores. A significant proportion, 31.87 % of respondents, prefer an omnichannel approach (using both shopping methods), while only 14.38 % of respondents shop exclusively online. These findings confirmed the continued dominance of brick-and-mortar stores in JYSK customers' shopping behavior,butalsohighlightedtheimportanceoftheonlineenvironmentandtheneed to effectively connect both channels for almost a third of the customer base.
• Respondents perceived prices in JYSK stores as primarily comparable to those of competitors (42.81 %). A significant proportion of respondents (31.87 %) were unabletocommentonthepricecomparison,indicatinglowpricesensitivityoralow priceorientationinthemarket.Ofthosewhodidcomment,theprevailingperception wasthatpriceswerelower(14.38%)thanthoseofitscompetitors,ratherthanhigher (10.94 %).Overall, these findings confirmedthat JYSK has successfully established itself in the mid-price segment and that its pricing strategy was acceptable to most customers and in line with the market offer.
While the descriptive analysis provided a general overview of customer preferences, price perception, and sales structure, the following sections present the results of testing the establishedhypothesesregardingtheinfluenceofdemographiccharacteristicsonpurchasing behavior. The first hypothesis aimed to evaluate the influence of gender on the type of product purchased at JYSK. This relationship was tested using regression analysis to determinethequantitativeeffect ofgender(independent predictor)on thetypeofpurchased
goods (dependent variable).The results oftheregression analysis are summarized in Table 1.
Tab.1 Results of regression analysis (influence of gender on type of product purchased).
Regression Summary
Dependent Variable
type of product purchased Independent Variable
R²
p-value (ANOVA) 0.817
Standardized Coefficient (β) –0.01
Conclusion
Gender does not influence the preferred type of product purchased
As shown in Table 1,, regression analysis was also used to determine whether respondents'genderaffectsthetypeofproductpurchasedatJYSK(i.e.,whetherthepurpose of visiting the chain under study is to purchase furniture, accessories, or both). The analysis shows that, based on the calculated values (F = 0.053; p = 0.817), the model is not statisticallysignificant.ThecoefficientofdeterminationR²=0.000168indicatesthatgender explains only 0.016 % of the variability in the type of product purchased; therefore, this demographic variable can be considered insignificant with respect to the type of product purchased. The adjusted R² is negative, indicating that the model does not explain more variabilitythanwouldbeexpectedbychance.Thebetacoefficientforthevariable“Gender” isverylow(b=–0.01)anditsp-valueissignificantlyabovethesignificancelevel(p>0.05). This means that gender has no statistically significant impact on whether customers buy furniture or accessories.
Tofurtherclarifywhichdemographiccharacteristicsmayshapeconsumerbehaviorin the studied retail chain, an additional regression model focusing on age was estimated. The detailed results from the performed regression analysis are presented in Table 2.
Tab.2 Results of regression analysis (influence of age on preferred purchasing method).
Regression Summary
Dependent Variable
(ANOVA)
Standardized Coefficient (β) –0.03
Conclusion
purchasing method
Age does not have a statistically significant effect on the preferred method of shopping
Regression analysis did not confirm that age has a significant effect on the preferred shoppingmethod(brick-and-mortarstoresvs.onlineshopping)withinJYSK.Themodeldid
not reach statistical significance (p=0.616), and theexplained variability was minimal (R² =0.00079). Age, therefore,does notappeartobeafactorthat influenceswhethercustomers prefer brick-and-mortar stores or online shopping. Shopping preferences in the case of the studied chain, which focused on thesaleoffurnitureand accessories, arethus influenced by other variables.
Prior to analyzing customer satisfaction, the reliability of the measurement scale was assessedusingCronbach’salpha.Instatisticalresearch,aCronbach’salphavalueabove0.70 is generally considered an acceptable threshold for internal consistency, while values exceeding 0.90 are regarded as excellent. In this study, the reliability analysis was applied to the multi-item scale measuring customer satisfaction across nine specific attributes (Promotion, Store Availability, Staff Expertise, In-Store Navigation, Product Range, Complaint Handling, Payment Options, Delivery Times, and Delivery Service). The resulting Cronbach’s alpha was 0.93, confirming that these items were internally consistent and provided a stable, highly reliable basis for evaluating the overall satisfaction profile.
In addition to a comprehensive evaluation of the questionnaire focused on JYSK customer preferences, the questionnaire was designed to test hypotheses identifying statisticaldependenciesintheinfluenceofselecteddemographicvariablesontheircustomer satisfaction with selected areas affecting their overall satisfaction. As part of the third hypothesis,weinvestigatedwhetherthereisastatisticallysignificantinfluenceofgenderon satisfactionwithselectedvariables,whicharePromotion,StoreAvailability,StaffExpertise and Behavior, In-Store Navigation, Product Range, Complaint Handling, Payment Options, Delivery Times, and Delivery Service, which have a significant impact on overall customer satisfaction and experience.
Since these variables are interrelated and form a complex satisfaction profile, multivariate analysis of variance (MANOVA) was used to test the effect of gender. This statistical procedure allows:
• Simultaneously assess differences between males and females in all monitored attributes of satisfaction.
• Take into account the mutual correlation among variables to minimize the risk of misinterpretation in multiple individual tests (e.g., several ANOVAs).
• Provide a comprehensive view of whether gender as an independent variable significantly influences the overall satisfaction profile.
Because customer satisfaction is an intricate concept that cannot be accurately evaluated by comparing individual variables in isolation without taking into account the others, the use of MANOVA is acceptable.
Tab.3 MANOVA results for the effect of gender on satisfaction with the observed satisfaction attributes.
As shown in Table 3, Wilks’ Lambda represents a measure of variability unexplained bydifferencesbetweengroups.Avalueclosetozeroreflectsgreaterdifferences.TheFvalue expresses the ratio of between-group variability to within-group variability. A high F value indicates large differences between groups relative to within-group variability. The calculated Wilks’ Lambda (0.097480) and F value (F ≈ 318), together with p < 0.001, confirm that gender has a statistically significant effect on the overall satisfaction profile.
However,thisresultindicatesonlythatthereisadifferenceintheoverallsatisfactionprofile anddoesnotidentifywhichspecificsatisfactionvariablecontributesmosttothisdifference. Therefore,inthesecond step,itwasnecessarytoperformunivariatetestsoftheinfluenceof individual variables. Theirinterpretation has adual purpose: to determinewhetherthereis a statistically significant difference between men and women for each of the nine satisfaction variables, and to identify which areas of satisfaction are most strongly affected.
Tab.4 Results of univariate ANOVA: Effect of gender on individual satisfaction variables.
Univariate ANOVA tests showed that all investigated satisfaction variables showed statistically significant differences between men and women (F values range from 1494 to 2131; p < 0.001). These results complement the MANOVA findings, which indicated a significant effect of gender on satisfaction ratings for the assessed attributes (Table 4).
Tab.5 Comparison of Males vs. Females Satisfaction Means.
(have lower average)
(averages are almost the same, but the difference is significant)
(the second biggest difference)
To more precisely identify the areas where differences in satisfaction arise, the averagevaluesoftheindividualsatisfactionvariablesformalesandfemales werecompared (Table5).Theresults showed that females weremoresatisfied in most oftheassessed areas (8 out of 9), especially regarding product range, complaint handling, delivery times, transport,staffexpertise,andbehavior.Minordifferencesemergedinstoreavailability,with the averages almost the same for both genders. The only attribute in which males showed higher satisfaction was the promotion.
These findings are fully consistent with the MANOVA results. While the MANOVA showedanoverallstatisticallysignificantdifferencebetweenthegenders,thecomparisonof the averages showed the specific direction and intensity of these differences for individual attributes. The average values thus complement the MANOVA result by revealing which areas contribute most to the overall difference in satisfaction.
Other authors have also examined customer satisfaction in the furniture sector, and their findings confirm the strategic orientation of our research. The study by Perić et al. (2010) identified the point of sale location as the most important factor in the purchase decision, with product selection and information rated equally highly. These findings confirm the strategic importance of store availability and product assortment, which were also addressed in this study.
The issue of customer satisfaction in the furniture sector was also addressed by Azizi et al. (2017). In theirresearch, theyfoundthat economicfactors,productspecifications, and trustworthiness have the greatest impact on customer satisfaction, while services and competencies are less important. Financial factors are decisive in consumer decisionmaking,indicatingthatsatisfactionwithfurniturepurchasesisprimarilyinfluencedbyprice, followedbyqualityandproductrange.Thisstudyidentifiedanotabledifference:inaglobal assessment, consumers attach little importance to processes, but in JYSK's specific retail environment, insufficient processes (complaints, logistics) are the strongest source of dissatisfaction and a key segmental differentiator.
A study by Balicka and Niedbała (2022) focuses on consumers' priorities when choosing furniture. Their findings show that design and aesthetics are the most influential factors influencing purchase decisions, while price prevails over quality. The aforementionedpreferencefordesignoverquality,combinedwithpricesensitivity,confirms JYSK's business model, which is based on affordable yet aesthetically appealing Scandinavian design.
Despitethesurvey'svaluableresults,thestudyhasseverallimitations.Futureresearch shouldaddressthelimitationsofnon-probabilitysnowballsamplingbyapplyingprobability sampling methods, thereby improving the generalizability of the findings to the broader customerbaseoftheinvestigatedJYSKcompany.Furthermore,futurestudiescouldexpand the analysis beyond demographic characteristics to include psychographic segmentation variables (e.g., lifestyleorlife-cyclestage),therebyfurtherincreasingtheexplanatoryvalue ofthefindingsandcontributingtoabetterunderstandingofcustomerbehaviorinthecontext of product strategy and omnichannel communication.
CONCLUSION
TheresultspresentedinthepaperprovideinsightintoJYSKcustomerpreferencesand satisfaction within selected areas. Descriptive analyses confirmed the importance of traditional promotional tools (especially television advertising), which remain the dominant source of information for this retail chain's customers. The purchase structure further
indicated that accessories are the core and most frequently purchased product category, highlighting their strategic importance in the company's assortment management. The quantitativeanalysisconductedrevealedkeyfindingsfortheJYSKretailchain,namelythat the influence of basic demographic variables (gender, age) is not a significant factor influencing purchasing behavior, manifested in the type of product purchased or the preferred method of purchase (physical store vs. online sales), which suggests that segmentation of purchasing behavior should be based primarily on psychographic factors, not demographic characteristics. While demographics appeared irrelevant to purchasing behavior,Wilks'test(MANOVA)confirmedthatgenderhasastrong,statisticallysignificant effect on the overall customer satisfaction profile. Detailed ANOVA revealed that women consistently show higher satisfaction across most monitored areas, with the largest segmentation differences occurring in critical processes such as complaint handling and assortment,whichrepresentsthestrongestareaforJYSKtooptimizeprocessesandservices by gender segmentation.
Although this study offers valuable insights, it is subject to several limitations that shouldbeacknowledged. First,theresearchfocusedexclusivelyonJYSKcustomers,which maylimitthegeneralizabilityoftheresultstothebroaderfurnituremarket. Second,thedata were collected via an online questionnaire using the snowball sampling technique, which canintroduceadegreeofself-selectionbiasamongrespondents.Finally,thestudyprimarily examined basic demographic factors, while other variables such as personality traits or specific lifestyle orientations were not included.
Future research could address these limitations by expanding the sample to include multiple international furniture retailers for a comparative analysis. Additionally, incorporating qualitative methods, such as in-depth interviews, could provide a more nuanced understanding of the underlying psychological drivers of customer satisfaction.
REFERENCES
Azizi, M., Dehghan, S.,Ziaie,M.,Mohebi, N.,2017.Identifyingthecustomer satisfactionfactorsin furniture market. Economics, Management and Sustainability, 2(1), 6-18. https://doi.org/10.14254/jems.2017.2-1.1
Balicka, A., Niedbała, M., 2022. Social factors affecting consumer decisions during purchasing furnitureinPoland.AnnalsofWarsawUniversityofLifeSciences–SGGWForestryandWood Technology 118, 22–34.
Evans, R., 2025. Understanding the interpretation of regression results. In Linear Regression Interpretation Deep Dive.Available at: https://www.econometricstutor.co.uk/linear-regressioninterpretation-of-regression-results [Accessed 24 November, 2025]
Girsang, N. M. D., Faadhil, F., 2025. Factors affecting consumer satisfaction. Journal of Education, Humaniora and Social Sciences 7(3). https://doi.org/10.34007/jehss.v7i3.2336
Hakala, I., Autio, M., Toppinen, A., 2015. Young Finnish and German consumers’ furniture acquisition – wooden, inherited or just low price? International Journal of Consumer Studies, 39(5), 445-451. https://doi.org/10.1111/ijcs.12189
Kaper, H.G., Engler, H., 2013. Mathematics and climate, 1st edn. ed. Society for Industrial and Applied Mathematics, Philadelphia.
Kim,N.L.,Jin,B.E.,2019.Whybuynewwhenonecanshare?Exploringcollaborativeconsumption motivations for consumer goods. International Journal of Consumer Studies, 44(2), 122-130. https://doi.org/10.1111/ijcs.12551
Kotler, P., Keller, K. L., 2015. Marketing management (15th ed., Global Ed.). Boston, MA: Pearson Education.
Kusdiana, Y., Yulita, R., 2024. The Role of marketing mix (7P) Strategy Towards Customer Satisfaction. INVEST: Jurnal Inovasi Bisnis dan Akuntansi 5(1), 9-16.
Kwak, S., 2023. Are only p-values less than 0.05 significant? A p-value greater than 0.05 is also significant! Journal of Lipid and Atherosclerosis, 12(2) 89–95. https://doi.org/10.12997/jla.2023.12.2.89
Kwok, L., Tang, Y., Yu, B., 2020. The 7 Ps marketing mix of home-sharing services: Mining travelers’ online reviews on Airbnb. International Journal of Hospitality Management, 90, Article 102616. https://doi.org/10.1016/j.ijhm.2020.102616
Langenberg, B., Janczyk, M., Koob, V., Kliegel, E., Mayer, A., 2023. A tutorial on using the paired t test for power calculations in repeated measures ANOVA with interactions. Behavior Research Method 55, 2467–2484. https://doi.org/10.3758/s13428-022-01902-8
Li, Y., Li, X., Zhang, Z., Zhang, G., Gong, M., 2020. Understanding Consumers Online Furniture PurchaseBehavior:AnUpdatedUTAUTPerspective.JournalofForestEconomics,35(4),267–303. https://doi.org/10.1561/112.00000516
Liu, S., 2023. Analysis of digital transformation of furniture market in the context of big data application.Proceedingsofthe3rdInternationalConferenceonSignalProcessingandMachine Learning (Article 0363). https://doi.org/10.54254/2755-2721/4/20230363
Perić, I., Bičanić, K., Pirc Barčić, A., Ojurović, R., Grladinović, T., 2010. Analysis of Customer Satisfaction in Furniture Market. Drvna Industrija 61(4), 251–258.
Pirc Barčić, A., Kitek Kuzman, M., Vergot, T., Grošelj, P., 2021. Monitoring consumer purchasing behavior for wood furniture before and during the COVID-19 pandemic. Forests, 12(7), 873. https://doi.org/10.3390/f12070873
Senna Ayrdelan, M. F., Ridanasti, E., 2024. Strategi Pemasaran Perusahaan Furniture CV. Orcard CollectionDalamMempertahankanUsahaFurniturePadaMasaPeralihanPandemiKeEndemi Covid-19. Journal of Economic, Bussines and Accounting (COSTING), 7(3), 478–489. https://doi.org/10.31539/costing.v7i4.10217
Solomon, M. R., Dahl, D. W., White, K., Zaichkowsky, J. L., Polegato, R., 2014. Consumer behaviour: Buying, having, and being (6th Canadian ed.). Toronto: Pearson Canada. Statistics How To., 2025. Wilks’ Lambda: Definition, Formula & Interpretation. Available at: https://www.statisticshowto.com/wilks-lambda/ [Accessed 24 November, 2025]
The Pennsylvania State University. (s. d.). STAT 505: Applied Multivariate Statistical Analysis, Lesson 8: Multivariate Analysis of Variance (MANOVA) - 8.3 Multivariate Test Statistics. [online].Availableat:https://online.stat.psu.edu/stat505/lesson/8/8.3 [Accessed24November, 2025]
Wulandari, R., Jajuli, A. S., 2022. The effects of omnichannel strategy on purchase intention in furniture companies. International Journal of Science and Management Studies (IJSMS), 5(6), 103–112. https://doi.org/10.51386/25815946/ijsms-v5i6p111
Xu, X., Du, H., Lian, Z., 2022. Discussion on regression analysis with small determination coefficient in human–environment researches. Indoor Air 32, e13117. https://doi.org/10.1111/ina.13117
Yu, C., Liu, W., Fei, Y., Chen, J., Hu, Z., 2023. Influencing factors of online furniture purchase behavior based on analytic hierarchy process. BioResources, 18(2), 2857 -2873. https://doi.org/10.15376/biores.18.2.2857-2873
Zhang,S.,Zhu,J.,Wang,G., Reng, S., andYan, H.,2022. Furniture online consumerexperience:A literature review, BioResources 17(1), 1627-1642.
ACKNOWLEDGMENT
The scientific paper was developed within the project VEGA 1/0513/25 Business model of innovations based on the principle of sustainability.
AUTHOR’S ADDRESS
Ing. Miriam Olšiaková, PhD. Technical University in Zvolen Faculty of Wood Sciences and Technology
T. G. Masaryka 24 960 01 Zvolen Slovakia olsiakova@tuzvo.sk