World Economic Journal – The New Global Economy | Preview | March–April 2026
Editor-in-Chief
Robert Gubernatorov
Editorial Team
Antoine Tigneres, Jonesha Smith, Anna Sokolidou, Usama Khan, Mohammed Ali Labchah, Victoria Soll, Julico Swanidze, Hakob Tarposhyan, Kirungero, Kamshat Zhumagulova
Design by Gera Lu
Editorial Office Address
World Economic Group Rambla de Catalunya 125, 3º 2ª 08008 Barcelona, Spain
Global publisher: World Economic Group Rambla de Catalunya 125, 3º 2ª 08008 Barcelona, Spain
Publisher in Central Asia and South Caucasus under WEJ license: “World Organization for Development” LLC 61, Kulatova str., Bishkek city, Kyrgyz Republic
Fonts: Adobe Fonts
ISSN 3082-0146 (online)
Depósito Legal: B-3749-2026
The journal is published since 2009. The journal is published on a monthly basis.
The authors’ opinions may differ from those of the editors. No part of this publication may be reproduced or used in any form without prior permission in writing from the editor.
No responsibility for the content of the advertising materials can be accepted by the editors. All the enclosures to the journal are made for publicity purposes.
For advertising please inquire: Tel.: +34 936 559 647
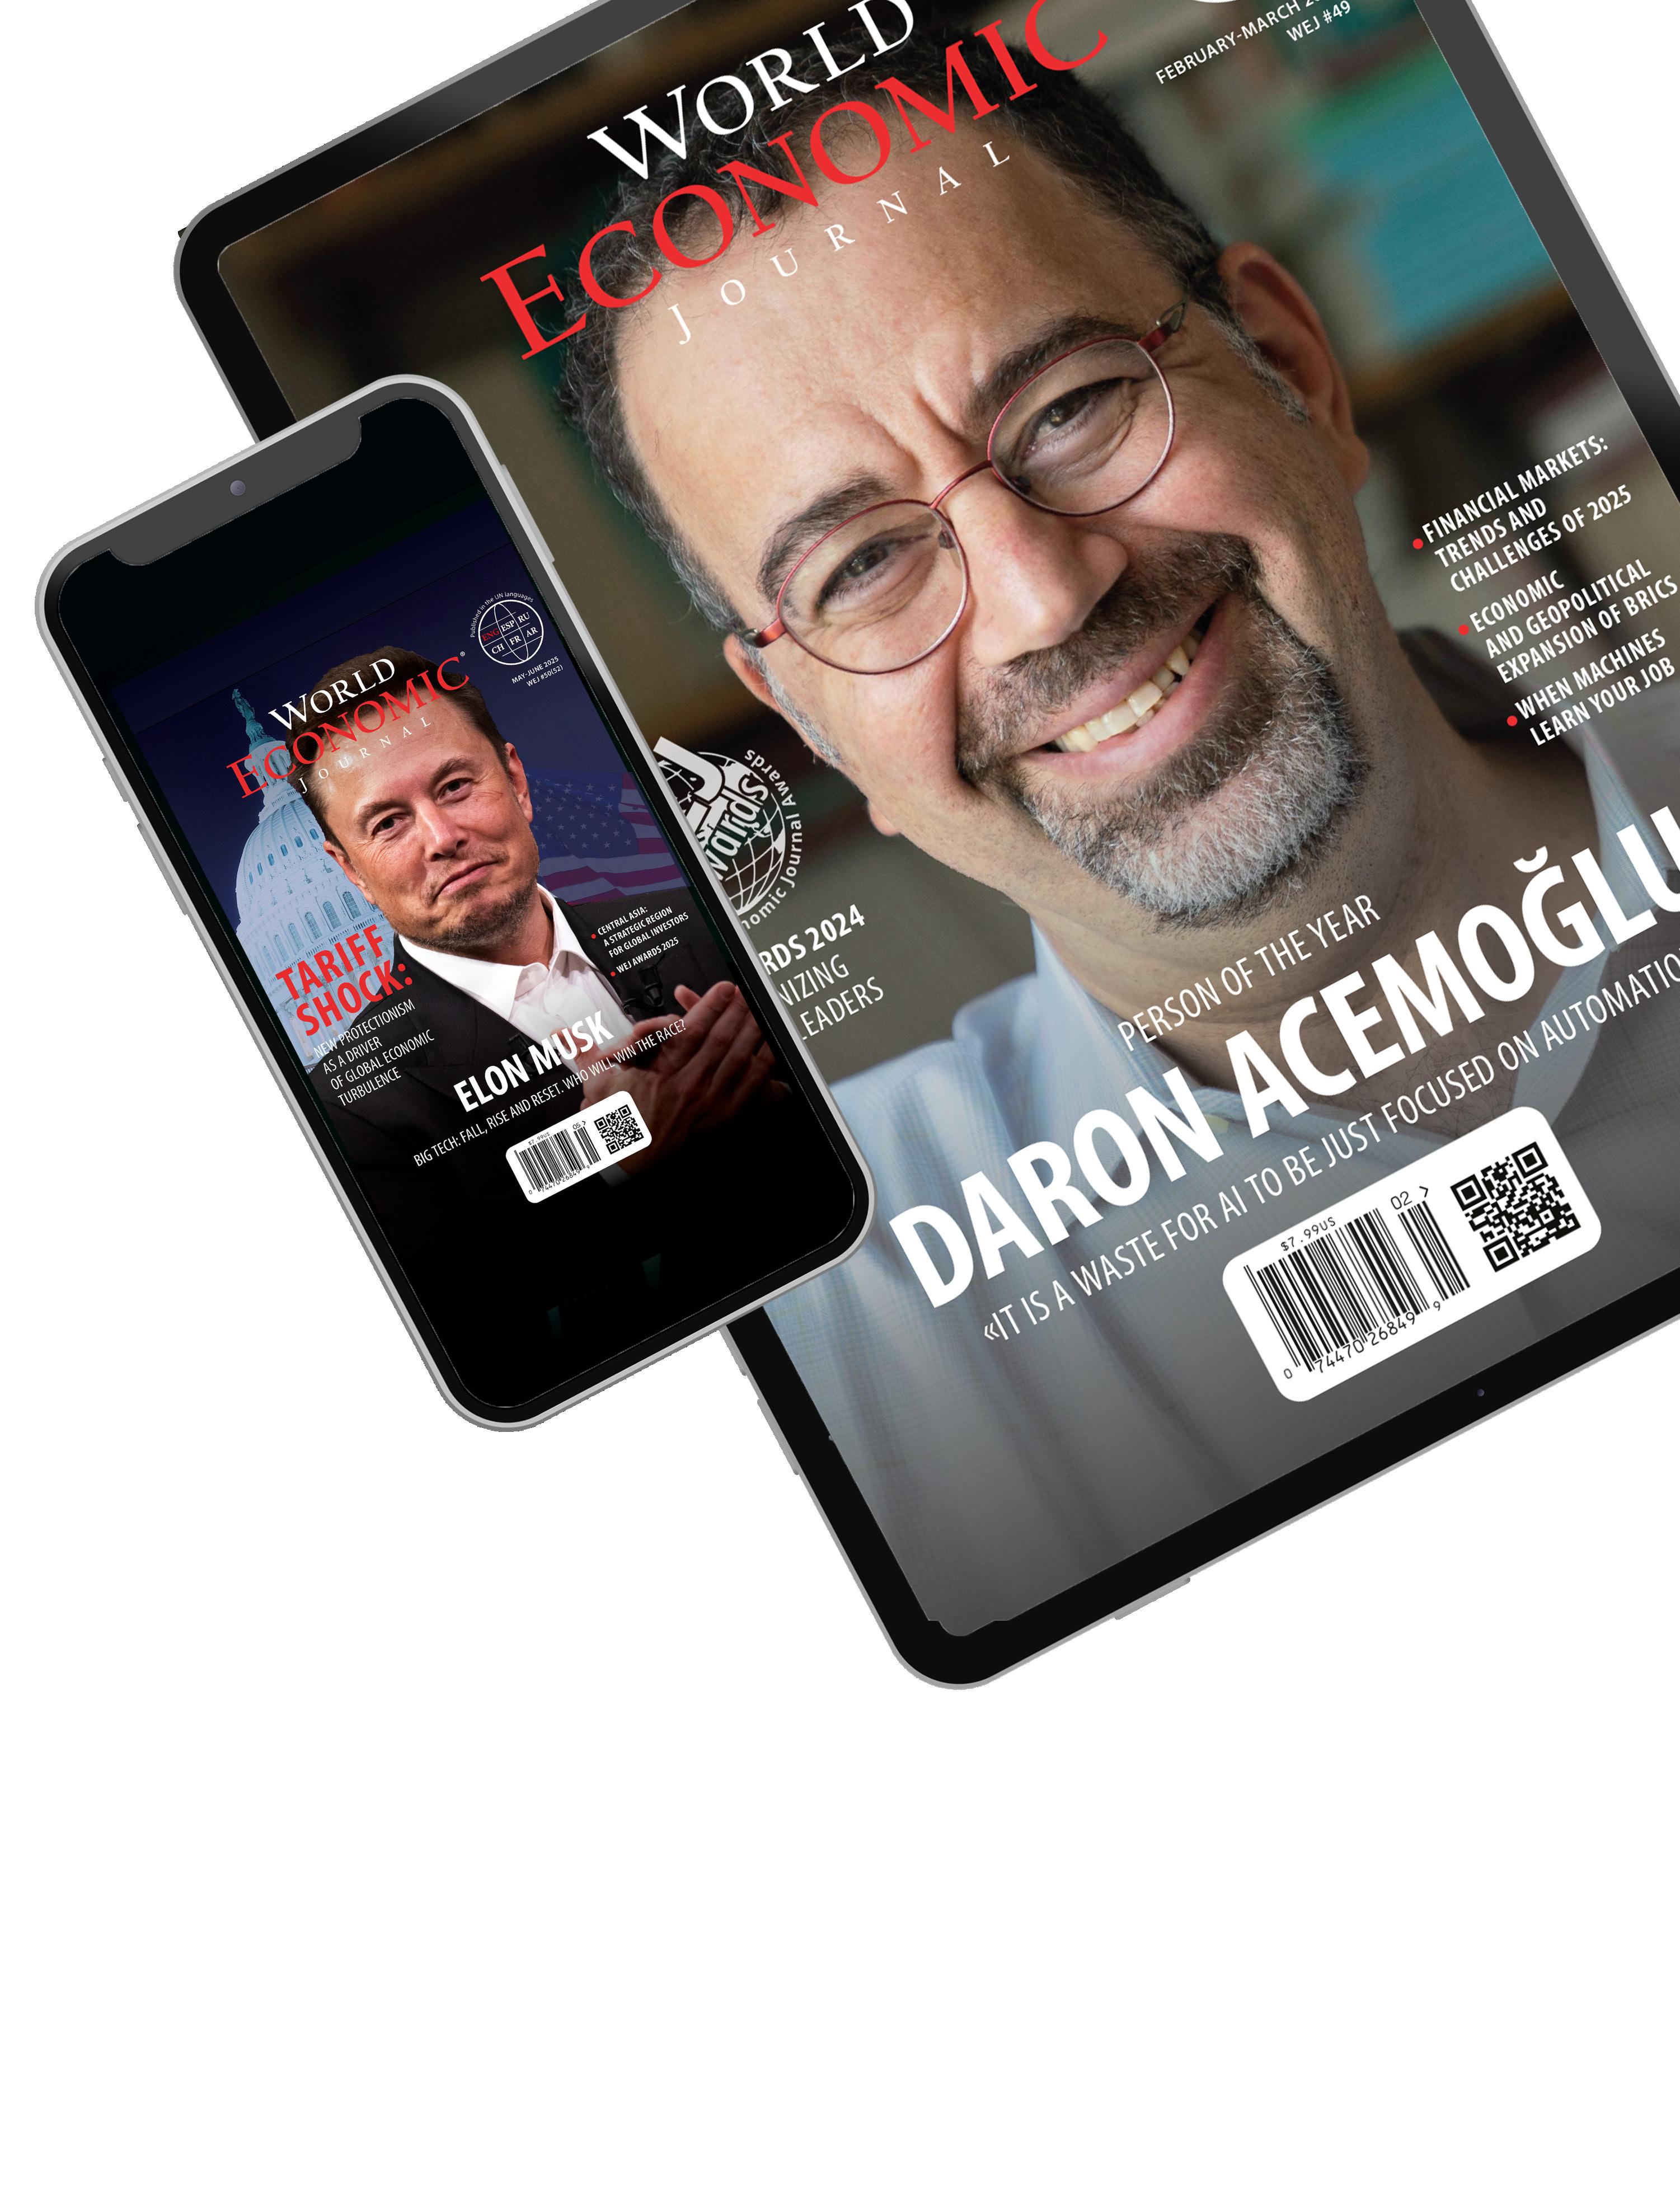
Cover: photo by Shutterstock; illustration by A. Connick
THE WORLD ECONOMY IS UNDER PRESSURE: NEW AMERICAN POLITICS AND GLOBAL MARKETS
The global economy is facing enormous pressure. The 20252026 period has been marked with rising economic risks. Geopolitical uncertainty and deteriorating foreign relations between the U.S. and other countries have been replaced with systemic pressure on the U.S. trading partners. In this article I will explore the consequences of trade tensions for the global supply chains, the investment climate as well as the economic effects of the trade wars for the U.S. trading partners.
By Anna Sokolidou
TARIFFS AND U.S. TRADE POLICIES
The new protectionist U.S. trade policies have been existing since Donald Trump’s first term as the U.S. President. But the trade wars with all of the U.S. trading partners intensified after the beginning of the renewed protectionist phase. Mexico, Canada, India, the EU but most importantly China have all faced new tariffs on their exports to the U.S. The U.S. now utilizes high tariffs, most notably on aluminum, steel, and automotive sectors as well as import restrictions and export controls to raise the U.S. GDP, most notably in the manufacturing sector. But most importantly Trump aims to raise the U.S. employment by getting the production facilities and jobs from developing countries like India and China back to the U.S. by making foreign products more expensive for American consumers.
As of the end of 2025 a large proportion of global imports were affected by tariffs. As can be seen from the diagram, the global imports worth USD 2,640 billion, or 11.1%
of total imports, were affected by tariffs imposed between mid-October 2024 and mid-October 2025 more than four times the USD 611 billion just before that period.
However, tariffs only lead to fragmentation of the global economy because they badly affect all the countries involved in the trade tensions. Even though the direct effect on the U.S. GDP has been rather low, estimated at 0.7%, the U.S. trade policies have substantially raised business uncertainty and heightened market volatility, while provoking countermeasures from U.S. trading partners. Additionally, tariffs have increased costs on imported goods for both businesses and consumers, while disrupting the supply chains. Higher prices of imported goods obviously lead to higher producer and consumer inflation numbers. Moreover, U.S.-based companies, most notably exporters selling products to countries with the highest U.S. tariffs have to cut their production, while laying off American workers.
U.S. trade policies have substantially raised business uncertainty and heightened
market volatility
FINANCIAL MARKETS IN 2026—VOLATILITY AS THE NEW NORM
By Anna Sokolidou
It seems like the era of stability is over for the financial markets simply because it is hard to predict what the future has in store for the financial world. Geopolitical conflicts, trade wars and low economic growth have become typical of our day-to-day reality. Stock indices, cryptocurrencies and even precious metals keep surging and soon afterwards depreciating. It is very hard to make accurate predictions in the new reality simply because market participants do not know what to expect next.
WHY ARE MARKETS VOLATILE IN 2026?
First of all, after the beginning of 2025 and now in 2026 investors are watching for any developments in the trade conflicts between the U.S. and other nations. Trade conflicts between the U.S. and China, the U.S. and India, the U.S. and the EU, to name just a few, dominated the economic news headlines last year. They are still likely to significantly affect investors’ sentiments this year as well. At the beginning of 2025, the U.S. imposed trade tariffs on imports from other countries, including Mexico, Canada and China. Some countries, especially China, retaliated and imposed counter tariffs on American goods1. But
The
this is not the only problem the global economy is currently dealing with.
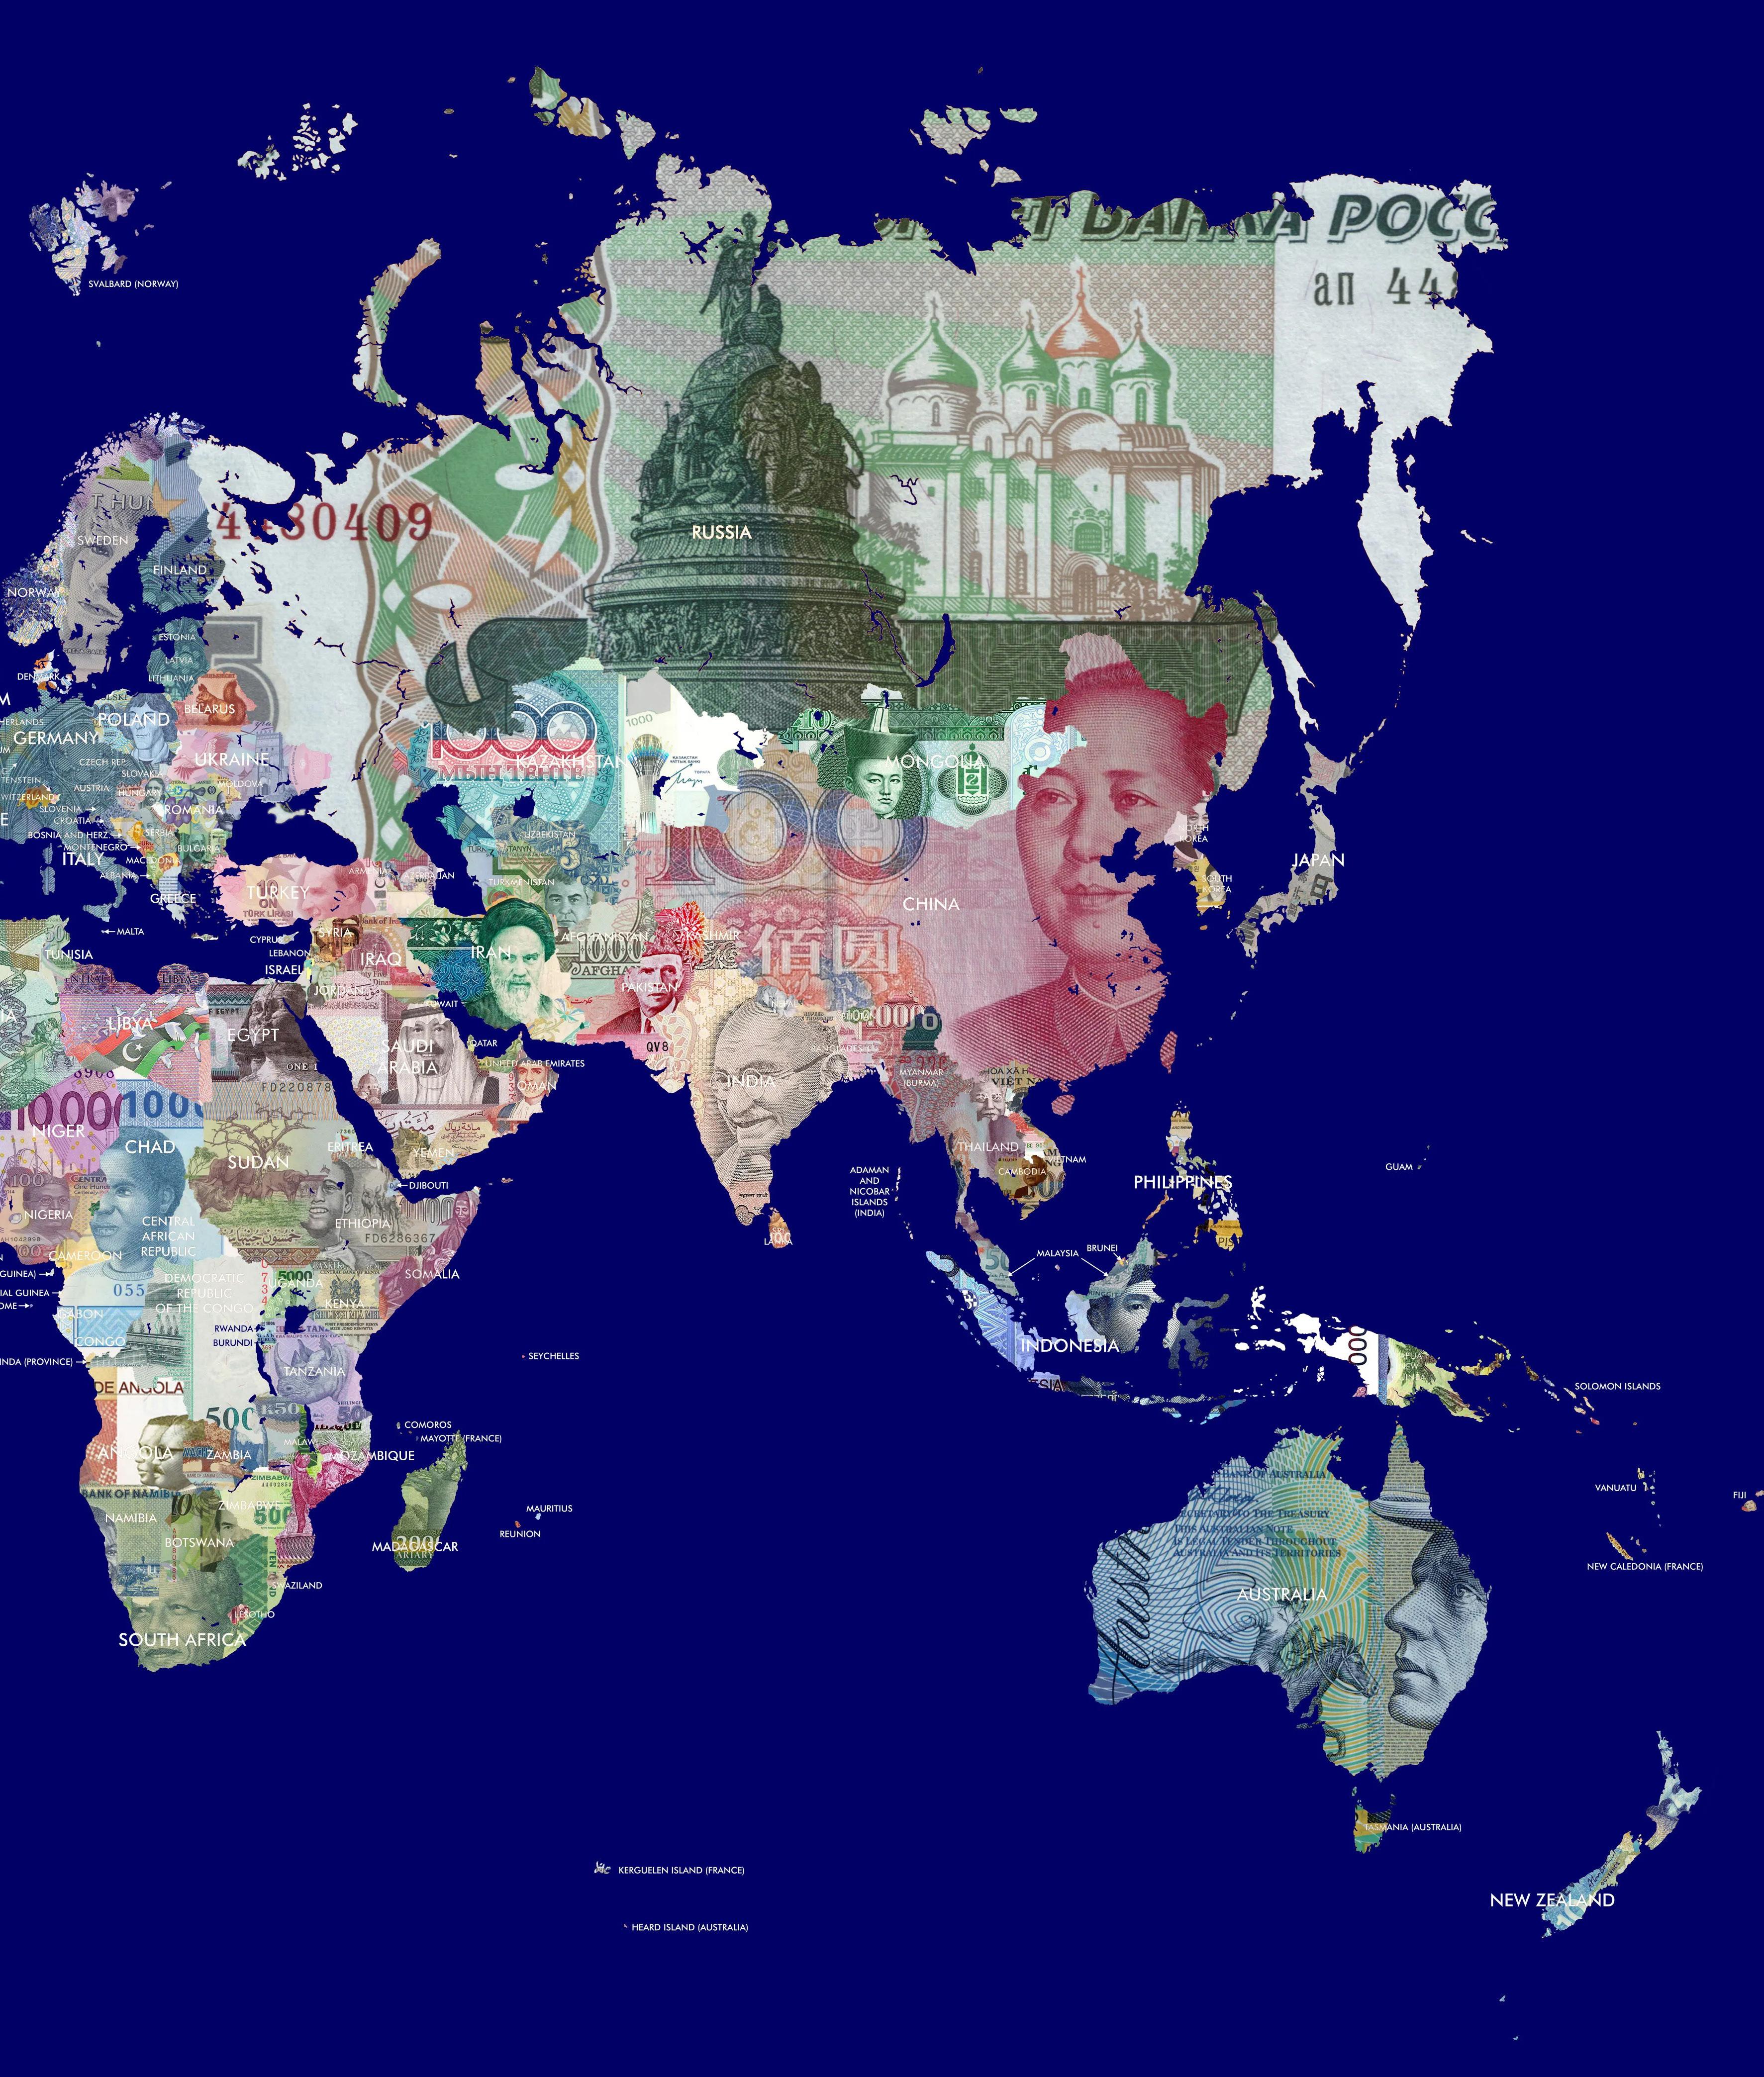
We also have several geopolitical and economic conflicts between countries and economic blocks. To start with, there is fragmentation between the BRICS+ countries and the Western nations. It is already discussed that BRICS+ are slowly moving away from using the U.S. dollar both as a medium of exchange and as a store of value. The countries are trying to use their national currencies to trade with each other and are also developing their common currency prototype2. These attempts to move from the USD have started after 2022 when sanctions against Russia were
countries are trying to use their national currencies to trade with each other
imposed and the country’s forex reserves were frozen in the EU3. Obviously, this desire to stop relying on the dollar is being met with little enthusiasm by the U.S. and President Donald Trump.
Indeed, on 30 November 2024 in his Truth Social post President Trump said: “We require a commitment from these Countries that they will neither create a new BRICS Currency, nor back any other Currency to replace the mighty U.S. Dollar or, they will face 100% Tariffs, and should expect to say goodbye to selling into the wonderful U.S. Economy4.”
In other words, Trump understands that creating such a currency would substantially undermine the USD’s position as the world’s reserve currency. This position was fixed in 1944 thanks to the Bretton Woods agreement. It made the U.S. dollar the main global reserve currency by tying its value to gold at $35 per ounce. Other countries, meanwhile, fixed the prices of their currencies to the USD. This agreement allowed post-World War II international trade, while the USD acted as the medium of exchange and also a currency for foreign reserves. Later in this article I will explain why maintaining the dollar’s status is so important for the U.S. economy.
In addition to conflicts with the BRICS+ nations and the trade tensions, the U.S. is having deteriorating political
2 PaymentsJournal, “BRICS Moves Forward on a Common Currency for Cross-Border”, https://www. paymentsjournal.com/brics-moves-forward-on-acommon-currency-for-cross-border/
3 GIS, “BRICS making incremental progress in dollarfree trade”, https://www.gisreportsonline.com/r/ brics-payment-system/#:~:text=The%20freezing%20 of%20Russian%20foreign,to%2020%2C000%20 messages%20per%20second
4 The Associated Press, “Trump threatens 100% tariff on the BRIC bloc of nations if they act to undermine U.S. dollar”, https://www.ap.org/news-highlights/ spotlights/2024/trump-threatens-100-tariff-on-thebric-bloc-of-nations-if-they-act-to-undermine-usdollar/#:~:text=Trump%2C%20in%20a%20Truth%20 Social,into%20the%20wonderful%20U.S.%20 Economy.%E2%80%9D
By Hakob Tarposhyan
For decades, asset safety was defined by labels. Inflation stayed stable. Large markets like U.S. Treasuries remained liquid in stress. Diversification worked because bonds typically rose when equities fell. Political and operational access was treated as secondary. That logic weakened as several pressures hit at once. Inflation became a source of real loss for nominal safe assets, and policy uncertainty began to show up in term premia. Liquidity proved state-dependent, with dealer capacity and leveraged positioning amplifying stress when investors tried to exit. Correlations changed due to inflationary pressures, so bonds and equities could fall together, and balanced portfolios offered less protection. Geopolitics then made market
access a material risk. Sanctions, asset freezes, investment screening, and payment restrictions showed that ownership does not guarantee usability.
Investors are responding by replacing asset labels with four criteria. Jurisdictional risk focuses on whether policy actions can limit ownership rights, convertibility, and access. Liquidity under stress focuses on execution and funding when volatility rises, not on normal-period spreads. Infrastructure resilience focuses on settlement, custody, clearing, payments, cyber risk, and energy reliability, all of which can disrupt market functioning. Real asset linkage focuses on preserving purchasing power when inflation is uncertain, while accepting governance and liquidity trade-offs. Regional strategies reflect different
exposures. Europe places more weight on energy security and fiscal capacity under geopolitical stress. Asia emphasizes supply chain resilience, deep domestic funding, and redundancy in financial infrastructure. Emerging markets focus on policy credibility and refinancing risk, given higher sensitivity to external funding conditions.
Institutional and private investors are adapting differently. Institutions are embedding these criteria into risk governance and operating arrangements, not only into allocation. They are more willing to carry ongoing costs for resilience through liquidity tiering, custody diversification, and simpler legal structures. Private investors often adjust through products and themes, but remain exposed to liquidity and access constraints in stress.
(World Bank, 2020). Cross-country correlation coefficients for equity returns ranged from 0.4 to 0.6 in developed markets, providing genuine diversification benefits when combined with negative bond-equity correlations that averaged -0.3 to -0.5 during riskoff episodes.
Financial innovation rapidly created sophisticated hedging tools. Overthe-counter derivatives outstanding reached $524 trillion in notional value by the end of 2019, providing sophisticated tools for risk transfer (Bank for International Settlements, 2020). Interest rate swaps, credit default swaps, and foreign exchange forwards enabled precise hedging of specific exposures. Financial innovation expanded the toolkit for managing traditional risk categories while reinforcing assumptions about jurisdictional stability and market access.
Jurisdictional Risk Remained a Background Consideration
Property rights appeared secure in developed economies throughout this period. The World Bank Governance Indicators showed political stability scores above 0.8 for high-income countries during 2000-2019 (World Bank, 2020). Capital mobility was largely unrestricted, with advanced economies maintaining open capital accounts and emerging markets gradually liberalizing theirs under IMF guidance. The Bretton Woods II system provided a stable monetary architecture, with approximately 65% of official reserves held in dollars and 90% of cross-border transactions involving dollar intermediation.
Sanctions are applied only in exceptional circumstances. Sanctions regimes affected limited jurisdictions—primarily Iran, North Korea, and a handful of other countries facing exceptional circumstances. The precedent of freezing sovereign assets or restricting access to financial infrastructure appeared remote for most investors. Portfolio construction focused on credit risk, duration risk,
Liquidity in U.S. Treasury Markets Disappears During Stress Episodes
Bid-ask spreads for one-the-run 10-year U.S. Treasuries, basis points; normal conditions vs. stress peaks.
EXECUTIVE SUMMARY
Treasury liquidity is state-dependent. Market depth evaporates precisely when investors require exit capacity, with spreads widening up to 8x normal levels.
1 basis point = 0.01%
Source: FRB New York (2024)
and correlation patterns rather than operational dependencies or political risk to asset access.
THE PROBLEM: FOUR DOCUMENTED FAILURE MODES
1. Inflation Broke Free From Central Bank Control
Central banks lost control of inflation despite aggressive action. Consumer price indices in major advanced economies rose well above policy targets during 2021-2023, despite aggressive monetary tightening. Core U.S. inflation reached 6.6% in September 2022, the highest since March 1982 (Board of Governors of the Federal Reserve System, 2023). The Federal Reserve raised the target rate from near zero to 5.25-5.50% over eighteen months—the fastest hiking cycle since the 1980s. However, inflation declined only gradually, with core PCE remaining above 3% through mid-2024. Markets priced in persistent inflation well above central bank targets. Treasury Inflation-Protected Securities breakeven rates—market-implied inflation expectations—remained elevated at 2.03% in September 2024, rising to 2.40% by January 2025 (T. Rowe Price, 2025). Markets priced inflation
persistence well above the Federal Reserve's 2% target over multi-year horizons. Real yields on TIPS turned negative during 2021-2022, meaning investors holding conventional Treasuries experienced substantial erosion of purchasing power despite receiving full nominal principal repayment.
Government debt reached unsustainable levels, threatening monetary policy independence. Advanced-economy public debt ratios approached 110% of GDP by 2024, levels last seen in the immediate post-World War II period (International Monetary Fund, 2024). Interest payments as a share of government spending rose from approximately 3% of GDP in 2021 to over 4% in 2024 among OECD countries with elevated debt-servicing burdens (Bank for International Settlements, 2024). The combination of high debt levels, persistent deficits exceeding 3% of GDP in major economies, and demographic pressures from aging populations created fiscal trajectories that raised questions about the subordination of monetary policy.
Central bank bond sales pushed yields higher for private investors. The Federal Reserve reduced its Treasury holdings by approximately $1.5 trillion from mid-2022 through 2024, and
AI AND THE ECONOMY:
NOT HYPE THE SOLOW PARADOX 2.0: WHY A TRILLION DOLLARS IN CAPITAL EXPENDITURE HAS NOT YET MOVED THE GLOBAL GDP NEEDLE
By Antoine Tigneres
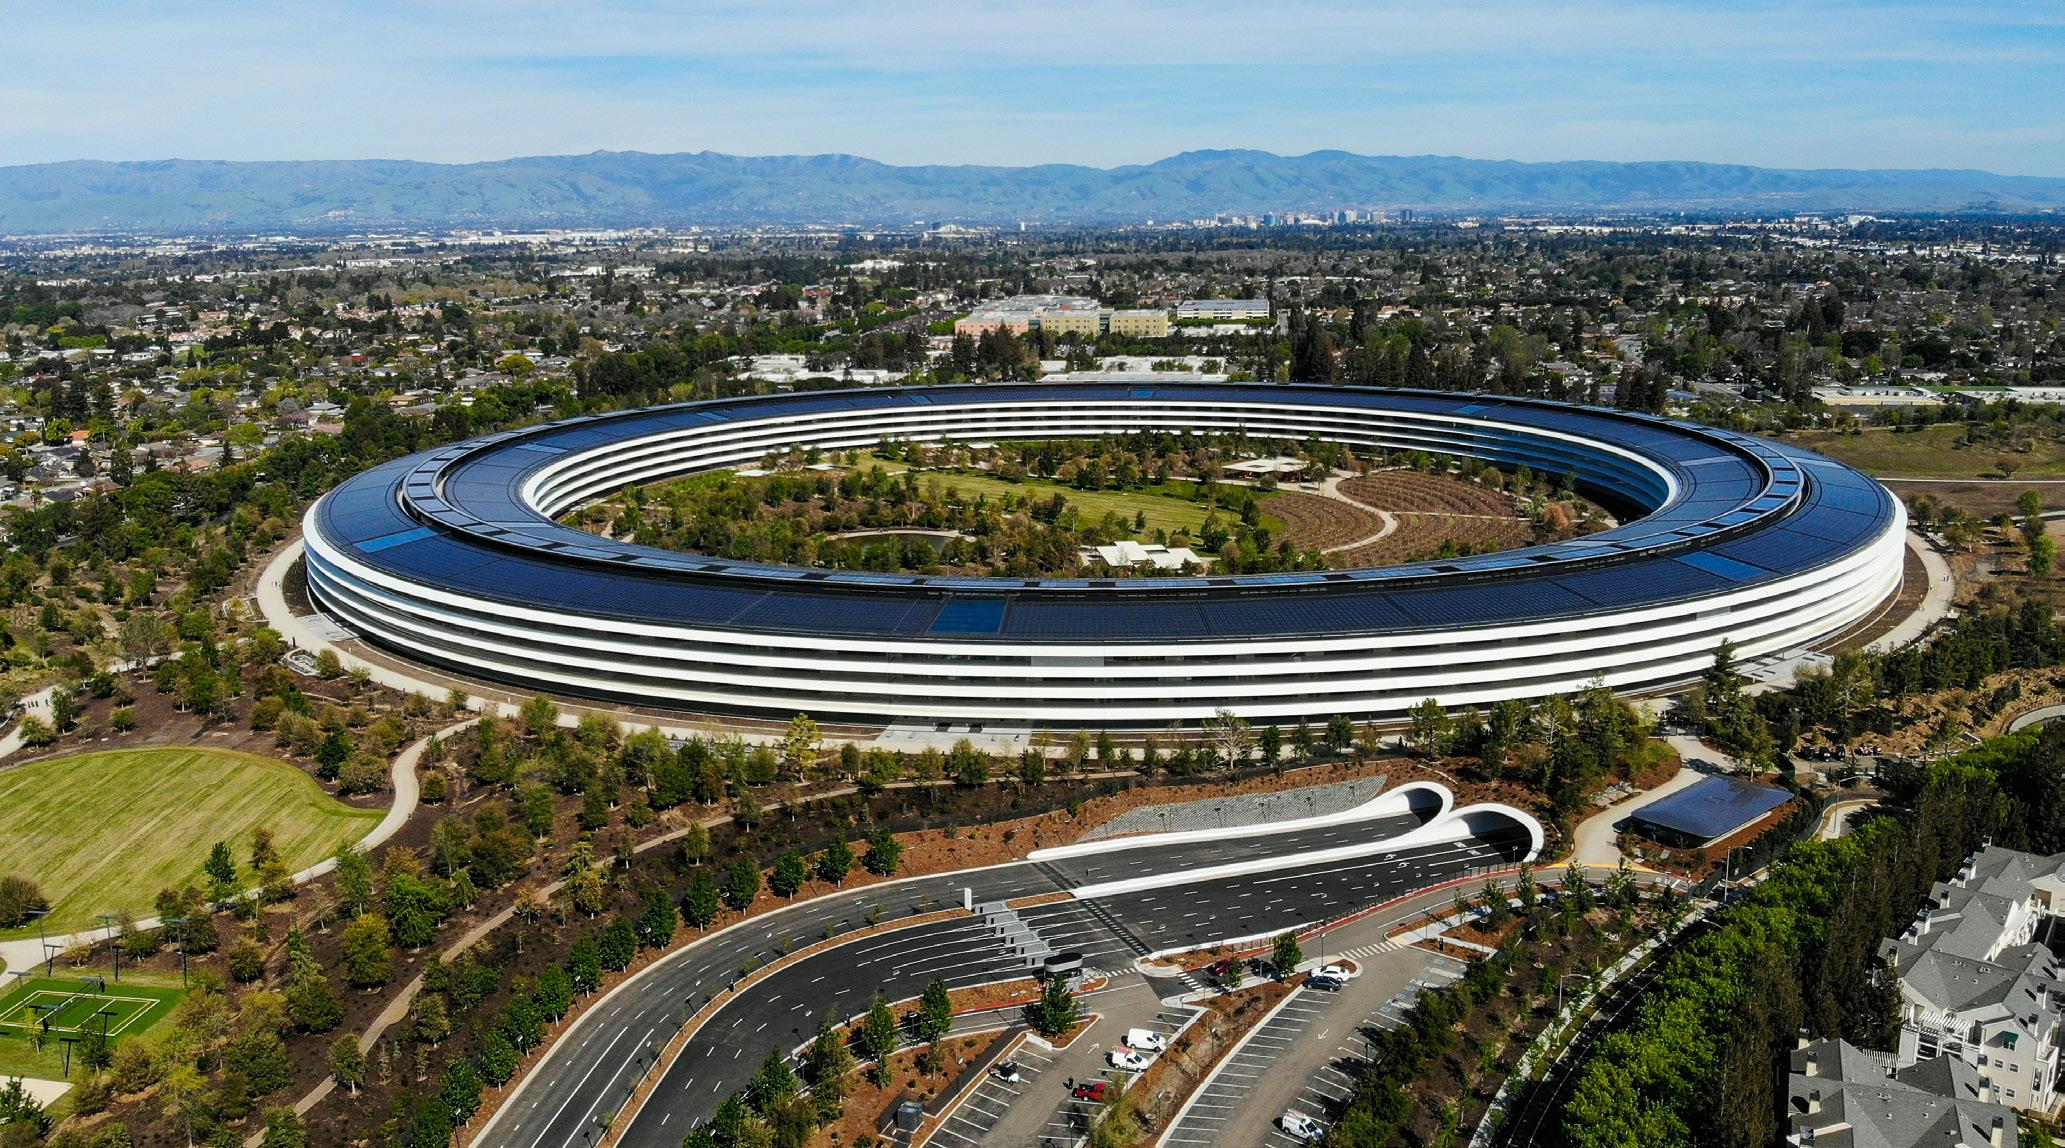
Wall Street has effectively bet the house on artificial intelligence. In only three years, investors have poured nearly a trillion dollars into infrastructure. Yet, the latest data from the OECD reveals an uncomfortable truth: global productivity is flatlining. This forensic audit of the AI economy suggests we aren't entering an era of magic. We are entering an era of heavy industry, where "Laborious Productivity" is our only defense against a shrinking workforce.
The gap between the evolution of Silicon Valley’s digital stock prices and that of productivity across the world is particularly striking.
In San Francisco, the mood remains electric. Venture capital flows continue to chase the dream of "Agentic AI," albeit more selectively than in the heady days of 2024. Inside the boardrooms of the hyperscalers (Google, Microsoft, and Amazon), the logic is binary: build or die. They operate on a singular, high-stakes conviction that if they provide the hardware, the profits will inevitably follow. As a matter of fact, over the past 36 months, the global financial system has funneled an estimated $1 trillion into the physical infrastructure of Artificial Intelligence. This capital injection is unprecedented. In speed and scale, it dwarfs the Manhattan Project in inflation-adjusted terms and rivals the ambition of the Apollo Program. However, the OECD in Paris shows that numbers tend to reveal a different reality. There, the screens show a flatline. According to the OECD Compendium of Productivity Indicators released this January 2026, Multifactor Productivity (MFP) is stagnating across the G7. This metric is the economist's gold standard for measuring innovation efficiency. In the Eurozone, it has actually contracted. Even in the United States, despite a tech-heavy index, the needle has barely moved beyond the statistical margin of error.
It feels like a cruel joke of economic history. In 1987, Nobel laureate Robert Solow famously quipped: "You can see the computer age everywhere but in the productivity statistics." Today, we face Solow Paradox 2.0. Only this time, the stakes are higher. To start with, we need to contextualize this disconnect against historical precedents. When electricity arrived in the late 19th century, it took nearly three decades for productivity to surge. Why the delay? Because factory owners initially just swapped steam engines for electric motors without changing the floor layout. It was only in the 1920s, when factories were redesigned around the flexibility of small electric motors (removing the dangerous overhead steam shafts), that U.S. manufacturing productivity finally exploded, averaging over 5% annual growth.
Right now, we are still in the "Steam Shaft" phase of AI. By contrast, the Internet Boom (1995-2004) was different. IT integration drove a decade of productivity growth averaging
nearly 3% in the U.S. because email and the web immediately killed communication friction. Today, despite the hype, productivity growth in the AI cycle (2023-2026) crawls between 0.4% and 0.8%.
The most hyped technology in human history has failed to deliver the "supply shock" promised by its evangelists. In fact, there is a fundamental category error in how we view AI in 2026. It is not a magic wand. It is heavy industry. It is a systemic, capital-intensive infrastructure that devours energy (Opex) and capital (Capex) at a rate that currently exceeds its economic output. We have traded the lightweight, high-margin software economy of the 2010s for a grinding, industrial-grade computation economy.
This article audits the books of the AI revolution. By stripping away the narrative and focusing on the hard data (from Big Tech's Form 10-K filings to the technical appendices of the Bank for International Settlements), we reveal a different story. We are not entering an era of effortless abundance. We are entering the era of "Laborious Productivity," where AI is used not to conquer new frontiers, but simply to keep the lights on in a world facing demographic and physical constraints.
THE SPECTRE OF SOLOW: THE MACRO VIEW
The Angle: The lag between investment and return is not just a timing issue; it is a structural blockage caused by financial crowding out.
Let's look at the anatomy of this stagnation. Macroeconomics is often accused of being a dismal science, but in 2026, it serves as a mirror reflecting a structural blockage. The data from the OECD Compendium (January 2026) paints a picture of a global economy running on a treadmill. While the aggregate GDP of the G7 nations has shown resilience, the quality of that growth is suspect.
In the United States, labor productivity rose by 1.6% in 2023. On the surface, that looks respectable. However, if you strip away the valuation effects of the tech sector itself (which inflates the numerator of GDP), the "real" economy looks anemic. In Europe, the situation is starker: the Eurozone saw labor productivity contract by -0.9%, erasing gains made post-pandemic. The core issue lies in Total Factor Productivity (TFP). This measures our collective "intelligence" in using resources (everything not explained by simply adding more workers or machines). That TFP is stagnating at 0.4% while we deploy "Artificial Intelligence" is the heart of the paradox.
Then there is the "Crowding Out Effect." Techno-optimists argue that we are simply in the dip of the "J-Curve," waiting for adoption to scale. However, the Bank for International Settlements (BIS) Quarterly Review (December 2025) points to a more insidious culprit. To understand why an SME in Lyon or Manchester cannot invest in modernization, one must
Google or Microsoft must effectively rebuild their entire infrastructure every four years just to stay competitive
look at the plumbing of the global financial system. The BIS data reveals a startling concentration: by late 2024, the top 10 global banks held nearly 60% of global foreign exchange (FX) derivatives and associated swap lines.
Why does this matter? Because these instruments act as the "pipes" channeling liquidity to Tech giants. To build data centers in Europe or Asia, U.S. Tech giants must move billions of dollars across borders. They use FX Swaps to hedge their currency risk. Large global banks use their balance sheets to underwrite these massive hedges. By committing their "Risk-Weighted Assets" (RWA) to hedge the tech sector's infrastructure build-out, banks have less capacity to underwrite credit for the rest of the economy. This creates a liquidity funnel. Consequently, capital mobilized for Big Tech is capital unavailable for traditional commercial credit. Real investment in non-AI sectors (manufacturing machinery, traditional R&D, chemical infrastructure) has softened. We are feeding the AI engine at the expense of the vehicle it is supposed to drive.
Finally, we are witnessing a form of "Baumol's Cost Disease" applied to technology. The sectors where AI is most easily deployed (namely coding and content creation) are already high-productivity sectors. Increasing efficiency there yields diminishing returns for the total economy. Meanwhile, the low-productivity sectors that drag down global GDP (healthcare, construction, education) remain largely impervious to Large Language Models because their bottlenecks are physical and regulatory, not linguistic. A chatbot can write a discharge summary in seconds, but it cannot move a patient from a
gurney to a bed. Until AI bridges that "physical gap," its macro impact will remain a rounding error.
THE COST AUDIT: CAPEX VS. OPEX
The Angle: The fundamental economic model of software has been inverted. Marginal costs are no longer zero, and depreciation is accelerating.
To understand why the macro needle isn't moving, we must look at the micro-economics of the firm. The most revealing documents of 2026 are not white papers on AGI, but the Form 10-K filings submitted to the SEC in February.
First of all, we face the "Capex Wall" and accelerated depreciation. Let’s look at Alphabet (Google). In 2024, the company spent $52.5 billion on capital expenditures. In 2025, that figure ballooned to $91.4 billion (a staggering 74% increase yearover-year).
Where does nearly $100 billion go? It goes into concrete, copper, and cooling towers. But crucially, it flows into an accounting trap: Accelerated Depreciation.
In the classic industrial economy, when Ford built a factory in 1950, that asset was amortized over 30 or 40 years. It was a durable stock of capital that produced value for decades. Unlike the old industrial model, an Nvidia H100 or Blackwell GPU has a "prime" economic life of 3 to 4 years before being rendered obsolete by the next generation. For Google or Microsoft, this means they must effectively rebuild their entire infrastructure every four years just to stay competitive. This is an accounting race against time that devours Free Cash Flow. In Item 1A ("Risk Factors") of their annual report, Alphabet’s legal team is brutally honest. They explicitly cite the risk that "rapid technological changes may render our existing investments obsolete before we have realized a sufficient return." This is not a technical detail; it is an admission that the economic model is under extreme tension.
Furthermore, we must consider the "Inference Tax." The most critical (and least understood) shift is the death of "Zero
PHOTO: CARLES RABADA / UNSPLASH
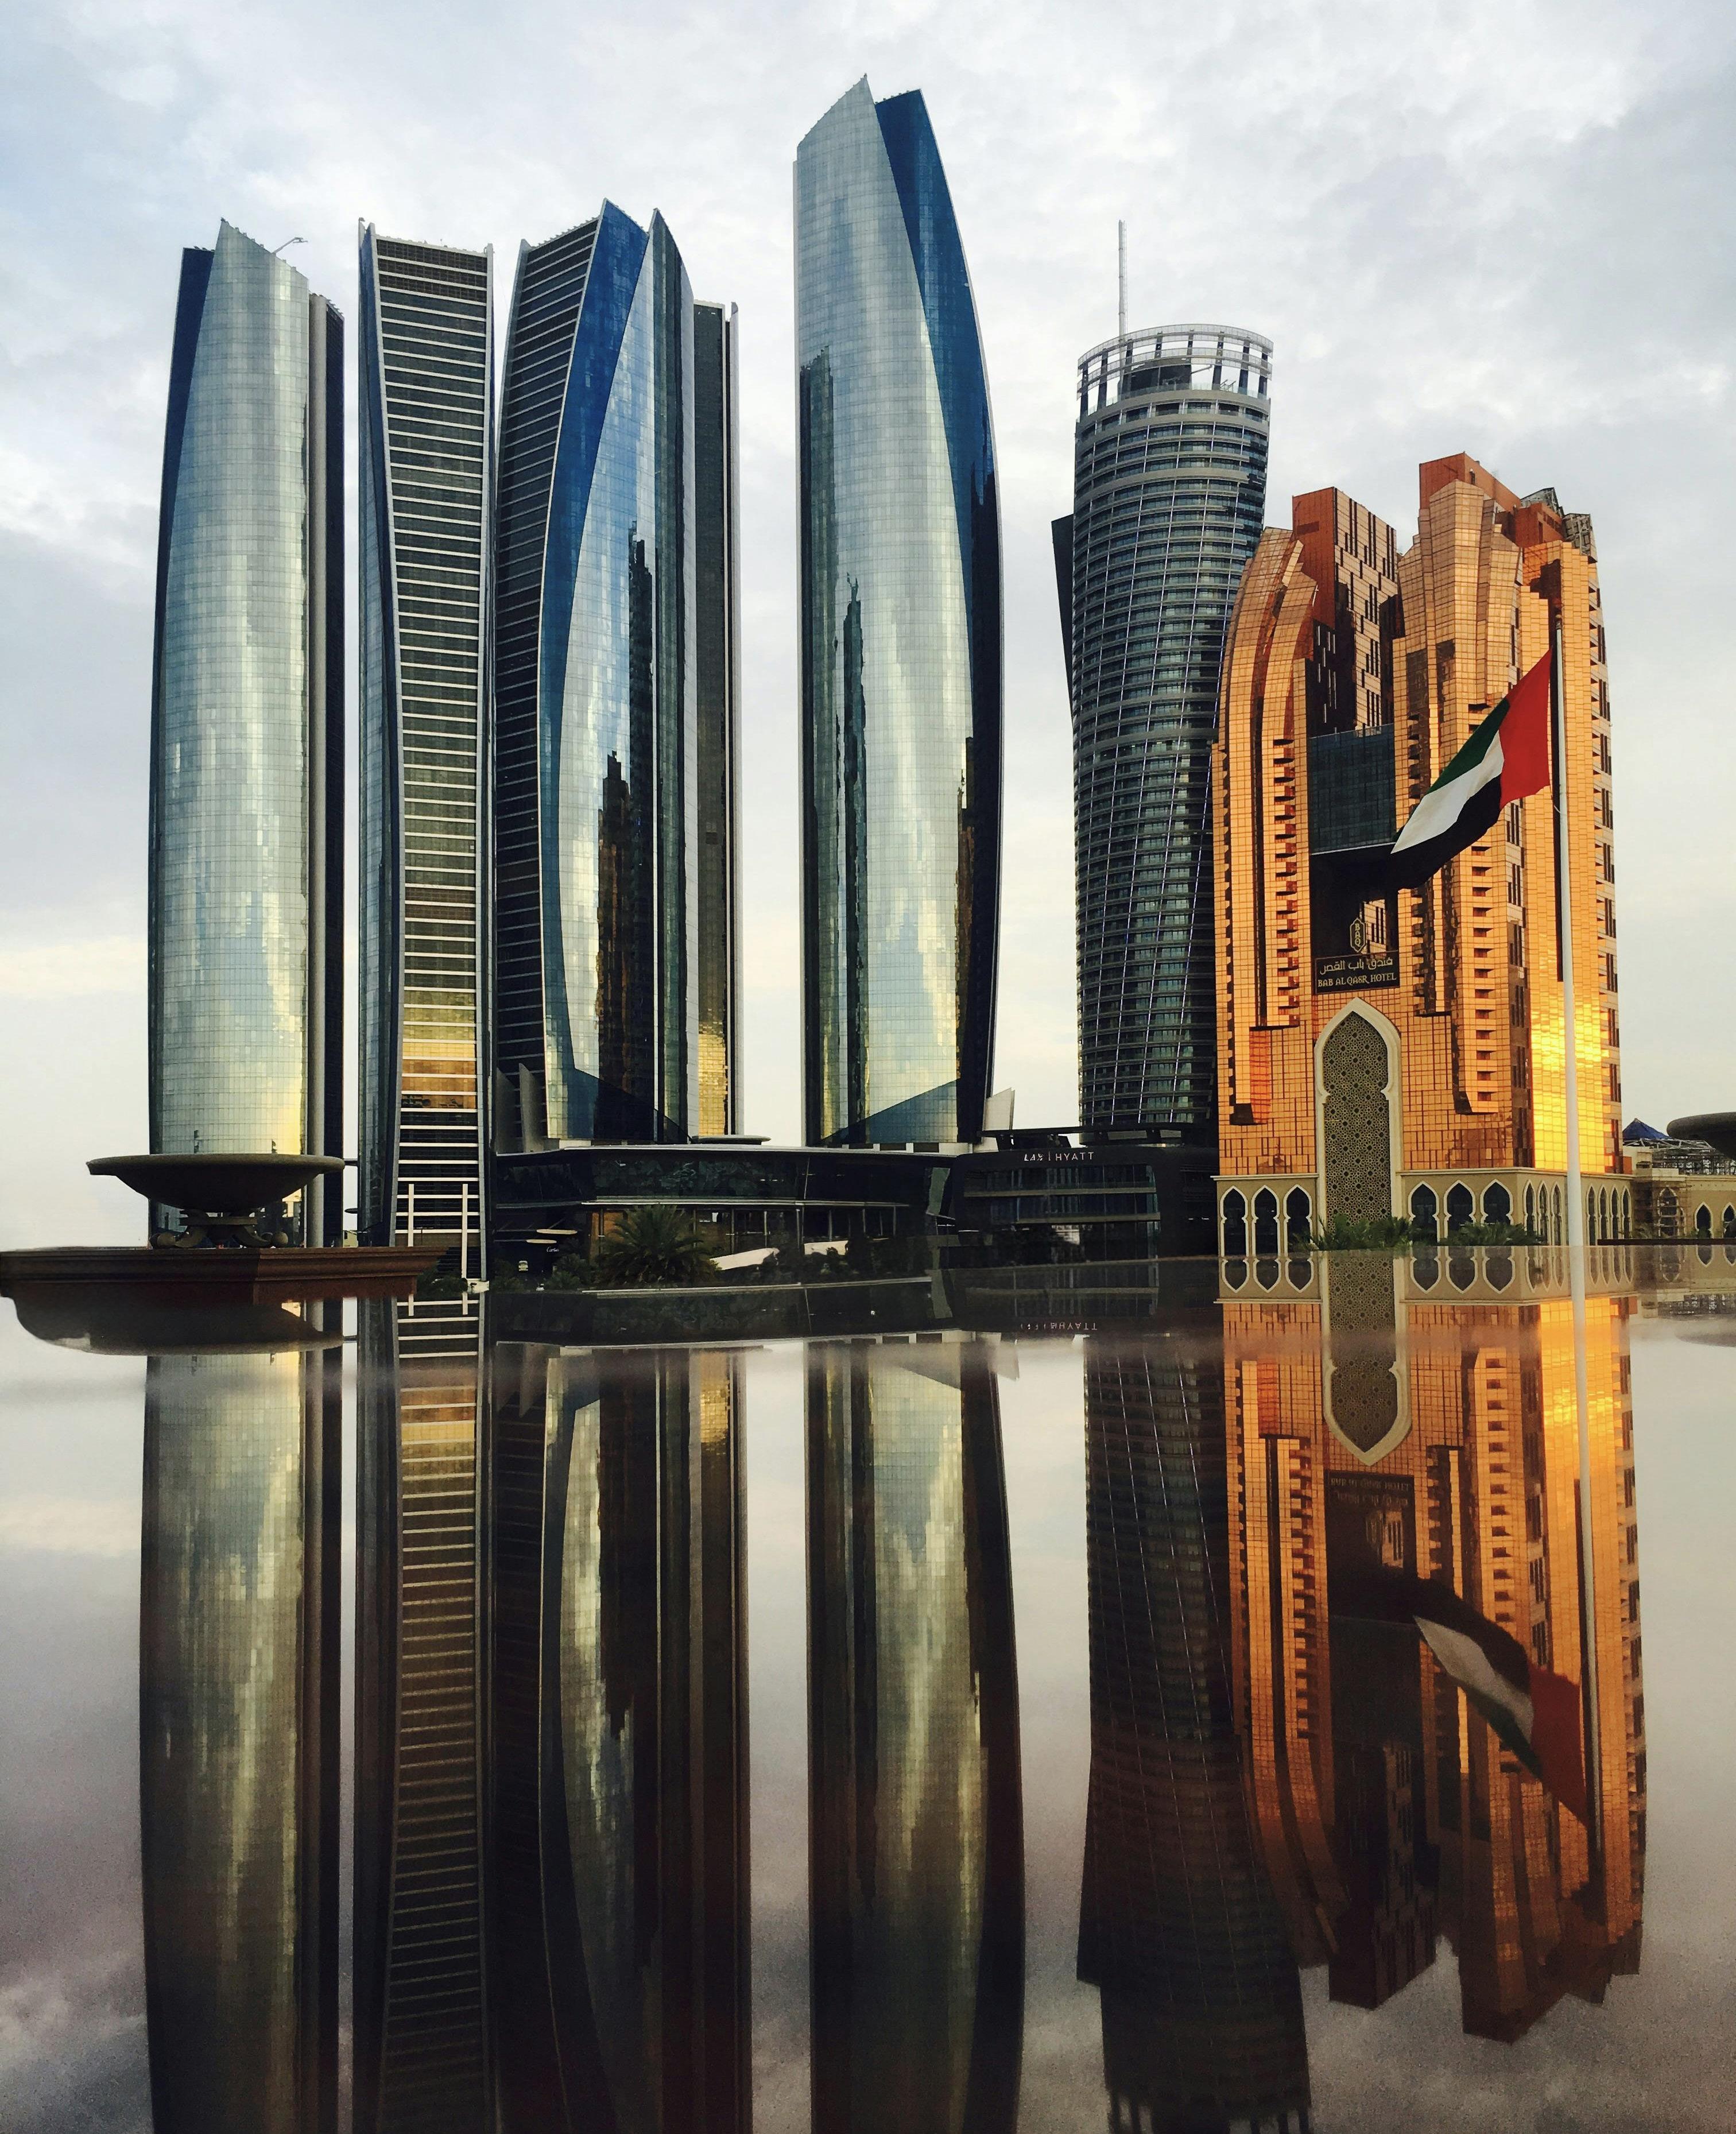
THE UAE AS A NEUTRAL HUB IN A FRAGMENTED GLOBAL ECONOMY
How the UAE's port infrastructure, free zones, and strategic neutrality are reshaping global trade flows and capital positioning amid U.S. tariff fragmentation.
By Jonesha Smith
The United Arab Emirates (UAE) is one of the few jurisdictions where the structural logic of neutral economic positioning has been directly translated into financial and trade gains amid rising economic trade fragmentation. Trade barriers are increasing, geopolitical blocs are forming and disintegrating, and global supply chains are also organizing. The UAE lies at the intersection of sea routes linking Europe, Asia, Africa, and the Arabian Peninsula, which centuries of trade history have already proven.
That position is not relevant solely due to its geography. It is institutional, regulatory, and infrastructural. Over the past forty years, the UAE has built a multi-layered infrastructure of free zones, port facilities, financial centres, and bilateral trade agreements that together serve as an economic operating system for companies to navigate cross-border complexity.
This article examines the UAE's hub positioning through the lens of five interconnected analytical domains: the physical logistics infrastructure that underpins cargo throughput; the free zone and investment regime architecture that channels capital flows; the UAE's deliberate strategic neutrality between competing economic blocs; the direct and indirect impacts of U.S. tariff policy on UAE-routed trade and investment; and the structural risks and regulatory constraints that define the limits of the model.
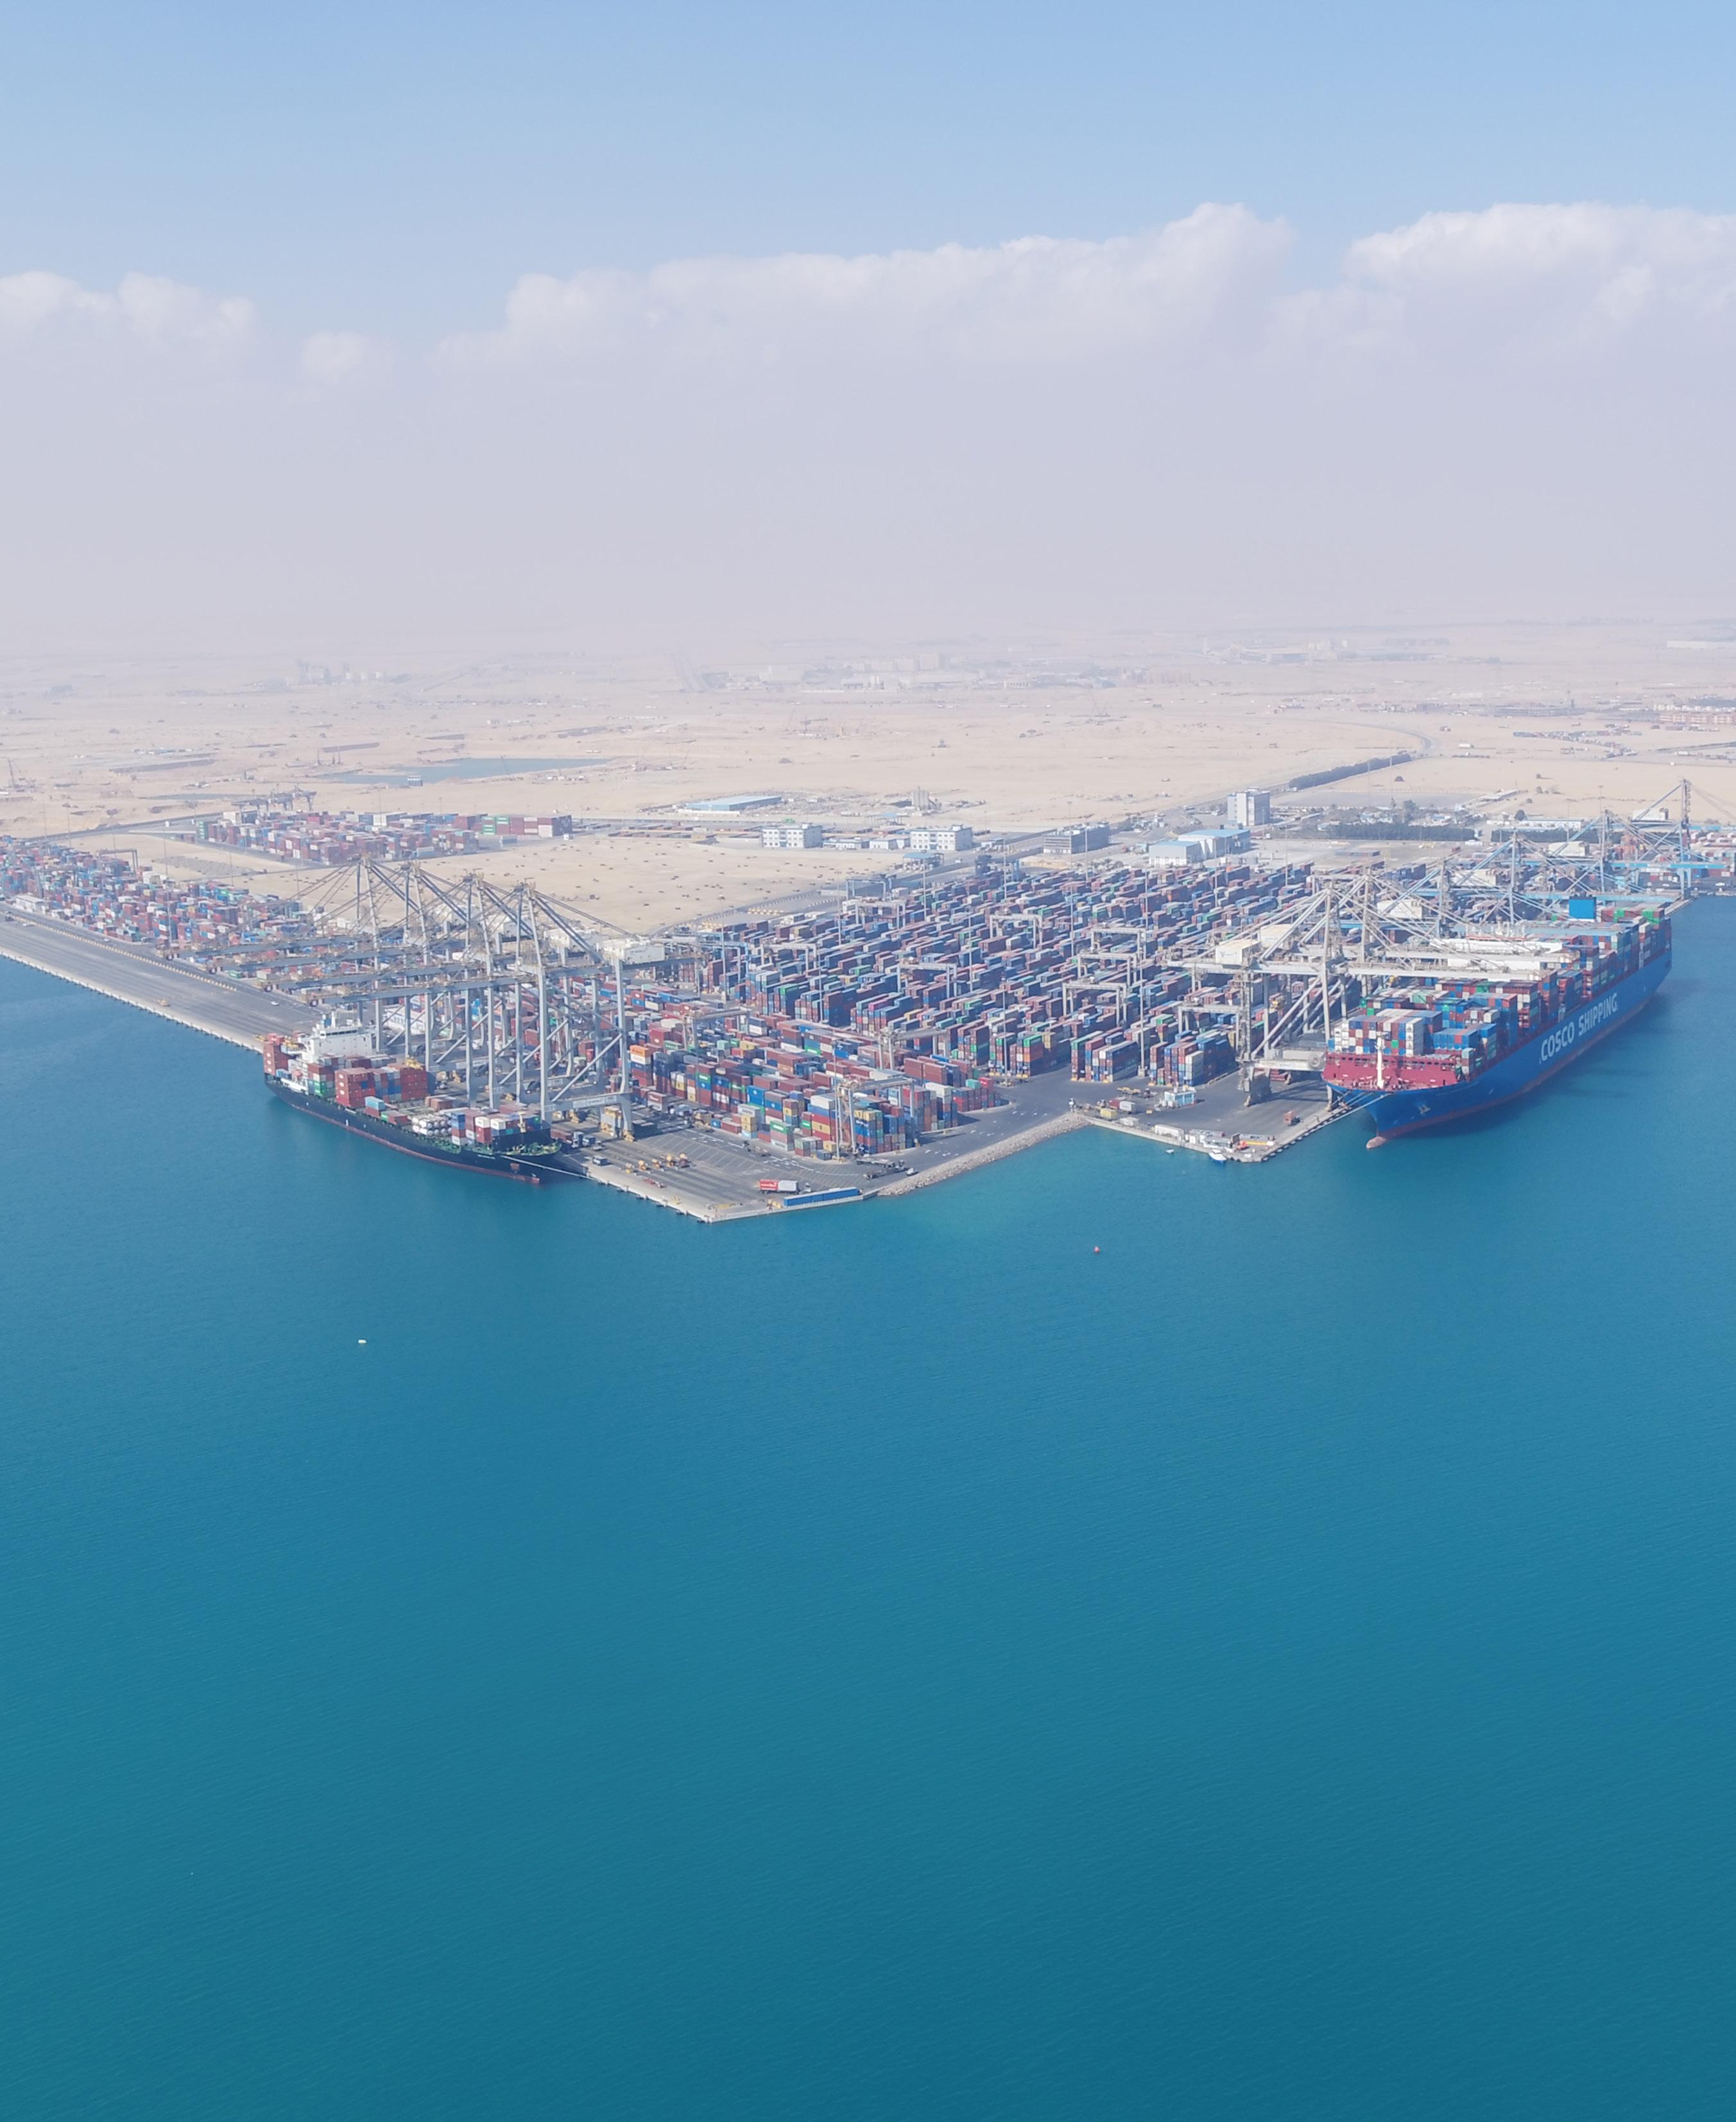
LOGISTICS INFRASTRUCTURE: THE PHYSICAL ARCHITECTURE OF A GLOBAL HUB
1. Port Infrastructure
UAE hub positioning is based on the structural support of the infrastructure, the most vital of which is Jebel Ali Port in Dubai. Jebel Ali is the biggest container terminal in the Middle East and Africa, with a yearly container handling capacity of 19.4 million twenty-foot equivalent units (TEUs) across four terminals, more than 100 berths, and a quay length of 25 kilometres that is continuous and managed by DP World. Jebel Ali has recorded its highest TEU container throughput since 2015, with a total of 15.5 million TEUs in 2024, a growth of about 1 million TEUs compared to 2023, representing approximately 18% of the total global TEU of 88.3 million TEUs handled by DP World in 2024.
2. Air Cargo Capacity
Air freight is a dimension of the UAE logistics hub architecture that is structurally distinct but increasingly important. Although air cargo contributes only 1 percent of all trade by volume, these goods are estimated to provide approximately 35% of the total value of all trade globally, a figure that makes air freight an important infrastructure for high-value, time-sensitive inventory (such as pharmaceuticals, electronics, luxury goods, and express shipments via e-commerce).
According to Airports Council International (ACI), Dubai International Airport (DXB), the biggest airport globally in terms of international passenger traffic, recorded 2.2 million tons of air cargo in 2024, a 20.5 percent increase over 2023. In terms of ACI cargo airport rankings, this event pushed DXB up from 17th to 11th in the globe, which was the largest increase of any of the top 20 airports that year. Together, DXB and Dubai World Central (Al Maktoum International Airport) handled 2.8 million tonnes of traffic in 2024, representing an 18.5% yearly increase. DXB offers directional coverage of what a true transshipment center needs, with 272 destinations to 107 countries via 106 international airlines.
Over the next ten years, the proposed 35 billion investment program for the expansion of Al Maktoum International Airport is expected to raise total cargo capacity to 12 million tonnes annually, placing the UAE's air freight infrastructure among the top three cargo hub systems globally.
Infrastructure quality in the United Arab Emirates is confirmed by sovereign logistics performance ratings. The UAE is rated at 4.0 out of 5.0 in the World Bank's 2023 Logistics Performance Index (LPI), which ranks 12 leading economies, including Singapore, Finland, Denmark, the Netherlands, Switzerland, Germany, and others. This is an improvement of 4 spots from the UAE's 11th-place ranking in 2018.
In the most recent LPI cycle, the UAE topped both the Arab world and the GCC. Every one of the six LPI assessment dimensions—customs efficiency, infrastructure quality, ease of organizing international shipments, UAE logistics hub service quality, tracking and tracing, and timeliness—received competitive scores. During the May–October 2022 reference period, the average number of days spent in UAE ports was four, which is a favorable comparison to the seven days spent in the U.S. and the 10 days spent in Germany.
YoY; 11th globally
Airports Total Air Cargo 2.8M Tonnes +18.5% YoY (Combined)
Airports / ACI Port Dwell Time 4 Days (Avg.) vs. 7 days (USA) / 10 days (Germany)
Bank LPI (2023)
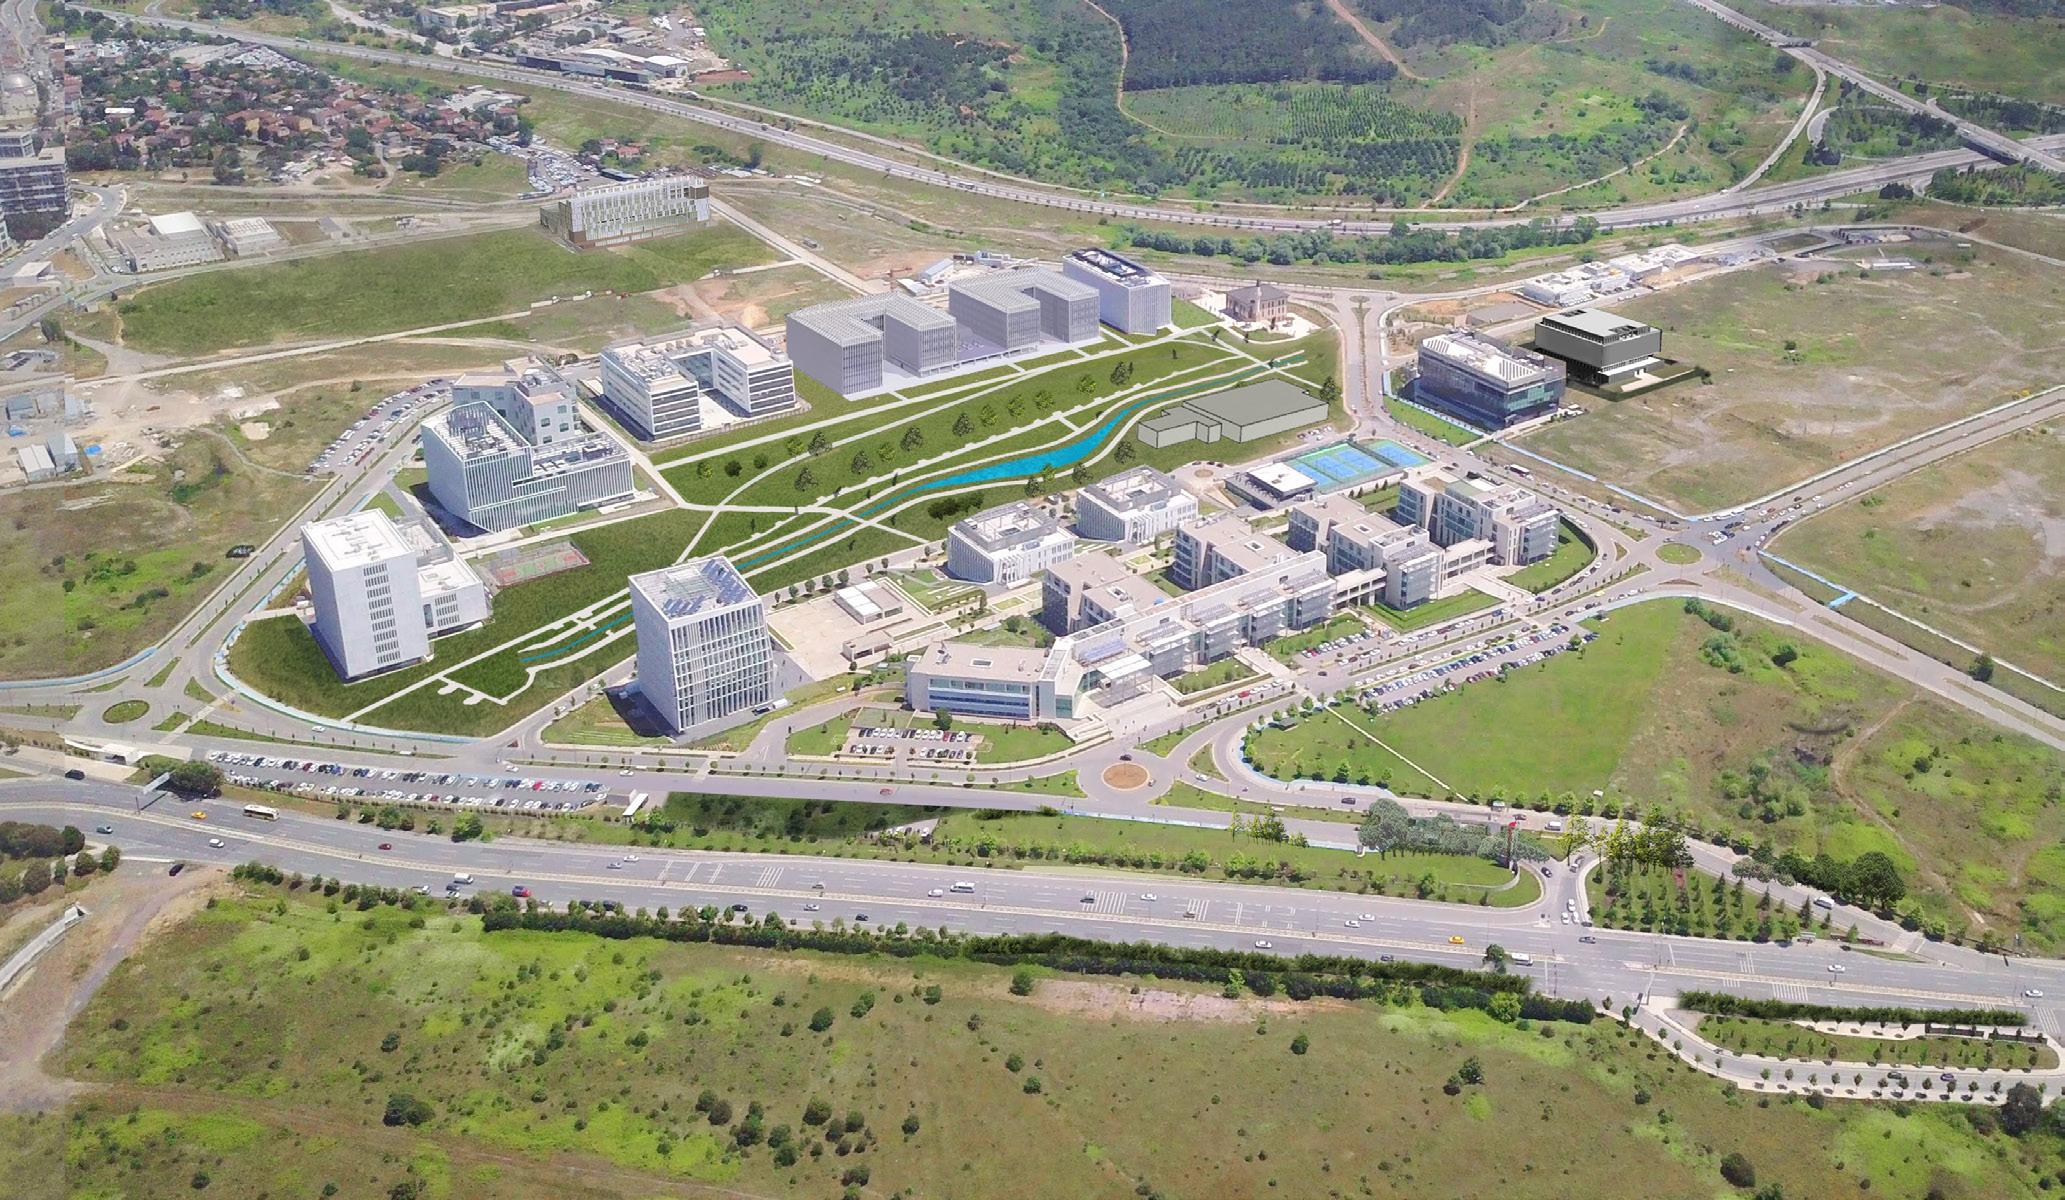
TURKEY AS
By Kamshat Zhumagulova
In April 2025, CMA CGM—the French shipping group and the world’s third-largest container carrier—paid $440 million for the logistics division of Turkey’s Borusan (Reuters, 27 April 2025). Five months prior, Ekol Logistics’ international transport network was purchased by Danish freight operator DFDS for $277 million, primarily to secure capacity on the Turkey-Europe route. These deals point in the same direction: Turkey is becoming a transit node that global freight operators cannot afford to route around.
With bilateral trade hitting a record €210 billion in 2024, Turkey continued to rank as the EU’s fifth-largest economic partner (European Commission). According to figures from the Turkish Statistical Institute (TÜIK), trade turnover with the United States reached $32.7 billion in 2024—$16.7 billion in exports and $16 billion in imports—making bilateral flows roughly balanced. The nation’s logistics market is valued between $34 and $50 billion (Mordor Intelligence, IMARC Group, BlueWeave Consulting, 2024). More than 350 organized industrial zones operate across the country, alongside 22 free trade agreements and a customs union with the European Union in effect since 1996.
But hub status comes with structural exposure. Heavy dependence on the European market, spillover from U.S. trade policy, and persistent macroeconomic volatility all complicate the investment case.
TRANSPORT CORRIDORS AND INFRASTRUCTURE
Turkey’s 2025 state transport budget allocates $11.15 billion for roads and $10.31 billion for rail. Istanbul Airport ranks among Europe’s leading cargo hubs. Rail freight volumes have doubled since 2003.
The flagship project is the Middle Corridor (Trans-Caspian International Transport Route), connecting China to Europe via Kazakhstan, the Caspian, Azerbaijan, Georgia, and Turkey. Transit time: 10-12 days, versus 30-40 by sea.
TITR activity increased thirteenfold in the first half of 2024 compared to the same period in 2023, according to the International Association “Trans-Caspian International Transport Route” (presentation at the Black and Caspian Sea Ports & Logistics Conference, Constanța, July 2024). By 2029, China and Kazakhstan intend to raise the number of container trains on this route to 2,000 per year (Kazakhstan Ministry of Transport, press release, 25 September 2024).
Mersin, Turkey’s largest Mediterranean container port, is undergoing a $455 million expansion to handle Middle Corridor cargo. The World Bank has allocated $660 million for the Eastern Turkey railway segment (Divriği-Kars-Georgian border).
According to TurkStat, maritime shipping carried 56.2% of Turkey’s exports in January-May 2025 ($62.2 billion out of $110.9 billion total). Road accounted for 32%. Air cargo reached $11.7 billion, a 19% year-on-year increase. Rail made up less than 1% of both imports and exports, with $757.6 million and
“Turkey’s dependence on the EU is not merely trade-related but structural in nature—it represents a deep integration of production chains.”— World Bank, Turkey Economic Monitor, November 2025
$1.4 billion respectively. The near-complete absence of rail from the export mix is a structural limitation for a nation at the western end of the Middle Corridor. Although TRY 305.2 billion is set aside for rail in the 2025 budget, it takes years, not quarters, to turn budget lines into freight capacity. Storage and transshipment infrastructure along Turkey’s 1,557-km Mediterranean coastline remains inadequate.
The Development Road—a 2,700-km rail corridor from Iraq’s Al-Faw port through Turkey to Bulgaria—could reshape Gulf-to-Europe cargo flows. Construction timelines remain undefined.
TRADE WITH THE EUROPEAN UNION: STRUCTURAL DEPENDENCE
The corridors described above carry freight overwhelmingly in one direction: toward the European Union. Turkey’s main trading partner is the EU—in 2024, 32.1% of Turkey’s imports and 41.4% of its exports involved EU member states, according to the European Commission. Textiles, machinery, electrical components, automobiles and auto parts are the top categories in both directions.
The EU’s share of foreign value added integrated in Turkey’s final demand is 16%, according to the World Bank’s Turkey Economic Monitor (November 2025), drawing on OECD TiVA statistics (2020). In contrast, the United States accounts for 1.4% and China 2.6%. According to the same analysis, Turkish growth is reduced by 1.5 percentage points over a two-
year period for every percentage point that the EU’s growth declines.
The customs union, in effect since 1996, underpins this integration. It does not, however, cover services, agriculture, or public procurement—sectors accounting for more than half of Turkey’s GDP. Additionally, when the EU signs free trade agreements with third countries, Turkey must open its market on equivalent terms without guaranteed reciprocal access.
Modernization of the customs union has been under discussion since the mid-2010s. A High-Level Trade Dialogue between the EU and Turkey was initiated in July 2024, and its second session was held in Ankara in July 2025 (European Commission, joint statements, 2024-2025). A 2021 European Parliament study estimated the potential GDP impact of modernization at 1.84%. No agreement has been reached.
INVESTMENT REGIMES AND INDUSTRIAL ZONES
Turkey operates more than 350 Organized Industrial Zones (OIZs) spread across all 81 provinces, offering shared infrastructure, simplified permitting, and reduced corporate tax rates—typically 50% exemptions on income and property taxes for manufacturers within the zones (Investment Office of the Presidency of the Republic of Turkey). In addition, the country hosts 12 Technology Development Zones (TDZs) designed to attract R&D-intensive firms, with full corporate tax exemptions on income generated from software and R&D activities.
INDONESIA AS A REGIONAL LOGISTICS & INVESTMENT HUB: CHAINS, REGIMES, AND U.S. POLICY IMPACTS
By Mohammed Ali Labchah
INTRODUCTION: INDONESIA’S STRATEGIC PIVOT
Looking at the Indonesian economy in early 2026, there is a visible and intensifying paradox: the nation sits on the world's most critical maritime "chokepoints," yet it often struggles to move its own goods efficiently across its 17,000 islands. For decades, Indonesia was content being a commodity giant, shipping out raw coal and nickel. Today, that is changing. Jakarta is attempting a massive strategic pivot, trying to transform the country into a sophisticated regional logistics and manufacturing hub that can compete with the likes of Vietnam and Thailand [World Bank Indonesia Economic Prospect, 2024].
The ambition is clear in the "downstreaming" policies and the hundreds of national strategic projects currently underway. In theory, Indonesia’s massive domestic market and control over the Malacca, Sunda, and Lombok straits should make it the natural successor to China for "China+1" investment strategies. However, the physical reality of an archipelagic nation creates massive structural bottlenecks. High shipping costs and a fragmented regulatory landscape mean that geography alone isn't enough to guarantee success [IMF Article IV Consultation, 2024; BKPM Investment Report, 2025].
Ultimately, this analysis asks if Indonesia can actually translate its recent reforms into a lasting "hub" status. This is a highstakes gamble. As the U.S. and China continue to fragment global trade, Indonesia is trying to position itself as a neutral, indispensable middle-ground. Whether it becomes a true regional engine or remains a "market of potential" depends on its ability to fix internal execution gaps and maintain investor confidence in its legal frameworks [UNCTAD World Investment Report, 2024; ASEAN Secretariat Trade Review, 2025].
LOGISTICS INFRASTRUCTURE: PORTS, CORRIDORS, AND CONNECTIVITY
Indonesia is currently playing a high-stakes game of geographical Tetris. With over 17,000 islands to stitch together, the government’s "Golden Vision 2045" rests almost entirely on whether it can turn a fragmented archipelago into a seamless conveyor belt for global trade. The results so far are a mix of breakneck construction and stubborn bottlenecks. While the physical landscape is being rewired at an unprecedented pace, the efficiency of that wiring remains a point of contention.
Maritime Gateway Development
The maritime sector is the obvious centerpiece. Tanjung Priok in Jakarta remains the undisputed heavyweight, handling over 7 million TEUs annually and posting a 5.7% throughput increase as of late 2025 [Shipping Gazette, 2025]. However, Priok’s chronic congestion has forced a strategic pivot. The 2024 completion of the Patimban Deep Sea Port in West Java—a $3 billion terminal—was designed specifically to bleed off excess traffic and serve as a dedicated export hub for the automotive sector [PWC Indonesia, 2025].
Further west, the Kuala Tanjung port in North Sumatra is being groomed as a direct competitor to the Malacca Strait hubs of Singapore and Malaysia. Yet, despite these "hard" infrastructure wins, Indonesia’s "soft" logistics performance has seen a surprising dip. In the 2023 Logistics Performance Index (LPI), Indonesia fell 17 spots to 63rd globally, primarily due to failures in "timeliness" and "tracking and tracing" [World Bank LPI, 2023]. This highlights a critical reality: building the port is only half the battle; the digital and bureaucratic tissue connecting them is still lagging.
AMBITIONS,
LIMITS, AND INVESTMENT RISKS
By Mohammed Ali Labchah
INTRODUCTION: THE INFRASTRUCTURE GAMBLE
Looking at the Egyptian economy in 2026, there is a clear and growing paradox: the country's physical landscape is expanding rapidly, but its financial foundations are under significant pressure. Over the last decade, massive infrastructure projects have completely changed the face of the country. The most prominent examples are the New Administrative Capital and a vast new highway system, both of which the government views as the backbone of its "New Republic." However, building these has required constant external borrowing. This has led to a spike in foreign debt, making the national budget highly vulnerable to any changes in global financial markets [IMF Article IV Consultation, 2024].
The real concern here isn't just the rate of economic growth, but whether that growth can actually last. In theory, investing in infrastructure is a good way to fix industrial bottlenecks and boost long-term productivity. But when these projects are built during a time of tight budgets and funded by expensive debt, the strategy can end up creating more economic risk than it solves. It leaves Egypt facing a vital question: Is this investment model a bridge to a more productive future, or is it simply creating a cycle of debt and fiscal instability? [World Bank Egypt Economic Monitor, 2023].
For international investors, this situation makes it difficult to assess risk. On one hand, Egypt has undeniable strengths, such as its massive consumer market and its control over the Canal—a vital global trade route. On the other hand, these benefits are often overshadowed by high inflation, a volatile exchange rate, and debt payments that eat up a huge portion of government revenue [Central Bank of Egypt Annual Report, 2025; IMF Fiscal Monitor, 2024].
Ultimately, the goal of this analysis is to determine if these new roads and cities will generate enough economic activity to stabilize the country's finances. This is especially urgent given today’s global climate of trade fragmentation and rising interest rates [UNCTAD World Investment Report, 2024].
THE INFRASTRUCTURE ENGINE: PROJECTS, PROMISES, AND PRODUCTIVITY
Egypt’s current growth strategy is essentially a massive experiment in state-led development. Instead of the private sector taking the lead, the government is the main driver of the economy. The most obvious symbol of this is the New Administrative Capital (NAC). With a price tag of around $58 billion, it’s a high-tech "smart city" meant to move the government away from Cairo's congestion and attract foreign investors.
However, there’s a catch. Many experts worry that the NAC is soaking up way too much public money while mostly benefiting the elite, rather than helping the wider economy [World Bank Egypt Economic Monitor, 2023; IMF Article IV Consultation, 2024].
Strategic Geography and the Suez Lifeline
It’s not all about fancy new cities, though. Egypt has proven it can build practical, functional infrastructure, too:
• Renewable Energy: The Benban Solar Park is a major success in green energy.
• National Road Network: A massive expansion of highways has improved local transport.
• High-Speed Rail: An $8 billion deal with Siemens is underway to connect the Red Sea to the Mediterranean, which could revolutionize how goods and people move across the country.
The real headache isn't the projects themselves—it’s how Egypt is paying for them. The government is using short-term, expensive loans to fund projects that won't pay off for many years. This creates a risky situation where they constantly need to find new ways to cover rising interest rates [IMF Fiscal Monitor, 2024].
For a long time, the Suez Canal was basically just a giant toll road. Now, the government is trying to turn the Suez Canal Economic Zone (SCZone) into a global industrial hub. The goal is to stop just watching ships pass by and start doing the work—like manufacturing and logistics—on Egyptian soil [UNCTAD World Investment Report, 2024].
External Debt
Infrastructure
Suez Canal Revenue
Debt Servicing
High sensitivity to global liquidity
Long-term productivity potential
Strategic buffer for FX reserves
Crowds out public social spending
IMF (2024)
World Bank (2023)
CBE (2025)
IMF (2024)
The Vulnerability Factor: Even with these upgrades, the Canal is still at the mercy of global politics. Geopolitical tension in the Red Sea or shifts in global trade can instantly hurt Egypt’s income. Plus, neighboring countries are building their own competing trade routes, meaning Egypt can’t take its dominance for granted [Central Bank of Egypt, 2025; OECD Global Trade Outlook, 2024].
Productivity Gains and Execution Constraints
The idea behind all this spending is the "multiplier effect"—the hope that government spending will jumpstart the rest of the economy. In reality, this hasn't quite happened yet for a few reasons:
1. State Dominance: Many big projects are run by state or military-linked companies. While they get things done fast, they often "crowd out" private businesses and make it harder for small companies to compete.
2. Uneven Gains: Infrastructure is great, but it’s not a magic fix. Without cutting red tape and making it easier for small businesses (SMEs) to operate, these billion-dollar assets might end up underused [IMF Selected Issues Paper, 2024; World Bank Private Sector Diagnostic, 2023].
In short, for investors, the big question is whether Egypt is building a foundation for real growth or just building impressive monuments that the country can't quite afford.
“Egypt’s challenge is not a lack of infrastructure, but a lack of productivity-enhancing reforms to make that infrastructure pay off. The new roads and cities are visible, but the invisible reforms—contract enforcement, bankruptcy frameworks, competitive neutrality—are what will determine long-term returns.”
— Ivanna Vladkova Hollar, IMF Mission Chief for Egypt, IMF Press Briefing, March 2025
Source: IMF Transcript (March 2025)
THE MACROECONOMIC TIGHTROPE: DEBT, CURRENCY, AND STABILITY
The most defining feature of Egypt’s economy in early 2026 is its massive debt. On the surface, things are looking up: the debt-to-GDP ratio has dropped to about 85%, a decent improvement from the 96% we saw a few years ago. However, this number hides a much harsher reality. The cost of just paying the interest on this debt is staggering, swallowing nearly 70% of all government revenue. This leaves almost no money left for schools, hospitals, or the kind of public investment that actually grows an economy [IMF Article IV Consultation, 2024; Ministry of Finance, 2025].
Even though Egypt received huge cash injections—like the Ras El Hekma deal and more help from international lenders—this hasn't really fixed the core problem. The country’s external debt is still stuck at a massive $160 billion. Essentially, the government is running the country just to pay back its creditors, which keeps the books balanced but does very little to improve the lives of everyday Egyptians [CBE External Debt Statistics, 2025; IMF Fiscal Monitor, 2024].
Currency and the Cost of Living
After the chaotic devaluations of 2024, the Egyptian pound has finally found some footing. By moving to a more flexible exchange rate, the Central Bank (CBE) managed to kill off the "black market" and boost its foreign reserves to over $52 billion by early 2026 [CBE Annual Report, 2025].
But for the average person, "stability" doesn't mean "affordable". While inflation has cooled down significantly—dropping from a peak of over 40% to around 10–12%—prices for essentials like food and electricity haven't actually come down. This "price rigidity" means people's salaries buy much less than they used to, which has slowed down consumer spending— the traditional engine of the Egyptian economy [World Bank Egypt Economic Monitor, 2024].
BANGLADESH AS A FRONTIER MARKET: GROWTH, INFRASTRUCTURE GAPS, AND INVESTMENT RISKS
By Usama Khan
Over the last two decades, Bangladesh has emerged as one of the most rapidly expanding economies in the world as a result of high export growth, large inflows of remittances, and a large and youthful workforce. Despite the short-term macroeconomic pressures and unbalanced labor market, international institutions forecast that the economy can maintain moderate growth, with the World Bank projecting the GDP growth of approximately 4.8% in the fiscal year 2025-26 and 6.3% in 2026-27 under current policy assumptions1. The International Monetary Fund predicts a recovery to about 4.7 percent in FY2026, subject to policies that drive fiscal and financial stability2.
This analysis examines the dynamic growth and demographics of Bangladesh, how the country has defined its growth in export-oriented manufacturing, acute infrastructure shortages, and the investment risk environment under the transforming global trade trends and transformed U.S. trade policy.
GROWTH DRIVERS AND DEMOGRAPHICS
Bangladesh experienced a strong upward growth trend between 2014-2019, as the historical data in the below chart demonstrate. The peak of GDP growth of 7.88% was observed in 2019, and it reinforcing that Bangladesh is a high-performing frontier market. It has demonstrated remarkable resilience despite the economic crisis of 2020, falling by 3.45 percent, in the midst of the global pandemic, and with growth accelerating to 3.97 percent in 2024, against global macroeconomic headwinds and inflationary pressures.
The demographic dividend in Bangladesh has been a major factor in its development. The country has a population of over 170 million people, with a large working-age
population, which has provided it with a competitive edge in exporting goods in its export-based sectors. However, labor force participation trends have indicated a decline from 60.9% to 58.9% due to a reduction in female participation3
The export-oriented model of industrialization that focuses on ready-made garments (RMG) is the principal driver that contributes to the export performance of Bangladesh. According to institutional statistics of the Export Promotion Bureau, the overall export value of RMG reached about USD 38.5 billion in 2024, of which the European Union and the United States accounted fro about 50% and 18.72% of the total exports, respectively (19.4 billion and 7.2 billion). Other markets like the United Kingdom and Canada collectively accounted for approximately 14% of RMG export earnings, with non-traditional markets (including Japan, Australia, India, and Turkey) taking 16% of the apparel exports4
Exports of ready-made garments (RMG) in Bangladesh have shown consistent growth over the past two decades, as shown in below chart, rising from under USD 28 billion in 2016 to nearly USD 39 billion in 2025. Approximately 80% of total export revenues come from clothing, underscoring a structural dependency on this single manufacturing sector.
Remittances will continue to be a significant external stabilizer, with almost $30 billion in FY2024-25 and foreign exchange reserves support and import funding. Through these advantages, there exists unequal productivity in terms of sectors, and the labour market performance varies according to age, gender, and skill level.
Bangladesh RMG Exports and Share of Total Exports (Billion)
Source: BGMEA Export Performance page Bangladesh Garment Manufacturers and Exporters Association (BGMEA)
INFRASTRUCTURE GAPS AND MEGA PROJECTS
The export-oriented model of growth has enabled Bangladesh to achieve high growth through its ambitious infrastructure development, but there are still structural gaps that limit productivity, increase trade costs, and affect investment decisions. These gaps include transport and logistics infrastructure, energy infrastructure, and port management, all of which are both essential to industrial activity, particularly export manufacturing.
Bangladesh experiences high logistics and transport inefficiencies, which undermine the competitiveness of exports. Chattogram Port, which serves approximately 90% of container traffic, experiences congestion and old handling systems, contributing to delays and increased cost of trade. Inadequate multimodal connectivity of the production centers and the ports also raises the delivery times and shipment costs5.
To address these structural obstacles, the government has also been conducting various mega-infrastructure initiatives that are aimed at changing the connectivity, lowering logistics expenses, and boosting exports:
Ports and Trade logistics: The Bay Terminal Marine Infrastructure Development Project, which is funded by $650 million from the World Bank, is meant to upgrade the port of Chattogram by building a climate-resistant breakwater and channel, including significant dredging works to reduce the vessel turnaround and the cost of vessel turnaround.
Also, the Dhaka Metro Rail (MRT Line-6) initiative can be used to solve traffic jams in the capital, which affects productivi-
ty and freight. Although implementation is in process, execution risk is represented by changes in timelines and costs. Some projects, such as the Padma Rail Link and the Karnaphuli tunnel, are designed to improve the inter-regional relationships, where the latter provides transport between the ports and the manufacturing regions of Chattogram6.
“Improving trade logistics and port efficiency is essential for Bangladesh to sustain export competitiveness as global supply chains become more time-sensitive.”
Mona Haddad, Global Director for Trade & Competitiveness, World Bank
Despite these initiatives, the project's execution experiences governance and capacity issues due to delays and cost escalations, which ultimately affect the investment potential and productivity of Bangladesh.
FOREIGN INVESTMENT & FINANCING STRUCTURE
Foreign direct investment (FDI) is a significant contributor to industrial growth, development of infrastructure, and technological progress in Bangladesh, although the inflows are relatively low compared to regional competitors.
Why World Economic Journal Is Launching a Systemic Focus on SEZs
The global economy is entering a period of structural pressure. Trade regimes are shifting, supply chains are being reconfigured, and competition for capital and technology is intensifying.
Governments are expanding the use of industrial policy instruments, while businesses are increasingly searching for territories where projects can be implemented quickly and predictably.
In this new configuration, special and free economic zones are no longer peripheral experiments. They are becoming instruments of economic resilience.
For this reason, World Economic Journal is launching a systemic editorial focus dedicated to special economic zones around the world. The first step in this direction is the publication of a specialized international edition—the Compendium of Special (Free) Economic Zones of the CIS.
This is not simply a publication. It marks the formal beginning of a permanent theme within the Journal’s agenda.
AN ECONOMY UNDER PRESSURE AND THE SEARCH FOR GROWTH ANCHORS
As the global environment becomes less predictable, the value of well-managed, structured territories increases. Investors are no longer evaluating countries in the abstract. They are
In the context of global supply chain reconfiguration, SEZs are emerging as elements of a new economic architecture
assessing specific locations: where regulatory rules are clear, infrastructure is ready, administrative costs are minimized, and operational risks are manageable.
Special economic zones remain one of the few instruments that allow governments to create such structured spaces within a short timeframe.
Over the past decade, the SEZ model has evolved significantly. It is no longer defined solely by tax incentives. Modern zones represent:
• industrial and logistics platforms,
• technology clusters,
• export-oriented production territories,
• centers for investment attraction and technology transfer.
In the context of global supply chain reconfiguration, SEZs are emerging as elements of a new economic architecture.
WHY SEZS REQUIRE A SYSTEMIC APPROACH
Information about special economic zones is often fragmented. Data is scattered across various sources, presented in inconsistent formats, and frequently framed in promotional rather than analytical terms. For investors and institutional stakeholders, this creates additional friction in assessing opportunities.
The topic requires an institutional and structured format. Our objective is not to create promotional materials but to establish a consistent analytical platform: to document models, compare approaches, assess effectiveness, and examine the role of SEZs in national industrial and investment strategies.
The launch of the CIS SEZ Compendium is a step in this direction.
THE CIS SEZ COMPENDIUM: INSTITUTIONAL CONTEXT
The preparation and publication of the Compendium of Special (Free) Economic Zones of the CIS is carried out by the Committee for Sustainable Development of Regions and International Cooperation of the Business Center for
Economic Development of the CIS, in execution of the decision of the XXIII Meeting of the Council of Heads of Chambers of Commerce and Industry of the CIS Member States dated December 17, 2024, and based on an official communication from the Department of Economic Cooperation of the CIS Executive Committee.
This institutional framework provides the project with formal status and positions it as an official instrument for presenting special economic zones within the region.
For the CIS countries, the SEZ agenda is particularly relevant today. The region simultaneously:
• occupies strategic transit corridors,
• is modernizing its industrial base,
• is strengthening its export orientation,
• is seeking to enhance investment transparency.
Special economic zones form part of this broader transformation.
REGIONAL FOCUS, INTERNATIONAL PERSPECTIVE
The choice of the CIS region as the first stage of this initiative is deliberate. It reflects a combination of geographic positioning, industrial potential, and the need for improved investment communication standards.
The Compendium consolidates information about special economic zones of the CIS member states into a unified format. This enables:
• systematization of legal frameworks and operational regimes,
• structured presentation of sectoral specialization,
• clarification of infrastructure capabilities,
• identification of priority investment projects.
Structured presentation is essential not only for external investors but also for institutional coordination among public authorities and zone management entities.
SEZS AS INSTRUMENTS OF INDUSTRIAL POLICY
Increasingly, governments are using special economic zones as tools for accelerated industrialization. SEZs enable states to:
• concentrate resources on strategic sectors,
• generate employment,
• attract technological expertise,
• pilot regulatory innovations.
In many jurisdictions, zones function as laboratories for administrative reform—implementing digital procedures, streamlined customs systems, and «single window» services. These measures enhance competitiveness relative to traditional regulatory frameworks.
At the same time, the effectiveness of SEZs depends on governance quality and integration with the national economy. Zones cannot operate in isolation; their sustainability is tied to broader economic strategy.
This is precisely why the topic merits continuous professional coverage.
A PERSONAL NOTE
«I am convinced that special economic zones will become one of the key instruments of economic adaptation in the coming years. As competition for investment and technology intensifies, structured and institutionally grounded territories will be able to provide what global capital increasingly demands: predictability, speed of execution, and concentration of resources. This is why World Economic Journal is initiating a systematic engagement with the SEZ agenda—not as a one-time feature, but as a responsible and sustained editorial direction.»
— Robert Gubernatorov Editor-in-Chief, World Economic Journal
FORUM PRESENTATION AND INTERNATIONAL VISIBILITY
The printed edition of the Compendium will be presented at the International Economic Forum of the CIS Member States. This places the project within the official business agenda of the region and reinforces its institutional significance.
The digital version will be accessible through World Economic Journal’s international information channels, ensuring broader visibility among global analytical and investment communities.
For WEJ, it is essential that the SEZ theme develops in a consistent and professional manner, rather than appearing episodically.
THE ROLE OF WORLD ECONOMIC JOURNAL
For World Economic Journal, the launch of a structured SEZ focus represents a natural extension of our editorial direction. The Journal has consistently analyzed developments at the intersection of public policy and business—trade transformations, capital flows, industrial restructuring, and technological change.
Special economic zones sit precisely at this intersection. They reflect strategic government decisions while simultaneously shaping concrete business conditions. Addressing them requires balance: institutional awareness combined with analytical rigor. Our responsibility is to provide this balance.
WHY THIS MATTERS NOW
In a period of global volatility, economic success is increasingly determined by the ability to adapt quickly and strategically. Special economic zones offer governments a mechanism to create growth nodes, and businesses a framework within which to operate with greater certainty.
The launch of the CIS SEZ Compendium marks the beginning of a broader effort to examine special economic zones as an integral component of the contemporary global economy— without excessive optimism, but without underestimating their role.
An economy under pressure requires points of stability.
Special economic zones may become such points.
For this reason, this theme becomes a permanent part of the World Economic Journal agenda.
World Economic Journal (WEJ) is an independent international magazine covering economic trends, social and urban development, sustainability, technology and innovation, and more, with a focus on emerging and frontier markets
WEJ operates since 2009, and since 2011 the magazine has been published in the USA, Canada, EU and other countries
WEJ shatters imposed stereotypes and offers readers the opportunity to draw their own conclusions based on objective facts and data
TARGET AUDIENCE
Investors and business owners
Company executives and CEOs
Policymakers and economists
Innovation and technology leaders
Prominent representatives of international institutions, analysts and researchers
MOBILE VERSION
APPSTORE
GOOGLE PLAY
ISSUU
ZINIO
MAGZTER
MARCH – MAY 2026
3-5 MARCH
BERLIN, GERMANY
ITB BERLIN 2026
ITB Berlin is the world’s leading travel trade show and a strategic barometer for the global tourism economy. The event convenes ministers of tourism, national tourism boards, airline alliances, hospitality groups, destination management organizations, digital travel platforms, and investment funds. Beyond exhibition activities, ITB serves as a high-level policy and strategy forum addressing sustainable tourism, aviation recovery, travel tech innovation, geopolitical risks, and capital flows into tourism infrastructure. It is a central marketplace for global contracts, partnerships, and destination branding.
Website: itb.com
9-13
MARCH
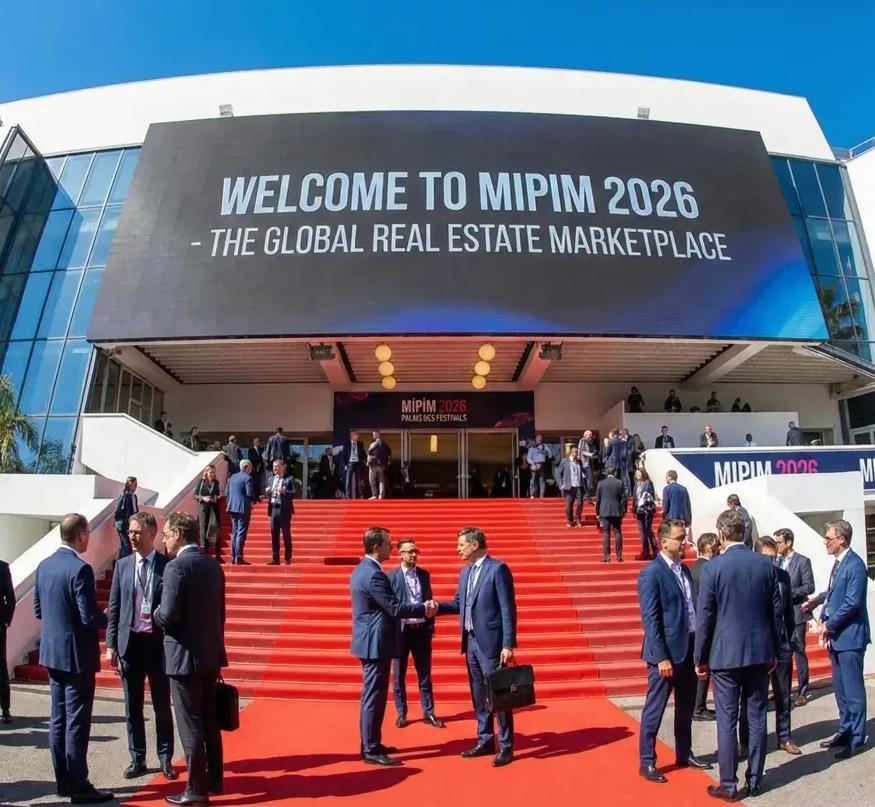
CANNES, FRANCE MIPIM 2026
MIPIM is the premier global real estate investment event, bringing together sovereign wealth funds, pension funds, private equity, institutional investors, city governments, and leading developers. The forum functions as a capital allocation platform for large-scale urban transformation projects, infrastructure corridors, mixed-use developments, and ESG-driven real estate strategies. MIPIM sets global trends in urban finance, regeneration policy, green construction, and smart city planning, influencing cross-border real estate investment decisions.
Website: mipim.com
9-13 MARCH
SAN FRANCISCO, USA GAME DEVELOPERS CONFERENCE (GDC) 2026
GDC is the world’s most influential professional conference for the video game industry, bringing together developers, publishers, platform owners, investors, and technology providers. The conference covers advanced game engines, AI in gaming, monetization models, immersive technologies, and cross-platform ecosystems. It serves as a launchpad for strategic announcements and a space for high-level discussions on the economic future of interactive entertainment.
Website: moscone.com (GDC listing)
PHOTO:
VIENNA, AUSTRIA 69TH COMMISSION ON NARCOTIC DRUGS (CND)UNITED NATIONS (UNODC)
The Commission on Narcotic Drugs is the central policymaking body of the UN system on drug control and international drug policy. Member states review global trends, regulatory frameworks, and law enforcement cooperation. The outcomes shape international conventions, public health strategies, and cross-border coordination mechanisms. Website: unodc.org
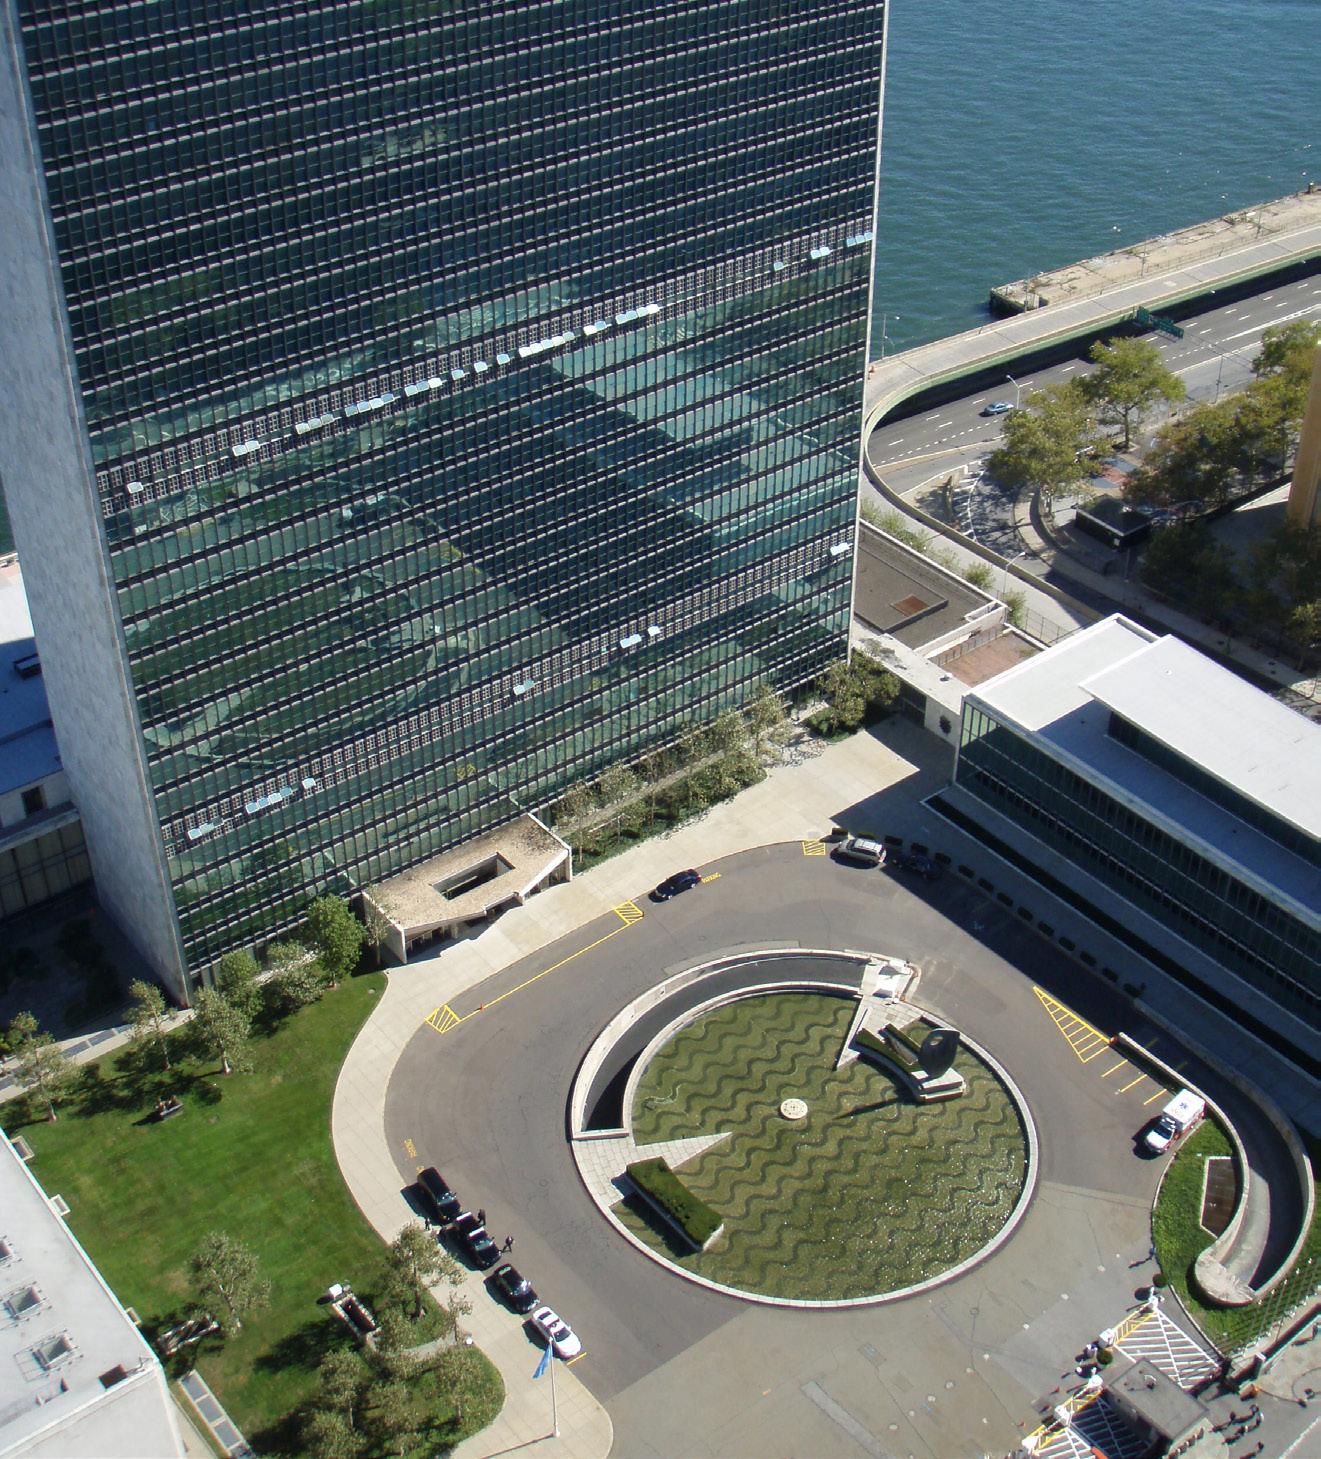
NEW YORK, USA (UN HQ) 69TH COMMISSION ON THE STATUS OF WOMEN (CSW69) - UNITED NATIONS
CSW is the United Nations’ principal intergovernmental body dedicated to gender equality and women’s empowerment. The session brings together ministers, ambassadors, UN agencies, civil society organizations, and development institutions to assess progress on global gender commitments and policy implementation. Discussions shape international frameworks on economic participation, education, leadership representation, and social protection systems.
Website: unwomen.org
AUSTIN, TEXAS, USA SXSW 2026 (CONFERENCE & FESTIVALS)
SXSW is a globally recognized convergence platform for technology, entrepreneurship, creative industries, media, and cultural leadership. The conference hosts heads of technology companies, venture investors, policymakers, startup founders, and global influencers. It highlights emerging technologies, AI, digital culture, sustainability, and cross-industry innovation, serving as a strategic marketplace for partnerships and venture capital activity.
Website: sxsw.com
HOUSTON, TEXAS, USA CERAWEEK BY S&P GLOBAL 2026
CERAWeek is one of the most influential global energy conferences, convening CEOs of energy majors, ministers, sovereign funds, and technology innovators. The forum addresses energy security, transition pathways, climate finance, hydrogen, renewables, and geopolitical risks. It plays a critical role in shaping global investment flows and long-term energy strategy. Website: ceraweek.com
23-26 MARCH
SAN FRANCISCO, USA RSAC 2026 CONFERENCE (RSA CONFERENCE USA)
RSA Conference is a premier global cybersecurity forum bringing together security executives, policymakers, intelligence specialists, and technology leaders. It addresses cyber risk governance, AI-driven security tools, digital resilience, and public-private cooperation. RSAC shapes global standards and strategic approaches to digital defense.
Website: rsaconference.com
13-18
WASHINGTON, D.C., USA 2026 SPRING MEETINGSIMF & WORLD BANK GROUP
The IMF-World Bank Spring Meetings represent one of the most significant annual gatherings in global economic governance. Finance ministers, central bank governors, development institutions, and private sector leaders convene to assess global macroeconomic trends, debt sustainability, climate finance, financial stability, and development policy. The meetings influence multilateral lending frameworks, fiscal coordination, and international financial architecture, particularly for emerging and developing economies.
Website: worldbank.org
13-17 APRIL
NEW YORK, USA (UN HQ) 59TH COMMISSION ON POPULATION AND DEVELOPMENT (CPD59)UNITED NATIONS
CPD is the United Nations’ intergovernmental forum on demographic trends, population policy, and sustainable development. The session evaluates global progress on demographic transitions, migration dynamics, urbanization, aging populations, and youth development. Its conclusions inform national strategies and international cooperation frameworks in health systems, education planning, labor markets, and inclusive growth.
Website: ecosoc.un.org
18-22 APRIL
LAS VEGAS, USA NAB SHOW 2026 (CONFERENCES
& WORKSHOPS)
NAB Show is a global platform for media, broadcasting, and digital content innovation. Industry executives, content creators, streaming platforms, and technology vendors gather to explore production technologies, monetization strategies, immersive media, and AI-driven content creation. The conference program sets industry standards for the evolving media ecosystem. Website: nabshow.com
19-22 APRIL
LAS VEGAS, USA NAB SHOW 2026 (EXHIBITS / SHOW
FLOOR)
The exhibition segment of NAB Show gathers leading global vendors presenting cutting-edge broadcasting, cloud media, AI production tools, and immersive technologies. It serves as a deal-making hub for procurement, partnerships, and strategic technology adoption.
Website: nabshow.com
20 APRIL -1 MAY
NEW YORK, USA (UN HQ)
25TH PERMANENT FORUM ON INDIGENOUS ISSUES (UNPFII TWENTY-FIFTH SESSION) - UNITED NATIONS
The UN Permanent Forum on Indigenous Issues is a high-level advisory body addressing Indigenous rights, cultural preservation, environmental stewardship, and inclusive development. Governments, Indigenous representatives, UN agencies, and civil society organizations engage in policy dialogue on land rights, climate justice, education, and economic participation. The forum strengthens international commitments and visibility of Indigenous communities worldwide.
Website: social.desa.un.org
20-24
GENEVA, SWITZERLAND 29TH COMMISSION ON SCIENCE AND TECHNOLOGY FOR DEVELOPMENT (CSTD)UNCTAD
The CSTD session focuses on science, technology, and innovation as drivers of inclusive development and digital transformation. Policymakers, economists, researchers, and multilateral institutions review progress in digital infrastructure, AI governance, data policy, and innovation ecosystems. The outcomes contribute to global debates on bridging the digital divide and fostering equitable technological growth. Website: ecosoc.un.org
HANNOVER, GERMANY HANNOVER MESSE 2026
Hannover Messe is the world’s leading industrial technology fair, showcasing advanced manufacturing, automation, robotics, hydrogen solutions, and smart energy systems. The event brings together global industrial leaders, technology providers, policymakers, and investors to shape the future of industrial transformation. It is a central platform for Industry 4.0 strategy, digital twins, AI-driven production, and sustainable industrial innovation.
Website: hannovermesse.de
20-24 APRIL
NEW YORK, USA (UN HQ) ECOSOC FORUM ON FINANCING FOR DEVELOPMENT FOLLOWUP - UNITED NATIONS (ECOSOC)
The FfD Forum addresses mobilization of financial resources for sustainable development, debt restructuring, private investment flows, and reform of international financial institutions. It is central to global development finance coordination.
Website: ecosoc.un.org
22-23 APRIL
JEDDAH, SAUDI ARABIA THE WORLD ECONOMIC FORUM: GLOBAL COLLABORATION AND GROWTH MEETING 2026
This WEF meeting convenes global leaders from government, business, finance, and academia to address growth strategies amid geopolitical and economic shifts. Discussions focus on trade, digital transformation, energy security, supply chains, and capital mobilization. It serves as a strategic platform for cross-regional dialogue and high-level policy coordination.
Website: weforum.org
27-29
BERLIN, GERMANY WORLD RETAIL CONGRESS 2026
World Retail Congress gathers senior retail executives, investors, and brand leaders to examine sector transformation, omnichannel strategy, supply chain resilience, and consumer behavior shifts. It provides insight into global retail investment, ESG integration, and technological modernization across markets. Website: worldretailcongress.com
3-6
NATIONAL HARBOR, MARYLAND, USA SELECTUSA INVESTMENT SUMMIT 2026 (U.S. DEPARTMENT OF COMMERCE / ITA)
The SelectUSA Investment Summit is the U.S. government’s flagship foreign direct investment event. International investors engage directly with U.S. states, economic development agencies, and federal officials to explore investment opportunities across technology, manufacturing, infrastructure, and clean energy. The summit strengthens cross-border capital flows and public-private partnerships.
Website: selectusasummit.us
6 -8 MAY 6 -7 MAY
LEIPZIG, GERMANY INTERNATIONAL TRANSPORT FORUM (ITF) ANNUAL SUMMIT 2026OECD
The ITF Summit is the world’s largest gathering of transport ministers and mobility stakeholders. It addresses infrastructure investment, sustainable mobility, decarbonization, digital logistics, and supply chain resilience. The outcomes influence transport policy coordination across OECD and partner countries. Website: summit.itf-oecd.org
NEW YORK, USA (UN HQ) MULTI-STAKEHOLDER FORUM ON SCIENCE, TECHNOLOGY AND INNOVATION FOR THE SDGS (STI FORUM)UNITED NATIONS
The UN STI Forum accelerates SDG implementation through science, innovation, and digital partnerships. Governments, research institutions, startups, and multilateral agencies exchange policy tools and best practices to scale sustainable technologies. Website: ecosoc.un.org
12 -23 MAY
CANNES, FRANCE FESTIVAL DE CANNES 2026 (79TH CANNES FILM FESTIVAL)
The Cannes Film Festival is one of the most prestigious cultural and media events globally, influencing international film markets, cultural diplomacy, and global creative industries. It serves as a strategic platform for distribution deals and global media visibility. Website: festival-cannes.com
PHOTO: MONY MISHEAL /
GENEVA, SWITZERLAND 79TH WORLD HEALTH ASSEMBLY (WHA79)WORLD HEALTH ORGANIZATION (WHO)
The World Health Assembly is the highest decision-making body of the World Health Organization. Health ministers and delegations adopt global health priorities, pandemic preparedness strategies, financing mechanisms, and regulatory frameworks impacting international public health systems.
Website: who.int
MOUNTAIN VIEW, CALIFORNIA, USA (+ ONLINE) GOOGLE I/O 2026
Google I/O showcases major technological advancements across AI, Android, cloud computing, and developer tools. The event shapes global software development trends and digital ecosystem strategies, influencing startups, enterprises, and platform economies worldwide.
Website: io.google
ROTTERDAM, NETHERLANDS WORLD HYDROGEN SUMMIT & EXHIBITION 2026
The World Hydrogen Summit is a premier global platform for hydrogen deployment strategies, investment mobilization, and policy alignment. Governments, energy companies, and infrastructure investors discuss largescale hydrogen production, transport corridors, and decarbonization pathways.
Website: world-hydrogen-summit.com
BERLIN, GERMANY GITEX EUROPE 2026
GITEX Europe is a major international technology gathering focusing on AI, cybersecurity, fintech, and deep tech innovation. It brings startups, venture capital, corporations, and policymakers together to drive Europe’s digital competitiveness.
Website: visitberlin.de
CHICAGO, USA ASCO ANNUAL MEETING 2026 (AMERICAN SOCIETY OF CLINICAL ONCOLOGY)
The ASCO Annual Meeting is one of the world’s most influential oncology congresses, presenting breakthrough clinical research and treatment innovations. It shapes global cancer care standards and pharmaceutical research strategies.
Website: asco-meeting.org
VIENNA, AUSTRIA 25TH COMMISSION ON CRIME PREVENTION AND CRIMINAL JUSTICE (CCPCJ) - UNITED NATIONS (UNODC)
The CCPCJ session addresses rule of law, anti-corruption frameworks, transnational crime, and justice reform. Governments and international organizations coordinate policies aimed at strengthening legal systems and international cooperation in criminal justice.
Website: ecosoc.un.org
A creative, competitive America is the answer to a changing world, not trade wars that would close doors, create greater barriers, and destroy millions of jobs. We should always remember: Protectionism is destructionism.
Ronald Reagan 40th President of the United States (1981–1989)
GLOBAL INITIATIVE FOR SUSTAINABLE DEVELOPMENT OF TERRITORIAL ENTITIES