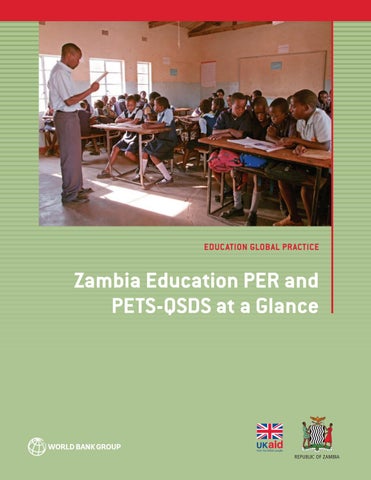
EDUCATION GLOBAL PRACTICE
Zambia Education PER and PETS-QSDS at a Glance
Zambia Education PER and PETS-QSDS at a Glance December 2015
© 2016 International Bank for Reconstruction and Development / The World Bank 1818 H Street NW, Washington, DC 20433 Telephone: 202-473-1000; Internet: www.worldbank.org Some rights reserved 1 2 3 4 19 18 17 16 This work is a product of the staff of The World Bank with external contributions. The findings, interpretations, and conclusions expressed in this work do not necessarily reflect the views of The World Bank, its Board of Executive Directors, or the governments they represent. The World Bank does not guarantee the accuracy of the data included in this work. The boundaries, colors, denominations, and other information shown on any map in this work do not imply any judgment on the part of The World Bank concerning the legal status of any territory or the endorsement or acceptance of such boundaries. Nothing herein shall constitute or be considered to be a limitation upon or waiver of the privileges and immunities of The World Bank, all of which are specifically reserved. Rights and Permissions
This work is available under the Creative Commons Attribution 3.0 IGO license (CC BY 3.0 IGO) http:// creativecommons.org/licenses/by/3.0/igo. Under the Creative Commons Attribution license, you are free to copy, distribute, transmit, and adapt this work, including for commercial purposes, under the following conditions: Attribution—Please cite the work as follows: World Bank. 2016. “Zambia Education PER and PETS-QSDS at a Glance.” World Bank, Washington, DC. Translations—If you create a translation of this work, please add the following disclaimer along with the attribution: This translation was not created by The World Bank and should not be considered an official World Bank translation. The World Bank shall not be liable for any content or error in this translation. Adaptations—If you create an adaptation of this work, please add the following disclaimer along with the attribution: This is an adaptation of an original work by The World Bank. Views and opinions expressed in the adaptation are the sole responsibility of the author or authors of the adaptation and are not endorsed by The World Bank. Third-party content—The World Bank does not necessarily own each component of the content contained within the work. The World Bank therefore does not warrant that the use of any third-party-owned i ndividual component or part contained in the work will not infringe on the rights of those third parties. The risk of claims resulting from such infringement rests solely with you. If you wish to re-use a component of the work, it is your responsibility to determine whether permission is needed for that re-use and to obtain permission from the copyright owner. Examples of components can include, but are not limited to, tables, figures, or images. All queries on rights and licenses should be addressed to the Publishing and Knowledge Division, The World Bank, 1818 H Street NW, Washington, DC 20433, USA; fax: 202-522-2625; e-mail: pubrights@worldbank.org. Cover photo: Zambian schoolroom. © Bread for the World. Used via Creative Commons license (https:// creativecommons.org/licenses/by-nc-nd/2.0/). Further permission required for reuse. Cover design: Bill Pragluski, Critical Stages, LLC.
Contents What Are the Public Expenditure Review and Public Expenditure Tracking Survey and Quantitative Service Delivery Survey?. . . . . . . . . . . . . . . . . . . . . . . . . . 1 The Education PER in Zambia: Highlights . . . . . . . . . . . . . . . . . . . . . . . . . . . . . . . . . . . . 2 Education Public Expenditure Tracking and Service Delivery in Zambia: Highlights . . . . . . . . . . . . . . . . . . . . . . . . . . . . . . . . . . . . . . . . . . . . . . . . 3 Summary of the Findings: PER . . . . . . . . . . . . . . . . . . . . . . . . . . . . . . . . . . . . . . . . . . . . . 4 Summary of the Findings: PETS-QSDS . . . . . . . . . . . . . . . . . . . . . . . . . . . . . . . . . . . . . . 9 Appendix A Service Indicators of Major Education Inputs in the 2014 Quantitative Service Delivery Survey . . . . . . . . . . . . . . . . . . . . . . . . . . . . . . . . . . . . 15 Appendix B Summary Table of Policy Recommendations, Public Expenditure Review. . . . . . . . . . . . . . . . . . . . . . . . . . . . . . . . . . . . . . . . . . . . . 16 Appendix C Summary Table of Policy Recommendations, Public Expenditure Tracking Survey and Quantitative Service Delivery Survey . . . . . . . . . . . . . . . . . . 17
Figures 1 Coverage of Public Expenditure Review and Public Expenditure Tracking Survey and Quantitative Service Delivery Survey. . . . . . . . . . . . . . . . . . . . . . . . . . . . . . . . . . . . . . . . . . . . . . . . 1 2 Number of Secondary Classrooms Required in 2020 . . . . . . . . . . . . . . . . . . . . . . . . . . . . . . . . . . . . . . 4 3 Projected Cost for Free Secondary Policy. . . . . . . . . . . . . . . . . . . . . . . . . . . . . . . . . . . . . . . . . . . . . . . . 5 4 Rate of Returns to Education among Wage-Employed Workers, by Gender. . . . . . . . . . . . . . . . . . . 6 5 Simulation of the Repayment and Cost of Bursary Scheme. . . . . . . . . . . . . . . . . . . . . . . . . . . . . . . . . 7 6 Trends in Grade 5 Student Learning Assessment, 1999–2014. . . . . . . . . . . . . . . . . . . . . . . . . . . . . . . 9 7 Grade 5 and 9 Learning, by Income Tercile. . . . . . . . . . . . . . . . . . . . . . . . . . . . . . . . . . . . . . . . . . . . . . 10 8 Pupil-Textbook Ratio (per Five Students), by Subject, Education Level, and Urban-Rural Location . . . . . . . . . . . . . . . . . . . . . . . . . . . . . . . . . . . . . . . . . . . . . . . . . . . . . . . . . . . . . . . 10 9 Teacher Assessment in Grades 5 and 9, by Subject and Rural-Urban Location. . . . . . . . . . . . . . . . 11 10 Teachers’ Activities. . . . . . . . . . . . . . . . . . . . . . . . . . . . . . . . . . . . . . . . . . . . . . . . . . . . . . . . . . . . . . . . . . 12 11 Action Taken by Head Teachers to Address Teacher Absenteeism, by Education Level. . . . . . . . . . . . . . . . . . . . . . . . . . . . . . . . . . . . . . . . . . . . . . . . . . . . . . . . . . . . . . . . . . . . . 12 12 Transfer Rates of Grade 5 and Grade 9 Teachers between Urban and Rural Schools. . . . . . . . . . . . . . . . . . . . . . . . . . . . . . . . . . . . . . . . . . . . . . . . . . . . . . . . . . . . . . . . . . . . . . . 12
Contents iii
Tables A.1 Indicators of Major Education Inputs in 2014 QSDS . . . . . . . . . . . . . . . . . . . . . . . . . . . . . . . . . . . . 15 B.1 Summary Table of Policy Recommendations . . . . . . . . . . . . . . . . . . . . . . . . . . . . . . . . . . . . . . . . . . . 16 C.1 Short- and Long-Term Strategies for Achieving the Overarching Goals for Zambia’s Education Policy . . . . . . . . . . . . . . . . . . . . . . . . . . . . . . . . . . . . . . . . . . . . . . . . . . . . . . . . . . . 17
iv Contents
What Are the Public Expenditure Review and Public Expenditure Tracking Survey and Quantitative Service Delivery Survey? Public Expenditure Review (PER) in Zambia addresses the efficiency and equity of the macrolevel policy framework, budget allocations, and budget exe cution for primary education; secondary education; technical education and vocational and entrepreneur ship training (TEVET); and higher education. A PER is a diagnostic instrument used to evaluate the effectiveness of public finances (figure 1). It analyzes government expenditures over a period of years to assess their consistency with policy priorities and determine what results were achieved. Many governments have made strides toward including PERs as part of their budget planning cycle. By examining how public expenditure was allocated and managed, governments and donors are better able to assess not only the impact of their investment but also the effectiveness of budget planning and execution. PERs help countries diagnose spending problems and develop more effective and transparent budget allocations. The objective is to establish a baseline understanding of key fiscal management and policy challenges, highlight
priority reform areas for policy makers, and set the agenda for the subsequent phase of budgetary planning. The Public Expenditure Tracking Survey (PETS) traces fund flows from the central government to schools in order to identify leakages and assess efficiency and effectiveness in the use of public funding. The Quantitative Service Delivery Survey (QSDS) examines the efficacy of spending, incen tives oversight, and the relationship between those who contract for a service (for example, parents) and those who deliver it (schools and teachers). The 2015 education PETS-QSDS in Zambia evaluates three aspects of general education in Zambia: (i) educational performance, (ii) the distribution of general education public expenditure and school-level financing in terms of equity, and (iii) various education inputs, including physical facilities and quality of teachers. It also attempts to show the link between educational performance and educational inputs and to offer constructive recommendations for the government of Zambia to consider.
Figure 1 Coverage of Public Expenditure Review and Public Expenditure Tracking Survey and Quantitative Service Delivery Survey
Policy framework
Budget allocation
Budget execution
Intermediate and final output Sector outcomes
Supply chain process
What Are the PER and PETS-QSDS?
Service delivery process
1
The Education PER in Zambia: Highlights The PER in Zambia recommends efficiency improvements in the education sector to support areas identified as needing more investment. • On a positive note, the largest share of the government budget for education reflects the strong commitment of the government to improve the education system in the country. • However, there are areas in the education sector needing more budget support: • There is a serious shortage of secondary schools. The current number of secondary schools can accommodate only about 30 percent of the current students in grades 1–5. • A free secondary education, which the government aims to introduce progressively, would require a sixfold increases in government spending on secondary school grants. • While the TEVET sthubsector produces a high-quality labor force, for which demand is increasing, it receives the smallest share of the government’s total education expenditure (per 2013 figures). It is also
2
low in comparison to the shares that other African countries spend on TEVET. • Capital investment (equipment and rehabilitaion) in TEVET is insufficient at the institutional level, which, in the long run, adversly affects the quality of training. • The education sector also needs serious improvement in the efficiency of financing and budget execution. • Twenty-eight percent of primary schools do not receive any school grants at all and that there are significant differences among provinces in terms of the amount of money they receive (partly due to incompliance of the budget allocation rule). • Public universities rely heavily on government grants, and they suffer from chronic deficits due to large salary and administrative expenses. • The current bursary scheme in higher education is a loan scheme by law, but it lacks the means to collect on loans. If a loan scheme is fully functional, the loan repayment can contribute to about 10 percent of the annual bursary allocation.
The Education PER in Zambia: Highlights
Education Public Expenditure Tracking and Service Delivery in Zambia: Highlights While access to education in Zambia is slowly improving, student learning has been stagnant for decades. There is serious underinvestment in and mismanagement of critical education inputs such as textbooks and teachers. • Are students learning? • There has been no improvement in student learning since the first national learning assessment was conducted in 1999. Learning assessment scores (grade 5) in 1999 were 34 percent in math and 33 percent in English in 1999. In 2014, they were 35 percent in math and 31 percent in English. • What are the key barriers in improving students’ learning? • There is a significant shortage of textbooks because of a lack of funding and poor exectuion of textbook policy. Five primary school students share less than 1 textbook for each subject (1.0 for mathematics, 0.9 for English, and 0.9 for science), and five secondary school students share between 1 and 1.7 textbooks, depending on the subject (1.0 for math, 1.7 for English, and 1.0 for science).
• Teachers are poorly managed: (i) teacher attrition is high, and a large percentage of teachers want to and do transfer schools; (ii) teacher absenteeism has remained almost the same for the past decade; and (iii) teacher subject knowledge is insufficient, especially at grade 9. • What are the other significant education inputs correlated with higher learning outcomes? • At the school level, access to a library, a lower pupil-teacher ratio, and a longer school day are correlated with higher student learning outcomes. • At the teacher level, the presence of contract teachers significantly raises the learning outcomes of students, and a teacher’s subject knowledge has a strong positive correlation with student learning outcomes. In addition, teachers who are intrinsically motivated and care for the community positively correlate with student learning outcomes. • At the student level, having a textbook, the frequency of questions that a teacher asks a student, and a student’s school attendance are important factors in higher learning outcomes.
Education Public Expenditure Tracking and Service Delivery in Zambia: Highlights
3
Summary of the Findings: PER The largest share of government budget goes to the education sector in Zambia. However, the allocation and execution of the budget within the education sector are not efficient. The government of Zambia (GoZ) has historically shown a strong commitment to educational development by allocating a relatively large proportion of its budget to the education sector. The ratio of government expenditure in education to gross domestic product (GDP) is strong, ranging between 3.7 percent and 4.4 percent through 2006–13, and it is projected to have exceeded 5 percent in 2014 and 2015. This is relatively high for the region and comparable to other emerging economies. However, there are certain education policies that need greater support from the government, and the funding for those should come from existing education-sector funding by reducing deficits caused by inefficient use of available funds.
The current number of secondary schools can accommodate only about 30 percent of the current students in grades 1–5. While the Zambian government continues to improve the accessibility of secondary education, the number of new secondary schools required to accommodate prospective secondary school students is alarming. Suppose 50 percent of the current grade 1–5 students are in the secondary school in 2020, the number of classrooms in secondary education required to accommodate these students without changing the current classroom-pupil ratio (1:66) is 17,922, which translates into an additional 6,662 classrooms (figure 2). The current number of secondary schools (683 as of 2013) can sustain 31 percent of current grade 1–5 students transitioning to secondary education. This means that increasing the accessibility of secondary schools will continue to be a policy priority for the next decade
Figure 2 Number of Secondary Classrooms Required in 2020
Secondary classrooms needed in 2020
30,000
25,000
20,000
17,415 13,831 10,246
15,000
6,662 3,078
10,000
5,000
11,260
11,260
11,260
11,260
11,260
50
60
70
80
0 40
Primary students transitioning to secondary (%) Current number of classrooms
4
Additional classrooms needed
Summary of the Findings: PER
However, the recent reintroduction of a previ ous primary and secondary education model can hamper access to lower secondary education even further, unless it is properly implemented. The government recently started to “reintroduce” the primary and secondary education system from the existing basic and high school system. The impetus was a low conversion rate of the primary to the basic system that had been introduced in 1996. Eighty-eight percent of lower secondary schools belonged to basic schools (grades 1–9) in 2013. These basic schools are supposed to become primary schools offering only grades 1–7. This means that grades 8–9, previously part of the basic schools, would go through significant school conversion. These grades may be absorbed by secondary schools. However, the number of secondary schools is very small, and there may be many catchment areas where there is no secondary school available within walking distance. The lower secondary school conversion may create stress in the supply of lower secondary grades. Therefore, the conversion of basic schools to
primary schools has to be implemented with proper planning that considers the supply of secondary schools offering grades 8–9. The free secondary school policy requires signifi cant budget support, which may not be currently available. Therefore, incremental implementation of the policy is recommended, starting with removal of the school fee for the most vulnerable (poor) students first. A free secondary education that the government aims to introduce progressively would require increasing government spending on secondary school grants by more than sixfold, even if enrollment in secondary education increases at the current pace (figure 3). Secondary schools charge, on average, ZMK 312 to each student to finance operating costs, and students pay ZMK 187 annually for tuition and Parent Teacher Association fees. It is apparent that the current school grant of ZMK 29 per student at the provincial level is not enough to fully cover the cost of secondary education, and it is unrealistic to expect the gap to be closed solely by government grants.
Figure 3 Projected Cost for Free Secondary Policy 200
150 ZMW (millions)
144.1
100
50 22.1
0 2014
2015
2016
2017
2018
Tuition support required
Summary of the Findings: PER
2019
2020
2021
2022
2023
2024
2025
Current budget level (secondary school grants)
5
The share of government education expendi ture on TEVET is the smallest among education subsectors (less than 1 percent of total education expenditures in 2013) even though the current labor market pays very high wage premiums to higher skills. Compared to workers with no education, workers with grades 1–7 earn salaries 16 percent higher if they are male and 6 percent higher if they are female (figure 4). The wage premium increases to 80 percent and 107 percent, respectively, for men and women in the case of grades 8–12. The premium among Bachelor’s degree holders reaches 268 percent and 247 percent for women and men, respectively. In addition, following secondary education (grade 12) with postsecondary education (TEVET and higher education) makes a significant difference in the chances of getting formal employment. While 31 percent of male workers who have secondary education (grades 8–12) work in the formal sector, 78 percent of those with a certificate qualification work in the formal sector. For female workers, the contrast is even starker. Fifteen percent of female workers with secondary education are employed in the
formal sector, while 77 percent of those with a certificate qualification work in the formal sector. Further, while almost all secondary education graduates in the formal sector have nonprofessional occupations, more than 60 percent of those with a certificate qualification hold a professional occupation. Financial management at the institutional level in TEVET is relatively healthy in general. However, it is accompanied by low capital invest ment, especially for smaller institutions. Low capital investment is probably the main victim of expenditure items in TEVET. The TEVET system inherently requires continued investment in relatively expensive equipment to provide relevant training to meet the latest labor market demands. Hence, it is of great concern that the low level of capital investment, especially at relatively smaller institutions, could adversely affect the quality of training in the long run. Meanwhile, there are serious inefficiencies in budget execution and in public expenditure. Public universities rely heavily on government grants and suffer from chronic deficits due to heavy salary and administrative expenses.
Figure 4 Rate of Returns to Education among Wage-Employed Workers, by Gender 300 268
Wage premium (percent)
250 247 200
197
185 175
174
A levels
Certificate
150 107 100 80
50 16 6 0 Grade 1–7
Grade 8–12
Male
6
Degree
Female
Summary of the Findings: PER
Compared to private universities, the high number of nonacademic staff in public universities is a burden, causing high salary expenses to both University of Zambia (UNZA) and Copperbelt University (CBU). The ratio of students to academic staff is 19:1 in UNZA and 28.5:1 in CBU. In comparison, a sampled private university in Zambia shows a staffing level of 18.2:1. As implied by these ratios, there is little risk of a shortage of teaching staff in these universities. On the other hand, the ratio of nonacademic staff to students follows quite a distinct pattern between public universities and a sampled private university. While the ratio is 73.4:1 students per nonacademic staff member in the sampled private university, the ratios are, respectively, 15.3:1 and 15.4:1 for UNZA and CBU. This means there is almost five times more nonacademic staff in the public universities per student than at the sampled private university. One of the important areas for improving the financing in Zambia is the bursary scheme in higher education. The current bursary scheme is a loan scheme by law, but it lacks the means to collect on loans. The repayment period of the loan has
been 10 years since the scheme’s inception in 2004, but none of the student beneficiaries have repaid even a penny to the treasury despite the fact that the contract specified it was a loan program with a return period and interest rates. One of the reasons for this issue is the unclear authority for loan collection and ineffective collaboration with other agencies. Furthermore, the ratio of graduates to loan beneficiaries was 16 percent in 2011 (1,167 graduates to 7,086 beneficiaries), indicating that inefficiency exists in the system, probably in the form of repetition or dropout of sponsored students. If a loan scheme is fully functional, the loan repayment can contribute to about 10 percent of the annual bursary allocation. To understand the cash flow associated with the bursary scheme, a simulation model was produced. Assuming that the number of GoZsponsored students grows at the current pace of 11 percent per annum and university tuitions increase by 17 percent per annum, the nominal amount of bursary expenditure will grow from ZMW225 million in 2013 to ZMW1,309 million in 2020 (figure 5). Yet the annual repayment
Figure 5 Simulation of the Repayment and Cost of Bursary Scheme 1,400
Nominal (ZMK million)
1,200 1,000 800 600 400 200 0 2004 2005 2006 2007 2008 2009 2010 2011 2012 2013 2014 2015 2016 2017 2018 2019 2020 GRZ bursary expenditure
Theoretical repayment
Note: Expenditure until 2013 is the actual expenditure. GoZ = government of Zambia.
Summary of the Findings: PER
7
from graduates could have contributed about ZMW22 million in 2013 if the scheme had been fully functional. This revenue would have contributed about 10 percent of the GoZ expenditure on bursary in 2013, and its contribution will remain roughly around 8 percent toward 2020. While repayment can make an important contribution to the sustainability of the bursary scheme, it is also important to note that the current structure of the bursary scheme, even if it is
8
fully repaid, is not self-sustaining because of the high inflation rate. Students are exempted from paying any interest while they are in school and during the one-year grace period. By the time they start repaying the loan, the real value of the loan (which students started receiving five years earlier) is almost one-third its nominal value. Therefore, the scheme itself won’t be self-sustaining even if the loan scheme is fully functional as per the contract.
Summary of the Findings: PER
Summary of the Findings: PETS-QSDS Are students learning? There has been little improvement in student learning since the first national learning assess ment was conducted in 1999. Scores for English and mathematics for grade 5 remain as low as 32.6 and 35.8 percent, respectively, which shows no improvement of scores in 1999 (figure 6). Grade 9 scores fare worse, with scores of 29 percent for mathematics and 36 percent for English and science. Income disparity in learning at both grades 5 and 9 is an issue. In general, average scores for students from the top 33 percent of household income are higher than the scores for students from lower-income households (figure 7). In English, grade 5 students from the bottom 33 percent of family income score 30 percent, while students from the top 33 percent of family income score 42 percent. Of more concern is that the distribution of scores for students from higher- income families is widely spread, whereas the
distribution of scores for students from lower-income families is concentrated around the lower mean. This may indicate that family income could be the major factor determining low student learning outcomes for low-income students. Certain factors are correlated with student learning and family income. For example, textbook ownership and student attendance are positively correlated with student learning, and students from richer families are more likely to have a textbook and higher attendance than students from poorer families.
What are the key barriers in improving students’ learning in Zambia? Textbooks There is a significant shortage in textbook supply because of the lack of funding and the poor execu tion of textbook policy.
Figure 6 Trends in Grade 5 Student Learning Assessment, 1999–2014 100
Score (%)
80
60
40
34.3 33.2
38.5
38.5
39.3
38.3
33.9
34.5
35.3
34.1
35.8 32.6
20
0 1999
2003
2006 English
Summary of the Findings: PETS-QSDS
2008
2012
2014
Mathematics
9
Figure 7 Grade 5 and 9 Learning, by Income Tercile 100
Score (%)
80 60 40
34 36
42
48
42
35
36 36 38
Life skills
Zambian laguage
32
30 31
45 27 28
33
31
35
35 35
41
20 0
Math
English
Math
English
Science
Grade 9
Grade 5
Poor
Middle
Rich
Figure 8 Pupil-Textbook Ratio (per Five Students), by Subject, Education Level, and Urban-Rural Location
Average number of textbooks that 5 students share
3.0 2.5
2.0 1.6 1.3 1.0
0.9
1.0
1.0 0.9
0.8
0.9
1.2 0.8
0.7
0.0 Math
English
Science
Math
Urban
Averaging urban and rural ratios, five primary school students share less than 1 textbook for each subject (less than 1.0 for mathematics, 0.9 for English, and 0.9 for science) and five secondary school students share between 1 and 1.5 textbooks, depending on the subject (1.0 for math, 1.7 for English, and 1.0 for science). In detail, there is little difference in pupil-totextbook ratios between rural and urban schools 10
English
Science
Secondary
Primary Rural
at the primary level. However, at the secondary level, rural schools have significantly lower ratios than urban schools. See figure 8. The textbook shortage was reconfirmed during the classroom observation conducted at the grade 5 level; 84 percent of teachers use textbooks, while only 8 percent of students use textbooks. The ambiguity in the responsibilities for textbook delivery and in delivery funds and the Summary of the Findings: PETS-QSDS
mismatch between textbook policy and imple mentation exacerbated the shortage in textbook in 2013. The current textbook procurement policy states that the delivery of textbooks is the responsibility of publishers. Primary schools submit textbook orders to the District Education Board Secretaries (DEBS), which convey the orders to publishers on behalf of the schools. Publishers then deliver the textbooks to the schools. Secondary schools purchase textbooks directly from publishers, and publishers are responsible for delivering textbooks to the schools. However, because the textbooks are procured centrally, contrary to the government’s official textbook procurement policy, responsibility for textbook delivery and budgetary support to local units (such as the DEBS and the Provincial Education Office (PEO) for delivering textbooks are not spelled out. For this reason, textbook delivery funds are lacking, and the DEBS deduct money from school grants to deliver textbooks to schools.
Teachers The subject knowledge of secondary school teach ers (grade 9) is not sufficient.
Grade 9 teachers scored approximately 70 percent on the same tests given to students across all subjects and require more subject knowledge to teach effectively (figure 9).When teachers were tested using the same examination questions that were put to their students, grade 5 teachers scored more than 90 percent in mathematics, English, and life skills. Across all subjects, rural teachers performed better than urban teachers. Teacher absenteeism does not show any sign of improvement over the past decades. During random unannounced visits to primary schools, the survey team found that teacher attendance on a given day was 82 percent (on par with the official rate of 83 percent). Furthermore, according to official records available at primary and secondary schools, 16 percent of primary school teachers and 12 percent of secondary school teachers were absent for more than 50 percent of school days in June and were a major factor in bringing down the teacher attendance rate. During visits, the team found that 54 percent of teachers were engaged in teaching activities (in classrooms or outdoors), 8 percent were in classrooms but not teaching, and 20 percent were in school but not involved in teaching activities (figure 10). About 70 percent of teachers’ time is
Figure 9 Teacher Assessment in Grades 5 and 9, by Subject and Rural-Urban Location
Score (% of correct answers)
100 89.7
91.8
91.7
95.2
93.1 95.7 81.9
80
87.0 73.2 62.2
60
67.0 69.7
67.5 67.3
English
Science
40 20 0 Math
English
Life skills
Zambian language
Grade 5
Grade 9 Urban
Summary of the Findings: PETS-QSDS
Math
Rural
11
Figure 10 Teachers’ Activities
Figure 11 Action Taken by Head Teachers to Address Teacher Absenteeism, by Education Level
60 52
50
20
15
16 9
10
4 5
te a ar n
Primary
12
r th e
Secondary
Figure 12 Transfer Rates of Grade 5 and Grade 9 Teachers between Urban and Rural Schools 60
53
50 % of teachers
spent teaching, and about 70 percent of teachers who are present in school are engaged in teaching activities. Head teachers’ actions on teacher absenteeism do not seem to solve the problem. Even though teacher absenteeism has been a problem for several decades, 16 percent of primary school head teachers and 9 percent of secondary school head teachers reported not having taken any action against absent teachers. A large percentage do, however, report teacher absenteeism to the DEBS or the PEOs (41 percent at primary level and 30 percent at secondary) or warn teachers (25 percent primary and 24 percent secondary). See figure 11. This may indicate that the report or warning does not seem to have reduced the problem of teacher absenteeism. Teacher attrition rate is high as is the teacher transfer rate between schools. The teacher attrition rate is hovering around 11 percent, despite two major increases in teacher salaries, and the reason for this attrition is unknown according to the government. Only 10 percent of attrition is from retirement, and about 8 percent of attrition is due to either death or illness. It is necessary for the government to identify the real cause of high teacher attrition. Furthermore, teacher transfers between schools
O
e on
er s ef er D m EB at S/ ter PE to Su O sp en d/ t te ran ac sf he er rs
0
N
Te ou ach td in oo g rs bu N t i ot n cl tea as c sr hin oo g N ot m no te t i ac n cl hin as g sr an oo d m
Te a cl ch as in sr g i oo n m
2
25 24
ch
8
10 0
18
32
30
30
W
20
20
40
R
30
% of head teachers
41
40
at te N nd o an t in ce
% of teachers
50
44
40 30 20
22
24
Urban
Rural
20 14 13
10
10 0 Urban
Rural
Grade 5 teacher Previous urban
Grade 9 teacher Previous rural
are common: 13 percent of all teachers reportedly transferred to other schools in 2013. The percentage of teachers transferring from urban to rural schools is high: 53 percent of transfers at grade 5 and 44 percent of transfers at grade 9 are from urban to rural schools (figure 12). The main reasons for teacher transfers between schools are marriage (20 percent) and better location (16 percent); only 26 percent are official Summary of the Findings: PETS-QSDS
transfers by the ministry. A large percentage of teachers said that they wanted to transfer, but few made an official request. There are several factors correlated with teacher absenteeism and the desire to transfer. Understanding this relationship can help in designing better teacher management policy. Unlike the conventional belief, teachers in a hardship position, school facilities, and physical environment are not significant factors in teachers’ desire to transfer or actual requests for a transfer. The location of the school (rural versus urban) is a major factor, although the desire to transfer does not increase with the remoteness of schools. Teaching intensity, such as the number of teaching hours, number of students per classroom, school shifts, and multigrade teaching, is associated with teachers’ desire to transfer or request a transfer. Head teachers’ and line teachers’ motivations are important in teacher management. A head teacher’s motivation is a strong indicator of teachers’ desire to transfer. If the head teacher has a strong intention to progress through the ranks in 5–10 years, teachers in the school will be more likely to want to transfer (11 percent more likely) and to request a transfer (9 percent more likely). In contrast, if the head teacher is more interested in being in the same community in 5–10 years, teachers will be less likely to request a transfer (10 percent less likely). At the same time, if the head teacher perceives that community interests and his or her self-interest overlap (inclusion of the “other” in the self), teachers in the school will be less likely to want to transfer to a different school. In terms of absenteeism, teachers with a higher calling—meaning they do not separate their work from their personal life and try to fulfill their achievement through work—a higher desire for career advancement, and a higher desire for pro-social impact have a lower probability of being absent from school. Also, teachers with higher prosocial motivation have significantly fewer absent days. Factors related to student learning outcomes Summary of the Findings: PETS-QSDS
At the school level, the presence of a library, the amount of school grant received per child, a lower pupil-teacher ratio, and longer school hours are significantly and positively correlated with student learning outcomes. With regard to school facilities, the presence of a library is the only one with a significant and positive association with student learning outcomes. Other infrastructure, such as having a laboratory, availability of electricity, and number of latrines per students, are not strongly related to student learning. Among all of these factors, the type of teacher position (unpaid volunteer or paid contract teacher) is the most important factor that is positively correlated with student learning. The students of contract teachers have sig nificantly higher learning outcomes (8 percent higher for math and 5 percent higher for English) than students of noncontract teachers (government teachers). Even after taking into account the subject knowledge of contract, the type of position remains important. In addition, teachers’ subject knowledge, per sonalities, and motivations and students’ personal ities and motivation are important factors at the teacher and student levels. Teacher subject knowledge and student learning outcomes have a positive relationship in grade 5, especially for English and the local language. For example, a 1 standard deviation increase in teacher subject knowledge (9 percent for English and 14 percent for local language) is associated with an increase in student scores by 2.0–2.5 percent in English and 4.0–5.0 percent in Zambian language. In math, the relationship between teachers’ subject knowledge and students’ learning outcomes is positive but very marginal. At the student level, having a textbook, the fre quency of questions that a teacher asks a student, and a student’s school attendance are important factors in higher learning outcomes. Having a textbook increases student math scores by 3 percent, and having a textbook is highly correlated with the wealth of the student’s family. However, the relationship between 13
textbooks and student learning persists even after controlling for wealth of the student’s family. Missing one day of school in a week is associated with a 1.0–1.5 percent lower score in math and English, respectively, and the number of days missed is higher for poorer students
14
than for richer students. Homework and frequency of homework assigned are not significant predictors of student learning outcomes, but the frequency of questions that a teacher asks a student is a strong indicator of higher learning outcomes.
Summary of the Findings: PETS-QSDS
Appendix A
Service Indicators of Major Education Inputs in the 2014 Quantitative Service Delivery Survey Table A.1  Indicators of Major Education Inputs in 2014 QSDS Indicator
Description
School absence rate for pupils (% of days absent during the previous week of the survey date)
Grade 5, 15%. Grade 9, 8%
School attendance rate for teachers (% of teachers present during unannounced visit and number of days present in June according to official attendance book)
82% of primary school teachers were present in school during unannounced school visit. Primary: 17 days present out of 21 school days (18.5 urban, 17.2 rural). Secondary: 18 days present out of 21 school days (17.7 urban and 18.2 rural)
Classroom absence rate (% of teachers absent in observation exercise)
During the survey visit (classroom observation), 6.5% of classes were not held. Reasons were (a) teachers were absent from school (20%); (b) teachers were in school but did not show up for class (31%); and (c) class was canceled without notice (48%)
Time spent teaching per day
Grade 5 teachers (primary): 5.5 hours. Grade 9 teachers (secondary): 4.2 hours
Knowledge among teachers (scores on the same examination questions that were put to their students)
Grade 5 teachers: mathematics, English, and life skills, more than 90%. Grade 9 teachers: math, English, and science, approximately 70%
Infrastructure availability
Primary school: potable water, 75%; electricity, 36%; boys per latrine, 83; girls per latrine, 75; pupils per classroom, 70. Secondary: potable water, 93%; electricity, 56%; boys per latrine, 73; girls per latrine, 67; pupils per classroom, 58
Teaching equipment availability
Primary school: library, 13%; science lab, 3%. Secondary school: library, 28%; science lab, 22%
Share of pupils with textbooks
20% for primary and secondary. Primary school: mathematics, 20%; English and science, 18%. Secondary school: math and science, 20%; English, 34%
Pupil-teacher ratio
40 pupils per teacher. Grade 2 schools: urban, 45; rural, 51. Grade 5 schools: urban, 43; rural, rural 37. Grade 7 schools: urban, 39; rural, 31
Student learning (learning assessment score)
Grade 5 scores: math, life skills, and Zambian language, 35%; English, 32%. Grade 9 scores: math, 29%; English and science, 36%
Service Indicators of Major Education Inputs in the 2014 Quantitative Service Delivery Survey
15
Appendix B
Summary Table of Policy Recommendations, Public Expenditure Review Table B.1 Summary Table of Policy Recommendations Subsector
Short-term (1–2 years)
Primary and Secondary Education
Improve the efficiency of public funding in the education sector
TEVET
Increase the allocation of the public expenditures in TEVET as a share of total government education expenditure because the (private) rate of returns is high and the supply of the TEVET graduates is welcomed by the market but remains limited
• Assess needed budget for textbook procurement and distrubtion to all schools • Plan school mapping and confirm and implement the selection criteria for school conversion plans • Develop a secondary school grant formula that takes into account equity issues • Conduct regular monitoring and reporting on primary school grants distribution • Harmonize the education sector data (Education Management and Information System [EMIS], Examination Council of Zambia [ECZ], projects, etc.) including cleaning up the data discrepancies in Education Statistical Bulletin (ESB) (net enrollment rate [NER], repetition, and dropout rates) • Provide training on data analysis (programming) on household surveys (LCMS [Living Conditions Monitoring Survey], Demographic Health Survey [DHS]) to technical staff in the Ministry of Education (MoE)
Medium-term (3–5 years) • Implement the school conversion plan nationwide, using selection criteria • Procure textbooks in a harmonized manner (centralization or discentralization) and increase the textbook budget to ensure distribution is to school level • Analyze education-related areas of LCMS and other household survey data to review possible policy and strategic responses to results
• Identify well-performing institutions that show healthy financial statements and high employment rates and prioritize in investing the limited government funding to such institutions (rather than establishing new institutions) • Identify institutions that show poor performance in financial and academic management (they are likely to be small institutions in rural areas) • Diversify funding sources through public-private partnerships • Develop the financial capacity of bursary scheme to target more poor but capable students to provide financial support • Identify strategic sectors to strengthen specific skills in those sectors (science, engineering, and technology) • Develop the EMIS capacity Higher Education
Improve the efficiency of the public spending on higher education—arrears of public universities are compensated by the MoE • Establish a better targetting mechanism to identify poor students who cannot enroll in university without bursary • Study a new sustainable loan scheme with a strong mechanism in which the MoE tracks down students for repayment • Conduct a thorough assessment of resource management at public universities and mutually agree between public universities and the MoE on a new funding mechanism (such as performance-based funding) and science, technology, and engineering • Identify three to four national priority fields in higher education, especially science, technology, and engineering
16
• Overhaul the current bursary scheme and establish a new loan scheme with more effective targeting mechanism (possibly linking with the national pension scheme) • Gradually introduce performance-based funding not only to public but also to private universities • Strategically provide public funding to more support to science, technology, and engineering fields
Summary Table of Policy Recommendations, Public Expenditure Review
Appendix C
Summary Table of Policy Recommendations, Public Expenditure Tracking Survey and Quantitative Service Delivery Survey Table C.1 Short- and Long-Term Strategies for Achieving the Overarching Goals for Zambia’s Education Policy Type of policy
Short-term strategies (1–2 years)
Medium-term strategies (3–5 years)
Textbook policy
• Review textbook procurement capacity at both DEBS and the MESVTEE and establish clear guidelines regarding textbook policy, including book selection procedures and distribution mechanisms and budgets • Ensure that sufficient budget is released to schools for distributing all textbooks with the new curriculum
• Inform and build the capacity of all stakeholders involved in textbook procurement
School grant distribution
• Enforce the school grant formula used by the DEBS to distribute school grant funds to primary and basic schools and monitor how well it is followed, including the public dissemination of transparent and clear guidelines regarding grant distribution
• Decentralize financial disbursement of school grants from MESVTEE or the Ministry of Finance directly to school bank accounts
Teacher recruitment, deployment, and attendance
• Conduct more research on teachers (including untrained, “contract” teachers and volunteers) to review how to improve attrition, effectiveness, and attendance • Conduct a pilot on how the motivation of the head teacher and classroom teachers can improve the retention of quality teachers • Prioritize training on leadership and management of head teachers to improve teacher attendance and delivery • Have the Ministry of General Education Permanent Secretary send a circular to the PEO, the DEBS, and head teachers advising them to enforce teacher attendance and refer to human resources and public service guidelines
• Using results of the teacher study, revise, implement, and enforce teacher deployment regulations and explore other types of teachers who could teach more effectively • Design and implement a teacher recruitment and deployment policy based on the findings of the pilot study on teacher motivation • Revise the monitoring and evaluation strategy to include explicit measurements of teacher attendance
Teacher performance and training
• Review teacher evaluation systems (such as the Annual Performance Appraisal System) to see what is fit for purpose • Develop a new way of assessing teachers (including head teachers) by developing teacher performance metrics • Review and revise teacher recruitment procedures (at central and decentralized levels)
• Devise an effective teacher evaluation system for recruitment, performance evaluation, and feedback on all teachers and administrators at the school and district levels • Continuously monitor teacher performance and provide feedback with a form of teacher training
Note: DEBS = District Education Board Secretaries; MESVTEE = Ministry of Education, Science, Vocational Training, and Early Education; PEO = Provincial Education Offices.
Summary Table of Policy Recommendations, PETS-QSDS
17
SKU K8642