
APRIL 2026
APRIL 2026
The Office of the Chief Economist of the South Asia Region

© 2026 International Bank for Reconstruction and Development / e World Bank 1818 H Street NW, Washington, DC 20433
Telephone: 202-473-1000; Internet: www.worldbank.org
Some rights reserved
1 2 3 4 29 28 27 26
is work is a product of the staff of e World Bank with external contributions. e findings, interpretations, and conclusions expressed in this work do not necessarily reflect the views of e World Bank, its Board of Executive Directors, or the governments they represent. e World Bank does not guarantee the accuracy, completeness, or currency of the data included in this work and does not assume responsibility for any errors, omissions, or discrepancies in the information, or liability with respect to the use of or failure to use the information, methods, processes, or conclusions set forth. e boundaries, colors, denominations, links/ footnotes, and other information shown in this work do not imply any judgment on the part of e World Bank concerning the legal status of any territory or the endorsement or acceptance of such boundaries. e citation of works authored by others does not mean the World Bank endorses the views expressed by those authors or the content of their works.
Nothing herein shall constitute or be construed or considered to be a limitation upon or waiver of the privileges and immunities of e World Bank, all of which are specifically reserved.
Certain artificial intelligence (“AI”) tools may have been used in creating this work, as indicated in the work, but all transformative and creative effort expressed in the work was performed by the World Bank staff or external contributors. e World Bank is not responsible for any claims, including for errors or inaccurate information, generated by AI programs not controlled or owned by the World Bank.

is work is available under the Creative Commons Attribution 3.0 IGO license (CC BY 3.0 IGO) http://creativecommons.org/ licenses/by/3.0/igo. Under the Creative Commons Attribution license, you are free to copy, distribute, transmit, and adapt this work, including for commercial purposes, under the following conditions:
Attribution—Please cite the work as follows: World Bank. 2026. South Asia Economic Update: Working with Industrial Policy. April. Washington, DC: World Bank. DOI: 10.1596/978-1-4648-2326-8. License: Creative Commons Attribution CC BY 3.0 IGO.
Translations—If you create a translation of this work, please add the following disclaimer along with the attribution: is translation was not created by e World Bank and should not be considered an official World Bank translation. e World Bank shall not be liable for any content or error in this translation
Adaptations—If you create an adaptation of this work, please add the following disclaimer along with the attribution: is is an adaptation of an original work by e World Bank. Views and opinions expressed in the adaptation are the sole responsibility of the author or authors of the adaptation and are not endorsed by e World Bank
ird-party content— e World Bank does not necessarily own each component of the content contained within the work. e World Bank therefore, does not warrant that the use of any third-party-owned individual component or part contained in the work will not infringe on the rights of those third parties. e risk of claims resulting from such infringement rests solely with you. If you wish to reuse a component of the work, it is your responsibility to determine whether permission is needed for that reuse and to obtain permission from the copyright owner. Examples of components can include, but are not limited to, tables, figures, or images.
All queries on rights and licenses should be addressed to World Bank Publications, e World Bank, 1818 H Street NW, Washington, DC 20433, USA; email: pubrights@worldbank.org.
ISBN (electronic): 978-1-4648-2326-8
DOI: 10.1596/978-1-4648-2326-8
Cover design: David Spours (Cucumber Design); Design and Creative Services, Global Corporate Solutions, World Bank Group.
e cutoff date for the data used in the report was March 25, 2026.
AI Disclosure Statement: Gemini 2.5 Flash-Lite, Google DeepMind, was used from November 2025 through January 2026 to classify whether firms hiring in South Asia were multinational firms. Prompts queried the model with firm names and requested a structured response indicating whether a firm operates in multiple countries. e resulting classification was used to construct a firm-level indicator of international exposure. A random sampling of the AI-generated classifications was reviewed and verified.
2.10 Preconditions for industrial policies: Regulation.......................................67
B2.1.1 Exports and AIimpacts inICT and BPOsectors......................................51
B2.1.2 AI adoption among SouthAsia’s trading partners.....................................52
B2.1.3 Impacts of GenAI on AI adoption····························································53
B2.1.4 Impacts of GenAI on hiring......................................................................56
B2.1.5 GVC spillover effects of AIadoption........................................................57
B2.2.1 Asymmetries in South Asian labor markets...............................................71
B2.2.2 Regional wage differentials........................................................................73
B2.2.3 Correlates of regional wagepremiums.......................................................75
B2.2.4 Correlates of growth in regional wagepremiums.......................................77
1.1 Growth in South Asia...............................................................................20
A1.1 Selected indicators of South Asia’s exposure to the Middle Eastconflict...37
B1.1 Listof sectors............................................................................................38
A2.1 Grouping of policy instruments................................................................83
A2.2 GLD sample country and survey year.......................................................83
A2.3 Sample size for estimationof the impact of industrial policy.....................83
A2.4 Estimation results for the impact of industrial policy on exports and imports for South Asia and all EMDEs..................................84
B2.1.1 Summary of reviewed papers....................................................................85
B2.1.2 First-level occupation shares in Lightcast..................................................89
B2.1.3 NAICS 2-digit sectoral share of GVC connections in FactSet...................90
B2.1.4 Top 10 buyers of South Asian GVC suppliers, all sectors..........................90
B2.1.5 Top 10 buyers of South Asian GVC suppliers, professional services..........91
B2.1.6 Impacts of AI exposure byfirm type.........................................................91
B2.1.7 Spillover effects of foreignbuyer exposure.................................................92
B2.1.8 Spillover effects of foreignbuyer exposure bycomplementarity.................92
B2.1.9 Long-difference estimates of own and buyer AI exposure..........................92
B2.1.10 Heterogeneity in spillover effects of foreign buyer exposure on jobs .........93
B2.2.1 Data sources.............................................................................................96
B2.2.2 Relationship between wages and region inSouth Asia...............................97
B2.2.3 Correlation between average regional wage and regional characteristics...102
B2.2.4 Correlation between average regional wage growth and regional characteristics............................................................................103
This report is a product of the Office of the Chief Economist for the South Asia Region (DECSA). The report was managed by Franziska Ohnsorge (Chief Economist, South Asia Region) under the general guidance of Indermit S. Gill (World Bank Group Chief Economist and Senior Vice President, Development Economics) and Johannes Zutt (Regional Vice President, South Asia Region).
Chapter 1 was written by Patrick Kirby and incorporates comments from Graham Hacche (former IMF), Phil Kenworthy, and Naotaka Sugawara (both DECPG). Box 1.1 was prepared by Hagen Kruse and Bob Rijkers (DECPY) and incorporates helpful feedback from Erhan Artuc (DECPY) and Julian Hinz (Kiel Institute). Chetan Ghate (Indian Statistical Institute), Charles Collyns, and Jim Rowe (both former IMF) reviewed all parts of the chapter.
Colleagues from Economic Policy provided country forecasts and other inputs to the country analysis in Chapter 1, including Udahiruni Atapattu (Sri Lanka), Erdem Atas (Maldives), Vincent Belinga (India), Ruijie Cheng (Maldives), Souleymane Coulibaly (Bangladesh and Bhutan), Rangeet Ghosh (Bangladesh), Mohini Gupta (India), Yumeka Hirano (Bhutan), Sharmin Akter Jahan (Bangladesh), Nayan Krishna Joshi (Nepal), Nazmus Sadat Khan (Bangladesh), Kok Zi Cheng (Bhutan), Aurelien Kruse (India), Naresh Kumar (India), Shruti Lakhtakia (Sri Lanka), Ran Li (India), Tanvir Malik (India), Abdoul Ganiou Mijiyawa (Nepal), Arvind Nair (Nepal and Sri Lanka), Dhruv Sharma (Bangladesh), and Richard Walker (Maldives and Sri Lanka).
Chapter 2 was prepared by Zoe Leiyu Xie. Helpful comments were provided by Nathan Lane (London School of Economics and Political Science), Michele Ruta (IMF), Ana Fernandes, and Tristan Reed (both DECPY). Box 2.1 was prepared by Jonah Matthew Rexer and Siddharth Sharma. Gaurav Nayyar (DECWD), Maggie Xiaoyang Chen (George Washington University), and Gaurav Chiplunkar (University of Virginia) reviewed this box. Box 2.2 was prepared by
Margaret Triyana. This box was reviewed by Ana Fernandes (DECPY) and Ritam Chaurey (Johns Hopkins University). Charles Collyns and Jim Rowe (both former IMF) reviewed all parts of the chapter.
Research assistance was provided by Giorgi Bokhua, Nga Thi Phuong Bui, Kaihao Cai, Priya Chopra, Issac Yurui Hu, Klara Katharina Stelzel, Xinyi Wang, Yaoli Wang, and Xiao’ou Zhu.
Quinn Sutton Austin was responsible for the layout and typesetting. David Spours (Cucumber Design) and Design and Creative Services, Global Corporate Solutions, World Bank Group designed the graphics and layout. Graeme Littler and Peter Milne copyedited the chapters. Elena Karaban, Diana Ya-Wai Chung, and Trishna Thapa (all ECR) coordinated the dissemination. Ahmad Khalid Afridi provided administrative support.
South Asia, as used in this report, includes Bangladesh, Bhutan, India, Maldives, Nepal, and Sri Lanka. This series was previously published under the title “South Asia Development Update,” covering countries in the World Bank Group administrative region for South Asia. As of July 2025, the administrative region and series no longer include Afghanistan and Pakistan. This series has been renamed “South Asia Economic Update.” Afghanistan and Pakistan are now covered in the “Middle East, North Africa, Afghanistan, and Pakistan Economic Update” series.
The cutoff date for this report was March 25, 2026.
Around the world, the consensus on how to grow is shifting. For decades, the formula was straightforward: governments lay the main track—sound macro policy, basic infrastructure, clear regulations—while the private sector acts as the engine pulling the economy forward.
Today, many governments want to take the wheel. And they are using industrial policy— government-led actions directed at changing the structure of economic activity—more directly to steer investment, build capabilities, and shape the composition of growth. If industrial policy can help create good jobs and accelerate growth, shouldn’t South Asia jump on board?
In many ways, the region is already on board. South Asian policymakers have long been comfortable with state intervention: state-owned enterprises dominate entire sectors in some countries, for example, and high trade barriers reduce competition from abroad.
But before again taking the wheel, it is worth recognizing a key fact: South Asia is growing faster than any other region, and much of that acceleration is thanks to reforms that reduce the role of the state—opening markets, simplifying regulations, and building infrastructure. e recent trade deal between India and the European Union is a positive signal that, while others are withdrawing from global trade, South Asia is comfortable charting its own course, facing competition with confidence. roughout the region, countries are supporting the private sector by reducing trade barriers, setting more predictable rules, investing in public infrastructure, and improving macroeconomic frameworks.
is does not mean that industrial policy has no role. e task is not to take the wheel from the market, but to set clear signals, remove bottlenecks, and, when needed, switch tracks to achieve job-rich outcomes faster.
A smart approach to industrial policy starts with first-choice public inputs—practical, procompetitive policies that fix specific market failures without heavy distortions. For South Asia, these include industrial parks, skill development programs, market access assistance, and qualityassurance infrastructure.
When governments want to take the wheel more directly, using tools like subsidies, tariffs, or local content rules, they should use them cautiously— with conditional support, transparent selection criteria, and a focus on encouraging competition rather than individual competitors. Otherwise, such tools can lead to exemptions, privileges, and detours that slow growth momentum.
South Asia already has the momentum. e question is whether industrial policy will keep things moving. Fortunately, policymakers don’t need to make an all-or-nothing choice between markets and industrial policy. ey simply need to move the wheel in the right direction.
Indermit Gill
World Bank Group Chief Economist and Senior Vice President
Johannes Zutt
World Bank Regional Vice President for South Asia
South Asia’s growth again surprised on the upside but is expected to slow to 6.3 percent in 2026 amid headwinds from global energy market dislocations. Over the medium-term, trade reforms in South Asian countries could unlock further growth by reducing trade barriers, especially for emerging export sectors. Across South Asia, accelerating job creation is becoming harder as job prospects erode in AI-exposed activities and long-standing subnational labor market disparities persist. To achieve policy goals, South Asian countries make proactive use of industrial policies, at about twice the rate of other emerging market and developing economies (EMDEs). Since 2022, about half of South Asia’s industrial policies have been directed at the manufacturing sector, particularly toward activities with larger employment, higher average wages, or larger or more productive firms. More than other EMDEs, South Asia has deployed trade-related industrial policy measures but their track record in South Asia has been mixed, with import restrictions lowering imports significantly but export support not materially raising exports. Given limited fiscal space and administrative capacity, cross-cutting measures to improve infrastructure, skilling opportunities, and the business environment remain a priority to accelerate and spread growth and jobs more evenly. These can be complemented by targeted industrial policies, prioritizing those that address market failures directly.
Chapter 1. Restoring Growth Momentum amid Energy Market Disruptions. South Asia’s economic growth is expected to slow to 6.3 percent in 2026 amid dislocations in global energy markets. South Asia remains the fastestgrowing EMDE region thanks to the strength of India’s economy. e rest of the region is expected to grow at a pace comparable to other EMDEs. South Asia’s growth prospects could be dampened by more persistent global energy market dislocations or a bout of global financial turbulence transmitted to the region and magnified by domestic weaknesses; by adverse spillovers from the adoption of artificial intelligence in major export markets; and by reform delays. Accelerating growth and job creation remains a major challenge for South Asian policymakers. Carefully designed industrial policy can turn cities into powerful growth accelerators or promote tourism to spread growth more broadly, especially if these policies are combined with broad-based reforms to promote firms’ growth.
Box 1.1. Where Households Gain: Trade Reforms in South Asia. India’s free trade agreements with the European Union and the United Kingdom, as well as Sri Lanka’s planned phase-out of para-tariffs, are expected to remove trade barriers, especially for emerging export sectors. e reforms are anticipated to result in broad-based consumption and real income gains for households across the entire income distribution. e largest benefits are expected for
consumers of manufactured goods, especially among rural households.
In addition to this assessment of the economic outlook, this edition examines the role of industrial policies in South Asia’s policy making, including for two potential use cases: to adapt to labor market disruptions caused by the adoption of artificial intelligence and to narrow regional labor market differentials.
Chapter 2. Where Policy Lands: Industrial Policy and Jobs in South Asia. On average during 2022–25, South Asian countries implemented twice as many industrial policies as the average EMDE. About half of these policies have been aimed at manufacturing. Among the policies targeted at manufacturing, Sri Lanka’s focused on high-employment activities, Bangladesh’s on large firms, and India’s on highwage activities and on large, more productive firms. While the activities with the most industrial policy measures have been the largest source of manufacturing employment growth, they have not been the main source of nonagricultural employment growth. e main source of non-agricultural employment growth has been the service sector, which has received few industrial policies. Compared with other EMDEs, South Asia has relied less on subsidies and more on procurement measures (India) and trade-related measures (elsewhere in South Asia). e latter have had asymmetric impacts in South Asia: import-restricting policies were followed by
South Asia is expected to remain the fastest-growing EMDE region, in part thanks to new trade reforms. The region has proactively used industrial policies, especially for manufacturing, with mixed success. Industrial policies could help narrow regional wage premiums.
A. Real GDP growth
C. India’s and Sri Lanka’s tariff cuts and revealed comparative advantage
B. Sectoral growth rates in South Asia’s three largest economies
statistically significant declines in imports, but export-supporting measures did not produce significant gains in exports. Constrained by limited fiscal space and regulatory capacity, South Asia can focus on broad-based development policies such as infrastructure investment, business environment reforms, and stronger institutions. Where more targeted measures are needed, industrial policy can prioritize those that address clear market failures, such as industrial parks, skill development programs, market access assistance, and quality assurance infrastructure.
E. South Asia: Cumulative change in imports and exports after start of trade defense or export incentive
Sources: ADB Multiregional Input-Output Tables; Central Bank of Sri Lanka; CEPII BACI; Eurostat; GLD (database); GTA database; Haver Analytics; IPUMS USA: Version 16.0 (dataset); Maldives Household Income and Expenditure Survey 2019; MPO; Sri Lanka Customs National Import Tariff Guide 2025; WTO Analytical Database; World Bank.
A. GDP aggregates calculated using real U.S. dollar GDP weights and market exchange rates. Dots indicate forecasts. For India, fiscal years are used, such that 2025 represents FY2025/26.
B. For Sri Lanka and Bangladesh, the figure reflects the average growth for the first three quarters.
C. “Revealed comparative advantage,” as in Balassa (1965), is defined as India’s or Sri Lanka’s export share relative to global average export shares across 16 goods-producing sectors. Positive log values indicate comparative advantages. Vertical axis reports the change in import-weighted average ad valorem duties applied. Bubble areas reflect sectoral export shares in 2024. Trend lines indicate the (unweighted) quadratic polynomial fit on the underlying data.
D. Bars show annual and country average number of new protective (blue) and liberalizing (red, negative) industrial policies implemented in South Asia and other EMDEs.
E. Impulse response function from a local projection estimation of cumulative changes in log imports or exports on a dummy variable for implementation of new trade defense policies (imports, red) or export incentives (exports, blue). t = 0 is first period after policy implementation. Estimation controls for the presence of other active industrial policies in the same country and two-digit ISIC sector. Country-sector, country-year, and sector-year fixed effects are included. Standard errors are clustered at country-sector level. The sample includes protective policies implemented during 2004–23 that were active for more than five years. Shaded regions indicate 90 percent confidence intervals. Trade defense instruments include anti-dumping, anti-subsidy, and other safeguards. Export incentives include export subsidies, export tax incentives, and other export incentives.
F. Red shade represents interquartile range, and red line shows median value for 22 EMDEs, including six EMDEs in South Asia. Bar for euro area shows the cross-country range of country-level average wages in 2024 in 12 euro area countries whose populations aged 15+ years account for more than 1 percent of the euro area population aged 15+ years. Bar for United States shows the cross-state region of state-level average wages in 2024 in 29 U.S.
for
Box 2.1. Where Firms Hire: AI and the Reshaping of Global Value Chains. Artificial intelligence (AI) is already reshaping firms and jobs in South Asia. AI adoption has proceeded rapidly since the release of ChatGPT in November 2022, particularly among affiliates of multinational companies. At the same time, higher AI exposure has been associated with slower hiring: an interquartile-range increase in AI exposure has been associated with a 1.5 percent decline in job postings on average, and with declines of about twice that size for multinational affiliates. Some of these declines appear to be related to spillovers from AI adoption by foreign firms: South Asian firms supplying goods and services to more AI-exposed foreign firms have experienced slower hiring. Value chain upgrading, underpinned by faster AI adoption and skills development, will be critical for firms to remaincompetitive in the age of AI.
2.2.
Di erentials in South Asia. South Asia has some of the largest and some of the smallest withincountry wage differentials by the standards of EMDEs. In South Asia’s larger countries, worker characteristics account for about one-fifth of these subnational wage differentials. South Asia’s remaining wage premiums, after controlling for worker characteristics, are higher in regions with better transport connectivity, more skilled workforces, larger firms, and more services sector activity. Wage premiums appear to be persistent and self-reinforcing. While such regional wage persistence may warrant place-based or industrial policies, South Asia’s experience with these policies has been mixed.
ADB
AE
AI
ASEAN
avg
BACI
bbl
BGD
BIS
BLS
BPO
BRA
BSE SENSEX
BTN
BaTIS
CAN
CAPE
CEPII
CESS
CETA
Chem. & pharma
CHN
CPIA
DAX 40
DEU
EA
EAP
ECA
EMDE
ESP EU
excl
FDI
FRA
FTA
FTSE 100
FY
GBR
GCC
GDP
GFS
GLD
GQII
GST
GTA
Asian Development Bank
advanced economy
artificial intelligence
Association of Southeast Asian Nations
average
Base pour l'Analyse du Commerce International
barrel
Bangladesh
Bank for International Settlements
Bureau of Labor Statistics
business processing outsourcing
Brazil
Bombay Stock Exchange Sensitive Index
Bhutan
balanced trade in services
Canada
cyclically adjusted price-to-earnings
Centre d'Etudes Prospectives et d'Informations Internationales
commodity export subsidy scheme
comprehensive economic and trade agreement
chemical and pharmaceutical industries
China
Country Policy and Institutional Assessment
German stock index
Germany
euro area
East Asia and the Pacific
Europe and Central Asia
emerging market and developing economy
Spain
European Union excluding
foreign direct investment
France
free trade agreement
Financial Times Stock Exchange 100 Index
fiscal year
United Kingdom
Gulf Cooperation Council
gross domestic product
Government
Financial Statistics
Global Labor Database
Global Quality Infrastructure Index
goods and services tax
Global Trade Alert
GTED
GVC
HS
ICE
IDN
IEEFA
IFRPI
IMF
IND
IPUMS
ISIC
ITA
JPN
KNOMAD
KPO
LAC
LHS
LKA
LNG
MDV
MEX
MNA
MNC
MONA
MPO
MVR
Mfg
NBFI
nes
NITI Aayog
NPL
NPLs
OECD
PAL
PLI
PMI
pop
PPP
RCA
RHS
RMG
ROW
S&P
SAR
Global Tax Expenditures Database
Global Value Chain
Harmonized System code
Intercontinental Exchange Endex
Indonesia
Institute for Energy Economics and Financial Analysis
International Food Policy Research Institute
International Monetary Fund
India
Integrated Public Use Microdata Series
International Standard Industrial Classification of All Economic Activities
Italy
Japan
Global Knowledge Partnership on Migration and Development
knowledge process outsourcing
Latin America and the Caribbean left hand side
Sri Lanka liquefied natural gas
Maldives
Mexico
Middle East and North Africa
multinational corporation
Monitoring of Fund Arrangements
Macro Poverty Outlook
Maldivian rufiyaa manufacturing non-bank financial institution not elsewhere specified
National Institution for Transforming India
Nepal nonperforming loans
Organisation for Economic Co-operation and Development
Ports and Airport Development Levy production linked incentive
Purchasing Managers’ Index
population purchasing power parity revealed comparative advantages right hand side ready-made garments rest of the world
Standard & Poor's South Asia Region
SDR
srv
SSA
SSE
T&T
TFP
TTDI
TTF
TUR
U.S. EIA
UAE
UK
UN
UNCTAD
USA
USD
USDA
VNM
WBES
WDI
WEO
WGI
WTO
ZAF
Special Drawing Rights professional service
Sub-Saharan Africa
Shanghai Stock Exchange travel and tourism
total factor productivity
Travel & Tourism Development Index
Title Transfer Facility
Türkiye
U.S. Energy Information Administration
United Arab Emirates
United Kingdom
United Nations
United Nations Conference on Trade and Development
United States of America
United States dollar
United States Department of Agriculture
Viet Nam
World Bank Enterprise Surveys
World Development Indicators
World Economic Forum
Worldwide Governance Indicators
World Trade Organization
South Africa
South Asia’s economic growth is expected to slow to 6.3 percent in 2026 amid dislocations in global energy markets. South Asia remains the fastest-growing EMDE region thanks to the strength of India’s economy. The rest of the region is expected to grow at a pace comparable to other EMDEs. South Asia’s growth prospects could be dampened by more persistent global energy market dislocations or a bout of global financial turbulence transmitted to the region and magnified by domestic weaknesses; by adverse spillovers from the adoption of artificial intelligence in major export markets; and by reform delays. Accelerating growth and job creation remains a major challenge for South Asian policymakers. Carefully designed industrial policy can turn cities into powerful growth accelerators or promote tourism to spread growth more broadly, especially if these policies are combined with broad-based reforms to promote firms’ growth.
South Asia grew an estimated 7 percent in 2025. Absent recent pressures resulting from conflict in the Middle East, growth would have been expected to remain robust at about thispacein2026and2027.Instead,growthis expectedtoslowto6.3percentin2026before regaining momentum in 2027 (figure 1.1). Recent free trade agreements and tariff cuts have improved the region’s export prospects, headlinedbythefreetradeagreementbetween India and the European Union. South Asia’s status as the fastest-growing EMDE region is due toIndia. e restofthe regionisexpected to grow at a pace comparable to other EMDEs.
Aroundtheworld,headlineinflationhadbeen easing amid gradually softening demand, but this progress is being threatened by recent increases in energy prices. In South Asia, inflation is generally within central bank targets. Financial conditions remain accommodative even as central banks adjust tothepossibilityofhigherinflation.
South Asia’s growth prospects could be dampened in a variety of ways. A sustained
Note: This chapter was prepared by Patrick Kirby.
period of high energy prices could drive up inflation and borrowing costs, weighing on growth, fiscal positions, and current account balances. A spate of global financial turbulence could be transmitted to the region and magnified by domestic vulnerabilities, such as high levels of non-performing loans or high interest payment obligations in some countries. Climate-related risks were recently illustrated by the damage Cyclone Ditwah inflicted on Sri Lanka. South Asia’s successes in services exports could become a weakness if key sectors are negatively affected by the spread of AI or new trade restrictions. Progress on key structural reforms could yield growth dividends, just as failure to implement needed changes could lead to growth disappointments.
Accelerating growth and job creation remains a major challenge for policymakers. Cities can be apowerful tool foraccomplishing thisgoal. Reforms to empower local governments can improve South Asian cities’ ability to drive productivity growth and create large numbers of jobs. Concentrating growth in small areas while other regions lag can, however, be a recipe for social tensions. Efforts to promote tourism can spread growth more broadly, including into rural areas where poverty is oftenconcentrated.
Absent recent pressures in global energy markets, growth in South Asia would have been expected to remain robust at about its 2025 pace in 2026 rather than slowing sharply. South Asia’s status as the fastest-growing EMDE region is due to India, whose export prospects have been improved by recent trade agreements. Elsewhere in the region growth is comparable to the EMDE average. Growth is at risk from persistently high energy prices, financial turmoil, a slowdown in services exports, or setbacks in structural reforms. Growth could be improved by strengthening cities, channeling the potential of tourism, and measured use of industrial policy.
Well-planned and implemented industrial policy can help accelerate and spread growth. South Asia doubled the number of annual newindustrialpolicymeasuresbetween2016–19 and 2022–25. Given limited fiscal space and regulatory capacity, South Asia can focus on broad-based development policies complemented by first-choice industrial policy measures that address market failures. A crosscutting priority is improving infrastructure in theregion.
Conflict in the Middle East is threatening activity around the Straitof Hormuz, which is a critical chokepoint for energy shipping. Roughly 20 percent of global petroleum production and a similar share of liquefied natural gas (LNG) transit through the Strait. is has been interrupted as ships have been attacked, insurance coverage has been withdrawn, and regional production facilities have been damaged. Energy prices have surged. is will increasingly affect inflation andgrowthifitcontinues.
Sources: Deep Trade Agreements Database; FactSet; Felten, Raj, and Seamans (2023); GTA; Haver Analytics; Lightcast; MPO; Pizzinelli et al. (2023); WDI; World Bank.
A. “Other EMDEs” represents 141 EMDEs. GDP aggregates calculated using real U.S. dollar GDP weights and market exchange rates. Dots indicate forecasts. For India, fiscal years are used, such that 2025 represents FY2025/26.
B. Shares of FTAs in global GDP are based on US$ in current prices. “Negotiations concluded” (but not yet in force) for India include agreements with the European Union and the United Kingdom.
C. Data are 2025Q1 for Sri Lanka; 2025Q3 for India and the Maldives; and 2025Q2 for other SAR countries. “Other EMDEs” shows the simple median and interquartile range for 87 EMDEs.
D. MNC affiliates are multinationals headquartered outside South Asia; local firms are South Asiaheadquartered with no foreign buyers; GVC suppliers have international buyers pre-ChatGPT. Bars show coefficients and whiskers show 95 percent confidence intervals from a firm-level regression of outcomes on average AI exposure of pre-ChatGPT job postings interacted with a post-ChatGPT indicator. Refer to chapter 2 for more details.
E. T = 0 denotes the year in which the tourism share rose by more than 1.67 percentage points in a single year, which is the 90th percentile of increases in tourism share in the sample. Pink area shows the interquartile range. Sample includes 159 EMDEs from 1995 to 2020.
F. Bars show annual and country-average number of new
implemented in South Asia and other EMDEs. Blue bars show number of protective measures. Red
measures, shown as
values.
e global economy is also in the midst of major shifts in the global trading system. e United States increased its effective tariff rate from 2.4 to 16 percent in 2025 through an array of country-specific increases, before changing to an across-the-board 10 percent increase in February 2026 after a Supreme Court ruling (Budget Lab at Yale 2026). Uncertainty about U.S. tariffs remains elevated: the administration has stated its intention to increase global tariffs to 15 percent in the future using alternative legal authorities. Tariff volatility and policy uncertainty haveweighedon some sectors,but this has been offset by surging investment in technologiessuchasartificialintelligence.
e effect of higher energy prices and tariffs is not yet apparent in global inflation. As of February, global inflation was slowly trending down closer to central bank targets, driven by gradually softening demand and the low energy prices prevalent at the beginning of 2026(figure1.2). ereweremanyexceptions to the overall trend. Inflation in the United States remains closer to 3 percent than the country’s 2 percent target, with goods prices pushed up by tariffs. Prices in China have been largely flat, restrained by the continuous declineinhouseprices.
As of early March, consensus forecasts for growth in major economies had been mostly trending up. Global surveys also suggested steady momentum for both manufacturing and services prior to the recent disruptions in globalenergymarkets.
Headline global merchandise trade growth was resilient to tariffs and uncertainty in 2025, helped by strong demand for products related to artificial intelligence and frontloading of shipments prior to tariffs coming into effect (WTO 2025). On an annual basis, the slowdown in merchandise trade has been gradual. Global trade in goods and services grew by an estimated 3.4 percent in 2025— only slightly below its pre-pandemic average of 4.6 percent—and is expected to slow to an average of 2.5 percent in 2026 and 2027 (World Bank 2025a, 2026). Beneath this surface stability, there are more substantial underlying shifts. U.S. imports fell across most categories in 2025 due to increased tariffs. Trade in high-tech capital goods associated with AI-related investment surged, however, bolstering U.S. imports and East Asian exports. China’s exports also surged while those from the euro area lagged. Trade in services has been largely unaffected by recent volatility and has continued to grow as a share of global trade—it grew 9 percent in 2025 and now accounts for 27 percent of globaltrade(UNCTAD2026).
Global disinflation continued in 2025, but is being threatened by rising energy prices. Consensus forecasts and surveys pointed to stable growth in major economies prior to recent energy market disruptions. Global trade has been resilient to major shifts in the global trading system, with more substantial shifts at the country level. The expectation that major central banks will lower policy rates has faded as energy prices have increased.
Sources: Consensus Economics; Haver Analytics; MacroMicro; MPO; Trading
World Bank; World Trade Organization.
A. Global inflation is global composite CPI from Haver Analytics. Coal prices are based on the IMF’s monthly coal price index (January 2023 = 100). Oil (Brent crude) and gas (ICE Dutch TTF) prices are daily series, smoothed using a 7-day moving average and indexed to their January 2023 average (=100).
B. “Other AEs” includes 15 economies. China forecasts from MPO.
C. Dotted lines show averages since January 2000.
D. Trade includes imports and exports in current U.S. dollars.
E. Bars show 6-month average of year-over-year growth in real trade flows. For the euro area and the United States, the period covered is August 2025 to January 2026; for China, period covered is September 2025 to February 2026.
F. Latest values are for March 2026. All projections are for 2026Q4: United States and euro area are based on MacroMicro futures-implied estimates, and China on Trading Economics.
Financial conditions have tightened. Equity prices have declined as energy prices have increased, but valuations remain high. U.S. consumption growth has mostly held steady despite growing weakness in the labor market and consumer confidence. In China, growth has become increasingly dependent on exports.
United States. Growth in the United States slowed from 2.8 percent in 2024 to 2.1 percent in 2025. Consumer spending has mostly held steady in the face of low consumer confidence, rising costs, and slowing employment growth, supported by a falling savings rate. Investment has been supported by a boom in AI-related activity, such as construction of data centers and purchases of equipment and software. According to consensus forecasts, output growth is expected to remain around 2 percent in 2026 and 2027 as high energy prices, tariff volatility, slowing labor supply, andpolicyuncertaintyweighongrowth.
Sources: BLS; Conference Board; Haver Analytics; Monevator; Siblis Research; Stock Analysis; World Bank.
Note: CAPE = Cyclically Adjusted Price-to-Earnings.
A. Bars show CAPE ratios as of February 2025 from Siblis Research for the U.S. (S&P 500), IND (Nifty 50), UK (FTSE 100 Index), DEU (DAX 40), and CHN (SSE Composite). Diamonds show historical medians from Monevator.
B. “Magnificent 7” shows market cap-weighted total returns of Alphabet, Amazon, Apple, Meta, Microsoft, NVIDIA, and Tesla. “Excluding Magnificent 7” shows market cap-weighted total returns of the rest of the S&P 500. Figure shows 14-day moving average of index with January 2023 = 100.
C. All values are three-month moving averages. “Employment change” shows monthly change in seasonally adjusted U.S. nonfarm payroll employment. “Consumer confidence” is the Conference Board Consumer Confidence Index (1985 = 100).
D. Bars show latest year-over-year growth rates for key indicators in China.
Financial conditions have tightened. e expectation that major central banks would continue to lower policy rates has faded as energy prices have increased. Equity valuations have declined but remain high and interest rate spreads remain narrow, however (figure 1.3). e importance of AI investment is evident in equity markets, as technology companies account for a large share of stock market capitalization, particularly in the UnitedStates.
Euro area. Growth in the euro area averaged 0.7 percent in 2023 and 2024, constrained by high energy prices resulting from Russia’s invasion of Ukraine. It recovered to 1.4 percent in 2025 and is expected to continue around this pace in 2026 and 2027. e labor market has been strong—unemployment is at a record low and real wage growth is high— and will continue to support domestic demand. Export growth was healthy in 2025 despite higher U.S. tariffs and declining exportstoChina.
China. In China, growth has hovered around 5 percent in recent years. Growth remains highly dependent on exports whereas domestic activity has weakened considerably. Fixed asset investment fell sharply over the course of 2025, while retail sales grew only slightly. New house prices came close to stabilizing in early 2025 but have since resumed declining. Since early 2023, new house prices have declined by 8 percent. Growth isexpected to slowbelow5percentin coming years as strong export growth wanes anddomesticdemandweaknesspersists.
Growth in other EMDEs has been generally robust, as many countries benefited from easing global financial conditions and the rapid rise in metals prices. Growth is expected
to slow in 2026 and 2027 as rising energy prices weigh on activity, except in energyexporting countries unaffected by supply disruptionsintheMiddleEast.
e South Asian economy accelerated to 7 percent in 2025, making it again the fastestgrowing EMDE region. e pace of growth was higher than originally forecast, largely fueled by stronger-than-expected domestic demand in India, with a contribution from a stronger-than-expected recovery in Sri Lanka (figure1.4).
Trade in the region continued to groweven as it was impeded by high and changing tariffs. e region’s exports have been supported by the depreciation of many South Asian currencies relative to the U.S. dollar. External positions have strengthened in most economies in the region. Prior to the conflict in the Middle East, solid inflows of remittances and international tourists had contributed to improved current account balances and increased foreign exchange reserves.
Longer-term trade growth will be supported by free trade agreements (box 1.1). India signed comprehensive FTAs with the United Kingdom in July 2025 and the European Union in January 2026. Under these agreements, more than 95 percent of exports on both sides will eventually benefit from reduced tariffs. Prior to these agreements, India had FTAs with a lower share of the global economy than the average EMDE; now it is above average. Furthermore, U.S. tariffs on India were negotiated down from 50 to 18 percent before being replaced by a 10 percent tariff imposed on all countries in February. Sri Lanka is planning to lower para-tariffs,
Growth in 2025 was stronger than expected in India and Sri Lanka. Growth was fueled by domestic demand, while trade was impeded by changing U.S. tariffs but supported by currency depreciation and increasing trade openness. Headline inflation remains far from central bank targets in most South Asian economies, largely due to idiosyncratic factors.
A. Growth in 2025 or FY2025/26 B. Average merchandise export growth
Sources: Atlantic Council; Deep Trade Agreements Database; Haver Analytics; MPO; UNCTAD; White House; World Bank.
A. Bangladesh, Bhutan, India, and Nepal use FY2025/26 data. Maldives and Sri Lanka use 2025 data.
B. Bars show average monthly year-over-year growth rates. “Other EMDEs” shows cumulative export growth in U.S. dollars for 49 economies.
“Jan-25” value refers to the trade-weighted tariffs computed by UNCTAD at the 8-digit HS product code level before January 2025. Floating bars refer to announced headline tariff changes during key events rather than trade-weighted or effectively applied tariffs. “Apr-2025” refers to individual rates announced by the United States on April 2nd; “Feb-2026” refers to country-specific tariffs being replaced by a universal 10 percentage point increase across all countries following a Supreme Court decision that impacted prior trade decisions. Other dates include tariffs negotiated bilaterally by individual countries. Bhutan, Maldives, and Nepal did not face individual rates.
D. Figure shows 7-day moving averages of local currency unit / U.S. dollar, such that an upward movement indicates relative U.S. dollar appreciation, indexed to January 2025 = 100. “World” line shows the IMF’s Special Drawing Rights (SDR) against the U.S. dollar.
E. Shares of FTAs in global GDP are based on U.S. dollars in current prices and include the economies along the horizontal axis. “Negotiations concluded” (but not yet in force) for India are with the European Union and the United Kingdom.
F. For Maldives, latest inflation data is for December 2025; for Bhutan, January 2026; for the rest, February 2026. Inflation target (range) for each country is for 2025.

India’s free trade agreements with the European Union and the United Kingdom, as well as Sri Lanka’s planned phase-out of para-tariffs are expected to remove trade barriers, especially for emerging export sectors. The reforms are anticipated to result in broad-based consumption and real income gains for households across the entire income distribution. The largest benefits are expected for consumers of manufacturedgoods,especially amongruralhouseholds.

Thus far, South Asia has been the least open emerging market and developing economy (EMDE) region to global trade, especially global goods trade (figure B1.1.1). In 2024, exports of goods represented only around 12 percent of GDP in South Asia—about half the share in other EMDEs. In part, this reflects the region’s exceptionally high tariffs and non-tariff barriers, with domestic manufacturing firms facing average tariffs on intermediate inputs that are more than double those in other EMDEs (WorldBank2025b).
country’s sizable border charges and taxes on imported goods that are levied in addition to statutory tariffs—particularly the Ports and Airport Development Levy (PAL) and the Commodity Export Subsidy Scheme (CESS) (EconomyNext2026).
Questions. This box examines the distributional impacts of these trade reforms, both at the sectoral level and at the household level. Specifically,itaddressesthefollowingquestions.
• Howmuch would tradereformsin Indiaand SriLankaloweraverageimportduties?
• What are the consumption and real income effects of both trade reforms on different householdsacrosstheincomedistribution?
• How do the trade reforms relate to India’s andSriLanka’scurrenttradespecializations?
Major reforms are now underway to open South Asian economies to global trade. In January 2026, India andtheEuropeanUnionannounced a new free trade agreement (FTA), which both sides have dubbed “the mother of all deals”. Six months earlier, the India-UK Comprehensive Economic and Trade Agreement (CETA) was signed. Both deals comprise tariff cuts on more than 95 percent of traded goods, as well as trade facilitation measures for both goods and services (Acharya, Kumar, and Blenkinsop 2026; Hinz et al. 2026). By anchoring domestic reforms in FTAs with major advanced-economy partners, India increases the market size and investment incentives for exporting firms amid a reshaping of global supply chains (Subramanian 2026; WorldBank2024a).
Sri Lanka,too,isplanningtograduallyeliminate a significant portion of its para-tariffs—the
Note: This box was prepared by Hagen Kruse and Bob Rijkers.
Contribution. This box adds to the existing literature in three ways. First, it provides detailed recent evidence on the magnitude of Sri Lanka’s planned para-tariff phase-out, as well as India’s tariff-cut commitments toward the European Union and the United Kingdom. Second, this box explores the consumption and real income effectsoftheproposedtradereformsfordifferent households across the income distribution. Previous impact assessments are based on general equilibrium models, which largely abstract from distributional implications (for example, Hinz et al. 2026; U.K. Department for Business and Trade 2025). Third, for the case of India, this box extends the framework of Artuc, Porto, and Rijkers (2021) to study the effects of specific FTAs.


South Asian economies are among the least open to international trade. In part, this reflects higher tariffs than in other EMDEs.

Sources: ADB Multiregional Input-Output Tables (database); Sri Lanka Customs National Imports Tariff Guide 2025; World Development Indicators (database); WTO Analytical Database; WTO-OECD Balanced Trade in Services Dataset; World Bank.
Note: “SAR, others” is the GDP-weighted average across Bangladesh, Bhutan, Maldives, and Nepal.
A. Trade is defined as the sum of goods and services exports and imports. Pink-shaded area represents the interquartile range across 119 other EMDEs.
B. “Other EMDEs” is the GDP-weighted average across 151 other EMDEs.
C. Figure reports the latest simple average of the ad valorem most-favored-nation duties applied. For Sri Lanka, data include para-tariffs. Pink-shaded area represents the interquartile range across 118 other EMDEs.
indicating a country’s revealed comparative advantages. The underlying export data are from the ADB Multiregional Input-Output Tables for 2024(annexB1.1).
Methodology. The consumption and real income effects of the proposed tariff reforms on different households are estimated following Artuc, Porto, and Rijkers (2021). Within this framework, households experience real income gains if tariff reductions are concentrated in sectors where they are net-consumers, such that expenditure shares exceed income shares. The main channel is through real consumption gains as a result of lower prices, which far outweigh income losses due to lower prices. The data for this exercise are from IFPRI’s 2023 Social Accounting Matrices for household expenditure and income shares, by household per capita consumption expenditure quintile, and from Indian, Sri Lankan, EU, and UK customs schedules and press releases for 6-digit HS product-level tariffs. Countries’ trade specializations are proxied using revealed comparative advantages as introduced in Balassa (1965). This measure represents the ratio of a country’s sectoral export shares relative to the global average, with log values above zero
Caveats. This box derives estimates for the firstorder, short-run consumption and real income effects of import duty reductions on households. This conceptualization, which is based on Deaton (1989), assumes perfect pass-through elasticities from changes in import duties to producer and consumer prices. In practice, these may be smaller, especially in rural areas (Ural Machand 2012). Yet, this box also abstracts from second-order long-run gains, such as sectoral shifts in production and consumption, export expansion, foreign direct investment, and trade diversion. Since tariff reductions are gradually phased in over multiple years in both reforms, the estimated short-run effects might be delayed and coincide with second-order gains. It also abstracts from changes in government revenue. In past episodes of major tariff cuts, trade tax

revenue losses were, on average, more than offset by gains in other tax revenues (World Bank 2025b).
Main findings. This box reports the following findings.
Lanka, planned import duty cuts would be steepest among the emerging export industries of food and beverage manufacturing, as well as rubberandplasticproducts.
First, India’s and Sri Lanka’s trade reforms are of considerable magnitude, but India’s apply only to about one-tenth of its imports, whereas Sri Lanka’s apply to virtually all of its import destinations. India’s tariff-cut commitments toward the European Union and the United Kingdom, as well as Sri Lanka’s planned paratariff phase-out, would each represent a 9percentage-point reduction in the simple average ad valorem import duties applied. India’s new FTAs are doubling the scope for international market access for domestic firms from currently one-sixth to one-third of global GDP, exceeding the global market access of emerging markets suchasBrazil,China,andTürkiye.
India’s new free trade agreements with the EU and the UK
Second, both trade reforms are expected to result in broad-based consumption and real income gains for households across the entire income distribution. This impact is driven by benefits for consumers of manufactured goods, especially among rural households. The expected magnitude is exceptionally strong in Sri Lanka, where the removal of para-tariffs could raise consumption by 3.1 percent on average, with largerincreasesforthepooresthouseholds.
Reform. India’s new FTAs with the European Union and the United Kingdom comprise tariff cuts on more than 95 percent of traded goods, along with trade facilitation measures for both goods and services (Acharya, Kumar, and Blenkinsop 2026; Hinz et al. 2026). The two FTAs provide Indian consumers and firms with easier access to cheaper imported final goods and intermediate inputs, as well as greater foreign market access for exporters. Once they enter into force, India will double its preferential global market access for domestic firms to one-third of global GDP, exceeding the global market access of most other EMDEs, including Brazil, China, and Türkiye (figure B1.1.2). FTAs also contain reductions in non-tariff barriers, such as trade facilitation for services. In line with the scenario assumptions by Hinz et al. (2026), this box assumes symmetric reductions in non-tariff barriers.
Third, bothIndia’sandSriLanka’stradereforms disproportionately reduce import barriers for emerging export industries with modest revealed comparative advantage and currently high tariffs. In contrast, both countries’ export industries with the strongest comparative advantage were already operating in sectors with low tariffs before the recent reforms. In India, tariff cuts among industries with comparative advantages are largest fortextilesandleatherproducts.In Sri
India’sexportcomposition. In 2024, about half of India’s total exports were shipped to advanced economies (figure B1.1.2). At about 23 percent of total exports, India not only exported more goods and services into the European Union and the United Kingdom than into any other advanced-economy region, it also exported a larger share into European markets than many other major EMDEs. The vast majority of these Indian exports to Europe comprised business services and heavy manufacturing, such as fuels, chemical products, and electronics. Yet, India’s overall manufacturing export share to Europe
India’s new free trade agreements are doubling the preferential global market access for domestic firms, exceeding the global market share of many of its peers. Tariff cuts are expected to result in consumption and real income gains for households across the entire income distribution, but consumers in rural areas would particularly benefit from tariff cuts on manufactured goods.
A. Share of global output covered by free trade agreements
D. India’s tariff-cut commitments toward the EU and UK, by sector
B. Export market composition by region,
C. Exports to Europe, by sector in 2024
F. Real income effects of the proposed tariff cuts with the EU
Sources: ADB Multiregional Input-Output Tables (database); Deep Trade Agreements Database; European Commission; Hinz et al. (2026); IFPRI 2023 Social Accounting Matrix; India-UK CETA, annex 2A; World Development Indicators (database); WTO Analytical Database; World Bank.
A. Shares of FTAs in global GDP are based on US$ in current prices and include the economies along the horizontal axis. “Current FTAs” for India are with Afghanistan, ASEAN, Australia, Bangladesh, Bhutan, Japan, Maldives, Mauritius, Nepal, Pakistan, the Republic of Korea, Sri Lanka, and the United Arab Emirates. “Negotiations concluded” (but not yet in force) for India are with the European Union and the United Kingdom.
B. Exports comprise goods and services. “Other EMDEs” comprise 35 economies and a rest-of-world aggregate.
C.D. Broad sectors are disaggregated following ISIC, revision 4, with “Agriculture” comprising section A; “Other industry” comprising sections B, D, and E (that is, mining; electricity, gas, and water supply; and construction); “Light manufacturing” comprising divisions 10–18 and 31–33 (for example, manufacture of food products, textiles, or furniture); “Heavy manufacturing” comprising divisions 19–30 (for example, manufacture of refined petroleum, electronics, or transport equipment); “Business services” comprising divisions 58–83 (for example, technical and administrative support, including IT services); and “Other services” comprising all other divisions.
D. Vertical axis reports the cut in India’s import-weighted average ad valorem tariffs applied.
E.F. First-order consumption and real income effects of joint tariff cuts agreed to in the India-EU FTA and the India-UK CETA are estimated following Artuc, Porto, and Rijkers (2021). Q1 (Q5) refers to the household quintile with the lowest (highest) national consumption expenditure.
was lower than that in most other major EMDEs,especiallyChinaandVietNam.
Impact across households. India’s FTAs with the European Union and the United Kingdom are expected to result in consumption and real income gains for households across the entire income distribution (figure B1.1.2). Consumers in rural areas would particularly benefit from tariff cuts on manufactured goods, which represent a 6-percentage-point larger share in rural households’ expenditures than in urban households. With an average gain of around 0.3 percent, the magnitude of these short-run consumption effects is small but broadly in line with other impact assessments (Hinz et al. 2026;
India’s new free trade agreements are expected to reduce tariff barriers, especially for emerging export sectors, such as textile and leather product industries. India’s main export specializations are in sectors with already low tariffs, while sectors without revealed comparative advantage remain protected.
B. Tariffs on intermediate inputs
Log revealed comparative advantage
Logrevealed comparative advantage
Log revealed comparative advantage
Sources: ADB Multiregional Input-Output Tables (database); CEPII BACI (database); European Commission; Hinz et al. (2026); India-UK CETA, annex 2A; WTO Analytical Database; World Bank.
Note: A.-C. “Revealed comparative advantage” is calculated as introduced in Balassa (1965) and indicates India’s export specialization across 16 goods-producing sectors relative to global average export shares, with log values larger than zero indicating comparative advantages. Bubble areas reflect sectoral export shares in 2024.
Refer to annex table B1.1 for the full list of sectors. Trend lines indicate the (unweighted) quadratic polynomial fit on the underlying data.
A. Vertical axis reports India’s FTA-implied reduction in the import-weighted average ad valorem tariffs applied toward the European Union and the United Kingdom.
B. Tariff cuts for intermediate inputs are calculated as the weighted average across inputs (split from HS 6-digit product codes using the Classification of Broad Economic Categories) used in the respective sectors.
C. Changes in the “effective rate of tariff protection” refer to the difference between tariff cuts for sectoral outputs (A) and tariff cuts for intermediate inputs (B).
U.K. Department for Business and Trade 2025). Long-run consumption and real income gains could be significantly larger due to increased trade diversion toward low-tariff partner economies, as well as positive incentives for foreign direct investment and productivity spillovers through global value chains (World Bank2020).
point cuts in input tariffs (figure B1.1.3). India’s biggest revealed comparative advantage is in sectors with already low tariffs (such as fuels and business services). Sectors without revealed comparative advantages—with those in manufacturing accounting for 7 percent of total employment—remain more protected and face lesssteeptariffcuts.
Distribution of tariff cuts by export specialization. India’s tariff-cut commitments toward the European Union and the United Kingdom especially target the manufacturing sector, while many agricultural goods have been exempted. The publicly announced provisions imply complementary tariff cuts in both light and heavy manufacturing. India’s textile and leather products industries—which are characterized by a modest revealed comparative advantage—face output tariff cuts of 17–19 percentage points, but also 5–7 percentage-
Reform. The simple average of Sri Lanka’s total import duties is 19 percent. Yet, less than half of these import duties are statutory tariffs (figure B1.1.4). Of the 19 percent, 11 percentage points are accounted for by para-tariffs. In line with the new National Tariff Policy, the Government of Sri Lanka is planning a four-year reform to fully eliminate its PAL and CESS para-tariffs by 2029. This phase-out of Sri Lanka’s two largest paratariffs would represent a 9-percentage-point cut
Sri Lanka’s proposed para-tariff reform is expected to result in broad-based consumption and real income gains for households across the entire income distribution, but especially large gains among poorer rural households.
A. Sri Lanka’s import duties, latest
Number of workers in sectors with import duties below 20 percent
D. Composition of exports by sector, 2024
E. Consumption effects of the planned para-tariff phase-out on Sri Lankan households
F. Real income effects of the planned para-tariff phase-out on Sri Lankan households
Sources: ADB Multiregional Input-Output Tables (database); Global Labor Database; Central Bank of Sri Lanka; IFPRI 2023 Social Accounting Matrix; Sri Lanka Customs National Import Tariff Guide 2025; WTO Analytical Database; World Bank.
Note: CESS = Commodity Export Subsidy Scheme; PAL = Ports and Airport Development Levy.
A. Sri Lanka’s simple average import duties, mapped from 6-digit HS product codes into 7 goods-producing sectors. Other para-tariffs comprise the Social Security Contribution Levy or the Special Commodity Levy.
B. Sri Lanka’s National Tariff Policy proposed full CESS and PAL phase-out on all imports until 2029. Unweighted averages of the ad valorem equivalent rates.
C. Latest tariff and employment data for all six South Asian economies and six other EMDEs (Brazil, Georgia, Mexico, Mongolia, Philippines, and Thailand).
D. Broad sectors are disaggregated following ISIC, revision 4, with “Agriculture” comprising section A; “Other industry” comprising sections B, D, and E (that is, mining; electricity, gas, and water supply; and construction); “Light manufacturing” comprising divisions 10–18 and 31–33 (for example, manufacture of food products, textiles, or furniture); “Heavy manufacturing” comprising divisions 19–30 (for example, manufacture of refined petroleum, electronics, or transport equipment); “Business services” comprising divisions 58–83 (for example, technical and administrative support, including IT services); and “Other services” comprising all other divisions.
E.F. First-order consumption and real income effects of the planned full CESS and PAL phase-out are estimated following Artuc, Porto, and Rijkers (2021). Q1 (Q5) refers to the household quintile with the lowest (highest) national consumption expenditure.
in the simple average ad valorem import duties applied.
Distributionoftariffcutsbysector. Sri Lanka’s para-tariffs exceed statutory tariffs across all manufacturing sectors, whereas statutory tariffs are larger in non-manufacturing sectors such as mining.The proposed reform would
introduce the steepest para-tariff cuts for processed food and beverages (28 percentage points) and the smallest cuts for textiles and mining (below 5 percentage points). The labor market exposure could be sizable: assuming the 2023 employment distribution, the reforms would lower tariffs from above to below 20 percent in sectors that employ one-third of all
FIGURE B1.1.5
Sri Lanka’s planned para-tariff phase-out would reduce import duties especially for emerging export sectors, such as rubber and plastics, as well as food manufacturing. Sri Lanka’s main export specializations are in sectors with already low import duties, while sectors without revealed comparative advantage remain protected.
A. Import duties on sectoral output
Percentage points
B. Import duties on intermediate inputs
C. Effective rate of import-duty protection
points
Log revealed comparative advantage
Log revealed comparative advantage
Sources: ADB Multiregional Input-Output Tables (database); Central Bank of Sri Lanka; CEPII BACI (database); IFPRI 2023 Social Accounting Matrix; Sri Lanka Customs National Import Tariff Guide 2025; WTO Analytical Database; World Bank.
Note: A.-C. “Revealed comparative advantage” is calculated as introduced in Balassa (1965) and indicates Sri Lanka’s export specialization across 16 goods-producing sectors relative to global average export shares, with log values larger than zero indicating comparative advantages. Bubble areas reflect sectoral export shares in 2024. Refer to annex table B1.1 for the full list of sectors. Trend lines indicate the (unweighted) quadratic polynomial fit on the underlying data.
A. Vertical axis reports the reduction in the import-weighted average ad valorem import duty applied due to Sri Lanka’s planned full CESS and PAL phase-out on all imports until 2029.
B. Import-duty reductions for intermediate inputs are calculated as the weighted average across inputs (split from HS 6-digit product codes using the Classification of Broad Economic Categories) used in the respective sectors.
C. Changes in the “effective rate of import-duty protection” refer to the difference between import-duty cuts for sectoral outputs (A) and import-duty cuts for intermediate inputs (B).
workers (figure B1.1.4). This exposure is most likely to translate into aggregate employment and wage gains if workers can easily switch between jobs (Hakobyan and McLaren 2016; WorldBank2025b).
Impact across households. As is the case for India, Sri Lanka’s planned para-tariff phase-out is expected to result in strong and broad-based gains for households across the entire income distribution (figure B1.1.4). Yet, at around 3.1 percent, the magnitude of these short-run consumption effects is considerably larger because the para-tariff cuts apply to all import destinations. In Sri Lanka, the trade reform could be particularly pro-poor among rural households. For example, the poorest rural household quintile spends about 31 percent of its expenditure on the output of the food manufacturing sector. This compares with food
expenditure shares of the richest urban and rural householdquintilesofaround10and12percent, respectively. This confirms previous findings on trade disproportionately favoring the consumption baskets of poor households (Fajgelbaum and Khandelwal 2016; Ural Marchand2012).
Differences between India’s and Sri Lanka’s reforms. The magnitude of household impacts from India’s FTAs differs from Sri Lanka’s paratariff cuts for multiple reasons. First, unlike Sri Lanka, India is reducing import duties for economies that account for only 9 percent of all imported goods. Price effects of tariff cuts are therefore scaled by the import or export share of the partner economy in each respective sector. Second, Sri Lanka’s proposed cuts are unilateral cuts, whereas the European Union and the United Kingdom have committed to average

tariff cuts of about 4 percentage points for Indian exporters. Domestic price effects therefore depend on net tariff cuts, that is, India’s tariff cuts minus the weighted average cuts of the European Union and United Kingdom. Third, India’s trade reform benefits could be slightly larger for richer households, because of strong net tariff cuts on machinery and equipment, which account for a four-times larger expenditure share among the richest householdquintilethanamongthepoorest.
Distribution of tariff cuts by export specializations. Sri Lanka’s main export sectors are in light manufacturing, with high revealed comparative advantages in textiles and in food and beverages, most notably tea. For textiles, the combination of the largest revealed comparative
advantage with already-low import duties indicatesasuccessfulintegrationintoglobalvalue chains (Wijesinghe and Yogarajah 2022). The planned para-tariff cuts are largest for export sectors with modest revealed comparative advantages and currently high tariffs, especially in food and beverage manufacturing, and in rubber and plastic products (figure B1.1.5). The proposed tariff reform would lower input tariffs in these industries by 7–8 percentage points, improving their competitiveness, especially if combined with productivity gains in response to greater import competition (De Loecker et al. 2016). Sectors without revealed comparative advantages remain more protected; as in India, these sectors account for 7 percent of Sri Lanka’s totalemployment.


Bhutan has eased restrictions on capital flows, and Bangladesh has signed an Economic Partnership Agreement with Japan that provides duty-free access for most ofBangladesh’sexports,especiallygarments.
Headline inflation declined in 2025 in most economies. In many cases, this was driven by idiosyncratic factors: Indian food prices fell sharply due to good harvests of several crops, Sri Lanka was in deflation for most of the year due to sharp reductions in administered energy prices and a favorable base effect, while inflation in Nepal dropped due to weak growth. Bangladesh stands out for its persistently high inflation,which was pushed up by currency depreciation, social unrest, supply chain disruptions, and floods that increasedfoodprices.
Monetary policy rates were gradually reduced acrossthe region,with the exception
of Bangladesh. Government bond yield spreads were largely stable. Despite easier global financial conditions into early 2026, private sector credit growth has generally been slow. In some cases, this has been due to macroprudential measures to contain banking sector risks (India); in others, it has been due to high costs of doing business and weaknesses in the banking system (Bangladesh,Maldives).
In most of South Asia, manufacturing/ industrial activity has been the fastestgrowing sector of the economy (figure 1.5). Services sector growth has also generally beenrobust,withagriculturelagging.
Industrial activity in South Asia grew 8.9 percent in 2025 and appears to be on track for further strong growth in 2026. is
Industrial activity has been the fastest-growing sector in most of South Asia, with agriculture typically lagging. The dominant manufacturing subsector varies in the region’s three largest countries, while manufacturing activity is largely absent in the three smallest.
A. Sectoral growth rates in India, Bangladesh, and Sri Lanka
B. Sectoral growth rates in Nepal, Bhutan, and Maldives
mostly reflected strong growth in India and Sri Lanka, whereas industrial activity growth elsewhereinSouthAsiawassluggish.
C. Decomposition of manufacturing production index
A.B. GDP growth for a given calendar year is calculated as the average of year-on-year quarterly GDP growth at basic prices from national accounts. For Bangladesh, Bhutan, and Maldives, 2025 value reflects average growth for the first three quarters; for Nepal, first two quarters.
C. Bars show weights of selected industries in the manufacturing industrial production index. Remaining weights represent other industries.
D. Bars show sectoral value added as a share of GDP in 2024. Electricity includes electricity, gas, and other utility services. Finance includes financial and insurance activities. Tourism is measured using accommodation and food service activities for all countries except Maldives (which directly reports value added of tourism).
E. Figure shows agricultural value added as a share of GDP. Share of employment based on estimates from the International Labour Organization. Other EMDEs represent the weighted average of 126 EMDEs, using GDP weights for the share of GDP and employment weights for the share of employment.
F. Total factor productivity (TFP) measures the amount of agricultural output produced from the combined set of land, labor, capital, and material resources employed in farm production. Estimates are from the USDA Economic Research Service.
India’s manufacturing sector grew by more than 10 percent per year between 2023 and 2025, and the manufacturing PMI reading of around 57 in February indicated only a modest deceleration in 2026. e country’s export basket has become increasingly sophisticated, and the country rose from 51 to 41 in international rankings of economic complexity from 2012 to 2024 (Growth Lab at Harvard University 2026). e electronics sector has been a key driver of growth for many years, with more recent support from the government’s Production Linked Incentive (PLI) program and significant investment inflows. Mobile phone production, for example, has increased nearly 28-fold over the past decade (World Bank 2025c).
In Bangladesh, manufacturing grew 5.8 percent in 2025 and remains heavily concentrated in the ready-made garment (RMG) sector, which accounts for around 60 percent of the country’s manufacturing activity and 85 percent of its merchandise exports (World Bank 2025d). Manufacturing was weak at the end of 2025, with a particularly acute slowdown in RMG activity. Construction activity has also been slowing, with the PMI sub-index falling below 50 in February.
In Sri Lanka, industrial production has been growing steadily at a pace of about 7 percent since 2023. is was largely driven by strong growth in manufacturing (particularly of pharmaceuticals)andconstruction.
Industrial activity in Nepal and Bhutan is dominated by electricity generation, which grew 16 and 36 percent in 2025, respectively,
and by large construction projects in Maldives. Manufacturing activity in the region’s smaller countries is limited. Compared to the EMDE average of 14 percent of gross value added, manufacturing makes up 8 percent of value added in Bhutan,4percentinNepal,and2percentin Maldives. is reflects structural constraints, including capital flow restrictions, infrastructure and logistics gaps, and real exchange rate appreciation partly driven by large remittance inflows (World Bank 2024a).
Services activity is the largest and most varied segment of the economy. On the low end among countries in the region, services account for 50 percent of GDP and 33 percent of employment in India. On the high end, services account for 72 percent of both GDP and employment in Maldives. e sector has been growing at a robust pace in most of South Asia. India’s services PMI has been close to 60 since 2023, with broadbasedstrengthacrosssub-sectors.
Elsewhere, services strength is more concentrated. Tourism is a major driver of activity in many of the region’s smaller countries—tourist arrivals collapsed during the pandemic but have since rebounded, with particularly strong rebounds in Sri LankaandMaldives.
e information and communications technology (ICT) sector has grown substantially in recent years, such that it makes up more than 22 percent of total exports and 6.5 percent of GDP in India, 5.3 percent of exports and 2.2 percent of GDP in Sri Lanka, and 3 percent of exports and 1.8 percent of GDP in Nepal. Concern that these activities may be threatened by AI has led to slower growth and stock market underperformancemorerecently(box2.1).
Financial sector activity has diverged across the region, with strength in India and Sri Lanka and weakness in Bangladesh and Nepal. India’s banking system is well capitalized and profitable, and its capital markets have grown rapidly in recent years, driven by small retail investors and enabled by regulatory simplification and innovation (RBI 2025). In Sri Lanka, financial institutions have recovered significantly since the country’s financial crisis in 2023, with improvements to liquidity, profitability, credit issuance, and capital adequacy (Central Bank of Sri Lanka 2025). By contrast, the banking sector in Bangladesh is struggling with high levels of loan defaults, while the insurance sector in Nepal suffered significantlossesfromrecentsocialunrest.
Agriculture remains the least productive and slowest-growing segment of the economy, making up 14 percent of regional GDP but 42 percent of employment. In India and Nepal, sectoral productivity has grown more quickly than in other EMDEs in recent decades, allowing the sector to shed workers. Agriculture in Bangladesh is a partial exception, as the sector has struggled with frequent natural disasters (primarily flooding) and a lack of access to credit and technology for farmers, who are predominantly small and informal (World Bank 2021). In India, sectoral growth has been supported by an increasing contribution from higher-value activities such as horticulture, livestock, and fisheries. For traditional crops, record kharif (monsoon-dependent crops sown in the summer) and rabi (sown in winter) sowings in the 2024–25 crop year supported rural incomes and kept food price inflation low in late2025andearly2026.
A high share of nonperforming loans has been identified in Bangladesh’s banking sector. Domestic demand in India has been strong, outweighing some weakness in exports. Fiscal and current account balances have improved in Maldives, but this may not account for rising unpaid arrears. Tourist arrivals in Nepal have started to rebound after dropping during social unrest. Sri Lanka’s fiscal balance continues to improve.
A. Nonperforming loans and returns to capital in banking sector in Bangladesh
Private consumption, retail sales and consumer
In Bangladesh, economic activity is still being affected by reverberations from the political turmoil in late 2024. GDP growth of 4.5 percent was below expectations for the first quarter of the 2025/26 fiscal year. e United States—Bangladesh’s largest export market— increased import tariffs by 20 percent in August before replacing this with a 10 percent tariff increase for all countries in February. e combination of higher tariffs and increased competition from other countries’ diverted exports has weighed on trade: readymade garment exports contracted sharply between September and December following front-loadingbyexportersearlierintheyear.
Inflation remains significantly above the central bank’s target of 6–7 percent. After peaking above 10 percent at the end of 2024, inflation declined steadily through the first half of 2025. is disinflation has since stalled, and inflation stood at 9.1 percent in February. As a result, the policy rate has been at a 15-year high of 10 percent since late 2024.
Sources: Haver Analytics; IMF Financial Soundness Indicators; Retailers Association of India; World Bank.
Note: MVR = Maldivian rufiyaa.
A. Return on capital represents the banking sector’s total net income before taxes divided by total assets, based on IMF data.
B. Private consumption represents growth in private consumption from quarterly national accounts. Retail sales growth and the consumer confidence index are quarterly averages.
C. Lines show year-over-year growth in the 3-month moving average of exports.
D. Parallel market rate is not officially published and is based on local news and anecdotal market information.
E. Remittances and import growth shown as 3-month moving averages.
F. All values are 4-quarter moving averages.
e financial sector remains under strain. e official nonperforming loan ratio stood above 30 percent in the latest data, and the banking sector recorded losses for the first time since the pandemic (figure 1.6). Together with the elevated policy rate, these pressures are constraining credit availability and limiting investment prospects. ere has been some progress in containing the fiscal deficit, but tax revenues below 9 percent of GDP continuetolimitthecountry’sfiscalspace.
In Bhutan, strong hydropower production and continued public spending on hydropower projects are supporting solid economic activity, with GDP growing by 8.1 percentinthe2024/25fiscalyear.
India’s economy performed better than anticipated last year, with GDP growth
reaching 7.8 percent in the October–December quarter of fiscal year 2025/26. Recent updates to GDP data and calculation methods revealed that the economy was slightly smaller than previously thought, but that recent growth has been faster. Domestic demand has been strong, with robust retail sales and consumer confidence reaching its highest post-pandemic level in November 2025. Recent reforms to simplify and reduce taxes have also supported private consumption.
Domestic strength outweighed goods export weakness. Goods exports grew by only 0.1 percent in 2025, held back by the United States’ brief imposition of 50 percent tariffs starting in August. Services exports remained strong, growing by about 16 percent from December to February. is, alongside strong remittances, helped contain the currentaccountdeficit.
Falling food prices kept inflation below the central bank’s 2–6 percent target from Septemberto December,before it rose to 3.2 percent in February 2026. e Reserve Bank of India reduced its policy rate four times in 2025, from 6.5 percent in January to 5.25 percent in December, contributing to persistentdepreciationoftheIndianrupee.
In Maldives, GDP grew by 8.6 percent in 2025Q3, the fastest pace in four years, primarily driven by strong tourist arrivals. e primary fiscal balance appears to have improved rapidly, but this may not account for the accumulation of unpaid arrears to suppliers and state-owned enterprises (World Bank 2025e). Inflation increased to 4 percent in 2025, partly contained by widespread subsidies, though these are becoming less effective due to foreign exchange constraints. Shortages of U.S. dollarsareapparentintherisinggapbetween the official exchange rate and the parallel market rate, and are contributing to rising costs and shortages of some essential
categoriesofimportssuchasmedicine.
In Nepal, following the prime minister’s resignation in September, an interim government was appointed to oversee parliamentary elections that were held in March. e winning party campaigned on a platform of anti-corruption, structural reforms, and increased openness to neighboring countries. After the initial 18 percent decline in September, tourist arrivals recovered gradually thereafter. Strong remittance inflows—equivalent to more thanone-quarterofGDPandgrowingby26 percent in 2025—have helped sustain consumption.
Inflation in Nepal declined throughout the year and fell below 2 percent in August for the first time in more than a decade due to a combination of weak growth and falling vegetable prices. is allowed the central bank to reduce the policy rate from 5 to 4.25percentoverthecourseof2025.
In Sri Lanka, GDP expanded 5 percent in 2025, similar to its pace in 2024. Activity was driven by a 9.1 percent increase in private consumption. is was bolstered by workers’ remittances increasing by more than 20 percent in 2025. Inflation stabilized between 2.1 and 2.3 percent between October and January. Cyclone Ditwah hit the country in November 2025, causing more than 600 fatalities and an estimated $3.3 billion in damages, equivalent to about 3 percent of GDP. In response, Sri Lanka secured emergency financial support from theIMFofover$200million.
e fiscal outlook has steadily improved since the sovereign debt crisis. e debt-toGDP ratio has declined gradually from a peak above 120 to 93 percent as of 2025Q3, and the primary balance has continued to rise. e banking sector has also strengthened, with improved liquidity and risingprofitability.
Sources: World Bank, MPO, and staff calculations.
Note: (e) = estimate; (f) = forecast. As of July 1, 2025, Afghanistan and Pakistan have been made part of the Middle East and North Africa (MENAAP) region and are no longer grouped in the World Bank’s South Asia region. GDP is measured in average 2010–19 prices and market exchange rates. Because quarterly GDP forecasts for Bangladesh, Bhutan, and Nepal are unavailable, the average of two consecutive fiscal years is used for regional aggregates.
South Asia grew an estimated 7.0 percent in 2025. Absent the recent disruptions in global energy markets, growth would have been expected to remain robust at about this pace in 2026 and 2027. Given the region’s dependence on imported energy, the forecast instead is for the region to decelerate to 6.3 percent growth in 2026 and recover to 6.9 percent in 2027 (table 1.1). Uncertainty around this forecast is unusually elevated. e baseline incorporates the assumption that the acute disruption to energy supplies largely dissipates after a few months. is headwind is concealing the region’s stronger-thanexpected growth momentum, and better prospects for Indian exports following the reduction of U.S. import tariffs and the signing of a free trade agreement with the European Union (figure 1.7). Even with improved prospects for trade, strength in the region is largely based on robust domestic activity.
South Asia continues to be the fastest-growing EMDE region. is outperformance is entirely due to India. e rest of the region is expectedtogrow4.1percentin2026,morein line with other EMDEs. In 2027, growth in South Asia excluding India is expected to surpass that of other EMDEs. is acceleration is largely dependent on the performance of countries recovering from social unrest. Bangladesh and Nepal both had smaller economic contractions than the average EMDE experiencing large-scale protests, but Bangladesh’s recovery is expected tobemoregradualthanistypical.
In most of the region, inflation was low in early 2026. Even before the recent rise in energy prices, it was projected to rise modestly while remaining close to central bank targets in most countries. is rise will be accelerated by higher energy prices and continued currency depreciation, especially if these prove
more persistent than currently anticipated. In India, strong demand, normalizing food prices, and higher energy prices are expected to push inflation up in FY26/27. In Bangladesh,inflation isexpected to ease under tight monetary policy, but remain elevated above the 6-7 percent target, reflecting continued pressures from energy and food supply and exchange rate instability. Following a prolonged period of deflation through early 2025, Sri Lanka’s inflation is expected to rise above its 5 percent target in 2026 due to stronger demand and higher energyprices.
Current account balances in the region are likely to worsen as a result of higher energy prices. In India, surpluses in services trade will help partly offset merchandise trade deficits. In Maldives, high external financing needs, costly energy imports, and disruptions to international travel will further strain the balanceofpaymentsandofficialreserves.
Fiscal policy is anticipated to diverge across the region. In India, the deficit had been shrinking in recent years, but this trend is expected to stall or reverse as a result of increased subsidy outlays resulting from efforts to limit inflation passthrough to consumers. In Bangladesh, the deficit is expected to widen despite improvements in revenue, as expenditures rise due to more costly fuel subsidies, the recapitalization of the banking sector, and the new government's promised increased social spending. Strong revenue performance and prudent expenditures in Sri Lanka should contribute to continued reductions in fiscal deficits and public debt (World Bank 2025f). In contrast, Bhutan’s fiscal deficit is anticipated to widen due to infrastructure spending and costly diesel subsidies. If more governments respond to rising energy prices with fuel subsidies, fiscaldeficitscouldwidenacrosstheregion.
South Asia is expected to decelerate significantly in 2026 due to recent disruptions in global energy markets. Absent this shock, the forecast for South Asia would have been revised up substantially due to stronger-thanexpected momentum and better prospects for trade. Growth is primarily reliant on domestic demand. Excluding India, South Asia is growing at about the same pace as other EMDEs, with the expected acceleration in 2026–27 based on recovery from recent social unrest in Bangladesh and Nepal. Current account and fiscal balances are being impacted by rising energy prices.
Sources: Global Protest Tracker; MPO; WDI; World Bank.
A. For India, “2026” refers to FY26/27. For other countries that use fiscal rather than calendar years, “2026” and “2027” represent FY25/26 and FY26/27. “EMDE” includes 141 economies.
B. Contribution from domestic demand defined as contribution from consumption and gross capital formation and includes the statistical discrepancy. Net exports represent the difference in contribution between exports and imports of goods and services. For India, 2025 refers to FY2025/26, and for Bangladesh, Bhutan, and Nepal, refers to FY2024/25.
C. “Other EMDEs” represents 141 emerging market and developing economies. GDP aggregates calculated using real U.S. dollar GDP weights and market exchange rates. Dots indicate forecasts. For India, fiscal years are used, such that 2025 represents estimation for FY2025/26.
D. Figure shows change in GDP growth around social unrest occurring in year t. The pre-event benchmark (t-1) is defined as the average GDP growth over the four years preceding the event (t-4 to t-1). Social unrest data from Global Protest Tracker, and defined as having a peak crowd size of above 50,000 people. Sample includes 34 events in 26 countries between 2017 and 2020.
E.F. Estimates from Macro Poverty Outlook
In Bangladesh, growth is expected to accelerate to 3.9 percent in 2025/26 as the country recovers from the political unrest that started in mid-2024. e elevated uncertainty ofthisforecast isreflectedin the wide rangeof projections by various forecasters, which range from 3.8 to 5.0 percent. e acceleration will be primarily driven by stronger private consumption. e pace of the recovery has been revised down, however, due to higher energy prices, and because the recovery of investment growth following persistent political uncertainty and weakness in the bankingsectorhasbeenslowerthanexpected.
Exports are expected to contribute to growth without being a major driver of the economy. e forthcoming graduation from Least Developed Country (LDC) status in November 2026 is not expected to have a severe impact on export growth as many countries—including the most important market, the European Union—have indicated they will maintain preferential tariff rates until 2029.
e outlook is predicated on the assumption of a period of political and social stability following the elections held in February. It also depends on continued progress on a number of structural reforms, including recapitalizing the banking sector and improvinggovernmentrevenues.
In Bhutan, the forecast is underpinned by the construction and opening of new hydropower projects. e economy is projected to grow 7.1 percent in FY25/26, benefiting from positivespilloversfrom the recently completed Puna II hydropower plant and ongoing construction of two other major hydropower plants (Dorjilung and Khorlochhu). e
forecast for FY26/27 has been revised up due to greater expenditure on hydropower construction.
In India, growth is estimated to have accelerated from 7.1 percent in FY25 to 7.6 percent in FY26 (April 2025–March 2026), owing to strong domestic demand and export resilience. Private consumption growth was particularly robust, supported by low inflation and rationalization of the Goods and Services Tax(GST).
Growth is projected to decelerate to 6.6 percent in FY27, reflecting headwinds from the Middle East conflict. e impact of these is highly uncertain: other forecasters have revised down their growth projections to a rangebetween5.9and6.7percent.
Although the reduction in GST rates should continue to support consumer demand in the firsthalfofFY27,elevatedglobalenergyprices are expected to put upward pressure on prices and constrain households' disposable income. Government consumption growth is expected to soften to offset higher subsidy outlays for cooking fuel and fertilizers. Investment growth is likely to moderate amid elevated uncertainty and rising input costs. Improved access to the United States and the European Union for India’s exports will be undermined byslowergrowthinmajortradingpartners.
In Maldives, conflict in the Middle East is expected to weigh heavily on the outlook through tourism disruptions, higher fuel prices, and tighter financing. Tourism revenue is projected to fall in 2026 amid fewer arrivals and shorter stays, limiting real GDP growth to 0.7 percent before a rebound in 2027–28. Inflation is expected to rise to 6 percent in 2026, reflecting higher global commodity prices, and remain above 4 percent through 2028 due to intensified foreign exchange constraints and demand pressures for food
and essential goods. e country is expected to maintain persistent and large current account and fiscal deficits in coming years, and may struggle with foreign exchange pressures.
In Nepal, activity is expected to rebound to 4.2 percent in 2026/27 as the effects of the unrest in late 2025 wane.Sectors that suffered from the unrest—notably tourism and insurance—are expected to lead the acceleration, supported by reconstruction activities and continued strength in hydropower-related activities. e recovery in investor confidence is expected to be slower, however, resulting in persistent weakness in non-hydropower private investment. Public capital expenditure is expected to be low. e forecast is predicated on the assumption of a smooth political transition and the absence of furthersignificantsocialunrest.
In SriLanka, growth is expected to moderate to 3.6 percent in 2026, with the size of the economy thereby regaining its 2018 level. Growth is expected to rebound slightly to 3.8 percent in 2027. e slowdown in activity relative to 2025 is due to higher energy prices as well as a shift from recovery to a pace consistent with its potential. Growth will be primarily driven by consumption and investment, supported by post-cyclone reconstruction activity. e economy continues to grapple with the lingering effects of the crisis, shortages of skilled workers exacerbated by outward migration, and continued under-execution of the capital budget. Nevertheless, once recent disruptions to flights from the Middle East ease, strong tourism, progress on structural reforms, and improved credit conditions are expected to supportgrowth.
South Asia’s growth could be dampened in a variety of ways. Persistently high energy prices could further increase production costs, erode real incomes, tighten financial conditions, and worsen current account imbalances. A spate of global financial turbulence could be transmitted to the region and magnified by domestic vulnerabilities, such as high levels of nonperforming loans in some countries, high interest payment obligations, or elevated stock price valuations. e damage Cyclone Ditwah inflicted on Sri Lanka is a reminder of the region’s longstanding vulnerability to climate risks (Lang et al. 2025). South Asia’s successes in services exports could become a weakness if key sectors are negatively affected by the spreadofAIornewtraderestrictions.Progress on key structural reforms could yield growth dividends, just as failure to implement needed changes could lead to growth disappointments.
e outlook for energy commodity prices is highly uncertain and contingent on 1) the intensity and duration of conflict in the Middle East, 2) the degree of damage to the region’s energy production capacity, and 3) the duration and extent to which the Strait of Hormuz remains closed to shipping. Previous conflicts in the Middle East have resulted in significant increases in oil prices, with some spikes proving temporary while others remainedabovetrendforyears(figure1.8).
e baseline forecast includes the underlying assumption that acute trade disruptions largely dissipate after a few months, while damage to energy infrastructure persists into the medium term. is overlaps with market expectations: oil futures point to the price of Brent oil declining steadily over the remainder
As has been the case before, conflict in the Middle East has led to a sharp increase in energy prices. This increase is expected to fade over time, but if it proves more sustained the impacts on inflation and growth could be considerable. South Asia is particularly vulnerable as a region that depends heavily on energy imports and remittances from countries in the region.
Real oil prices in 2025 U.S. dollars
Brent oil price and futures
of the year, averaging about $90/bbl for the year.Twootherscenariosarealsoconsidered.
In a swift resolution scenario, threats to energy infrastructure dissipate rapidly. Severe disruptions to shipping are resolved promptly, after which the full re-opening of the Strait of Hormuz proceeds more quickly than in the baseline. ere is minimal medium-term damage to oil infrastructure in the Middle East and no further damage to natural gas facilities. e reductions in the Middle East’s oil supply are partially offset by releases of emergencyoilstocksandincreasedproduction elsewhere. In this scenario, the average Brent oil price for 2026 would be well below $90/ bbl. Increases in the prices of other important commodities, such as natural gas and fertilizer, would increase only modestly relativetotheirpre-conflictlevels.
Sources: Bureau of Labor Statistics; Central Bank of Sri Lanka; CEPII BACI; CME Group FedWatch; Department of Census and Statistics Sri Lanka; Eurostat; Haver Analytics; IMF Fossil Fuel Subsidies (database); Intercontinental Exchange (ICE); KNOMAD/World Bank Bilateral Remittance Matrix 2021; MPO; Nepal Rastra Bank; U.S. EIA; WDI; World Bank.
A. Line shows 7-day moving average of Brent crude oil prices deflated by U.S. Consumer Price Index.
B. Blue line shows nominal brent oil price. Last observation is March 25.
C. Bars show share of direct energy expenditure from housing and transport from country-level consumer price indices.
D. Chart shows market-implied probabilities of Federal Reserve policy rate outcomes for the December 9, 2026 FOMC meeting, derived from 30-day Fed funds futures prices. Last observation is March 25.
E. Chart shows energy imports and net energy imports as a share of GDP.
F. Data from KNOMAD/World Bank Bilateral Remittance Matrix 2021.
In a protracted severe disruption scenario, trade through the Strait of Hormuz is interrupted for about half of a year, with shipping flows then resuming more gradually than in the baseline scenario. Furthermore, there is substantial lasting damage to oil and natural gas production facilities in the Middle East. Over time, sustained elevated energy prices constrain energy intensive economic activity, resulting in extensive demand destruction. In this scenario, the Brent oil price averages well above $100/bbl in 2026, with large increases in the prices of other affectedcommodities.
For businesses, higher energy costs raise production costs across virtually all sectors, compressing margins and reducing investment. For households, higher fuel prices erode households’ real incomes. Oil price shocks feed directly into headline inflation through energy prices and indirectly through fertilizer, transport, and production costs. A 10 percent increase in oil prices has been shown to raise inflation by about 0.4 percent in both advanced economies and EMDEs
(Choi et al. 2018; Känzig 2021). e direct share of energy in the consumer basket exceeds 5 percent in South Asia and is particularlyhighinIndia.
Higher inflation often necessitates monetary policy tightening, even if central bank credibility can help avoid second-round effects. Already, the latest rise in oil prices has lowered market expectations for monetary easing by theFederalReserve—the probability that the policy rate is unchanged from its current level by the end of the year (rather than being cut) has risen sharply since the end of February. Central banks around the world will likely have similar responses, tightening global financial conditions even as demand suffers.
South Asia is particularly vulnerable to rising energy prices because of its dependence on imported energy. Higher oil import bills would widen current account deficits and, where fuel subsidies are in place, do the same to fiscal deficits, which are generally already above the EMDE median. Countries with wide deficits, elevated external debt, expensive energy subsidies, and limited reserve buffers, such as Maldives, would be especially vulnerable. Where inflation is already abovetarget, such as in Bangladesh, central banks may find themselves with limited options to support demand when energy prices push up inflation. Annex table A1 provides metrics reflecting countries’ exposure, vulnerability, andabilitytorespondtoenergypriceshocks.
In addition to accounting for about 13 percent of South Asia’s exports, Gulf Cooperation Council (GCC) countries— Saudi Arabia, the UAE, Kuwait, Qatar, Bahrain, and Oman—host an estimated 9 million South Asians. Turmoil in the region could interrupt the flow of remittances from these workers if it causes job losses or disrupts migrant flows. ese flows provide significant support to incomes and current accounts in the region, making up nearly 10 percent of
GDP in Nepal, 3 percent in Bangladesh and Sri Lanka, and around 2percent in India. e poverty impact of migrant workers returning home or no longer sending remittances would likely outweigh the GDP impact, given that 90 percent of the South Asian migrant workers in the GCC are low-skilled and lower -paid than migrants in other host countries (WorldBank2025g).
While the conflict in the Middle East is expected to lower growth in the short term, it may revitalize several long-standing reform agendas. Efforts toward increasing the use of renewable energy and regional energy grid integration could reduce dependence on imported energy and build resilience to future energy supply shortages (World Bank 2023). High energy prices may prompt lasting fuel subsidy reforms and efficiency improvements among state-owned enterprises that intensively use energy inputs, such as those that produce fertilizers. e need to protect vulnerable households against fuel price spikes may spurreformsto strengthen adaptive social protection. Efforts to diversify global shipping and event hubs might benefit South Asian ports,logisticshubs,andtourism.
Global financial conditions have tightened as market expectations that major central banks will continue to lower policy rates have faded. All major equity index valuations have declined substantially since late February. Nonetheless, the global financial system has weathered multiple episodes of recent uncertainty with few signs of systemic stress. Most countries’ banking sectors are well capitalized and interest spreads for all but the riskiestborrowersarecontained.
Beneath the surface, however, some vulnerabilities may be worsening. High equity valuations are predicated on assumptions aboutgrowth,financialconditions,andprofits that may prove optimistic, particularly for
Some vulnerabilities in global and domestic financial systems may be growing. High levels of nonperforming loans could put pressure on solvency and confidence. High equity market valuations are vulnerable to a correction that could have significant impacts on activity. A.
tech stocks. Non-bank financial institutions (NBFIs) are generally not monitored or regulated in the same way as banks and have grownin size andincreased theirlinkageswith banks (IMF 2025). Private credit to firms has also surged, sometimes in complex and opaque forms (Aldasoro, Doerr, and Todorov 2025). In bond markets, tighter-thanexpected monetary policy in major central banks, concerns about monetary policy credibility, or weaker demand for government debt could push up term premia and lead to disorderly market conditions. Stresses in any of these market segments could spread to others, resulting in widespread financial turmoil characterized by equity price corrections, rising risk premia, and foreign exchangeshortages.
E. GDP growth for EMDEs during large equity price falls
F. Investment growth for EMDEs during large equity price falls
Sources: Haver Analytics; IMF Financial Soundness Indicators; Jacob and Raju (2024); Schiller Data; WDI; World Bank.
A. NPLs expressed as a percent of total loans. Data are for 2025Q1 for Sri Lanka, 2025Q3 for the Maldives, and 2025Q2 for other SAR countries. “Other EMDEs” shows the simple median and interquartile range of the latest observations for 87 EMDEs.
B. Capital adequacy ratio is defined as total regulatory capital divided by on- and off-balance-sheet assets weighted by risk. Data refer to 2025Q1 for Sri Lanka, 2025Q3 for India and Maldives, and 2025Q2 for other SAR countries. “Other EMDEs” shows the simple median and interquartile range for 87 EMDEs.
C. Scatter plot shows GDP per capita against market capitalization as a share of GDP for 62 countries in 2024. Blue dotted line shows simple trend.
D. The CAPE ratio (Cyclically Adjusted Price-to-Earnings) is a stock market valuation metric that divides a stock’s current price by its average inflation-adjusted earnings from the past 10 years, smoothing out business cycles to gauge long-term market valuation, with higher ratios often signaling overvaluation. For the United States, the CAPE for the S&P 500 index is used; for India, the BSE SENSEX. Averages are calculated using values since 2000.
E. Figure shows GDP growth across 18 episodes in 13 EMDEs from the 1990s to 2022, where domestic market capitalization fell by more than 50 percent of GDP. T = 0 marks the point of the market cap decline.
F. Figure shows real private investment growth across 15 episodes in 10 EMDEs from the 1990s to 2022, where domestic market capitalization fell by more than 50 percent of GDP. T = 0 marks the point of the market cap decline.
Global financial turbulence could transmit to South Asia through a sudden drop in risk appetite that causes capital outflows, currency depreciation, higher borrowing costs, and tighter domestic liquidity. ese spillovers would be amplified by each South Asian country’sdomesticvulnerabilities.
In Bangladesh and Nepal, risks are concentrated in the domestic banking system. In Bangladesh, nonperforming loans have been high and underreported (until recently) due to forbearance and permissive classifications, and many banks have insufficient capital buffers (figure 1.9; World Bank 2025h). Nonperforming loan ratios are also rising in Nepal’s banking system, although from a lower level. And nonperforming loan ratios remain high in Sri Lanka and Maldives,notwithstanding declines from the 2023 peak caused by the sovereign debt crisis in Sri Lanka and the 2021 peak caused by the pandemic-related tourism collapseinMaldives.
In Sri Lanka and Maldives, sovereign debt burdens present risks. In Sri Lanka, interest payments continue to absorb a high share of
government revenues, increasing vulnerability to changes in borrowing costs and leaving limited scope for fiscal policy support (World Bank 2025f). Maldives has limited foreign exchange reserves and is at high risk of sovereign debt distress, as assessed by credit rating agencies and recent debt sustainability assessments.
India’s banking system is well capitalized, its fiscal position is solid, and authorities are providing proactive oversight. In other countries, risks have arisen from the rapid development of domestic equity markets. e value of Indian equities rose from 76 percent of GDP in 2019 to 124 percent in 2025, well above the level of other countries at a comparable level of development. Indian equities have lagged other markets recently, but the stock index’s cyclically adjusted priceto-earnings ratio nonetheless stood at 33 in January—well above its long-run average of 25 and nearly double the EMDE average. Much of this is attributable to strong prospects for growth and profitability, but it may also signal some potential vulnerability to asuddencorrection.
In a sample of 69 EMDEs from 1984 to 2024, there have been 18 episodes of stock market valuations falling by the equivalent of at least 50 percent of GDP in a year. In these episodes, the median country experienced GDP growth of just 0.5 percent—5.5 percentage points below its prior four-year average—in the year after the stock market drop. Investment fell even more drastically, slowing by around 15 percentage points to4.3 percent,on average. Half of these episodes occurred around the 2008 global financial crisis, which featured many shocks beyond equity market corrections. Even when excluding episodes around 2008, large equity falls were associated with GDP and investment growth declining by 4.7 and 8.2 percentagepoints,respectively.
FIGURE 1.10 Slowdown in services trade due to restrictions or AI
Global trade has been weak for many years, and this trend was worsened by recent tariff increases. Services trade, however, has grown steadily. This is a source of strength for South Asia, which exports business and financial services, ICT, and tourism. This could become a weakness if new restrictive trade policies are introduced or if AI threatens business models. Greater AI exposure leads firms to reduce hiring, particularly among multinational affiliates. South Asian firms selling to foreign companies that are highly exposed to AI tend to have shrunk their networks of international buyers since the introduction of ChatGPT.
Sources: FactSet; Felten, Raj, and Seamans (2023); Global Trade Alert; IMF WEO; Lightcast; Pizzinelli et al. (2023); Reserve Bank of India; WDI; WTO; World Bank.
A. 2007 = 100. Index shows real growth of exports of goods and services. “South Asia” shows total exports from Bangladesh, Bhutan, India, Maldives, and Sri Lanka. 2025 uses IMF WEO estimation. B. Newly introduced policies each year. Services sectors are defined as sections 5–9 in CPC coding system.
C. Bars show ICT sector exports relative to total exports. Pink areas indicate the interquartile range for other EMDEs, weighted by population.
D. Lines show indexed values of technology services exports and total exports (2022Q3 = 100) in India from 2020Q2 to 2025Q3, with 2022Q3 marking the quarter before the release of ChatGPT. E. MNC affiliates are multinationals headquartered outside South Asia; local firms are South Asiaheadquartered with no foreign buyers; GVC suppliers have international buyers pre-ChatGPT. Bars show coefficients and whiskers show 95 percent confidence intervals from a firm-level regression of outcomes on average AI exposure of pre-ChatGPT job postings interacted with a post-ChatGPT indicator. Refer to chapter 2 for more details.
F. Bars show coefficients and whiskers show 95 percent confidence intervals from a firm-level regression of log job postings on the average AI exposure of firms’ international buyers before the introduction ChatGPT, interacted with a post-ChatGPT indicator. Refer to chapter 2 for more details.
Slowdown in services trade due to restrictions or AI
Global trade in goods has stagnated as a share of activity since 2007 and has been encumbered more recently by tariff volatility and uncertainty (figure 1.10). Global trade in services has grown robustly in recent decades even as goods trade has slowed. is has been a source of strength for South Asia. Services make up a large share of South Asia’s exports, accounting for 44 percent of total exports, compared to the global average of 27 percent in 2024. ey are concentrated in ICT, business services, tourism, and financial services. e region’s real services exports have grown at an average rate of 15 percent per yearsincethepandemic.
is source of strength could become a weakness under certain conditions. Services exports are not subject to tariffs, but trade policy could still become more restrictive through new rules and regulations. New restrictions on services have picked up in recent years, even if they remain less common than new restrictions on goods. Data localization rules could interrupt the flow of data moving across borders, reducing the ability of South Asian firms to service distant clients. Widening differences in approaches to privacy, consumer protection, financial compliance, or cybersecurity could hinder cross-border services trade. Geopolitical tensions or spreading diseases could lead to visa restrictions or other mobility constraints, sharply reducing tourism and any face-to-face contact required to expand or sustain business processoutsourcing,forexample.
e rapid adoption of AI-related technologies could similarly reshape services exports, specifically business process outsourcing (BPO). Many firms in India, Sri Lanka, and Nepal have grown rapidly by taking on the
back-office functions of corporations situated abroad, such as information and communication technology (ICT) and BPO services. Increasingly, many of these services can also be performed by AI at much lower cost. AI allows foreign buyers of South Asian services to reshore business functions that were previously sourced through imports but it may also generate demand for new, highervalue services by increasing productivity and investmentamongforeignbuyers.
ere is evidence that AI is already reshaping firms and jobs in South Asia since the release of ChatGPT in November 2022 (chapter 2 box 2.1). Companies that are more exposed to AI have seen reductions in overall hiring. An interquartile-range increase in AI exposure is associated with a 1.5 percent decline in job postings, a proxy for labor demand, compared to the aggregate trend in job postings. ese (relative) job losses are particularly large among South Asian firms that are multinational affiliates or GVC suppliers, compared to purely local firms. e nature of the overseas buyer also matters: South Asian suppliers exporting to highly exposed buyers (that are not part of a multinational) reduce employment most. An interquartile-range increase in buyers’ AI exposure is associated with a 10 percent reduction in hiring among theseSouthAsiansuppliers.
However, AI exposure among foreign buyers may also create opportunities. As AI-driven productivity gains fuel growth and investment in advanced economies, demand may expand for higher-value activities that complement rather than compete with AI. South Asian firmsthatmoveupthevaluechainordiversify into these complementary services—such as those that have transitioned from BPO services to more advanced knowledge process outsourcing (KPO) services—may benefit fromthisshift.
While South Asia’s services export industries are under pressure from AI adoption abroad, South Asian economies’ opportunities from AI adoption at home are hindered by digital penetration,whichisstilllimited despite rapid recentdevelopment.Onlyabout 60percentof people in the region have access to the internet, for example, and half of South Asian adults without a financial account also do not own a mobile phone (Klapper et al. 2025). is limits opportunities for digital transactions.
Structural reforms unlock new dynamism… or falter
Successful structural reforms create the conditions for higher productivity, investment, and growth. Setbacks to reforms—whether through outright policy reversals or simply weak implementation— can undermine confidence, deter investment, andleadtoeconomicstagnation.
South Asia’s growth has been substantially stronger than expected since the pandemic. Between 2021and 2025,growth in the region has been higher than originally forecast by an average of 0.8 percentage points each year (figure 1.11). India has largely driven this outperformance. e country has pursued a multitude of structural reforms that seem to be bearing fruit. Financial sector reforms improved the balance sheets of banks by resolving nonperforming loans. Public investment has improved transport and digital connectivity, as well as sanitation. GST reform helped unify the domestic market. More recently, labor law regulations were consolidated, simplified, and modernized. Recent free trade agreements with the European Union and the United Kingdom willexpandexportopportunities.
In other South Asian countries, growth has
South Asia’s growth has been stronger than expected since the pandemic, largely driven by India. Elsewhere, business climates tend to be challenging, but years of deterioration in policy reforms have recently reversed in many countries as economies emerge from crisis with IMF support. If reforms lead to a virtuous cycle of growth, countries in the region could reach high-income status more quickly than expected.
B. Business Ready scores in South Asia
C. Number of structural reforms under IMF programs in South Asia
D. Change in GDP growth around social unrest events
E. CPIA economic management cluster
F. Years to reach high-income status under alternative scenarios
A. Chart shows the 2021–25 average growth forecast errors across countries. For year t, forecast errors are defined as the difference between GDP growth estimates from the latest data and the April vintage of year t. Country GDP growth rates are reported on countries’ reference periods and converted to calendar years to calculate regional growth.
B. Figure shows countries’ Business Ready scores. “Other EMDEs” is median of 73 economies.
C. Figure shows the number of reforms for South Asian countries under IMF-supported programs, including Assessment Criteria, Performance Criteria, Prior Actions, and Structural Benchmarks.
D. Figure shows change in GDP growth around social unrest occurring in year t. The pre-event benchmark (t-1) is defined as the average GDP growth over the four years preceding the event (t-4 to t-1). Social unrest data from Global Protest Tracker, defined as having a peak crowd size of above 50,000 people. Sample includes 34 events in 26 countries between 2017 and 2020.
E. Chart presents the economic management cluster scores in the Country Policy Institutional Assessment (CPIA) for South Asian countries, which include assessments of Monetary and Exchange Rate Policies, Fiscal Policy, and Debt Policy.
F. Bars show number of years required to exceed the World Bank high-income threshold. Projections based on continuation of 2023–25 GDP growth rates and population trends (except Sri Lanka, which uses 2016–18 average to avoid recession). High-income threshold projected using its historical growth rate. Upside scenario incorporates recent regional forecast errors into post-2026 growth.
South Asia is less urban than other regions. It is not clear that South Asian cities are yielding the same benefits to productivity and wages as elsewhere. The benefits of agglomeration may be lessened by unplanned development, lack of infrastructure, and the limited capacity of municipal governments.
Urban population share of EMDE regions B. Difference in regional wage premium by urban agglomerations
Labor productivity premium among urban formal firms
Range of regional average wages
been weaker and less prone to upside surprises, possibly in part because of a lack of reform progress. Business climates tend to be challenging, with Bangladesh, Bhutan, and Nepal all scoring below the median EMDE in terms of the quality of their regulatory frameworks and public services (World Bank 2025i). is may soon change, however, as several South Asian countries are currently stepping up structural reforms, often with IMF and World Bank support. ese are concentrated in countries emerging from periods of public unrest and include reforms to improve governance of state-owned enterprises in Sri Lanka, enhance exchange rate flexibility in Bangladesh, and improve revenue collection and fiscal management in Nepal,amongothers.
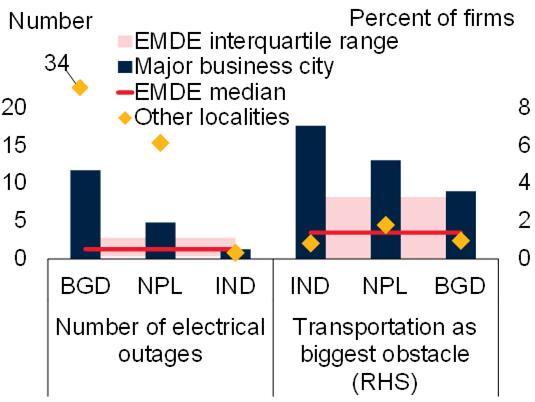
Sources: Global Labor Database; Maldives Household Income and Expenditure Survey 2019; Kapur and Subramanian (2025); World Urbanization Prospects 2025; WDI; World Bank Enterprise Survey; World Bank.
A. Definition from United Nations World Urbanization Prospects 2025, using the Degree of Urbanization methodology. A “city” is a contiguous agglomeration of 1-km2 grid cells with a density of at least 1,500 inhabitants per km2 and a total population of at least 50,000.
B. Predicted difference in log regional wage premium between the highest (90th percentile) and lowest (10th percentile) value for share of urban population. Refer to chapter 2 for more details.
C. Figure shows estimated coefficients of firm labor productivity growth premium on location in city with 250,000 or more people. Only statistically significant results are presented, except for Nepal. Sample includes 19 EMDEs between 2022 and 2025.
D. Charts show minimum-maximum range of average wages in admin-1-level subnational units relative to the average wage of the median subnational unit. Red shading represents the interquartile range and the red line shows the median value for 22 EMDEs. Bar for euro area shows the range of country-level average wages in 2024 in 12 euro area countries. Bar for United States shows the range of state-level average wages in 2024 in 29 U.S. states. Refer to chapter 2 for more details.
E. Responses of firms in major business cities to questions of how often they experienced electrical outages in the past month and perceive transportation as biggest obstacle to business operation. Sample for “Other EMDEs” includes 73 economies.
F. Latest data are for 2019 in India and 2023 in Nepal. AEs and “Other EMDEs” use latest available year. India’s local government refers to urban local bodies from Kapur and Subramanian (2025). “Other EMDEs” and “AEs” include, respectively, 65 and 34 economies for local government data.
e baseline forecast assumes that recent social unrest in Bangladesh and Nepal is followed by a rebound in growth as stability returns and structural reforms are enacted. is view is supported by recent improvements in indicators of governance quality (the World Bank Group’s Country PolicyandInstitutionalAssessment).
ere is, however, a risk that these reforms are not implemented fully or effectively. Recent improvements in the governance indicators mentioned above were partly in response to social unrest and came only after a preceding period of decline. ese countries may have underlying political economy constraints that could impede reform follow-through. e possibility of renewed social unrest and political volatility also makes reform trajectories less predictable. e payoff could be large if reforms are implemented steadfastly; but slippages, reversals, or uneven execution could just as easily erode confidence andstallthesecountries’growthmomentum.
Even modest differences in potential output growth can transform a country’s economic
trajectory if sustained. If countries in the region were to complete structural reforms that added the equivalent of South Asia’s recent forecast errors (+0.8 percentage points) on top of recent growth performance, it would significantly bring forward the date they would be expected to reach high-income status: India could be a high-income country by 2047, Bangladesh by 2060, Sri Lanka by 2050,andBhutanby2042.
Accelerating growth and job creation is a major challenge. Cities can be a powerful tool for accomplishing these goals. Reforms to empower local governments can improve the ability of South Asian cities to drive productivity growth and create large numbers of jobs. Concentrating growth in small areas while other regions lag can be a recipe for social tensions. Promoting tourism can spread growth more broadly, including to rural areas where poverty is often concentrated. Welldesigned and targeted industrial policy can help accelerate and spread growth. Facing limited fiscal space and regulatory capacity, South Asia can focus on broad-based development policies complemented by firstchoice industrial policy measures that address market failures. A cross-cutting priority is improvinginfrastructureintheregion.
Urbanization is a powerful force for raising productivity and incomes (Ciccone and Hall 1996; Brülhart and Sbergami 2009). e concentration of people in cities allows firms and people to benefit from knowledge spillovers, specialization, and skill matching both within and across sectors (Henderson 2003; Glaeser et al. 1992). e density of activity improves economies of scale and allows infrastructure to be efficiently shared,
makingcomplex,high-valueactivitiesviable.
Using internationally comparable data, around 40 percent of South Asians live in cities, which is less than in other EMDE regions (figure 1.12; United Nations 2025). is share is increasing: more than 500 million people are expected to move into South Asian cities by 2050 (World Bank 2025j). Cities that are able to absorb large numbers of migrants are a critical engine of labor market integration, helping to absorb shocks in the national job market as workers suffering from job losses elsewhere can move tolocationswithmorepromisingprospects.
ere are signs that many cities in South Asia are less effective than elsewhere at boosting incomes and absorbing migrants. For example, the Indian states of Maharashtra and Gujarat have almost identical urban population shares, but Maharashtra has a wage premium (controlling for worker characteristics) that is 6 percentage points above the median, while Gujarat’s is 7 percentage points below the median (chapter 2, box 2.2). As a result of this wide heterogeneity, and unlike in other EMDEs, there is no statistically significant association between greater urbanization and higher wages across regions in South Asia. e labor productivity premium for urban formal firms in South Asia is also on the low end among EMDEs.
is may be because the benefits of agglomeration are being undermined by the negative externalities of urban density, including costs of congestion, disease, and crime (Jedwab and Vollrath 2015). e densely-populated Indo-Gangetic Plains and Himalayan Foothills—which include parts of Bangladesh, Bhutan, India, Nepal, and Pakistan—have some of the world’s highest levels of pollution, which take a heavy toll on
Tourism activity has largely recovered since the pandemic and is an important sector for South Asia. The sector has many appealing characteristics, and is far more productive than the informal sector, even if it is one of the least productive formal sectors. Improving infrastructure quality can help boost productivity gains and other benefits of the sector.
C. Per capita real GDP growth after significant increases in share of tourism activity
D. Cumulative change in real GDP per capita, 2000–19, by convergence club
E. Formal sector wage gap relative to EMDE average, 2020–2025 F. Infrastructure and services development index for tourism and travel
health and productivity (Heger, Cros, and Pople2025).
All major cities are congested to a degree, but in productive cities high density coexists with high levels of livability. In most South Asian countries, 40 percent or more of the urban population lives in slums, above the EMDE median,likelyduetoinefficienciesinlandand housing markets (Bryan, Glaeser, and Tsivanidis2020).
Policymakers can improve the livability and prosperity of cities in a variety of ways. Land and housing reform can increase the supply and density of affordable housing (Ellis and Roberts 2016; World Bank 2025j). is includes improving land titling and registration systems, and increasing access to finance forconstruction and mortgages.It also includes improving urban land management by governments, which often own and underutilize large tracts of prime land. Revenues from land sales can be an important fundingsourceforlocalgovernments.
Sources: BLS; Haver Analytics; Travel & Tourism Development Index 2024; WEO; World Bank Enterprise Survey; World Bank.
A. Tourism share of GDP is measured as the value added share of accommodation and food service activities. Tourism employment is proxied by accommodation, food and beverage service activities, and travel agency and tour operator activities. For Maldives, the direct tourism value added share is used for GDP, and employment share also includes the transportation sector. Employment data are for 2017 for Nepal, 2019 for Maldives, 2023 for Sri Lanka, and 2024 for others.
B. Figure shows 12-month moving average of tourist arrivals, indexed to 2019.
C. T = 0 denotes the year in which tourism share rose by more than 1.67 percentage points, which is the 90th percentile of increases in the sample. Sample includes 159 EMDEs from 1995 to 2020.
D. Figure shows cumulative percent change in real GDP per capita for each convergence club from 2000 to 2019. Whiskers indicate 90 percent confidence intervals. Convergence clubs are groups of countries whose differences in macroeconomic outcomes narrow over time. Based on the methodology of Phillips and Sul (2009). “High-tourism club” represents the convergence group with the highest tourism share of GDP (averaging 9.5 percent), while “Low-tourism club” represents the group with the lowest tourism share (averaging 1.8 percent).
E. EMDEs include 82 economies between 2020 and 2025. Average country and sectoral wages are weighted at firm-level. Bars show the median percent deviation across all EMDEs.
F. Bars show the 2024 Travel & Tourism Development sub-index for Infrastructure and Services.
Basic urban services that could mitigate negative externalities are often not adequate in South Asia (Bryan, Glaeser, and Tsivanidis 2020). Core elements of urban infrastructure such as transit, electricity,and sanitation often lag demand—many firmsin South Asia report frequently experiencing electrical outages and that transportation is among their biggest obstacles. Insufficient infrastructure investment also translates into a lack of resilience to natural hazards, particularly heat waves and urban flooding (World Bank 2025j).
Local governments are limited in their ability to improve urban infrastructure. ey often lack the mandate, accountability, or financial capacity needed to develop or maintain urban infrastructure. As in other EMDEs, local governments in South Asia are often under-
resourcedandgenerallylacktheabilitytoraise needed funds on their own, relying on transfers from federal or state governments for the majority of their expenditures. e central government in Maldives sets all local revenue rates (Ellis and Roberts 2016). In Bangladesh and Bhutan, local governments must comply with central government guidelines and secure approvaltoadjustlocaltaxrates.
One way to harness the potential gains from urbanization is to strengthen fiscal decentralization so that public services can be delivered closer to citizens (Sow and Razafimahefa 2015). In India, for example, fiscal decentralization has made rapid progress at the state level, but less so at the local level: between 1961 and 2019, the share of statelevel expenditure increased from 8.1 to 16.6 percent, while that of local expenditures changed from 0.6 to 0.8 percent (Kapur and Subramanian2025).
Several South Asian countries have increased the resources available to local governments through intergovernmental transfers rather than increasing local revenues. Revenue decentralization to the local government level hasthe potential to improve publicservices, as local governments have more knowledge and accountability to their communities. Expanding access to own-source tax revenues and capital market financing could provide additional, more flexible resources for local governments to support urban infrastructure and public service delivery (Khemani et al. 2005). For example, fiscal decentralization to the third tier of government has been found to be associated with lower infant mortality rates and overall citizen satisfaction, as improved citizen participation makes the allocation of expenditure more closely match popular preferences (Gonçalves 2014; Miao 2023).
Tourism is an important economic sector in South Asia. It accounts for a particularly large share of activity and employment in Maldives, Bhutan, and Nepal (figure 1.13). Tourist arrivals collapsed during the pandemic but have since rebounded (Twining-Ward et al. 2026).
Tourism activity has several appealing economic characteristics. It can spread growth to lagging areas such as secondary cities and rural areas where poverty is often concentrated, thereby reducing urban-rural income inequality (Li et al. 2016). It brings in foreign exchange earnings but, unlike many other export industries, it is less vulnerable to foreign policy changes such as tariffs or competition from artificial intelligence. It creates a wide spectrum of jobs that can absorb labor from agriculture and informal sectors, often including marginalized groups, women,andyouth.
In recent decades, EMDEs where tourism increased as a significant share of GDP also tended to experience accelerations in per capita GDP. An exercise following the methodology of Tomal (2024) and first suggested by Baumol (1986) also finds that there is a distinct “convergence club” of countries characterized by large tourism sectors (averaging about 10 percent of GDP) and faster recent growth in per capita incomes.
ese findings are consistent with those in the literature. On a macroeconomic level, studies find a positive relationship between the degree of tourism dependence and the pace of GDP growth, and no evidence of systematic distortions—such as overvalued real exchange rates and de-industrialization—that might lead to the opposite (Pérez-Rodríguez, Ledesma-Rodríguez, and Santana-Gallego
The number of new industrial policy measures soared in the 2020s, led by advanced economies. In South Asia, the number of new industrial policy measures per year doubled between 2016–19 and 2022–25. Importrestricting industrial policy measures were followed by declines in imports, but export-supporting measures did not produce gains in exports.
C. Cumulative percent change in South Asia’s imports after start of trade defense instruments
Sources: CEPII BACI; GTA; World Bank.
A. Lines show the new industrial policies implemented over time, either the total number of policies (liberalizing as well as protective measures) or protective policies only, which discriminate against foreign businesses and protect domestic businesses, as classified in the Global Trade Alert (GTA).
B. Bars show the annual average number of new industrial policies implemented in each country group. Blue bars show the number of protective measures, and the red bars show the number of liberalizing measures, shown as negative values.
C. Estimates of the change in affected sector’s imports after the introduction of trade defense instruments, including anti-dumping, anti-subsidy, and other safeguards. Refer to chapter 2 for more details.
D. Estimates of the change in affected sector’s exports after the introduction of export incentives, including export subsidies, export tax incentives, and other export incentives. Refer to chapter 2 for more details.
2015; Holzner 2011). On a local level, surges in tourism have been found to lead to large and significant economic gains through both direct effects and spillovers to other sectors (Faber and Gaubert 2019; Nocito, Sartarelli, andSobbrio2023).
Jobs in tourism are generally less productive than those in other formal sectors, and wages in the sector tend to be considerably lower
than average. e prevalence of face-to-face services in tourism means that the benefits from economies of scale and automation can be more challenging to achieve than in manufacturing, for example. Tourist activity can be seasonal, resulting in high staff turnover and inefficiently low capacity utilization during off-peak periods. e sector can nonetheless support rising incomes when itisdrawingworkersfromtheinformalsector, who are less than half as productive as formal sector workers in South Asia (Ohnsorge and Yu2022).
Several countries in South Asia (Sri Lanka, Bhutan, and Nepal) are making efforts at improving connectivity and increasing valueadded in tourism to create jobs in lagging regions (World Bank 2024b, 2025k, forthcoming). Productivity and wages in the sector can be raised by moving into high-yield segments and investing in skills, standards, and enterprise capabilities. Empowered destination management organizations can professionalize local stewardship and coordinate private investment. e benefits of tourism can be distributed throughout the economy by moving away from importdependent “enclave” models. Community linkages can be maximized to raise value addedandpositivespillovers—forexample,by connecting the hospitality industry with local farmers, transport services, and creative industries. Appropriately designed industrial policiescanguidesuchefforts.
Many of the enabling conditions for tourism are also helpful for growth more generally. Infrastructure qualitytendsto belowin South Asia, resulting in gaps in transport connectivity and services such as sanitation at destinations.Publicinvestmentcan close these gaps with significant benefits for both tourism and the broader private sector, as it reduces congestion, improves safety, and helps preserve sensitive ecosystems and heritage sites
from degradation. Both tourism and the broader economy benefit from sound regulation and land-use planning; transparent and predictable permitting; environmental sustainability; and skills systemsalignedwithindustryneeds.
Over the past decade, industrial policy has gained momentum globally (figure 1.14; Evenett et al. 2024; Fernandes and Reed 2026; Juhász et al. 2023). In the right enabling environment, industrial policy can drive meaningful structural change by addressing market failures such as high fixed costs, coordination problems, and information gaps (chapter 2). Partly inspired by success stories from East Asia and guided by lessons from Latin America, new industrial policiesare more outward-oriented and focused on integrating into global value chains. ey are also less likely to be motivated by import substitution and industrialization than they were in the 1970s to1990s.
South Asia has long made proactive use of industrial policy. Already prior to the pandemic (2016–19), South Asia introduced about twice as many new industrial policies per year as the average EMDE. In the four years after the pandemic (2022–25), the region’s use of industrial policies more than doubled. India drove most of the increase, with the average number of new protective measures implemented each year increasing from 125 to 240, placing it among the world’s top 10 countries by policy counts andthirdamongEMDEs.
Since the pandemic, significantly more new industrial policy measureshave been directed at firms with more workers (Bangladesh, India) or higher productivity (India). In manufacturing, which is the target of about half of new policies in South Asia, Sri Lanka
directed more policies at sectors with more employment, and India directed more policies atsectorswithhigherwages.
Compared with other EMDEs, South Asia used fewer domestic subsidies and more procurement-related measures (India) and trade-related measures (elsewhere in South Asia). Import instruments—such as import bans, import tariffs, and import licensing requirements—accounted for 25 percent of the region’s new protective policies implemented during 2022–25. Measures to steer exports—such as export subsidies, taxes, or quotas—have accounted for about onetenth of South Asia’s protective policies, but aboutone-thirdinBangladesh.
Trade-related measures have had asymmetric effects in South Asia. Sectoral imports declined significantly for several years after the introduction of import-restricting policies in South Asia, but sectoral exports did not rise significantlyafterexport-promotingpolicies.
In principle, domestic subsidies—such as financial grants, loans, and interest payment subsidies—could help firms address the credit constraints, high fixed costs, or coordination challenges that often accompany exporting activities. In practice, however, such subsidies have not been associated with significant increasesinsectoralexportsinSouthAsia.
More broadly, South Asia’s experience with industrial policies has been mixed. e region’s use of industrial policies has been constrained by limited fiscal space and government capacity, as well as gaps in implementation and infrastructure. e few success cases have hinged on coordinated policy and integration into global value chains.
Because of these constraints on industrial policies,effortsto address market failures head
on (so-called first-choice policies)—such as industrial parks, skills development, market access assistance, and quality infrastructure improvement—can maximize the chance of success. ese are likely to be most effective if accompanied by broad-based policies to improve physical and digital infrastructure, business environments, and institutions. Some of South Asia’s fastest periods of investment growth have been driven by broad-based improvements in the underlying business environment, regulatory predictability, and state capacity—reinforcing the importance of cross-cuttingreforms.
e analysis in box 1.1 combines data on tariffs, imports and exports, and household income and consumption expenditure to assess how proposed trade reforms relate to countries’ current trade specializations and how households might be affected. Trade specializations are proxied using revealed comparative advantages (RCA) Household impacts are estimated using the framework of Artuc,Porto,andRijkers(2021).
Tari s and para-tari s. Latest 6-digit HS product-level tariff data are obtained from the Analytical Database of the World Trade Organization (WTO) and from the Sri Lanka Customs National Imports Tariff Guide 2025 forpara-tariffs. e reform scenario appliesSri Lanka National Tariff Policy’s proposed full phase-out of the Commodity Export Subsidy Scheme (CESS) and Ports and Airport Development Levy (PAL) on all imports until 2029. Tariff cut commitments as part of India’s free trade agreements (FTA) with the EuropeanUnionandtheUnitedKingdomare from Indian, EU, and UK customs schedules and various press releases. e India-UK Comprehensive Economic and Trade
Agreement (CETA), annex 2, comprises a full list of 8-digit HS product-level tariff cut commitments.
Household impact: Method. e impact analysis estimates the first-order, short-run real income effects of the proposed tariff and para-tariff reforms on different households across the income distribution, following the framework of Artuc, Porto, and Rijkers (2021). erealincomeeffectsaregivenby (1.1)
us, household h experiences real income gains if reductions in import duties τ are concentrated in sectors i where it is a netconsumer, such that expenditure shares si h exceed income shares ϕi h. is conceptualization, which is based on Deaton (1989), assumes perfect pass-through elasticities from changes in import duties to producer and consumer prices. To more closely reflect the expenditure and income effects on households, the analysis across broader commodity groups or goodsproducing sectors relies on import-weighted importduties.
Householdimpact:Data. Household income and expenditure data are from IFPRI’s 2023 Social Accounting Matrices for India and Sri Lanka. ey provide income and expenditure data across 10 household groups. Urban and rural households are separated into national per capita consumption expenditure quintiles, such that urban and rural quintiles are comparableandthatthecombinedpopulation of each quintile is equal to one-fifth of the national population. Income and expenditure data are disaggregated across 42 sectors (30 goods-producing sectors and 12 service sectors; IFPRI 2024, 2025). e sum of sectoral household income is the difference
between total household income and enterprise, government, and foreign transfers. e sum of sectoral household expenditure is the difference between total household expenditure and non-marketed consumption, taxes,savings,andpaymentsabroad.
Revealed comparative advantages. is measure, as introduced in Balassa (1965), represents the ratio of a country’s sectoral export shares relative to the global average. More formally, country c’s RCA index in sector j iscalculatedas
where X denotesexport values. e numerator measures the share of sector j in country c’s total gross exports. e denominator calculatesthesameacrossalleconomies.Ifthe
RCA is above 1 for a particular sector j, it indicates that country c is specialized in exporting that sector’s outputs. Given its distributional properties, figures B1.1.3 and B1.1.5 report the natural logarithm of RCAs, such that values above zero indicate country’s export specialization. Data on RCAs across 35 sectors (16 goods-producing sectors and 19 service sectors) are from the ADB Multiregional Input-Output Tables and CEPIIBACIfor2024(annextableB1.1).
Sources: BACI; Fitch; Haver Analytics; IMF WEO; WDI; World Bank.
Note: External
Agriculture, hunting, forestry, and fishing
Mining and quarrying
Food, beverages, and tobacco
Textiles and textile products
Leather products, and footwear
Wood, products of wood and cork
Pulp, paper, paper products, printing, and publishing
Coke, refined petroleum, and nuclear fuel
Chemicals and chemical products
Rubber and plastics
Other non-metallic minerals
Basic metals and fabricated metal
Machinery, not elsewhere classified
Electrical and optical equipment
Transport equipment
Manufacturing, not elsewhere classified; recycling
Electricity, gas, and water supply
Construction
Sale, maintenance, and repair of motor vehicles and motorcycles; retail sale of fuel
Wholesale trade and commission trade
Retail trade; repair of household goods
Inland transport
Water transport
Air transport
Other supporting and auxiliary transport activities
Hotels and restaurants
Post and telecommunications
Financial intermediation
Real estate activities
Renting of M&Eq and other business activities
Public administration; defense; compulsory social security
Education
Health and social work
Other community, social, and personal services
Private households with employed persons
Maize; rice; other cereals; pulses; oilseeds; roots; vegetables; sugarcane; tobacco; cotton and fibres; fruits and nuts; coffee, tea, and cocoa; other crops; cattle and raw milk; poultry and eggs; other livestock; forestry; fishing Agriculture
Mining
Food processing
Beverage and tobacco
Textiles, clothing, and footwear
Wood and paper products
Chemicals and petroleum
Non-metal minerals
Metals and metal products
Machinery, equipment and vehicles
Other manufacturing
Electricity, gas, and steam
Water supply and sewage
Construction
Wholesale and retail trade
Transportation and storage
Accommodation and food services
Information and communication
Finance and insurance
Real estate activities
Business services
Public administration
Education
Health and social work
Other services
Other industry
Light manufacturing
Heavy manufacturing
Light manufacturing
Other industry
Other services
Business services
Other services
Acharya, S., M. Kumar, and P. Blenkinsop. 2026. “India, EU Reach Landmark Trade Deal, Tariffs to Be Slashed on Most Goods.” Reuters.January27,2026.
Aldasoro,I.,S.Doerr,andK.Todorov.2025. "Retail Investors in Private Credit." BIS Bulletin 106, Bank for International Settlements, Basel. https://www.bis.org/publ/ bisbull106.htm.
Artuc, E., G. Porto, and B. Rijkers. 2021. “Household Impacts of Tariffs: Data and Results from Agricultural Trade Protection.” WorldBankEconomicReview 35(3):563–85.
Balassa, B. 1965. “Trade Liberalisation and ‘Revealed’ Comparative Advantage.” e ManchesterSchool 33(2):99–123.
Baumol, W. J. 1986. “Productivity Growth, Convergence, and Welfare: What the LongRun Data Show.” American Economic Review 76(5):1072–85.
Brülhart, M., and F. Sbergami. 2009. “Agglomeration and Growth: Cross-Country Evidence.” Journal of Urban Economics 65(1): 48–63
Bryan, G., E. Glaeser, and N. Tsivanidis. 2020. “Cities in the Developing World.” AnnualReviewofEconomics 12(1):273-97.
Budget Lab at Yale. 2026. “Tracking the Economic Effects of Tariffs.” Yale University. https://budgetlab.yale.edu/research/trackingeconomic-effects-tariffs.
Central Bank of Sri Lanka. 2025. Financial Stability Review 2025. Colombo: Central BankofSriLanka.
Choi, S., D. Furceri, P. Loungani, S. Mishra, and M. Poplawski-Ribeiro. 2018. “Oil Prices and Inflation Dynamics: Evidence from Advanced and Developing Economies.”
Journal of International Money and Finance 82 (April):71–96.
Ciccone, A., and R. E. Hall. 1996. “Productivity and the Density of Economic Activity.” American Economic Review 86 (1): 54–70.
De Loecker, J., P. K. Goldberg, A. K. Khandelwal, and N. Pavcnik. 2016. “Prices, Markups, and Trade Reform.” Econometrica 84(2):445–510.
Deaton, A. 1989. “Rice Prices and Income Distribution in ailand: A Non-Parametric Analysis.” EconomicJournal 99(395):1–37.
EconomyNext. 2026. “Sri Lanka to Remove Para-Tariffs Cess, PAL: Deputy Minister.” February11,2026.https://economynext.com/ sri-lanka-to-remove-para-tariffs-cess-paldeputy-minister-260390/.
Ellis, P., and M. Roberts. 2016. “Leveraging Urbanization in South Asia: Managing Spatial Transformation for Prosperity and Livability.” Washington,DC:WorldBank.
Evenett, S., A. Jakubik, F. Martín, and M. Ruta. 2024. “ e Return of Industrial Policy in Data.” IMF Working Paper 24/1, International Monetary Fund, Washington, DC.
Faber, B., and C. Gaubert. 2019. “Tourism and Economic Development: Evidence from Mexico’s Coastline.” American Economic Review 109(6):2245–93.
Fajgelbaum, P. D., and A. K. Khandelwal. 2016. “Measuring the Unequal Gains from Trade.” Quarterly Journal of Economics 131 (3):1113–80.
Felten, E., M. Raj, and R. Seamans. 2023. “Occupational Heterogeneity in Exposure to Generative AI.” SSRN Working Paper 4414065, Social Science Research Network, Rochester,NY.
Fernandes, A., and T. Reed. 2026. Industrial Policy for Development. Approaches in the 21st Century. Policy ResearchReport. Washington, DC:WorldBank.
Glaeser, E. L., H. D. Kallal, J. A. Scheinkman, and A. Shleifer. 1992. “Growth in Cities.” Journal of Political Economy 100 (6):1126–52.
Gonçalves, S. 2014. “ e Effects of Participatory Budgeting on Municipal Expenditures and Infant Mortality in Brazil.” WorldDevelopment 53(January):94–110.
Growth Lab at Harvard University. 2026. “Growth Projections and Complexity Rankings.” Harvard Dataverse. https:// doi.org/10.7910/DVN/XTAQMC.
Hakobyan, S., and J. McLaren. 2016. “Looking for Local Labor Market Effects of NAFTA.” Review of Economics and Statistics 98(4):728–41.
Heger, M. P., M. Cros, and A. Pople, eds. 2025. A Breath of Change: Solutions for Cleaner Air in the Indo-Gangetic Plains and Himalayan Foothills. Washington, DC: World Bank.
Henderson, J. V. 2003. “Marshall’s Scale Economies.” Journal of Urban Economics 53 (1):1–28.
Hinz, J., R. Langhammer, H. Mahlkow, and V. akur. 2026. “ e EU–India Trade Deal: Strategic Diversification in an Era of Uncertainty.” Kiel Policy Brief 202 (January), KielInstitutefortheWorldEconomy,Kiel.
Holzner, M. 2011. “Tourism and Economic Development: e Beach Disease?” Tourism Management 32(4):922–33.
IFPRI (International Food Policy Research Institute). 2024. “2022/23 Social Accounting Matrix for India.” Data Paper, IFPRI, Washington,DC.
IFPRI (International Food Policy Research Institute). 2025. “2023 Social Accounting Matrix for Sri Lanka: A Nexus Project SAM.” Data Paper, IFPRI, Washington, DC.
IMF (International Monetary Fund). 2025. “Global Financial Stability Report, October 2025: Shifting Ground beneath the Calm.” Washington, DC: International Monetary Fund.
Jacob, J., and R. Raju. 2024. “Forecast or Fallacy? Shiller's CAPE: Market and Style Factor Forward Returns in Indian Equities.” Electronic Working Paper Series 4911989, SSRN,Rochester,NY.
Jedwab, R., and D. Vollrath. 2015. “Urbanization without Growth in Historical Perspective.” Explorations in Economic History 58(October):1–21.
Juhász, R., N. Lane, E. Oehlsen, and V. C. Perez. 2023. “ e Who, What, When, and How of Industrial Policy: A Text-Based Approach.” SSRN Scholarly Paper 4198209, Social Science Research Network, Rochester, NY.
Känzig, D. R. 2021. " e Macroeconomic Effects of Oil Supply News: Evidence from OPECAnnouncements." American Economic Review 111(4):1092–125.
Kapur, D., and A. Subramanian. 2025. A Sixth of Humanity: Independent India’s Development Odyssey. New Delhi: HarperCollinsIndia.
Khemani, S., J. Ahmad, S. Shah, and S. Devarajan. 2005. “Decentralization and Service Delivery.” Policy Research Working Paper3603,WorldBank,Washington,DC.
Klapper, L., D. Singer, L. Starita, and A. Norris. 2025. e Global Findex Database 2025: Connectivity and Financial Inclusion in
the Digital Economy. July. Washington, DC: WorldBank.
Lang, M., J. Rexer, S. Sharma, and M. Triyana, eds. 2025. From Risk to Resilience: Helping People and Firms Adapt in South Asia. South Asia Development Matters. Washington,DC:WorldBank.
Li, H., J. L.Chen, G. Li,and C. Goh. 2016. “Tourism and Regional Income Inequality: Evidence from China.” Annals of Tourism Research 58(May):81–99.
Miao, H. 2023. “Types of Public Participation and eir Effect on Satisfaction with Local Public Servicesin China: Political Trust as a Moderating Variable.” Asian Survey 63(6):851–77.
NITI Aayog (National Institution for Transforming India). 2025. India’s Services Sector: Insights from GVA Trends and Statelevel Dynamics. October. New Delhi: GovernmentofIndia.
Nocito, S., M. Sartarelli, and F. Sobbrio. 2023. “A Beam of Light: Media, Tourism and Economic Development.” Journal of UrbanEconomics 137(September):103575.
Ohnsorge, F., and S. Yu, eds. 2022. e Long Shadow of Informality: Challenges and Policies. Washington,DC:WorldBank.
Pérez-Rodríguez, J. V., F. LedesmaRodríguez, and M. Santana-Gallego. 2015. “Testing Dependence between GDP and Tourism’s Growth Rates.” Tourism Management 48(June):268–82.
Pizzinelli, C., A. J. Panton, M. M. Tavares, M. Cazzaniga, and L. Li. 2023. “Labor Market Exposure to AI: Cross-Country Differences and Distributional Implications.” IMF Working Paper 2023/216. International Monetary Fund, Washington,DC.
RBI (ReserveBankofIndia).2025. Financial Stability Report, December 2025. Mumbai: ReserveBankofIndia.
Sow, M., and F. Razafimahefa. 2015. “Fiscal Decentralization and the Efficiency of Public Service Delivery.” IMF Working Paper 15/59, International Monetary Fund, Washington,DC.
Subramanian, A. 2026. “India May Be about to Become One of the World’s Most Open Economies.” e Economist, February 5, 2026.
Tomal, M. 2024. “A Review of Phillips-Sul Approach-Based Club Convergence Tests.” JournalofEconomicSurveys 38(3):899–930.
Twining-Ward, L., A. Tomilin, P. BellasSuarez, Y. Chun, S. Danyo, G. Dao, W. Fang, et al. 2026. Tourism Watch. February. Washington,DC:WorldBank.
U.K. Department for Business and Trade. 2025. Impact Assessment of the Free Trade Agreement between the United Kingdom of GreatBritainandNorthernIrelandandIndia. London:UKGovernment.
UNCTAD (United Nations Conference on Trade and Development). 2026. Global Trade Update. January. New York: United Nations.
United Nations. 2025. World Urbanization Prospects 2025: Summary of Results. New York:UnitedNations.
Ural Marchand, B. 2012. “Tariff Passthrough and the Distributional Effects of TradeLiberalization.” Journal of Development Economics 99(2):265–81.
Wijesinghe, A., and C. Yogarajah. 2022. “Trade Policy Effects on Global Value Chain Participation of South Asian Countries.”
Journal of Asian Economic Integration 4 (1): 24–48.
World Bank. 2020. World Development Report 2020: Trading for Development in the Age of Global Value Chains. Washington, DC:WorldBank.
World Bank. 2021. Bangladesh Systematic Country Diagnostic, 2021 Update. Washington,DC:WorldBank.
World Bank. 2023. South Asia Development Update: Toward Faster, Cleaner Growth. October.Washington,DC:WorldBank.
World Bank.2024a. South Asia Development Update: Women, Jobs, and Growth. October. Washington,DC:WorldBank.
World Bank. 2024b. Bhutan Country Economic Memorandum: Maximizing Bhutan’s Potential for Economic Diversification and Structural Transformation September.Washington,DC:WorldBank.
World Bank. 2025a. Global Economic Prospects. June. Washington, DC: World Bank.
WorldBank.2025b. South Asia Development Update: Jobs, AI, and Trade. October. Washington,DC:WorldBank.
WorldBank.2025c. India Country Economic Memorandum: Becoming a High-Income Economy in a Generation. Washington, DC: WorldBank.
World Bank. 2025d. Bangladesh: Country Private Sector Diagnostic. Washington, DC: WorldBank.
World Bank. 2025e. Maldives Development Update. Washington,DC:WorldBank.
World Bank. 2025f. Sri Lanka Public Finance Review: Towards a Balanced Fiscal Adjustment.Washington,DC:WorldBank.
WorldBank.2025g. South Asia Development Update: Taxing Times. April. Washington, DC:WorldBank.
World Bank. 2025h. Bangladesh DevelopmentUpdate: Special Focus - Restoring Financial Sector Stability. Washington, DC: WorldBank.
World Bank. 2025i. Business Ready 2025. Washington,DC:WorldBank.
World Bank. 2025j. Towards Resilient and Prosperous Cities in India. Washington, DC: WorldBank.
World Bank. 2025k. Nepal Country Economic Memorandum: Unlocking Nepal’s Growth Potential. Washington, DC: World Bank.
World Bank. 2026. Global Economic Prospects. January. Washington, DC: World Bank.
World Bank. Forthcoming. “Sri Lanka Country Partnership Framework.” World Bank,Washington,DC.
WTO (World Trade Organization). 2025. Global Trade Outlook and Statistics: October 2025 Update. Geneva: World Trade Organization.
On average during 2022–25, South Asian countries implemented twice as many industrial policies as the average EMDE. About half of these policies have been aimed at manufacturing. Among the policies targeted at manufacturing, Sri Lanka’s focused on high-employment activities, Bangladesh’s on large firms, and India’s on high-wage activities and on large, more productive firms. While the activities with the most industrial policy measures have been the largest source of manufacturing employment growth, they have not been the main source of non-agricultural employment growth. The main source of non-agricultural employment growth has been the service sector, which has received few industrial policies. Compared with other EMDEs, South Asia has relied less on subsidies and more on procurement measures (India) and traderelated measures (elsewhere in South Asia). The latter have had asymmetric impacts in South Asia: importrestricting policies were followed by statistically significant declines in imports, but export-supporting measures did not produce significant gains in exports. Constrained by limited fiscal space and regulatory capacity, South Asia can focus on broad-based development policies such as infrastructure investment, business environment reforms, and stronger institutions. Where more targeted measures are needed, industrial policy can prioritize policies that address clear market failures, such as industrial parks, skill development programs, market access assistance, and quality assurance infrastructure.
Over the past decade, the use of industrial policy has grown around the world (figure 2.1; Evenett et al. 2024; Fernandes and Reed 2026; Juhász et al. 2023). Defined broadly as government actions aimed at increasing strategic business activities, industrial policies are typically designed to develop or support specific firms, sectors, or domestic economic activities by providing policy preferences (IMF2025;WorldBank2024a).1
Against the backdrop of a global slowdown in growth, supply chain disruptions, and the rapid rise in automation and artificial
Note: This chapter was
1 Industrial policy measures are not limited to the industrial sectors, and can be used to develop services sectors, such as tourism, and agricultural and mining sectors that provide upstream inputs. Industrial policy can be implemented using policy instruments such as domestic subsidies and state aid, trade-related policies including import tariffs and controls and export subsidies, and public procurement policies.
intelligence, both advanced economies and emerging markets and developing economies (EMDEs) have increased their use of industrial policies to support domestic priority sectors and boost resilience. South Asia, too, has stepped up its use of industrial policy measures: in the average South Asian country, the annual average number of newly implemented policies doubled between the four years prior to the COVID-19 pandemic (2016–19)andthefouryearsafterward(2022–25). When ranked by the number of new industrial policies during 2022–25, India was among the world’s top 10 countries and was thirdamongEMDEs,afterChinaandBrazil.
Historical evidence suggests that industrial policies, when implemented in the right enabling environment, can address market failures—such as high fixed costs, coordination problems, and information gaps—and drive meaningful structural change (Aghion et al. 2015; Altenburg and Rodrik 2017; Choi and Levchenko 2025; Fernandes and Reed 2026). PartlyinspiredbysuccessstoriesfromEastAsia
The number of new industrial policy measures soared in the 2020s, led by advanced economies. In South Asia, the number of new industrial policy measures per year doubled between 2016–19 and 2022–25, with India accounting for most of the increase.
A. World: Number of new industrial policy measures
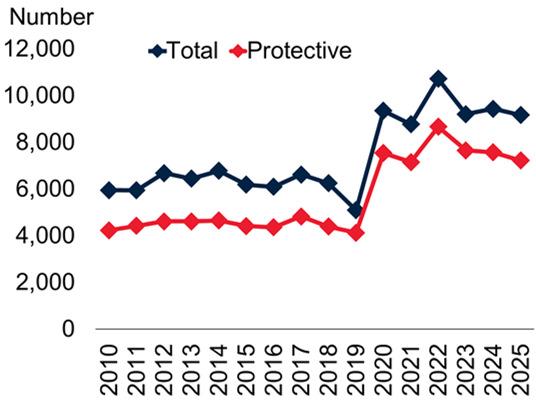
C.
B. Average annual number of new industrial policy measures per country
and guided by lessons from Latin America, new industrial policies are more outwardoriented and focused on integrating into Global Value Chains (GVCs), and less likely to be motivated by import substitution and industrialization than they were in the 1970s to1990s(Juhász,Lane,andRodrik2024).
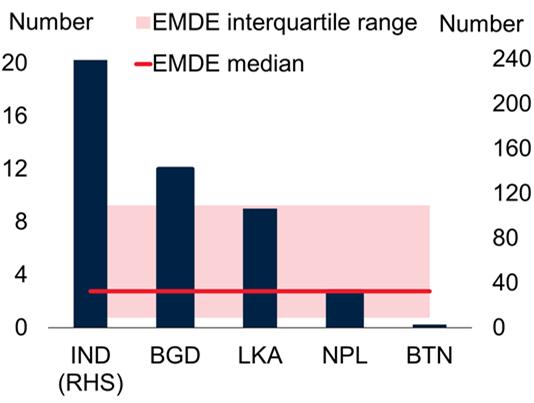
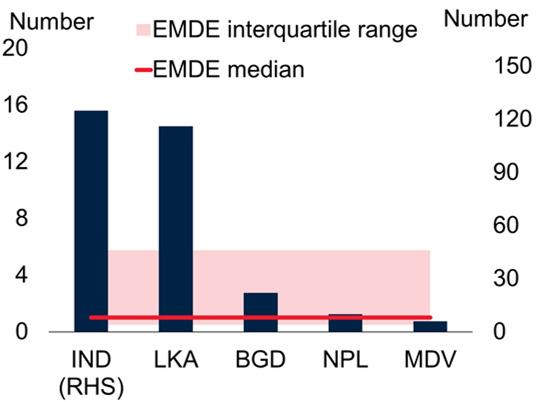
Sources: GTA (database); World Bank.
A. Lines show new industrial policies implemented over time, either the total number of policies (liberalizing as well as protective measures) or only protective policies, which are those that discriminate against foreign businesses and protect domestic businesses, as classified in the GTA.
B. Bars show the annual average number of new industrial policies implemented in each country group. Blue bars show the number of protective measures, and the red bars show the number of liberalizing measures, in negative.
C. Bars show the annual and country average number of new industrial policies implemented in South Asia and other EMDEs. Blue bars show the number of protective measures, and red bars show the number of liberalizing measures, shown as negative values.
D. Bars show the annual average of new protective industrial policies implemented in each of the top 10 countries by policy numbers during 2022–25. Markers show the annual average new protective industrial policies implemented during 2016–19.
E.F. Bars show the annual average number of new protective industrial policies implemented in each South Asian country during 2022–25 (E) and 2016–19 (F). Shaded regions and horizontal lines show the interquartile range and median for EMDEs.
South Asian countries—Bangladesh, Bhutan, India, Maldives, Nepal, Sri Lanka—also make proactive use of industrial policies to achieve development goals. Indian authorities, for example, envision using industrial policies to boost competitiveness, exports, and strategic resilience, particularly in high-technology manufacturing (Government of India 2026). In Bhutan, Maldives, and Sri Lanka, the most recent national development plans emphasize the services sector—specifically the tourism sector (figure 2.2). At the same time, jobs at South Asian firms,especiallythose thatsupply to GVCs, are at risk of displacement by artificial intelligence (AI), while shifts in trade policies can lead to short-term disruptions in labormarkets(boxes1.1and2.1;WorldBank 2025a). Industrial policies can be used to support at-risk workers through programs designed to develop their abilities to adapt to changingskillsdemand.
Questions. is chapter examines the followingquestions:
• What are the features of South Asia’s industrialpolicies?
• What has been the effect of industrial policiesontrade?
• How can South Asia maximize gains from industrialpolicies?
Main findings ischapterreportsthefollowingfindings.
Allocation of industrial policies. On average during 2022–25, South Asian countries implemented more than twice the number of industrial policies as the average EMDE. About half of South Asia’s new industrial policy measures implemented since 2022 have been aimed at manufacturing, even though the sector only accounts for 14 percent of South Asia’s employment. e industrial policy measures aimed at manufacturing have been mainly trade-related. In India, traderelated measures have accounted for almost half the new measures in manufacturing. Among measures aimed at manufacturing, Sri Lanka’s focused on high-employment activities, Bangladesh’s on high-employment firms, and India’s on high-wage activities and high-employment and highly productive firms. Activities with the most industrial policy measures have been the largest source of manufacturing employment growth. However, they have not been the main source of non-agricultural employment growth—the main source has been theservice sector, which hasrarelybeenthetargetofindustrialpolicies.
E ectiveness of new industrial policies. Compared with other EMDEs, South Asia used fewer domestic subsidies, and more procurement-related measures (India) and trade-related measures (rest of South Asia). e latter had asymmetric impacts. A local projection estimation suggests that South Asia’s import-restricting industrial policy measures were associated with significant declines in imports, but export-promoting policies were not associated with significant increasesinexports.
Candidate for industrial policy: Adjustment to AI. In South Asia, AI adoption has proceeded rapidly since the release of ChatGPT in November 2022, particularly among affiliates of multinational companies (box 2.1). At the same time, higher AI
In their most recent national development plans, Bhutan, Maldives, and Sri Lanka targeted an above-average share of industries, while Bangladesh targeted manufacturing.
Sources: Fernandes and Reed (2026); World Bank.
Note: Bars show the share of unique industries mentioned in a national development plan that are manufacturing (A) or services (B). Industries are defined at either the two-digit HS (1992) code level for agriculture, mining, and manufacturing, or service categories in the services trade data from the Harvard Growth Lab's Atlas of Economic Complexity. Data are assembled by Fernandes and Reed (2026). National development plan of 2017 for Sri Lanka, 2018 for India, 2020 for Bangladesh, and 2024 for Bhutan, Maldives, and Nepal. Horizontal lines show the median of other EMDEs, which include 140 non-South Asia countries. Shaded regions show the inter-quartile range of other EMDEs.
exposure has been associated with slower hiring. An interquartile-range increase in AI exposure has been associated with a 1.5 percent decline in job postings on average and by about twice as much for multinational affiliates. Some of these declines appear to have been related to spillovers from AI adoption by foreign firms: hiring slowed more in South Asian firms supplying goods and services to more AIexposed foreign firms. Value chain upgrading, underpinned by faster AI adoption and skills development that can be supported by industrial policies, will be critical if firms are to remain competitive in theageofAI.
Candidate for industrialpolicy:Subnational labor market di erentials. South Asia has some of the largest and some of the smallest within-country wage differentials by the standards of EMDEs (box 2.2). In South Asia’s larger countries, worker characteristics
account for about one-fifth of these subnational wage differentials. South Asia’s remaining wage premiums, after controlling for worker characteristics, are higher in regions with better transport connectivity, more skilled workforces, larger firms, and more services sector activity. Wage premiums appear to be persistent and self-reinforcing. While such regional wage persistence may warrant place-based or industrial policies, South Asia’s experience with such policies has beenmixed.
Policy implications. South Asia’s experience with industrial policies has been mixed, as a result of limited fiscal space and government capacity, poor implementation, and infrastructure gaps. e success cases—such as the electronics sector supported by India’s production incentives—hinge on wellcoordinated policies supporting integration into GVCs. Because of these constraints on industrial policies, those that address market failuresheadon(so-calledfirst-choicepolicies) —such as industrial parks, skills development, market access assistance, and quality infrastructure improvement—can maximize the chance of success.2 ese are likely to be most effective if accompanied by broad-based policies to improve physical and digital infrastructure, business environments, and enablinginstitutions.
Contribution is chapter makes several contributions to theliterature.
First, it documents the features of industrial policies in South Asia and compares South Asia with other EMDEs. Past evidence on industrial policies has focused primarily on
advanced economies and large EMDEs. is chapter deepens the analysis of World Bank (2024b),whichonlysketchedoutan overview of the use of industrial policies in South Asia. e patterns documented here provide new evidence on how developing economies, especially lower- and middle-income countries,haveusedindustrialpolicies.
Second, this chapter evaluates the impact of trade-related industrial policy on the exports and imports that were targeted by these policies, using sector-level data. Machado Parenteetal.(2025)documentedinfirm-level data that export incentives have been associated with short-term declines and limited medium-term gains in firms’ value added and productivity. In contrast to this earlier study, this chapter examines sectorlevel data to allow for reallocations across firms. A similar exercise as the one in this chapter was conducted by Rotunno and Ruta (2024), but it examined the impact of subsidies on exports only and only for the world’slargestemergingmarkets.
ird, the chapter evaluates South Asia’s use of industrial policy tools in the framework set out by Fernandes and Reed (2026). Case studies illustrate why policies that may be feasible in principle have tended not to succeed in South Asia because of the characteristicsofagivencountry.
Data and methodology
2 Following Fernandes and Reed (2026), “first-choice” policies are those that address market failures head-on by subsidizing activities that are underprovided.
Data. e analysis draws on multiple datasets at individual, firm, and sector levels. Counts of industrial policy measures are derived from the Global Trade Alert (GTA) database. e database includes detailed information on trade-related industrial policies implemented in186countries,including149EMDEs,with information on the timing, targeted sectors, policy instruments, and the scope (for
example,whetherfirm-orlocation-specific)of each policy, but not the policy’s size or monetary value. Policies are classified into those that discriminate against foreign businesses and protect domestic business (“protective policies”) and those that liberalize trade or improve policy transparency (“liberalizing policies”). For most analyses, only protective policies are used—because these are the majority of the policy measures, and many liberalizing policies appear to reverseorrelaxpreviousprotectivepolicies.
All analyses use the flow of policies, that is, the count of newly implemented policies, instead of the stock of active policies, to capture how economic outcomes respond to policy shocks. To capture changes in the choice of industrial policies, policies newly implemented during the more recent period of 2022–25 are compared with those implemented during 2016–19, where possible. is time window skips the pandemicyears(2020–21).
Sector-level tariff data are drawn from the World Trade Organization’s (WTO) Analytical Database,which includestariffrates as recent as 2025. Data on subsidies to businesses are sourced from the International Monetary Fund (IMF)’s Government Financial Statistics (GFS) and the World Bank’s BOOST Open Budget dataset. Tax revenue foregone comes from the Global Tax Expenditures Database (GTED). A database of industries targeted in national development plans in more than 180 countries, assembled by Fernandes and Reed (2026), is used to illustrate countries’ priority sectors for development.
Economy-wide employment data drawn from the World Bank’s Global Labor Database (GLD) are used for three South Asian
countries and five other EMDEs for the period 2022–25. Firm-level data drawn from the World Bank’s Enterprise Survey for the period 2022–25 are used and include about 70 countries. Export and import data are sourced from the Base pour l’Analyse du Commerce International (BACI) database of the Centre d'Études Prospectives et d'Informations Internationales (CEPII) at detailed sector levels for 229 countries (154 EMDEs)upto2023.
Methodology. In addition to descriptive statistics, a series of linear regressions at country and sector levels and with year fixed effects is used to estimate the correlation between the number of industrial policies in a sector and the sector’s employment, wages, firm size, firm productivity, exports, and imports. A dynamic difference-in-differences model is estimated at the country, detailed sector, and year level to analyze the impact of industrial policy on sector exports and imports. Annex 2.1 provides more details on thedataandmethodology.
Limitations. e data and methodology have several limitations. First, the industrial policy data are at the policy-country-sector level, but it is unknown which firms received or were affected by the policy measure. Second, only direct exposures to industrial policies are considered, while indirect exposures through input-output linkages or policies on the same sector by trading partners or competitors are not taken into account (refer to Lane 2025 andMachadoParenteetal.2025forexamples where both input-output linkages and other countries’ policies are considered). ird, the GTA dataset provides the count of industrial policies but not the size or monetary value of individual policies; for this reason, tariff data and subsidies data are used to supplement the GTAdataset.
Artificial intelligence (AI) is already reshaping firms and jobs in South Asia. AI adoption has proceeded rapidly since the release of ChatGPT in November 2022, particularly among affiliates of multinational companies. At the same time, higher AI exposure has been associated with slower hiring: an interquartile-range increase in AI exposure has been associated with a 1.5 percent decline in job postings on average, and with declines of about twice that size for multinational affiliates. Some of these declines appear to be related to spillovers from AI adoption by foreign firms: South Asian firms supplying goods and services to more AI-exposed foreign firms have experienced slower hiring. Value chain upgrading, underpinned by faster AI adoption and skills development, will be critical for firms to remain competitive in the age of AI.
Introduction
EmergingeffectsofAIinSouthAsia. The latest wave of AI technologies—Generative AI (GenAI), which can interpret human prompts and produce content across multiple formats— has the potential to raise productivity considerably by augmenting human labor in higher-value tasks while automating more routine, lower-value tasks.a Its effects are already visible in South Asia, particularly in the business process outsourcing (BPO) and information and communications technology (ICT) sectors, whichconstituteanabove-averageshareofSouth Asia’s exports (figure B2.1.1; Liu 2024). Early evidence suggests that firms in these sectors are experiencing productivity gains along with greater AI. Exports continue to grow steadily even as hiring has slowed following the introduction of GenAI. In parallel, the demand for AI-related competencies in South Asian firms has increased, with positions requiring these skills commanding a wage premium of nearly 30 percent(WorldBank2025a).
Note: This box was prepared by Jonah M. Rexer and Siddharth Sharma.
a Prominent examples of GenAI include OpenAI’s ChatGPT, Anthropic’s Claude, X’s Grok, Google’s Gemini, Microsoft’s Copilot, and DeepSeek. Highly AI-exposed occupations with low complementarity—comprising routine jobs such as call center agents, secretaries, and digital application programmers—tend to have lower complementarity. High-complementarity, high-exposure jobs instead often involve interpersonal interaction, responsibility, and expert judgment—such as managers, business consultants, and other professional service providers, doctors, teachers, and lawyers (World Bank 2025a).
ReshoringofAI-exposedactivities. GlobalValue Chains (GVCs) may amplify the effect of AI on South Asian firms in export-oriented sectors. AI adoption rates, investment levels, and new company formation are substantially higher in the primary GVC export destinations of South Asia than in South Asia itself (figure B2.1.2). South Asian exporters in sectors in which AI can readily substitute for labor face demand erosion if their foreign buyers deploy AI to reshore business functions that were previously sourced through imports. For example, firms in the BPO sector mightexperience falling demand for lower -value tasks that are automatable, such as software development, customer support, accounting, web development, and payroll processing (Webb 2020). Such reshoring of activities (although not necessarily jobs) from emerging markets and developing economies (EMDEs) back to advanced economies occurred during the last major automation wave. This wave was driven by the adoption of industrial robots in advanced economies (Faber 2020; Kugler et al. 2020; Krenz, Prettner, and Strulik 2021). However, this time the effect might be different because GenAI is relevant to a wider range of tasks—including high-skilled cognitive work—than are industrial robots, which primarily automate physical and routine manual tasks(Webb2020).
Positive GVC spillovers from foreign AI adoption. At the same time, South Asian firms
South Asia has above-average export dependence on information and communications technology (ICT) and business process outsourcing (BPO) services. In India, the sector has experienced strong export performance following the introduction of GenAI, even as hiring and wages have fallen.
A. ICT and BPO service exports as percent of total exports
B. India’s BPO sector exports over time
Index (2022Q3 = 100)
C. Impact of ChatGPT on BPO jobs and wages
Sources: Felten, Raj, and Seamans (2023); Lightcast (database); Pizzinelli et al. (2023); Reserve Bank of India; WDI (database); World Bank.
Note: BPO = business process outsourcing; ICT = information and communications technology.
A. Bars show the ICT sector exports relative to total exports. Pink areas indicate the interquartile range for other EMDEs, weighted by population.
B. Lines show indexed values of technology services exports and total exports (2022Q3 = 100) in India from 2020Q2 to 2025Q3, with 2022Q3 marking the quarter before the release of ChatGPT.
C. Bars show coefficients from occupation-month regressions of the log of job postings and the log of wages on the interaction between post-ChatGPT and a business services occupation indicator, conditional on occupation and month fixed effects. Gold whiskers represent 95 percent confidence intervals, with standard errors clustered at the occupation level. Estimates are from World Bank (2025a).
stand to benefit if AI-driven productivity gains among foreign GVC buyers increase their demand for high-value goods and services that cannot be easily automated by AI. For example, stronger productivity and investment due to AI adoption in major economies could support global demand for high-quality professional services exports from South Asia. Evidence suggests that, in an earlier wave of automation, robot adoption in advanced economies increased total imports into those economies—even though it also resulted in some job reshoring (Artuc, Bastos, and Rijkers 2023; Cilekoglu, Moreno,andRamos2024).HighAIpenetration in foreign GVC partners may also generate positive knowledge spillovers for South Asian firms, given past evidence that exporting promotes technological upgrading in EMDE firms(Verhoogen2023;WorldBank2020).
Questions. is box examines the following questions:
• Are the effects of GenAI on hiring in South Asian firms more pronounced among GVCintegratedfirms?
• Are GVC-integrated firms in South Asia experiencing spillovers from foreign AI adoption?
Contribution to the literature. is box contributes to the literature on the effects of automation in advanced economies on firms and jobs in EMDEs. It is one of the first studies to examine cross-border spillovers that involve GenAI-led automation. With the exception of Betai and Chen (2025), who examine the effects of AI-led automation on online job platforms, earlier studies have focused on industrial robots
South Asia’s major global value chain (GVC) export destinations, particularly for professional services, are rapidly investing in AI development and adopting AI technology at an above-average rate.
A. Average AI use for South Asia’s top GVC export destinations by sector
C. AI adoption and GVC buyer share for South Asia’s GVC export destinations in professional services
Sources: Anthropic Economic Index database (2025–26), Anthropic; FactSet database (2003–25); Maslej et al. (2025); World Bank.
Note: AI = artificial intelligence; avg = average; BPO = business process outsourcing; GVC = global value chain; Mfg = manufacturing; Prof. srv. = professional services.
A. Bars show country-level average usage of Anthropic’s Claude AI models per 100,000 people. Each bar restricts the sample to the top 10 GVC trading partners in professional services, manufacturing, or other sectors. All averages are weighted by working-age population (aged 16 to 64). The top trading partners are shown in annex tables B2.1.2–3.
B. Each bar restricts the sample to the top 10 GVC trading partners in professional services, manufacturing, or other sectors. All averages are weighted by the workingage population.
C. The vertical axis represents the foreign country’s share in the total number of GVC buyers of South Asian professional services firms, in logs. The horizontal axis represents the (log) Anthropic adoption rate per 100,000 working-age people in that country. The sample comprises all trading partners, such that each point represents a country, with GVC connections to South Asian firms. The country-level scatterplot is binned at 20 quantiles of the distribution of the independent variable. Linear fit is estimated on the underlying data.
and the reshoring of manufacturing activities. eir relevance to the current wave of AI-led automation is limited because, unlike robots, AI technologies have mainly affected service sector jobs in advanced economies (Bonfiglioli et al. 2025). efindingsinthisboxalsocontributeto research on the effects of AI in EMDEs, extending the work presented in a World Bank report (2025a) by examining firm-level hiring responses and trade-related effects of AI (GoldfarbandTrefler2018).
Main Findings. Several findings emerge from thisstudy.
net employment effect depends on the balance betweentheseopposingforces.
First, historical experience with industrial robots suggests that advanced-economy automation can displace EMDE jobs through reshoring of automatable tasks. However, productivity gains in adopting firms can partly offset these job losses by raising overall demand for inputs. e
Second, the introduction of GenAI has increased AI adoption and slowed hiring among South Asian firms, especially among multinational affiliates. An interquartile-range increase (from the 25th to the 75th percentile)in AI exposure is associated with a 1.5 percent decline in job postings among South Asian firms on average, with the impact being about twice as much among multinational affiliates. e larger effects among multinational affiliates may reflect both higher exposure to reshoring and higher returns fromAIadoption.
ird, South Asian firms are upskilling in responseto GenAI—thatis,theyare postingjobs that, on average, are less exposed and more complementarytoAI.
Jobs posted by multinational affiliates operating in South Asia tend to be more exposed to AI and less complementary with it. As a result, multinational affiliates are adopting AI more rapidly than local firms following the introduction of GenAI.
A. AI exposure and complementarity before ChatGPT by firm type
B. Demand for AI skills by firm type over time
C. Impact of GenAI on demand for AI skills
Sources: FactSet database (2003–25); Felten, Raj, and Seamans (2023); Lightcast database (2020–25); Pizzinelli et al. (2023); World Bank.
Note: MNC = multinational company; MNC affiliates are defined as multinational firms headquartered outside of South Asia but operating foreign affiliates within South Asia. Local firms are those headquartered in South Asia without any foreign buyers, while GVC suppliers are firms with international buyers before the release of ChatGPT. AI adoption is measured as the share of job postings requiring AI skills.
A. Chart shows average AI exposure and complementarity of job postings by firm type. Exposure metrics are calculated for all vacancies posted prior to the release of ChatGPT from November 2020 to November 2022.
B. Chart shows the share of total job postings that require AI skills by firm type. Vertical line indicates the release of ChatGPT in November 2022.
C. Chart shows the coefficients from a firm-level regression of the share of job postings requiring AI skills on the average AI exposure of pre-ChatGPT job postings, interacted with a post-ChatGPT indicator, controlling for firm and month fixed effects (annex table B2.1.6). Yellow whiskers show a 95 percent confidence intervals.
Fourth, South Asian GVC suppliers whose foreign buyers had higher AI exposure prior to the introduction of ChatGPT have experienced significantly slower hiring after the introduction ofChatGPT.
Fifth, policies could help South Asian firms adapt by investing in foundational infrastructure—internet connectivity, reliable electricity, and expanded access to technical education—so that firms and workers are equipped to adopt AI. It may also involve supporting AI-exposed sectors through “firstchoice” industrial policy tools that provide public inputs that can be underprovided by markets, such as skills development programs andmarketaccessassistanceschemes.
Data and methodology. is box combines occupational, firm-level, and international data to examine how exposure to AI shapes labor demand and firms’ behavior in South Asia, both
directly and through GVCs. Occupational AI exposure is measured using task-based indices from Felten, Raj, and Seamans (2021; 2023), complemented by human-AI complementarity measures from Pizzinelli et al. (2023). Firm-level labor demand is captured through roughly 25 million online job postings from Lightcast, covering 437,300 unique firms in South Asia between 2020 and 2025. ese postings are merged at the firm level with GVC data from FactSet, which identify buyer, supplier, and partnership relationships between South Asian and foreign firms, using a fuzzy name-matching algorithm. e resulting monthly panel links firms’ hiring activity in South Asia to their participation in GVCs and the AI exposure of their foreign partners.b e empirical analysis
b The analysis distinguishes between affiliates of multinationals, GVC suppliers, and purely local firms. Multinational affiliation is determined on the basis of ownership, while GVC status is based on contractual relations.
estimates, in a difference-in-differences approach, how firms’ pre-existing exposure to AI shapes labor demand, skill composition, and participation in GVCs using the monthly firmlevel job postings data. To identify the effect of GenAI, all regressions relate changes in firm outcomes after the introduction of ChatGPT, the first major GenAI product, to measures of pre-ChatGPT AI exposure and include firm and month fixed effects (details in annexes B2.1.2 andB2.1.3).c
Impact of automation: Historical experience
labor markets. ese studies generally find that robot adoption in advanced economies caused joblossesin EMDElocationswith highexposure toautomation.Forinstance,U.S.robotadoption during 2011–16 is estimated to have caused 63,000 to 100,000 cumulative job losses in Colombia (Kugler et al. 2020). It also had similarly negative effects on employment and exports in exposed Mexican and Brazilian locations (Artuc, Christiaensen, and Winkler 2019; Faber 2020; Stemmler 2023). ese findings are consistent with automation-driven reshoringofautomatabletasks.
Although “this time may be different,” the closest historical precedent of AI adoption to automate service activities is the adoption of industrial robots to automate goods production. Historical experience with industrial robots suggests that advanced-economy automation can displace EMDE jobs by reshoring automatable tasks. However, productivity gains in adopting firms can counteract these losses by boosting overall demand for imported inputs—with the net effect depending on the balance between theseopposingforces.
E ects of advanced-economy automation on EMDE labor markets. e introduction of industrial robots sparkedresearch into the effects of the automation of production in advanced economies on EMDEs (annex B2.1.1). One branch of the literature estimates the effect of robot adoption in advanced economies on EMDE employment using shift-share instrumental variables approaches, ese approaches exploit pre-existing differences in exposure to robotization across EMDE local
c The launch of ChatGPT in November 2022 is widely used as the “exogenous” cutoff date in event studies of the impact of GenAI This timing reflects that it was the first major demonstration of a GenAI model and was followed by a rapid acceleration in its adoption.
Evidence of reshoring in advanced-economy industriesandlabormarkets. A related literature explores reshoring from the perspective of advanced-economy firms and labor markets. Bonfiglioli et al. (2022) find that robot automation reduces offshoring of business functions from the United States, while Krenz, Prettner, and Strulik (2021) estimate that an increase of one robot per 1,000 workers is associated with a 2.5 percent rise in reshoring activity within the manufacturing sector. In contrast, Artuc, Bastos, and Rijkers (2023) find thatgreaterrobotintensityin advanced-economy industries increases both imports from and exports to EMDEs, and Cilekoglu, Moreno, and Ramos (2024) report that robots raised intermediate input purchases from foreign suppliers among Spanish firms. ese contrasting findings may be reconciled by distinguishing substitution effects—which reduce demand for labor-intensive, routine inputs that can be automated—from scale effects, whereby automation-driven productivity gains raise overall input demand (Artuc, Bastos, and Rijkers 2023;StapletonandWebb2020).
Productivitye ectsofautomationonadvancedeconomy rms. e hypothesized scale effects depend on robots increasing productivity and
(continued) outputinadoptingfirmsinadvancedeconomies.
been offshoring to their South Asian affiliates or GVC partners were particularly AI-exposed (figure B2.1.3).Multinationalaffiliateshave been leading AI adoption—as measured by the share of job postings requiring AI skills—with the gap relative to local firms rising over time. is may reflect the gap in AI penetration between advanced economies and EMDEs. Higher AI exposure before the release ofChatGPThas been associated with a significantly higher increase in AI adoption post-release, with the strongest increaseamongmultinationalaffiliates.
Several studies confirm sizable positive effects, using exogenous variation in robot adoption costs as instruments to address reverse causation (for example, Bonfiglioli et al. 2024; DeStefano and Timmis 2024; Graetz and Michaels 2018). Robot adoption by Spanish firms is estimated to have raised total factor productivity, expanding output by 20–25 percent (Koch, Manuylov, and Smolka 2021). Across 17 countries, robot usage contributed about 0.36 percentage points to annual labor productivity growth (Graetz and Michaels 2018). Robots have also increased product quality and GVC participation in both advanced economies and EMDEs (DeStefano and Timmis 2024; Fontagné et al. 2024; Xie, Guo, and Chen 2025; Zhang, Chen, and Wei 2025).Overall,the evidence on productivityand output impacts is consistent with robots generating positive scale effects on import demandinadoptingfirms.
South Asian firms with greater pre-ChatGPT AI exposure have adopted AI faster, while reducing overall hiring. ese effects are largest among multinational affiliates. ey have also shifted hiring toward fewer AI-exposed and more AIcomplementary roles. South Asian GVC suppliers whose foreign buyers had higher preChatGPT AI exposure have experienced a greater reduction in hiring, indicating a decline in foreign demand for automatable business functions.
Hiring slowdown. Higher ChatGPT AI exposure has been associated with greater reductions in overall hiring post-ChatGPT (figure B2.1.4). is effect has been more pronounced among more internationally connected firms: job postings have declined by about 3.2 percent for multinational affiliates, 1.5 percent for GVC suppliers, and 1.1 percent for purely local firms. ese differences are consistent with two mechanisms. First, they may reflect in-house labor substitution due to more intensive adoption of AI among internationally connected firms.d Second, they may reflect demand displacement operating more strongly for firms with greater flexibility to relocate productionacrossborders.
AI adoption. Multinational affiliates and GVC supplier firms account for nearly 8 percent of all jobs posted by South Asian firms during the study period. Prior to the introduction of ChatGPT, jobs posted by multinational affiliates and GVC suppliers were more exposed to AI than jobs posted by purely local firms. is suggests that the tasks that foreign firms have
Skill upgrading. Following the introduction of ChatGPT, firms with higher pre-existing AI exposurehaveshiftedhiringtowardjobfunctions that are less exposed to AI substitution and offer more complementary roles (figure B2.1.4). ese adjustmentsare observedacrossallfirmtypesbut are substantially larger for GVC suppliers and local firms than for multinational affiliates. is
d The estimated average impact of Gen AI on hiring (minus 1.5 percent) translates into a loss of 200,000 job openings between November 2022 (the introduction of GenAI) and March 2025 (the last month in the dataset). This projection is based on the fact that there were 13 million job openings observed during this period, and assumes that GenAI only affected firms in the top quartile of AI exposure (which account for about 11 percent of job openings in SAR).
Greater AI exposure leads firms to reduce hiring and change their skill composition toward less-exposed and morecomplementary roles. Job losses have been most pronounced for multinational affiliates, while changes in skill composition has been the main response among local firms.
Sources: FactSet (database); Felten, Raj, and Seamans (2023); Lightcast (database); Pizzinelli et al. (2023); World Bank.
Note: Panels show coefficients and 95 percent confidence intervals, shown as yellow whiskers, from a firm-level regression of the outcome on the average AI exposure of pre-ChatGPT job postings, interacted with a post-ChatGPT indicator, controlling for firm and month fixed effects (annex table B2.1.6). Multinational (MNC) affiliates are defined as multinational firms headquartered outside of South Asia but operating foreign affiliates within South Asia. Local firms are those headquartered in South Asia without any foreign buyers, while GVC suppliers are firms with international buyers before the release of ChatGPT. Jobs (A) is defined as the log of total job postings. Outcome variables in (B) and (C) are defined as the average AI exposure and complementarity of posted jobs. Sample includes 196,202 firms with preChatGPT hiring data, split by firm type. Standard errors are clustered at the firm level. Coefficients are scaled to correspond to a change in the interquartile range of AI exposure.
pattern is consistent with firms upgrading skill demand as AI adoption progresses, with complementary skills becoming more valuable and exposed tasks increasingly substitutable. e more muted skill upgrading observed among multinationalaffiliatesmayreflecttheirabilityto reshore higher skill, complementary functions to headquarters or other locations outside South Asia.
increase in buyers’ AI exposure has reduced hiringby10percent(figureB2.1.5).
Cross-border spillovers from AI exposure abroad. To capture how foreign AI adoption affectsSouth Asian firms, the analysisfocusedon GVC suppliersandmeasuredtheirbuyer-side AI exposure—the average pre-ChatGPT AI exposure of their foreign buyers—where higher exposure implies stronger partner incentives to adopt AI and, consequently, greater negative demand spillovers. ere is a clear negative employment spillover associated with foreign buyers’ exposure to AI: an interquartile range
Cross-border spillover, combined with own AI exposure. is spillover has been larger for suppliers whose own AI complementarity is lower: an interquartile range increase in buyers’ AI exposure has reduced hiring by 12 percent among low-complementarity suppliers, but has not had a statistically significant effect among high-complementarity ones. Moreover, the negative spillover from buyer exposure is concentrated entirely among GVC suppliers in highly exposed product categories (figure B2.1.5). ese patterns are consistent with an automation-driven reduction in foreign demand for low-complementarity services such as basic ICT support, customer services, or other routine business functions. Notably, there has been no corresponding increase in AI adoption by GVC suppliers connected to highly exposed buyers,
Hiring growth has been slowest in South Asian GVC suppliers whose workforce was itself more susceptible to substitution by AI and who had more highly exposed foreign buyers.
A. Hiring effects in GVC suppliers by AI complementarity
B. Buyer exposure and job growth in GVC suppliers with
C. Buyer exposure and job growth in GVC suppliers with above-median AIexposure
Percentchange in jobs
Buyer exposure
Sources: FactSet (database); Felten, Raj, and Seamans (2023); Lightcast (database); Pizzinelli et al. (2023); Speedtest Global Index; WDI (database); World Bank. Note: GVC suppliers are firms with international buyers before the release of ChatGPT.
A. Bars show coefficients and 95 percent confidence intervals, shown as yellow whiskers, from a firm-level regression of log job postings on the average AI exposure of firms’ international buyers before the introduction of ChatGPT, interacted with a post-ChatGPT indicator, controlling for firm and month fixed effects. Regression also controls for firms’ own pre-ChatGPT AI exposure interacted with a post-GPT indicator. Standard errors are clustered at the firm level. Sample is 1,824 GVC suppliers with international buyers before ChatGPT, split into those above and below the median of pre-ChatGPT firm-level complementarity (annex tables B2.1.7–8). Coefficients are scaled to correspond to a change in the interquartile range of AI exposure.
B.C. Outcome variable is the log difference in the total number of jobs posted by a firm before and after the introduction of ChatGPT in November 2022. Buyer exposure measures the average AI exposure of a firm’s international buyers before ChatGPT. Panels show binned scatterplot at 20 quantiles of the distribution of buyer exposure, with a linear fit estimated on the underlying data. Sample is 1824 GVC suppliers with international buyers before ChatGPT, split into those below (B) and above (C) the median pre-ChatGPT firm-level AI exposure. Regression results are in annex table B2.1.9.
suggesting that the observed employment effects are unlikely to reflect AI technology transfer from buyers to suppliers (figure B2.1.5; annex table B2.1.7). Finally, the negative effect of buyer exposure on hiring does not differ significantly across GVC suppliers in the services and manufacturing sectors, suggesting that negative demand spillovers are not specific to servicesexports(annextableB2.1.10).
Conclusion
GVCupgrading. RapidAIadoptioninadvanced economies is disrupting GVCs in which South Asian firms participate, as foreign buyers automate tasks previously outsourced to the region. However, this disruption also creates opportunities for South Asian firms to upgrade into higher-value GVC activities that
complement rather than compete with AI. Global demand for such activities may itself expand as AI-driven productivity gains fuel investment and growth in advanced economies. Upgrading hinges on two factors: South Asian firms themselves adopting AI, and workers acquiring the skills needed to perform more sophisticated tasks. By raising productivity and enabling more sophisticated outputs, AI adoption can help firms move up the value chain and remain competitive as lower-skill tasks are automated—but only if workers are equipped to take on higher-value roles. For example, South Asian BPO firms facing automation of routine services such as payroll processing can transition into Knowledge Process Outsourcing (KPO), delivering higher-quality analytical and advisory services such as legal research or engineering design. AI is complementary to such

sophisticated knowledge processing activities, making both its adoption and workforce upskilling essential for firms seeking to compete in the KPO sector. Experience from past automation waves suggests that such product upgrading can allow GVC suppliers to thrive amidtechnologicaldisruption.

Policies to support GVC upgrading in the age of AI. South Asian governments can facilitate adaptation to AI through policies that ensure access to fast and reliable internet and electricity, and strengthen science, technology, engineering, and mathematics (STEM) skills (World Bank 2025a). ese broad-based policies will help firms adopt AI and equip workers for highervalue,AI-complementaryroles.Governments
could also consider targeted support to the most AI-exposed, export-oriented sectors, focusing on two types of public inputs tailored to these sectors and at risk of being underprovided by markets: skills development programs and market access assistance schemes. For example, they could explore comprehensive sectoral retraining schemes, learning from programs with strong community and private sector links, which have shown promise in advanced economies (Katz et al. 2022). Successful implementation of these industrial policy tools hinges on government bandwidth—or capacity to interact with many businesses and industries to ensure that the public input being provided is market-relevant(FernandesandReed2026).

Compared with other EMDEs, countries in South Asia are more likely to use procurement measures (India) and trade instruments (elsewhere in the region), and less likely to use subsidies as industrial policy measures. Half of South Asia’s policies are aimed at manufacturing, 15 percent (twice the share of other EMDEs) at utilities and construction, and a growing share at services. Across nonagricultural sectors, those least protected by industrial policy measures (mostly service sectors) havebeenthesourceofSouthAsia’sjobcreation, while within manufacturing, sectors more targeted by industrial policies have contributed moretoemploymentgrowth.
Numberofpolicies:Gatheringpace. Between 2016–19and2022–25,South Asian countries on average doubled the number of new industrial policies (figure 2.1). e number of
new protective industrial policies implemented each year by South Asian countries was more than twice the number of the average EMDE and was the secondhighest across EMDE regions. India drove most of the increase, with the average number of new protective measures implemented each year increasing from 125 to 240, placing it among the world’s top 10 countries by policy counts and third among EMDEs (after China and Brazil). Among other South Asian countries, Nepal doubled and Bangladesh quadrupled their new protective policy measures, while Sri Lanka reduced new policy measuresinthelaterperiod.
Policy instruments: Public procurement growing, especially in India. Between 2016–19 and 2022–25, the average South Asian country increased the share of public procurement policies (figure 2.3). Public procurement policies, including procurement preferencemargins(thedifferencebetweenthe cost of producing an item and its sales price)
and procurement localization, have been found to lead to long-term improvement in business performance in other countries (Ferraz, Finan, and Szerman 2015; Mensah, Wankuru, and Kirui 2026). Procurement policies accounted for 20 percent of South Asia’s industrial policies implemented during 2022–25, compared with less than 2 percent among other EMDEs and a substantial increase from 4 percent in the region during 2016–19. Many of these policies were concentratedintheutilities,construction,and services sectors, with some applied in the manufacturing sectors. India drove the increase: public procurement policies accounted for one-quarter of the country’s industrial policies implemented during 2022–25, and government spending on procurement represented 20 percent of GDP in 2022—more than twice the median of EMDEs. India’s latest Economic Survey, for example, highlighted the use of public procurement policies to boost domestic innovation and to shape incentives (GovernmentofIndia2026).
Policy instruments: Subsidies below EMDE average with large within-region variations. Subsidies on production or innovation can support firms in nascent and high-potential industries, but can be fiscally costly. A growing share of South Asian industrial policies took the form of subsidies and state aid—such as financial grants, loan guarantees, production subsidies, and interest payment subsidies (figure 2.3). Even so, South Asian countries still rely less on subsidies than the average of other EMDEs. Subsidies accounted for about one-quarter of South Asia’s protective industrial policies implemented during 2022–25, compared with more than half among other EMDEs. On the value of subsidies—in the form of both direct funding to businesses and foregone tax revenues— South Asia is also below the EMDE average.
Compared with other EMDEs, South Asian countries use more procurement measures—especially in construction, utilities, and services sectors—and fewer domestic subsidies and, except for India, more import restrictions.
New protective industrial policy measures by instrument
New protective industrial policy measures by instrument, 2022–25
Government procurement spending, latest
New protective industrial policy measures by instrument: agriculture and manufacturing, 2022–25
New protective industrial policy measures by instrument: utilities, construction, and services, 2022–25
Sources: Fernandes and Reed (2026); GTA (database); GTED (database); GPPD (database); IMF GFS (database); World Bank BOOST (dataset); World Bank.
Note: Sample is restricted to protective measures only.
A.B. Bars show the number of new industrial policies by instrument type, as a share of total new industrial policies implemented during 2022–25 or 2016–19 by the country group or by South Asian country. Sample includes all protective industrial policies. “Other EMDEs” include 115 economies for policies implemented during 2016–19 and 108 countries for policies implemented during 2022–25. Grouping of instrument types is based on the more detailed classification of the Global Trade Alerts, and details are in annex 2.1. “Other” comprises capital controls and exchange rate policy, foreign investment policy, labor force migration policy, localization, and trade defense instruments.
C. Bars show government procurement expenditure as a percentage of GDP. “Other EMDEs” include 70 non-South Asia EMDEs. Latest data are between 2018 and 2022—including 2018 for Bangladesh and Sri Lanka and 2022 for India and Nepal. Horizontal line shows the median among other EMDEs, and the shaded region shows the interquartile range of this sample.
D. Direct funding refers to direct transfers to businesses, such as cash grants, which come from GFS, supplemented by BOOST. Data are for 2022 for all countries except 2019 for Sri Lanka. Tax revenue foregone is from 2023—except for BGD and BTN, which are from 2022. No data are available for Nepal for either direct funding or tax revenue foregone. For both variables, the number for EMDE refers to the median level of the sample, and includes 101 economies for subsidies and 47 economies for tax revenue foregone.
E.F. Bars show the number of new industrial policies by instrument type, as a share of total new industrial policies implemented during 2022–25 by the country group in each of the four broad economic activity sectors.
South Asia’s new industrial policy measures implemented in 2022–25 are more targeted at specific firms or locations than those implemented in 2016–19.
A. Share of firm- or location-targeted new protective industrial policy measures
B. Share of firm- or location-targeted new protective industrial policy measures, 2022–25
still rely more heavily on import or export instruments than the average EMDE, and the average import duties in all countries in the region are above the median of other EMDEs (figure 2.3B; box 1.1). Import restrictions may be tempting options for the development of domestic industries, but in the long term they can reduce the competitiveness of the targeted sector and increase the cost of production in downstream sectors that use importedinputs(WorldBank2025a).
Note: Sample is restricted to protective
A. Bars show the number of firm or location targeted policies as a share of all new protective industrial policies in South Asia. Markers show the share for other EMDEs.
B. Bars show the share of South Asian countries’ new protective industrial policies implemented in 2022–25 that are targeted. “Other EMDEs” comprise 108 non-South Asia countries. The horizontal line shows the median, and the shaded region shows the interquartile range of other EMDEs.
e region’sgovernmentspaid0.9percentof GDP in direct funding in 2022, below the EMDE average. e region had about the same amount in foregone tax revenues as the average EMDE. ere was considerable variation within the region. Tax revenue foregone in Bangladesh, Maldives, and Sri Lanka was far higher than the EMDE average, while total subsidies in India are about half of the EMDE average as a percentageofGDP.
Policy instruments: Trade measures still above EMDE average, especially outside India. e average South Asian country shifted away from trade instruments. In particular, import instruments—such as import bans, import tariffs, and import license requirements—accounted for 25 percent of the region’s new protective policies implemented during 2022–25, a decline from 40 percent during 2016–19 but stillmorethaninotherEMDEs(figure2.3A, E). South Asian countries other than India
Policy scope: Increasingly rm- or locationspeci c. About one-third of South Asia’s industrial policies implemented during 2022–25 were targeted at specific firms or locations, compared with less than 20 percent during 2016–19 and about 40 percent among other EMDEs (figure 2.4). Across South Asian countries, industrial policies implemented by India were the most targeted, while policies of othercountriesintheregionwerelesstargeted than the EMDE median. Firm- or locationspecific policies can direct fiscal resources where most needed, if the targets are well chosen. For example, young firms in nascent andhigh-potentialindustries,andfirmsfacing high fixed costs can be targeted for more effective industrial policies (Choi and Levchenko 2025; Machado Parente et al. 2025). Conversely, targeted policies can also create unfair competitive advantages. Successful targeting depends on state administrative capacity to identify targets correctly (ISID 2025). For example, policies that benefit unproductive state-owned enterprises can lead to resource misallocation and crowd out more competitive private businesses(Criscuoloetal.2022).
Sectoral targeting: Half in manufacturing. About half of industrial policies implemented by South Asian governments in 2022–25 targeted the manufacturing sectors, a slightly larger share than in other EMDEs but lower
than during 2016–19 (figure 2.5). About 40 percent of the policies in the manufacturing sectors—and 70 percent outside of India— were trade-related instruments, and about 25 percent were implemented using domestic subsidies. Within manufacturing, the electronics industry has become the secondlargest beneficiary of protective industrial policies after food manufacturing. During 2022–25, seven percent of all South Asia’s newprotectiveindustrialpoliciesweretargeted at the electronics industry—a marked shift from the focus on chemicals, machinery, and basic metals manufacturing in the 2010s. Examples include India’s production-linked incentives for information technology hardware and advanced lithium batteries (Government of India 2021, 2023). e region also focused an above-average share of policies on basic metals and food manufacturing (for example, Bangladesh’s export ban on several food items), although the shares of policies targeting both sectors havedeclinedfrom2016–19.
Sectoraltargeting:Moreinconstructionthan in the average EMDE. Fifteen percent of South Asia’s industrial policies targeted the utilitiesandconstructionsectorsduring2022–25, twice the share in the average EMDE and a five-fold increase from 2016–19. India accounted for all the increase in the region (figure 2.5). Civil engineering, in particular, stands out, accounting for 6 percent of all policy measures in the region, ten times the share in the average EMDE and a ten-fold increase from 2016–19. ese policies have accompanied a rapid expansion in public infrastructure, especially in India and Bangladesh.
Sectoral targeting: Increasingly in services. e share of policies targeting the service sector has risen fourfold in South Asia (figure 2.5). Whereas other EMDEs focused on
Half of South Asia’s protective industrial policies target manufacturing, but they also focus more on utilities and construction than those in other EMDEs. Agriculture sector output is protected by high tariffs, but there were fewer new measures in the 2020s aimed at protecting this sector than in the 2010s. Over the past decade, the non-agricultural sectors least targeted (mostly services) by protective industrial policies have been the main source of employment growth in South Asia, while, in manufacturing, the more targeted activities contributed more to employment growth.
measures
Sources: GLD (database); GTA (database); WTO Analytical Database; World Bank.
A. Bars show the number of new protective industrial policies by broad sectors, as a share of total new industrial policies for the country group. Policies are shown by the year they were implemented.
B. Tariff data are the latest available. For Sri Lanka, data include para-tariffs (border charges that resemble tariffs). Refer to World Bank (2025a) for more details. Industry comprises manufacturing, mining, utilities, and construction.
C.D. Bars show the number of new protective industrial policies at detailed two-digit ISIC v4 sector level of the broad manufacturing, utilities, and construction sectors, as a share of all policy counts at detailed sector level among South Asian countries. Markers show the shares for non-South Asia EMDEs. Sample includes policies implemented in 2022–25 (C) or 2016–19 (D). Policies that apply to multiple sectors are counted in each of those sectors.
E.F. Annual employment growth is computed for 2016–22 for Bangladesh, 2017–23 for India, and 2015–23 for Sri Lanka. Industrial policy measures are the sum of new protective policies implemented in the two-digit sector during the period
protective measures in finance and transport, South Asia’s main policy focus in the service sector in 2022–25 was engineering and warehousing—services that mainly support theconstructionandmanufacturingsectors.
Sectoral targeting: Agriculture protected by tari s. During 2022–25, the share of new industrial policies targeting agriculture declined compared with the 2010s, but the sector—employing about 40 percent of South Asia’s workforce—continued to receive substantial policy support and protection (figure 2.5). In Bangladesh, India, and Sri Lanka, crop and animal production, the largest agricultural sector, was among the 10 percent of sectors most targeted by protective industrial policies, while food manufacturing—a downstream sector—was the target of the largest number of new policies in each of the three countries. e sector’s output remains protected by an average tariff of 30 percent, compared with an average 15 percent import tariff on the region’s industry (manufacturing, mining, utilities, and construction) sector and 6 percent in the agriculture sector of other EMDEs.
Sectoral targeting: Manufacturing sectors with faster job growth. Non-agricultural sectors least protected by industrial policies have been the source of job creation in South Asia over the past decade. e quarter of nonagricultural sectors that were targets of the least industrial policies generated over 80 percent of non-agricultural employment growth in Bangladesh and Sri Lanka—and 40 percent in India (figure 2.5). In part, this reflects the concentration of protective industrial policies in manufacturing, where employment growth has been slower than in services. Within manufacturing, however, sectors that were targets of more industrial policies have contributed more to
employment growth. e quarter of manufacturing sectors that were targets of the most industrial policies generated around three-quarters of manufacturing employment growth in Bangladesh and were the only manufacturing sectors with positive employment growth in Sri Lanka. In India, the quarter of manufacturing sectors with the least industrial policies were sources of only five percent of manufacturing employment growth.
On average during 2022–25, significantly more new industrial policy measures were directed at firms with more workers (Bangladesh, India) or higher productivity (India). In manufacturing (the target of about half of new policies), Sri Lankadirectedmorepoliciesatsectorswithmore employment, and India directed more policies at sectors with higher wages. India and Bangladesh directed new industrial policies at sectors with larger imports, while India and Sri Lanka targetedsectorswithlargerexports.
Methodology. A series of linear regressions reveal the de facto policy targeting of South Asia’s industrial policies. A country’s share of new protective industrial policies by sector is regressed on its one-year-lagged sectoral share of total employment, sectoral average (log) hourly wage, sectoral average (log) firms’ employment size, sectoral average (log) firms’ output per worker, and the sectoral share of exports and imports. e regression includes year fixed effects. e resulting coefficient estimates capture the degree to which more of a country’s policies are targeted at a sector with larger employment and higher wages, larger firms’ size and productivity, or larger exports and imports. e sample is restricted to non-agricultural sectors. e sample
comprises 73 sectors at the two-digit ISIC level in four South Asian countries (Bangladesh, India, Nepal, and Sri Lanka) for analysis of sector-level employment and wage; 45 sectors in three South Asian countries (Bangladesh, India, and Nepal) for firms’ size and productivity; and 25 sectors in all six South Asian countries for trade. Annex 2.1 providesmoredetailsonthesamples.
High-employment in Sri Lanka and highwagemanufacturingsectorsinIndia. Mostof South Asia’s new protective industrial policies did not target non-agricultural sectors with larger employment (figure 2.6). Instead, a significantly larger number of India’s policies targeted manufacturing sectors with higher wages. e quarter of manufacturing sectors that were targets of the most industrial policies paid 30 percent higher hourly wages than the quarter that received the fewest new policies in India. An exception was Sri Lanka, where significantly more policies were applied in sectors with larger employment, especially among manufacturing sectors. On average, the quarter of non-agricultural sectors that were targets of the most industrial policies employed 50 percent more workers than the quarter of sectors that received the fewest policies in Sri Lanka—and 80 percent more amongmanufacturingsectors.
Larger and more productive rms. During 2022–25, sectors with larger formal firms in both Bangladesh and India—and, in India, more productive firms—were targets of significantly more industrial policies (figure 2.6). In India, the quarter of sectors with the most industrial policies had firms that were 100 percent larger (by employment) and 40 percentmoreproductive.
Largerimports,largerexports. During 2022–25, non-agricultural sectors with larger imports were the targets of significantly more industrial policy measures in Bangladesh and India, while significantly more policies were
FIGURE 2.6 Correlation between sector characteristics and protective industrial policies
During the 2020s, more industrial policies were deployed in sectors with larger employment in Sri Lanka and sectors with larger firms in Bangladesh. In India, policies were directed to sectors with larger and more productive firms, as well as in manufacturing sectors with higher wages.
A. Predicted impact of a 1 percentage point increase in employment share on new industrial policy measures, 2022–25
B. Average employment share in sectors in the highest and lowest quartiles of new industrial policy measures, 2022–25
C. Predicted impact of a 10 percent increase in hourly wages on new industrial policy measures, 2022–25
D. Average hourly wages in sectors in the highest and lowest quartiles of new industrial policy measures, 2022–25
E. Predicted impact of a 10 percent increase in firms’ employment or productivity on new industrial policy measures, 2022–25
F. Average firms’ employment and productivity in sectors in the highest and lowest quartiles of new industrial policy measures, 2022–25
Sources: GLD (database); GTA (database); WBES (database); World Bank.
Note: Sample is restricted to non-agricultural sectors only.
A.C. Bars show the coefficient from regressions of sector share of new protective industrial policy on one-year lagged sector share of total employment (A) or sector average log hourly wage (C), with year fixed effects, for non-agricultural sectors or only manufacturing sectors. For C, coefficients are scaled by 10 to show the effect of a 10 percent change in hourly wage. The other EMDE sample comprises 5 non-South Asia EMDEs. Shaded region and horizontal line show the max-min range and median of regression coefficients for other EMDEs. Whiskers indicate a 90 percent confidence interval. Annex 2.1 provides more details.
E. Bars show the coefficient from regressions of sector share of new protective industrial policy on one-year lagged sector average log firms’ employment and log productivity. Coefficients are scaled by 10 to show the effect of a 10 percent change in firms’ employment or productivity. The other EMDE sample comprises 51 non-South Asia EMDEs. Shaded region and horizontal line show the interquartile range and median of regression coefficients for other EMDEs. Whiskers indicate a 90 percent confidence interval.
B.D.F. Bars show the average employment share (B), average hourly wage (D), and average firms’ employment and productivity (F) for the two-digit ISIC sectors in the top quartile by the sector share of new protective industrial policies. Diamonds show the values for sectors in the bottom quartile. For D and F, values are normalized by the country’s average hourly wage, average firms’ employment, and firms’ productivity.
In the 2020s, new protective industrial policies have targeted sectors with larger imports in Bangladesh and India, and those with larger exports in India and Sri Lanka.
A. Predicted impact of a 1 percentage point increase in import share on new industrial policy measures, 2022–25
C. Predicted impact of 1 percentage point increase in export share on new industrial policy measures, 2022–25
B. Average import share in sectors in the highest and lowest quartiles of new industrial policy measures, 2022–25
most export-competitive sectors (those with thehighestrevealedcomparativeadvantage)— textiles in Sri Lanka and mineral fuels in India—are protected by the lowest tariff rates ineachcountry(box1.1).
During 2004–23, South Asia’s imports declined significantly after the introduction of importrestricting policies while exports did not rise significantly after the introduction of exportpromotingpolicies.
D. Average export share in sectors in the highest and lowest quartiles of new industrial policy measures, 2022–25
Highest quartile Lowest quartile
Sources: CEPII BACI (database); GTA (database); World Bank.
Note: Sample is restricted to non-agricultural sectors only.
A.C. Bars show the coefficient from regressions of sector share of new protective industrial policy on one-year lagged sector share of the country’s exports or imports, with year fixed effects and separately for each country. Industrial policies are counted at the two-digit ISIC v4 sector level and include protective policies newly implemented during 2022–25. Industrial policy share is the sector’s share of total new protective industrial policies in the country-year. Import or export share is computed at the two-digit ISIC v4 sector level in the year prior to the industrial policy count, and expressed as a share of the country’s total imports or exports. The last year of trade data is 2023. The shaded region and horizontal line mark the interquartile range and median among other EMDEs with statistically significant coefficient at the 10 percent level. The sample includes 36 non-SAR EMDEs for imports (A) and 42 non-SAR EMDEs for exports (C).
B.D. Bars show the average import share (B) or average export share (D) for the two-digit ISIC v4 sectors in the top quartile by the sector share of new industrial policies implemented. Diamonds show the values for sectors in the bottom quartile by the sector share of new industrial policies. Values are normalized by the country’s average import or export share. New industrial policies are for 2023.
directed at sectors with larger exports in India and Sri Lanka (figure 2.7). In India, for example, the quarter of sectors targeted by the most industrial policies imported seven times, and exported eight times, as much as the quarter of sectors that received the fewest industrial policies. In India and Sri Lanka, the
Trade supports South Asia’s long-term macroeconomic stability, development, and jobs (World Bank 2025a). Manufacturing competitivenessandexportsareamongIndia’s stated development goals (Government of India 2026). As shown above, more than half of the new industrial policies implemented in South Asian countries other than India were import restrictions or export incentives (figure 2.3). Globally, export incentives have been associated with short-term declines and statistically insignificant medium-term gains in firms’ value added and productivity (Machado Parente et al. 2025). Domestic subsidies have been shown to have persistent positive effects on sectoral trade and, in some cases, positive effects on inward cross-border investment (Huang et al. 2025; Rotunno and Ruta2024;RutaandSztajerowska2025).
Methodology. A local projection model is estimated to trace out changes in sectoral imports and exports after the introduction of sector-specific protective industrial policy measures that discriminate against foreign businesses and protect domestic ones. Estimates distinguish by instruments used. e sample consists of data for 31 sectors at the two-digit ISIC level in 154 EMDEs, including all six countries in South Asia, for
2004–23. During this time span, new policy measures were introducedin about 10percent (8,706 observations) of country-sector-year observations among EMDEs and 17 percent (604 observations) in South Asia. e estimation controls for country-sector, country-year, and sector-year fixed effects to remove global sector-specific trends, countryspecific trends, and country-sector characteristics.Italsocontrolsforthepresence of pre-existing industrial policies in the sector before the introduction of the new measure.
Figure 2.8illustrates results for the South Asia region; annex 2.1 shows that these results are consistentwiththoseforall154EMDEs.
Imports: Declines after policy restrictions. Sectoral imports declined significantly for several years after the introduction of trade defensepoliciesordomesticsubsidiesinSouth Asia (figure 2.8). is is consistent with domestic subsidies serving as importsubstitution policy: subsidies on importcompeting sectors support the expansion of domestic production and, after some delay, lower imports of goods produced in the targetedsectors.Itisalsoconsistentwithtrade defense policies outright restricting imports; for example, Sri Lanka’s import ban on fertilizers in 2021 led to a dramatic decline in fertilizer imports without the development of a domesticfertilizer industry (Ghose, Pinheiro Fraga, and Fernandes 2023). Similarly, public procurement policies, such as procurement access, localization, and preference margins, could restrict imports. But in practice, these policies, although gaining popularity in South Asia, were not followed by significant changes inimportsintheregion(annex2.1).
Exports: No signi cant change after policy support. e introduction of outright exportpromoting policies (such as export incentives) was not followed by a significant increase in exports in South Asia (figure 2.8). In principle, domestic subsidies—such as financial grants, loans, and interest payment
FIGURE 2.8 Evolution of trade flows after introduction of protective industrial policies
In South Asia, industrial policies to protect against imports have been followed by periods of significantly lower imports in the sectors targeted by these measures. In contrast, export-promoting policies were not followed by significantly higher exports.
A. Cumulative percent change in South Asia’s imports after the start of industrial policy: Trade defense instruments
B. Cumulative percent change in South Asia’s imports after the start of industrial policy: Domestic subsidies
C. Cumulative percent change in South Asia’s exports after the start of industrial policy: Export incentives
-4-3-2-101234
D. Cumulative percent change in South Asia’s exports after the start of industrial policy: Domestic subsidies
Sources: CEPII BACI (database); GTA (database); World Bank.
Note: The impulse response function is from a local projection estimation of cumulative changes in log imports (A, B) or exports (C, D) on a dummy variable for the implementation of a protective industrial policy. T=0 is the first period after policy implementation. Estimation includes controls for the presence of other active industrial policies in the same country and sector. Country-sector, countryyear, and sector-year fixed effects are included. Sectors are at the two-digit ISIC v4 level. Standard errors are clustered at the country-sector level. The sample includes protective industrial policies implemented between 2004 and 2023 that were active for more than five years. The broken parts of the line show the pre-trend. Shaded regions indicate 90 percent confidence intervals. Annex 2.1 provides more details on the estimation.
A.B. Estimates for the change in imports of affected sectors after the introduction of trade defense instruments (A), or domestic subsidies (B). Trade defense instruments include anti-dumping, antisubsidy, and other safeguards.
C.D. Estimates for the change in exports of affected sectors after the introduction of export incentives (C), or domestic subsidies (D). Export incentives include export subsidies, export tax incentives, and other export incentives. Domestic subsidies also include state aid.
subsidies—can alleviate credit constraints for young firms and industries with high fixed costs or coordination challenges (including many exporting activities). In practice, however, such subsidies have not been associated with a significant increase in sectoral exports in South Asia. Public procurement policies, if used to support
South Asian countries have limited fiscal space, with below-average revenues, above-average debt, and above-average bank holdings of sovereign debt. Several South Asian governments are also limited in their effectiveness, operational efficiency, and the quality of their regulatory frameworks.
if the public sector offers more attractive pricesormore favorable termsthan the export market (Deringer et al. 2018). In South Asia, the introduction of public procurement measures was not followed by significantly higherorlowerexports(annex2.1).
Even outside the remit of trade policies, South Asia’s experience with industrial policies has beenmixed. eregion’suseofindustrialpolicies has been constrained by limited fiscal space and government capacity, poor implementation, and gaps in infrastructure. e few success cases have hinged on coordinated policies and integration intoglobalvaluechains.
Sources: B-Ready Index (database); Haver Analytics; IMF WEO (database); World Bank Fiscal Survey (database); WDI (database); WGI (database); World Bank.
A. Tax revenue includes social security contributions and excludes grants. EMDE average is the nominal GDP-weighted average of 142 EMDEs.
B. EMDE average is the nominal GDP-weighted average of 147 EMDEs. For Bhutan, about twothirds of general government debt is in hydropower debt
C. Bars show the banks’ claims on central government as percentage of banks’ total assets. The red horizontal line shows the median among 102 non-SAR EMDEs. The shaded region shows the interquartile range for this sample. Latest data are for December 2025 for Bangladesh, Bhutan, Maldives, and Nepal, and FY24/25 for India.
D. The red horizontal line shows the median among 149 non-SAR EMDEs for which the government effectiveness index is available from the Worldwide Governance Indicators database. The shaded region shows the interquartile range for this sample.
E.F. B-Ready indicators, where a higher index indicates a more business-friendly business climate. Data are available for three South Asian countries. “Other EMDEs” include 73 non-SAR EMDEs. The red line is the unweighted average of other EMDEs.
Limited scal space in most South Asian countries. South Asian countries have limited fiscal space. Tax revenue as a percentage of GDP during 2019–23 was below the EMDE average in all six South Asian countries, and general government debt as a percentage of GDP was above the EMDE average in all but Bangladesh as of the end of 2024 (figure 2.9; World Bank 2025b). India and Nepal have highertaxrevenueandlowergovernmentdebt than other South Asian countries, a combination that could allow their governments to use fiscal resources for industrial policies. However, Nepal has little accesstointernationalfinancialmarkets,anda large share of its fiscal financing comes from domestic banks, which hold more assets in domesticgovernmentbondsthan do domestic banks in most other EMDEs. Even in India, the share of sovereign bonds in bank assets ranks in the top quartile of EMDEs. As a result, fiscally expensive policies—including state loans, financial grants, and trade finance—are not priorities (Fernandes and Reed 2026). Indeed, South Asian countries have relied less heavily on domestic subsidies and state aid than other EMDEs, although
India uses a larger share of subsidy measures thanothercountriesintheregion(figure2.3).
Lack of a large local market in most South Asian countries. South Asian countries other than Bangladesh and India have moderately sized local markets, ranking in the second quartile of EMDEs by U.S. dollar GDP. For countries without a large local market size, trade policies that leverage local market size for advantages, such as technology transfer quid pro quo and local content requirements, arenotpriorities(FernandesandReed2026).
Limited government capacity in Bangladesh and Nepal. In Bangladesh and Nepal, government capacity—whether measured by the government effectiveness index or the World Bank’s B-Ready scores for regulatory frameworks and operational efficiency—is below the median of other EMDEs (figures 2.9; World Bank 2025b). Although government capacity in Bhutan and India is higherthan in mostotherEMDEs,itstillfalls well short of the median of advanced economies. In Bhutan, government capacity constraints exist in areas such as technical capacity and implementation capacity. For countrieswith lowgovernmentcapacity,firmspecific policies that require accurate targeting—such as trade finance, export subsidies,financialgrants,andstateloans—do not appear to be priorities (Fernandes and Reed 2026). Nepal’s export subsidy scheme is one such example. e scheme—first introduced in 2010–11 and expanded in 2022—provided 4–8 percent of export value for targeted product categories. However, the program had faced long delays in paying out cash incentives to exporters because of scattered budget allocations, long approval processes, and lack of coordination across multiple ministries ( e Annapurna Express 2024; Verma 2025). As a result, the subsidy program was found to have limited impact on the exports of domestically produced goods
Several South Asian countries have poor-quality infrastructure, and some face constraints from non-tariff trade barriers and from access to land and finance, which typically hinder small and medium-sized enterprises in particular.
A. Quality infrastructure, 2023 B. Days for exports and imports to clear customs for medium-size firms
C. Access to land as a major constraint, by firms’ size
D. Access to finance as a major constraint, by firms’ size
Sources: GQII (database); Harmes-Liedtke, Muñoz, and Waltos (2024); WBES (database); World Bank.
A. Red horizontal line shows the median among 139 non-SAR EMDEs for which the Global Quality Infrastructure Index is available. Shaded region shows the inter-quartile range for this sample. Yellow horizontal line shows the median among 38 advanced economies.
B. Bars show the average number of days it takes for imports or exports to clear customs among medium-sized firms (20 to 99 employees). Horizontal line shows the median among other EMDEs, which comprise 74 non-SAR EMDEs with surveys between 2022 and 2025.
C.D. Bars show the share of firms identifying inadequate access to land (C) or finance (D) as a major or very severe constraint. Small firms are those with fewer than 20 employees, medium-sized firms are those with 20–99 employees, and large firms are those with 100 or more employees. Horizontal lines show the median among other EMDEs, comprising 78 non-SAR EMDEs with surveys between 2022 and 2025.
and has since been abolished (Defever et al. 2020; e Kathmandu Post 2025). Limited capacity can also lead to poor program designs. Bangladesh’s policy support for its ready-made garments (RMG) sector— including preferential taxation, concessional export finance, and subsidized lending— helped propel the sector into a global export powerhouse during the 1980s and 1990s but, since then, rent-seeking and stifled broader economic diversification have been attributed to the absence of sunset clauses for these policies(Galaletal.2025).
Poor implementation and onerous regulation. Even in countries with solid government capacity, gaps in implementation can limit the impact of industrial policy. India’s Production-Linked Incentive (PLI) offers sales-based incentives to encourage domestic production. But as of September 2025, the PLI, which started in 2020–21 and was scheduled to last five years, had issued only 12 percent of the funds allocated to it (CareEdge Ratings 2025). Burdensome administrative requirements, limited coordination across ministries, and supply chain constraints (in solar production sectors) have been cited as reasons for the ineffective implementation (Hudson Institute 2024; IEEFA2025;Reuters2025). Sri Lanka’smore than 500 state-owned enterprises contributed significantly to the country’s debt crisis because of conflicting objectives, mismanagement, and inadequate oversight (Advocata 2022). For Sri Lanka, strengthening the oversight and management of state-owned enterprises is therefore among the core reform priorities (World Bank 2025c). Complex and long regulatory processes limit the take-up and success of industrial policy programs. South Asian firms across all sectors cite a host of obstacles to doing business, in particular non-tariff trade barriers, and difficult access to land and finance. Medium-sized firms in Bangladesh and India experience longer delays to clear import and export customs than firms in the median EMDE (figure 2.10). An abovemedian share of small firms in Bhutan and an above-median share of medium-sized firms in India identify inadequate access to land as a major constraint to operations. An abovemedian share of firms of all sizes in Nepal face amajorconstraintfromaccesstofinance.
Gapsininfrastructure. Gapsininfrastructure, bothphysicalanddigital,
constrain the scale of industrial policy. In Bangladesh, planned economic zones were canceledorexperiencedlong delaysbecause of slow infrastructure development ( e Daily Star 2025). In Sri Lanka, the lack of a fully digitized and automated system prevented exporters from taking full advantage of tax incentives for purchases of domestic inputs (World Bank 2024c). In addition, infrastructure for quality assurance, as measured by the Quality Infrastructure Indices, is below the median of other EMDEs in Bhutan, Maldives, and Nepal (figure 2.10). Quality infrastructure—such as standardization, accreditation, and metrology (measurement science) assures buyers of the quality of a country’s products and helps promote exports, whereas weak quality infrastructure can hinder the effect of industrialpoliciesonexportpromotion.
Coordinated policy and integration into globalsupplychains. India’selectronicssector illustrates how coordinated policies can drive integration into global supply chains. e National Policy on Electronics laid the foundation for a broader ecosystem— attracting foreign direct investment (FDI), nurturing domestic manufacturers, and linking Indian producers to GVCs. Building on this foundation, the PLI schemes provided targeted financial incentives tied to incremental production, directly encouraging firms to scale up manufacturing capacity and boost exports. e results have been significant: Since FY21, the sector has attracted more than US$ 4 billion in FDI, including Apple suppliers establishing operations in Tamil Nadu, alongside strong growth in mobile phone exports (CareEdge Ratings 2025; Fernandes and Reed 2026; Karnik2025).
South Asian countries can maximize the gains from industrial policies through first-choice policies such as industrial parks, skill development programs, and market access assistance. Better infrastructure, business regulation, and institutions can provide broad benefitsacrossindustries.
First choice policies to address market failures
Market failures such as coordination problems, high fixed costs, and information gaps can be addressed by first-choice policies and require only moderate institutional capacity(FernandesandReed2026).
Industrial parks allow firms to jointly locate and operate with coordinated infrastructure. Industrial parks reduce fixed-cost and entry barriers, especially for a new industry, strengthen agglomeration benefits among firms, and require only moderate government capacity to implement. Sound design choices are critical—such as locating industrial parks near skilled labor and transportation hubs. Industrial parks combined with special regulatory regimes have been successful in China, Poland, Türkiye, and Viet Nam. In South Asian countries, evidence is mixed on the impact of industrial parks and special economic zones (Alkon 2018; Görg and Mulyukova 2024). One exception is India’s plug-and-play industrial parks in Tamil Nadu for iPhone production, which have been showntoalleviateconstraintsfrominadequate access to land and finance (Fernandes and Reed 2026; Government of India 2025). Some South Asian countries have unusually divergentsubnationallabormarkets(box2.2).
Locating industrial parks or economic zones in lagging regions could stimulate economic
activities and increase employment in the surrounding areas (Gallé et al. 2024; McCaig et al. 2025). But to achieve positive outcomes requires a responsive local government—as in the case of Tamil Nadu. e region needs to have the resources, including land and labor, to provide production inputsandconnectivity to ensure access to markets. Otherwise, it is often more cost-effective to allow labor reallocation across locations by lowering barriers to worker mobility (Grover, Lall, and Maloney2022).
Skills development programs can target prioritysectorswithskillsshortagesto support growth of firms in these sectors. Such programs can start with mapping private sector demand to training programs, and seek to develop both technical and managerial skills.Forexample,inCostaRica,atechnician training program supported the development of its electronics industry. Similar efforts supported the software industry in India—a government-private sector partnership in the city of Bhubaneswar, India, provides technical training to nearly 38,000 people each year (Banga 2026; Kumar 2014). Countries with limited fiscal space, including many South Asian countries, could also benefit from the skills training provided by the Global Skills Partnership (Acosta et al. 2025). Skills developmentprogramscanhelpworkersadapt to changing skill demand and equip them with the necessary skills to move to rising sectors, especially as disruptions from trade and AI are thinning out labor markets (box 2.1).
Market access assistance—which India and Sri Lanka include in their national development plans—helps match firms to their best trading partners and to their best sources of quality inputs from foreign suppliers. Such assistance can be especially helpful for small- and medium-sized
South Asia has some of the largest and some of the smallest within-country wage differentials by the standards of emerging market and developing economies (EMDEs). In South Asia’s larger countries, worker characteristics account for about one-fifth of these subnational wage differentials. South Asia’s remaining wage premiums, after controlling for worker characteristics, are higher in regions with better transport connectivity, more skilled workforces, larger firms, and more services sector activity. Wage premiums appear to be persistent and selfreinforcing. While such regional wage persistence may warrant place-based or industrial policies, South Asia’s experience with these policies has been mixed.
Introduction
Despite balance of payments crises and severe pandemic-relatedrecessions,percapitarealGDP growth in South Asia—Bangladesh, Bhutan, India, Maldives, Nepal, and Sri Lanka—has outpaced that of other EMDEs since the mid2010s (figure B2.2.1). This growth, however, was reflected unevenly in labor market outcomes—with large regional disparities. Per capita incomes in India, for example, grew on average by 4.1 percent per year between 2017 and 2023, but average annual real wage growth at the state level ranged from –5.4 percent per year in Punjab to +5.6 percent per year in Chhattisgarh. Chhattisgarh’s average wage is 40 percent below the national mean, whereas Kerala’swageis60percentabove.
promising activities, locations, and firms. For example, the output gains from a trade reform that lowers import costs would be only half of those that would be generated without a modest reduction in job-switching costs. The combined reform would encourage workers to move to differentsectorsandfirms,andincreasethegains (WorldBank2025a).
Industrial policies can help create the right conditions for job creation and business growth in disadvantaged regions, including by supporting employment-creating sectors(chapter 2). Tourism and agribusiness, for example, have been cited as sectors that could boost economic activity in lagging regions (Fernandes and Reed 2026;GovernmentofIndia2026).
Regional wage differentials may widen further as asymmetricshocksaffectsectorsand—becauseof different sectoral compositions—regional labor markets. For example, the widespread adoption of artificial intelligence is disrupting service sector exports (such as in India’s state of Karnataka),whilemajortariffchangesabroadare affecting manufacturing sector exports (such as in the state of Gujarat; figure B2.2.1; World Bank2025a).
Such asymmetric shocks can cause job and wage losses if workers cannot quickly move to more
This box examines labor market fragmentation among entities that are one administrative level below the national government: divisions in Bangladesh, districts in Bhutan, states and union territories in India, major atolls and cities in Maldives, and provinces in Nepal and Sri Lanka. Extremely small subnational units that account for less than 1 percent of the working-age population are excluded from the analysis, to ensure that findings are broadly applicable to the vast majority of the workforce. Specifically, this boxconsidersthefollowingquestions:
Note
• How large are wage differentials among South Asia’s labor markets by international comparison?
Since the mid-2010s, most of South Asia has benefited from higher per capita real GDP growth than most other EMDEs. However, this per capita growth has been reflected in labor market outcomes in a highly uneven manner. Several asymmetric shocks may further widen the gap between higher- and lower-paying regional labor markets.
A. Average annual per capita real GDP growth, 2016–23
Interquartile range of other EMDEs
B. Average annual real wage growth, 2016–22: Bangladesh
C. Average annual real wage growth, 2017–23: India
D. Average annual real wage growth, 2015–23: Sri Lanka
E. Workers’ exposure to AI
EMDEs average
F. Workers in tariff-exposed sectors
Sources: GLD (database); Maldives Household Income and Expenditure Survey 2019; World Bank (2025a); WDI (database); World Bank.
Note: AI = artificial intelligence; AP = Andhra Pradesh; MP = Madhya Pradesh; UP = Uttar Pradesh.
A. Red line is the median, and red shade is the interquartile range, for 145 EMDEs, excluding the six countries in South Asia.
B.–D. Charts show average annual growth in regional average raw wages between the year with available data closest to 2015 and the year with the last available data. Subnational units with a population of less than 1 percent of the national population are omitted.
E. “Other EMDEs” are 25 non-SAR economies for which labor force surveys are available. All EMDE and regional averages are weighted by the working population (aged 15+). Generative AI (GenAI) occupational exposure scores are averaged across text and image and defined as standard deviations relative to the average occupational exposure. Bars show the average GenAI exposure index in SAR countries. Yellow line shows the average GenAI exposure index in 25 EMDEs for which labor force surveys are available, excluding SAR.
F. South Asia comprises the latest data for all six countries in the region and other EMDEs comprise six comparator countries.
• What are the features of the most dynamic subnationallabormarketsinSouthAsia?
• Which policy options are available to improve labor market outcomes in lagging regions?
Main findings. This box documents the followingfindings.
First, considering regional wage differentials as a proxy for within-country labor market fragmentation, South Asia’s labor markets range from being unusually fragmented by EMDE standards (in Bhutan, India, Maldives) to being unusually integrated (in Bangladesh, Nepal). Differences in worker characteristics, such as education and sector of employment, explain about one-fifth (Bangladesh, Bhutan, India) to
four-fifths (Maldives) of the wage differences across subnational regions. Until 2019, wage differentials between leading and lagging regions narrowed in most South Asian countries, but thenwidenedagain.
Second, the regions that pay the highest wage premiums, after controlling for worker characteristics, are those with larger and better transport networks, more educated workforces, andmoreemploymentinlargerfirmsinindustry and services. These are also the features of the regions with fastest-rising wage premiums, suggesting self-reinforcing regional wage dynamics.
Timmis2023).Thisboxdiffersfromtheexisting literature in two ways. First, instead of focusing on individual cities, this box focuses on a subnational level of government that controls much of economicpolicyin South Asia. Second, instead of focusing on single-country patterns, this box identifies common, cross-country regularitiesinsubnationalwagedifferentials.
Data and definitions
Third, improved transport connectivity and skilling can helpimprove labor market outcomes in South Asia’s lagging regions. Industrial policies can foster economic activity in lagging regions by supporting sectors such as tourism and agribusiness, or by addressing market failures. For example, industrial parks that concentrate manufacturing activity can alleviate coordination challenges, although South Asia’s experiencewithindustrialparkshasbeenmixed.
Data. Thisboxdrawsonawiderangeofsources. Harmonized, detailed labor force surveys from theWorldBank’sGlobalLaborDatabase(GLD) are supplemented with national survey data for Bhutan and Maldives. The data are then aggregated to the subnational level. Infrastructure data at the subnational level come from Straub et al. (forthcoming). These sources result in a dataset of subnational labor market indicators between 2008 and 2024 for all South Asian countries and 19 other EMDEs. For India and Sri Lanka, the latest available data are for 2023; for Bangladesh, 2022; for Bhutan, 2024; forMaldives,2019;andforNepal,2017.
Contribution to the literature. An urban wage premium is well established for advanced economies and, in the United States, accompanied by greater earnings inequality (Buchholz 2025). In both the United States and Europe, local wage premiums have been higher (or grown faster) in urban centers, and in areas that have more skilled workforces and specialize in more technologically sophisticated and globally connected activities (Bathelt, Buchholz, and Storper 2024; Groot, de Groot, and Smit 2014). In EMDEs, too, urban centers offer agglomeration benefits, but some lagging regions may struggle even when market failures or transitory adverse shocks are addressed (Grover, Lall, and Maloney 2022; Grover, Lall, and
Definitions. For the purposes of this box, regional “wage differentials” are captured by the minimum-maximum range of raw regional averages of wages at the administrative level 1 in the GLDdatabase,scaled bythe median region’s average wage. By contrast, the regional “wage premium” is a regional average wage controlling for worker characteristics. Specifically, it is the coefficient on the regional fixed effect derived from a survey-by-survey regression. The analysis regresses individual workers’ log wages on experience, squared experience, as well as dummy variables for male gender, primary education, secondary education, post-secondary education, urban location, high-skilled occupation, employment in industry, and employment in services. Experience is defined as
FIGURE B2.2.2 Regional wage differentials
In most South Asian countries, wage dispersion across regional labor markets is near the top quartile of EMDEs. One-fifth (Bangladesh, Bhutan, India) to four-fifths (Maldives) of the dispersion is accounted for by differences in worker characteristics. Until about 2019, differences between regional wages narrowed in most South Asian countries but then widened amid balance of payments pressures in Bangladesh and Sri Lanka.
A. Range of regional average wages
range for other EMDEs
D. Highest and lowest regional wage premium: India
E. Highest and lowest regional wage premium: Nepal
C. Highest and lowest regional wage premium: Bangladesh
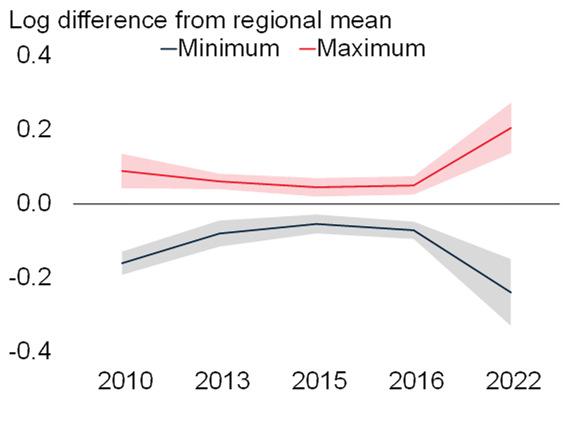
F. Highest and lowest regional wage premium: Sri Lanka
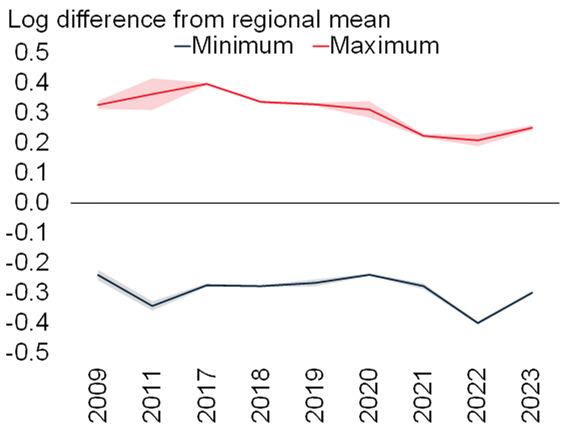
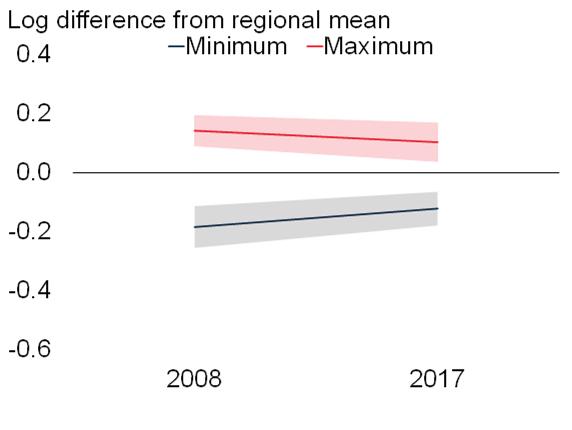
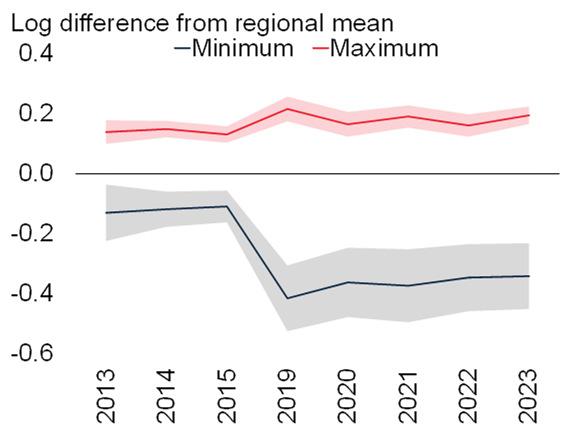
Sources: Eurostat; GLD (database); IPUMS USA: Version 16.0 (dataset); Maldives Household Income and Expenditure Survey 2019; World Bank.
Note: Charts show the minimum-maximum range of average wages in admin-1-level subnational units relative to the average wage of the median subnational unit. Subnational units that account for less than 1 percent of the country’s working-age population (aged 15+ years) are excluded.
A. Red shade represents the interquartile range and the red line shows the median value for 22 EMDEs, excluding countries in South Asia. Bar for euro area shows the cross-country range of country-level average wages in 2024 in 12 euro area countries. Bar for United States shows the cross-state region of state-level average wages in 2024 in 29 U.S. states.
B.–F. “Controlling for worker characteristics” is based on the residual derived from country-by-country regressions of individual workers’ log wages on experience; squared experience; as well as dummy variables for male, primary education, secondary education, post-secondary education, urban residence, high-skilled occupation, employment in industry, and employment in services. Experience is defined as age minus years of education minus 6. Shaded region indicates 90 percent confidence intervals. Results can be found in annex table B2.2.2.
age minus years of education minus six years to account for the age that most workers entered primary school. Extremely small regions, which host less than 1 percent of the working-age population,aredroppedfromthesample.
Regional wage differentials. In the average South Asian country, the wage differentials (almost 20 percent) is slightly wider than the
average EMDE, but South Asia has some of the largest, as well as some of the smallest, spatial wage differences among EMDEs. Wage differentials are particularly narrow in Nepal and Bangladesh: the range of raw wages across subnational regions is well below that of the median EMDE (figure B2.2.2). Nepal’s wage differential is low even compared with the narrowdifferentialsbetween U.S.statesthathave been widely studied in the literature. In contrast, South Asia’s small states—mountainous Bhutan
and the islands and atolls of Maldives—have exceptionally wide regional wage differentials, ranking among the highest quartile of EMDEs. Infact,their subnational wagedifferentialsareon par with the cross-country wage differentials in the euro area that have been the focus of much of the convergence literature. Cross-regional differences in raw wages in India, too, rank near thetopquartile amongEMDEs,andthosein Sri Lanka are also above the EMDE median. In part, these regional differences in raw wages reflectdifferentworkercharacteristics.
B2.2.2). As severe exchange rate pressures and energy shortages depressed non-agricultural activityinBangladeshin2022,alargenumberof workers moved into agriculture, widening wage differentials between higher-wage urban and lower-wage rural areas (World Bank 2025d). In Sri Lanka, the Easter Sunday terrorist attacks in 2019 and a simultaneous fall in tea prices disproportionately affected the Central Province, where some of Sri Lanka’s most famous cultural sites and tea estates are located (IMF 2019; Sri Lanka Department of Census and Statistics 2019).
Characteristics of regions with higher wage premiums
Candidate correlates of regional wage premiums: Literature. In both the United States and Europe, local wage premiums have been higher (or grown faster) in urban settings, which tend to have more skilled workforces, and specialize in more technologically sophisticated and globally connected activities (Bathelt, Buchholz, and Storper 2024). In EMDEs, too, urban areas have offered higher wages (Grover, Lall,andMaloney2022).
Regional wage premiums, controlling for worker characteristics. To control for worker characteristics such as education and sector of employment, the regional wage premium is estimated as the coefficient on the regional fixed effect of a regression of log wages on worker characteristics. The resulting regional wage premium reflects region-specific wage differentials for workers with the same characteristics. In Maldives, worker characteristics account for almost all of the regional wage differentials: controlling for worker characteristics shrinks these differentials to one-fifth (figure B2.2.2). In South Asia’s other countries, worker characteristics account for about one-fifth, and at most one-third (Sri Lanka) of the cross-regional wage differentials. The remaining range of regional wage premiums amounts to about three-fourths of the median region’s wage premium in India, Bangladesh, and Sri Lanka and less than one-fifth the medianregion’swagepremiuminNepal.
Regional wage premiums over time. In India, differentials in regional wage premiums have gradually narrowed since the 2010s as wage premiums in the highest-paying regions trended down. In Bangladesh and Sri Lanka, differences in wage premiums narrowed over the 2010s, but then diverged beginning in 2019–20 (figure
• Urbanization benefits. The spatial concentration of economic activity that is commonly found in urban centers can increase wage premiums by enhancing productivity and growth through knowledge spillovers, labor market pooling, and input sharing (Bathelt, Buchholz, and Storper 2024). Alternatively, such a concentration of people and activity can generate pollution, congestion, and crime that offset agglomeration-driven productivity gains (Grover,Lall,andTimmis2023).
• Laborsorting. Related to agglomeration, the observed wage premiums can reflect the
FIGURE B2.2.3
Regions with large urban agglomerations, better transport connectivity, better-educated workforces, and larger firms, especially in services and industry, offer a higher wage premium, even after controlling for workers’ individual characteristics.
A. Difference in regional wage premium by urban agglomerations
B. Difference in regional wage premium by workforce education and skills
C. Difference in regional wage premium by industry structure
Sources: GLD (database); Maldives Household Income and Expenditure Survey 2019; World Bank.
Note: pop. = population. Predicted difference in log regional wage premium between the highest (90th percentile) and lowest (10th percentile) value for each regional characteristic in South Asia. Prediction is based on a linear regression of the log regional wage premium on one characteristic at a time, controlling for country-year fixed effects. Yellow whiskers represent 90 percent confidence intervals. Regional wage premium is the coefficient on the regional fixed effect in a country-by-country regression of individual workers’ log wages on experience; squared experience; as well as dummy variables for male, primary education, secondary education, postsecondary education, urban residence, high-skilled occupation, employment in industry, and employment in services. Experience is defined as age minus years of education minus 6. Results can be found in annex table B2.2.3.
A. “Urban pop.” stands for the share of urban population. “Rail length” and “Road length” stand for the log length of railway tracks and roads, respectively (in kilometers). “Rail value” and “Road value” stand for the log value of the stock of rail and road assets, respectively, at replacement cost (in U.S. dollars).
B. “Below Primary” stands for the share of workforce with below-primary education. “Above Secondary” stands for the share of population with post-secondary education.
C. “Agriculture,” “Industry,” and “Service” stand for share of workers employed in agriculture, industry, and service, respectively. “Large firms” stands for the share of workers in firms with more than 20 workers.
spatial concentration of higher-skilled workers in high-wage local labor markets, and a self-reinforcing interaction between skill demand and skill supply (Overman and Xu 2024). In France, for example, skill sorting accounts for a substantial share of wage differences across regions after controlling for worker heterogeneity (Combes,Duranton,andGobillon2008).
integration in the European Union (Bartz and Fuchs-Schündeln 2012). Lack of transport links prevented access to export markets for highland tea-growing areas in Kenya(Grover,Lall,andMaloney2022).
• Others. Wage premiums can reflect differences in place-based endowments, constraintsthatlimitmobilityacross regions, or market failures that dampen firms’ growth. For example, rising housing costs in high-income areas limit low-skill migration in the United States (Ganong and Shoag 2017). Language barriers limit cross-border
Correlates of regional wage
Empirical estimates. Correlations between regional wage premiums and regional characteristics are derived from a series of panel regressions of regional wage premiums after controlling for worker characteristics. They include education and transport connectivity, one characteristic at a time, and country-year fixed effects. To test for differences between South Asia and other EMDEs, an interaction term between the regional characteristic and a South Asia dummy variable is added, but
retained only when the coefficient on the interaction term is statistically significant (annex tableB2.2.3).Applyingtheresultingestimatesto data for South Asia’s regions suggests that South Asia’s regions with higher regional wage premiums differed systematically from their peers in the composition of their workforce, in the composition of their firms, and in their transport connectivity, broadly in line with the literature.
pointsinfigureB2.2.3).AbouthalfofIndia’s states and union territories, half of Bangladesh’s divisions, all of Nepal’s provinces, and the Eastern and NorthCentral provinces of Sri Lanka have smaller road networks than the EMDE median. Similarly, across South Asian subnational regions, the road quality (as measured by the average replacement value) is below the EMDE median. This suggests considerable potential for better transport connectivity to raisewagesinSouthAsia’slaggingregions.
• Urbanization. In the full EMDE sample, regions with higher urban population shares had significantly higher regional wage premiums—except in South Asia, consistent with South Asia’s relatively low-performing urban areas (figure B2.2.3; chapter 1). The urban population share is the only regional characteristic whose correlation with regional wage premiums differs significantly between South Asia and other EMDEs. In South Asia, the correlation between urban population shares and regional wage premiums is statistically indistinguishable fromnilbecause wage premiumdifferwidely between states with large urban population shares. For example, the two Indian states Maharashtra and Gujarat had virtually identical urban population shares in 2023 (a touch under 43 percent), but Maharashtra’s wage premium was 6 percentage points above the median, while Gujarat’s was 7 percentagepointsbelowthemedian.
• Workforcecomposition. Regions with a larger share of more educated and more skilled workers offer significantly higher wage premiums. Conversely, those with a larger share ofless-educatedandless-skilledworkers offer significantly lower wage premiums (figure B2.2.3). The wage differentials between South Asia’s regions in the lowest and highest deciles by education and skill amounted to 20 to 40 percent (that is, 0.2 to 0.4 log points in figure B2.2.3). Most of South Asia’s subnational regions have lower shares of high-skilled workers and higher sharesoflow-skilledworkersthantheEMDE median. Efforts to improve skills and employment opportunities for higher-skilled workers could therefore yield broader wage gains.
• Transport connectivity. Transport connectivity plays a special role, as regions with larger and better-quality road and rail networks also offer significantly higher wage premiums. The regional wage differential between South Asia’s regions in the lowest and highest deciles by transport links amounted to 10–20 percent (0.1–0.2 log
• Firmcomposition. South Asia’s regions with fewer agricultural and more industrial jobs offer higher wage premiums (figure B2.2.3). A higher share of workers in large firms— those with 20 or more workers—is also associated with higher regional wage premiums. South Asia’s regions with the highest and lowest deciles of services shares and firm sizes had wage differentials of about 20 percent (0.2 log points in figure B2.2.3).

The factors associated with higher regional wage premiums were also those associated with higher growth in regional wage premiums, suggesting self-reinforcing regional wage dynamics.
A. Difference in regional wage premium growth by urban agglomerations
difference
B. Difference in regional wage premium growth by workforce education and skills
C. Difference in regional wage premium growth by industry structure

Sources: GLD (database); Maldives Household Income and Expenditure Survey 2019; World Bank.
Note: Predicted difference in log regional wage premiums between the lowest (10th percentile) and highest (90th percentile) value of each regional characteristic in South Asia. Prediction is based on a linear regression of the log regional wage premium on one characteristic at a time, controlling for country-year fixed effects and for lagged log regional wage premium. Yellow whiskers represent 90 percent confidence intervals. The regional wage premium is the coefficient on the regional fixed effect in a country-by-country regression of individual workers’ log wages on experience; squared experience; and dummy variables for male gender, primary education, secondary education, post-secondary education, urban location, high-skilled occupation, employment in industry, and employment in services. Experience is defined as age minus years of education minus 6. Results can be found in annex table B2.2.4.
A. “Urban pop.” stands for the share of urban population. “Rail length” and “Road length” stand for the log length of railway tracks and roads, respectively (in kilometers). “Rail value” and “Road value” stand for the log value of the stock of rail and road assets, respectively, at replacement cost (in U.S. dollars).
B. “Below Primary” stands for share of workforce with below-primary education. “Above Secondary” stands for the share of population with post-secondary education.
C. “Agriculture,” “Industry,” and “Service” stand for the share of workers employed in agriculture, industry, and service, respectively. “Large firms” stands for the share of workers in firms with more than 20 workers.
With fewer than a handful of exceptions in India (such as Goa), all of South Asia’s subnational regions have lower shares of workers employed in large firms than in the median EMDE. Also, with very few exceptions (such as Delhi and Goa in India, Colombo in Sri Lanka, and Kathmandu in Nepal), agricultural employment shares are higher, and services employment shares are lower. This suggests that a continuing process of structural transformation may lift wageseveninSouthAsia’slaggingregions.
Correlates of growth in regional wage premiums: Empirical estimates. The same regression exercise is conducted for average annual growth in regional wage premiums (after controlling for worker characteristics) between
the mid-2010sandthe latestavailable datain the 2020s, controlling for initial regional wage premiums. There is strong evidence of convergence: wage premiums rose significantly faster in regions with initially lower wage premiums (table B2.1.4). Beyond convergence pressures, the same characteristics that were associated with significantly higher levels of regional wage premiums were also associated with significantly higher growth rates of regional wage premiums (figure B2.2.4A). This suggests that self-perpetuating dynamics are working against convergence: those regions that are thriving are pulling further ahead, while those thatarestrugglinglagfurtherbehind.a

a In practice, convergence has been the stronger force in South Asia.

The results suggest that broad-based development policies, such as investment in transport connectivity and education, can help raise wages across the board. But self-reinforcing dynamics suggest that such broad-based policies may particularly benefit regions that are already thriving.
Labor markets in lagging regions can be supported through a combination of broadbased policies, industrial policies that promote specific sectors, or place-based policies (Grover, Lall, and Maloney 2022). For example, industrial policy support can target sectors such as tourism, agribusiness, and low-skilled manufacturing that could attract economic activity into lagging regions (World Bank 2023).

InSouthAsia,however,theexperiencewithsuch policies has been mixed. For example, tax incentivesfor“backward” districtsin fourIndian states did expand the number of light manufacturing firms and did raise employment, but only in the least backward districts and only
for as long as the incentives remained in place. They also lowered economic activity in adjacent, non-backward districts (Hasan, Jiang, and Rafols 2021). While these tax incentives increased firm hiring, they attracted migrants such that neither the employment probability nor wages rose for the average initial resident (Abeberese, Chaurey, and Menon 2026). In contrast, a later tax incentive scheme in two different Indian states promoted employment without triggering migration (Chaurey2017).Evidence fromspecial economic zones in Bangladesh and India suggests that they can attract foreign direct investment, increase firm size, and raise employment and wages. However, the wage benefits may only pertain to higher-skilled workers, and trade facilitation and transport connectivity may yield greaterbenefitsthanfiscalincentives(Galal2024; Hyun and Ravi 2018). In general, policies that target lagging regions require identifying market failures and distortions, addressing the main shortfalls, prioritizing the most viable projects, taking into account private sector interest, and funding them accordingly (Grover, Lall, and Maloney2022).

enterprises that have information gaps and for firms in emerging industries that have no existing trading relations.Colombia and Costa Rica have had some successes in bundling services to provide several forms of market access assistance and in combining the assistance with other export promotion policies (Rodríguez-Álvarez and MongeGonzález 2013). Market access assistance can help maximize the gains from broader trade agreements and ongoing reforms aimed at reducingnon-tariffbarriers(box1.1).
Tradefacilitation measures to reduce customs delays, streamline inspection and documentation protocols, and improve regulatory processes help reduce the time and cost of trade, and improve predictability and transparency.
Quality infrastructure improvements remove information gaps for exporters through standardization and help promote exports. Establishing a well-functioning quality infrastructure system requires government
capacity, including an independent agency for standardization, metrology, and accreditation. e private sector can be involved through public-private partnerships.Indiahasachieved a level of quality infrastructure comparable to the average advanced economy, after efforts to reformthecountry’sstandardssystemtomake it more flexible and responsive to external standards (World Bank 2025e). In Bangladesh, improvements in quality infrastructure—such as stricter factory inspections and safety standards in the garment sector prompted by major industrial failures—have largely been driven by external initiatives(WorldBank2025e).
In South Asia, some of the periods of fastest investment growth have been driven by broad -based improvements in the underlying business environment, regulatory predictability, and state capacity—reinforcing the importance of cross-cutting reforms (Rajagopalan2026).
Improved infrastructure—particularly in transportation networks, logistics systems, electricity reliability, and digital connectivity—is not only sound development policy but also a foundational input for effective industrial parks and economic zones. Better roads, ports, and power systems lower transaction costs, expand market access, and enable lagging regions to integrate into nationalandglobalvaluechains.
A more conducive business environment, through reduced regulatory burdens, streamlined approvals, and improved predictability of administrative processes, can increase the take-up of industrial programs and their success. Excessive compliance
requirements and slow processing times often deter firms from investing or participating in incentive schemes, and they raise uncertainty forbothdomesticandforeigninvestors.
Stronger enabling institutions for implementingindustrialpoliciestypicallyhave three features (Rodrik 2009). First, government agencies are closely embedded with firms and industry associations to ensure rapid, two-way information flows and timely identification of bottlenecks. Second, support combines carrots—such as reliable infrastructure, streamlined public inputs, and coordinated services—with sticks, including sunset clauses and clear, enforceable performance-based conditionalities. ird, robust accountability mechanisms guard against favoritism and elite capture, ensuring that industrial policy remains disciplined, transparent, and aligned with development goals.
e analysis draws on multiple datasets at individual,firm,andsectorlevels.
Industrial policy data. Industrial policy countsarederivedfromthe Global Trade Alert (GTA) database. is is the most widely used database for cross-country comparison of industrial policies. It contains the years of announcement, implementation, and closing for each policy, as well as affected sectors and instrument types of industrial policies implemented in 186 countries, including 149 EMDEs. Depending on the expected impact, GTA classifies policies into those that discriminate against foreign businesses and protect domestic business (“protective
policies”) and those that are conducive to trade(“liberalizingpolicies”).
GTA provides detailed classification of instrument type used in the industrial policy. Policy instruments are grouped into broad categories according to annex table A2.1. For figure 2.2, only several of the broad categories are shown, and the “Other” category includes therest.
To supplement the GTA data, sector level tariff data are drawn from the World Trade Organization (WTO) Analytical Database to quantifyindustrialpoliciesthatrelyonimport tariffs. Subsidies to businesses sourced from the IMF’s Government Financial Statistics (GFS) and the World Bank’s BOOST Open Budget dataset; and tax revenue foregone from the Global Tax Expenditures Database (GTED) are used to quantify industrial policies that rely on subsidies. A database of industries targeted in national development plans in more than 180 countries assembled by Fernandes and Reed (2026) is also used to supplementtheGTAdata.
Employment data. To estimate the sectoral employment intensity of industrial policies, economy-wide employment and real hourly wage data drawn from the World Bank’s Global Labor Database (GLD) are used. e GLD consists of harmonized individual-level labor force surveys for about 30 EMDEs. For the analysis, a sample drawing from surveys for three South Asian countries and five EMDEs during 2022–25 is used—which consists of 80 sectors at the two-digit ISIC level. Annex table A2.2 lists the sample country and survey years. In addition, firmlevel data drawn from the World Bank’s Enterprise Survey for the period 2022–25 are used. Unlike GLD, which consists of all types of employment in all economic sectors, the Enterprise Survey covers only employment in formal firms in about 45 sectors at the two-
digit ISIC level mostly in industrial sectors. But those are also the firms most likely to receive industrial policies. Further, the broader country coverage of the Enterprise Survey—comprising around 70 countries, depending on the variable—allows for a comparison with a larger sample of other EMDEs. e correlation analysis is restricted to non-agricultural sectors only, which leaves 73 sectors from GLD and 45 sectors from Enterprise Survey (original dataset includes onlynon-agriculturalformalfirms).
Trade data. For the analysis of impact of industrial policy on trade, exports, and imports, data are sourced from CEPII BACI database at detailed sector levels, for 229 countries (154 EMDEs) and up to 2023. e advantage of the CEPII BACI database is that it is bilaterally balanced. e downside is that the data coverage is mostly in primary and secondary sectors, with very few services sectorsincluded.
Data merging. For sector level analysis, the industrial policy data are converted to a panel by country, sector, policy, and year. e converted industrial policy data are then merged with employment and trade data at the two-digit ISIC (version 4) level, after necessary conversions from CPC and HS sector codes. Because only countries and sectors with industrial policies show up in the industrial policy data, it is important to distinguish between missing information for a country-sector and a country-sector with no policies in a particular year. It is thus assumed that if a country or sector shows up in the dataset between 2004 and 2025, then whenever the country-sector pair does not appear in a year, it did not have a new industrialpolicy.
For most analyses, only protective policies are used, because these are the majority of the policy measures, and many liberalizing
policies appear to be a reversal or relaxation of previous protective policies. e analyses use the inflow of policies, that is, the count of newly implemented policies, instead of the stock of active policies, because the stock of active policies in the data could be subject to delayinthereportedclosingtime.
Employment shares. e following fixed
effects regressions are estimated for each country and at the two-digit ISIC sector level for the correlation between the sectoral share of new protective industrial policies and the sectoralemploymentshare:
larger share of the country’s total industrial policies.
Firm size and productivity. e following regressions are used to estimate the distribution of industrial policies across sectors, by average firms’ employment size or averagesalesperworker:
IPict is the count of protective industrial policies in sector i in country c, newly implemented in year t, as a share of all protective industrial policies newly implemented in country c in year t. Eict-1 is sector i’s share of country c’s total employment in year t-1. α t is the year fixed effects. βi gives the estimated employment intensity of industrial policies for country i: sectors with 1 percentage point larger employment shares received a β percentage point larger share of the country’s total industrialpolicies.
Hourly wages. Similarly, the following fixed effects regressions are estimated for each country and at the two-digit ISIC sector level for the correlation between the sectoral share of new protective industrial policies and sectoralaveragehourlywage:
IPict = βi ✕ Wict-1 + α t + ϵict .
IPict is similarly defined as before. Wict-1 is the average hourly wage in 2010 U.S. dollar, of sector i in country c. α t is the year fixed effects. Sectors with 10 percent higher average hourly wages received β /10 percentage point
IPict is similarly defined as before. Fict-1 is the log sector average of firms’ employment size or log sales per full-time equivalent worker in 2009 U.S. dollars, in year t-1. α t is the year fixed effects. Sectors with 10 percent larger average firm size (or firm productivity, or firm age) received a β /10 percentage point larger shareofthecountry’stotalindustrialpolicies.
Tradeshares. efollowingpanelfixedeffects regressions are estimated for each country, at thetwo-digitISICsectorandyearlevel:
IPict is similarly defined as before. EXict-1 and IMict-1 are sector i’s share of country c’s total exports and imports in year t-1, respectively. βi EX and βi IM give the export and import intensityofindustrialpoliciesinacountry.
Impact of policy on trade. e following dynamic model is estimated at the country, two-digit ISIC sector, and year level for the impact of industrial policy on sector exports andimports:
Using the local projection method, the above model is estimated over time horizons h from
the year of policy implementation to five years after (h=0, …, 4). Yict+h is the value of exports or imports of sector i of country c at time t+h, where t is the year of policy implementation. Following Rotunno and Ruta (2024), an overlapping structure is used, in which an event is considered to occur when at least one policy is implemented. Dict is a dummy variable that equals 1 in the year when at least one protective policy is implemented in sector i of country c. Ik ict is an indicator for whether otherindustrialpoliciesoftype k (protective, liberalizing) are present. A control for one lagged change of the dependent variable is also included, as well as country-sector fixed effects, country-year fixed effects, and sectoryearfixedeffects.
e country-sector fixed effects absorb any time-invariant determinants of sector-level exports and imports in the country. e country-year fixed effects absorb any country -specific trends, and the sector-year fixed effects absorb global and sector-specific trends. With these fixed effects, the estimated model resembles a difference-indifferences setup. e estimated βh compares the change in trade flows from the year before the policy implementation to h years afterward with changes across the same time horizon for country-sectors without policy implementation. Reported standard errors are clustered at the country-sector level to correctforpotentialserialcorrelation.
e model is estimated separately by policy instruments. For this analysis, export instruments are further separated into export incentives (export subsidies, export tax incentive and other export incentives) and export barriers (all other export instruments). For analysis by policy
instrument, the control sample is still observationswithoutpolicyimplementation.
e sample is restricted to industrial policies thatwereactiveformorethanfiveyears. is restriction allows the analysis to focus on policies that were in place long enough to have an effect,because theeffectofindustrial policies tends to have a dynamic component andcantaketimetomaterialize.Annextable A2.3 summarizes the sample. In particular, 22 percent of country-sector-years in the sample of EMDEs have at least one active protective policy. In about 10 percent of country-sector-years among EMDEs, at least one protective policy started, and in about 17 percent of observations in South Asia at least one protective policy started. Annex table A2.4 reports the estimates for South AsiaandallEMDEsbyinstrumenttype.
e data and methodology have several limitations. First, the industrial policy data are at policy-country-sector level, but it is unclear which firms received or were affected by the policy measure. Second, only direct exposures to industrial policies are considered, while indirect exposures through input-outputlinkagesorpoliciesonthesame sector by trading partners or competitors are not taken into account; refer to Lane (2025) and Machado Parente et al. (2025) for examples in which both input-output linkages and other countries’ policies are considered. ird, the GTA dataset provides the count of industrial policies but not the scale or monetary value of individual policies; for this reason, tariff data and subsidies data are used to supplement the GTAdataset.
Annex Table A2.1 Grouping of policy instruments
Tradedefenseinstruments
Subsidiesandstateaid
Capitalcontrolsandexchange policy
Exportpolicyinstruments
Foreigninvestmentpolicy
Importpolicyinstruments
Laborforcemigrationpolicy
Localizationpolicy
Publicprocurementpolicy
Other
Sources: GTA (database); World Bank. Note: nes = not elsewhere specified.
Anti-dumping;Anti-subsidy;Anti-circumvention;Safeguard;Specialsafeguard
Capitalinjectionandequitystakes(includingbailouts);Financialassistanceinforeignmarket;Financial grant;In-kindgrant;Interestpaymentsubsidy;Loanguarantee;Pricestabilization;Productionsubsidy; Stateaid,nes;Stateaid,unspecified;Stateloan;Taxorsocialinsurancerelief
Controlsoncommercialtransactionsandinvestmentinstruments;Controlsoncreditoperations;Trade finance;Tradepaymentmeasure;Repatriationandsurrenderrequirements;Competitivedevaluation; Controlonpersonaltransactions
Exportban;Exportlicensingrequirement;Exportquota;Exportsubsidy;Exporttax;Export-relatednontariffmeasure,nes;Otherexportincentive;Tax-basedexportincentive;Exporttariffquota;Foreigncustomerlimit;Exportpricebenchmark
FDI:Entryandownershiprule;FDI:Financialincentive;FDI:Treatmentandoperations,nes
Importban;Importincentive;Importlicensingrequirement;Importquota;Importtariff;Importtariffquota; Import-relatednon-tariffmeasure,nes;Internaltaxationofimports;Importmonitoring;Importprice benchmark;Minimumimportprice;Otherimportcharges
Labormarketaccess;Post-migrationtreatment
Localcontentincentive;Localcontentrequirement;Locallaborincentive;Localoperationsrequirement; Localsupplyrequirementforexports;Localvalueaddedincentive;Localization,nes;Locallaborrequirement;Localoperationsincentive;Localvalueaddedrequirement
Publicprocurementaccess;Publicprocurementlocalization;Publicprocurement,nes;Publicprocurementpreferencemargin
Instrumentunclear;Intellectualpropertyprotection;Technicalbarriertotrade;Tradebalancingmeasure; Distributionrestriction;Portrestriction
Sources: GLD (database); World Bank.
Annex Table A2.3
Sources: CEPII BACI (database); GTA (database); World Bank.
Annex Table A2.4 Estimation results for the impact of industrial policy on exports and imports for South Asia and all EMDEs
T B. Domestic subsidies and state aid
T C. Export incentives
T D. Public procurement
Sources: CEPII BACI (database); GTA (database); World Bank.
Note: Impulse response function from a local projection estimation of cumulative changes in log imports or exports on a dummy variable for the implementation of a protective industrial policy. T=0 is the first period after policy implementation. Estimation includes controls for the presence of other active industrial policies in the same country and sector. Country-sector, country-year, and sector-year fixed effects are included. Sectors are at the 2-digit ISIC v4 level. Standard errors are clustered at country-sector level. The 90 percent confidence interval reported in brackets. Bolded numbers are significant at the 10 percent level. Sample includes protective industrial policies implemented between 2004 and 2023 that were active for more than five years. Estimates show the change in the affected sector’s imports after the introduction of trade defense instruments (panel A), domestic subsidies (panel B), export incentives (panel C), or public procurement measures (panel D). Trade defense instruments include anti-dumping, anti-subsidy, and other safeguards. Domestic subsidies also include state aid. Export incentives include export subsidies, export tax incentives, and other export incentives. Public procurement policies include procurement preference margins and procurement localization. Estimates are reported for South Asia only or for all EMDEs.
Annex Table B2.1.1 Summary of reviewed papers
International spillovers from robot adoption and other types of automation in advanced economies
Artuc, Christiaensen, and Winkler (2019) Mexico,2004–14
Difference-in-differences regressionwithlocallabor marketshift-shareexposuremeasure
Artuc, Bastos, and Rijkers (2023) Cross-countrytrade data,1995–2015 IVpanelregression
Onerobotper100workersintheUnitedStateslowered growthinMexico'sexportsperworkertotheUnitedStatesby 6.7percent,andreducedemploymentinMexicanareasmost exposedtoU.S.robots,withoffsettingpositiveimpactson employmentinotherareas.
Robotadoptioninadvancedeconomiesincreasedtheir EMDEimportsandexports.Thisisexplainedbyamodel featuringtwo-stageproductionandtradeinintermediateand finalgoodsinwhichrobotscantakeoversometaskspreviouslyperformedbyhumansinasubsetofindustries
Betai and Chen (2025) Globaljobsplatforms,2022–24
Bonfiglioli et al. (2022) U.S.,1990–2015
Cilekoglu, Moreno, and Ramos (2024) Spain,2006–16
DeStefano and Timmis (2024) 100countries,2000–15
Díaz Pavez and Martínez-Zarzoso (2024) TenEMDEs,2008–14
Faber (2020) Mexico,1990–2015
Difference-in-differences regressionandevent study
Difference-in-differences regressionswithlocal labormarketshift-share exposuremeasure
IVpanelregression
Difference-in-differences IVpanelregression
IVPanelregressionswith shift-shareindexofexposure.
Difference-in-differences regressionwithlocallabor marketshift-shareexposuremeasure.
Fontagné et al. (2024) 14Europeancountries,1999–2011 IVpanelregression
Freund, Mulabdic, and Ruta (2022) Cross-countrytrade data,1995–2015.
Hallward-Driemeier and Nayyar (2025)
Cross-countrydata, 2004–15.
Krenz, Prettner, and Strulik (2021) 43countries,2000–14
Difference-in-differences regression;synthetic control
Difference-in-differences regression
GenAIsignificantlyreducedinternationalserviceoutsourcing toEMDEsononlinejobsplatforms.Demandshiftedtoward higher-value,morecomplextasks,withfewerbuthighervaluejobs.WorkersadaptedbyreskillinginAI-exposedand AI-complementarydomains.
RobotautomationdisplacedU.S.workersbutalsoreduced offshoringfromtheUnitedStates,withitsnegativeemploymenteffectsconcentratedinnon-offshorableoccupations.
Robotsincreasedintermediateinputpurchasesfromforeign suppliersamongSpanishfirms.
Robotadoptionamongforeigncustomersledtorobotadoptionathome;robotsincreasedexportquality,especiallyin EMDEs.
Foreignrobotadoptionnegativelyaffectedemploymentin emergingcountries,witheffectsconcentratedinsectorsmost exposedtoautomation.
U.S.robotadoptionhadsizablenegativeimpactonemploymentandexportsinMexico,withemploymentimpacts strongeramongmenandlow-educatedmachineoperators.
RobotadoptionincreasedupstreamGVCparticipation,which reducedlaborsharesinincome.
Exportsofhearingaidsincreasedbyroughly80percent followingtheintroductionof3-Dprinting.Thereisnoevidenceofnolocalizationofproductionaftertheintroductionof 3-Dprinting.
Theintensityofrobotuseinadvancedeconomieswaspositivelyassociatedwithgrowthingreenfieldforeigndirectinvestment(FDI)announcementsfromadvancedeconomiesto EMDEsbetween2004and2015.Pastathreshold,however, increasedrobotizationinadvancedeconomiesisnegatively associatedwiththisFDIgrowth.
IVpanelregression
Onaverage,withinmanufacturingsectors,anincreaseofone robotper1,000workerswasassociatedwitha3.5percent increaseofreshoringactivity.
Citation Sample
Kugler, Kugler, Ripani, and Rodrigo (2020)
Stapleton and O’Kane (2021)
Stapleton and Webb (2020)
Colombia, 2011–16
U.K., 2012–17
Methodology
Difference-in-differences regression with local labor market shift-share exposure measure
Difference-in-differences regression
Spain, 1990–2016 IV panel regression
Stemmler (2023) Brazil, 1994–2014
Difference-in-differences regression with local labor market shift-share exposure measure
Impacts of robot adoption on advanced-economy firms and jobs
Acemoglu and Restrepo (2020)
U.S., 1993–2014.
Acemoglu, Lelarge, and Restrepo (2020) France, 2010–15
Bonfiglioli et al. (2024) France, 1994–2013
Dauth et al. (2021) Germany, 1994–2014
Difference-in-differences regression with local labor market shift-share exposure measure
Long differences firm-level regression
Long differences panel model exploiting baseline variation in robot exposure
Difference-in-differences regression with local labor market shift-share exposure measure
Deng et al. (2023) Germany, 2014–18 Firm-level panel event study
Graetz and Michaels (2018)
17 countries, 1993–2007 IV panel regression
Koch, Manuylov, and Smolka (2021) Spain, 1990–2016
Stiebale, Suedekum, and Woessner (2024)
Six European advanced economies, 2000–06
Xie, Guo, and Chen (2025) China, 2006–15
Zhang, Chen, and Wei (2025) China, 2000–13
Comment
U.S. robots decrease employment and earnings for Colombian workers, with disproportionate impacts on areas exporting to the United States and on women, older workers, small enterprises and manufacturing. U.S. robots cause an estimated cumulative loss of 63,000–100,000 jobs in Colombia during the study period.
The demand for machine learning (ML) skills increased in local labor markets in the United Kingdom that were more exposed to ML automation. ML deployment has led to an increase in services offshoring, particularly to lower-income countries, rather than high-income countries.
Robot adoption in Spanish firms increased their imports from, and number of affiliates in, lower-income countries. It decreased the share of imports from lower-income countries for firms that were already offshoring to the latter.
Foreign automation decreased exports and the share of manufacturing employment, and increased the share of employment in the mining sector in exposed local labor markets.
One more robot per thousand workers reduced the employment-to-population ratio by 0.2 percentage points and wages by 0.42 percent in local U.S. labor markets.
Robot adopting firms experienced significant declines in labor shares and increases in value added and productivity. They expanded their overall employment, but at the expense of competitors, leading to an overall negative association between adoption and employment.
Firms facing larger positive demand shocks adopted more robots. Firms that were more exogenously exposed (that is, suited) to robot automation experienced significant job losses and increases in robot usage and labor productivity
Robot adoption led to reduced manufacturing jobs. However, this was fully offset by increased, higher-quality service sector jobs. The incidence of labor market disruption was higher among younger workers.
Robot adoption increased turnover among female employees, with modestly positive net impacts on female employment in German firms.
Increased robot use contributed about 0.36 percentage points to annual labor productivity growth, while raising total factor productivity and lowering output prices.
Firm-level panel differencein-differences combined with a propensity score reweighting estimator
Panel regression with TFP estimated using a semiparametric control function approach
Event study difference-indifferences using firm-level panel data
Firm-level panel regression with firm fixed effects
Better performing firms were more likely to adopt robots. Causal estimates suggest that robot adoption increased output by 20-25 percent and employment by 10 percent over four years.
Industries with higher robot adoption rates experienced a disproportionate increase in productivity among more productive firms, and a decrease in the labor share
Automation among Chinese firms was associated with increased GVC participation and productivity improvements.
Firm-level robot adoption was associated with significant increases in productivity and export sophistication
is study combines multiple data sources to characterize AI exposure, firm-level AI adoption, labor demand, and GVC linkages involving Indian firms. e core datasets include occupational AI exposure and complementarity indices, online job postings data, firm-level global supply chain relationships, and country-level AI adoption metrics. ese datasets are linked at the occupation, firm, and country levels to study how AI exposure propagates through firms andinternationalproductionnetworks.
AI exposure and human–AI complementarity
Occupational exposure to AI is measured using the AI Occupational Exposure (AIOE) indicesdevelopedbyFelten,Raj,andSeamans (2021, 2023). ese indices quantify the extent to which the abilities required for a given occupation overlap with the capabilities of existing AI systems. Exposure is initially measured at the U.S. Standard Occupational Classification (SOC-10) level using task- and ability-level data from the Occupational Information Network (O*NET), a comprehensive database maintained by the U.S. Department of Labor. SOC-level exposure scores are then mapped to four-digit ISCO occupations using a standard crosswalk and averaged across all SOC occupations correspondingtoagivenISCOcode.
e exposure indices are computed separately for text- and image-based generative AI systems, then averaged and standardized across occupations. e resulting index is expressedinstandarddeviationsrelative to the median occupation, with higher values indicating greater potential overlap between occupational tasks and AI capabilities. ese standardized indices are used throughout the descriptive analysis of occupational exposure
patterns. Similarly, these exposure indices can beaggregatedattheindustryleveltoconstruct the AI Industry Exposure (AIIE) index for 4digit North American Industry Classification System(NAICS)codes.
To distinguish between occupations where AI is likely to substitute for labor versus augment it, the analysis incorporates measures of human–AI complementarity developed by Pizzinellietal.(2023). esemeasurescapture the extent to which human input remains essential in an occupation even when certain tasks can be automated. Complementarity is derived from O*NET “work context” variables that describe cross-cutting job characteristics such as interpersonal interaction, decision-making responsibility, task criticality, routine content, physical conditions, and skill requirements. Relevant work contexts are grouped into six dimensions—communication, responsibility, physical conditions, criticality, routine, and skill requirements—and aggregated into a composite index normalized to range between zero and one, with higher values indicating greater reliance on human judgment or interaction.
Using this complementarity index, a complementarity-adjusted exposure measure (C-AIOE) is constructed by scaling down the unstandardized AIOE score by the complementarity parameter. A higher CAIOE score therefore indicates an occupation that is more easily substituted by AI. e analysis uses standardized AIOE measures when describing broad exposure patterns and reliesontherawAIOEandC-AIOEmeasures when explicitly analyzing substitution versus augmentationdynamics.
Online job postings and firm-level measures
Firm-level labor demand is measured using online job postings data from Lightcast, a
labor market analytics firm that aggregates vacancies from major online job platforms.
e dataset covers about 25,454,327 job postings in South Asia between January 2020 and March 2025, originating from 437,300 unique firms. Each posting reports required skills—including digital and AI-related skills such as machine learning, neural networks, and natural language processing—as well as occupation (four-digit ISCO), sector (2-digit NAICS),location,and,forroughly16percent ofpostings,apostedsalary.
e Lightcast data are heavily skewed toward urban,high-skill,white-collaroccupationsand therefore representanarrowsegmentofSouth Asia’s labor market (annex table B2.1.2). Consequently, results based on job postings should be interpreted as applying primarily to formal-sector, white-collar employment. To facilitate firm-level analysis, job postings are collapsed to the firm–month level, generating measures of total job postings, AI-related postings, and the average AI exposure and complementarity of jobs posted in each month. In addition, pre–generative AI baseline measures are constructed of the average exposure and complementarity of all jobs posted during the pre-ChatGPT period (August2020–November2022).
Firms’ headquarters and ownership characteristics are inferred using a large language model (LLM)–based classification pipeline. Using the Gemini 2.5 Flash-Lite model accessed via API, firms’ names are queried to generate structured outputs identifying country of incorporation, primary country of operations, public versus private status, listing status in the South Asian country, and indicators of foreign ownership. API calls are executed in parallel with retry logic and periodic checkpointing to ensure reproducibility. is process identifies 75,821 firms—about 17 percent of all firms in the Lightcast sample—whose primary operations are located outside South Asia. ese firms
constitute the multinational subsample used intheanalysis.
To measure firms’ participation in global value chains, the analysis uses firm-level relationship data from FactSet, a global corporate data provider. e FactSet dataset includes time-varying buyer, supplier, and strategic partnership relationships among firms worldwide. e initial FactSet sample contains 38,519 South Asian firms, of which 9,659 are observed to have at least one international relationship between April 2003 and August 2025. ese relationships span a wide range of sectors in both manufacturing and services, with particularly strong representation in automotive components and software-related industries (annex table annex table B2.1.3). International partners of South Asian firms tend to be based in advanced economies in Europe and North America, as well as in China (annex table B2.1.4 and B2.1.5).
For each international relationship, the AI exposure ofthe foreign partnerismeasuredby merging the partner’s 4-digit NAICS industry code with sector-level AI exposure indices fromFeltenetal.(2023),averagedacrosstextand image-based AI. Firm-level measures of GVC exposure include indicators for any international connection, the number of connections, and the average AI exposure of connected partners. ese measures are constructed separately by relationship type (supplier, customer, partner) and by period relative to the introduction of generative AI (before vs. after ChatGPT’s November 2022 release).
South Asian firms in FactSet are linked to Lightcast firms using a two-stage fuzzy matching algorithm based on company names. e first stage generates candidate matches using MinHash locality-sensitive
hashingtoidentifyfirmswithhightoken-level Jaccard similarity. e second stage refines matches using normalized Levenshtein edit distance to account for spelling and formatting differences. Using this approach, 9,646 Lightcast firms are successfully matched to FactSet firms, of which 4,532 have international connections, representing about 47 percent of internationally connected FactSetfirms. eresultingfirm–monthpanel contains 2.86 million observations, with about 3 percent corresponding to internationally connected firms. However, these firms are disproportionately large, and account for nearly 8 percent of all jobs posted during the period. Since the largest, most productive firms export, they are likely to comprise an even larger share of total valueadded.
is merged dataset is subject to selection concerns. Not all internationally connected firms post vacancies online, and not all firms appearing in Lightcast are covered by FactSet. Both datasets disproportionately cover larger firms with stronger public reporting, and no quantitative information is available on the economic size or intensity of individual GVC relationships, limiting the ability to measure tradevolumesdirectly.
Country-level AI adoption is measured using data from the Anthropic Economic Index, whichcovers197countriesasofAugust2025. e index reports the number of unique users of Anthropic’s Claude models per 100,000 inhabitants. Using internal classification of user interactions, queries are categorized as primarily augmentative or automated in nature. ese metrics are used to characterize AI adoption levels and usage patterns in countries that are strongly connected to India through GVCs, as identified in the FactSet data.
AkeylimitationofthismeasureisthatClaude models are less widely adopted than consumer -facing systems such as ChatGPT and tend to be used disproportionately by software developers and enterprise users. As a result, absolute adoption levels may not be directly comparable to other AI platforms. Nevertheless, the data are likely to capture meaningful cross-country variation in AI adoption intensity and usage patterns relevant for firms operating in international productionnetworks.
Post-GPT Pre-
Sources: FactSet (database); Felten, Raj, and Seamans (2023); Lightcast (database); Pizzinelli et al. (2023); World Bank.
Note: Standard errors in parentheses clustered at the firm level. All models include firm and month fixed effects.
Sources
Annex Table B2.1.8 Spillover effects of foreign buyer exposure by
Sources: FactSet (database); Felten, Raj, and Seamans (2023); Lightcast (database); Pizzinelli et al. (2023); World Bank.
Annex Table B2.1.9 Long-difference
Sources: FactSet (database); Felten, Raj, and Seamans (2023); Lightcast (database); Pizzinelli et al. (2023); World Bank. Note
Sources: FactSet (database); Felten, Raj, and Seamans (2023); Lightcast (database); Pizzinelli et al. (2023); World Bank. Note: Standard errors in parentheses clustered at the firm level. All models include firm and month fixed effects.
is chapter studies how firms’ exposure to artificial intelligence affects labor demand, skill composition, and international engagement, and how these effects vary by firm type and GVC position. e empirical strategy combines firm-level panel regressions with heterogeneity analyses and spillover tests based on firms’ pre–Generative AI exposure and the AI exposure of their international partners. All analyses are conducted at the firm-month level using job postings data from January2020toMarch2025.
A key feature of the strategy is that all measures of AI exposure and complementarity on the right-hand side are fixed at pre-GPT levels (August 2020–November 2022). is mitigates concerns that firms adjust their occupational mix, partner composition, or product scope endogenously in response to AI
adoption, which would mechanically contaminate contemporaneous exposure measures.
Main effects and heterogeneity by firm type
e first set of analyses estimates the relationship between AI exposure and firmlevel outcomes, allowing effects to vary by firm type. Outcomes include the logarithm of total job postings, the share of postings requiring AI-related skills, and the average AI exposure and complementarity of posted jobs. For firm i in month t, the baseline specificationis:
where AIOEi pre denotes the firm’s average occupational AI exposure prior to the introduction of generative AI, computed from
pre-GPT job postings. Firm types k distinguish: (i) purely local (domestic) firms, (ii) domestic firms which are GVC suppliers, and (iii) foreign-owned or multinational affiliate firms. All specifications include firm fixed effects α i, month fixed effects δt, and standarderrorsclusteredatthefirmlevel.
is heterogeneity structure is motivated by differences in adjustment margins available to different firm types. Multinational firms may adopt new technologies more rapidly than Indian firms and can reallocate production across borders at relatively low cost, potentially amplifying both adoption and employment responses. Domestic firms may respond more through changes in skill composition,particularlythoseintegratedinto international value chains, where competitive pressureanddisplacementrisksarehigher.
Spillovers from AI exposure of foreign buyers
e analysis further examines spillover effects arising from firms’ exposure to highly automatable foreign buyersbyfocusingon the subsampleofSouthAsianGVCsuppliers. e core hypothesis is as follows. Foreign buyers that operate in highly exposed sectors have a strong incentive to adopt AI, independent of their relationship with Indian exporters. In turn, Indian firms supplying these foreign buyers may therefore experience downstream employment and adoption effects. ere are three possible channelsforthisspillovereffect: (i) through reshoring and displacement among clients; (ii) via technology transfer from AI-adopting clients; or (iii) via increased demand for their products from more productiveAI-adoptingclients.
For exporting Indian firms, the following specificationisestimated:
yit = βpostGPTt ✕ BuyerExposurei pre + λpostGPTt ✕ AIOEi pre + α i + δt + εit ,
where BuyerExposurei pre is the average preGPT AI exposure of the firm’s foreign buyers, measured using industry-level exposure indices. Firm-level occupational exposure AIOEi pre is also included as a control to isolate partner-driven effects, as firms’ AI exposure maybecorrelatedalongasupplychain.
Identification of β relies on variation across exporting firms in the AI exposure of their buyers, driven by differences in buyer sector andcountrycomposition. ekeyassumption is that buyers’ incentives to adopt AI are determined by their own technological opportunities rather than by bilateral relationships with Indian suppliers, and unrelated to trends in firms’ outcomes among their Indian suppliers. To further probe mechanisms, the sample is split by firms’ preGPT complementarity. If displacement dominates, negative employment effects should be larger among low-complementarity firms whose activities are easier for clients to automate or reshore. Additional tests using alternative outcomes (such as AI skill adoption) help distinguish displacement from puretechnologytransfer.
Finally, the analysis estimates a binned scatterplot of the log difference in the total number of jobs posted by a firm before and after the introduction of ChatGPT in November 2022, at 20 quantiles of the distribution of buyer exposure, with a linear fit estimated on the underlying data. e sample is split based on the South Asia GVC supplier’s pre-GPT product-level AI exposure: if the negative effect of buyer exposure on hiringisdrivenbyreshoring,thenitshouldbe concentrated among GVC suppliers producinghighlyexposedproductcategories.
Data
DatafromtheGlobalLaborDatabase (GLD), supplemented with other datasets, are used to analyze the relationship between labor market outcomes and regional characteristics. Annex table B2.2.1 presents the list of countries and survey years used in the analysis. Infrastructure data at the subnational level comefromStraubetal.(forthcoming).
Methodology
e following equation is estimated to compare trends in regional wages. For each year of the survey, the following equation is separatelyestimated:
Logwageji = α i + βXji + ϵji (1),
where Logwageji is the log real hourly wage of individual j in region i. e hourly wage from each survey year is adjusted using each country’sCPI,with2010asthebaseyear,and then converted into U.S. dollars. Individual characteristics, Xji include experience, experience squared, indicators for education level, male, urban, sector, and high skill. α i, the regional fixed effects, capture the regional wage premium or penalty after controlling for workercharacteristics.Allanalysisincludesthe survey weight, and standard errors are clustered at the regional level. Results can be foundinannextableB2.2.2.
e following equation isestimatedto analyze the association between the estimated regional
fixed effects in equation (1) and regional characteristics:
wageic = βXic + αc + ϵic ,
where wageic is the fixed effect for region i from the first-stage worker-level regression for country c around the year 2020. Xic includes labor market or spatial characteristics in the region. Country-year fixed effects, αc, are included to absorb country-level effects, including exchange rates and prices, with standard errors clustered at the country level. Another specification includes an interaction term between regional characteristics and an indicator for South Asia to explore potential heterogeneity in South Asia. e results are showninannextableB2.2.3.
A similar regression is run where the dependentvariableisregionalwagegrowth:
Δwageic = βX0ic + αc + ϵic ,
where Δwageic is the change in regional wage premiums between the mid-2010s and the latest available data in the 2020s for region i in country c X0ic includes labor market or spatialcharacteristicsinthe regioninthe mid2010s, except for infrastructure variables, which are only available in the 2020s. Country-year fixed effects, αc, are included to absorb country-level effects, including exchangeratesandprices,withstandarderrors clustered at the country level. Another specification includes an interaction term between regional characteristics and an indicator for South Asia to explore potential heterogeneity in South Asia. e results are showninannextableB2.2.4.
Country Year(s)
Armenia 2014,2023
Bangladesh 2010,2013,2015–2016,2022
Bhutan 2024
Bolivia 2023
Brazil 2008,2009,2011–2013,2015–2020,2022
Chile 2017
Colombia 2012,2021
Georgia 2010–2023
Ghana 2012
India 2009,2011,2017–2019,2021–2023
Indonesia 2024
Maldives HouseholdIncome andExpenditureSurvey 2019
Mexico 2008–2023
Mongolia 2008,2010–2019.2021–2022
Nepal 2008,2017
Pakistan 2012,2020
Philippines 2008–2009,2011–2022
Russia 2020
Rwanda 2021
SouthAfrica 2010,2020
Sri Lanka 2008,2011–2015,2019–2023
Thailand 2008,2010,2012,2014,2016–2021
Türkiye 2009,2019
VietNam 2022
Zambia 2012,2022
Sources: GLD (database); Maldives Ministry of National Planning 2019; World Bank.
Description
Theselaborforcesurveysarenationally representativeandhavebeen harmonizedusingtheGlobalLabor Database.
Keyvariablesinclude:
-Sectorindicatorsincludeagriculture, industry,andservices.
-High-skilledworkersaredefinedas professionals,managers,and technicians.
-Educationalattainmentincludesfour categories:lessthanprimaryeducation, primaryeducation,secondaryeducation, andpost-secondaryeducation.
-Potentialexperienceisdefinedasage minusyearsofeducation,assumingan entryageof6forstartingprimaryschool.
-Firmsizeisavailableforsomeyearsfor somecountries.Anindicatorfor20and moreworkersisgeneratedbasedonthe self-reportednumberofworkersor ranges.
-Urbanresidenceandsexcomedirectly fromthesurveys.
Samplerestriction:
Theanalysisisrestrictedtotheworkingagepopulationaged15andabovewho arewageearners.
Note: Countries listed in bold are South Asian countries. Mid-2010s data are 2013 for Colombia and Ghana; 2014 for Armenia; 2015 for Georgia and Sri Lanka; 2016 for Bangladesh, Brazil, Mexico, Mongolia, the Philippines, and Thailand; 2017 for Chile and India; and 2019 for Türkiye. The Maldives does not have a labor force survey but the Household Income and Expenditure Survey (HIES) includes a labor module that has sector and occupation data at the 2-digit level. Demographic characteristics, such as education and age, are available. The HIES is nationally representative. The sample is restricted to monthly wage earners aged 15 and above.
Panel B. Bhutan
-2.509*** (0.067) GelegphuThromde -2.517*** (0.073) Haa -2.729*** (0.065)
Lhuentse -2.315*** (0.057) Monggar -2.249*** (0.064)
Paro -2.118*** (0.058)
PemaGatshel -2.540*** (0.058)
PhuentshoglingThromde
Punakha -2.313*** (0.060)
SamdrupJongkhar -2.253*** (0.060)
SamdrupJongkharThromde -2.381*** (0.068)
Samtse -2.299*** (0.063)
Sarpang -2.301*** (0.068)
Thimphu -1.922*** (0.050)
ThimphuThromde -2.115*** (0.069)
TrashiYangtse -2.315*** (0.063)
Trashigang -2.475*** (0.062)
Trongsa -2.350*** (0.054)
Tsirang -2.392*** (0.068)
Zhemgang
WangduePhodrang -2.258*** (0.058) -2.372*** (0.063)
Observations
R-squared
Meanlogwage
Chhattisgarh
DhaaluAtoll
FaafuAtoll
GaafuAlifAtoll
GaafuDhaaluAtoll
HaaAlifAtoll
HaaDhaaluAtoll
LaamuAtoll
LhaviyaniAtoll
RaaAtoll
SeenuAtoll
ShaviyaniAtoll
(0.144)
(0.139)
(0.129)
(0.137)
(0.138)
(0.135)
(0.151)
(0.168)
Observations
Sources: GLD (database); Maldives Household Income and Expenditure Survey 2019; World Bank.
Note: All analysis included experience, experience squared, indicators for education level, male, urban, sector, and high skill, weighted using the survey weight. Standard errors (in parentheses) are clustered at the regional level. * p<0.10, ** p<0.05, *** p<0.01.
Shareofworkersinfirmswithmorethan20employees(percent)
Railvalue(U.S.dollars,logarithm)
Raillength(km,logarithm) 0.022 -0.003 (0.017) (0.061) 0.029* 0.012 (0.013) (0.053)
Sources: GLD (database); Maldives Household Income and Expenditure Survey 2019; World Bank.
Note: Each row in column 1 presents the coefficient of a panel regression of regional wage premiums (that is, regional fixed effects from a first-stage regression) on region characteristics. Each row in column 2 presents the coefficient of a panel regression of regional wage premiums (that is, regional fixed effects from a first-stage regression) on region characteristics interacted with an indicator for South Asia. Country fixed effects are included. Standard errors (in parentheses) are clustered at the country level. * p<0.10, ** p<0.05, *** p<0.01.
Annex
Growth
and
Shareofworkersinfirmswithmorethan20employees(percent)
Railvalue(U.S.dollars,logarithm)
Sources: GLD (database); Maldives Household Income and Expenditure Survey 2019; World Bank.
Note: The dependent variable is regional wage premium growth (that is, regional fixed effects from a first-stage regression) between available mid-2010s data point and latest 2020s data. Each row presents the coefficient on lagged region characteristic (column 1) and lagged wage premium (column 2). Each row in column 3 presents the coefficient on a regression that includes region characteristics interacted with an indicator for South Asia, controlling for lagged wage premium. Country fixed effects are included. Standard errors (in parentheses) are clustered at the country level. * p<0.10, ** p<0.05, *** p<0.01.
Abeberese, A. B., R. Chaurey, and R. Menon. 2026. “Place-Based Policies and Migration: Evidence from India.” World Bank Economic Review 40(1):82–104.
Acemoglu, D., C. Lelarge, and P. Restrepo. 2020. “Competing with Robots: Firm-Level Evidence from France.” AEA Papers and Proceedings 110(May):383–88.
Acemoglu, D., and P. Restrepo. 2020. “Robots and Jobs: Evidence from US Labor Markets.” Journal of Political Economy 128 (6):2188–244.
Acosta,P., Ç.Özden,J.Lebow,L.Rodriguez, and E. Dahlgren. 2025. Global Skill Partnerships for Migration: Preparing Tomorrow’s Workers for Home and Abroad. Washington,DC:WorldBank.
Advocata. 2022. e State of State Owned Enterprises 2022. Colombo, Sri Lanka: Advocata.
Aghion,P.,J.Cai,M.Dewatripont,L.Du,A. Harrison, and P. Legros. 2015. “Industrial Policy and Competition.” American Economic Journal:Macroeconomics 7(4):1–32.
Alkon, M. 2018. “Do Special Economic Zones Induce Developmental Spillovers? Evidence from India’s States.” World Development 104:396–409.
Altenburg, T., and D. Rodrik. 2017. “Green Industrial Policy: Accelerating Structural Change TowardsWealthyGreen Economies.”
In Green Industrial Policy: Concept, Policies, Country Experiences, 1–20. Geneva, Bonn: UN Environment; German Development Institute.
Artuc, E., L. Christiaensen, and H. Winkler. 2019. “Does Automation in Rich Countries
Hurt Developing Ones? Evidence from the U.S. and Mexico.” Policy Research Working Paper8741,WorldBank,Washington,DC.
Artuc, E., P. Bastos, and B. Rijkers. 2023. “Robots, Tasks, and Trade.” Journal of International Economics 145 (November): 103828.
Banga, A. 2026. “How to Create Jobs for the World’s 1.2 Billion New Workers.” Bloomberg. February 11, 2026. https:// www.bloomberg.com/opinion/articles/202602-11/how-to-create-jobs-for-the-global-south -population-boom.
Bartz, K., and N. Fuchs-Schündeln. 2012. “ e Role of Borders, Languages, and Currencies as Obstacles to Labor Market Integration.” European Economic Review 56 (6):1148–63.
Bathelt, H., M. Buchholz, and M. Storper. 2024. “ e Nature, Causes, and Consequences of Inter-Regional Inequality.” Journal of Economic Geography 24 (3): 353–74.
Betai, N., and M. Chen. 2025. “Automation without Borders: Generative AI and CrossBorder Service Outsourcing.” Working Paper. GeorgeWashingtonUniversity.
Bonfiglioli, A., R.Crinò,H. Fadinger, and G. Gancia. 2024. “Robot Imports and FirmLevel Outcomes.” e Economic Journal 134 (664):3428–44.
Bonfiglioli, A., R. Crinò, G. Gancia, and I. Papadakis. 2022. “Robots, Offshoring, and Welfare.” In Robots and AI, edited by L. Y. Ing and G. M. Grossman. London: Routledge.
Bonfiglioli, A., R. Crinò, G. Gancia, and I. Papadakis. 2025. “Artificial Intelligence and Jobs: Evidence from US Commuting Zones.” EconomicPolicy 40(121):145–94.
Buchholz, M. 2025. “Does Urbanization Increase Inequality? Race, Gender, and the Urban Wage Premium.” Journal of Urban Affairs 47(6):1923–41.
CareEdge Ratings. 2025. “PLI Scheme: A Mixed Bag with 12% Disbursement of Incentives.”CareEdgeRatings,Mumbai.
Chaurey, R. 2017. “Location-Based Tax Incentives: Evidence from India.” Journal of PublicEconomics 156(December):101–20.
Choi, J., and A. A. Levchenko. 2025. “ e Long-Term Effects of Industrial Policy.” Journal of Monetary Economics 152 (C): 103779.
Cilekoglu, A. A., R. Moreno, and R. Ramos. 2024. “ e Impact of Robot Adoption on Global Sourcing.” Research Policy 53 (3): 104953.
Combes, P.-P., G. Duranton, and L. Gobillon. 2008. “Spatial Wage Disparities: Sorting Matters!” Journal of Urban Economics 63(2):723–42.
Criscuolo,C.,N.Gonne,K.Kitazawa,andG. Lalanne. 2022. “Are Industrial Policy Instruments Effective? A Review of the Evidence in OECD Countries.” OECD Science, Technology and Industry Policy Papers 128, Organisation for Economic CooperationandDevelopment,Paris.
Dauth, W., S. Findeisen, J. Suedekum, and N. Woessner. 2021. “ e Adjustment of Labor Markets to Robots.” Journal of the European Economic Association 19 (6): 3104–53.
Defever, F., J.-D. Reyes, A. Riaño, and G. Varela. 2020. “All ese Worlds are Yours, Except India: e Effectiveness of Cash Subsidies to Export in Nepal.” European EconomicReview 128(September):103494.
Deng, L., S. Müller, V. Plümpe, and J. Stegmaier. 2023. “Robots and Female
Employment in German Manufacturing.” AEA Papers and Proceedings 113 (May): 224–28.
Deringer,H.,F.Erixon,P.Lamprecht,andE. Van der Marel. 2018. “ e Economic Impact ofLocalContentRequirements:ACaseStudy of Heavy Vehicles.” European Centre for International Political Economy Occasional Paper1/2018.
DeStefano, T., and J. Timmis. 2024. “Robots and Export Quality.” Journal of Development Economics 168(May):103248.
Díaz Pavez, L. R., and I. Martínez-Zarzoso. 2024. “ e Impact of Automation on Labour Market Outcomes in Emerging Countries.” eWorldEconomy 47(1):298–331.
Evenett, S., A. Jakubik, F. Martin, and M. Ruta. 2024. “ e Return of Industrial Policy in Data.” IMF Working Paper 2024/1, International Monetary Fund, Washington, DC.
Faber, M. 2020. “Robots and Reshoring: Evidence from Mexican Labor Markets.” Journal of International Economics 127 (November):103384.
Felten, E., M. Raj, and R. Seamans. 2021. “Occupational, Industry, and Geographic Exposure to Artificial Intelligence: A Novel Dataset and Its Potential Uses.” Strategic ManagementJournal 42(12):2195–217.
Felten, E., M. Raj, and R. Seamans. 2023. “Occupational Heterogeneity in Exposure to Generative AI.” SSRN Working Paper 4414065, Social Science Research Network, Rochester,NY.
Fernandes, A. M., and T. Reed. 2026. Industrial Policy for Development: Approaches in the 21st Century. Policy Research Report. Washington,DC:WorldBank.
Ferraz, C., F. Finan, and D. Szerman. 2015. “Procuring Firm Growth: e Effects of
Government Purchases on Firm Dynamics.” NBER Working Paper 21219, National Bureau of Economic Research, Cambridge, MA.
Fontagné, L., A. Reshef, G. Santoni, and G. Vannelli. 2024. “Automation, Global Value ChainsandFunctionalSpecialization.” Review ofInternationalEconomics 32(2):662–91.
Freund,C.,A.Mulabdic,andM.Ruta.2022. “Is3DPrintinga reattoGlobalTrade? e Trade Effects You Didn’t Hear About.” Journal of International Economics 138 (September):103646.
Galal, R. 2024. “Place-Based Preferential Policies and Firm Performance.” Policy Research Working Paper10781,WorldBank, Washington,DC.
Galal, R, M. Schiffbauer, A. Rossignol, and G. Dexter. 2025. Frontier Firms and Job Creation in Bangladesh. Washington, DC: WorldBank.
Gallé, J., D. Overbeck, N. Riedel, and T. Seidel. 2024. “Place-Based Policies, Structural Change and Female Labor: Evidence from India’s Special Economic Zones.” Journal of PublicEconomics 240(December):105259.
Ganong, P., and D. Shoag. 2017. “Why Has Regional Income Convergence in the U.S. Declined?” Journal of Urban Economics 102 (November):76–90.
Ghose, D., E. Pinheiro Fraga, and A. M. Fernandes. 2023. “Fertilizer Import Bans, Agricultural Exports, and Welfare: Evidence from Sri Lanka.” Policy Research Working Paper10642,WorldBank,Washington,DC.
Goldfarb, A., and D. Trefler. 2018. “AI and International Trade.” NBER Working Paper 24254, National Bureau of Economic Research,Cambridge,MA.
Görg, H., and A. Mulyukova. 2024. “PlaceBased Policies and Firm Performance:
Evidence from Special Economic Zones in India.” European Economic Review 165(June): 104752.
Government of India. 2021. “ e Production Linked Incentive scheme, National Programme on Advanced Chemistry Cell (ACC) Battery Storage” Ministry of Heavy Industries. https://heavyindustries.gov.in/en/ pli-scheme-national-programme-advancedchemistry-cell-acc-battery-storage.
Government of India. 2023. “Production Linked Incentive Scheme – PLI 2.0 for IT Hardware.” Ministry of Electronics and Information Technology. https:// www.meity.gov.in/offerings/schemes-andservices/details/production-linked-incentivescheme-pli-2-0-for-it-hardwarewM0MDOtQWa.
Government of India. 2025. “Industrial Parks Facilitating Smarter Infrastructure and Stronger Industrial Growth.” Press Information Bureau. https://www.pib.gov.in/ PressNoteDetails.aspx? id=156687&NoteId=156687&ModuleId=3& reg=3&lang=1.
Government of India. 2026. Economic Survey 2025-26. NewDelhi:MinistryofFinance.
Graetz, G., and G. Michaels. 2018. “Robots at Work.” Review of Economics and Statistics 100(5):753–68.
Groot, S. P. T., H. L. F. de Groot, and M. J. Smit. 2014. “Regional Wage Differences in the Netherlands: Micro Evidence on Agglomeration Externalities.” Journal of RegionalScience 54(3):503–23.
Grover, A., S. Lall, and W. Maloney. 2022. Place, Productivity, and Prosperity: Revisiting Spatially Targeted Policies for Regional Development.Washington,DC:WorldBank.
Grover, A., S. Lall, and J. Timmis. 2023. “Agglomeration Economies in Developing
Countries: A Meta-Analysis.” Regional Science and Urban Economics, 101 (July): 103901.
Hallward-Driemeier, M., and G. Nayyar. 2025. “Have Robots Grounded the Flying Geese? Evidence From Greenfield FDI Announcements.” World Economy 48 (6): 1282–96.
Harmes-Liedtke, U., M. Muñoz, and E. Waltos. 2024. Global Quality Infrastructure Index Report 2023. Global Quality InfrastructureIndex(GQII)Program.
Hasan, R., Y. Jiang, and R. M. Rafols. 2021. “Place-Based Preferential Tax Policy and Industrial Development: Evidence from India’s Program on Industrially Backward Districts.” Journal of Development Economics 150(May):102621.
Huang, Y., S. Baquie, S. Jaumotte, J. Kim, Y. Lu, R. Machado Parente, and S. Pienknagura. 2025. “Do Industrial Policies Increase Trade Competitiveness.” IMF Working Paper 2025/98, International MonetaryFund,Washington,DC.
Hudson Institute. 2024. “India’s Manufacturing Sector Is Stagnant. Relying on PLI Not Enough, Policies Need a Relook.” October 16, 2024. https:// www.hudson.org/domestic-policy/indiasmanufacturing-sector-stagnant-relying-plinot-enough-policies-need-relook-aparnapande.
Hyun, Y., and S. Ravi. 2018. “Place-Based Development: Evidence from Special Economic Zones in India.” Institute for Economic Development (IED) Working PaperSeries.BostonUniversity.
IMF (International Monetary Fund). 2019. “Sri Lanka: Sixth Review Under the Extended Arrangement Under the Extended
Fund Facility and Requests for Waiver of Nonobservance and Modification of Performance Criterion-Press Release; Staff Report; and Statement by the Executive Director for Sri Lanka.” IMF Staff Country Report 2019(335):1.
IMF (International Monetary Fund). 2025. “Industrial Policy: Managing Trade-Offs to Promote Growth and Resilience.” In World Economic Outlook: Global Economy in Flux, Prospects Remain Dim, October, Chapter 3. Washington, DC: International Monetary Fund.
IEEFA (Institute for Energy Economics and Financial Analysis). 2025. “Assessing the Effectiveness of India's Solar Production Linked Incentive Scheme.” Valley City, OH: Institute for Energy Economics and FinancialAnalysis.
ISID (Institute for Studies in Industrial Development). 2025. India Industrial Development Report 2024–25: Towards a Manufacturing-led Transformation. New Delhi: Institute for Studies in Industrial Development.
Juhász, R., N. Lane, E. Oehlsen, and V. C. Perez. 2023. “ e Who, What, When, and How of Industrial Policy: A Text-Based Approach.” SSRN Working Paper 4198209, Social Science Research Network, Rochester, NY.
Juhász, R., N. Lane, and D. Rodrik. 2024. “ e New Economics of Industrial Policy.” AnnualReviewofEconomics 16:213–42.
Karnik, A. G. 2025. “Impact of the Production Linked Incentive Schemes by the Government of India on the growth of the Manufacturing Sector.” International Journal of Social Science and Economic Research 10 (10):5106–15.
Katz, L. F., J. Roth, R. Hendra, and K. Schaberg. 2022. “Why Do Sectoral Employment Programs Work? Lessons from WorkAdvance.” Journal of Labor Economics 40(S1):S249–91.
Koch, M., I. Manuylov, and M. Smolka. 2021.“RobotsandFirms.” Economic Journal 131(638):2553–84.
Krenz,A.,K.Prettner,andH.Strulik.2021. “Robots, Reshoring, and the Lot of LowSkilledWorkers.” European Economic Review 136(July):103744.
Kugler, A., M. Kugler, L. Ripani, and R. Rodrigo. 2020. “U.S. Robots and eir Impacts in the Tropics: Evidence from Colombian Labor Markets.” NBER Working Paper 28034. National Bureau of EconomicResearch,Cambridge,MA.
Kumar, N. 2014. “National Innovation Systems and the Indian Software Industry Development.” In Innovation in India: Combining Economic Growth with Inclusive Development, edited by S. V. Ramani, 143–85. Cambridge, UK: CambridgeUniversityPress.
Lane,N.2025.“ManufacturingRevolutions: Industrial Policy and Industrialization in SouthKorea.” Quarterly Journal of Economics 140(3):1683–741.
Liu, Y. 2024. “Generative AI: Catalyst for Growth or Harbinger of Premature DeProfessionalization?” Policy Research Working Paper 10915, World Bank, Washington,DC.
Machado Parente, S. Baquie, R., Y. Huang, S. Jaumotte, J. Kim, Y. Lu, and S. Pienknagura. 2025. “Industrial Policies and Firm Performance: A Nuanced Relationship.” IMF Working Paper 2025/143, International Monetary Fund, Washington,DC.
Maslej, N., L. Fattorini, R. Perrault, Y. Gil, V.Parli,N.Kariuki,E.Capstick,etal.2025. “ e AI Index 2025 Annual Report.” AI Index Steering Committee, Institute for Human-CenteredAI,Stanford,CA.
McCaig, B., M. S. McMillan, M. Mavungu Ngoma, and A. Pham. 2025. “ e Uneven Impact of Industrial Zones on Formal Job CreationinVietnam.”Workingpaper.
Mensah, J. T., P. C. Wankuru, and B. K. Kirui. 2026. “Public Procurement and Firms: Evidence from Kenya.” Journal of Development Economics 180 (March): 103688.
Overman, H. G., and X. Xu. 2024. “Spatial Disparities across Labour Markets.” Oxford Open Economics 3 (Supplement_1): i585–610.
Pizzinelli, C., A. J. Panton, M. M. Tavares, M. Cazzaniga, and L. Li. 2023. “Labor Market Exposure to AI: Cross-Country Differences and Distributional Implications.” IMF Working Paper 2023/216. International Monetary Fund, Washington,DC.
Rajagopalan, S. 2026. “India’s AI Wedding Buffet: Generous Portions, Political Economy Heartburn.” February 15, 2026. https://srajagopalan.substack.com/p/indias-ai -wedding-buffet-generous.
Reuters. 2025. “Exclusive: India's $23 bln Plan to Rival China Factories to Lapse After It Disappoints.” March 24, 2025. https:// www.reuters.com/markets/emerging/indias23-bln-plan-rival-china-factories-lapse-afterit-disappoints-2025-03-21/.
Rodríguez-Álvarez, J. A., and R. MongeGonzález. 2013. “Impact Evaluation of Innovation and Linkage Development Programs in Costa Rica: e Cases of PROPYME and CR Provee.” IDB Working
Paper 461, Inter-American Development Bank,Washington,DC.
Rodrik, D. 2009. “Industrial Policy: Don't Ask Why, Ask How.” Middle East DevelopmentJournal 1(1):1–29.
Rotunno, L., and M. Ruta. 2024. “Trade Spillovers of Domestic Subsidies.” IMF Working Paper 2024/41, International MonetaryFund,Washington,DC.
Ruta, M., and M. Sztajerowska. 2025. “Shifting Advantages: Do Subsidies Shape Cross-Border Investment?” IMF Working Paper 2025/80, International Monetary Fund,Washington,DC.
Sri Lanka Department of Census and Statistics. 2019. “National Accounts of Sri Lanka2019.”
Stapleton, K., and L. O’Kane. 2023. “Artificial Intelligence and Services Offshoring.”Workingpaper.
Stapleton, K., and M. Webb. 2020. “Automation, Trade and Multinational Activity:MicroEvidencefromSpain.”CSAE Working Paper. Center for the Study of AfricanEconomies,UniversityofOxford.
Stemmler, H. 2023. “Automated Deindustrialization: How Global Robotization Affects Emerging Economies— Evidence from Brazil.” World Development 171(November):106349.
Stiebale, J., J. Suedekum, and N. Woessner. 2024. “Robots and the Rise of European Superstar Firms.” International Journal of Industrial Organization 97 (December): 103085.
Straub, S., M. G. Santana, H. He, Y. Li, X. Lyu, H. Selod, J. Steinbuks, and E. V. Cobos. Forthcoming. “ e Return Imperative. Moving Infrastructure from a
Resource-Gap to a Priority-Based Approach.”WorldBank,Washington,DC.
e Annapurna Express. 2024. “Exporters Await Delayed Government Subsidies.” October 23, 2024. https:// www.theannapurnaexpress.com/ story/50970/.
e Daily Star. 2025. “Snail-Paced G2G Economic Zones Show Uneven Progress.” October 27, 2025. https:// www.thedailystar.net/business/news/snailpaced-g2g-economic-zones-show-unevenprogress-4020656.
e Kathmandu Post. 2025. “Private Sector Urges Revival of Export Cash Subsidy.” October 15, 2025. https:// kathmandupost.com/money/2025/10/15/ private-sector-urges-revival-of-export-cashsubsidy.
Verma, R. 2025. “Government Moves to Clear Long-Delayed Export Cash Incentives, Signals Shift to Production-Based Support.” December 23, 2025. https:// english.clickmandu.com/2025/12/5441/. (AccessedFebruary20,2026).
Verhoogen, E. 2023. “Firm-Level Upgrading in Developing Countries.” Journal of EconomicLiterature 61(4):1410–64.
Webb, M. 2020. “ e Impact of Artificial Intelligence on the Labor Market.” SSRN Working Paper 3482150, Social Science ResearchNetwork,Rochester,NY.
World Bank. 2020. World Development Report 2020: Trading for Development in the Age of Global Value Chains. Washington, DC:WorldBank.
World Bank. 2023. South Asia Development Update: Toward Faster, Cleaner Growth Washington,DC:WorldBank.
World Bank. 2024a. World Development Report 2024: e Middle-Income Trap. Washington,DC:WorldBank.
WorldBank.2024b. South Asia Development Update: Women, Jobs, and Growth.October. Washington,DC:WorldBank.
World Bank. 2024c. Sri Lanka Development Update: Opening Up to the Future. October. Washington,DC:WorldBank.
WorldBank.2025a. South Asia Development Update: Jobs, AI, and Trade. October. Washington,DC:WorldBank.
WorldBank.2025b. South Asia Development Update: Taxing Times. April. Washington, DC:WorldBank.
World Bank. 2025c. Sri Lanka Development Update: Better Spending for All. October. Washington,DC:WorldBank.
World Bank. 2025d. “Bangladesh - Poverty and Equity Assessment:Navigating the Road to Prosperity.” Poverty Assessment 206850. WorldBank,Washington,DC.
World Bank. 2025e. World Development Report 2025: Standards for Development. Washington,DC:WorldBank.
Xie, J., J. Guo, and X. Chen. 2025. “Automation and Value-Chain Embedment: Evidence from Chinese Manufacturing Firms.” AppliedEconomics 57(26):3608–25.
Zhang, H., Z. Chen, and Y. Wei. 2025. “Robot Adoption and Export Sophistication: Firm-LevelEvidencefromChina.” Journal of AsianEconomics 98(June):101891.
Rising interest-growth differentials and what it means for developing economies
Financial markets post-lending support measures
Shifting gears: Digitization and services-led development
Digital technologies can also aid agricultural production
The pandemic has exacerbated the difficulties in measuring GDP in South Asia
What does a model based on macro trends predict about remittance growth in 2020, and what does it miss?
Without immediate action, learning losses and the resulting economic losses in South Asia could be catastrophic
Tourism in South Asia has been shattered but there are opportunities
Assessing India’s economic activity with daily electricity consumption
Worrying fiscal implications of shuttered tourism in Maldives
Green and resilient recovery in South Asia
Early insights from Bangladesh—Informal workers and women are losing livelihoods, and considerable uncertainty remains
South Asia Economic Focus forecasting performance
Growth expectations from within the region
Climate and environment
From Risk to Resilience: Overview of the report
Under the weather: Household climate shock
Prepared for the worst: Building household resilience
Shutters down: Firm climate risk
Back to business: Building firm resilience
Returns to resilience: Aggregate impacts of adaptation
Who bears the burden of climate adaptation and how? A systematic review
Climate adaptation and agriculture in South Asia
Bridging the adaptation financing gap in South Asia
Adaptive social protection in South Asia
Urban policy for climate adaptation in South Asia
Clear the way: Climate resilience in South Asia’s private sector
Heat and floods in South Asia: Household and firm exposure
Fall 2022, Box 2.1
Spring 2022, Box 1.3
Fall 2021, Chapter 3
Fall 2021, Box 3.4
Spring 2021, Box 1.1
Spring 2021, Box 1.2
Spring 2021, Box 2.4
Fall 2020, Box 1.3
Fall 2020, Box 1.4
Fall 2020, Box 1.5
Fall 2020, Box 2.2
Fall 2020, Box 3.2
Fall 2019, Box 3
Fall 2019, Box 4
From Risk to Resilience: Helping People and Firms Adapt in South Asia, Chapter 1
From Risk to Resilience: Helping People and Firms Adapt in South Asia, Chapter 2
From Risk to Resilience: Helping People and Firms Adapt in South Asia, Chapter 3
From Risk to Resilience: Helping People and Firms Adapt in South Asia, Chapter 4
From Risk to Resilience: Helping People and Firms Adapt in South Asia, Chapter 5
From Risk to Resilience: Helping People and Firms Adapt in South Asia, Chapter 6
From Risk to Resilience: Helping People and Firms Adapt in South Asia, Spotlight
From Risk to Resilience: Helping People and Firms Adapt in South Asia, Deep Dive 1
From Risk to Resilience: Helping People and Firms Adapt in South Asia, Deep Dive 2
From Risk to Resilience: Helping People and Firms Adapt in South Asia, Deep Dive 3
From Risk to Resilience: Helping People and Firms Adapt in South Asia, Deep Dive 4
Spring 2025, Spotlight
Fall 2024, Spotlight 1
Climate and environment (continued)
Climate shocks and the poor Spring 2024, Box SL.1
Recruiting firms for the energy transition Fall 2023, Chapter 2
Literature review: Addressing barriers to technology diffusion in firms Fall 2023, Box 2.1
Stranded jobs? The energy transition in South Asia’s labor markets
Weather extremes and price stability
Fiscal space and disaster resilience
The turning point—Fossil fuel subsidy reform in South Asia
The green transition: How will it affect households in South Asia?
Migration and climate change in South Asia
How prepared are South Asia's energy firms and workers for the green transition?
Healthy fiscal balance for a swift recovery: Lessons from natural disasters
Toward a low carbon future in South Asia
The “double jeopardy” of fiscal and climate-related risks
2023, Chapter 3
2023, Box 2.1
2023, Box 2.3
2023, Box 2.4
2022, Box 2.4
2022, Box 3.5
2022, Box 2.2
2021, Box 2.2
2021, Box 2.3 Green and resilient recovery in South Asia
Striving for clean air: Air pollution and public health in South Asia
Glaciers of the Himalayas: Climate change, black carbon, and regional resilience
jobs pay: Wage differentials in South Asia
2020, Box 2.2
South Asia Development Matters, July 2023
Asia Development Forum, June 2021
2026,
2.2 Heat and floods in South Asia: Household and firm exposure
Stranded jobs?
2024, Spotlight 1
SouthAsia’s growth again surprised on the upside but is expected to slow in 2026 amid headwinds from global energy market dislocations. Over the medium-term, trade reforms in South Asian countries could unlock further growth by reducing trade barriers, especially for emerging export sectors. Across South Asia, accelerating job creation is becoming harder as job prospects erode in AI-exposed activities and long-standing subnational labor market disparities persist. To achieve policy goals, South Asian countries make proactive use of industrial policies, at about twice the rate of other EMDEs. Since 2022, about half of South Asia’s industrial policies have been directed at the manufacturing sector, particularly toward activities with larger employment, higher average wages, or larger or more productive firms. More than other EMDEs, South Asia has deployed trade-related industrial policy measures but their track record in South Asia has been mixed, with import restrictions lowering imports significantly but export support not materially raising exports. Given limited fiscal space and administrative capacity, cross-cutting measures to improve infrastructure, skilling opportunities, and the business environment remain a priority to accelerate and spread growth and jobs more evenly. These can be complemented by targeted industrial policies, prioritizing those that address market failures directly.