© 2025 International Bank for Reconstruction and Development / The World Bank
1818 H Street NW, Washington, DC 20433
Telephone: 202-473-1000; Internet: www.worldbank.org
Some rights reserved
1 2 3 4 28 27 26 25
This work is a product of the staff of The World Bank with external contributions. The findings, interpretations, and conclusions expressed in this work do not necessarily reflect the views of The World Bank, its Board of Executive Directors, or the governments they represent. The World Bank does not guarantee the accuracy, completeness, or currency of the data included in this work and does not assume responsibility for any errors, omissions, or discrepancies in the information, or liability with respect to the use of or failure to use the information, methods, processes, or conclusions set forth. The boundaries, colors, denominations, links/footnotes and other information shown in this work do not imply any judgment on the part of The World Bank concerning the legal status of any territory or the endorsement or acceptance of such boundaries. The citation ofworks authored by others does not mean the World Bank endorses the views expressed by those authors or the content of their works.
Nothing herein shall constitute or be construed or considered to be a limitation upon or waiver of the privileges and immunities of The World Bank, all ofwhich are specifically reserved.
Rights and Permissions
=5
This work is available under the Creative Commons Attribution 3.0 IGO license (CC BY 3.0 IGO) http://creativecommons.org/licenses/by/3.0/igo. Under the Creative Commons Attribution license, you are free to copy, distribute, transmit, and adapt this work, including for commercial purposes, under the following conditions:
Attribution-Please cite the work as follows: World Bank. 2025. Global Economic Prospects, June 2025. Washington, DC: World Bank. doi: 10.1596/978-1-4648-2193-6. License: Creative Commons Attribution CC BY 3.0 IGO
Translations-If you create a translation of this work, please add the following disclaimer along with the attribution: This translation was not created by The World Bank and should not be considered an official World Bank translation. The World Bank shall not be liable for any content or error in this translation.
Adaptations-If you create an adaptation of this work, please add the following disclaimer along with the attribution: This is an adaptation ofan original work by The World Bank. Views and opinions expressed in the adaptation are the sole responsibility of the author or authors of the adaptation and are not endorsed by The World Bank.
Third-party content-The World Bank does not necessarily own each component of the content contained within the work. The World Bank therefore does not warrant that the use of any third-party-owned individual component or part contained in the work will not infringe on the rights of those third parties. The risk of claims resulting from such infringement rests solely with you. If you wish to reuse a component of the work, it is your responsibility to determine whether permission is needed for that reuse and to obtain permission from the copyright owner. Examples of components can include, but are not limited to, tables, figures, or images.
All queries on rights and licenses should be addressed to World Bank Publications, The World Bank Group, 1818 H Street NW, Washington, DC 20433, USA; e-mail: pubrights@worldbank.org.
ISSN: 1014-8906
ISBN (paper): 978-1-4648-2193-6
ISBN (electronic): 978-1-4648-2195-0
DOI: 10.1596/978-1-4648-2193-6
Cover design: Bill Pragluski, Critical Stages LLC.
Library of Congress Control Number: 2025912134.
The cutoff date for the data used in the report was June 3, 2025.
This World Bank Flagship Report is a product of the Prospects Group in the Development Economics (DEC) Vice Presidency. The project was managed by M. Ayhan Kose and Carlos Arteta, under the general guidance of Indermit Gill.
The preparation of the analytical chapters was overseen by Dana Vorisek. The report was prepared by a team that included Amat Adarov, Marie Albert, Francisco Arroyo Marioli, Mirco Balatti, Samuel Hill, Phil Kenworthy, Jeetendra Khadan, Gitanjali Kumar, Dawit Mekonnen, Valerie Mercer-Blackman, Alen Mulabdic, Hayley Pallan, Edoardo Palombo, Peter Pedroni, Nikita Perevalov, Dominik Peschel, Peter Selcuk, Shijie Shi, Naotaka Sugawara, Takuma Tanaka, Garima Vasishtha, and Collette Wheeler.
Research assistance was provided by Sergiu Dinu, Jiayue Fan, Mario Guillen Salvatore, Matias Urzua, Shiqing Hua, Fuda Jiang, Nikola Evgeniev Kolev, Maria Hazel Macadangdang, Nikita Makarenko, Rafaela Martinho Henriques, Sadhna Naik, Vasiliki Papagianni, Juan Felipe Serrano Ariza, Kaltrina Temaj, Canran Zheng, and Juncheng Zhou. Modeling and data work was provided by Shijie Shi.
Online products were produced by Graeme Littler, with assistance from the Open Knowledge Repository. Adriana Maximiliano handled design and production. Joe Rebello managed communications and media outreach with a team that included
Kristen Milhollin, Mariana Lozzi Teixeira, and Leslie Yun, with extensive support from the World Bank's media and digital communications teams. Graeme Littler provided editorial support, with contributions from Adriana Maximiliano and Christina Davis.
Regional projections and write-ups were produced in coordination with country teams, country directors, and the offices of the regional chief economists.
Many reviewers provided extensive advice and comments. The analysis also benefited from comments and suggestions by staff members from World Bank country teams and other World Bank Vice Presidencies as well as Executive Directors in their discussion of the report on June 3, 2025. However, both forecasts and analysis are those of the World Bank staff and should not be attributed to Executive Directors or their national authorities.
The Prospects Group gratefully acknowledges financial support from the Policy and Human Resources Development (PHRD) Fund provided by the Government of Japan, which helped underpin some of the analytical work in this publication.
Only six months ago, a "soft landing" appeared to be in sight: the global economy was stabilizing after an extraordinary string of calamities both natural and man-made over the past few years That moment has passed. The world economy today is once more running into turbulence. Without a swift course correction, the harm to living standards could be deep.
International discord-about trade, in particular-has upended many of the policy certainties that helped shrink extreme poverty and expand prosperity after the end of World War II. This year alone, our forecasts indicate the upheaval will slice nearly half a percentage point off the global GDP growth rate that had been expected at the start of the year, cutting it to 2.3 percent. That's the weakest performance in 17 years, outside of outright global recessions By 2027, global GDP growth is expected to average just 2 5 percent in the 2020s-the slowest pace of any decade since the 1960s
As this edition of Global Economic Prospects makes clear, the poorest countries will suffer the most. By 2027, the per capita GDP of high-income economies will be roughly where it had been expected to be before the COVID-19 pandemic. But developing economies would be worse off, with per capita GDP levels 6 percent lower. Except for China, it could take these economies about two decades to recoup the economic losses of the 2020s.
This grim predicament did not arrive by stealth. It has been advertising itself for at least a decade. Growth in developing economies has now been ratcheting downward for three decades in a row-from an average of 5.9 percent in the 2000s to 5.1 percent in the 2010s to 3.7 percent in the 2020s. That happens to track the declining trajectory of growth in global trade-which has fallen from an average of 5.1 percent in the 2000s to 4.6 percent in the 201 Os to 2.6 percent in the 2020s. Investment, meanwhile, has been growing at a progressively weaker pace. But debt is piling up.
In short, many of the forces behind the great economic miracle of the last 50 years-when per capita GDP in developing countries nearly quadrupled and more than 1 billion people escaped extreme poverty-have swung into reverse. Conditions that might have facilitated relatively painless policy corrections have come and gone-the record-low interest rates that prevailed in the first two decades of this century, for example, are now a thing of the past. Through it all, policymakers mostly stood still, hoping that conditions would somehow improve on their own. That was a false hope, but it is never too late to do the right thing. This report outlines three priorities:
First, rebuild trade relations. The evidence is clear: economic cooperation is better than any of the alternatives-for all parties. Our analysis suggests that if today's trade disputes were resolved with agreements that halve tariffs relative to their levels in late May, 2025, global growth could be stronger by about 0.2 percentage point on average over the course of 2025 and 2026.
Most developing economies today tend to have far higher tariffs than high-income economies. If their goal is to accelerate growth, their best course of action will be to lower tariffs with respect to all trading partners. Converting preferential trade agreements-mainly involving tariffs-into "deep trade agreements" that span the full range of cross-border regulatory policies could also juice GDP growth. Developing economies also have a crucial role to play in restoring a fully functional, rules-based trade system, specifically through the World Trade Organization (WTO). Predictability cuts trade costs, which in turn boosts GDP growth
Second, restore fiscal order. It's fair to say that the succession of economic shocks in the 2020s has made a mess of government finances in many developing economies. But they were hardly the sole cause: in the era of easy money that preceded the COVID-19 pandemic, governments opted to take too many risks for far too long. The bill is
now due: fiscal deficits so far in the 2020s have averaged nearly 6 percent in developing economies, the highest level of this century. Interest costs alone account for about a third of the deficits. In low-income countries, the budget squeeze has been intensified by a drop in foreign aid, which finances a big share of critical needs such as health care. It should be no surprise that more than half of low-income countries are now either in debt distress or at high risk ofit.
Developing economics need to expand their fiscal room to maneuver. They have a lot of work to do in this regard, because they collect far less in revenues than high-income economies do-about 25 percent of GDP compared with nearly 40 percent of GDP in the wealthiest economies. They should seep up efforts to mobilize greater domestic resources-by broadening the tax base and strengthening tax administration and collection to reduce tax avoidance and proficshifring. They can also reap significant gains by narrowing the focus of costly food and fuel subsidies, channeling them simply toward lowincome households.
Third, accelerate job creation. Across the world, a historic demographic shift is underway-one that
is intensifying the need for jobs in many of the poorest countries. Sub-Saharan Africa's workingage population is forecast to almost double by 2050, growing by more than 600 million, more than any region has ever experienced over a 25year period. South Asia's working-age population is expected to expand by nearly 300 million over the same timcframe, and the Middle East and North Africa's by more than 100 million.
Whether these regions succeed or fail in tackling the challenge will determine the outlook for longterm global peace and prosperity. They will need to accelerate economic growth, upgrade the workforce's education and skills, and set the stage for labor markets to function efficiently.
The global economy today is at an inflection point. The forces that once drove economic convergence and lifted billions out of poverty are now in retreat. But chis moment offers a chance to reset the agenda- with renewed global cooperation, restored fiscal responsibility, and a relentless focus on creating jobs. With decisive action, governments across the world can still regain the momentum of poverty reduction-and deliver rising living standards for the next generation.
lndermit Gill Senior Vice President and ChiefEconomise The World Bank Group
After a succession of adverse shocks in recent years, the global economy is facing another substantial headwind, with increased trade tension and heightened policy uncertainty. This is contributing to a deterioration in prospects across most of the world's economies. For emerging market and developing economies (EMDEs) , the ability to narrow per capita income gaps with richer countries, boost job creation, and reduce extreme poverty remains insufficient. Downside risks to the outlook predominate, including an escalation of trade barriers, persistent policy uncertainty, rising geopolitical tensions, and an increased incidence of extreme climate events Conversely, policy uncertainty and trade tensions may ease if major economies succeed in reaching lasting agreements that address ongoing trade disputes. The challenging global context faced by EMDEs is compounded by the fact that foreign direct investment inflows into these economies have fallen to less than half of their peak level in 2008 and are likely to remain subdued. Global cooperation is needed to restore a more stable and transparent global trade environment and scale up support for vulnerable countries grappling with conflict, debt burdens, and climate change. Across EMDEs, domestic policy action is also critical to contain inflation risks, strengthen fiscal resilience through improved revenue mobilization, and reprioritize spending. To unlock job creation and long-term growth, structural reforms must focus on raising institutional quality, attracting private investment, and strengthening human capital and labor markets. In particular, countries in fragile and conflict situations (FCS) face daunting development challenges that will require tailored domestic policy reforms, underpinned by well-coordinated multilateral support.
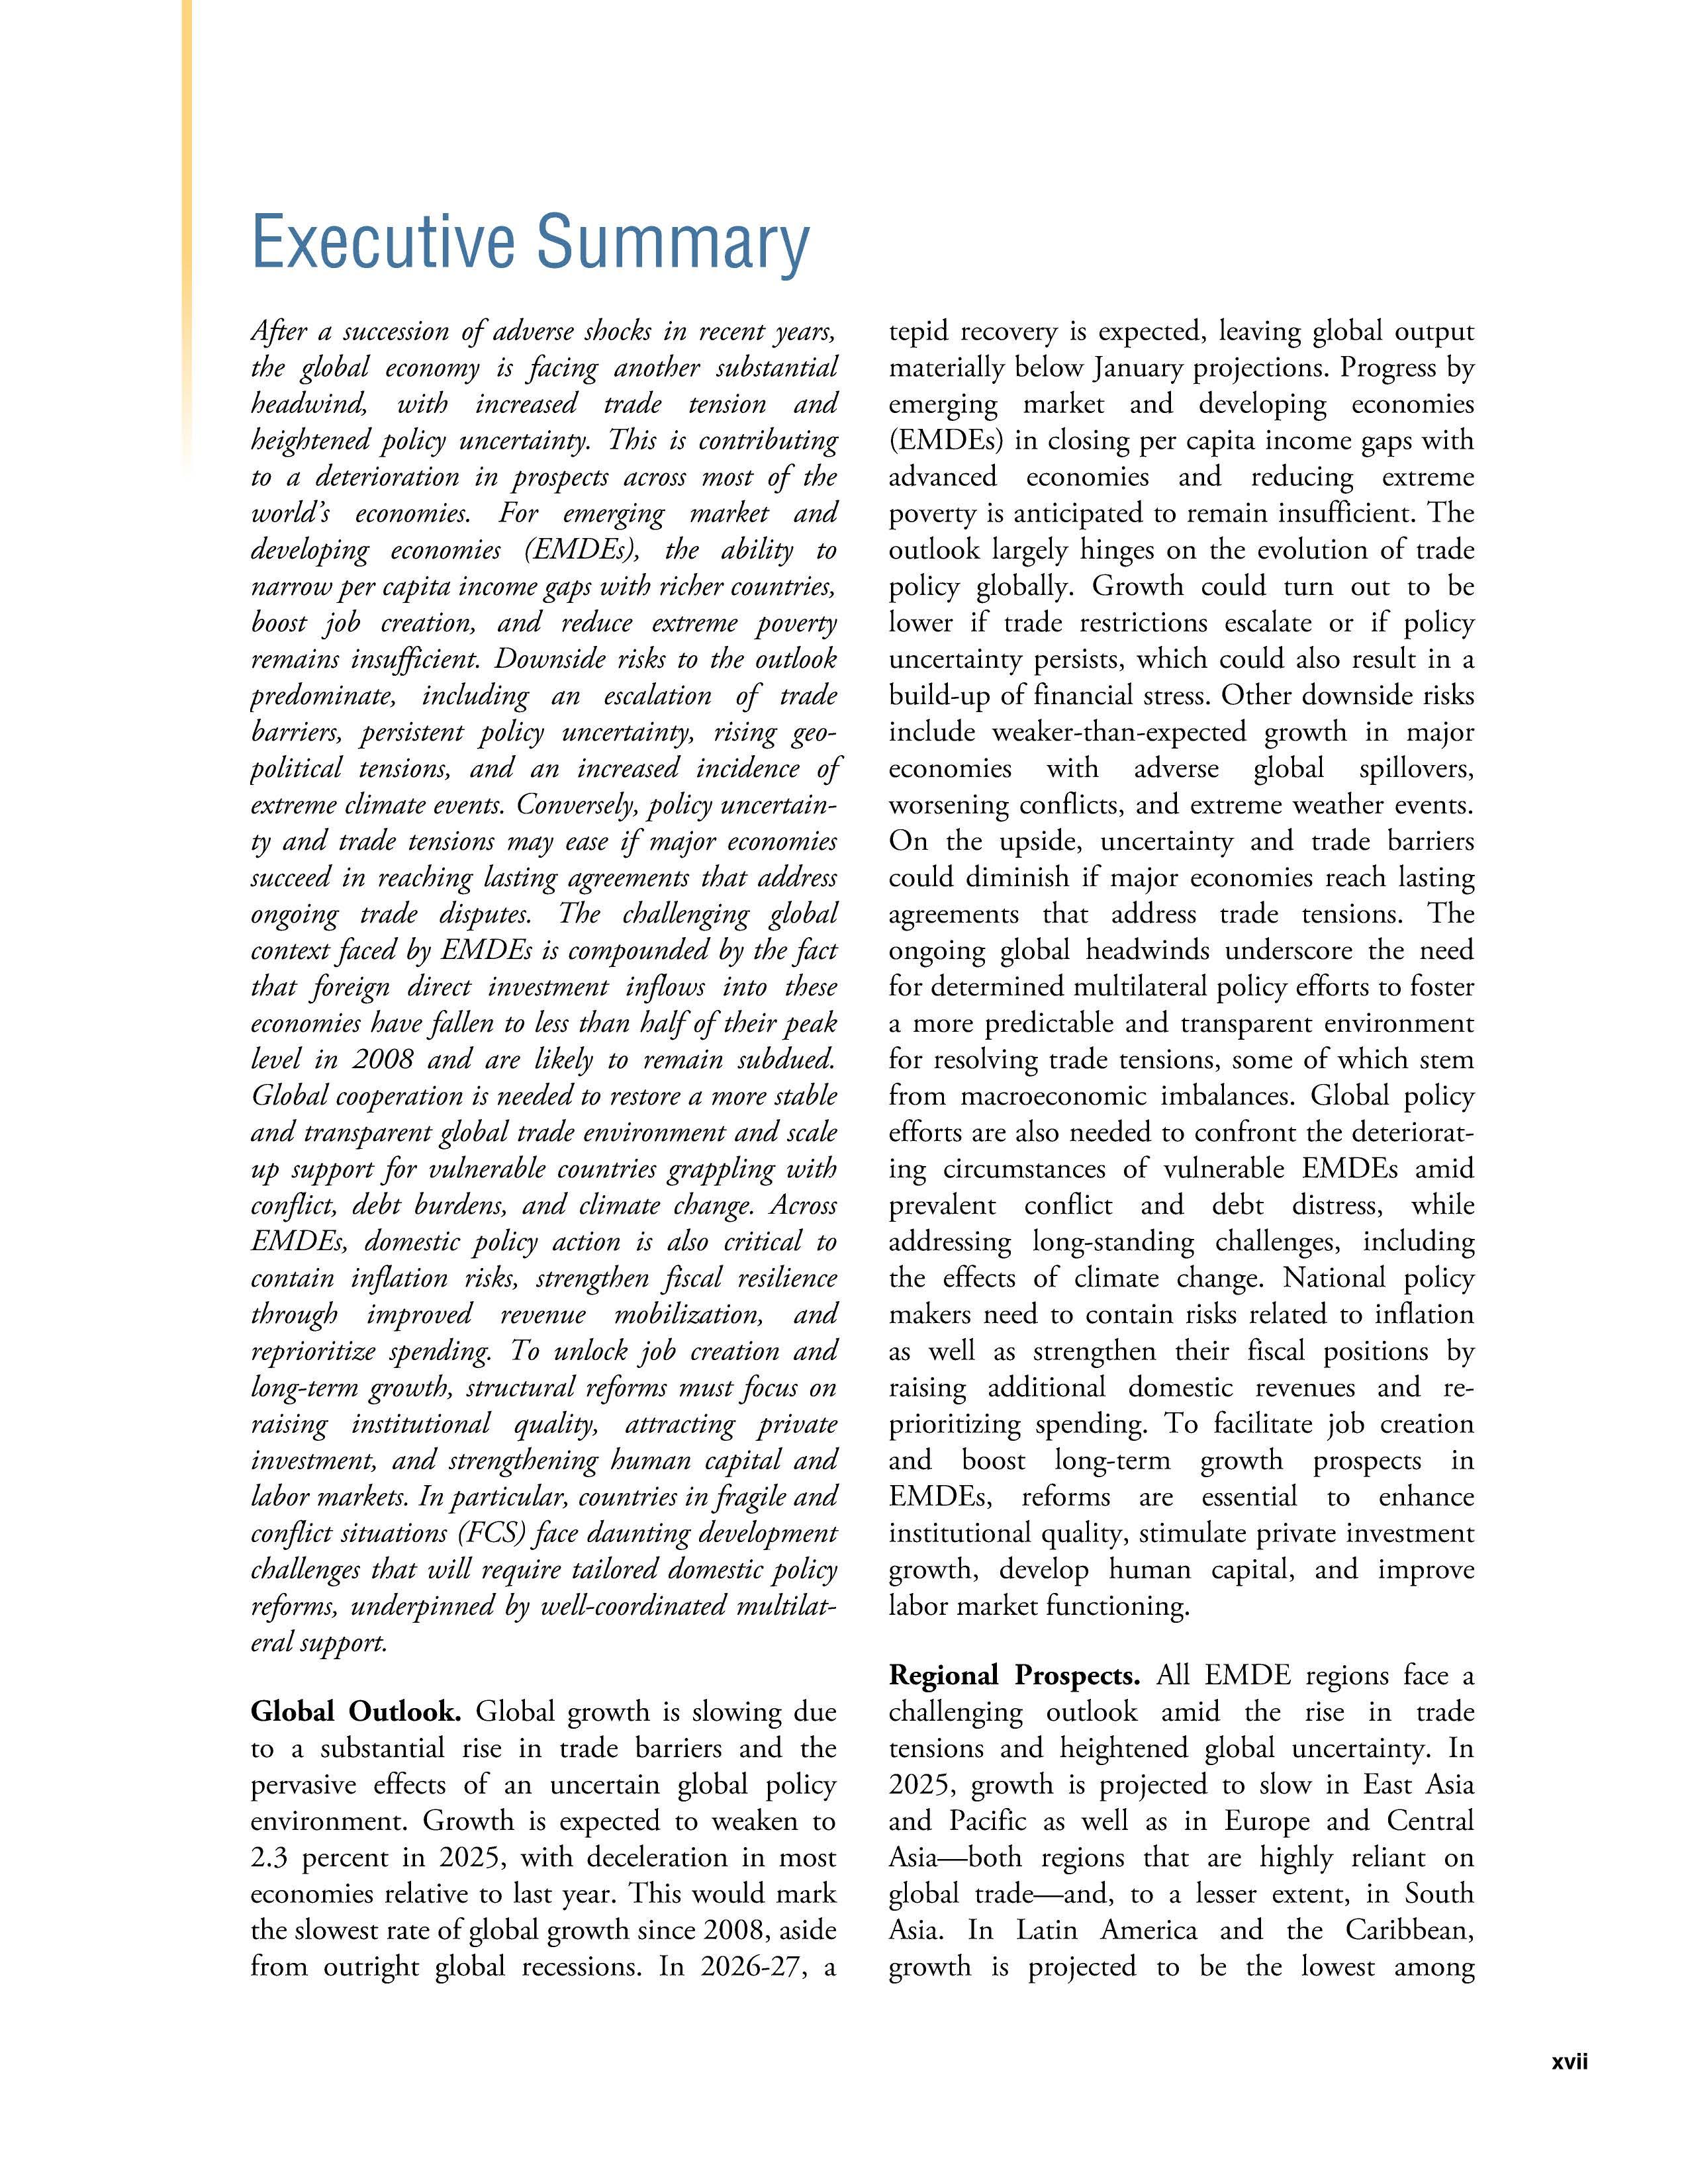
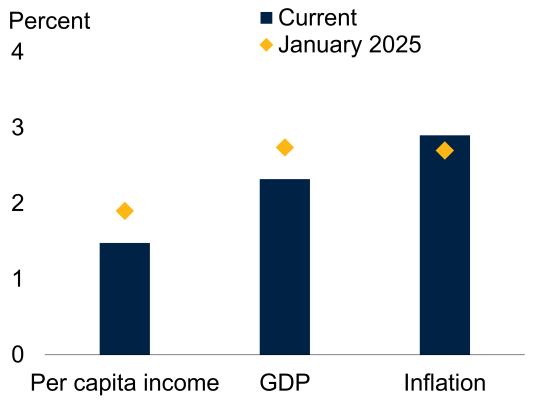
Global Outlook. Global growth is slowing due to a substantial rise in trade barriers and the pervasive effects of an uncertain global policy environment. Growth is expected to weaken to 2.3 percent in 2025, with deceleration in most economies relative to last year. This would mark the slowest rate of global growth since 2008, aside from outright global recessions. In 2026-27, a
tepid recovery is expected, leaving global output materially below January projections. Progress by emerging market and developing economies (EMDEs) in closing per capita income gaps with advanced economies and reducing extreme poverry is anticipated to remain insufficient. The outlook largely hinges on the evolution of trade policy globally. Growth could turn out to be lower if trade restrictions escalate or if policy uncertainty persists, which could also result in a build-up of financial stress Other downside risks include weaker-than-expected growth in major economies with adverse global spillovers, worsening conflicts, and extreme weather events On the upside, uncertainty and trade barriers could diminish if major economies reach lasting agreements that address trade tensions. The ongoing global headwinds underscore the need for determined multilateral policy efforts to foster a more predictable and transparent environment for resolving trade tensions, some of which stem from macroeconomic imbalances. Global policy efforts are also needed to confront the deteriorating circumstances of vulnerable EMDEs amid prevalent conflict and debt distress, while addressing long-standing challenges, including the effects of climate change. National policy makers need to contain risks related to inflation as well as strengthen their fiscal positions by raising additional domestic revenues and reprioritizing spending. To facilitate job creation and boost long-term growth prospects in EMDEs, reforms are essential to enhance institutional quality, stimulate private investment growth, develop human capital, and improve labor market functioning.
Regional Prospects. All EMDE regions face a challenging outlook amid the rise in trade tensions and heightened global uncertainty In 2025, growth is projected to slow in East Asia and Pacific as well as in Europe and Central Asia-both regions that are highly reliant on global trade-and, to a lesser extent, in South Asia. In Latin America and the Caribbean, growth is projected to be the lowest among
EMDE regions over the forecast horizon, as activity is held back by high trade barriers and long-standing structural weaknesses. In regions with a large number of commodity exporters, including in the Middle East and North Africa and Sub-Saharan Africa, growth is anticipated to
face drags from the weakening outlook for external commodity demand. Against the backdrop of a deteriorating global environment, growth forecasts for 2025 have been downgraded in all EMDE regions relative to January projections.
AE
AI
CFA
CPI
EAP
ECA
EM7
EMBI
EMDEs
EU
FCS
FOi
FY
GCC
GDP
GNI
GVCs
IDA
IMF
KNOMAD
LAC
LIC
LNG
M&A
MNA
MNEs
NDVls
ODA
OECD
OPEC+
PMI
PPP
PVAR
R&D
SAR
SSA
SVAR
TFP
UN
UNCTAD
VAR
WDI
WTO
advanced economy
artificial intelligence
African Financial Community
consumer price index
East Asia and Pacific
Europe and Central Asia
Brazil, China, India, Indonesia, Mexico, the Russian Federation, and Tiirkiye
Emerging Markets Bond Index
emerging market and developing economies
European Union
fragile and conflict-affected situations
foreign direct investment
fiscal year
Gulf Cooperation Council
gross domestic product
gross national income
global value chains
International Development Association
International Monetary Fund
Global Knowledge Partnership on Migration and Development
Latin America and the Caribbean
low-income country
liquefied natural gas
mergers and acquisitions
Middle East and North Africa
multinational enterprises
normalized difference vegetation indices
official development assistance
Organisation for Economic Co-operation and Development
Organization of the Petroleum Exporting Countries and other affiliated oil producers
purchasing managers' index
purchasing power parity
panel vector autoregression
research and development
South Asia
Sub-Saharan Africa
structural vector autoregression
total factor productivity
United Nations
United Nations Conference on Trade and Development
vector autoregression
World Development Indicators
World Trade Organization
Global growth is slowing due to a substantial rise in trade barriers and the pervasive effects of an uncertain global policy environment Growth is expected to weaken to 2.3 percent in 2025, with deceleration in most economies relative to last year. This would mark the slowest rate of global growth since 2008, aside from outright global recessions. In 2026-27, a tepid recovery is expected, leaving global output materially below fanuary projections. Progress by emerging market and developing economies (EMDEs) in closing per capita income gaps with advanced economies and reducing extreme poverty is anticipated to weaken The outlook largely hinges on the evolution of trade policy globally. Growth could turn out to be lower if trade restrictions escalate or ifpolicy uncertainty persists, which could also result in a build-up offinancial stress. Other downside risks include weaker-than-expected growth in major economies with adverse global spillovers, worsening conflicts, and extreme weather events. On the upside, uncertainty and trade barriers could diminish if major economies reach lasting agreements that address trade tensions. The ongoing global headwinds underscore the need for determined multilateral policy efforts to foster a more predictable and transparent environment for resolving trade tensions, some of which stem from macroeconomic imbalances. Global policy efforts are also needed to confront the deteriorating circumstances of vulnerable EMDEs amid prevalent conflict and debt distress, while addressing long-standing challenges, including the effects of climate change. National policy makers need to contain risks related to inflation as well as strengthen their fiscal positions by raising additional domestic revenues and re-prioritizing spending. To facilitate job creation and boost long-term growth prospects in EMDEs, reforms are essential to enhance institutional quality, stimulate private investment growth, develop human capital, and improve labor market functioning.
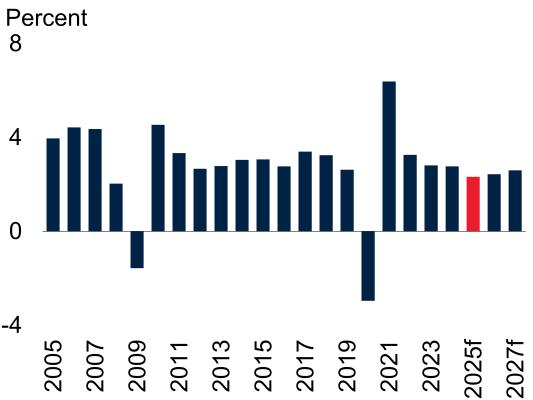
After being buffeted by a series of adverse shocks over 2020-24, the global economy is facing another significant headwind this year, with increased trade barriers and heightened policy uncertainty leading to a notable deterioration of the outlook relative to January (figure L LA). In particular, global output is expected to grow at its weakest pace since 2008, aside from outright global recessions (figure LLB). The sharp increase in tariffs and the ensuing uncertainty are contributing to a broad-based growth slowdown and deteriorating prospects in most of the world's economies (figure L LC). Subdued global growth prospects are unlikely to improve materially without policy actions to address increasing trade restncttons, geopolitical tensions, heightened uncertainty, and limited fiscal space.
The global outlook is predicated on tariff rates close to those of late May prevailing throughout the forecast horizon. Accordingly, pauses to previously announced tariff hikes between the
Note: This chapter was prepared by Carlos Arteta, Phil Kenworthy, Nikita Perevalov, Peter Selcuk, Garima Vasishcha, and Collette Wheeler, with contributions from Micco Balatri, Jongrim Ha, Samuel Hill, Gicanjali Kumar, Dawit Mekonnen, Ale n Mulabdic, Edoardo Palombo, Shijie Shi, Naocaka Sugawara, and Takuma Tanaka.
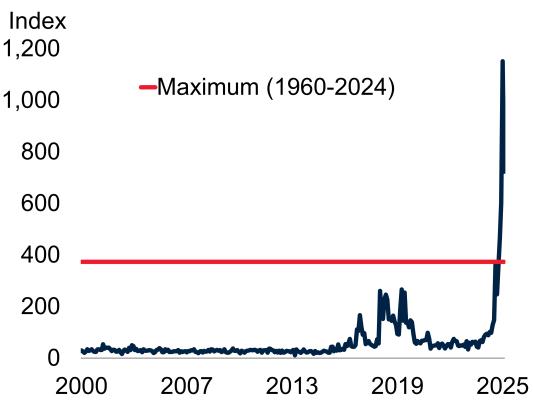
United States and its trading partners are assumed to persist. This baseline nonetheless entails the highest U S average effective tariff rate in nearly a century. In addition, in view of recent rapid shifts in trade policies and the potential for a return to even higher tariffs, consumers and businesses continue to grapple with unusually elevated uncertainty (figure LLD). In this context, a prospective recovery in global trade and investment-two important drivers of long-term development that have been relatively subdued in recent years-has been disrupted.
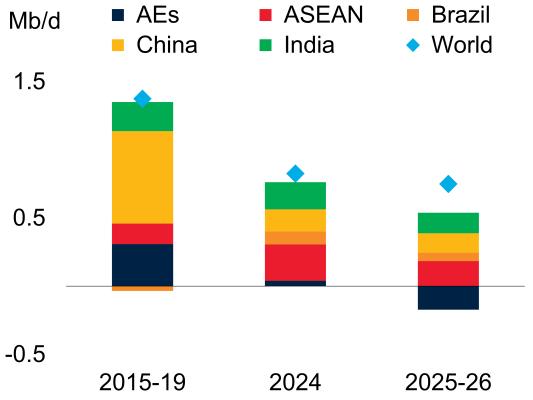
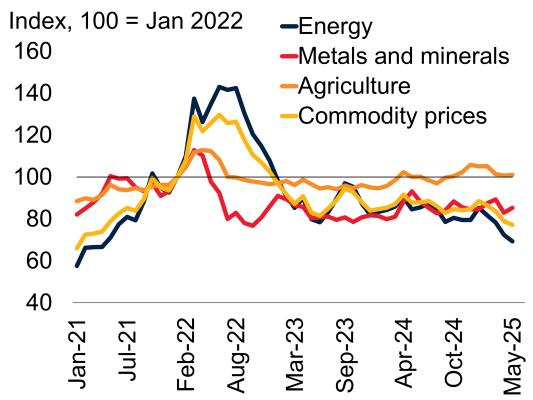
Commodity prices plunged in early April in response to deteriorating growth prospects. Oil prices posted an especially large decline, with the effects of a notable hike in oil production by OPEC+ nations compounded by a muted outlook for oil demand growth (figure L LE). Base metal prices also dropped as markets priced in substantial headwinds to global manufacturing and industrial activity but have since partially recovered. Overall commodity prices are forecast to decline by 10 percent in 2025, softening further in 2026-mainly due to falling oil prices.
Global headline inflation generally remains elevated relative to central bank targets and prepandemic averages and has even risen in some advanced economies since late last year. Slower
M emorandu m item s: Real GDP 1
Source : World Bank
Note : e= estimate;f= forecast. EM? = Brazil,China,India,Indonesia,Mexico,the Russian Federation,and TOrkiye WBG = World Bank Group World Bank forecasts are frequently updated based on newinformation Consequently, projectionspresented here may differfrom those contained in otherWorld Bank documents,even if basic assessments of countries' prospects do not differat any given date For the definition of EMDEs, developing countries,commodity exporters,and commodity importers,please refer to table 1.2 The World Bank is currently not publishing economic output, income,orgrowth data for Turkmenistan and Reptlblica Bolivariana de Venezuela owing to lack of reliable data of adequate quality. Turkmenistan and Reptlblica Bolivariana de Venezuela are excluded from cross-country macroeconomic aggregates.
1 Headline aggregate growth rates are calculated using GDP weights at average 2010-19prices and market exchange rates.
2 GDP growth rates are on afiscalyear(FY) basis. Aggregates thatinclude these countries are calculated using datacompiled on acalendar yearbasis. For India and the Islamic Republic of Iran,the column for 2022 refers to FY2022/23 For Bangladesh,the Arab Republicof Egypt,and Pakistan,the column for 2022 refers to FY2021/22. Pakistan'sgrowth rates are basedon GDP atfactorcost.
3 World growth rates are calculated using average 2010-19purchasing powerparity (PPP) weights,which attribute agreater share of global GDP to emerging market anddeveloping economies (EMDEs) thanmarketexchange rates.
4 World trade volume of goods and nonfactorservices.
5 Indexes are expressed in nominal US. dollars (2010 = 100). Oil refers to theBrent crude oil benchmark For weightsand composition of indexes,see https://worldbank org/commodities
disinflation globally over the last six months has largely reflected continuing inflationary pressures from services prices. The recent rise in consumer inflation expectations has been influenced by the implementation of trade restrictions. In addition, core inflation in some economies is expected to remain high due to persistent services price increases. In all, GDP-weighted global inflation is projected to average 2.9 percent in 2025 and 2026-still a little above the average inflation target-but with notable heterogeneity across economies.
Global financial conditions have been tighter this year, on average, relative to late 2024, principally reflecting trade policy uncertainty Volatility in financial markets spiked and equity markets plunged globally as trade tensions escalated in early April; however, asset prices largely recovered after an initial 90-day tariff pause was announced and following the rollback in U.S.-China tariffs in May (figure 1.1.F). Long-term government bond yields in major advanced economies have increased since late last year, albeit with pronounced volatility. EMDE financial conditions are also somewhat tighter, on average, relative to late last year. In early April, many EMDEs saw sharp declines in equity markets amid a surge in capital outflows. Sovereign spreads rose, albeit to differing degrees based on economies' exposure to announced trade barriers Nevertheless, EMDE equity markets regained ground and spreads narrowed again following the partial de-escalation in trade tensions
Against this backdrop, global growth is set to slow this year, to 2.3 percent-substantially weaker than previously projected amid the impact of higher trade barriers, elevated uncertainty, increased financial volatility, and weakened confidence. Thereafter, growth is forecast to firm to about 2.5 percent over 2026-27, as trade flows continue adjusting to higher tariffs such that global trade edges up, while policy uncertainty moderates from record-high levels. The downgrade to global growth this year is principally driven by advanced economies (figure 1.2.A). This slowdown is projected to be concentrated on investment, including foreign direct investment (FDI) and portfolio flows-which tend to respond
The global outlook has deteriorated substantially relative to January, with global growth in 2025 expected to register its weakest pace since 2008, aside from outright global recessions. This deterioration is broad-based across the world's economies and follows sharp increases in trade tensions and policy uncertainty. The slowdown in global growth will erode demand for oil and various other commodities, weighing on the outlook for many EMDE commodity exporters. Following U.S. tariff announcements, financial markets experienced substantial turbulence, with a spike in equity market volatility and a rise in EMDE sovereign bond spreads, although these subsequently subsided. A. Global growth, per capita income growth, and inflation in 2025
F. Equity market volatility and EMDE bond spreads
Sources: Caldara et al. (2020); Haver Analytics; International Energy Agency (IEA); J.P. Morgan; UN World Population Prospects;World Bank.
Note: f =forecast. AEs =advanced economies; ASEAN = Association of Southeast Asian Nations; EMDEs =emerging marketand developing economies;mb/d = million barrels perday;GDP aggregates calculated using real U.S. dollar GDP weights at
prices and market exchange rates.
A. Blue bars "current''correspond to the current edition of the Global Economic Prospects (GEP) report and yellow diamonds "January 2025" correspond to the January 2025 edition of the GEP.
B. Data for 2024 are estimates;data for 2025-27 are forecasts.
C. Panel shows the share of economies with slowing growth and with growth outlook downgraded relative to January 2025 forecasts. Horizontal line shows 50 percent.
D. Trade Policy Uncertainty Index based on automated text searchesof the electronic archives of seven newspapers. A highervalue indicates higher trade policy uncertainty. Last observation is May 2025.
E. Bars indicate the average change in annual oil demand in mb/d for the selected periods. Data based on IEA's Oil Market Report,May 2025 edition. 2025 and 2026 are projections
F. Blue line represents the daily CBOE Volatility Index, which measures marketexpectations of nearterm volatility conveyed by stock index option prices. Red line represents the median sovereign bond spread for a sample of up to 71 EMDEs. Lastobservation is May 30 2025.
The deterioration in the global outlook has largely emanated from trade shocks, with forecasts for advanced economies downgraded markedly. These shocks are set to weigh on EMDEs via trade, financial, and investment flows with major economies. Risks are tilted to the downside. Global growth could be even lower if an escalation of trade tensions and uncertainty further weakens investment, trade, and confidence. Geopolitical fragmentation could accelerate if trade or geopolitical tensions worsen. In EMDEs, a higher incidence of conflict could lead to lasting output losses. A downside scenario of renewed trade tensions could push the world economy into an extended period of anemic growth.
A Contributions to global growth downgrades in 2025 and 2026
C. Probability distribution around global growth forecast
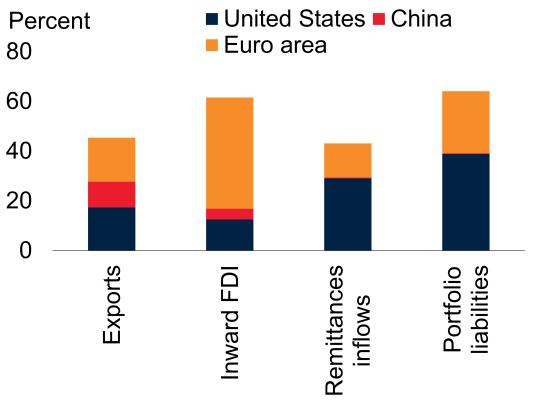
B Trade and financial linkages between major economies and EMDEs excluding China
D. Geopolitical Fragmentation Index
more to demand shifts than aggregate outputand trade, with widespread adverse spillovers to other economies (figure 1.2.B).
Growth in EMDEs is expected to slow in 2025, to 3.8 percent, before edging up a touch over 202627, to 3.9 percent. China's economy is projected to decelerate across the forecast horizon, as a nearterm boost from fiscal policy fades amid slowing potential growth. Meanwhile, near-term growth in many other EMDEs is anticipated to decelerate amid weakening investment, which is likely to more than offset any possible benefits from trade diversion during the forecast period Against the backdrop of a deteriorating external environment, progress by EMDEs in closing sizable per capita income gaps with advanced economies, spurring job creation, or reducing extreme poverty rates is anticipated to slow further, leaving poverty rates above pre-pandemic levels in many poorer or fragile EMOEs At the same time, many of these economies are set to face a looming jobs challenge in the coming decades, especially if employment growth continues to be outstripped by population growth
Sources : BIS (database); Bloomberg; Consensus Economics; Fernandez-Villaverde, Mineyama, and Song (2025); IMF Coordinated Direct Investment Survey (database); Ohnsorge, Stocker, and Some (2016); Uppsala Conflict Data Program; Oxford Economics; World Bank (WITS; KNOMAD)
Note: e = estimate; f = forecast. EMDEs = emerging market and developing economies; FDI = foreign direct investment; GDP aggregates calculated using real U S. dollar GDP weights at average 201019 prices and market exchange rates.
A Contributions to the global growth downgrade between the current and the January 2025 editions of Global Economic Prospects.
B Bars show, for EMDEs excluding China, the share of total exports (total inward FDI positions, remittance inflows, and portfolio liabilities) that are to (from) China, the euro area, and the United States. See figure 1.11.Cfor details.
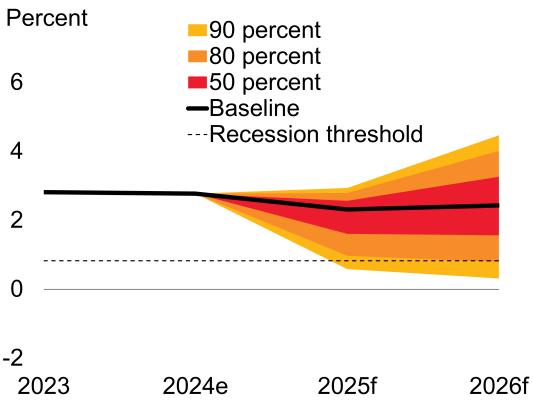
C. The dashed line is the global recession threshold (below zero per capita growth). Probabilities use the range and skewness implied by oil and equity price derivatives, and term spread forecasts Last observation is May 2025
D. Last observation is 2024Q1. See figure 1.13.Bfor details
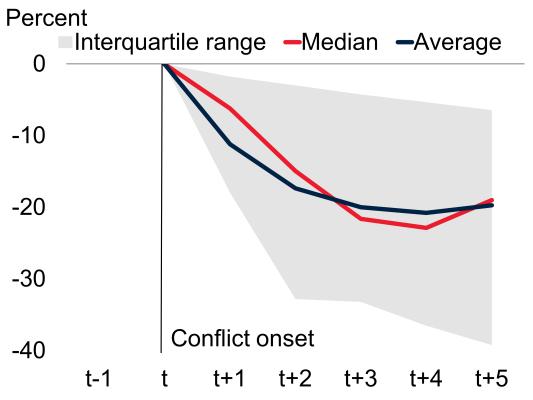
E. Lines show the cumulative gap between forecasted and actual percapita GDP following highintensity conflict. Sample includes 14conflicts in 14 EMDEs (3 not currently FCS) from 2006-23 See figure 1.12 E for details
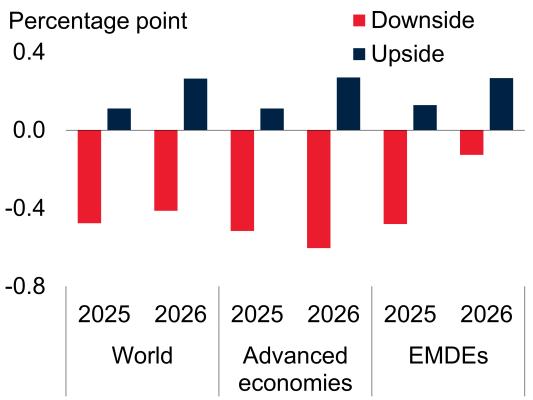
F Panel shows the deviation of aggregate growth in the upside and downside scenarios,using Oxford Economics' Global Economic Model.
Risks to the global outlook remain tilted decidedly to the downside (figure 1.2.C). High and persistent policy uncertainty-particularly related to trade-could lead to greater-than-expected weakening in investment, trade, and confidence. Renewed increases in trade restrictions could push inflation higher in key economies, magnifying real income losses and limiting the scope for major central banks to support flagging growth by lowering policy rates. This backdrop also implies several potential triggers for a souring of financial risk appetite, which could reverberate globally and amplify downside surprises to growth. Even with efforts to resolve some major conflicts, geopolitical tensions and regional conflict risks persist in many parts of the world and could contribute to further geopolitical fragmentation (figure 1.2.D). Moreover, worsening conflict could generate lasting, concentrated output losses, particularly in EMDEs (figure 1.2.E). Natural disasters, the frequency and intensity of which have increased over time, pose another ever-present threat in many economies.
Nonetheless, there are also some notable upside risks to growth. A cooling of trade tensions on the back of recent and ongoing negotiations-for instance, through further trade agreements between large economies that secure lower tariffs-would curb uncertainty, limit trade disruptions, and strengthen business and consumer confidence. A synchronous loosening of fiscal policy in several large economies could mitigate the downward pressures on demand, albeit while also exerting upward pressure on inflation, government debt levels, and interest rates. Efforts to widely employ recent advances in technology-notably artificial intelligence (Al)could give rise to stronger-than-anticipated global investment growth and start to feed into broad productivity improvements.
To quantify downside risks concerning trade policy, a scenario is modeled in which U.S. weighted average tariffs increase by about 10 percentage points relative to the baseline, with proportional retaliation from trading partners. This sudden escalation in trade barriers results in global trade seizing up in the second half of this year and is accompanied by a widespread collapse in confidence, surging uncertainty, and turmoil in financial markets. The combination of these multiplying shocks reduces global growth, by 0.5 and 0.4 percentage point in 2025 and 2026, relative to the baseline, tipping the world economy into an extended period of anemic growth (figure 1.2.F). In contrast, an upside scenario features further trade agreements that halve tariffs relative to the baseline and reduce trade-related uncertainty. Under these conditions, global growth would be higher compared with the baseline by 0.1 and 0 3 percentage point in the next two years.
The challenging global context highlights the need for policy action at both global and national levels. To mitigate the adverse impact of elevated trade barriers and policy uncertainty on global growth, a key priority is to foster dialogue and cooperation to address global imbalances and restore a more predictable, transparent, and rules-based approach to resolving trade tensions and avoiding escalation. The global community also needs to confront the worsening circumstances of many vulnerable
EMDEs amid debt distress, acute food insecurity, and prevalent conflict. Tackling these severe headwinds to growth and development has become more challenging considering declining aid flows from key donors Meanwhile, reinvigorating global efforts toward climate change adaptation and mitigation is vital to limit the future economic and social costs of increasingly frequent natural disasters.
Policy action at the domestic level is critical. Some EMDE central banks will face a difficult balancing act between addressing continuing price pressures, on the one hand, and seeking to moderate the contractionary effects of trade restrictions and policy uncertainty, on the other. This will require careful calibration of monetary policy tailored to each economy's circumstances At the current juncture, some EMDEs may be especially prone to financial volatility and capital outflows, underscoring the importance of central bank credibility With respect to fiscal policy, many EMDEs are not well positioned for the expected slowdown in growth, with fiscal deficits remaining above pre-pandemic averages and debt levels rising in many economies. To build fiscal space, EMDEs need to raise additional domestic revenues, especially where other sources of financing are drying up, while reprioritizing spending toward growth-enhancing measures and protecting vulnerable populations
In the long run, the most sustainable solution to the wide range of challenges facing EMDEsincluding insufficient job creation, slow poverty reduction, debt-related challenges, and scarce fiscal resources-is to foster stronger environments for private investment and raise potential growth. Reinvigorating FDI deserves particular attention, given its historical role as a vector of technology diffusion and productivity gains. Doing so would require improving institutions and safeguarding political, regulatory, and socioeconomic stability
To help EMDEs create productive employment for growing working-age populations, measures to strengthen foundational infrastructure, address structural bottlenecks, and enhance private sector dynamism are critical. Priorities could include
policies that encourage upskilling workers, ease access to finance, and promote labor markets that better match workers and employers. Moreover, policy makers need to consider not only aggregate job creation but also the quality of jobs-for instance, by seeking to improve productivity, ensure good working conditions, and reduce barriers to firms expanding and formalizing. For EMDEs recently or currently embroiled in conflict, attaining durable peace and stability is paramount not only for limiting the human toll but also as a prerequisite for raising employment, human capital, and income levels.
Against the backdrop of heightened policy uncertainty and increased trade barriers, the global economic context has become more challenging, with the risk of further adverse policy shifts materializing, particularly with respect to trade relations among the largest economies. The rise in trade restrictions clouds the near-term trade outlook-despite solid trade growth earlier this year, which partly reflected the front-loading of imports by some large economies in anticipation of tariff hikes. Beyond the direct impact of higher tariffs, the potential for further rapid shifts in the timelines and magnitudes of trade-restrictive measures is a source of sentiment-sapping policy uncertainty. Commodity prices have fallen substantially, reflecting new headwinds to global manufacturing and broader industrial activity. With re-emerging pressures in core inflation globally, the pace of global disinflation has slowed, while survey-based inflation expectations in key countries have risen alongside tariff-related developments. Trade policy shifts and the associated increase in uncertainty weighed substantially on financial markets earlier this year, although risk appetite has largely recovered in recent weeks.
Global trade conditions experienced a large shock in early April when the United States announced prospective tariffs on most trading partners, with rates proportional to bilateral goods trade deficits, in addition to previously announced tariffs. A sharp escalation of trade barriers between China
and the United States followed. Subsequently, country-specific tariffs were reduced to a universal 10 percent-including in the case of China, with initially prohibitively high tariff rates being rolled back sharply in May. However, other tariff increases remain on China and other large trade partners. As a result, the effective U.S. tariff rate has been brought to levels not seen in almost a century (figure 1.3.A). Tariff rates in effect as of May 27 are assumed to prevail throughout the forecast period, but there is notable uncertainty in this regard. The baseline projections for global trade also incorporate important carve-outs for USMCA-compliant goods, pharmaceuticals, semiconductors, bullion, energy, copper, and other critical minerals, as well as retaliatory measures in place as of late May
Shifting policy announcements have led to heightened global trade policy uncertainty, measures of which reached historical highs over the past few months (figure 1.3.B). This reflects uncertainty over whether current tariff rates will endure, their implementation, and the scale and timing of potential retaliatory responses. New tariff measures mark an intensification of the upward trend in trade-restrictive measures seen in recent years, with a significant risk of further escalation in trade barriers, as announced policies could generate substantial spillovers to third markets These markets may respond by adopting protectionist measures to shield domestic industries from a surge in imports
Prior to the recent tariff announcements, growth in global goods trade had accelerated at the turn of the year, partly reflecting inventory build-ups in anticipation of changes in trade policy in major economies (figure 1.3.C). The growth in goods trade has been relatively widespread, albeit with the pace of expansion in advanced economies exceeding that in EMDEs. Likely driven by the rush to front-load imports before tariffs took effect, the global new export orders manufacturing PMI subindex briefly entered expansionary territory in March, signaling temporary improvements in goods trade, before falling in April to its lowest level in 20 months. Global services trade growth has flattened out after several years of recovery from the pandemic, with travel activity approaching pre-pandemic levels. The
stabilization in services trade is also reflected in the continued softening of the expansion in the global services PMI.
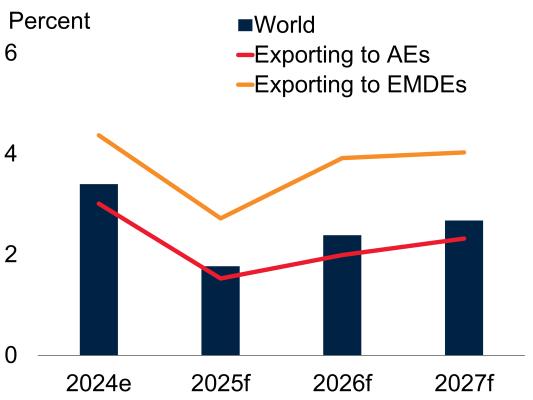
Global trade growth in goods and services is projected to slow sharply in 2025, to 1 8 percent, from 3.4 percent in 2024 (figure 1.3 D). The forecast has been revised down by 1.3 percentage points since January, reflecting changes in trade policies in key economies and higher trade policy uncertainty. Increased tariffs are expected to weigh on global trade over the forecast horizon. In tandem with the projected pickup in global growth, trade growth is nonetheless forecast to firm from a feeble pace this year, reaching 2.4 percent in 2026 and 2.7 percent in 2027-still well below its pre-pandemic average of 4.6 percent. The forecast for global trade growth masks significant heterogeneity. Countries with greater export exposure to EMDE markets are projected to recover more rapidly than those more reliant on advanced economies, though elevated policy uncertainty and weakening demand could weigh on the recovery more broadly.
The outlook for global trade is subject ro substantial downside risks, notably a renewed escalation of trade restrictions. Even absent further escalation, a related risk is that uncertainty about trade and other policies could slow investment, an import-intensive component of GDP, dampening trade more than anticipated.
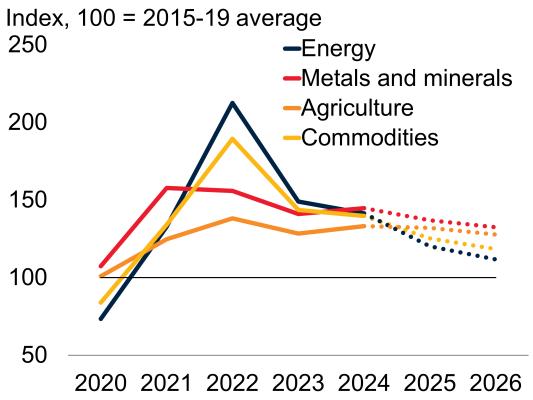
Commodity prices have fallen since February, largely owing to weaker growth prospects amid increased trade barriers and policy uncertainty (figure 1.4 A). Largely reflecting these movements, annual average commodity prices are expected to decline by 10 percent in 2025 (figure 1.4.B). In 2026, commodity prices are projected to soften further, by 6 percent, as production of some energy and metals commodities expands and supply constraints on several agricultural commodities ease Thereafter, commodity prices are projected to edge up as global growth continues to recover, supporting commodity consumption. Risks to the commodity price projections are tilted to the downside, as a renewed escalation of trade tensions between
The effective U.S. tariff rate has risen sharply in 2025 to its highest level in almost a century Trade policy uncertainty, which has reached record-high levels, could further weaken trade prospects. Global goods trade growth had firmed at the turn of the year, partly reflecting inventory build-ups ahead of new tariff announcements Global trade growth is projected to slow substantially in 2025 and then firm in 2026-27, in line with the projected pickup in global growth.
Sources : Caldara etal. (2020); CPB Netherlands Bureau of Economic Analysis; IMF;The Budget Lab;World Bank.
Note : e = estimate; f = forecast. AEs = advanced economies: EMDEs = emerging market and developing economies. Trade in goods and services is measured as the average of export and importvolumes.
A. Panel shows historical and projected customs duty revenues based on tariffs in force as of May 12,2025,as a share of goods imports,without accounting for potential shifts in consumerand business purchasing behavior in response to tariff increases.
B. Trade Policy Uncertainty index based on automated text searches of the electronicarchives of seven newspapers: Boston Globe Chicago Tribune, Guardian, Los Angeles Times New York Times, Wall Street Journal , and Washington Post. A higher value indicates highertrade policy uncertainty. Last observation is May2025.
C. Panel shows the annual percentage change in goods trade volume and industrial production. Last observation is March 2025.
D. Panel shows the growth of global trade volume in goods and services. "Exporting to AEs" refers to trade growth for countries with over 50 percent of exports to advanced economies during the 201519 period;"Exporting to EMDEs"refers to trade growth for countries with over 50 percentofexports to EMDEs during the 2015-19 period.
major economies could further weaken global trade and investment, undermining commodity demand.
Oil prices declined precipitously in early April, as worries about the effect of rising trade tensions on demand coincided with OPEC+ pivoting toward relatively rapid increases in oil production. Brent oil prices are projected to average $66 per barrel this year and $61 per barrel next year, with demand growth set to remain well below 2015-19
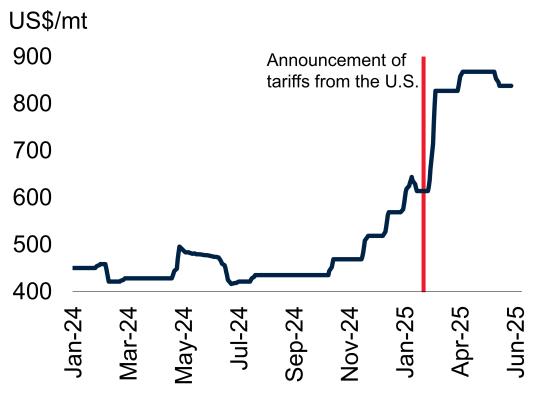
Commodity prices have fallen, partly reflecting deteriorating growth prospects due to increased trade tensions and policy uncertainty. Annual average prices are expected to decline markedly in 2025 and soften further in 2026. Energy prices are forecast to decrease by 15 percent this year, reflecting increases in oil production from OPEC+ and weakening demand growth, which is set to remain well below 2015-19 levels From early in 2025, the front-running of new trade-restrictive measures buoyed aluminum prices to well above global benchmarks.
=
=
Sources : Bloomberg; International Energy Agency (IEA); World Bank. Note: AEs = advanced economies; ASEAN = Association of Southeast Asian Nations; IEA = International Energy Agency; mb/d = million barrels per day.
A B. "Commodity prices"/"Commodities" line refers to the World Bank Commodity Price Index, excluding precious metals.
A Monthly prices. Last observation is May 2025.
B Dashed lines indicate forecasts.
C. Bars indicate the average change in annual oil demand in mb/d for the selected periods Data based on IEA's Oil Market Report, May 2025 edition 2025 and 2026 are projections ASEAN includes the following members: Brunei Darussalam,Cambodia, Indonesia,Lao PDR, Malaysia, Myanmar, the Philippines,Singapore, Thailand,and Viet Nam. Data for Lao PDR is excluded from the calculations due to its unavailability.
D Five-day moving average of July 2025 futures contract for aluminum Midwest premium Premium reflects the additional cost above the London Metal Exchange price for aluminum delivered to U.S. Midwest. Last observation is June 3 2025.
Agricultural commodity prices are forecast to be little changed this year and decrease slightly in 2026-27. In 2025, a surge in beverage pricesreflecting weather-related supply shocks to coffee and cocoa-is expected to be offset by a decline in food commodity prices, partly owing to mounting rice stocks and record-high soybean production In addition, maize prices are projected to edge down, in part due to lower oil prices reducing demand for maize-derived ethanol. In 2026-27, beverage prices are expected to start normalizing, with food prices broadly holding steady, such that overall agricultural prices are forecast to soften slightly.
Metal prices (excluding precious metals) fell sharply in early April as global growth prospects deteriorated, before partially recovering as trade tensions cooled somewhat. From earlier in the year, copper and aluminum prices were bolstered by the front-running of prospective tariff increases, with U.S. aluminum prices substantially exceeding the global benchmark (figure 1.4.D). In all, the metals index is projected to drop by 5 percent in 2025 and drift lower in 2026 before stabilizing. Prices for most base metals are set to decline this year, reflecting trade-related headwinds to global manufacturing. The precious metals price index-reflecting principally gold but also silver and platinum-is projected to buck the broader trend, increasing by more than 30 percent in 2025. Annual average gold prices are expected to reach a record high this year, supported by safe haven flows, before plateauing in 2026-27.
levels (figure 1.4.C). In contrast, annual average natural gas prices are set to climb markedly this year, due mainly to a more than 50 percent jump in U.S. natural gas prices. While European natural gas prices have generally fallen in recent months due to mild weather and adequate inventories, U.S. prices have been buoyed by the ongoing structural expansion of LNG exports. In all, energy prices are projected to decrease by 15 percent in 2025 and 7 percent in 2026, before increasing somewhat in 2027 as oil prices firm.
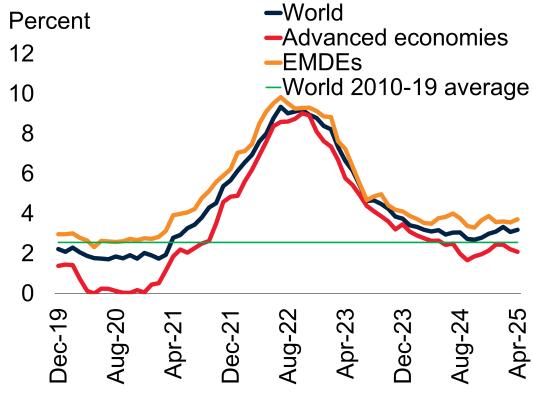
Global headline consumer price inflation has remained elevated above pre-pandemic norms over the past year, briefly edging higher in some advanced economies in early 2025 (figure 1.5.A). Continued tightness in labor markets has kept core inflation at a somewhat elevated level in many economies. In EMDEs, monthly headline inflation readings were volatile earlier this year, with a pickup in core inflation partly reflecting rising services prices and wage pressures.
The outlook for global inflation has become more uncertain since last year due to a combination of shocks. Most notably, substantial tariff hikes are
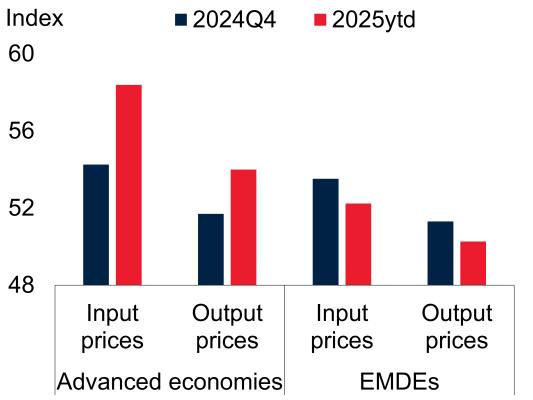
set to exert upward pressure on consumer inflation in key economies by raising prices for imported consumer goods and inputs into production and redirecting demand toward domestic production that is relatively inelastic in the short run (Barbiero and Stein 2025). Indeed, manufacturing purchasing managers in advanced economies have already reported accelerating input and output prices so far this year (figure 1.5.B). Even so, outside economies where import duties have significantly increased, higher trade barriers are likely to be generally deflationary as they weaken external demand. There may nevertheless be other upside risks to inflation in these economies that are indirectly associated with trade restrictions. These include the potential for damage to global supply chains to push up prices in unpredictable ways, and the possibility of sizable currency depreciations.
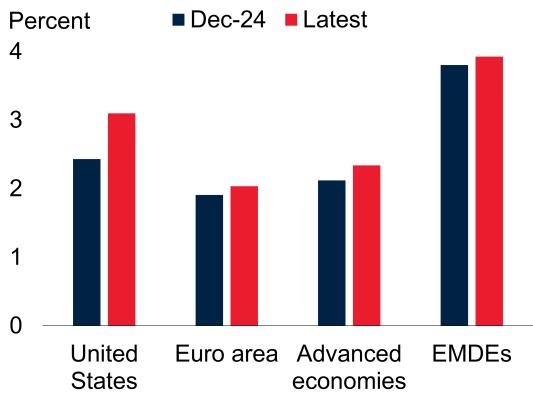
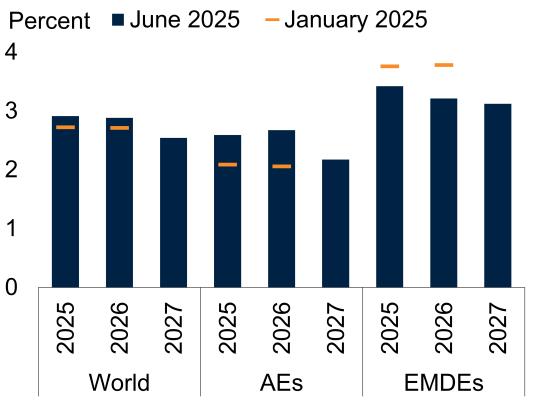
Inflation expectations, particularly at the shorter horizon, have picked up in 2025, mainly in some major economies (figure 1.5.C). This is likely explained by the expected impact of tariff increases on consumer prices, even as trade tensions weigh on economic activity and commodity prices. Persistent underlying inflationary pressures, coupled with the impact of rising tariffs and tradeprotectionist measures, are anticipated to delay the normalization of global inflation to levels broadly consistent with inflation targets. On a GDPweighted basis, global inflation is projected to average 2.9 percent in both 2025 and 2026, before easing to 2.5 percent in 2027-about in line with the average inflation target. However, there is significant heterogeneity across countries, with inflation projections revised slightly lower in EMDEs in 2025 due to the impact of weaker demand for traded goods, while being revised significantly higher in advanced economies, primarily the United States (figure 1.5.D).
Global financial conditions have been tighter this year, on average, compared to late 2024, due to financial market volatility and some decline in risk appetite, fueled by elevated trade policy uncertainty (figure 1.6.A). The surge in and then partial de-escalation of trade tensions in the second quarter led to marked financial market turbulence,
Global headline inflation has remained somewhat elevated over the past year, briefly edging higher in advanced economies in early 2025 . Tariffinduced upward pressure on prices has begun to build along supply chains, particularly in advanced economies, with manufacturing surveys pointing to rising input and output prices Inflation expectations have picked up in 2025, especially in some major economies Inflation projections in 2025-26 have been revised slightly lower in EMDEs on account of weaker demand for traded goods, while being revised notably higher in advanced economies, primarily the United States
Sources: Consensus Economics;Haver Analytics; Oxford Economics; World Bank.
Note: CPI = consumer price index; EMDEs = emerging market and developing economies; PMI = purchasing managers' index;ytd = year to date.
A. Aggregates are calculated as medians. Sample includes up to 36 advanced economies and 99 EMDEs. Last observation is April 2025.
B. Aggregated by source. PMI readings above (below) 50 indicate expansion (contraction). Last observation is April 2025.
C. Panel shows median inflation expectations. Latest survey is May2025.
D. Model-based GDP-weighted projections ofconsumer price inflation using Oxford Economics' Global Economic Model. Sample includes 69countries,out of which 35 are EMDEs, and excludes Argentina and Republica Bolivariana deVenezuela.
including in core government bond markets. Global equity markets plunged in early April, followed by a recovery driven by the postponement of some tariffs and the partial rollback of tariffs between the United States and China. Risk premia in U.S. equity and corporate credit markets, as gauged by cyclically adjusted equity earnings relative to the risk-free rate and highyield spreads, have increased this year, albeit from very low levels (figure 1.6.B).
Monetary policy in the United States remains restrictive, with policy rates unchanged so far this
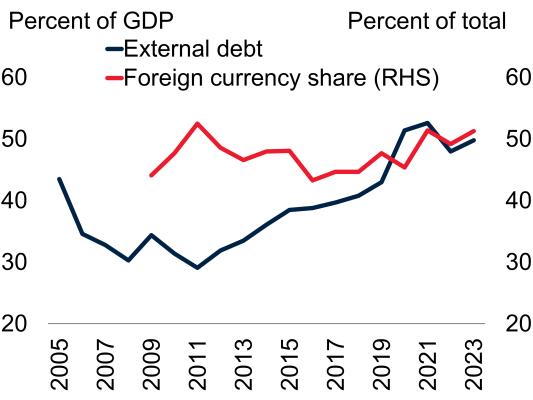
Global financial conditions have been tighter this year, on average, relative to late 2024 amid increased trade barriers, elevated trade policy uncertainty, and concerns of a slowdown in global growth. Risk premia in U.S. equity and high-yield bond markets have edged up, albeit from very low levels. Sovereign spreads have increased overall in EMDEs, although a spike in the spreads of countries exposed to higher U.S. tariffs largely unwound when tariffs were paused. A rise in borrowing costs would put pressure on vulnerable EMDEs with elevated levels of external debt and foreign-currency-denominated government debt, which have increased in recent years. A Financial conditions index
B Risk premia in the United States
EMDE financial conditions have been somewhat tighter, on average, relative to late last year. Tariff announcements in April led to portfolio outflows along with broad-based declines in EMDE equity markets, although these moves largely reversed after the pauses in tariffs were announced. Most EMDE currencies have appreciated against the U S dollar since the start of the year, except for some economies with pre-ex1stmg domestic vulnerabilities. EMDE sovereign spreads have increased overall in recent months, jumping in April among economies that faced higher prospective trade barriers (figure 1.6.C). However, this surge proved short-lived, with spreads generally retreating when trade tensions partially de-escalated. Despite this volatility, from a longerterm perspective, spreads have remained at manageable levels in most economies.
C. EMDE sovereign spreads, by announced U.S. tariff rate
D. EMDE external debt and foreigncurrency-denominated debt
PercentofGDP Percentoftotal -External debt
60 - Foreign currency share (RHS) 50
Sources : Barclays Investment Bank;Bloomberg; Federal Reserve Bankof St. Louis; Goldman Sachs; J.P Morgan; Kose et al. (2022); White House; World Bank.
Note: EMDEs = emerging market and developing economies.
A Higher index values represent tighter financial conditions. Last observation is May 30 2025
B "Shiller excess earnings yield" is the inverse of the cyclically adjusted price-to-earnings ratio minus the yield on 10-year U.S Treasury inflation-protected securities "High-yield corporate bond spreads" are measured by ICE BofA Option-Adjusted Spreads (OASs) These represent the calculated differences between a computed OAS index for all bonds rated below Baa/BBB and the spot U.S Treasury curve. Last observation is April 2025 for the yield and May 2025 for the bond spreads
C. Median spreads for 6 high-tariff EMDEs and 58 low-tariff EMDEs "Low tariff' is defined as a tariff rate of up to 30 percent as announced on April 2 Last observation is May 30 2025
D External debt (percent of GDP) is the median of up to 137 EMDEs. Foreign-currency share of government debt is the median of up to 36 EMDEs. Last observation is 2023.
year and anticipated to decline only gradually, despite expectations of a slowdown in growth. This partly reflects the Federal Reserve's communications regarding the need to ensure that near-term inflationary pressures do not become persistent and long-term inflation expectations remain anchored. Meanwhile, policy rates have been lowered in the euro area since January, with further cuts expected by the end of the year. Even so, long-term yields have risen, reflecting fiscal announcements earlier in the year.
Monetary policy in EMDEs has become more cautious, with many central banks easing or holding their policy rates unchanged as they assess the consequences for inflation and growth of higher trade barriers, elevated uncertainty, and potential shifts in investor appetite for EMDE financial assets. Policy rates may be kept higher for longer to ward off possible capital outflows and currency depreciations that could result from a renewed escalation of trade tensions. As a result, higher borrowing costs and weaker domestic currencies could put pressure on many EMDEs, especially those with weak credit ratings and large debt-refinancing burdens. External debt and the share of foreign-currency-denominated government debt in EMDEs have risen in recent years and are currently at elevated levels (figure 1.6.D).
Advanced economies
In advanced economies, growth forecasts for 2025 have declined substantially since January, driven by downgrades in some of the world's largest economies. This reflects the shock dealt by the increases in trade barriers-even with the partial 90-day pause in U S. tariff increases-and the associated policy uncertainty, financial volatility, and dampening effects on confidence As a result,
growth is expected to remain below potential growth estimates over the forecast horizon in some advanced economies, including in the United States and the euro area.
In the United States, the announcement of trade policy changes did not provide much-needed clarity or reduce policy uncertainty, given the scale and scope of new tariffs, shifting timelines for their implementation, and fluid lists of exemptions Furthermore, the implications of such large policy shifts, including potential steps that could be taken by other governments in response, remain highly unpredictable
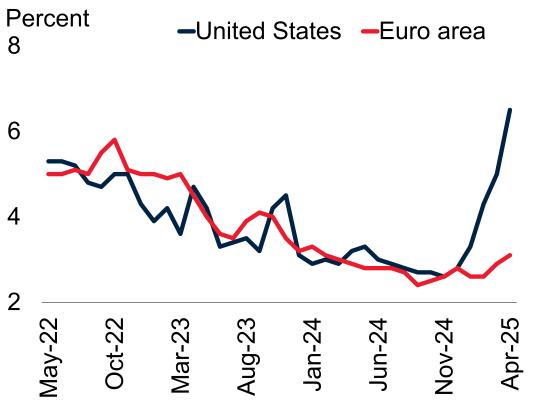
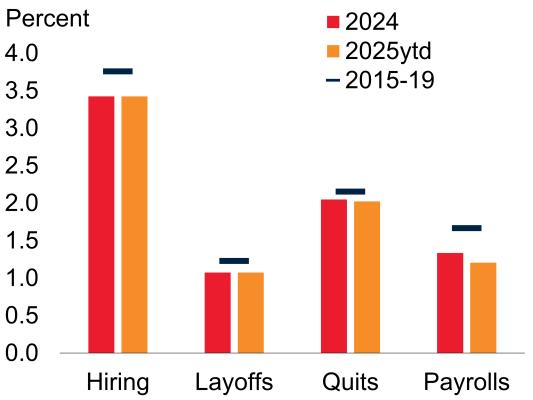
Prior to recent tariffs coming into effect, U.S. activity had already begun to slow in early 2025 as spending on imports surged at the expense of domestically produced goods. Private consumption growth has eased somewhat, despite a brief pickup toward the end of the first quarter in anticipation of new tariffs in categories such as autos Consumer sentiment has fallen sharply amid declines in equity markets and risk appetite. In addition, U.S. consumer inflation expectations have risen markedly since the start of the year (figure 1.7.A) Treasury yields have increased, and corporate risk spreads have widened, while some corporate sectors faced the risk of disruption to tightly integrated supply chains, particularly in the U.S. auto industry. Policy uncertainty has remained high, with many firms highlighting concerns about the impact of trade policy changes on prices (Federal Reserve Board 2025). In tandem, the resilience in U S labor markets has continued to gradually diminish, with nonfarm payroll growth below the 2015-19 average and easing further, and other labor market indicators signaling reduced dynamism (figure 1.7.B).
The outlook for U.S. growth and inflation in 2025 has deteriorated relative to January forecasts. The rise in trade barriers, heightened uncertainty, and the spike in financial market volatility are set to weigh on private consumption, international trade, and investment. As a result, U.S. growth is expected to decelerate sharply in 2025, to 1.4 percent. Investment spending is projected to be particularly hard-hit following the earlier frontloading of imported investment goods
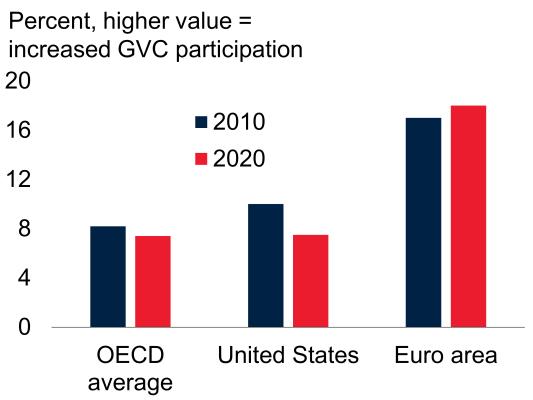
U.S. consumer inflation expectations have risen markedly this year amid escalating trade tensions. Increased trade restrictions, weak confidence, and the resulting slowdown in aggregate demand are expected to contribute to reduced dynamism in the U.S. labor market. In the euro area, activity is expected to remain anemic, particularly given its deep integration in global value chains, which leaves the bloc highly exposed to adverse shifts in trade policy. In China, goods exports expanded in early 2025, reflecting continued front-loading, but are expected to slow as the effects of rising trade restrictions and the associated policy uncertainty are felt.
C. Global value chain exposure:Share D Merchandise trade in China of foreign value added in gross exports
Sources: ECB; Federal Reserve Bank of St. Louis; Haver Analy1ics; Organisation of Economic Cooperationand Development (OECD);University of Michigan;World Bank
A Panel shows 12-month-ahead consumer inflation expectations from the Michigan Consumer Sentiment Survey and the European Central Bank (ECB) Consumer Expectations Survey. Last observation is April 2025
B. Hiring, layoffs, and quits and separations are shown as percent of employment. Payrolls are shown as year-over-year percent change. Panel shows simple averages for the indicated periods. Last observation is April 2025 y1d = year to date.
C Data measure the extent to which a country is a user of foreign inputs, which is considered as a measure of backward linkages in analyses of global value chains, as computed by the OECD Euro area aggregates exclude intra-regional trade. Due to data constraints, euro area excludes Croatia
D Lines indicate year-on-year percent change in goods exports and imports in US dollars Last observation isApril 2025
forward, the supply of investment goods is anticipated to be disproportionately impacted by tariffs due to their high import content, at the same time as investment demand cools due to record-high uncertainty, the rise in financing costs, and reduced domestic and external demand.
In 2026, growth is anticipated to edge up to 1.6 percent as the economy adjusts to higher trade barriers and policy uncertainty gradually declines.
Growth could prove to be stronger over the next few years if proposals to extend some expiring prov1s10ns of the Tax Cuts and Jobs Act and introduce other new fiscal measures clear the legislative process and are implemented. The resulting increase in the federal budget deficit would then be likely to broadly offset the budgetary impact of additional tariff-related revenues, with the latter estimated to reduce the primary deficit by $2.5 trillion over 10 years (CBO 2025).
In the euro area, the recent surge in policy uncertainty and financial volatility, as well as increases in tariffs on the European Union (EU), are set to prolong the bloc's economic weakness, holding back a recovery in investment and trade. The EU is exposed to adverse shifts in trade policies and related uncertainty given its high openness to trade, with extra-EU trade in value terms placing the bloc as the second largest exporter and importer of global goods in 2022 (ECB 2019; Eurostat 2024). The bloc is also vulnerable to these external shocks owing to its deep integration into global value chains (figure 1.7.C; Gunnella and Quaglietti 2019). Together, these developments are set to further dent exports, compounding the losses in competitiveness and global export market shares stemming from high energy prices in the past few years.
Growth in the euro area is projected to slow in 2025, to 0.7 percent, and remain a touch below its trend of about 1 percent, averaging 0 9 percent over 2026-27. Substantial downgrades to growth forecasts relative to January projections reflect a combination of higher U.S. tariffs on imports from the EU, heightened uncertainty and financial market volatility, and weaker external demand, which are expected to more than offset newly legislated fiscal spending on defense and infrastructure-particularly in Germany. Although trade spillovers from higher spending in Germany to other euro area economies are expected to be positive, they are likely to be somewhat muted by the slow implementation of the package given Germany's capacity constraints.
The baseline is also predicated on additional policy rate cuts as inflation is expected to hover near the ECB's medium-term target. Although
possible price pressures could arise from increased trade barriers and additional government spending, they would likely be somewhat countered by weaker demand, softer commodity prices, and the potential redirection of exports from China to the EU (Attinasi et al. 2024; ECB 2025) The baseline assumptions include U.S. tariffs, including those on sectoral goods, as of late May and do not include any potential retaliatory trade measures
In Japan, growth is expected to firm from an estimated 0 2 percent in 2024 to 0 7 percent in 2025, underpinned by a rebound in consumption and the reopening of automobile plants after longer-than-expected shutdowns last year. However, the growth outlook has been downgraded by 0 5 percentage point this year relative to previous projections, largely due to slowing external demand amid increased trade barriers and weaker-than-expected real wage growth owing to elevated food inflation Over 2026-27, growth is forecast to average 0.8 percent, assuming a slow but continued recovery in consumer spending, as well as modest growth in capital investment, even if it is partly moderated by policy interest rate hikes as the Bank of Japan normalizes its policy stance.
In China, the imposition of tariffs by the United States, the ensuing retaliation, and the subsequent partial rollback will have notable implications for the outlook of trade and broader economic activity. Before these policy actions, China's growth remained resilient in the first quarter of 2025, driven by a front-loading of exports ahead of the implementation of tariffs (figure 1.7.D). In contrast, imports were sluggish, held back by continued tepid domestic demand amid the property sector downturn, now approaching the four-year mark. Resulting soft underlying price pressures, as well as falling food and energy prices, led to decreasing consumer prices earlier in 2025. Producer prices also continued to fall, reflecting declining global commodity prices and competition among firms for market share.
To help strengthen domestic demand and counter headwinds from trade tensions and heightened
trade policy uncertainty, additional fiscal support was announced in early 2025, implying an estimated consolidated fiscal deficit of 8.1 percent of GDP in 2025, wider than the 6.5 percent of GDP in 2024. 1 These measures are aimed at further boosting infrastructure-related spending and, to a much lesser extent, consumer spending. More recently, additional monetary policy easing and financial measures targeted at several sectors were announced to support domestic economic activity
Going forward, growth is forecast to slow from 5 percent in 2024 to 4.5 percent this year-in line with previous projections, as the impact of higher trade barriers and weaker external demand is assumed to be offset by the boost from additional fiscal policy support. Export growth is expected to slow as the impact of U.S. tariff increases materializes. A soft labor market and a subdued property sector are expected to weigh on consumption However, announced additional fiscal support will help buoy non-property-related investment, consumption, and industrial activity. Growth is projected to slow to 4 percent in 2026 and edge down to 3.9 percent in 2027, as the growth of potential ourpur decelerates, reflecting the effects of slowing productivity growth, an aging population, and high debt levels
Against the backdrop of a more challenging external environment, EMDE growth is forecast to slow significantly in 2025, to 3.8 percent, with only a modest projected pickup in 2026-27 The expected rate of growth is well below prepandemic averages and the pace that is needed to create sufficient jobs to meet working-age population growth and make progress in closing large per capita income gaps with advanced economies. The deterioration in EMDE growth prospects is driven in large part by economies with a high degree of trade and investment openness. In these economies, large manufacturing sectors,
high global value chain participation, and reliance on global financial markets amplify the negative spillovers from the recent shocks to global trade and confidence and the sharp rises in uncertainty and financial market volatility. However, the softness in the EMDE outlook is anticipated to be broad-based, with growth expected to slow in nearly 60 percent of EMDEs in 2025. More generally, the capacity of many EMDEs to respond to negative shocks has diminished due to sharp pandemic-related increases in debt, elevated poverty rates, and waning official development assistance.
Prior to the recent deterioration in the external environment this year, activity in EMDEs had generally steadied over 2024, with domestic demand supported by generally benign financial conditions and solid credit growth (figure 1.8 A). Although domestic activity indicators remained relatively resilient over the first quarter of 2025, the rapid rise in uncertainty and slowdown in external demand have begun to act as a drag on acnv1ty. Gauges of manufacturing acnv1ty, including headline manufacturing PMis and goods trade indicators, have eased recently. Some trade-exposed EMDEs-such as Malaysia, Mexico, Romania, and Viet Nam-have seen the new export orders component of the manufacturing PMI weaken markedly since November amid increasing global trade policy uncertainty (figure 1.8.B).
On the services side, PMis have remained in expansionary territory bur nonetheless have trended lower this year (figure 1.8.C). Highfrequency consumption indicators also point to a similar dynamic, with both consumer confidence and retail sales losing some momentum in recent months. Nonetheless, the so-far generally resilient trends are expected to lose momentum amid the sharp rise in uncertainty following increases in trade restrictions and other policy shifts (figure 1.8.D).
1 For China, the World Bank uses a definition of the consolidated fiscal balance that allows for comparisons across countries. See chapter 2 for details
Growth has continued to diverge across EMDEs so far in 2025, with a slower pace of activity in some commodity-exporting EMDEs and somewhat more solid conditions across other
Before the recent deterioration in the external environment, activity in EMDEs had been supported by solid credit growth, in line with earlier domestic and global monetary policy easing. More recently, some tradeexposed EMDEs have seen a marked decline in new export orders, while services activity and other high-frequency indicators have trended lower Against the backdrop of a sharp rise in uncertainty, momentum across EMDEs is expected to ease further.
A EMDE credit impulse B. Manufacturing PMls: New export orders
the upside in some large energy-exporting EMDEs-including Russian Federation, Saudi Arabia, and Nigeria-largely owing to domestic factors outside of the energy sector.
In commodity-importing EMDEs excluding China, activity had remained broadly steady before the sharp rise in trade tensions, supported by a pickup in private consumption and investment, with the latter benefiting from firm manufacturing acnv1ty. Despite overall solid performance, some economies have seen a material weakening in activity in recent quarters, largely reflecting an increase in uncertainty related to domestic developments or rising trade barriers.
C. Headline PMls: Manufacturing and services D. Overall World Uncertainty Index across EMDEs
Sources : Ahir, Bloom, and Furceri (2022); HaverAnalytics;World Bank.
Note: EMDEs = emerging market and developing economies; PMI = purchasing managers' index.
A Sample includes up to 36 EMDEs Last observation is December 2024
B Blue line shows a 3-month moving average for a sample of select trade-exposed EMDEsthat includes Malaysia,Mexico, Romania and Viet Nam. Red line shows a 3-month moving average for a sample of 12 EMDEs. Last observation is April 2025. Shaded area indicates the interquartile range for all 16 EMDEs
C. PMI readings above (below) zero indicate expansion (contraction) Monthly readings are centered on 50, the expansionary threshold Last observation is April 2025
D Panel shows the 3-month moving average of the unweighted average of the country-specific measure of overall uncertainty based on the World Uncertainty Index (WUI). All indices have been computed by counting the frequency of the world uncertainty (or its variant) in EIU country reports The indices are normalized by total number of words and rescaled by multiplying by 1,000. A higher number means higher uncertainty and vice versa. Sample includes 49 EMDEs. Last observation is April 2025
In LICs, growth is estimated to have firmed to 4.6 percent in 2024, up from 2.8 percent a year earlier. The pickup in activity last year was driven mainly by major LICs facing fragile and conflict-affected situations (FCS)-including the Democratic Republic of Congo, where mining activity surprised on the upside, and in Ethiopia, where mining and agriculture output was better than expected. Such positive momentum hinged on tailwinds from commodity markets and favorable financing conditions prevailing in 2024, which may give way to headwinds as global growth and trade slow, commodity prices weaken, and uncertainty dampens risk appetite. Moreover, pervasive violence and political instability have resulted in persistently challenging economic and humanitarian situations, particularly in the Sahel region and its adjacent countries. Sudan has continued to experience a deep contraction related to ongoing violent conflict, which has also hampered activity in neighboring South Sudan, leading to a steeper-than-anticipated decline in output.
economies. The weaker performance among the former was mostly concentrated in energyexporting economies and related to softness in global energy demand; ongoing OPEC+ production cuts; notable declines in commodity prices amid rising trade tensions, which weighed on net exports, revenues, and investment; and new sanctions on some oil-exporting economies. Prior to the deterioration in the external environment, earlier activity readings had modestly surprised to
Following the trade shocks that have rippled through the global economy, growth in EMDEs is forecast to slow to 3.8 percent in 2025, then edge up to an average of 3.9 percent over 2026-27, about 1.2 percentage points below the 2010-19 average (figure 1.9 A). In large part, the aggregate EMDE profile continues to be shaped by China's outlook, especially as the ongoing structural deceleration is exacerbated by the escalation in
trade tensions Nevertheless, the projected slowdown in EMDE growth this year is anticipated to be broad-based, affecting nearly 60 percent of EMDEs
Excluding China, growth in EMDEs is forecast to decelerate from an estimated 3 6 percent in 2024 to 3.4 percent in 2025 and then pick up to about 3.9 percent over 2026-27. EMDE growth this year and next is projected to be notably weaker than expected in January. This reflects a combination of adverse policy shifts at the global level announced since the beginning of 2025and the limited space to respond to such headwinds in most EMDEs-and weaker external demand related to slowing growth in advanced economies, as well as lower prices for some commodities. These global shocks are propagating to EMDEs through trade, investment, and confidence channels, all of which are being amplified by record-high global policy uncertainty and financial market volatility.
The ability of EMDE governments to respond to these global shocks is constrained by limited fiscal policy space amid elevated debt levels and the tightening of financial conditions. As such, fiscal policy is expected to either dampen or have a neutral effect on growth in about three-quarters of EMDEs, while financial conditions across EMDEs have tightened somewhat since the start of 2025 more broadly.
Over the forecast horizon, domestic demand is expected to continue to anchor growth, despite the substantial downgrade to its outlook since January. Among EMDEs excluding China, investment growth is envisaged to substantially weaken in 2025, with forecasts for investment and trade downgraded relative to January owing to declining business confidence and nsmg uncertainty-particularly in some trade-exposed EMDEs (figure 1.9.B). The slowdown in investment this year is expected to be broad-based, affecting nearly 60 percent of EMDEs. Private consumption is anticipated to be the principal driver of domestic demand, but it is also expected to decelerate steeply in 2025, in line with declining consumer confidence and nsmg uncertainty. Over 2026-27, consumption growth
EMDE growth is expected to slow this year, with forecasts for trade and investment revised down markedly across many economies. The deterioration of the external environment and ongoing trade policy uncertainty is anticipated to weigh materially on advanced-economy demand for EMDE exports, as well as foreign direct investment (FD/) flows to EMDEs. Against the backdrop of elevated uncertainty and growing protectionism, FOi-which has historically served as a key long-term driver of growth across EMDEs-will likely weaken. This could compound the challenge many EMDEs face to ensure the creation of sufficient employment for swiftly expanding working-age populations.
B Share of forecast revisions across EMDEs for 2025, by component
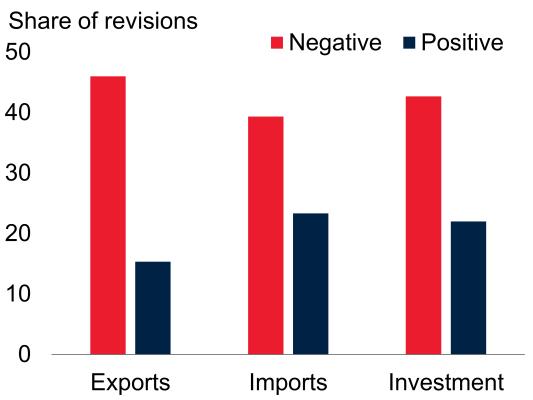
D. Inward foreign direct investment to EMDE regions, by source
F Change in the working-age population from 2025 to 2030
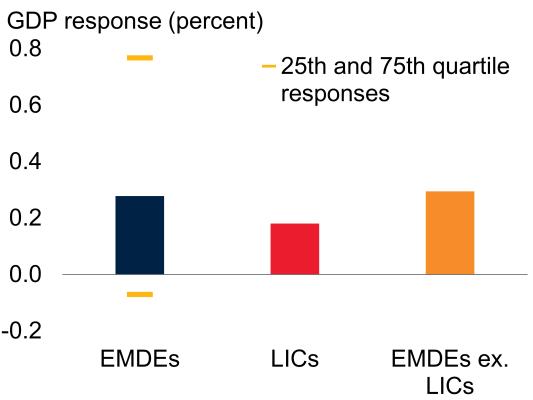
Sources: IMF Coordinated Direct Investment Survey (IMF-CDIS) (database); UN Population Prospects (database); WITS (database); World Bank.
Note: e = estimate; f = forecast. AEs = advanced economies; EAP = East Asia and Pacific; ECA = Europe and Central Asia; FDI = foreign direct investment; LAC = Latin America and the Caribbean; LICs = low-income countries; MNA = Middle East and North Africa; PVAR = panel vector autoregression; SAR = South Asia; SSA= Sub-Saharan Africa.
A. Discrepancies between GDP growth and the sum of its components reflect inventories and residuals.
B. Forecast revisions relative to the January 2025 Global Economic Prospects for up to 150 EMDEs. C.D. Data is for 2023. Sample includes 169economies for panel C and 189 for panel D.
E Impact after 3 years of a 1a-percent increase in net FDI inflows on real GDP level (in percent), based on heterogenous PVAR model estimations. Bars show average country group responses. Horizontal lines show impact in countries at the 75th percentile and 25th percentile responses of GDP to FDI inflows. Sample includes74 EMDEs 11 of which are LICs. F. Panel shows the change in the working-age population over 2025-30.
in EMDEs excluding China is envisioned to remain subdued, as real wage and productivity growth weaken amid adverse policy shifts impacting trade and investment flows to EMDEs, while idiosyncratic factors in several large economies, such as India and Russia, see consumption growth moderate.
In many EMDEs, net exports are expected to be dampened by weaker external demand from key trading partners, especially given tight trade linkages with advanced economies in some EMDE regions (figure 1.9.C; box 1. 1). In parallel, ongoing trade policy uncertainty and concern over market access to advanced economies are expected to weigh on foreign investment flows from key trading partners to EMDEs (figures 1.9.D).
With the rise in trade barriers and elevated uncertainty, the recovery in EMDEs from the shocks of the past five years remains incomplete In EMDEs excluding China, the level of output is anticipated to remain about 4 percent below the pre-pandemic trajectory in 2027. Indeed, if growth were to continue at the pace forecast for 2027, it would take about two decades for output to return to the pre-pandemic path.
Against the backdrop of another delay in the postpandemic recovery across EMDEs, uncertainty and risks continue to mount, with trade growth in EMDEs set to come under further pressure after weak performance in recent years. These developments will likely place further strain on global value chains and slow the pace of investment-including foreign direct investment, which has been a key driver of economic growth in many EMDEs (figure 1.9.E). Indeed, participation in global value chains linked to advanced economies remains substantial in some EMDE regions, which has historically fostered productivity growth and technological adoption across EMDEs-but also has the potential to amplify the effects of trade fragmentation (World Bank 2021).
Over the longer run, a major jobs challengeensuring the creation of sufficient employment opportunities for rapidly growing working-age populations-is looming in many EMDEs, including in the poorest two regions-SSA and
SAR-and MNA (figure 1.9.F). Taken together, SSA, SAR, and MNA are envisaged to add about 1 billion people to their working-age populations between 2025 and 2050. This increase is historically large relative to previous episodes of rapid working-age population expansion, in both numerical and percentage terms. Most of these additional people will need jobs In almost all SSA countries, the expected average annual growth in the working-age population between 2025 and 2030 is set to exceed the average annual employment growth seen over 2010-19. Absent sufficient new job creation, various economic, social, and political pressures could rise in countries with fast-growing populations.
With the backdrop of deteriorating global economic prospects, projected growth across LICs has been downgraded by 0.4 percentage point in 2025, to 5.3 percent. Although this represents an uptick in growth from last year, the rebound hinges on a recovery that is already being hindered by violent conflict in parts of SSA, particularly Sudan (box 1.2).
Growth in LICs is expected to rise to 6.1 percent over 2026-27. Yet the LICs' outlook remains highly uncertain and depends on the evolving circumstances in economies marred by conflict, where substantial improvements in security situations will need to take place. Furthermore, the forecast assumes that no new conflicts or debt crises in LICs emerge, and that inflation continues to broadly abate. Moreover, given LICs' high dependence on commodity exports, weakening external demand and lower global commodity prices could still dampen growth and government revenues in many economies.
Notwithstanding the expected pickup in growth, the level of output across LICs is projected to remain about 3.7 percent below the pre-pandemic trajectory by 2027. Growth prospects of non-FCS economies have deteriorated materially, while the near-term outlook for FCS LICs has been marginally revised up from last January Nevertheless, many LICs continue to face severe challenges related to conflict, including the destruction of productive capacity and significant
All emerging market and developing economy (EMDE) regions face a challenging outlook amid the rise in global trade tensions and heightened uncertainty. In 2025, growth is projected to slow in East Asia and Pacific (EAP) as well as in Europe and Central Asia (ECA)-both regions that are highly reliant on global trade-and, to a lesser extent, in South Asia (SAR). In Latin America and the Caribbean (LAC), growth is projected to be the lowest among EMDE regions over the forecast horizon, as activity is held back by high trade barriers and long-standing structural weaknesses In regions with a large number of commodity exporters, including in the Middle East and North Africa (MNA) and Sub-Saharan Africa (SSA), growth is anticipated to face drags from the weakening outlook for external commodity demand. Against the backdrop of a deteriorating global environment, growth forecasts for 2025 have been downgraded in all EMDE regions relative to January projections. The looming jobs challenge faced by EMDEs could intensify already weak trends in per capita income catch-up and extreme poverty reduction. Risks to the outlook remain tilted to the downside and stem especially from additional increases in trade restrictions and policy uncertainty, as well as the further weakening in external demand and heightened financial volatility. To varying degrees, EMDE regions also face downside risks from declining global risk appetite, worsening or increasing conflict and violence, and more frequent natural disasters.
Emerging market and developing economy (EMDE) regions are being buffeted by a variety of adverse factors-in particular, the wide-ranging repercussions of a rise in trade tensions and the ensuing increase in global policy uncertainty, which are affecting EMDEs through trade, commodity, financial, and confidence channels. In addition to the increase in trade barriers and uncertainty and the subsequent weakening in external demand, the projected deceleration in growth is also related to idiosyncratic factors across regions, including headwinds from elevated levels of violence and conflict, heightened domestic political uncertainty, and the impact of recent natural disasters.
Growth is projected to slow in most EMDE regions this year, particularly in the trade-reliant economies of East Asia and Pacific (EAP) and Europe and Central Asia (ECA), and to a lesser extent in South Asia (SAR). In Latin America and the Caribbean (LAC), growth is expected to be the lowest among the EMDE regions over 2025-27, as structural weaknesses are amplified by softening activity in the United States and China via tight linkages through trade, financial flows (including remittances), and commodity markets (in the case of China). Although growth is set to edge up in the Middle East and North Africa (MNA) and Sub-Saharan Africa (SSA) in 2025, this follows soft activity over the past couple of years, partly related to conflict and, in some economies, oil production cuts. Furthermore, lower global commodity prices are set to weigh on
Note : This box was prepared by Samuel Hill and Collette Wheeler.
activity and government revenues in some commodity exporters in MNA and SSA, as well as in LAC and ECA As a result of this weak outlook, prospects for spurring the job creation that is needed to lift incomes and reduce poverty are subdued.
In this context, this box considers two questions:
What are the cross-regional differences in the outlook for growth?
What are the key risks to the outlook for EMDE regions?
While the economic outlook varies across EMDE regions, it remains challenging for all amid the deterioration in the global economic environment (figure B1.1.1.A; chapter 1). Increases in global trade barriers and uncertainty, as well as the subsequent projected weakening in external demand, have contributed to downgrades to growth forecasts for this year and next in most EMDE regions (figure B1.1.1.B).
In some trade-exposed regions, the growth slowdown in 2025 relative to last year is expected to be broad-based, affecting 78 percent of EAP economies and 73 percent of ECA economies. In many commodity-exporting regions-including ECA, LAC, MNA, and SSAactivity and fiscal revenues in some large commodity exporters are expected to come under pressure this year and next from softening global commodity demand. Among the regions, aggregate growth in LAC is expected to be the lowest over 2025-27, followed by ECA, as the weakening in the external environment amplifies domestic challenges and exacerbates the deceleration in growth.
Growth in all EMDE regions is facing considerable headwinds amid a notable deterioration in the external environment, resulting in weaker growth projections this year relative to pre-pandemic trends and previous forecasts. For most regions, increased trade barriers and heightened policy uncertainty at the global level-including the impacts on external demand, financial and commodity markets, and broader sentiment-are offsetting tailwinds to domestic demand from moderating inflation and, in some cases, macroeconomic policy support. The pace of per capita income catch-up with advanced economies is projected to be slower in many EMDE regions than in 2010-19, with income gaps widening in some-notably in Sub-Saharan Africa, the poorest region. The rapid deterioration in the external environment is likely to further weigh on progress in per capita income catchup.
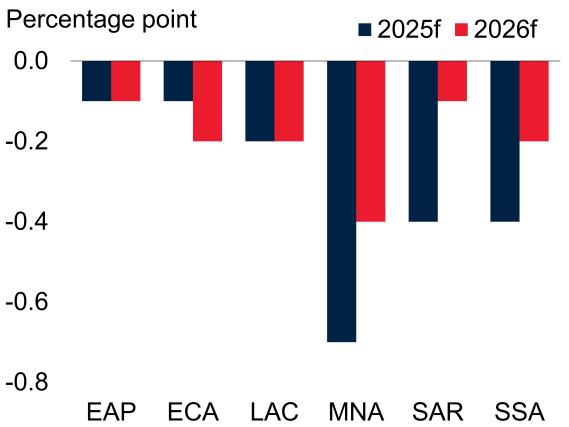
Source: World Bank.
Note: e = estimate; f = forecast. EAP = East Asia and Pacific; EGA= Europe and Central Asia; EMDEs = emerging market and developing economies; LAC = Latin America and the Caribbean; MNA = Middle East and North Africa;SAR = South Asia;SSA = Sub-Saharan Africa.
A. Aggregated growth rates are calculated using GDP weights at average 2000-18 prices and market exchange rates "2010-19" refers to period averages of regional growth rates. Data for 2025, 2026, and 2027 are World Bank forecasts
B Revisions reflect differences in forecasts presented in the January 2025 edition of the Global Economic Prospects report and the current forecasts Data for 2025 and 2026 are World Bank forecasts
C. Bars and dashes represent annual average GDP per capita growth in EMDE regions minus the annual average GDP per capita growth in advanced economies, expressed in percentage points
In EAP, the slowdown this year largely reflects tight trade linkages-both globally and within the region, especially with China, where macroeconomic policy support is expected to counter the adverse impact of recent increases in trade tensions with the United States. In some EAP economies, including Myanmar, Thailand, and Vanuatu, activity has been disrupted by powerful earthquakes in recent months. In ECA, although the deceleration in growth is broad-based, in tandem with the projected weakening of euro area growth-one of ECA's largest export markets-it also reflects the slowdown in activity in the Russian Federation amid the lagged effects of monetary policy tightening.
In LAC, although growth is expected to remain at the same pace in 2025 as in 2024, activiry in many economies is likely to be impacted by the recent rise in trade barriers and policy uncertainty. Mexico will be
particularly affected, largely through its high integration with the United States via goods' trade-particularly the automotive sector. Other LAC economies, particularly those in Central America and the Caribbean, will also be affected through trade, investment, and remittance flows. These drags on LAC's growth are expected to offset the rebound in Argentina following two years of recession
In contrast to most other regions, growth is forecast to pick up this year in MNA as activity in oil exporters benefits from rising oil production amid the phase-out of OPEC+ oil production cuts. This improvement is expected to counter the adverse effects of weakening external demand and lower oil prices. Growth is also contingent on expanding activity in MNA's oil importers, assuming that armed conflicts in the region stabilize and inflationary pressures ease. Although growth in SAR is projected to remain the fastest among
Additional increases in global trade barriers and policy uncertainty could further weaken activity in many EMDE regions , particularly in those with tight trade linkages to advanced economies Import tariffs, which were already elevated in EMDE regions prior to this year, could rise if EMDEs undertake retaliatory measures in response to recent increases in trade restrictions Heightened conflict and its fallout continue to pose a major risk to activity in all regions , particularly in EGA, MNA, and SSA.
A New trade-distorting policy measures
B Tariff rates on imports into EMDE regions and share of EMDE regional exports to advanced economies
C. Conflicts
Sources: ACLED (database); WDI (database);World Bank
Note : AEs = advanced economies; EAP = East Asia and Pacific; ECA = Europe and Central Asia; EMDEs = emerging market and developing economies; LAC= Latin America and the Caribbean; MNA = Middle East and North Africa; RHS = right-hand scale; SAR= South Asia;SSA= Sub-Saharan Africa
A. The numberof harmful trade measures implemented by and affecting different EMDE regions These measures include the sum of "Amber" and "Red" measures classified as hannful in the Global Trade Alert database Each measure may be implemented by, and target, multiple countries Data are adjusted for reporting lags as of June 4, 2025
B. Bars show the most favored nation tariff rate for each EMDE region,based on unweighted average across all products, 2022 orthe latest available Markers show, for EMDE regions the share of total exports that are directed to advanced economies Export data refer to 2023 Sample includes 106 EMDEs for exports data.
C Stacked bars show three-month moving averages of the numberof reported individual conflict events per million people in each ofthe six EMDE regions Major conflicts involve multiple conflict events,including battles explosions riots, and violence against civilians The date of Russia's invasion of Ukraine is February 24, 2022
The date of the conflict in the Middle East is October 7, 2023. Last observation is May 2025.
the regions, the rise in global trade barriers and elevated uncertainty is set to keep growth below the prepandemic average. In some SAR economies, the effect from heightened global uncertainty is expected to be somewhat countered by reduced domestic political uncertainty, which should help support confidence and investment. In SSA, growth is forecast to edge up this year, but the outlook remains highly uncertain and depends on an easing in inflation and de-escalation of conflict in some fragile and conflict-affected situations (FCS; box 1.2). However, lower global commodity prices are expected to weigh on regional activity and revenues. Moreover, elevated government debt, stillhigh interest rates, and rising debt-servicing costs have further narrowed fiscal space, prompting fiscal consolidation efforts in many countries, while financing needs remain high as international development assistance is cut back.
Inflation has diverged somewhat across EMDE regions so far in 2025. In ECA, inflation edged up in late 2024
and early 2025 on the back of food price increases and robust wage growth in some cases More recently, it has moderated somewhat alongside easing energy prices in some economies but remains above 4 percent in most ECA subregions. In LAC, price pressures have mostly subsided, with inflation above central bank target ranges in only a couple of large economies. The disinflation process in SSA has stalled, largely owing to rising food prices. Conversely, inflation has softened in MNA and SAR but has remained high in some notable cases. Meanwhile, inflation mostly declined across EAP given falling commodity prices On average for 2025, inflation is generally expected to remain stable or decline modestly across regions, supported by softening energy prices.
The outlook for trade in all EMDE regions remains challenging due to elevated global policy uncertainty, ratcheting trade tensions between major economies, and an expected slowdown in external demand this year. Although some EMDEs benefited from the front-
loading of exports ahead of anticipated tariffs, additional uncertainty and restrictions are set to dampen investment and dent global value chains, leading to downward revisions to trade growth forecasts for this year in nearly every region. With global tourism near pre-pandemic levels, tailwinds to service exports from the recovery in inbound tourists have also faded. Trade growth is projected to slow markedly in EAP and LAC and, to a lesser extent, in SSA; meanwhile, it is expected to pick up in MNA as oil production cuts unwind, though this is curbed somewhat by weaker external demand. Trade growth in SAR is projected to firm, as robust domestic demand in India supports an improvement in imports.
Investment growth slowed across most regions last year amid high interest rates, subdued global manufacturing and trade activity, and idiosyncratic drivers, including lower extractive production or conflict. Investment growth is anticipated to slow this year in MNA, SAR, and SSA, and remain subdued in ECA and LAC due to the rise in global policy uncertainty and weaker confidence. In EAP, firming investment growth largely reflects additional fiscal support in China; excluding China, it is anticipated to soften owing to global trends. In SAR, investment growth is anticipated firm over 2026-27, partly because of reduced domestic political uncertainty and monetary policy easing in several economies, helping to counter the rise in global uncertainty. In all, most regions are expected to experience weaker investment growth this year relative to their 2010-19 averages.
Private consumption growth, while projected to moderate in many regions, will still underpin activity, assuming that inflation moderates and supports real incomes. However, the outlook for private consumption is expected to be dampened by the rise in global uncertainty and, in some cases, modest fiscal consolidation. In a few regions, private consumption is anticipated to be further contained amid persistent underlying price pressures, which have kept inflation close to the upper end of central bank target ranges in some countries, limiting central banks' scope to reduce policy rates. Central banks many across regions continue to make headway on taming inflation but remain watchful for a resurgence in inflation and the possibility of financial instability stoked by further global policy uncertainty. Uncertainty surrounding the
pace and extent of monetary policy easing in some major economies is adding to caution and restricting room to maneuver.
The stance of fiscal policy is expected to vary across regions and thus has a mixed influence on activity. In LAC, SAR, and SSA, needed-albeit gradual-fiscal consolidation will impose some headwinds to growth but should help address fiscal deficits and stabilize public debt if these efforts are sustained. In ECA, fiscal policy is expected to be somewhat supportive of activity, with deficits set to increase further this year, partly due to rising military expenditures, before a gradual shift toward consolidation. Meanwhile, in EAP, increased government spending is expected to provide notable support to demand in China and, to a lesser extent, in Thailand; in many other large EAP economies, fiscal policy support-including from social spending programs and public investment-is anticipated to be more modest and have a relatively neutral impact on growth.
Over the forecast horizon, catch-up toward advancedeconomy per capita GDP levels is anticipated to be limited, particularly in MNA and SSA (figure B1.1. 1.C). Absent the sufficient creation of new jobs, EMDE regions with fast-growing populations face especially subdued prospects for per capita income catch-up with advanced economies and poverty reduction (Chrimes, Kose, and Stamm forthcoming). This jobs challenge is concentrated in SSA-which accounts for two-thirds of the world's population living in extreme poverty-but it also looms large in several economies in SAR and MNA. In these regions, job growth has not met the pace of growth of the workingage population in recent years, and this trend of subdued job growth is set to intensify amid the projected slowdown in long-term growth in many cases (Kose and Ohnsorge 2024). For example, in almost all SSA economies, the expected average annual growth in the working-age population between 2025 and 2030 exceeds the average annual employment growth seen over 2010-19. Most countries that face a surge in their working-age populations are not well-placed to cope with the challenge due to limited fiscal space, weak government capacity, pervasive informality, high levels of low-productivity employment, widespread economic inactivity (such as high youth unemployment), and heightened levels of conflict or extreme poverty.
Risks to the outlook remain tilted to the downside across all EMDE regions. Persistently elevated or renewed policy uncertainty and additional trade tensions at the global level pose significant risks, especially for trade-exposed regions with large manufacturing sectors. Further risks relate to a marked deterioration in global risk appetite, which could dampen capital flows to EMDEs, as well as increased conflict and rising frequency and severity of natural disasters
Global policy uncertainty has increased markedly in recent months and could be persistent, posing a substantial downside risk to all EMDE regions. Abrupt policy changes, particularly relating to trade, could again unnerve financial markets and cause firms to hold off committing to investments or shelve them completely. Regions more dependent on investment-led growth, particularly where it is tied to trade-intensive production, are especially exposed to the cooling effects of heightened policy uncertainty. This includes EAP and ECA, and to a lesser extent LAC, MNA, SAR, and SSA.
A substantial rise in global trade barriers has affected EMDE regions in recent years, and the imposition of new tariffs earlier this year adds to these earlier increases (figure B1.1.2.A). Additional trade policy restrictions beyond those implemented by late May could negatively impact all EMDE regions through various channels. Beyond worsening global trade fragmentation, additional trade barriers could weaken trade growth, suppress economic activity, drive up prices, and reduce purchasing power, causing real wages to decline. Regions could suffer directly if their exports face new restrictive trade measures, and indirectly if external demand weakens owing to slower growth in key trading partners or if mounting policy uncertainty dents investment. Export-reliant regions with substantial manufacturing bases, such as EAP, ECA, and, to a lesser extent, LAC, are particularly vulnerable to the adverse
effects of heightened protectionism and supply chain reorientation. If taken by EMDEs, retaliatory measures could ramp up import tariffs in EMDE regions, which were already high (figure B1.1.2.B). This would magnify risks related to trade and inflation.
Worsening policy uncertainty could also trigger a marked erosion in global risk appetite, which could reduce capital flows to EMDE regions, push up borrowing costs, and lead to currency depreciation and further inflationary pressures. Regions with a preponderance of less-creditworthy borrowers, as well as high levels of external debt with elevated exposure to foreign currency or shorter maturities, are vulnerable to sudden adverse shifts in market sentiment and external financing. This could particularly affect LAC and SSA, but also several economies in ECA, MNA, and SAR.
All regions continue to experience varying degrees of violence, including from high insecurity, and conflict (figure B1.1.2.C). A key downside risk to growth is the possibility of conflicts flaring and broadening, especially given that baseline assumptions in several regions, especially in MNA and SSA, hinge on a de-escalation in violence and conflict (chapter 2). Given the loss of life and large economic losses caused by armed conflict, this could substantially set back growth and the catch-up of per capita income with advanced economies. Regions where major armed conflicts continue to be centered, including ECA, MNA, and SSA, are particularly vulnerable to the effects of escalating instability and violence.
Natural disasters-including chose related to climate change, which are becoming more frequent and severe-pose further downside risks to all regions. These can amplify other challenges, notably food insecurity and population displacement, particularly in regions with concentrations of fragile and conflict affected situations, notably MNA and SSA. The ability to respond to such events is hampered by narrow fiscal space, still elevated borrowing costs, and weak institutional capacity in some cases.
Relative to pre-pandemic trends , per capita income losses in EMDEs are expected to remain large Excluding China and India, income levels relative to advanced economies are envisaged to remain stagnant. Conflict-related casualties have risen since the 2000s, with conflict having become an increasingly important driver of per capita output losses across FCS. Following steady progress before the pandemic, the extreme poverty rate in EMDEs excluding China and India, and especially L/Cs, remains higher than in 2019, driven in large part by rising poverty across FCS
A Per capita output losses relative to pre-pandemic trends
Percent - Advanced economies - EMDEs
EMDEs excl. China
FCS
Non-FCS LICs
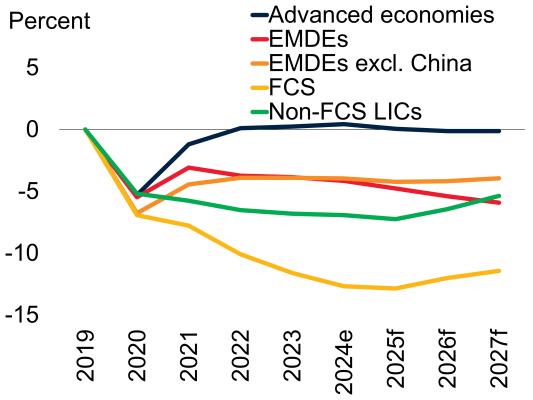
Sources : Mahler Yonzan and Lakner (2022);UN World Population Prospects; Uppsala Conflict Data Program; World Bank Poverty and Inequality Platform (database); World Bank Note: e = estimate; f = forecast. EMDEs = emerging market and developing economies; FCS = fragile and conflict-affected situations;LICs = low-income countries; PPP= purchasing powerparity. FCS country group based on current World Bank FCS classification
A G Sample includes 179 economies of which 37 are advanced economies and 142are EMDEs.
A.D For2023 and beyond, the pre-pandemic trend is the January 2020 baseline projection extended using the projected growth rate for 2022
A Panel shows the percent deviation between the latest forecast and the January 2020 Global Economic Prospects report
C. Bars show the numberof fatalities per year;lines show the simple average for the period indicated Last observation is December 2024. Sample includes up to 82 economies The Uppsala Conflict Data Program defines a conflict event" as an incident in which armed force was used by an organized actor against anotherorganized actor, oragainst civilians, resulting in at least one direct death.
D. "June-24" and "June-25" refer to the forecasts presented in the corresponding editions of the Global Economic Prospects report For2023 and beyond the pre-pandemic trend is the January 2020 baseline projection extended using the projected growth rate for 2022. Shaded area indicates the output loss since 2019.
E.F "Extreme poverty'' is defined as living on less than $3 perday in 2021 PPP. Estimates after2023 are nowcasts. Sample includes 192 countries, of which 39 are currently classified as FCS economies
population displacement, with adverse effects on poverty reduction efforts (Wu et al. 2024). Severely constrained fiscal space, high levels of indebtedness, slow progress in debt restructuring, and limited access to new external financing continue to pose headwinds to the outlook. Progress in poverty reduction, conflict prevention, infant mortality, and institutional capacity may be further damaged as major international donors reduce their support to LICs, and especially to FCS.
Per capita GDP in many EMDEs is on a trajectory that implies a very slow pace of convergence with advanced-economy incomes, with the recent deterioration in external conditions hindering progress This comes on top of an incomplete recovery from the pandemic, combined with an escalation of conflict in some economies, all of which have slowed the pace of poverty reduction and hampered per capita income catch-up. Per capita income growth in EMDEs over 2025-27 is projected to be 2 9 percent-about 1.1 percentage point below its 2000-19 average. Excluding China and India, both key drivers of income convergence over the forecast horizon, per capita income growth is expected to be even slower, at 1.8 percent over 2025-27. Across numerous LICs and FCS-many of which have large gaps in per capita income with other EMDEs and advanced economies-per capita income growth is projected to be lower still, contributing to slowing progress in poverty reduction. Moreover, absent the rapid economic growth and supportive policies needed to spur job creation, many EMDEs will continue to struggle to lift incomes and thus reduce poverty in the coming years.
In level terms, per capita income in EMDEs is estimated to remain nearly 5 percent below prepandemic trends in 2025, compared to marginally above for advanced economies, with the gap on track to widen through 2027 (figure 1. IO.A). Indeed, most EMDEs are in a notably worse position in terms of output losses relative to the pre-pandemic trend, compared to advanced economies, given their weaker initial recoveries. This has been exacerbated further by the
In low-income countries (LICs), growth is projected to rise to 5.3 percent in 2025 and average 6.1 percent in 2026-27, yet this outlook hinges on a de-escalation of conflict in some countries and a moderation in inflation . Crucially, the weaker global environment has led to a significant downward revision of LICs' growth this year. Although per capita income is set to increase by an average of 3 percent annually during the forecast period, this pace remains too weak to fully recover pandemic-related losses or foster the rapid expansion ofjobs needed to lift incomes and reduce extreme poverty. In this context, extreme poverty will remain high, exacerbated in many cases by the effects of violent conflict. A weaker global environment amid the rise in trade tensions and uncertainty weighs on the outlook for LICs, especially those that rely heavily on commodity exports. Reduced fiscal space, arising partly from increased debt-servicing costs and exacerbated by falling donor support, has heightened the challenges many countries face in addressing their development needs and confronting recent global shocks. Risks to the growth outlook are tilted to the downside. They include intensifying insecurity and violent conflict, which could result in negative spillovers for many LICs, including increased food insecurity. Other downside risks include weaker external demand due to heightened trade tensions and related policy uncertainty, more persistent inflation, increased risk ofgovernment debt distress, further withdrawals of donor support, and more frequent or intense extreme weather events.
Last year, output in low-income countries (LICs) grew by an estimated 4.6 percent-still below the 2010-19 average of 5 percent. While growth in LICs is expected to strengthen further, to 5.3 percent in 2025 and to an average of 6.1 percent in 2026-27, such a forecast is contingent on substantial improvements in security in several LICs in fragile and conflict situations (FCS; figure B1.2 1.A) Notwithstanding such a rebound, the projections for this year represent a significant downgrade in LICs' growth prospects compared to January forecasts, in line with the deterioration of the global economic environment. Indeed, at these projected rates, per capita income growth will remain too weak to fully unwind losses in per capita income from the pandemic and spur the rapid growth in jobs needed to lift millions from extreme poverry.
In many LICs, the outlook is clouded due to the worsening in the external environment-including rising trade tensions and uncertainty, tighter global financing conditions, and lower demand and prices for commodities-even if their exposure is somewhat contained by more limited trade in manufactured goods than in other EMDEs. Growth in LICs also remains hindered by lingering structural constraints, including pervasive violence. In several LICs, elevated violence has increased extreme poverty, food insecuriry, and the number of displaced people (figure B1.2.1.B). Additionally, increased debt-servicing payments, in part reflecting higher borrowing costs, have required budgetary tightening and constrained the ability of
Dominik Peschel.
governments to support the poor and promote development. To this end, many LICs have reduced their capital spending, which constrains their ability to address wide infrastructure gaps, weighing on longerterm growth prospects.
Risks to the growth outlook are skewed to the downside. Growth in LICs could fall short of current projections if the global environment deteriorates further. Intensification of global trade tensions and uncertainty could weigh on activity, especially in commodity-exporting LICs. Weaker external demand could exacerbate other risks in LICs, including further increases in domestic political instabiliry and violent conflict, as well as more persistent inflation than projected, which could delay the easing of financial conditions. Greater frequency or intensity of adverse weather events could also dampen economic activity, as could further reductions in donor support.
Against this backdrop, this box addresses the following questions:
What have been the main recent economic developments in LICs?
What is the outlook for LICs?
What are the risks to the outlook?
Growth in LICs strengthened to 4.6 percent in 2024 but remained below pre-pandemic average rates. The growth momentum was driven by accelerated activity in agricultural exporters, including Ethiopia; solid invest-
Despite growth in L/Cs strengthening to 4.6 percent in 2024, domestic factors-such as violent conflict, displacement, and inflationary pressures-continue to hinder economic and humanitarian development. The incidence of violence has remained high in L/Cs, mainly reflecting violent conflicts in East Africa and the Sahel. Consequently, the number of displaced people has increased, driven by conflicts in Sub-Saharan Africa. Median consumer price inflation in L/Cs has been on a downward trend since early 2023, but a resurgence in food inflation caused it to spike in mid-2024 , and it has edged up again more recently.
A Violent events B Number of displaced people
Numberofevents
Congo,Dem.Rep.
Sahelexcl.Sudan
SouthSudanandSudan
OtherLICs
Consumer price inflation
Congo,Dem.Rep. Sahelexcl.Sudan
SouthSudanandSudan
OtherLICs
Sources: ACLED (database); Haver Analytics; UNHCR Refugee Population Statistics Database;World Bank.
Note: excl. = excluding; LICs = low-income countries
A Three-month moving average. Violent events include battles explosions, violence against civilians and riots Last observation is April 2025
B. Statistics cover forcibly displaced persons by country of origin, including refugees under UNHCR's mandate,asylum-seekers,and internally displaced persons of concern to UNHCR. Sample includes 26 LICs,of which 6 are in the Sahel.
C. Change in prices from 12 months earlier. Unweighted average for the sample of seven LICs Last observation is March 2025
ment growth in Uganda; and still-above-average growth in the Democratic Republic of Congo, spurred by mining activity. Part of the improvement in aggregate growth also reflects a smaller-than-anticipated economic contraction in Sudan's economy. In 2024, growth picked up in 15 of the 25 LICs for which data are available, and it has been revised up since January for nearly two-thirds of them, including the two largest LICs-the Democratic Republic of Congo and Ethiopia. For LICs as a group, growth in 2024 has been revised up by 1.0 percentage point since the January forecast.
Fragility and conflict have been key differentiators of growth performance. Among non-FCS LICs, activiry expanded by 5.7 percent in 2024, helped in part by the oil-related construction boom in Uganda However, output grew by only 0.5 percent in FCS LICs when the Democratic Republic of Congo and Ethiopia are excluded. The conflict-related contraction in Sudan contributed markedly to this weak performance, with government institutions collapsing and a sizable portion of the population displaced. In Ethiopia, growth accelerated to 8.1 percent last year, boosted by good agricultural output, increased mmmg, and higher electriciry generation activity. In the Democratic
Republic of Congo, output grew by 6.5 percent, despite intensifying conflict in the eastern part of the country, which has further increased the number of internally displaced persons, already in the millions, as a result of ongoing violence.
In early 2025, improved weather conditions helped agricultural output recover in some LICs affected by severe climate-related shocks last year, such as Malawi, which experienced droughts, and Mozambique, which experienced heavy rains and floods. In South Sudan, returning households have resumed agricultural activities, which has increased farming production and helped prevent an even more severe economic downturn.
While annual consumer price inflation in the median LIC has come down from its mid-2022 peaks, food prices temporarily edged up in many LICs in mid-2024 (figure Bl.2 1.C) In 2024, floods in East Africa and the Sahel and droughts in Southern Africa adversely affected some harvests, raising local food prices. However, recent satellite data show that, since the start of 2025, drought conditions have worsened in East Africa, with Rwanda and Uganda particularly affected. In early 2025, food price inflation remained very high in some LICs
Although growth in L/Cs is expected to firm in 2025, it will be weaker than previously expected, reflecting a more challenging external environment Debt-to-GDP ratios in L/Cs are set to decline , but interest payments are set to remain elevated relative to fiscal revenues . Despite recoveries in FCS economies, L/C per capita incomes are not set to reach pre-pandemic trends by 2027. L!Cs export a small share to the United States, with a greater share directed to China, the euro area, and other SSA economies. Metal exporters drove the doubling in LIC exports from 2015 to 2023. Growing dependence on development assistance (2018-22) makes L/Cs vulnerable to aid withdrawal, which would worsen fiscal pressures , growth , and humanitarian conditions.
A. Growth forecast and comparison to January 2025 projections
B. Government debt and interest payments
C. Per capita income losses relative to pre-pandemic projections
Sources: International Monetary Fund; World Bank
Note: e = estimate; excl. = excluding; f = forecast. COD = Democratic Republic of Congo; ETH = Ethiopia; FCS = fragile and conflict-affected situations; GDP = gross domestic product;GNI = gross national income; LICs = low-income countries; SSA = Sub-Saharan Africa.
A. Data are GDP growth forecasts,as reported respectively in the June 2025 and January 2025 editions of the Global Economic Prospects Sample comprises 22 LICs
B. Simple averages of country groupings. Sample includes 21 LIC economies
C Panel shows percent deviation from the 2020 January Global Economic Prospects baseline projections for GDP per capita
D -E Subgroupings include LICs only The sample contains 22 LICs
D The figure shows the share in total exports.
E. Countries are categorized according to their main export items
F. Sample includes up to 23 LIC economies. The blue line represents the median from 2008 to 2017 for each grouping
(Burundi and Malawi), while conflict has kept food prices elevated in other LICs (South Sudan and Sudan).
Outlook
Growth in LICs is projected to firm to 5.3 percent in 2025 and strengthen further to an average of 6.1 percent a year in 2026-27 (figure B1.2.2.A). Compared to previous projections, the forecast has been trimmed by 0.4 percentage point for 2025 This largely reflects slower global growth amid increases in trade barriers, heightened trade policy uncertainty, and waning investor sentiment. While weaker growth prospects in 2025 have also been driven by a large downward revision for conflict-affected South Sudan, the deterioration in prospects is broad-based Specifically, growth forecasts have been downgraded for nearly 60 percent of LICs in 2025 and in 2026 Although the growth forecast in LICs has been upgraded by 0.2 percentage point for 2026, this is driven by the large upward revisions for South Sudan and Sudan, where
TABLE B1 .2.1 Low-income country
(Real GDP growth at market prices in
a
Source: World Bank.
Note: e = estimate; f = forecast. World Bank forecasts are frequently updated based on new information and changing (global) circumstances. Consequently projections presented here may differfrom those contained in other Bank documents, even if basic assessments of countries' prospects do not significantly differat any given moment in time.
a. The Democratic People's Republic of Korea is not projected due to data limitations.
b. Aggregate growth rates are calculated using GDP weights at average 2010-19 prices and marketexchange rates Data for the Syrian Arab Republic and the Republic of Yemen are excluded.
c Forecasts for the Syrian Arab Republic (beyond 2025) and the Republic of Yemen (beyond 2026) are excluded because of a high degree of uncertainty. Forecasts forAfghanistan (2024-26) and the Republic of Yemen (2026) were not included in January 2025 Global Economic Prospects; therefore, the differences from January 2025 projection are not computed.
d. GDP growth rates are on a fiscal year basis. Forexample the column for 2022 refers to FY2021/22.
conflict is assumed to de-escalate and oil exports resume in the latter, outweighing the impact of lower global growth on other LI Cs.
Activity in LICs will continue to face multiple challenges arising from domestic factors, including high public debt, limited access to financing, and external factors, such as a slowdown in global growth, fragmented trade, and falling donor support. Against
this backdrop, the outlook remains highly uncertain and hinges on a substantial improvement in the security situation in a number of LICs, no new violent conflicts breaking out, inflation abating, debt crises being avoided, donor support not retrenching further, and the absence of major adverse weather events.
Government debt-to-GDP ratios in LICs are expected to decline gradually from recent highs but remain above
60 percent, on average, by the end of 2027 (figure Bl.2.2.B). The projected decline in debt ratios partly reflects primary fiscal surpluses amid consolidation efforts. Interest payments are expected to stay elevated across LICs and to remain above 10 percent of fiscal revenues by 2027, partially offsetting the improvements in the projected primary fiscal balance.
Anticipating improvements in the security situation in some countries, growth in FCS LICs is forecast to increase to 5.2 percent in 2025 and average 5.8 percent a year in 2026-27. The pick-up reflects a projected return to growth in Sudan and recovery of oil production in South Sudan. Growth is projected to remain solid in both the Democratic Republic of Congo and Ethiopia, albeit at a lower rate than in the last two years.
Growth in non-FCS LICs, which include 8 economies out of a total of 22 LICs, is forecast to weaken marginally from 5.7 percent in 2024 to 5 5 percent in 2025, before picking up to an average of 7.0 percent a year in 2026-27. This acceleration partly reflects stronger growth in Uganda due to oil-related capital investment and the anticipated start of oil production in 2027.
Per capita income growth in LICs is expected to increase from 1.8 percent in 2024 to an average of 3.0 percent a year in 2025-27, with per capita income growth in non-FCS LICs averaging 3.9 percent a year. However, these growth rates in average per capita incomes are not enough to close the gap with their prepandemic trend by the end of 2027 (figure Bl.2.2.C).
Indeed, per capita incomes growth in FCS LICs, excluding the Democratic Republic of Congo and Ethiopia-the two countries driving growth in this group-is expected to be only 1.7 percent a year in 2025-27. Per capita incomes in more than one-third of 24 LICs are expected to be below pre-pandemic projections by the end of 2027, down from half in 2024.
Despite gains in per capita income, many LICs will likely see limited progress in reducing poverty. One contributing factor is that SSA-home to most LICshas a high growth inelasticity of poverty, requiring stronger economic growth rates than other regions to achieve similar poverty reduction results (Wu et al. 2024). The high inelasticity reflects a lower pass-
through between growth in GDP per capita and growth in private consumption. Moreover, populations in several countries continue to suffer from violent conflicts, political instability, and their repercussions, including displacement and food shortages, exacerbating the often-dire conditions in FCS LICs.
Without sufficient job creation in LICs, however, these countries' economic and humanitarian challenges will not be resolved. Indeed, the challenge to spur jobs remains large, given growth headwinds and a further doubling of populations over the next 25 years in many LICs. This is likely to exacerbate pre-ex1snng employment constraints, such as pervasive informality and widespread economic inactivity, including largescale youth unemployment. In many cases, labor productivity remains subdued, notably in the agricultural sector, which accounts for a larger share of employment in LICs than in other EMDEs.
Risks to the growth outlook remain tilted to the downside, especially for FCS LICs, as projections are predicated on positive regional developments, which may fail to materialize. Should the intensity of ongoing conflicts not ease as assumed or escalate furtherespecially in the Democratic Republic of Congo, South Sudan, and Sudan-it could lead to extended humanitarian crises and exacerbate already severe food insecurity across LICs in the region, as many of these countries rely heavily on food imports.
Growth in LICs could prove weaker than projected if global economic conditions deteriorate. Specifically, unexpected adverse changes in trade policies among major economies and persistently high policy uncertainty could negatively impact LICs' growth prospects. While the direct effect of tariff increases by major economies would likely be relatively moderate for LICs given their limited export exposure to advanced economies, indirect effects could be substantial (figure Bl.2.2.D). A primary concern is the potential for trade barriers to escalate and trigger a larger-than-expected global slowdown, which would particularly affect metal exporters, given their reliance on world export markets (figure Bl.2.2.E). Overall, LICs remain vulnerable to global commodity price fluctuations and shifts in investor sentiment that could result from heightened international trade tensions.
Lower-than-expected official development assistance (ODA) inflows to LICs pose another important downside risk to the growth outlook, as well as fiscal burdens and humanitarian challenges. The loss of aid financing for various projects, such as infrastructure development, education, and healthcare, could lead to a deterioration in economic activity and the drivers of long-term growth. Moreover, withdrawal of donor support may exacerbate the fiscal challenges of LICs as governments may have to substitute the missing ODA inflows, representing a median of 8 percent of GNI in 2022 (figure B1.2.2.F). Although, on average, there is not a significant difference in exposure to donor support between FCS and non-FCS LICs, three FCS economies-Afghanistan, Central African Republic and the Syrian Arab Republic-are among the most exposed LICs to a sharp decline in ODA inflows, given their high reliance on donor support.
Domestic inflationary pressures in LICs could intensify due to several factors, including further debt monetization, exchange rate depreciations, regional conflicts disrupting supply chains, and adverse weather conditions affecting food prices. This may push central banks in SSA to slow the pace of monetary policy easing, resulting in a slower-than-expected improvement in LICs' financial conditions. While high debtservicing costs remain a burden for many LICs, liquidity concerns and foreign reserve adequacy are also pressing challenges. These challenges, which often
disproportionately impact vulnerable populations, may be compounded by global developments, especially should global inflation prove more persistent than expected and global interest rates remain high.
A deterioration in financing conditions facing LICs could further heighten the risk of government debt distress in some countries. Despite the efforts of several LICs to reduce vulnerabilities to external shocksthrough an increased share of domestic debt and the extension of its maturity-15 out of 25 LICs were in or at high risk of government debt distress in 2024. Indeed, sizable primary deficits have driven the debt buildup in LICs, reflecting expenditure pressures amid persistent revenue weakness (Chuku et al. 2023). In the forecast horizon, government debt-to-GDP ratios in LICs are expected to improve (IMF 2025). However, overall debt burdens are set to remain elevated, and fiscal consolidation efforts are expected to be slower and more uncertain than anticipated in January, given the challenging external environment.
If the adverse effects of climate change intensify, the pace of poverty reduction in LICs could be markedly slower Qafino et al. 2020). Extreme weather events, such as droughts and floods, have frequently had catastrophic consequences in LICs. Such experiences could be repeated, as these countries have limited institutional capacity to cope with natural disasters and generally lack the financial resources needed to help mitigate their adverse effects.
deteriorating outlook for global growth amid increasing uncertainty and rising trade restrictions, as well as by limited policy space. Excluding China and India, progress in closing the gap in income levels with advanced economies has stalled since the early 20 I Os and is envisaged to remain stagnant (figure 1.10.B).
In LICs, per capita growth is expected to pick up over the forecast horizon but remain too slow to make up for ground lost since the pandemic. Indeed, despite LICs' comparatively lesser exposure to increased trade tensions, their recovery in per capita income is projected to be slower than was anticipated in January's forecasts, with softer
global commodity demand and subdued investor confidence weighing on the outlook this year and next. PCS countries continue to fare much worse than was foreseen in the 201 Os, as conflict has become an increasingly prominent driver of per capita output losses. Since the early 2000s, the number of conflicts and conflict-related deaths has risen substantially (figure 1.10.C). As a result, by 2027, per capita incomes in PCS are projected to remain over 11 percent lower than the prepandemic trend, compared to about 4 percent for LICs as a whole (figure 1.10.D).
After considerable headway in reducing extreme poverty rates until the 201 Os, moderating per
capita income growth across EMDEs has slowed progress on poverty reduction (figure 1.10.E) While some regions, such as SAR, have made notable reductions in extreme poverty, the extreme poverty rates in EMDEs excluding China and India, and especially across LICs-many of which are FCS economies-are expected to remain higher than prior to the pandemic through 2026. Slowing progress on poverty reduction has coincided with an intensification in conflict since the mid-201 Os. As of 2025, FCS, which are home to nearly 1.1 billion people, account for nearly half of the global population living in extreme poverty, up from about 40 percent in 2019. By 2030, almost 60 percent of the world's poor, or 365 million people, are expected to reside in FCS (figure 1.10.F).
Summary of global outlook
In all, global growth prospects have substantially weakened since January, with some of the downside risks related to trade having materialized in recent months-most notably, a significant increase in trade barriers and policy uncertainty. In view of these developments, the forecasts assume that tariff rates in place as of late May prevail throughout the forecast horizon. Accordingly, previously announced pauses to tariff hikes between the United States and its trading partners are assumed to be extended with at most limited modifications. In this context, global growth is projected to slow markedly to 2.3 percent in 2025-the slowest pace since 2008, aside from two years of outright global recession in 2009 and 2020. Over 2026-27, a pickup in domestic demand is expected to lift global growth to a still-subdued 2.5 percent-far below the prepandemic decadal average of 3.1 percent (figure 1.11.A). The expected deterioration in growth is broad-based, with many of the world's economies likely to experience slower growth relative to last year as well as previous forecasts (figure 1.11.B).
EMDEs with tight trade and investment linkages with the three largest economies-the United States, euro area, and China-are expected to be adversely impacted by the spillovers from a concurrent slowdown in these economies this year (figures 1.1 l.C and 1.11.D).
Although central banks are anticipated to continue lowering monetary policy rates, the future path of interest rates is uncertain considering the potential risks that higher tariffs pose for the disinflation process, particularly in the United States. Fiscal policy is assumed to be broadly neutral in many economies, excluding some European countries where increased defense and infrastructure spending is included in the baseline. In some major economies, aggregate fiscal policy shifts could prove materially more expansionary than the baseline assumptions.
Against this backdrop, global trade and investment growth are also expected to be notably lower relative to previous projections, mostly owing to a sharp deterioration in business and consumer confidence. Uncertainty about future trade policies is likely to amplify the negative effect of increased trade barriers on near-term investment and activity, especially as firms delay or reconsider capital spending, which tends to be trade-intensive (IMF 2018; Kose, Ohnsorge et al. 2017). As global trade and investment weaken, labor demand and private consumption growth in key advanced economies are also set to slow Although some countries may benefit from trade diversion in the short run depending on the distribution of tariffs across U S trading partners, mounting trade restrictions could disrupt global value chains, contributing to higher prices in some sectors. Protectionism, if it becomes entrenched, is also likely to stifle cross-border flows of commerce, capital, and technology in the longer term, weighing on productivity and global potential growth.
Downside risks to the outlook continue to dominate (figure 1.12.A). Higher or more persistent trade policy uncertainty presents a major risk to global trade, investment, and overall activity. Renewed increases in trade tensions and barriers could further weigh on consumer and business confidence, weakening demand. A reappraisal of risk appetite and deleveraging in financial markets could generate financial stress that curbs economic activity globally, with large capital outflows from vulnerable EMDEs. Some
Global growth is anticipated to weaken in the near term, reflecting a sharp increase in trade barriers and heightened uncertainty The deterioration in growth prospects is expected to be broad-based, affecting most of the world 's economies The slowdown this year in the three major engines of global growth-the United States, euro area, and China-is expected to dampen activity in other EMDEs , especially those with tight trade and investment linkages to these economies
A Contributions to global growth B Share of economies with slowing/ downgraded growth in 2025
reductions between major economies. In addition, global growth could be stronger than projected due to a technology-led investment boost and additional fiscal spending in major economiesthough the latter could also generate inflationary pressures and undermine efforts to restore medium-term fiscal sustainability.
C Trade and financial linkages between major economies and EMDEs excluding China
D Share of economies for which the United States is a major goods export destination, 2010-23
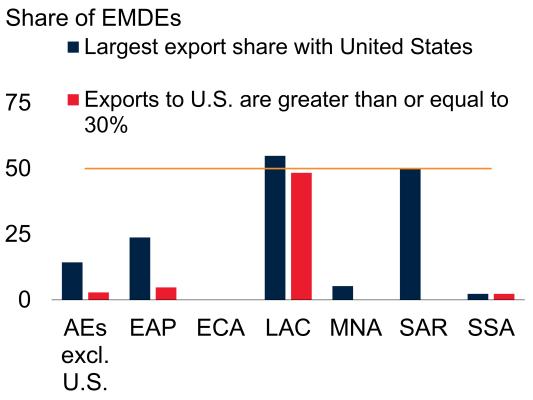
Sources : BIS (database); IMF Coordinated Direct Investment Survey (database); World Bank; World Integrated Trade Solution (database); WBG-KNOMAD.
Note: e = estimate; f = forecast. AEs = advanced economies; EAP = East Asia and the Pacific; ECA = Eastern Europe and Central Asia; EMDEs = emerging market and developing economies; LAC = Latin America and the Caribbean;MNA = the Middle East and North Africa; SAR = South Asia; SSA = Sub-Saharan Africa; U.S.= United States
A Aggregates are calculated using real U.S dollar GDP weights at average 2010-19 prices and market exchange rates. Discrepancies between GDP growth and the sum of its components reflect inventories and residuals.
B Panel shows the share of economies with slowing growth and with growth outlook downgraded relative to January 2025 forecasts Horizontal line shows 50 percent.
C. Bars show for EMDEs excluding China the share of total exports that are directed to China the euro area and the United States and the shares of total inward FDI positions remittance inflows and portfolio liabilities that originate from China, the euro area, and the United States Data refer to 2023 apart from remittance inflows, which refer to 2021. Sample includes 106 EMDEs for exports, 144 EMDEs for FDI, 153 EMDEs for remittances,and 81 EMDEs for portfolio liabilities
D Share of EMDEs in each region for which exports to the United States account for the single largest share of total exports or for which exports to the United States account for at least 30 percent of total exports.
major economies may experience a mutually reinforcing combination of downside risks, resulting in notably weaker growth with adverse global spillovers. Increased conflict and geopolitical stress, as well as more frequent and intense natural disasters, could also push growth below expectations. On the upside, the drag from uncertainty and increased trade barriers could be attenuated if negotiations give rise to tariff
Policy uncertainty-especially about trade policy-remains very high The imposition of higher trade barriers has already unsettled financial markets and dampened business and consumer sentiment Despite recent trade negotiations, concerns remain that global trade tensions could escalate in unpredictable ways The speed and scope of policy shifts have also made it challenging for firms to plan, leading to reduced capital investment and hiring plans
The duration of this period of acute uncertainty could be a key determinant of global growth, on top of the direct impacts of policies that are enacted. In the baseline, uncertainty is expected to wane as tariff rates stabilize and trade patterns adjust. If, however, elevated uncertainty persists for longer or rises further over the forecast period, the adverse implications for economic activity could compound, pushing global growth notably below expectations
An unexpected rise in trade policy uncertainty could weigh more on the sentiment of consumers, investors, and businesses, which, in turn, would have adverse impacts on output and employment globally, especially in export-intensive industries
A sharp further increase in uncertainty, particularly for an extended period, would likely drive EMDE investment and growth markedly lower (figure 1.12 B). It could, for example, delay investments in productive capacity in exporting countries, speed up exit of firms from exporting industries most likely to be affected by tariffs, and lead to costly trade diversion (Crowley, Exton, and Han 2020; Douch, Du, and Vanino 2019; Handley and Limao 2019). Weaker investor sentiment and a lack of clarity over future trading arrangements could particularly curtail the flow of
FDI linked to establishing supply chains, which has historically been a major driver of economic development.
Although the baseline encompasses a significant increase in trade barriers, there remams a substantial risk that the trend of rising trade protectionism and inward-looking policies in major economies intensifies further. This could include a reversion to previously announced higher tariffs and the reintroduction and expansion of retaliatory measures. A renewed escalation in trade tensions and trade costs would amplify their negative consequences for the global economy. Such an outcome might become more likely if tariffs and ongoing shifts in trading relations put downward pressure on export prices in large goods exporters, such that domestic producers in economies that have not increased import levies face suddenly intensifying competition.
Further increases in tariffs would likely lead to higher inflation in the implementing jurisdictions (Amiri, Redding, and Weinstein 2019). Prices for imported consumer and intermediate goods would rise directly, with at least a sizable portion of tariffs likely to be passed on to domestic buyers. In the near term, substitution toward domestic alternatives would not be feasible for every product affected-such adjustments would take time and be costly. This would further push up prices-including on domestically assembled products as already suggested by high-frequency data-raising consumer inflation generally (Cavallo, Llamas, and Vazquez 2025) Higher prices would reduce real income and consumption further, which, in turn, could dampen private investment. These effects could be especially pronounced in export-intensive economies, as importers move parts of the supply chain onshore. Consumer and business confidence would also decline in the context of escalating trade conflicts, further reducing economic activity. In the long run, sustained high trade barriers and reduced trade would dampen productivity growth, including by impeding the diffusion of technology across borders.
Downside risks continue to dominate . Further uncertainty would lower EMDE investment and growth Despite recent market turmoil, risk premia in key markets remain relatively narrow, leaving asset prices vulnerable to large negative adjustments. A marked slowdown in major economies, especially the United States, would have sizable adverse spillovers. A rising number of EMDEs face acute risks from armed conflicts, which have proliferated in recent years, often culminating in deep recessions Globally, a downside scenario of renewed trade tensions could push global growth sharply lower In contrast, an upside scenario of trade negotiations that deescalate tensions could mitigate the expected slowdown in global growth
B Impact of 10-percent rise in global EPU on activity in EMDEs
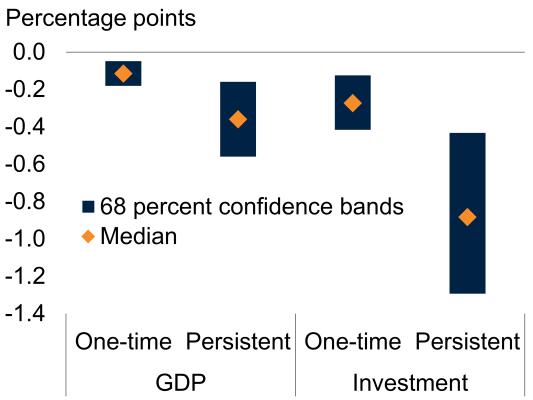
Output response in EMDEs excluding China to a 1-percentage• point decrease in U S growth
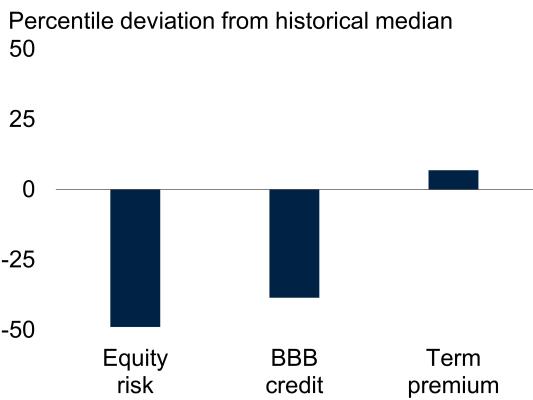
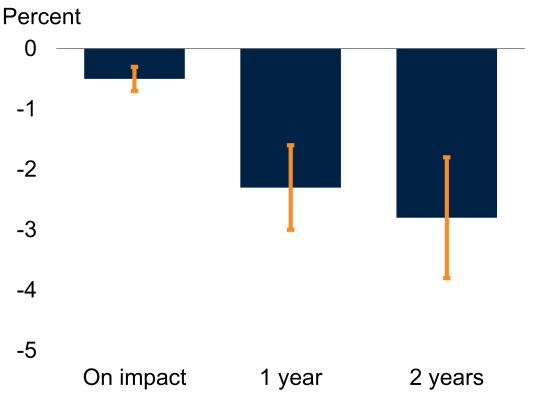
Sources: Barclays;Bloomberg;Consensus Economics; Federal Reserve Banks of New York and St. Louis; Haver Analytics;Oxford Economics; Uppsala Conflict Data Program;World Bank. Note: BVAR = Bayesian vectorautoregression; EPU =economic policy uncertainty.
A. Dashed line indicates global recession (below zero percapita growth). Probabilities use range and skewness implied by oil and equity options, and term spread forecasts. Values for 2025-26 use 6month- and 18-month-aheadforecast distributions. Last observation is May 2025.
B. GDP-weighted cumulative impulse responses of growth to a 10-percent increase ("one-time")or ongoing 4-quarter 10-percentincrease ("persistent'') in global EPU (Davis 2016),one year after the first shock. BVAR estimated over 199801-202304for 39 EMDEs,with four lags.
C. Equity risk proxied by the U.S. Shillerexcess earnings yield. BBB credit spread is for the U.S. Term premium is an average of Kim and Wright, and Adrian,Crump, and Moench models ofthe U.S. 10-yearpremium. Data from 2003 for equities;2000 for other variables. Last observation May 2025.
D. Median cumulative responses from BVAR covering 200001-2304. Whiskers show 16-84 percent confidence bands. Fordetails,see Annex 3.2 in the Jan 2025 Global Economic Prospects.
E. High-intensity conflict means 150+deaths per million at onset with that threshold not exceeded in four prioryears. Lines show the cumulative gap between World Bank forecast one year before onset and actual per capita GDP. Sample of 14 conflicts in 14 EMDEs from 2006-23.
F. Growth deviation in upside/downside scenarios,using Oxford Economics' Global Economic Model.
Damage to global supply could, over time, push up prices even in countries that do not raise their own tariffs and are not significantly affected by rising tariffs elsewhere. A bout of higher inflation and weaker growth would pose substantial challenges to central banks in affected economies, especially if inflation expectations showed signs of de-anchoring following several years of abovetarget price gains.
Heightened volatility in financial markets and the potential for large asset price adjustments pose additional risks to global economic activity and could amplify the effects of other risks materializing. Despite recent volatility spikes, risk premia in key equity and credit markets remain narrow compared with historical norms (figure 1.12.C) In this context, a material reappraisal of risk appetite could lead to sharp asset price corrections in advanced economies, which would reverberate through global markets and might become disorderly if synchronous deleveraging by market participants leads to liquidity strains The resulting repricing of equities in both advanced economies and EMDEs could lower consumption through wealth and confidence effects, whereas widening corporate spreads would weigh on investment globally. Banks might also retrench from riskier lending, slowing credit growth and curbing some cross-border intermediation. For example, with heightened trade policy uncertainty, tighter lending conditions could see the availability of trade credit decline, exacerbating the slowdown in global trade and EMDE exports.
It is also possible that weakening risk sentiment might coincide with a rise in the term premium on advanced-economy government bonds, given uncertainty about the outlook for inflation and policy rates in key economies. This would further tighten global financial conditions. Against a backdrop of reduced global risk appetite and stillelevated benchmark interest rates, EMDEs with heightened domestic vulnerabilities would be prone to large capital outflows Shifting interest rate differentials could constrain some EMDE central banks from supporting domestic activity,
as they might slow or delay policy easing to mitigate capital outflows and inflationary pressures resulting from currency depreciation In EMDEs with weak credit ratings and high debt levels, market access for refinancing maturing debts could be disrupted, necessitating sudden fiscal adjustments. More broadly, higher borrowing costs would raise debt-servicing burdens over time, worsening fiscal pressures in many EMOEs.
In some major economies, downside risks could become mutually reinforcing or interact with preexisting vulnerabilities. In the United States, business investment, hiring, and consumer spending could retrench markedly due to pessimism about future economic activity and job prospects, increases in trade barriers, and resurgent financial market volatility Household spending may be further curtailed by weaker disposable income growth Reduced private spending could precipitate a sharp deceleration in U S economic activity or even a recession. A confluence of factors such as weaker external demand, heightened uncertainty, supply chain disruptions, and tighter financial conditions could also challenge large economies seeking to overcome domestic headwinds In China, for example, robust export performance in recent years has helped attenuate the drag on growth from the property sector slowdown.
Markedly weaker-than-expected growth in major economies could have considerable negative global spillovers. For EMDEs, external demand could soften, with exports of manufactured goods and traded services such as travel likely to weaken. Commodity prices would fall below the baseline projections, weighing on terms of trade and curbing export earnings in many commodityexporting EMDEs, some of which might tighten fiscal policy pro-cyclically given diminishing commodity-linked revenues. Additionally, deteriorating labor markets in large economies could curtail remittance flows to some EMDEs. In general, the spillovers to EMDEs from weak growth in the United States are particularly sizable-a one percentage point decrease in U.S.
growth is estimated to lower output in EMDEs excluding China by about 3 percent after 2 years (figure 1.12.D)
The incidence of armed conflicts has risen substantially in recent years. While the baseline assumes a partial resolution of some major conflicts, the risk of continued or escalating conflict remains high-both at the interstate and intrastate level-against a backdrop of elevated geopolitical tensions globally. Armed conflicts result in the destruction of physical and human capital and can lead to sharp increases in poverty and food insecurity. They often culminate in deep recessions, reduced private investment, and persistent output losses in the countries involved (figure 1.12.E). Neighboring countries can also experience weaker private investment, as they often become less stable and more susceptible to conflict themselves. In addition, some large conflicts can have global consequences, as they can lead to large waves of refugees and disrupt trade networks and international commodity and financial markets.
In countries directly involved in conflict, elevated military spending can squeeze public resources for economic capacity-building spending, such as that on education, health, and civilian infrastructure More broadly, conflict-induced declines in productive capacity lower future expected incomes, raising risk premia and increasing the probability of debt default.
Among current major episodes, a re-intensification of conflict in the Middle East could disrupt oil and natural gas supplies, causing energy prices to rise, exerting upward pressure on inflation. Uncertainty around Russia's ongoing invasion of Ukraine and its future economic implications also remains elevated, although a negotiated end of active hostilities could be reached at some point. More generally, EMDEs can be particularly vulnerable to various knock-on consequences of conflicts, including from the impact of sanctions on trade or through weaker global investor confidence impacting capital flows.
The growing incidence of natural disasters poses significant risks to lives, livelihoods, and the global economy. It is likely that the frequency and severity of extreme weather events, including natural disasters, will continue to escalate with global warming (IPCC 2014; 2022) As these events become more prevalent and intense, their future impacts are likely to be more significant. The immediate impacts of extreme weather events can materialize through various channels: loss of life, destruction of physical and infrastructure capital, displacement or migration of the labor force, and disruption of economic activity Although empirical estimates of the economic costs of extreme weather events vary widely, such events have been shown to have major impacts on economic activity (Dell, Jones, and Olken 2014; Burke, Hsiang, and Miguel 2015). In the longer term, climate-change-related natural disasters can weaken investment and trend productivity growth as well as impede human capital development, with long-lasting impacts on vulnerable households (Angeli et al. 2022; World Bank 2025a; Zhang and Borja-Vega 2024).
Natural disaster risks are more acute for EMDEs given their higher vulnerability to such events, including typhoons, extreme heat, and severe precipitation (Hsiang and Jina 2018). Small island developing states are among the most vulnerable, owing to narrow production bases and undiversified economies, with estimated annual average losses from natural disasters ranging between 1 and 9 percent of their GDP over 2000-15 (OECD 2018). Moreover, the impacts of natural disasters across EMDEs may be amplified by weak institutional capacity, including those related to governance, and constrained fiscal space.
Extreme weather events can also lead to upward price pressures in the short run, with inflation becoming more volatile in areas subject to more frequent occurrence of such events (Angeli et al. 2022). Droughts have been found to increase food price volatility, with disproportionate impacts on poorer households.
A partial resolution of trade tensions between the United States and its trading partners-for example, through further trade negotiations or unliteral tariff reductions-could help stabilize the global trade policy environment and reduce uncertainty. These measures would enable firms to plan better and, where necessary, reorganize supply chains over a longer horizon, mitigating the adjustment costs and limiting trade disruptions (Grossman, Helprnan, and Redding 2024). Such measures could also lower effective tariff rates between the United States and its major trading partners compared to the assumptions embedded in the baseline.
Relative to the baseline, lower tariffs would ease upward pressure on consumer prices and raise profit margins for both importing and exporting firms (Amiti, Redding, and Weinstein 2019). These disinflationary impacts would likely be most pronounced in the United States and any countries rolling back retaliatory measures. Diminishing trade policy uncertainty would have wider beneficial impacts, raising business and consumer confidence and thereby partially reversing the widespread drag on investment and consumption assumed in the baseline (Caldara et al. 2020). It is likely that tailwinds to global activity would also be reinforced by further easing of financial conditions, with risky asset prices incorporating a lower possibility of weak growth or debt-related strains.
In major economies, fiscal policy may become more supportive of growth relative to baseline assumptions. In the United States, fiscal policy may prove expansionary over the forecast horizon, in contrast to the slightly contractionary stance embedded in the baseline. This could result from a renewal of expiring individual and business tax provisions of the Tax Cuts and Jobs Act or other tax reductions, potentially partly offset by federal spending cuts. In the near term, this could reduce personal and corporate taxes and boost disposable
incomes, supporting consumption and business investment
In the euro area, the outlook is subject to some upside risk following announced plans to relax fiscal rules rather than slightly tighten policy as assumed in the baseline. The EU has paved the way for allowing member states to significantly increase spending by exempting defense categories from its existing clauses in debt and deficit rules, with some economies already approving additional spending. In China, additional fiscal policy stimulus could result in higher-than-expected growth.
A combination of fiscal support in major economies would lift domestic demand in the near term and trigger positive spillovers via trade, despite the relatively low import content of defense spending and the ongoing trend toward greater trade fragmentation. However, the boost from additional fiscal support would likely be dampened somewhat by the crowding out of private investment due to higher government borrowing rates, and with wider fiscal deficits and increases in government debt worsening fiscal sustainability in some key economies.
Heightened optimism about the growth potential of new technologies-including generative AIhas become widespread in recent years Already, many large public companies are drastically increasing capital expenditures to ramp-up their technological capabilities, while many governments are also dedicating increased resources to supporting burgeoning industries If this optimism broadens or intensifies-perhaps fueled by further technological breakthroughs-a large wave of technology-led investment could follow. This could manifest in increased global investment in energy infrastructure, data centers, and research and development, as well as foster more trade in ICT components and services.
Even if centered mostly in advanced economies and wealthier EMDEs, the benefits of such investments could spill over to EMDEs more broadly in the form of stronger external demand
Moreover, as applications of new technologies proliferate and mature, a greater number of firms across EMDEs may make investments to enable adoption. Over the longer term, new technologies could potentially support a pickup in productivity growth in both advanced economies and EMDEs However, this remains contingent on many broader factors, such as institutional arrangements, and whether commercially successful applications tend to be labor augmenting or labor replacing.
Growth outcomes under alternative scenarios
If some of the risks discussed above were to materialize, global growth could deviate materially from the baseline projection The risks around key trade policy assumptions are particularly notable, and their implications are examined below using a global macroeconomic model.2
Downside scenario: Renewed increases in trade barriers
This scenario assumes the weighted average U.S. tariff increases by about an additional 10 percentage points, resulting in significantly higher U.S. tariffs compared to those incorporated in the baseline. These developments are assumed to spark retaliation from trading partners. The renewed rise in trade tensions also leads to a more persistent increase in uncertainty and rising financial market volatility, accompanied by a sizable and widespread shock to confidence.
The resulting seizing up of global trade, elevated uncertainty, declines in confidence, and falling asset prices tip the global economy into an extended period of anemic expansion, reducing global growth by 0.5 and 0.4 percentage point in 2025 and 2026 relative to the baseline (figure 1.12.F). Under this scenario, the impact on growth in advanced and developing economies in 2025 is broadly similar, as the global shock to financial markets and confidence leads to a widespread reduction in activity. Compared with the baseline, advanced-economy growth is weaker
' These simulations are conducted using the Oxford Economics Global Economic Model, a semi-structural macroeconomic projection model that includes 188 individual country blocks in its extended version, available at quarterly or annual frequencies (Oxford Economics 2019).
by 0.5 and 0.6 percentage point in 2025 and 2026, whereas EMDE growth is reduced by 0.5 and 0.1 percentage point. 3
Much of the sofrness in global growth is attributable to weaker global demand amid sharply higher trade barriers and souring sentiment, which also leads to lower energy prices. This combination initially reduces global inflation by 0.4 percentage point compared with the baseline in 2025, before the upward pressure on prices from higher tariffs begins to dominate, raising inflation to 0.5 percentage point above the baseline in 2026. In this context, central banks in many advanced economies and EMDEs are constrained from significantly easing monetary policy over the next two years.
Under an upside scenario, the U S. effective tariff rate, while still remaining above 2024 levels, is assumed to be reduced by roughly half compared to the baseline, with all retaliatory tariffs receding Such an outcome might occur following negotiations between the United States and its main trading partners, resulting in a series of bilateral trade agreements and a general cooling of trade tensions The lower tariffs are assumed to be accompanied by a reduction in uncertainty and an increase in confidence starting in the second half of 2025.
The more benign global trade backdrop and widespread improvement in confidence would raise global growth by 0.1 and 0.3 percentage point in 2025 and 2026 relative to the baseline. The impact is anticipated to be generally uniform across economies, with growth in both advanced economies and EMDEs boosted by 0.1 and 0.3 percentage point in 2025 and 2026 compared with the baseline. Across major economies,
3 These results are consistent with other studies that analyze the impact of comparable increases in U.S. tariffs. For instance, without retaliation from trading partners, higher tariffs are found ro have a larger effect on U.S. growth compared to other economies Furthermore, in line with the simulation results, recent studies also suggest that retaliation by trading partners would amplify the negative impact of higher tariffs on U.S. output (McKibbin, Hogan, and Noland 2024; The Budget Lab 2025).
tailwinds from stronger real income growth and better sentiment are reinforced by gradual monetary easing and rising asset prices.
With increased trade barriers, heightened policy uncertainty, and multiple downside risks weighing on the outlook, revitalizing and re-energizing global dialogue and cooperation are paramount. Global policy efforts are needed to safeguard international trade by fostering the resolution of trade disputes and mitigating the adverse impacts of geopolitical tensions on trade networks. Collective action is also needed to tackle the myriad of overlapping challenges, including widespread conflict, decline in official development assistance, and severe food insecurity, facing many vulnerable EMOEs. Furthermore, revitalizing global efforts toward climate change mitigation and adaptation is essential to limit future costs from increasingly frequent climaterelated natural disasters. At the national level, shoring up economic stability requires focusing on sound monetary and financial policies to contain risks related to inflation and capital flow volatility. Amid narrow fiscal space and substantial development needs, it is critical for EMDE fiscal policy makers to adopt measures to mobilize domestic revenues, reprioritize fiscal spending, and strengthen fiscal frameworks. To bolster long-term growth prospects in EMDEs, structural reforms are needed to strengthen institutional quality, accelerate investment growth, develop human capital, and improve the functioning of labor markets. For EMDEs affected by conflict, achieving lasting peace and stability is crucial to reducing human suffering and improving economic well-being.
Key global challenges
Confronting rising trade barriers and fragmentation
The recent rise in trade barriers and ongoing trade fragmentation are critical challenges that require appropriate policy action. These developments come against the backdrop of already sluggish global trade, where the once-rapid increase in
trade openness has stalled since the early 201 Os, as the maturation of global supply networks has limited the scope for further gains from specialization (figure 1.13.A). Supply-chain disruptions associated with the pandemic and elevated geopolitical tensions have highlighted the vulnerabilities of the global trade system, prompting some countries to pursue reshoring strategies through increased use of trade restrictions and industrial policies. As a result, the momentum for trade globalization has slowed while geopolitical fragmentation has intensified (figure 1.13.B).
From a longer-term perspective, EMDEs have become increasingly integrated into the global economy since the early 2000s. This integration helped their economic development but also made them more vulnerable to rising protectionism, value chain disruptions, and trade policy uncertainty. The recent increase in trade barriers imposed by key economies, and possible ensuing retaliation, pose a significant threat to the global trading system. The international community has a role in fostering dialogue and cooperation to address global trade imbalances in an orderly and transparent manner. EMDEs, in particular, would benefit more by liberalizing broadly rather than imposing retaliatory tariffs. Across-the-board liberalization lowers trade costs and promotes investment, supporting long-term growth.
In tandem, countries need to design other policies to mitigate the adverse consequences of higher trade restrictions while taking advantage of opportunities for cross-border cooperation and improvements in domestic conditions. In EMDEs, such an approach can involve seeking strategic trade and investment partnerships with other EMDEs, reducing regulatory and trade barriers, and pursuing opportunities to diversify trade, including through regional trade agreements (World Bank 2025a) The negative consequences of rising trade barriers in certain markets can be partially offset by fostering deeper integration with other countries, including intra-regional partners, and by expanding the liberalization of current trade agreements. For example, deepening all existing preferential trade agreements to their highest level of ambition could increase GDP by
an estimated 0.8 percent in Sub-Saharan Africa and by 1.7 percent in South Asia (Fernandes et al. 2021). Deeper trade agreements can also limit the negative spillovers on excluded countries and reduce trade policy uncertainty (Handley and Limao 2015; Lee, Mulabdic, and Ruta 2023; Mattoo, Mulabdic, and Ruta 2022). Additionally, priority needs to be placed on reforming the multilateral trading system to address emerging challenges. Estimates indicate that trade cost reductions between 1995 and 2020, including those related to WTO accession commitments, boosted global real GDP by nearly 7 percent over the period, with low-income countries growing by over 30 percent (WTO 2024).
A range of adverse trends-including the rise in global trade-restrictive measures, the incidence of conflict, the increase in displaced populations, and acute food insecurity-point to escalating challenges in many of the most vulnerable EMDEs. At the same time, many of these countries are facing extraordinary financial pressures with elevated public debt, fiscal constraints, and obstacles in mobilizing private finance. These financing challenges are compounded by declining aid flows from the international community (figure 1.13.C). Crossborder and domestic crises have led to increased humanitarian needs that necessitate swift financial responses, with governments often redirecting official development assistance (ODA) funds from other priorities to meet emergent needs (Ahmed, Calleja, and Jacquet 2025).
In a global economy susceptible to additional adverse shocks, collective action is needed to help vulnerable EMDEs make progress on key development goals and avert potentially adverse spillovers to other economies, including pressures for outward migration. Vulnerable EMDEs will need international support to mobilize additional resources and strengthen institutions for lasting reforms. Multilateral institutions can also help ensure the availability of vital goods, such as food and medical equipment, that are urgently needed during crises-as was evident during the COVID19 pandemic (World Bank 2025a).
The global economic environment has shifted significantly, with increased trade barriers and ensuing policy uncertainty coming on the heels of already sluggish global trade The once-rapid advance in goods trade openness has stalled since the early 2010s, partly due to the maturation of global supply networks. This, together with pandemic-related supply chain disruptions and escalating geopolitical tensions, has slowed the momentum for trade globalization and exacerbated geopolitical fragmentation Meanwhile, declining official development assistance flows are compounding the financing hurdles facing many vulnerable EMDEs Climate change remains a major challenge, with EMDEs increasingly exposed to extreme weather events.
B Geopolitical Fragmentation Index
Index,100=Maximum
Mar-01Sep-02Mar-04Sep-05Mar-07Sep-08Mar-10Sep-11Mar-13Sep-14Mar-16Sep-17Mar-19Sep-20Mar-22Sep-23Mar-25
C. Net ODA outflows, DAC countries D. Extreme weather events in EMDEs
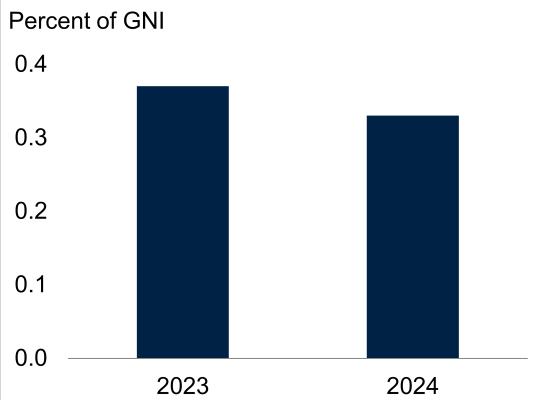
Sources: CPB Netherlands Bureau for Economic Policy Analysis; EM-DAT (database); FernandezVillaverde Mineyama,and Song (2025); OECD (2025); WDI (database); World Bank.
Note: DAC = Development Assistance Committee; EMDEs = emerging market and developing economies; GNI = gross national income; LICs = low-income countries;ODA = Official Development Assistance.
A. Trade openness is measured as the 12-month moving average ofthe ratio of global merchandise export volumes to global industrial production volumes (excluding construction) Last observation is March 2025.
B. The Geopolitical Fragmentation Index extracts the common factor across various indicators relating to trade,finance, mobility of people and ideas. and geopolitical instability and misalignment (Fernandez-Villaverde, Mineyama. and Song 2025). Lines show the common factor derived from standardized variables with zero mean and unit standard deviation. A highervalue implies greater fragmentation Lastobservation is 202401.
C. Panel shows ODAflows and grant equivalents as a share of GNI by Development Assistance Committee (DAC) countries.
D. Extreme weather events include droughts floods,and storms. Sample includes 122economies for droughts 144 for floods,and 127for storms.
In the case of LICs and PCS, given their substantial financing needs and limited state capacity, coordinated efforts from the global community can help these countries expand fiscal space. Measures include concessional financing and debt relief, where appropriate, as well as technical assistance to strengthen fiscal policies and build resilient macroeconomic frameworks. Countries in active conflicts will continue to
depend on the global community for emergency relief and peace-building support.
Natural disasters and the concomitant economic impacts are a growing concern for policy makers. EMDEs are particularly exposed to the adverse effects of climate-related natural disasters, with a steady increase in the frequency and intensity of storms, floods, and droughts over the past decades (figure 1.13.D). At the same time, loss of biodiversity-defined as the variety of plant and animal life in habitats or ecosystems-is proceeding at an unprecedented rate and scale, with dire implications for economies and livelihoods. Biodiversity and climate change are inextricably linked, with climate change being a key driver of biodiversity loss. Biodiversity can also provide protection against natural disasters and promote ecosystem resilience (Seymour, Wolosin, and Gray 2022).
As with natural disasters, the loss and degradation of biodiversity impacts low income and lower middle-income countries disproportionately. Renewable natural capital, including agricultural land and forests, and blue assets, such as fisheries and mangroves, account for 23 percent of the wealth in low-income and 10 percent in lowermiddle income countries (Kemper and Pathak 2021). Estimates indicate that about $44 trillion of global value added is generated in industries that depend moderately or heavily on nature and, consequently, exposed to risks from biodiversity loss (World Economic Forum 2020) Loss of biodiversity also presents a major risk to global food security by undermining the resilience of agricultural systems to climate change and other factors, such as pests and pathogens.
Comprehensive policies are needed to support climate change mitigation and adaptation and address biodiversity loss. These include incentivizing green investments and technologies; strengthening environmental standards and regulations; promoting debt-for-climate swaps; and reducing environmentally harmful subsidies to agriculture, fisheries, and fossil fuels (Damania et al. 2023; World Bank 2021). Well-targeted
social benefit systems can help reduce the damage done by adverse shocks. Furthermore, facilitating trade and investment in green technologies will enhance green investments in EMDEs and promote knowledge spillovers to these economies.
Reversing global trends in biodiversity loss will require efforts to reduce global pressures on food systems, including practices such as sustainable intensification and reducing food losses and waste (Leclere et al. 2020). Better allocation and management of land, water, and other inputs could boost income from agriculture and forestry as well as increase food production to meet the caloric needs of growing global populations (Damania et al. 2023). Additionally, applying rigorous safeguards and standards for development finance in line with best practices can help minimize and manage the impact of land use, infrastructure development, and energy and extractive sectors on biodiversity at the global scale (Narain et al. 2023; WEF 2020).
EMDE monetary and financial policy challenges
With core inflation across EMDEs plateauing since mid-2024 about half a percentage point above the pre-pandemic pace, risks to inflation persist (figure 1.14.A). As trade policies shift, the economic impacts that follow should determine the appropriate monetary policy response. Elevated policy uncertainty and increased global trade barriers may have notable negative impacts on economic activity that could require some central banks to ease policy, particularly if inflation falls in response to such shocks (Baker et al. 2016; Caldara et al. 2020). Yet, given challenges in foreseeing these effects with precision, it may be best for central banks to delay taking action until incoming data clarify the state of economic activity. In other cases, central banks may need to proactively respond to emerging inflationary pressures, even at the cost of some softening of economic activity to avoid deanchoring of inflation expectations (Mendes, Murchison, and Wilkins 2017).
With capital inflows to EMDEs declining since late 2024, some EMDEs may be particularly
prone to destabilizing capital outflows amid increased uncertainty, ongoing inflation risks, and currency volatility (figure 1.14.B). To reduce the likelihood of such sudden shifts, EMDE policy makers can reaffirm their commitments to price stability (Kalemli-Ozcan and Unsal 2024). EMDE monetary policy credibility can be reinforced through clear communications, robust monetary frameworks, and the safeguarding of central bank independence, which has steadily improved over the last two decades but nevertheless remains below advanced economy levels, on average (figure 1.14.C). To bolster credibility some EMDE central banks may need to tighten monetary policy in the face of potential capital outflows and financial volatility. Doing so could help anchor inflation expectations, reinforce investor confidence, and reduce domestic market volatility. Indeed, a proactive tightening of monetary policy by many EMDE central banks during the postpandemic inflationary surge helped create conditions for a sustained decline in inflation, in addition to bolstering financial stability amid the nse m global interest rates at the time (Evdokimova et al. 2024).
EMDEs policy makers also need to be prepared to deploy tools that manage risks to financial stability, arising, for example, from reduced international investor risk appetite, capital outflows, and rising bond yields-all of which might stem from heightened trade tensions and policy uncertainty. Weakening growth in EMDEs-especially if downside risks materialize-could imperil financial sector balance sheets, increase corporate borrowing costs, and curtail funding access in the nonfinancial sector, particularly among trade-exposed EMDEs Such strains could also worsen extant financial sector vulnerabilities in some countries, such as overreliance on domestic banks for sovereign financing. To promote financial sector resilience, precautionary steps can include comprehensive stress tests for financial institutions and the scrutiny of bank credit quality and capital levels, as well as enhanced liquidity and liability management, among other sound macroprudential rules Building on progress in recent years, continued efforts to ensure adequate foreign reserves are also important (figure 1.14.D).
EMDE core inflation has plateaued above the pre-pandemic average. Cumulative capital inflows to EMDEs have been declining since late 2024 and could come under further strain amid heightened uncertainty, currency volatility, and inflationary pressures. EMDE central banks can make use of clear communications and credible monetary frameworks that reinforce confidence in policy independence, which remains below advancedeconomy levels, on average. Additionally, foreign reserves could help protect against sudden shifts in sentiment and deterioration in financing conditions.
B. Cumulative capital inflows to EMDEs
Central Bank Independence Index, by
D Change in official reserves relative to December 2019
Index,100= December2019
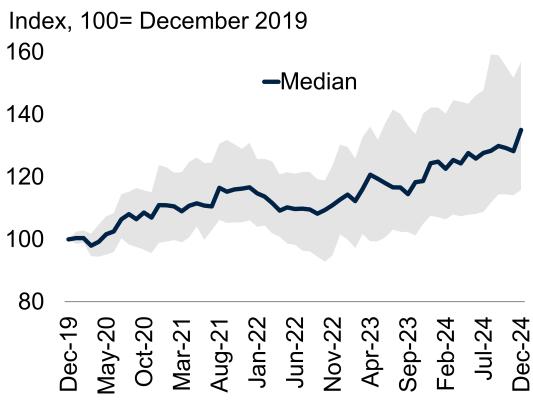
Sources: Haver Analytics; Ramelli (2022,2024); World Bank.
Note : EMDEs = emerging market and developing economies.
A. Panel shows year-over-year core inflation for up to 46 EMDEs. Last observation is April 2025.
B. Panel shows the cumulative capital inflows from March 2022,using monthly data. Sample includes up to 32 EMDEs. Last observation is March 2025.
C. Lines represent the average Central Bank Independence Index score by country group,ranging from Oto 1, with higher scores indicating greater independence. Sample includes up to 37 advanced economies and 117 EMDEs. Last observation is 2023.
D. Official reserves and otherforeign currency assets, presented as an index compared to December 2019 levels. Shaded area indicates the interquartile range. Lastobservation is December 2024.
EMDEs require considerable fiscal resources to tackle development challenges, but the space to do so has been constrained by overlapping shocks in the last few years, which have increased government debt and widened fiscal deficits (figure 1. 15.A). As a result, governments continue to face the difficult task of meeting critical public spending needs and supporting vulnerable households while shoring up fiscal sustainability Despite progress in extending the maturity of
Fiscal space has narrowed in recent years, with fiscal deficits remaining wider than pre-pandemic averages in EMDEs , pointing to the need for these economies to mobilize domestic revenues and reprioritize spending
High government and external debt levels leave some EMDE regions vulnerable to sudden rises in borrowing costs. In L/Cs and FCS, retrenchment in official development assistance could reduce the spending envelope for critical categories, including health care Revenue collection continues to substantially lag in EMDEs , especially in L/Cs, relative to advanced economies
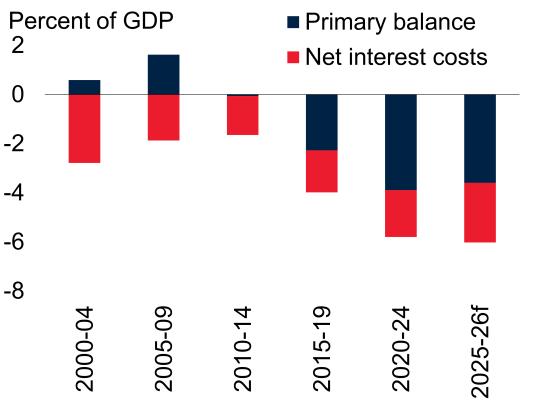
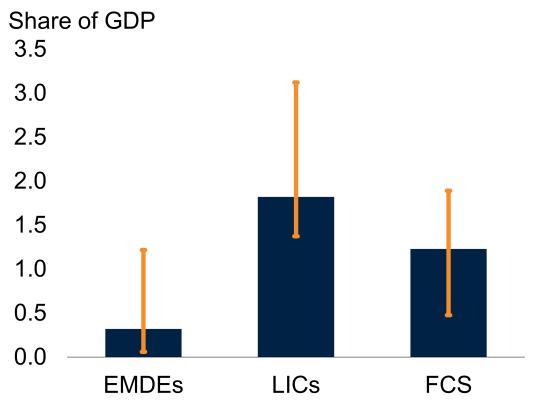
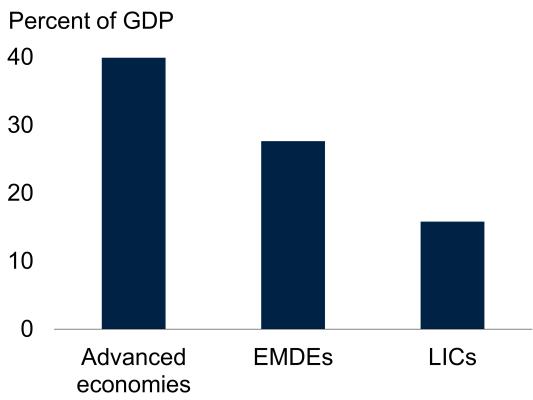
Sources: Center for Global Development; IMF; Kose et al. (2022); World Bank.
Note: f = forecast. EAP = East Asia and Pacific; ECA = Europe and Central Asia; EMDEs = emerging market and developing economies; FCS = fragile and conflict-affected situations; LAC = Latin America and the Caribbean; LICs = low-income countries; MNA = Middle East and North Africa; SAR = South Asia; SSA = Sub-Saharan Africa.
A Panel shows GDP-weighted aggregate fiscal balance for 154 EMDEs Bars represent simple averages for each time period.
B Bars show the median debt-to-GDP ratio for each EMDE region. Gross government debt includes domestic and external debt; external debt includes government and private debt.
C. Panel shows median official development assistance (gross disbursements) for health spending received in 2023 as a share of GDP Sample includes 133 EMDEs, of which 38 are FCS and 25 are LICs Orange whiskers indicate interquartile range.
D Panel shows average general government revenue as a share of GDP in 2024 Sample includes 38 advanced economies and 149 EMDEs, of which 22 are LICs
domestic debt in recent years, some EMDE regions remain vulnerable to further rises in borrowing costs and adverse shifts in market sentiment amid already high debt-servicing costs and sizable debt levels (figure 1.15.B).
Although many EMDEs have undertaken measures to strengthen fiscal posmons in recent years, including the unwinding of pandemic-era spending, fiscal deficits remain above prepandemic averages and debt levels continue to rise
in about half of EMDEs and, in some cases, to levels that appear unsustainable. It will be critical for EMDEs, particularly those with fiscal space constraints, to raise additional domestic revenues, especially as debt-servicing costs grow and some external sources of financing, including development assistance, dwindle. LICs have become more vulnerable to rising debt-servicing costs, as their debt has increasingly shifted from concessional to market-based financing. Nearly half of LICs are either in debt distress or at high risk of it-double the share in 2015-and no LIC is at low risk. This inhibits their ability to repair the economic damage generated by recent shocks Moreover, in LICs and FCS, since official development assistance represents a large share of critical spending, including in health, the partial loss of these flows could put further pressure on budgets (figure 1.15.C).
EMDEs, especially LICs, continue to substantially lag advanced economies in revenue collection (figure 1.15.D). Building tax capacity is a crucial step toward mobilizing domestic resources, maintaining sustainable debt dynamics, providing essential public services, supporting vulnerable populations, and rebuilding fiscal buffers (Choudhary, Ruch, and Skrok 2024). This can include measures that broaden revenue bases, including the introduction of new tax instruments (De Mooij et al. 2020). Additionally, to balance the tradeoff between generating revenue and economic growth, reducing costly loopholessuch as incentives, deductions, and exemptionscan be complemented with reforms that reinforce tax administration and collection to curb avoidance, base erosion, and profit shifting (Bachas et al. 2025). These reforms can also be combined with those that strengthen institutions and legal systems, which would help unlock tax potential in EMDEs (Benitez et al. 2023). Careful sequencing of various reform elements is also required to harness their mutually reinforcing effects for maximizing the boost to fiscal revenue (World Bank 20256).
Reprioritizing fiscal spending away from broad, untargeted support and costly subsidies can free up resources that can be redirected to low-income households. In particular, governments can provide vulnerable households with means-tested
cash transfers, which tend to be less costly than food and fuel subsidies. Over the longer term, EMDEs can enhance internet connectivity and leverage digital tools to better identify vulnerable households, especially in countries where registries are outdated, and surveys are costly (Chowdhury et al. 2022). Protecting spending in growthenhancing categories, such as health and education, is critical given setbacks from the pandemic, increased spending pressures due to rapid price increases in recent years, and persistently large investment gaps-all of which are likely to reduce the space for spending in these critical categories in future years (Kurowski et al 2024).
Improvements to the expenditure review process-such as strengthening mechanisms that prioritize and evaluate the efficacy of public projects-can enhance the quality and efficiency of public spending. Policies that aim at strengthening public procurement practices, administrative capacity, and transparency can also bolster public investment efficiency, foster a more favorable business climate for private investment, and help reinvigorate productivity.
More broadly, fiscal sustainability can be enhanced by credible and well-designed frameworks, including fiscal rules, stabilization funds, and medium-term expenditure frameworks. Such measures can help reduce the procyclicality of fiscal policy, build fiscal space, and improve fiscal policy outcomes-particularly in the context of fiscal challenges posed by commodity price volatility m commodity-exporting EMDEs (Arroyo Marioli and Vasishtha 2025). In the case of fiscal rules, a supportive institutional environment and broad political consensus are key for sustained fiscal discipline (Fatas, Gootjes, and Mawejje 2025).
EMDE structural policy challenges
The ongoing headwinds to the global economy exacerbate the broad-based and sustained slowdown in growth that EMDEs have experienced since the global financial crisis. This has reflected a slowdown in underlying potential growth, mirroring trends in investment, labor
productivity, and labor supply growth. Policies that advance R&D, innovation, and adoption of technology can boost the growth of productivity and potential output (Cirera and Maloney 2017; Kose and Ohnsorge 2024) Reversing the prolonged, widespread slowdown in investment growth is critical for addressing large investment gaps and making progress toward development goals FDI can help boost domestic investment, generate employment, spread technological innovation, and spur productivity (Amighini, McMillan, and Sanfilippo 2017; Javorcik 2015; Kose, Prasad, and Terrones 2009). Thus, FDI can be a key driver of growth, particularly in countries with sufficiently well-developed financial markets or high levels of human capital (Benetrix, Pallan, and Panizza 2023) Yet, FDI flows to EMDEs as a share of their GDP have also trended down, reflecting a combination of global and countryspecific factors (figure 1.16.A). Globally, macroeconomic shocks, elevated uncertainty, and escalating geopolitical tensions have dampened FDI. In many EMDEs, progress with institutional reforms has stalled since the 2000s, weakening the investment climate and discouraging FDI inflows (World Bank 2025a).
To bolster long-term growth prospects, EMDEs need to reinvigorate key policy reforms to accelerate investment growth, including by improving the institutional and business environment. Regulatory reforms can enable innovation by lowering barriers to entry, reducing bureaucratic hurdles, and stimulating competition (World Bank 2025a). In the medium to long term, such reforms can also promote economic diversification. In addition, enhancing competition policy is vital for creating a fair and dynamic market landscape. By curbing monopolistic practices and enabling a level playing field, and by effectively regulating markets that lack competitiveness, such policies can boost innovation and improve economic efficiency (World Bank 2020, 2024a).
Supportive structural conditions are also essential for attracting FDI inflows. These include solid macroeconomic fundamentals; high-quality institutions; political, regulatory, and socioeconomic stability; strong human capital and productivity growth; financial development; and trade and
FD/ inflows to EMDEs, as a share of their GDP, have trended down since the 2010s. Institutional quality in EMDEs , especially in L/Cs, generally lags advanced economies, with no progress seen in investment climate indicators over the past decade . To confront the jobs challenge, EMDEs need to enhance human capital, including by boosting spending on education to increase the average years and quality of schooling. FCS face persistent risks of violence and instability, often fueled by weak state capacity, as indicated by measures of government effectiveness , rule of law, and regulatory quality
A. FOi inflows to EMDEs B. Investment climate
Percentof GDP 10 - Median Interquartile range
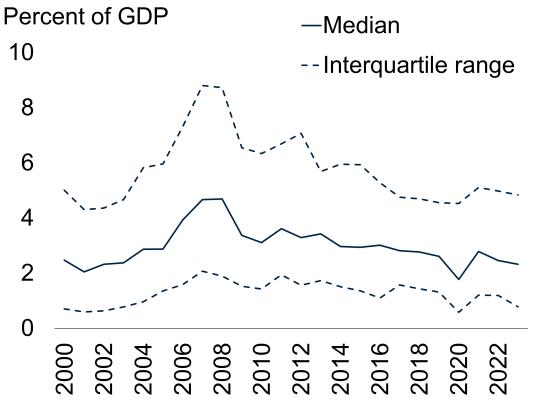
C. Average years of schooling in EMDEs
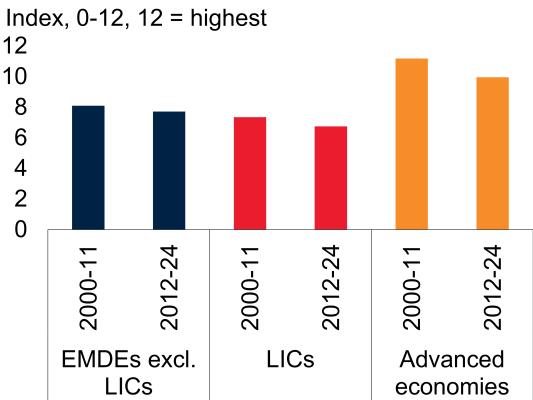
State capacity in FCS versus other EMDEs
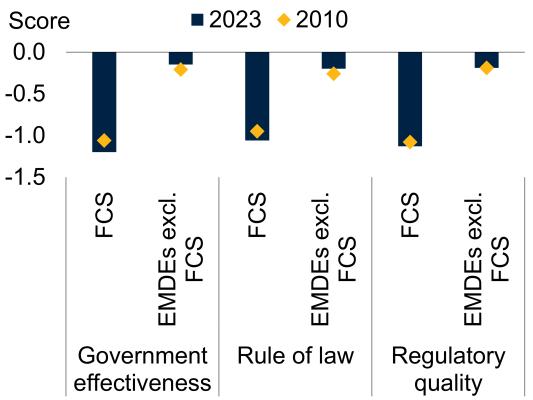
Sources: PRS Group's International Country Risk Guide (ICRG); UN Population Prospects (database); WDI (database); World Bank; Worldwide Governance Indicators (database)
Note : EMDEs = emerging market and developing economies; FCS = fragile and conflict-affected situations; FDI = foreign direct investment; LICs = low-income countries The FCS group is based on the current World Bank classification
A. Annual medians and interquartile ranges of FDl-to-GDP ratios. Balanced sample of 134 EMDEs.
B. Medians of ICRG Investment Profile Index Sample includes 36 advanced economies and 102 EMDEs. of which 18 are LICs
C Panel shows the unweighted average years of schooling by EMDE group at the latest years of observations EMDEs facing a large jobschallenge are those with a projected working-age population increase of 50 percent or more between 2025 and 2050.
D Panel shows simple averages Highervalues reflect better outcomes across each indicator, which range from a minimum of -2 5 to a maximum of 2.5. Sample includes 148 EMDEs of which 34 are FCS.
Meeting the jobs challenge amid structural change
The challenge of creating sufficient employment opportunities for growing working-age populations is looming in many EMDEs, particularly in the poorest regions (Chrimes, Kose, and Stamm forthcoming). Between 2025 and 2030, over 600 million young people are expected to join the ranks of the working-age population in EMDEs, with the net working-age population increasing by around 250 million over the same period SSA, especially PCS economies in the region, and SAR will account for four-fifths of this net increase. In addition, in some regions, such as SAR, the jobs challenge reflects low employment prospects for the female labor force (World Bank 20246). The challenge also extends over the longer term in some regions: the projected increase in the working-age population over the next quartercentury in SSA is larger than any region has experienced over a 25-year period in the past.
The task of creating sufficient employment opportunities is complicated by the challenging global context, especially as key drivers of growth-notably, trade integration-have weakened significantly over recent decades and now face an even more extreme disruption (Kose and Ohnsorge 2024). Overlapping crises that have hit the global economy since 2020 have damaged fiscal positions, including in many of the countries most affected by the jobs challenge (Mawejje 2024). Evolving structural shifts, including shifts in trade relations and uncertainty about new technologies such as AI, as well as the need to manage the energy transition, add to uncertainty around employment prospects (Cazzaniga et al. 2024; Feriga et al. 2024; IMF 2022a).
investment openness. EMDEs, especially LICs, generally lag advanced economies in terms of the quality of institutions, having made no progress over the past decade in improving features such as the investment climate (figure 1. 16.B). Given the significance of institutional quality for both encouraging FDI and enhancing its macroeconomic benefits, it is imperative for EMDEs, particularly LICs, to intensify reform efforts in this area.
Job creation strategies should focus on three pillars: foundational infrastructure for jobs; strengthening governance and supporting business -enabling policies; and mobilizing private capital. These broad pillars include measures to accelerate economic growth, upskill workers, and improve the functioning of labor markets to better match potential workers and firms (Chrimes, Kose, and Stamm forthcoming). Policies to promote macroeconomic stability and robust, effective institutions are crucial. These need to be
complemented with targeted interventions to encourage a more flexible and responsive labor market (including by reducing labor barriers to the formal sector), improve access to finance, address structural bottlenecks (such as barriers to competition, trade, and investment), and support a facilitative business regulatory environment (Kose and Ohnsorge 2024). Investments in key physical and digital infrastructure are also vital. To enhance human capital, EMDEs need to boost spending on education to increase the average years of schooling and the quality of education (figure 1.16.C). Moreover, aggregate job creation is not the only employment-related consideration for policy makers: the quality of jobs is also critically important. Job quality can be enhanced by boosting productivity, in part through the upskilling of existing, including younger, workers; addressing informality; and ensuring adequate working conditions. Strategies can also pay particular attention to sectors with high jobcreation potential.
Tackling rising conflicts and associated damage
Addressing the rising incidence of conflict in EMDEs is essential for fostering peace and promoting growth and development in some of the most vulnerable countries. Intense armed conflicts lead to destruction of human and physical capital, often culminating in deep recessions and large output losses (Dieppe, Kilic Celik, and Okou 2020; Federle et al. 2024). Conflicts can also have adverse spillovers, decreasing trade flows and reducing private investment in neighboring states (Abdel-Latif et al. 2024; Rauschendorfer and Shepherd 2022). FCS face persistent risks of violence and instability,
often fueled by deep-seated grievances, exclusion, inequality, and weak governance (World Bank 2020). For instance, state capacity in FCS, as indicated by measures of government effectiveness, rule of law, and regulatory quality, lags other EMDEs (figure 1.16.D).
Although the roots of armed conflicts and instability are complex and context-specific, addressing these challenges requires a proactive approach-tailored to each country's needs-that prioritizes conflict prevention, fosters inclusive development, and strengthens resilience to adverse shocks (United Nations and World Bank 2018). Investing in early-warning systems and conflict prediction mechanisms enables proactive interventions, which are more cost-effective than post-violence responses (Mueller et al. 2024). For example, counter-cyclical macroeconomic policies and job creation programs can help reduce the risk of violent conflict (Akanbi et al. 2021; Blattman and Annan 2016). During active conflicts, protecting civilians, providing humanitarian relief, and preserving critical institutions-such as central banks, legal systems, and public service infrastructure-can lessen the costs of violence while supporting faster, more inclusive recoveries (Gillard 2024). Effective disarmament, demobilization, and reintegration programs are also crucial for stabilizing post-conflict societies, alongside policies that strengthen institutions, including electoral and justice systems (Ayissi 2020) Sustaining recovery requires investments in basic infrastructure, education, healthcare, and social protection, while expanding financial inclusion and leveraging the private sector to drive inclusive growth.
Algeria* Lao PDR
Angola* Liberia
Argentina Libya*
Armenia Madagascar
Azerbaijan* Malawi
Bahrain* Mali
Belize Mauritania
Benin Mongolia
Bhutan* Mozambique
Bolivia* Myanmar*
Botswana Namibia
Brazil Nicaragua
Afghanistan
Albania
Serbia
Somalia, Fed Rep
Antigua and Barbuda Sri Lanka
Bahamas, The St. Kitts and Nevis
Bangladesh
Barbados
Belarus
St. Lucia
St. Vincent and the Grenadines
Syrian Arab Republic
Bosnia and Herzegovina Thailand
Bulgaria Tonga
Cambodia
China
Djibouti
Tunisia
TOrkiye
Tuvalu
Burkina Faso Niger Dominica Vanuatu
Burundi Nigeria*
Cabo Verde Oman*
Cameroon* Papua New Guinea
Central African Republic Paraguay
Chad* Peru
Dominican Republic Viet Nam
Egypt, Arab Rep
El Salvador
Eswatini
Georgia
Chile Qatar* Grenada
Colombia* Russian Federation*
Haiti
Comoros Rwanda Hungary
Congo, Dem Rep Sao Tome and Principe India
Congo, Rep.* Saudi Arabia*
Costa Rica
Cote d'Ivoire
Senegal
Seychelles
Ecuador* Sierra Leone
Equatorial Guinea*
Jamaica
Jordan
Kiribati
Lebanon
Solomon Islands Lesotho
Eritrea South Africa
Malaysia
Ethiopia South Sudan* Maldives
Fiji Sudan
Marshall Islands
Gabon* Suriname Mauritius
Gambia, The Tajikistan
Ghana* Tanzania
Mexico
Micronesia, Fed Sis
Guatemala Timor-Leste* Moldova
Guinea Togo
Guinea-Bissau
Trinidad and Tobago*
Guyana* Uganda
Honduras Ukraine
Indonesia* United Arab Emirates*
Iran, Islamic Rep.* Uruguay
Montenegro
Morocco
Nauru
Nepal
North Macedonia
Pakistan
Iraq* Uzbekistan Palau
Kazakhstan* West Bank and Gaza
Panama
Kenya Yemen, Rep.* Philippines
Kosovo Zambia
Poland
Kuwait* Zimbabwe Romania
Kyrgyz Republic
• Energy exporters
Samoa
1. Emerging market and developing economies (EMDEs) include all those that are not classified as advanced economies and for which a forecast is published for this report Dependent territories are excluded. Advanced economies include Australia; Austria; Belgium;Canada;Cyprus;Czechia; Denmark; Estonia; Finland;France;Germany;Greece; Hong Kong SAR,China; Iceland; Ireland; Israel; Italy;Japan; the Republic of Korea; Latvia; Lithuania; Luxembourg;Malta; the Netherlands; New Zealand;Norway; Portugal;Singapore;the Slovak Republic; Slovenia; Spain; Sweden; Switzerland; the United Kingdom; and the United States. Since Croatia became a memberof the euro area on January 1,2023,it has been removed from the list of EMDEs,and related growth aggregates, to avoid double counting
2. An economy is defined as commodity exporter when,on average in 2017-19,either (1) total commodities exports accounted for 30 percentor more oftotal exportsor (2) exports of any single commodity accounted for 20 percent ormore of total exports Economies for which these thresholds were met as a result of re-exports were excluded. When data were notavailable, judgment was used. This taxonomy results in the classification of some well-diversified economies as importers even ifthey are exportersofcertain commodities (for example Mexico). 3. Commodity importers are EMDEs not classified as commodity exporters
Abdel-Latif, H., A. C. David, R. Ouedraogo, and M. Specht. 2024. "Echoes Across Borders: Macroeconomic Spillover Effects of Conflict in Sub-Saharan African Countries." IMF Working Paper 24/100, International Monetary Fund, Washington, DC.
ACLED (Armed Conflict Location & Event Data Project) database. Accessed on May 30, 2025. https:// adeddata.com/data-export-tool.
Ahmed, M., R. Calleja, and P. Jacquet. 2025. "The Future of Official Development Assistance: Incremental Improvements or Radical Reform?". Washington, DC: Center for Global Development
Ahir, H., N. Bloom, D. Furceri. 2022. "The World Uncertainty Index." NBER Working Paper 29763, National Bureau of Economic Research, Cambridge, MA.
Akanbi, 0. A., N. Gueorguiev, M. J. Honda, P. Mehta, M. K Moriyama, K. Primus, and M. Sy. 2021. "Avoid a Fall or Fly Again: Turning Points of State Fragility." IMF Working Paper 21/133, International Monetary Fund, Washington, DC.
Amighini, A. A., M S. McMillan, and M. Sanfilippo. 2017. "FDI and Capital Formation in Developing Economies: New Evidence from IndustryLevel Data." NBER Working Paper 23049, National Bureau of Economic Research, Cambridge, MA.
Amiti, M., S. J. Redding, and D. E. Weinstein. 2019. "The Impact of the 2018 Tariffs on Prices and Welfare." Journal of Economic Perspectives 33 (4): 187210.
Angeli, M., C. Archer, S. Batten, A. Cesa-Bianchi, L. D'Aguanno, A. Haberis, T. Lober, S. Maxwell, R. Sajedi, M. van der Merwe, B. Wanengkirtyo, and C. Young. 2022. "Climate Change: Possible Macroeconomic Implications." Quarterly Bulletin 2022 Q4. Bank of England, London.
Arroyo Marioli, F., and G. Vasishtha. 2025."Fiscal Policy Procydicality and Volatility in CommodityExporting Emerging and Developing Economies: Determinants and Implications for Growth." Policy Research Working Paper 11037, World Bank, Washington, DC.
Ayissi, A. 2021. "Three Decades of Disarmament, Demobilization, and Reintegration of Ex-Combatants in Africa: Lessons Learned and Challenges Ahead." In The State of Peacebuilding in Africa, edited by T. McNamee, M. Muyangwa. Palgrave Macmillan, Cham.
Bachas, P., A. Brockmeyer, R Dom, and C. M. Semelet. 2025. "Effective Tax Rates, Firm Size and the Global Minimum Tax." Policy Research Working Paper 11090, World Bank, Washington, DC.
Baker, S. R., N. Bloom, and S. J. Davis. 2016. "Measuring Economic Policy Uncertainty." The Quarterly Journal ofEconomics 131 (4): 1593-636.
Barbiero, 0., and H. Stein. 2025. "The Impact of Tariffs on Inflation." Current Policy Perspectives 25-2, Federal Reserve Bank of Boston, Boston, MA.
Benetrix, A., H. Pallan, and U. Panizza. 2023. "The Elusive Link between FDI and Economic Growth." Policy Research Working Paper 10422, World Bank, Washington, DC.
Benitez, J. C., M. Mansour, M. Pecho, and C. Vellutini. 2023. "Building Tax Capacity in Developing Countries." IMF Staff Discussion Note SDN/2023/ 006, International Monetary Fund, Washington, DC.
BIS (Bank for International Settlements) database. Accessed on February 23, 2025. https://data.bis.org/.
Blattman C., and J. Annan. 2016. "Can Employment Reduce Lawlessness and Rebellion? A Field Experiment with High-Risk Men in a Fragile State." American Political Science Review 110 (1): 1-17.
Borja-Vega, C. and F. Zhang. 2024. Water for Shared Prosperity. Washington, DC: World Bank.
Burke, M., S. M. Hsiang, E. Miguel. 2015. "Global non-linear effect of temperature on economic production." Nature 527: 235-39.
Caldara, D., M. Iacoviello, P Molligo, A. Prestipino, A. Raffo. 2020. "The Economic Effects of Trade Policy Uncertainty." Journal of Monetary Economics 109: 3859.
Cavallo, A., P. Llamas, and F. Vazquez. 2025 "Tracking the Short-Run Price Impact of U.S. Tariffs." Working Paper, Havard Business School, Boston, MA.
Choudhary, R., F. U. Ruch, and E. Skrok. 2024. "Taxing for Growth: Revisiting the 15 Percent Threshold." Policy Research Working Paper 10943, World Bank, Washington, DC.
Chowdhury, A., C. Lawson, E. Kellison, H. S. Chia, H. Kharas, J. Fuller, M. Faye, M. Rutkowski, R. Salvado, and S. Dercon. 2022. "Accelerating digital cash transfers to the world's poorest" Brookings (commentary). February 17, 2022. https:/ I www.brookings.edu/articles/accelerating-digital-cashtransfers-to-the-worlds-poorest/.
Chrimes, T., M.A. Kose, and K. Stamm. Forthcoming. The Global jobs Challenge Washington, DC: World Bank.
Chuku, C., P. Sama!, J. Saito, D. Hakura, M. Chamon, M. Cerisola, G. Chabert, and J. Zettelmeyer. 2023. "Are We Heading for Another Debt Crisis in Low- Income Countries? Debt Vulnerabilities: Today vs the pre-HIPC Era." IMF Working Paper 2023/079, International Monetary Fund, Washington, DC.
Cirera, X., and W F. Maloney. 2017. The Innovation Paradox: Developing-Country Capabilities and the Unrealized Promise of Technological Catch-Up. Washington, DC: World Bank.
CBO (Congressional Budget Office). 2025. "Budgetary and Economic Effects of Increases m Tariffs Implemented Between January 6 and May 13, 2025." Nonpartisan Analysis for the U.S. Congress, Washington, DC.
Crowley, M. A., 0. Exton, and L. Han. 2020. "The Looming Threat of Tariff Hikes: Entry into Exporting under Trade Agreement Renegotiation." AEA Papers and Proceedings 110: 547-51.
Cuba-Borda, P., A. Queralto, R. Reyes-Heroles, and M. Scaramucci. 2025. "How Do Trade Disruptions Affect Inflation?" FEDS Notes. Board of Governors of the Federal Reserve System, Washington, DC.
Damania, R., E. Balseca, C. de Fontaubert, J. Gill, K. Kim, J. Rentschler, J. Russ, and E. Zaveri. 2023. Detox Development: Repurposing Environmentally Harmfal Subsidies. Washington, DC: World Bank.
Damania, R., S. Polasky, M. Ruckelshaus, J. Russ, M. Amann, R Chaplin-Kramer, J. Gerber, P. Hawthorne, M. P. Heger, S. Mamun, G. Ruta, R. Schmitt, J. Smith, A. Vogl, F. Wagner, and E Zaveri. 2023 Nature's Frontiers: Achieving Sustainability, Efficiency, and Prosperity with Natural Capital Environment and Sustainable Development Series. Washington, DC: World Bank.
Davis, S. J. 2016. "An Index of Global Economic Policy Uncertainty." NBER Working Paper 22740, National Bureau of Economic Research, Cambridge, MA.
De Mooij, R., R. Fenochietto, S. Hebous, S. Leduc, and C. Osorio-Buitron. 2020. "Tax Policy for Inclusive Growth after the Pandemic." Special Series on COVID-19. December. International Monetary Fund, Washington, DC.
Dell, M., B. F. Jones, B. A. Olken. 2014. "What Do We Learn from the Weather? The New ClimateEconomy Literature." fournal of Economic Literature 52 (3): 740-98.
Dieppe, A. M., S. K. Celik, C. I. F. Okou. 2020. "Implications of Major Adverse Events on Productivity." Policy Research Working Paper WPS9411, World Bank, Washington, DC.
Douch, M , J. Du, and E Vanino 2019 "Defying Gravity? Policy Uncertainty and Trade Diversion." LBGCBP Research Paper 3, Lloyds Banking Group Centre for Business Prosperity, Birmingham
ECB (European Central Bank). 2025. "ECB staff macroeconomic projections for the euro area, March 2025." https://www ecb.europa eu/press/projections/ html/index.en.html.
ECB Working Group on Global Value Chains. 2019. "The impact of global value chains on the euro area economy." Occasional Paper 221, European Central Bank, Frankfurt.
EM-DAT (The International Disaster Database) database Centre for Research on the Epidemiology of Disasters (CRED), UCLouvain, Brussels. Accessed on June 2, 2025. https://emdat be
Eurostat. 2024. "International trade in goods for the EU-An overview." Globalisation patterns in EU trade and investment. https://ec.europa.eu/eurostat/statisticsexplained/index.php?title=lnternational_trade_in_ goods_for_the_EU_-_an_overview.
Evdokimova, T., P. Nagy-Mohacsi, 0. Ponomarenko, E. Ribakova, 2024. "Breaking down success: How emerging market central banks have outperformed the Fed and ECB in the post-Covid inflation surge." VoxEU.org, CEPR Policy Portal, April 24. https:// cepr.org/voxeu/columns/breaking-down-success-howemerging-market-central-banks-have-outperformedfed-and-ecb.
Fatas, A., B. Gootjes, and J. Mawejje 2025. "Dynamic Effects of Fiscal Rules: Do Initial Conditions Matter?" Policy Research Working Paper 11066, World Bank, Washington, DC.
Federal Reserve Board 2025. The Beige Book: Summary of Commentary on Current Economic Conditions by Federal Reserve District. February Washington, DC: Federal Reserve Board.
Federle, J., A Meier, G. Muller, W. Mutschler, and M. Schularick. 2024. "The Price of War." CEPR Discussion Paper 18834, Center for Economic and Policy Research, Washington, DC.
Fernandes, A., N. Rocha, M. Ruta, eds. 2021. The Economics of Deep Trade Agreements. Paris and London: Centre for Economic and Policy Research Press.
Fernandez-Villaverde, J., T. Mineyama, D. Song. 2025. "Are We Fragmented Yet? Measuring Geopolitical Fragmentation and Its Causal Effects." NBER Working Paper 32638, National Bureau of Economic Research, Cambridge, MA
Gillard, E. 2024. "Enhancing the Security of Civilians in Conflict: Notifications, Evacuations, Humanitarian Corridors, Suspensions of Hostilities and Other Humanitarian Arrangements." Research Paper, Royal Institute oflnternational Affairs, London.
Grossman, G. M., E. Helpman, and S. J. Redding. 2024. "When Tariffs Disrupt Global Supply Chains." American Economic Review 114 (4): 988-1029.
Gunnella, V., L. Quaglietti. 2019. "The economic implications of rising protectionism: a euro area and global perspective." ECB Economic Bulletin, Issue 3/2019, European Central Bank, Frankfurt.
Hallegatte, S., J. Rentschler, and J. Rozenberg. 2019. Lifelines: The Resilient Infrastructure Opportunity. Washington, DC: World Bank.
Handley, K., and N. Limao. 2015. "Trade and Investment under Policy Uncertainty: Theory and Firm Evidence." American Economic Review 7 (4): 189-222.
Handley, K., and N. Limao. 2017. "Policy Uncertainty, Trade, and Welfare: Theory and Evidence for China and the United States." American Economic Review 107 (9): 2731-83.
IPCC (Intergovernmental Panel on Climate Change). 2014. Climate Change 2014: Synthesis Report. Contribution of Working Groups I, II and III to the Fifth Assessment Report of the Intergovernmental Panel on Climate Change. Geneva: IPCC.
IPCC (Intergovernmental Panel on Climate Change). 2022. Climate Change 2022: Impacts, Adaptation and Vulnerability. Contribution of Working Group II to the Sixth Assessment Report of the Intergovernmental Panel on Climate Change. Geneva: IPCC.
IMF (International Monetary Fund). 2025. Fiscal Monitor: Fiscal Policy under Uncertainty. April. Washington, DC.
Jafino, B. A., B. J. Walsh, J. Rozenberg, and S. Hallegatte. 2020. "Revised Estimates of the Impact of Climate Change on Extreme Poverty by 2030." Policy Research Working Paper 9417, Wodd Bank, Washington, DC.
Javorcik, B. 2015. "Does FDI Bring Good Jobs to Host Countries?" The World Bank Research Observer 30 (I): 74-94.
Kemper, K. E, and V. Pathak. 2021. "The Business Case for Nature." Voices (blog). May 21, 2021. https:// biogs.worldbank.org/en/voices/business-case-nature.
Kose, M.A., and F. Ohnsorge, eds. 2024. Falling LongTerm Growth Prospects: Trends, Expectations, and Policies. Washington, DC: World Bank.
Kose, M. A, E. S. Prasad, and M. E. Terrones. 2009. "Does Openness to International Financial Flows Raise Productivity Growth?" Journal of International Money and Finance 28 (4): 554-80.
Kose, M. A, N. Sugawara, and M. E. Terrones 2019. "What Happens During Global Recessions?" In A Decade after the Global Recession: Lessons and Challenges for Emerging and Developing Economies, edited by M. A Kose and F. Ohnsorge, 55-114. Washington, DC: World Bank.
Kose, M. A, S. Kurlat, F. Ohnsorge, and N. Sugawara. 2022. "A Cross-Country Database of Fiscal Space." Journal of International Money and Finance 128 (November): 102682.
Kurowski, C., M. Schmidt, D. B. Evans, A. Tandon, P. H.-V. Eozenou, J. S. Cain, and E. S. Pambudi. "Government Health Spending Outlook-Projections Through 2029-Diverging Fiscal Pressures, Uneven Constraints (English)." Double Shock, Double Recovery Paper Series. Washington, D.C.: World Bank Group.
Leclere, 0., M. Obersteiner, M. Barrett et al. 2020. "Bending the Curve of Terrestrial Biodiversity Needs an Integrated Strategy." Nature 585: 551-56.
Lee, W., A Mulabdic, and M. Ruta. 2023. "Thirdcountry Effects of Regional Trade Agreements: A FirmLevel Analysis." Journal of International Economics 140 Qanuary): 103688.
Mahler, D. G., N. Yonzan, and C. Lakner. 2022. "The Impact of COVID-19 on Global Inequality and Poverty." Policy Research Working Paper 10198, World Bank, Washington, DC.
Mattoo, A., A. Mulabdic, and M. Ruta. 2022. "Trade Creation and Trade Diversion in Deep Agreements." Canadian journal ofEconomics 55 (3): 1598-637.
McK.ibbin, W. J., M. Hogan, and M. Noland. 2024. "The International Economic Implications of a Second Trump Presidency." Working Papers 24-20, Peterson Institute for International Economics, Washington, DC.
Mendes, R., S. Murchison, and C. A. Wilkins. 2017. "Monetary Policy Under Uncertainty: Practice Versus Theory." Bank of Canada Staff Discussion Paper 201713, Bank of Canada, Ottawa, Ontario, Canada.
Mueller, H., C. Rauh, B. Seimon, and R. Espinoza. 2024. "The Urgency of Conflict Prevention-A Macroeconomic Perspective." IMF Working Paper 24/256, International Monetary Fund, Washington, DC.
Narain, D., L. J. Somer, A. M. Lechner, J. E. M. Watson, J. S. Simmonds, M. Maron. 2023. "Global Assessment of the Biodiversity Safeguards of Development Banks that Finance Infrastructure." Society for Conservation Biology: 37-4.
OECD (Organisation for Economic Cooperation and Development). 2018. Making Development Cooperation Work for Small Island Developing States. Paris: OECD Publishing.
OECD (Organisation for Economic Cooperation and Development). 2025. "Preliminary Official Development Assistance Levels in 2024; Detailed Summary Note." OECD, Paris.
Ohnsorge, F., M. Stocker, and M. Y. Some. 2016. "Quantifying Uncertainties in Global Growth Forecasts." Policy Research Working Paper 7770, World Bank, Washington, DC.
Powell, J. H. 2025 "Economic Outlook." Speech. Board of Governors of the Federal Reserve System, April 4, 2025. https://www.federalreserve.gov/news events/speech/powell20250404a.htm.
Rauschendorfer, ]., and B. Shepherd. 2022. "Trade, Conflict and Informality: Evidence from the South Sudanese Civil War." The World Economy 45 (3): 86794.
Romelli, D. 2022. 'The political economy of reforms in central bank design: evidence from a new dataset." Economic Poliry 37 (112): 641-88.
Romelli, D. 2024. "Trends in central bank independence: a de-jure perspective." BAFFI CAREFIN
Centre Research Paper 217, Bocconi University, Milan, Italy.
Seymour, F., M. Wolosin, and E. Gray. 2022. Not just Carbon: Capturing Alf the Benefits of Forests for Stabilizing the Climate from Local to Global Scales. Washington, DC: World Resources Institute.
The Budget Lab. 2025. "State of U.S. Tariffs: May 12, 2025." The Budget Lab at Yale, New Haven.
UNHCR (United Nations High Commissioner for Refugees). Refugee Population Statistics Database. Accessed on May 13, 2025. https://unhcr.org/ refugeestatistics/download/?url=IAr67y.
UN (United Nations). 2024. 2024 Revision of World Population Prospects (database). New York: UN.
United Nations and World Bank. 2018. Pathways for Peace: Inclusive Approaches to Preventing Violent Conflict. World Bank, Washington, DC.
World Bank. 2020. World Development Report 2020: Trading for Development in the Age of Global Value Chains. Washington, DC: World Bank.
World Bank. 2021. Unlocking Nature-Smart Development: An Approach Paper on Biodiversity and Ecosystem Services. Washington, DC: World Bank.
World Bank. 2024a. World Development Report 2024: The Middle-Income Trap. Washington, DC: World Bank.
World Bank. 20246. Women, jobs, and Growth. South Asia Development Update. October. World Bank, Washington, DC.
World Bank. 2025a. Global Economic Prospects. January. Washington, DC: World Bank.
World Bank. 20256. Taxing Times. South Asia Development Update. April 2025. World Bank, Washington, DC.
WEF (World Economic Forum). 2020. "Nature Risk Rising: Why the Crisis Engulfing Nature Matters for Business and the Economy." World Economic Forum, Cologny, Switzerland.
Wu, H., A. Atamanov, T. Bundervoet, and P. Paci. 2024. "The Growth Elasticity of Poverty-ls Africa Any Different?" Policy Research Working Paper 10690, World Bank, Washington, DC.
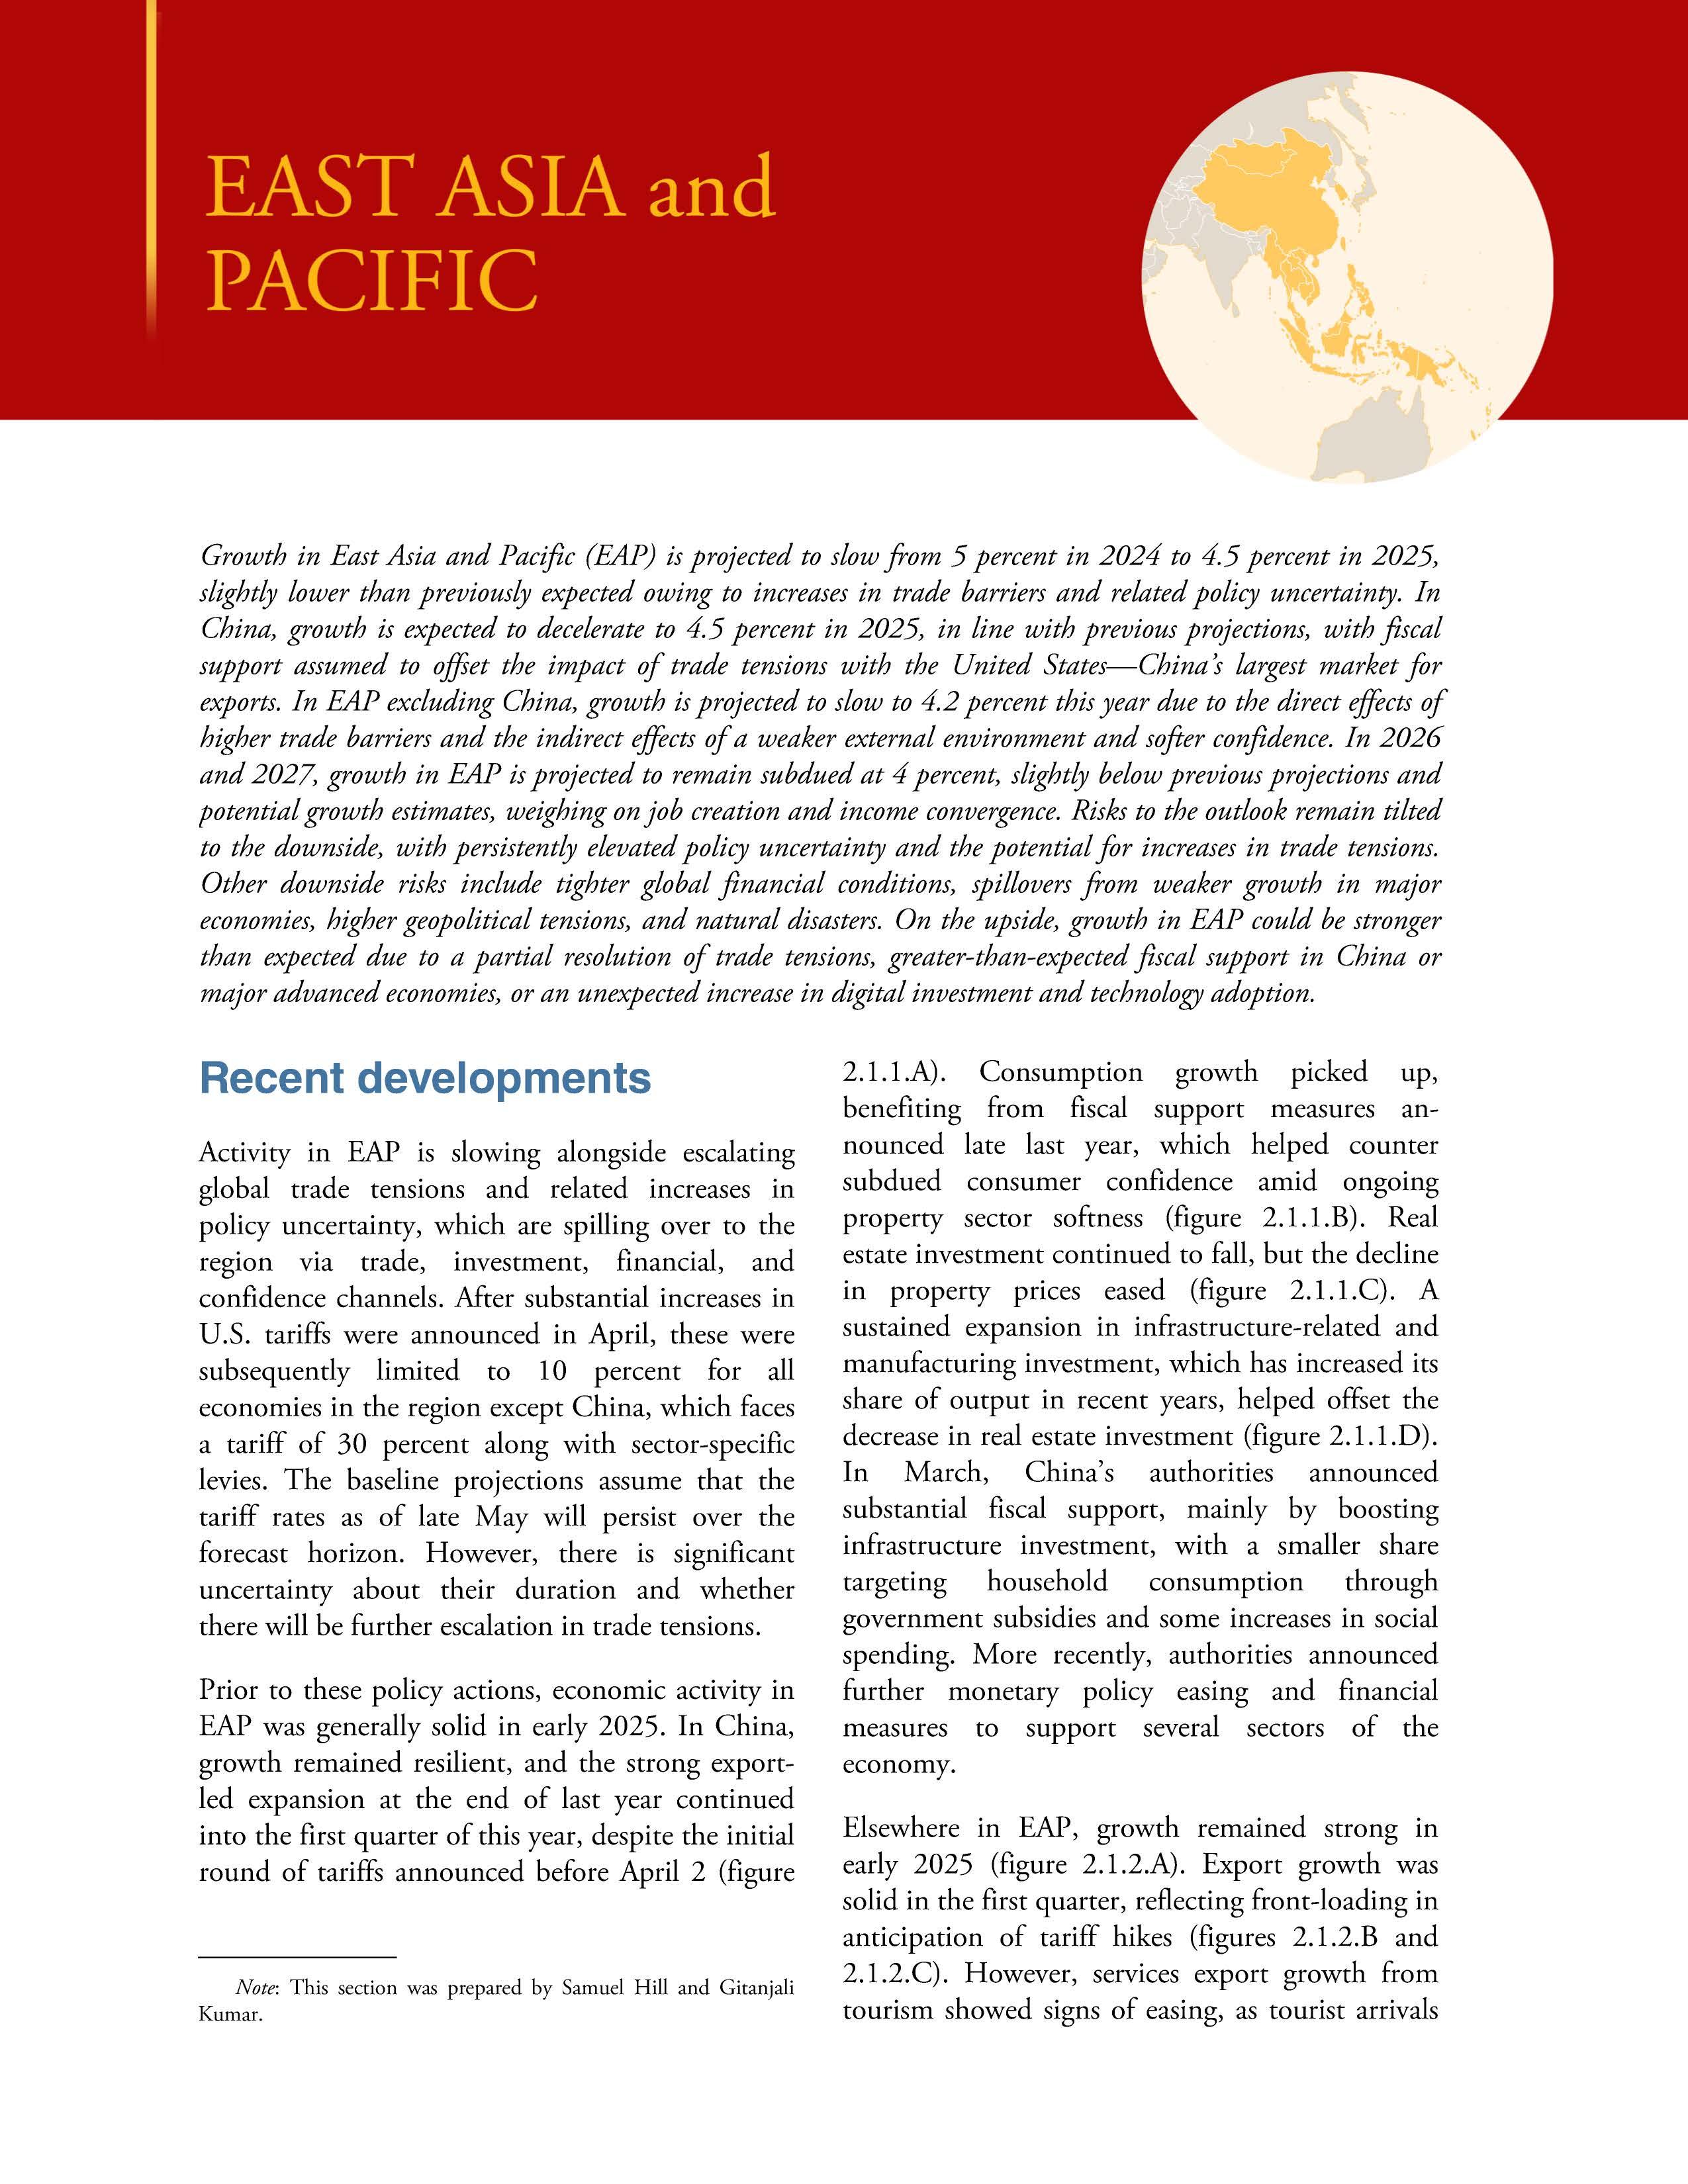
Growth in East Asia and Pacific (EAP) is projected to slow from 5 percent in 2024 to 4.5 percent in 2025, slightly lower than previously expected owing to increases in trade barriers and related policy uncertainty. In China, growth is expected to decelerate to 4.5 percent in 2025, in line with previous projections, with fiscal support assumed to offset the impact of trade tensions with the United States-Chinas largest market for exports. In EAP excluding China, growth is projected to slow to 4.2 percent this year due to the direct effects of higher trade barriers and the indirect effects of a weaker external environment and softer confidence. In 2026 and 2027, growth in EAP is projected to remain subdued at 4 percent, slightly below previous projections and potential growth estimates, weighing on job creation and income convergence. Risks to the outlook remain tilted to the downside, with persistently elevated policy uncertainty and the potential for increases in trade tensions. Other downside risks include tighter global financial conditions, spillovers from weaker growth in major economies, higher geopolitical tensions, and natural disasters. On the upside, growth in EAP could be stronger than expected due to a partial resolution of trade tensions, greater-than-expected fiscal support in China or major advanced economies, or an unexpected increase in digital investment and technology adoption.
Activity in EAP is slowing alongside escalating global trade tensions and related increases in policy uncertainty, which are spilling over to the region via trade, investment, financial, and confidence channels. After substantial increases in U.S. tariffs were announced in April, these were subsequently limited to 10 percent for all economies in the region except China, which faces a tariff of 30 percent along with sector-specific levies. The baseline projections assume that the tariff rates as of late May will persist over the forecast horizon However, there is significant uncertainty about their duration and whether there will be further escalation in trade tensions.
Prior to these policy actions, economic activity in EAP was generally solid in early 2025. In China, growth remained resilient, and the strong exportled expansion at the end of last year continued into the first quarter of this year, despite the initial round of tariffs announced before April 2 (figure
Note: This section was prepared by Samuel Hill and Gitanjali Kumar.
2.1 .1.A). Consumption growth picked up, benefiting from fiscal support measures announced late last year, which helped counter subdued consumer confidence amid ongoing property sector softness (figure 2.1.1.B). Real estate investment continued to fall, but the decline in property prices eased (figure 2.1. LC). A sustained expansion in infrastructure-related and manufacturing investment, which has increased its share of output in recent years, helped offset the decrease in real estate investment (figure 2.1.1.D).
In March, China's authorities announced substantial fiscal support, mainly by boosting infrastructure investment, with a smaller share targeting household consumption through government subsidies and some increases in social spending. More recently, authorities announced further monetary policy easing and financial measures to support several sectors of the economy.
Elsewhere in EAP, growth remained strong in early 2025 (figure 2.1.2.A). Export growth was solid in the first quarter, reflecting front-loading in anticipation of tariff hikes (figures 2.1 2.B and 2.1.2.C). However, services export growth from tourism showed signs of easing, as tourist arrivals
Growth in China remained resilient in early 2025 as the export-led expansion in late 2024 continued in anticipation of higher tariffs Consumer confidence has been subdued despite some pickup in consumption growth on the back of fiscal support. While the decline in property prices eased, real estate investment declined further. Nonetheless, continued expansion of manufacturing and infrastructure investment has supported activity
official target ranges. In China, both consumer and producer price inflation have been particularly low, reflecting soft prices for global commodities, notably energy and metals; relatively insufficient domestic demand; and competition among firms for market share
Across the region, financial conditions tightened after the U.S. announcement of higher tariffs in April. Equity prices declined sharply, and currencies depreciated against the U.S. dollar amid capital outflows (figure 2.1.2.D). Indonesia's currency, already under pressure due to domestic policy uncertainty, fell to its lowest recorded value in early April. Most asset prices largely recovered in the weeks following the initial postponement in tariff increases and the partial rollback of tariffs by the United States and China In a context of low inflation and concerns about growth alongside mounting global policy uncertainty, central banks have cut interest rates further in major EAP economies, including in China, Indonesia, the Philippines, and Thailand.
Sources : Haver Analytics; World Bank.
A Year-on-year real GDP growth and expenditure contributions Last observation is 2025Q1 B Consumerconfidence on a scale of 0 to 200, where 200 indicates extreme optimism 0 indicates extreme pessimism,and 100 indicates neutrality Last observation is March 2025
GDP. Last observation is 202501
in key markets reached or rose above prepandemic levels (World Bank 2025a). Manufacturing activity softened, with purchasing managers' indexes declining in some of the region's largest economies. Private consumption remained steady across the region, aided by accommodative monetary policy. However, activity in Myanmar was severely disrupted by a powerful 7.7magnitude earthquake m late March, with Thailand also affected.
Consumer price inflation in most EAP economies has remained low so far in 2025, reflecting a combination of easing commodity prices, moderate demand pressures, and, in some cases, price controls. In recent months, both headline and core inflation have been below or within
Growth in EAP is projected to decelerate to 4 5 percent this year from 5 percent in 2024, as the direct effects of higher trade barriers and the indirect effects of heightened policy uncertainty, a weaker global growth outlook, and softer confidence weigh on investment, exports, and consumption in the region (figure 2.1.3.A; table 2.1.1). Due to their high trade openness, EAP economies are more exposed to trade policy shifts. Growth is expected to remain roughly steady at 4 percent in 2026 and 2027, still below estimates of its potential pace (figure 2.1.3.B). Compared with January projections, growth in EAP is expected to be 0.1 percentage point lower in both 2025 and 2026. The downgrade reflects the impact of higher tariffs on growth, which is expected to be partly offset by policy support measures in EAP economies, notably China. In many regional economies, the deterioration in the outlook will weigh on the pace of job creation and per capita income catch-up with advanced economies, which over 2021-27 is set to roughly halve relative to the 2010-19 average (box 1.1).
In China, growth is projected to slow to 4.5 percent this year. This is in line with the January
forecast, reflecting the impacts of higher U.S. tariffs and slower growth in major advanced economies, which are assumed to be offset by the announced fiscal policy support measures. A soft labor market and a subdued property sector are expected to weigh on consumption, countered somewhat by fiscal stimulus. Export growth is expected to slow in 2025 as the impact of higher tariffs is felt and the earlier boost from the frontloading of exports fades. Although China has increased its goods exports to other economies in recent years, the United States remains its largest destination market. Growth is projected to remain unchanged at 4 percent in 2026 and edge down to 3.9 percent in 2027, in line with decelerating potential output growth, reflecting the effects of slowing productivity growth, an aging population, and high debt levels.
In EAP excluding China, growth is expected to slow to 4.2 percent in 2025, mainly due to trade tensions. The increase in trade policy uncertainty, reduced confidence, and spillovers from softer external demand in major advanced economies and China are likely to curtail exports and private investment in the region, since there are several economies with large exposures to global trade, notably Cambodia, Thailand, and Viet Nam (World Bank 20256). While some economies will benefit from fiscal policy support-such as social spending programs and public investment in Indonesia, Malaysia, Thailand, and Viet Namthe full macroeconomic effects of higher trade barriers, which are hard to predict, could weigh on growth. Growth in the Pacific Island economies is projected to decline over the forecast horizon, largely driven by weaker global demand as a result of elevated trade tensions, as well as a normalization of mining activity in Papua New Guinea and fiscal tightening in Fiji (table 2.1.2).
Across EAP, fiscal policy is expected to support growth in China and Thailand in 2025 but to be broadly neutral elsewhere (figure 2.1.3.C). In China, the announcement of additional spending measures in March implies an increase in the consolidated fiscal deficit to 8.1 percent of GDP in 2025 from 6.5 percent of GDP in 2024. 1 In
In East Asia and Pacific excluding China, growth was strong in early 2025. The United States announced and subsequently paused substantial increases in tariffs, with all economies in the region except China facing an across-the-board 10 percent tariff rate. Export growth remained solid as front-loading ahead of the implementation of higher tariffs continued. Economies experienced sharp currency depreciations in the aftermath of U.S. tariff increases announced in early April, with most currencies recovering after the initial pause and subsequent de-escalation in trade tensions.
1 The consolidated budget includes (i) the Public Finance Budget which includes tax and non-tax revenues, current expenditures, and a
Sources: Haver Analytics; White House; World Bank.
Note: CHN = China; EAP = East Asia and Pacific; FJI = Fiji; FSM = the Federated States of Micronesia; ION = Indonesia; KHM = Cambodia;KIR = Kiribati; LAO = Lao PDR; MHL = Marshall Islands; MMR = Myanmar; MNG = Mongolia; MYS = Malaysia; NRU = Nauru; PHL = the Philippines; PLW = Palau; PNG = Papua New Guinea;SLB = Solomon Islands; THA = Thailand; TLS = Timor-Leste; TON = Tonga; TUV = Tuvalu; VNM = Viet Nam; VUT = Vanuatu; WSM = Samoa.
A. Year-on-year real GDP growth. Lastobservation is 202501
B. Bars denote tariffs on imports from trading partners announced bythe United States on April 2, 2025,and subsequently paused. Line denotes tariffs as of late May. The 20 percent tariff on Chinese imports announced priorto April 2 remains in place.
C. Value of goods exports in U.S. dollars. Three-month moving average ofyear-on-year change. Last observation is April 2025 for China,Malaysia, the Philippines,Thailand,and Viet Nam;March 2025 for Indonesia.
D. Lines denote indexed daily exchange rates of selected currencies against the U.S. dollar. Last observation is May 26,2025.
Thailand, the Digital Wallet program-a one-time transfer to 45 million Thai citizens-is expected to provide near-term support to activity (World Bank
portion of capital expenditures; (ii) the Government Fund Budget which reflects mainly local land-lease revenues and expenditures for infrastructure and social projects; (iii) the Social Security Fund Budget; and (iv) the state-owned asset operation budget. The consolidated budget balance refers to the sum of (i), (ii), (iii), and (iv) minus net withdrawals from the stabilization fund.
Growth in East Asia and Pacific is projected to slow to 4 5 percent this year, reflecting the impact of trade tensions and policy support in the region , with a further decline to 4 percent in 2026 and 2027 amid slowing potential growth in China. In the Pacific Island economies, growth is expected to ease owing to weaker global demand. This year, fiscal policy is expected to bolster growth in China and Thailand but exert a more neutral influence in other major EAP economies. EAP central banks are expected to remain accommodative to support growth and cushion the impact of higher trade barriers.
A Contributions to growth
B Growth projections in East Asia and Pacific Island economies excluding China
consumer inflation expected to remain below this year's downwardly adjusted target of 2 percent. As a result, monetary policy in the region is expected to remain accommodative to support growth and cushion the impact of higher trade barriers (figure 2.1.3.D).
C. Primary fiscal balance
D. Expected changes in one-yearahead interest rates and inflation
Downside risks to the baseline projections for EAP dominate and have intensified since January, including the possibility of a reversion to previously announced higher trade barriers and persistently elevated policy uncertainty. Additional shifts in trade policy would likely have large impacts on economies across the region, owing to their high trade openness and links to global production networks. Other downside risks include tighter global financial conditions, substantially weaker growth in major economies, increased geopolitical stress, and natural disasters. There are, however, some upside risks associated with a partial resolution of trade tensions, larger-than-expected fiscal expansions in major economies, and productivity gains from technological adoption.
Sources : Consensus Economics; Haver Analytics; Macro Poverty Outlook (database); World Bank
Note: e = estimate; f = forecast. CHN = China; EAP = East Asia and Pacific; Gov.= government; IDN = Indonesia;MYS = Malaysia; PHL = the Philippines;THA = Thailand
A Annual real GDP growth and contributions of expenditure components Projections for 2025, 2026, and 2027 are by the World Bank. Discrepancies between GDP growth and the sum of its components reflect inventories and residuals.
B Annual real GDP growth Projections for 2025, 2026, and 2027 are by the World Bank Aggregate growth rates are calculated using average 2010-19 GDP weights and market exchange rates
C. Lines denote the primary fiscal balance. Projections for 2025 and 2026 are obtained from the Macro Poverty Outlook (database).
D. Change in interest rate (or inflation) is the difference between the current nominal interest rate (or inflation rate) and its expectation in 2026 based on data from Consensus Economics. Last observation is May 2025
2025c). Modest fiscal consolidation is expected to continue in Malaysia and the Philippines.
With global commodity prices expected to decline this year and demand pressures remaining limited, inflation is likely to remain contained across the region. In China, relatively insufficient domestic demand and declining global commodity prices are expected to maintain downward pressure on consumer and producer prices, with headline
Persistently elevated global policy uncertainty could have a range of adverse effects on EAP growth It could lead firms, particularly those focused on exporting goods, to further delay capital spending, resulting in weaker-thananticipated investment and output growth. These factors could compound other risks in China, where prolonged softness in the property sector could weigh on activity. Compared with other regions, EAP economies are especially vulnerable to the effects of heightened uncertainty because of their relatively larger exposure to trade and, therefore, higher shares of investment in GDP (figure 2 1.4.A)
A reemergence of trade tensions and higher trade costs, as well as negative demand spillovers from weaker growth in major economies, present a significant downside risk to regional growth. Economies with large export-oriented manufacturing sectors, including China, Malaysia, Thailand, and Viet Nam, are particularly exposed (figure 2.1.4.B). In addition, potential diversion of Chinese goods to markets other than the United
States could lead other economies to impose barriers on imports from China. Indeed, such responses have been seen in recent months, with duties imposed by Malaysia and Viet Nam on steel products, following measures by other economies including Brazil, India, and the Republic of Korea.
Tighter financial conditions globally and weakening risk appetite for EMDE assets could lead to capital outflows and currency depreciations. The resulting increases in inflation and shifting interest rate differentials could reduce the scope for EAP central banks to cut policy rates to support domestic activity and cushion the impact of heightened trade tensions and policy uncertainty. Higher borrowing costs, in turn, would raise debtservicing burdens, particularly in economies with elevated debt levels, adversely affecting their fiscal positions (figure 2.1 .4.C).
EAP economies, most of which are energy importers, are particularly vulnerable to an escalation of geopolitical tensions. Intensified conflict could disrupt global energy supplies and raise energy prices, negatively impacting economies in the region. Within EAP, persistent armed conflict could further depress activity in Myanmar, including by causing inflation to spike, business sentiment to weaken, and the displacement of populations.
Across EAP, more frequent climate-related natural disasters pose considerable downside risks, especially destructive tropical storms, whose incidence has increased in recent years, costing many lives and causing substantial economic losses (figure 2.1.4.D). For instance, extreme cold weather in Mongolia caused around 12 5 percent of the country's livestock to perish by the middle of 2024 (World Bank 2024a). Vulnerability to natural disasters also poses downside risks, as underscored by the substantial damage caused by powerful earthquakes in Myanmar and Thailand in late March, and Vanuatu late last year.
On the upside, a partial resolution of trade tensions and reduction in trade policy uncertainty would likely lift growth prospects in the region above the baseline. More expansionary fiscal policy in China or in major advanced economies could
EAP is especially vulnerable to the impacts of heightened trade policy uncertainty given its openness and larger shares of investment in GDP in many regional economies Economies with large export-oriented manufacturing sectors are at particular risk if there is a reemergence of trade tensions and higher trade barriers . Higher borrowing costs could put financial pressure and dampen investment in many economies in the region, especially in those that have elevated debt levels Climate-related and other natural disasters, notably storms and earthquakes, pose an important downside risk, especially in the region 's numerous small states
Sources: EM-DAT (database); Haver Analytics; International Monetary Fund; World Bank. Note: CHN = China; EMDEs = emerging market and developing economies; FJI = Fiji; FSM = the Federated States of Micronesia; IDN = Indonesia; KHM = Cambodia;LAO = Lao PDR; MMR = Myanmar; MNG = Mongolia; MYS = Malaysia; PHL = the Philippines; PLW = Palau; PNG = Papua New Guinea; SLB = Solomon Islands; THA = Thailand;TLS = Timor-Leste; TON = Tonga; VNM = Viet Nam; VUT = Vanuatu;WSM = Samoa.
A. Gross fixed capital formation as a percent of GDP. Line is the median of 108 EMDEs.
B. Line is the median of 102 EMDEs.
C. General government gross debt as a percent of GDP. Bars refer to the share in 2024. Diamonds show 2010-19 averages.
D. Frequency is calculated based on the annual numberof natural disasters per 1million square kilometers of land area. Natural disasters include droughts, earthquakes, extreme temperatures, floods, storms,volcanic activities,and wildfires. Last observation is end-2024.
support faster-than-expected activity. In addition, surging digital investment and technological adoption could boost productivity growth, since major economies in the region rank high in terms of readiness for AI adoption, which could underpin stronger-than-expected regional growth (Cazzaniga et al. 2024; World Bank 20246).
Gains from higher technology-led investment in advanced economies could also spill over to the EAP region.
(Real GDP growth at market prices in percent, unless indicated otherwise)
EMDE EAP, GDP 1
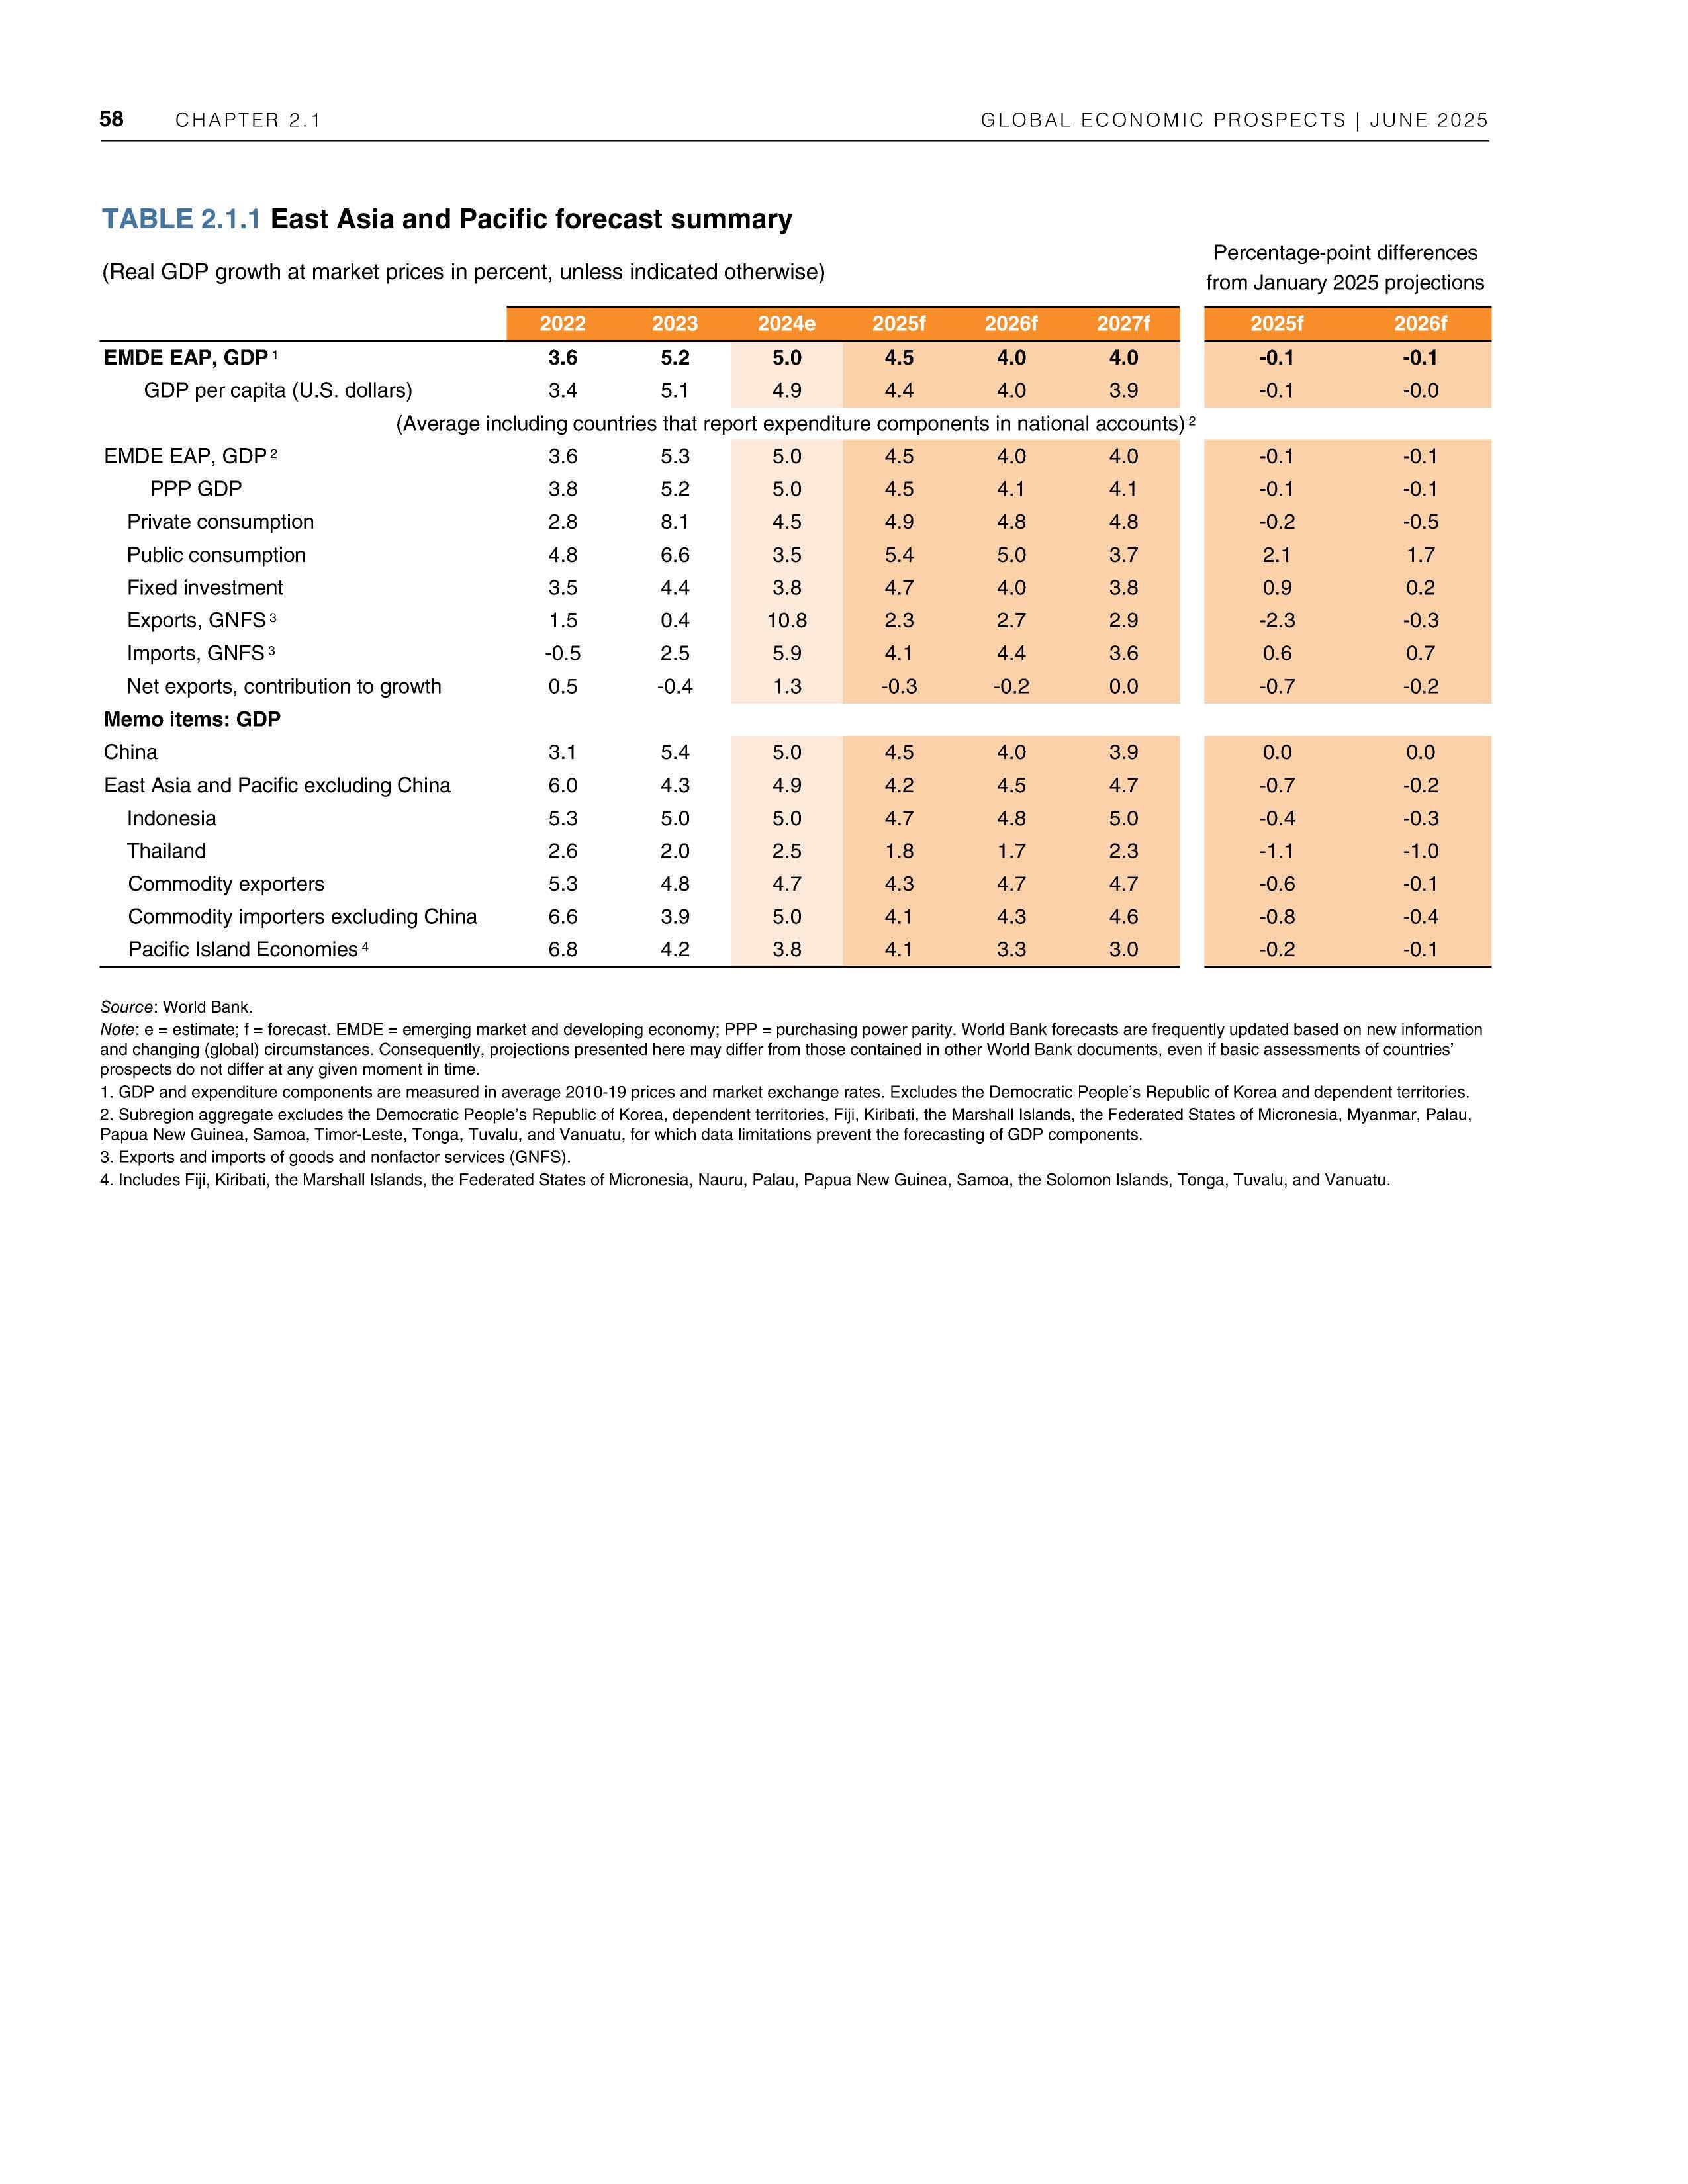
(Average including countries that report expenditure components in national accounts)2
EMDE EAP, GDP2
PPP GDP
Private consumption
Public consumption
Fixed investment
Exports, GNFS3
Imports, GNFS3
Net exports, contribution to growth
Memo items: GDP
China
East Asia and Pacific excluding China
Indonesia
Thailand
Commodity exporters
Commodity importers excluding China
Pacific Island Economies4
Source: World Bank
Note: e = estimate; f = forecast. EMDE = emerging market and developing economy; PPP= purchasing powerparity. World Bank forecasts are frequently updated based on new information and changing (global) circumstances Consequently, projections presented here may differfrom those contained in otherWorld Bank documents, even if basic assessments ofcountries' prospects do not differat any given moment in time
1. GDP and expenditure components are measured in average 2010-19 prices and market exchange rates Excludes the Democratic People's Republic of Korea and dependent territories.
2. Subregion aggregate excludes the Democratic People's Republic of Korea dependent territories, Fiji Kiribati, the Marshall Islands, the Federated States of Micronesia Myanmar Palau Papua New Guinea Samoa, Timor-Leste Tonga, Tuvalu and Vanuatu for which data limitations prevent the forecasting of GDP components.
3. Exports and imports of goods and nonfactor services (GNFS).
4. Includes Fiji, Kiribati, the Marshall Islands,the Federated States of Micronesia, Nauru, Palau, Papua New Guinea, Samoa, the Solomon Islands,Tonga,Tuvalu,and Vanuatu
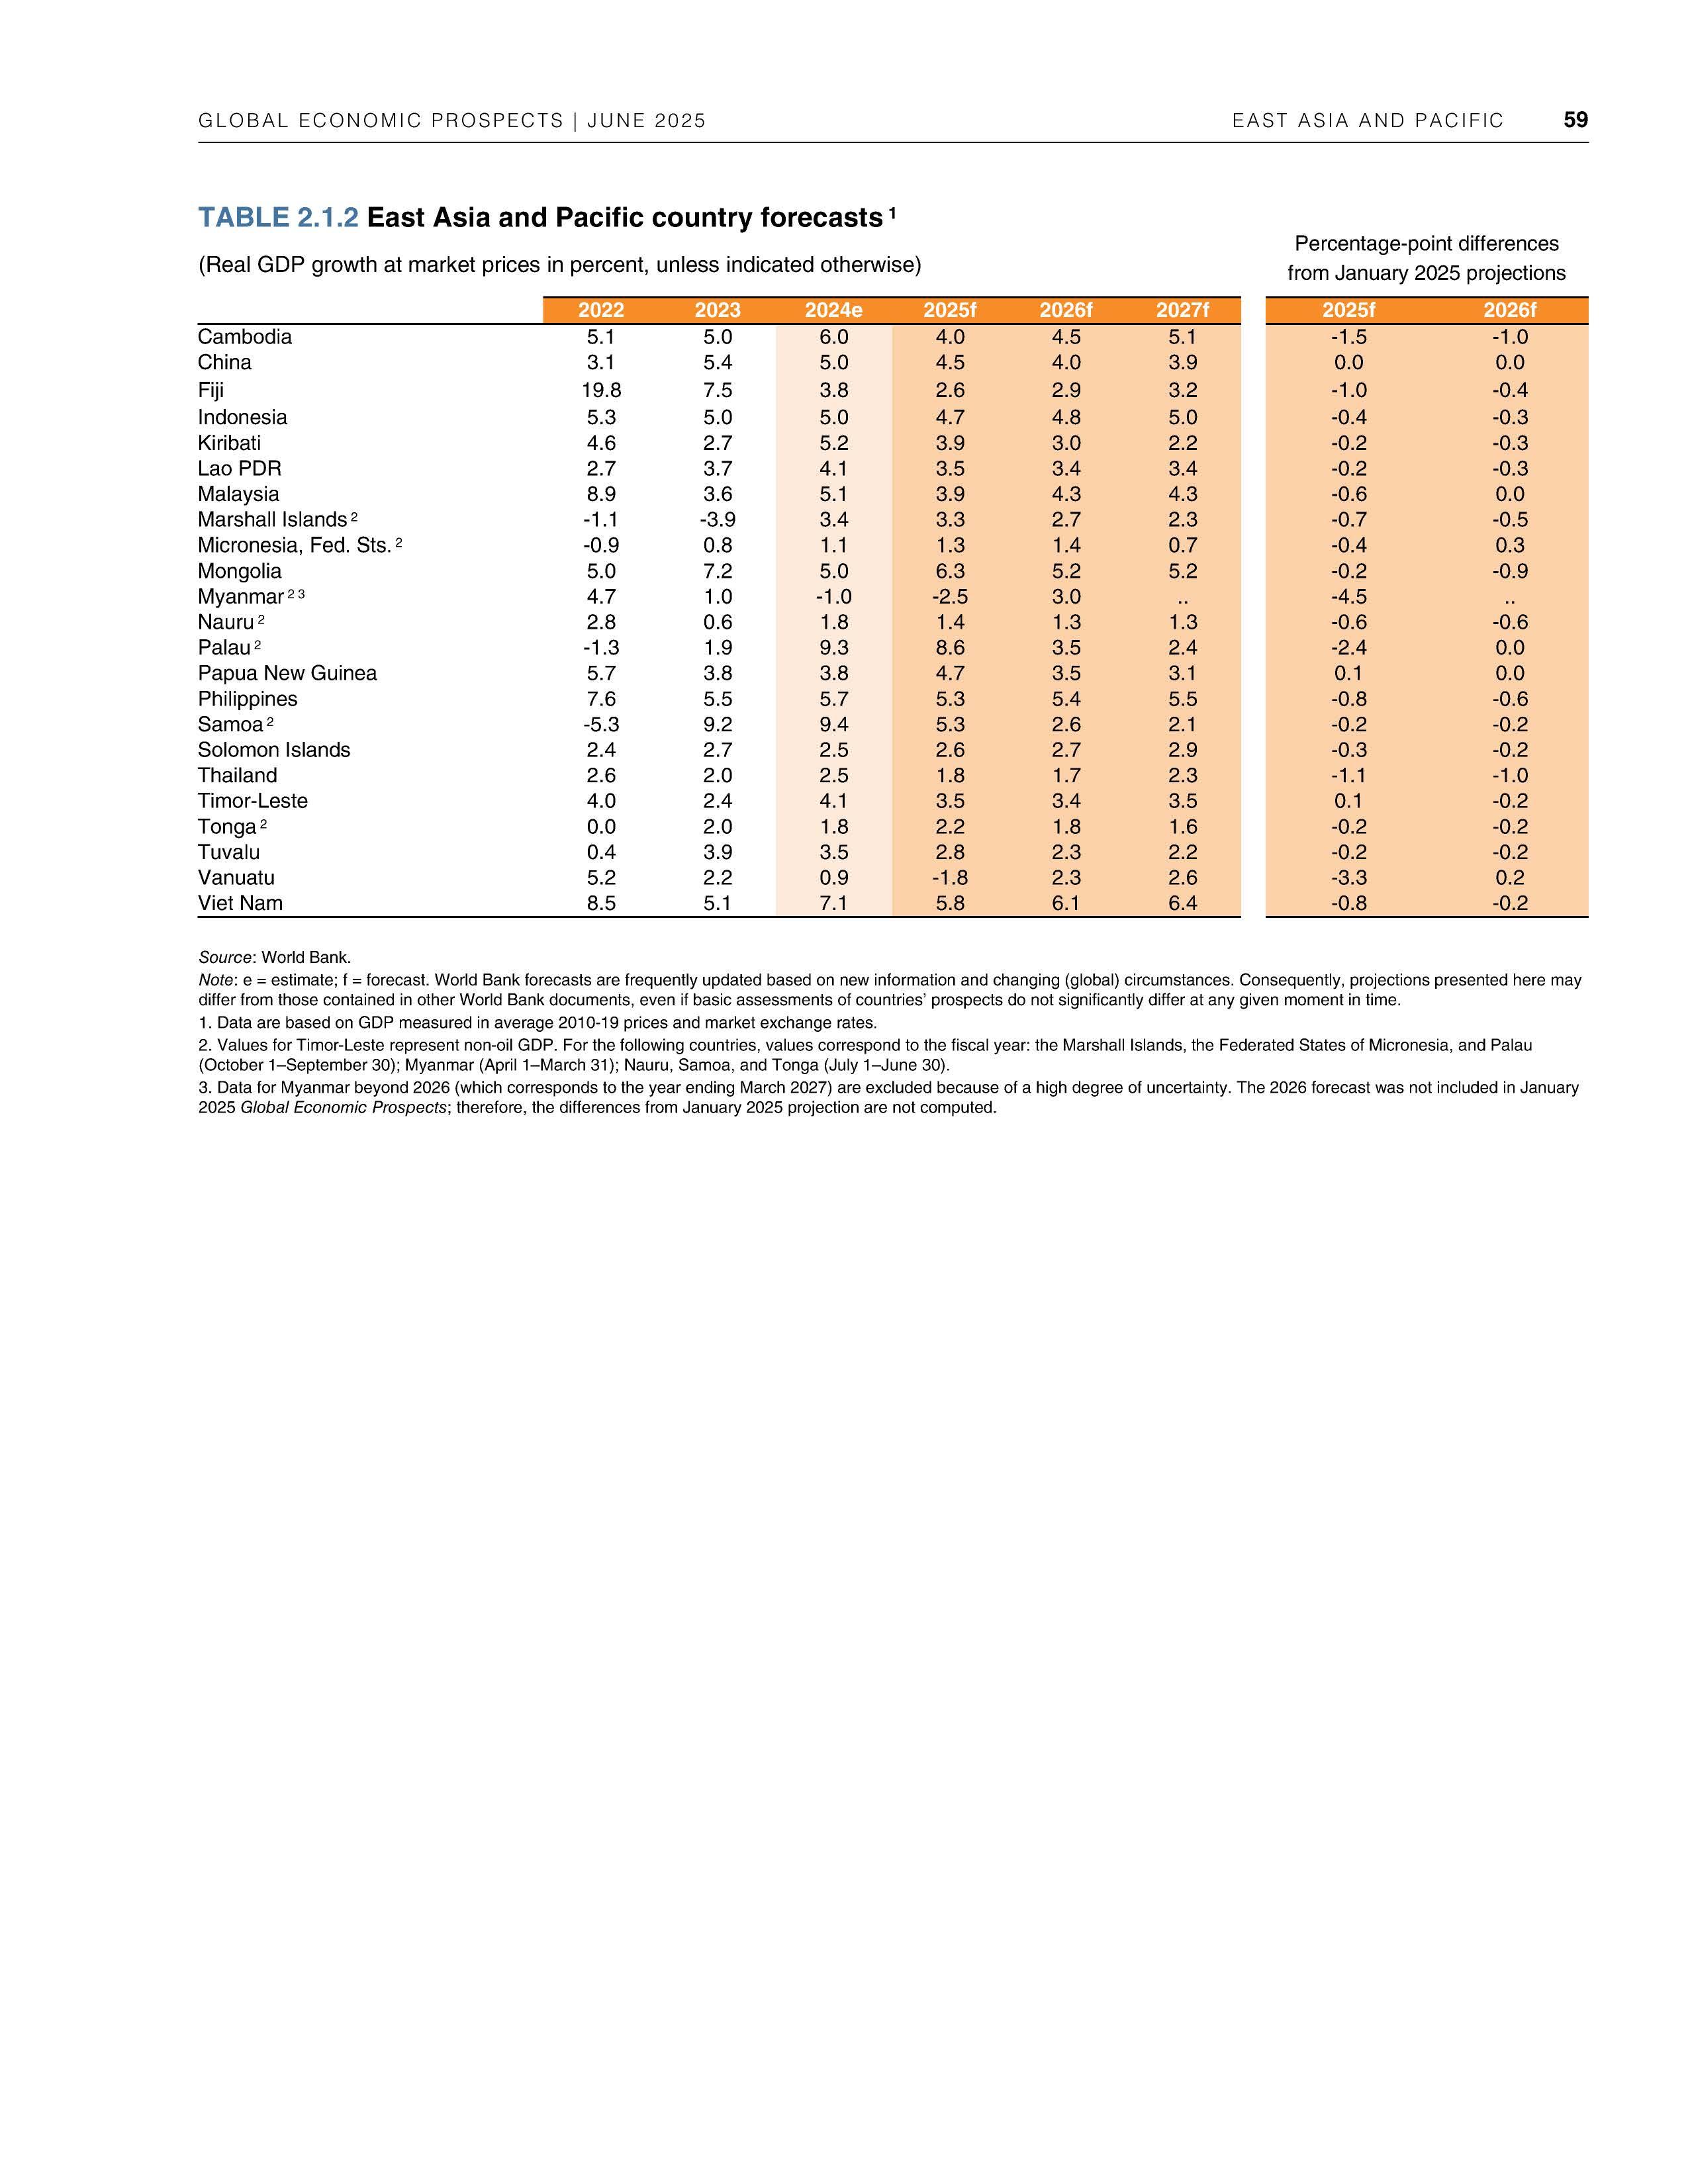
Note: e = estimate; f = forecast. World Bank forecasts are frequently updated based on new information and changing (global) circumstances Consequently projections presented here may differ from those contained in other World Bank documents eve n if basic assessments ofcountries' prospects do not significantly differ atany given moment in time
1. Data are based on GDP measured in average 2010-19 prices and market exchange rates
2. Values for Timor-Leste represent non-oil GDP. For the following countries, values correspond to the fiscal year:the Marshall Islands the Federated States of Micronesia and Palau (October 1-September30);Myanmar (April 1-March 31); Nauru, Samoa,andTonga (July 1-June 30)
3. Data for Myanmarbeyond 2026 (which corresponds to the yearending March 2027) are excluded because of a high degree of uncertainty The2026 forecast was not included in January 2025 Glob al Ec onomic Prospe cts; therefore, the differences from January 2025 projection are not computed
Growth in Europe and Central Asia (ECA) is projected to slow to 2.4 percent in 2025. Although growth is expected to edge up to 2.6 percent in 2026-27, it will remain below its 2010-19 average, limiting progress in job creation and income convergence. A challenging external environment-marked by rising trade restrictions and heightened policy uncertainty-is expected to weigh on ECA activity this year, given the regions strong linkages to the global economy via trade, commodities, investment, financial, and confidence channels. The substantial deceleration in regional growth in 2025 reflects a stepdown in activity in the Russian Federation due to monetary tightening, while the slowdown is set to be more modest in many other ECA economies. Downside risks to the outlook include a prolonged extension or intensification ofRussia s invasion of Ukraine, a further escalation of global trade tensions and policy uncertainty-which could particularly harm economies dependent on manufacturing and commodity exports-weaker-than-expected euro area growth, and more persistent inflation. On the upside, growth could be boosted by an earlier-than-expected end ofactive hostilities associated with the invasion, or by faster and broader adoption of artificial intelligence (AI) technologies, particularly in economies with adequate digital infrastructure and human capital.
Growth in Europe and Central Asia (ECA) is estimated to have stabilized at 3.6 percent in 2024, with softening private consumption and investment balanced by a modest rebound in exports after two years of substantial weakness in trade. Excluding Russia, Tiirkiye, and Ukraine, growth in the region rose to an estimated 3.1 percent, led by a recovery in Poland on the back of strong private consumption supported by rising wages. Most high-frequency economic indicators pointed to a slowdown in early 2025 in the largest economies, particularly in new export orders owing to the anticipated impacts of rising trade barriers (figure 2.1.1.A). The announcement of higher U.S. tariffs in early April-building on previous measures-triggered a marked tightening of financial conditions in EMDEs, including ECA, where equity markets fell and sovereign spreads widened (figure 2.1.1.B). Conditions improved after these tariff increases were paused.
Activity in the region continued to face external headwinds, with weak growth in key trading
N ote: This section was prepared by Marie Albert.
partners, particularly the euro area, restrammg exports in Central Europe and the Western Balkans. Tourism and remittances remained notable growth drivers, although their contribution to activity was more moderate than in previous years. Tourist arrivals in early 2025 exceeded pre-pandemic levels by 18 percent, while remittance inflows through end-2024 held steady at around 11 percent above pre-invasion levels (figure 2.1. l.C).
In Russia, growth rose to 4.3 percent in 2024, supported by solid growth in manufacturing act1v1ty, particularly in military-related and import-substituting industries. However, the sharp year-on-year slowdown in the first-quarter suggests a weakening in economic activity. Despite policy rate hikes, to a record high of 21 percent in October 2024, headline inflation exceeded 10 percent in early 2025 amid elevated fiscal spending and labor shortages. In addition, the corporate profit tax rate was raised from 20 to 25 percent in January, weighing on domestic demand. Oil output is estimated to have declined slightly to 9.1 mb/d in early 2025, down 0.2 mb/d from 2024 (IEA 2025).
Leading activity indicators in the three largest EGA economies-the Russian Federation, Tilrkiye , and Poland-point to a slowdown in activity in early 2025. The early-April announcement of U.S. tariffs was accompanied by tighter financial conditions, equity price declines, and wider sovereign spreads, though these trends have improved following some de-escalation in trade tensions. As of the end of 2024, remittance inflows and tourist arrivals continued to exceed pre-pandemic levels, although their pace has moderated. Inflation remains elevated across most subregions.
policy has remained tight, since December 2024 the central bank has cut its policy rate from 50 to 42.5 percent by March 2025, as inflation had nearly halved over the year. However, the policy rate was raised in April due to domestic and global market volatility, signaling a commitment to price stability
Growth in Ukraine slowed co 2.9 percent in 2024, as the output gap narrowed and energy shortages caused by Russian attacks on infrastructure continued to disrupt activity. Services activity remained resilient, supported by strong consumption Inflation jumped to 15 1 percent year-onyear in April, largely driven by rising wages and energy tariffs, currency depreciation, and a weaker harvest Since November, the central bank has raised interest rates three times, from 13 percent to 15 5 percent Discussions of a potential ceasefire began earlier in the year, but prospects of a lasting resolution remain uncertain
Sources: Bloomberg; Goldman Sachs; Haver Analytics; World Bank
Note : CA = Central Asia; CE = Central Europe; ECA = Europe and Central Asia; EE = Eastern Europe; FCI = Financial Conditions Index; pp = percentage point; RUS = Russian Federation; SCC = South Caucasus;TUR = T0rkiye; UKR = Ukraine; WBK = Western Balkans
A GDP, retail sales, and industrial production are GDP-weighted averages of year-on-year growth rates for Poland, the Russian Federation, and T0rkiye. PMI indices are GDP-weighted indices Last observation is 202501
B Bars denote the change in the stock index and FCI and the change for the EMBI spread in percentage points between April 1and April 9 2025 Diamonds show the changes between January 1 2025 and May 30 2025. The EMBI average spread for ECA excluding Ukraine includes 8 economies ECA average of national benchmark stock indexes includes 16countries. FCI is computed by Goldman Sachs for EMDEs, and larger positive changes indicate tighter financial conditions. Last observation is May 30, 2025
C. Blue line shows the four-quarter moving average of remittance inflows. Remittance inflows are the sum of personal transfers and compensation of employees Red line represents the 12-month moving average of tourist arrivals Sample includes 22 ECA economies in remittance inflows data and 13 economies in tourist arrivals Last observation is 202404 for remittances and 202501 for tourist arrivals.
D. Bars represent average year-on-year inflation in April 2025. Diamonds and dashes show the average year-on-year inflation in 2024 and 2023,respectively.
Median regional headline inflation rose for about six months following September 2024, reflecting faster growth of food prices, an increase in regulated prices, and robust wage growthparticularly in Central Asia, where recent wage growth has exceeded pre-pandemic rates (EBRO 2025; IMF 2025). Since March 2025, inflation has moderated somewhat but remained above 4 percent in most ECA subregions (figure 2 1.1.D). Combined with the ECA median real interest rate remining below 2 percent since early 2025-lower than in the previous year-most central banks have paused further policy easing, given the limited room for additional cuts.
Tiirkiye's growth softened slightly in 2024 to 3.2 percent, primarily reflecting earlier policy interest rate hikes, and decelerated further early 2025. Financial market volatility intensified in midMarch 2025 owing to domestic uncertainties before stabilizing: the Turkish lira hit a record low, reserves declined sharply, and sovereign credit default swap premia rose. Although monetary
Growth in ECA is forecast co slow to 2.4 percent in 2025 before firming slighcly to an average of 2.6 percent in 2026-27-below the region's 201019 pace of 3.2 percent-reflecting the weakening external environment and a scepdown in growth in Russia (figure 2.2.1.A; table 2.2.1). 1 The slowdown projected for chis year is expected to be broad-based across the region, with about threequarters of ECA's economies anticipated to
1The baseline projections assume chat che tariffs in place in late May will prevail for the rest ofthe forecast horizon
decelerate. Over 2026-27, growth is expected to edge up, supported by a modest increase in investment as the impact of previous monetary tightening fades and by a gradual recovery of exports as growth in the euro area firms.
Given the region's close ties to the global economy, the deterioration m the external environment-including nsmg trade tensions, elevated global uncertainty, weakening confidence, and renewed financial market volatility-is expected to dampen activity. Growth forecasts this year have been downgraded in nearly threequarters of ECA's economies. Trade and financial flows this year are expected to be hampered by the euro area slowdown, the region's largest partner. Heightened global uncertainty and weaker confidence are anticipated to weigh on the region's investment outlook. Lower global commodity demand and prices are expected to have mixed effects across the region-negatively affecting energy exporters, such as Azerbaijan, Kazakhstan, and Russia, and metal exporters particularly exposed to China's slowdown, such as Tajikistan, while benefiting energy importers like Tiirkiye (World Bank 2025d).
Inflation is projected to remain above target in most ECA countries, limiting the room for monetary policy easing. In addition to persistent underlying domestic pressures-such as tight labor markets and sustained demand in the services sector-the increase in trade barriers is expected to slow the disinflation process, notably by raising input costs, although this may be partly offset by declining commodity prices.
Fiscal deficits have widened relative to the prepandemic decade, partly due to rising military expenditures, and are expected to increase further in 2025, before a gradual shift toward fiscal consolidation (figure 2.2.2.B). Poland and Romania are under the European Union's excessive deficit procedures, and their fiscal deficits, projected to exceed 5 percent of GDP in 2025, highlight rising fiscal risks.
In Russia, growth is forecast to decelerate to 1.4 percent in 2025 and average 1.2 percent in 202627 (table 2.2.2). The marked slowdown this year is largely driven by weakening private and public
Growth in EGA is projected to slow to 2.4 percent in 2025, before edging up to 2.5 percent in 2026. Fiscal deficits have widened relative to the prepandemic decade, partly due to an increase in military expenditures, and may rise further this year. Central Europe and the Western Balkans are likely to be most affected by weak euro area growth, given their tight economic linkages with the bloc, though Germany's fiscal support package may provide some offset. Insufficient innovation, which remains below euro area levels, limits potential growth.
A GDP growth forecasts
B. Fiscal deficit and military expenditures in ECA
C. Shares of ECA exports to the United States and euro area 1111 I
D. Innovation I I I I I
Sources: Digital Progress and Trends Report 2023 (World Bank); International Monetary Fund; Stockholm International Peace Research Institute; World Bank;World Integrated Trade Solution; World Intellectual Property Organization (database).
Note : f = forecast. CA = Central Asia;CE = Central Europe; EGA = Europe and Central Asia; EE = Eastern Europe; RUS = Russian Federation;SCC = South Caucasus;TUR = T0rkiye;WBK = Western Balkans.
A. Bars and dashes represent GDP growth forecasts for 2025 and 2026,as reported in the June 2025 and January 2025 editions of Global Economic Prospects.
B. Bars show average military expenditures in EGA and the fiscal deficit for 2024 in percentage of GDP; dashes indicate the average values for the period 2000-19. Sample includes 21 EGA economies for military expendituresdata and 22 economies for fiscal deficit.
C. Blue bars show the share of exports to the United States. Red solid bars represent the share of exports to the euro area except Germany,and red striped bars the share of exports to Germany. Last observation is 2023 (2021 for Belarus, the Russian Federation,and Tajikistan)
D. Bars show normalized scores (on a 0-100 scale) for the five input pillarscaptured by the Global Innovation Index for 2022. Red and orange dashes represent the normalized scores for the euro area and EMDEs, respectively. Higherscores indicate a higherdegree of innovation. Sample includes 21 EGA economies and 96 EMDEs. Last observation is 2022.
consumption amid the lagged effects of previous monetary policy tightening, sluggish growth in real wages, and a moderation of state-led corporate lending. Growth and fiscal revenues are expected to be dampened by lower global energy prices. Export growth is expected to be muted, while imports are projected to slow due to weaker domestic demand and tighter payment sanctions. Labor shortages, exacerbated by negative demo-
graphic trends, and restricted access to markets and technologies are expected to continue to limit long-term growth (CEPR 2024).
In Ti.irkiye, growth is projected to slow to 3.1 percent in 2025, before edging up to 3 6 percent in 2026 and 4.2 percent in 2027. Relatively moderate growth in 2025 reflects the effects of still-tight monetary policy, expected fiscal consolidation, and subdued global activity amid heightened uncertainty. The 0.5 percentage point upward revision for growth in 2025 since January largely stems from previous momentum, including stronger-than-expected growth in the fourth quarter of 2024, and lower global oil prices. Private consumption is expected to remain the main growth driver in 2026-27, supported by continuing disinflation. Export growth is likely to be limited by the real appreciation of the lira, subdued euro area demand, and uncertainty surrounding trade policies in major economies.
Ukraine's growth is projected to rise from 2 percent in 2025 to 5.2 percent in 2026 and then ease to 4.5 percent in 2027, assuming the invasion extends through end-2025, with active hostilities winding down afterward. Shortages of labor, energy, and other inputs are expected to constrain activity this year. The projected pick-up in growth for 2026 assumes a surge in investment in manufacturing and reconstruction, while the export recovery is expected to remain limited due to a challenging trade environment and economic uncertainty. The reconstruction and recovery costs are estimated at $524 billion-almost three times Ukraine's GDP in 2024 (World Bank 2025e).
In contrast to other subregions, and despite a challenging external environment, growth in Central Europe is forecast to firm to 2.4 percent in 2025, driven by Poland The country's growth is expected to be supported by robust wage growth and a projected increase in investment from EU funding. Weak euro area demand is envisaged to weigh on exports, while its subdued recovery is expected to support a modest rebound of the subregion to 2.7 percent in 2026-27. Germany's newly legislated fiscal support package may help offset some of the external drag-particularly in the coming years-benefiting the subregion, which sends about 22 percent of its exports to
Germany, notably Poland and Romania (figure 2 2.2 C)
Growth in the Western Balkans is forecast to slow slightly to 3.2 percent in 2025 before picking up to an average of 3.6 percent in 2026-27 While subdued euro area growth and ongoing global trade policy uncertainty are expected to limit export expansion, private consumption, supported mainly by robust real wages, is projected to drive growth, especially in Kosovo, Montenegro, and Serbia (World Bank 2025f).
In the South Caucasus, growth is projected to slow to 3.6 percent in 2025 and 3.4 percent in 202627 Growth in Azerbaijan is expected to be affected by declining oil production alongside weakening global demand and lower oil prices Growth in Armenia and Georgia is projected to ease-reflecting softer domestic demand and a slowdown in re-exports-and converge toward potential rates.
Central Asia's growth is forecast to decelerate to 5.0 percent in 2025 and 4.3 percent in 2026-27. Private consumption is expected to soften due to persistently high inflation. Trade growth in the subregion is projected to remain subdued, reflecting weaker growth in China and Russia, along with ongoing global trade uncertainty. Energy and metal exporters, in particular, are likely to face headwinds from lower global oil and metal prices, which will reduce exports and fiscal revenues.
Since the global financial cns1s, many ECA countries have faced growing challenges in achieving sustainable growth, exacerbated in recent years by the pandemic and the invasion of Ukraine. Progress with structural reforms has slowed. Key constraints on growth include shortages of skilled labor, declining educational quality, and limited innovation-below euro area levels-further compounded by the dominance of state-owned enterprises and a lack of competition in many cases (figure 2.2.2.D; Iacovone et al. 2025; World Bank 2025g). Structural challenges continue to hold back the pace of growth needed to support job creation and retain skilled labor, contributing to emigration to advanced European economies.
Risks to the regional outlook remain tilted to the downside, including the possibility of prolonged extension or intensification of Russia's invasion of Ukraine, a further escalation of global trade tensions, weaker-than-expected euro area growth, and more persistent inflation Higher uncertainty surrounding these risks has intensified since the beginning of the year. On the upside, an early and durable resolution of the invasion could boost regional growth, while faster and broader adoption of AI technologies could strengthen growth in the longer term, particularly in economies with adequate digital infrastructure and human capital skills.
The uncertain trajectory of the invasion presents a two-sided risk for the region. On the upside, an earlier-than-expected end of hostilities could accelerate reconstruction-driven investment in Ukraine and improve Russia's outlook through sanctions relief (BOFIT 2025). A boost in confidence would benefit the broader ECA region, though direct trade spillovers are likely to be limited given many countnes relatively low economic exposure to Russia and Ukraine. On the downside, without a strong peace agreement, a prolonged extension or intensification of the invasion could further weaken Ukraine's economy, deepen distortions in Russia, and keep geopolitical tensions high. A disruption to financing flows to Ukraine would heighten these risks, as the country's external funding remains heavily reliant on continued support from the EU and the United States (figure 2.2.3.A).
A renewed escalation of global trade tensions, leading to additional increases in trade restrictions and policy uncertainty, would hinder trade and growth in the region. While the direct impact on ECA would likely be limited by the region's modest trade exposure to the United Statesaveraging about 2 percent of goods exports, with Tiirkiye the highest at nearly 6 percent-indirect effects could be more substantial due to euro area exposure and increased competition in third markets (figure 2.2.2.C). With over half of the region's exports going to the euro area, any further weakening in EU demand could generate
Risks to the outlook remain tilted to the downside The evolution of Russia 's invasion of Ukraine remains highly uncertain , with European and U S support playing a key role for Ukraine. Central Europe and the Western Balkans, the most trade-open subregions and with significant manufacturing sectors, could be among the most affected by trade disruptions Elevated inflation may persist longer than expected, with risks of further increases and inflation remaining above central bank targets in many EGA economies Countries with a high value-added share in GDP and strong Al preparedness, such as those in Central Europe , are likely to see significant productivity gains from the adoption of advanced technologies
A Ukraine aid by donor and type, 2022-24
Trade openness and manufacturing value added
Sources: Cazzaniga et al. (2024); Consensus Economics; Haver Analytics; International Monetary Fund; Kiel Institute for the World Economy (database); Trebesch et al. (2023);World Bank
Note: Al = artificial intelligence; ALB = Albania; ARM = Armenia; AZE = Azerbaijan; BGR = Bulgaria; BLR = Belarus;CA = CentralAsia; CE = Central Europe; EE = Eastern Europe; EU = European Union;GEO = Georgia; HRV = Croatia; ICT = information and communication technology;KAZ = Kazakhstan;MDA = Moldova; MNE = Montenegro; MKD = North Macedonia; POL = Poland; ROU = Romania; RUS = Russian Federation;sec = South Caucasus; SRB = Serbia;TUR = Turkiye; UKR = Ukraine; UZB = Uzbekistan; VA = value added; WBK = Western Balkans; XKX = Kosovo
A. Bars show total military and non-military support to Ukraine,representing commitments made between January 24, 2022,and February 28,2025.
B. Bars show the GDP share of exports and imports by ECA subregion Diamonds represent the GDP share of value added by the manufacturing sector. Lastobservation is 2023.
C. Figure shows the Consensus Economics forecast of year-on-year inflation for 2025 based on the May 2025 surveys of 16 ECA economies. Inflation targets are as of May 2025. Last observation for headline inflation is April 2025.
D Scatter plot shows the Al Preparedness Index calculated by the InternationalMonetary Fund and the share of VA of ICT services in percentage of nominal GDP The index scale ranges from Oto 1, with higher values indicating greater Al preparedness Last observation is 2023
significant negative spillovers for ECA. Central Europe and the Western Balkans would be particularly vulnerable, given their high trade openness, strong integration into European value chains, and reliance on the manufacturing sector-especially the German automotive sector, which has already been targeted by U.S. trade
restnct10ns (figure 2.2.3.B). Additional trade disruptions could weaken household real incomes, reduce labor demand and profitability in exposed sectors, and dampen investment. A deterioration in consumer and business confidence-amplified by elevated or persistent policy uncertainty, particularly around trade-could further weigh on activity.
Persistently high inflation may lead to tighter monetary policy, which would weigh on growth. Inflation is already projected to remain above targets in 2025 in most ECA countries (figure 2.2.3.C). Tighter-than-expected labor markets, stronger wage growth, additional or larger tariffs on imported goods, and supply chains disruptions-particularly relevant for Central Europecould further exacerbate inflationary pressures. Shifts in policy rate expectations or rising financial stress could trigger capital outflows and currency depreciation in vulnerable countries.
Climate change remains an important downside risk. Without adaptation, climate-related damages could reduce GDP by 5-6 percent in Tajikistan
and up to 14 percent in Bosnia and Herzegovina by 2050, while flooding in Kazakhstan could lower GDP by 1.3 percent by 2060 (World Bank 2022, 2024c, 2024d). The energy transition also poses adjustment challenges-notably in the Western Balkans, where about 20 percent of the workforce in this subregion is likely to be at risk, particularly in high-emission sectors such as heavy manufacturing (World Bank 2025f)
The possibility of an accelerated adoption of new technologies, including generative AI, presents an upside risk to ECA's growth. With education reforms to equip workers for a technology-driven labor market, increased global investment in energy infrastructure, data centers, and R&D could generate spillovers through stronger external demand and rising trade in information and communications technology (Dalvit et al. 2023; World Bank 2024e). Central European countries, with the highest ICT value-added share of GDP and the region's strongest AI preparedness, are likely to benefit from significant productivity gains from the adoption of technology advances (figure 2 2 3 D)
(Real GDP growth at market prices in percent, unless indicated otherwise)
EMDE ECA, GDP 1
GDP per capita (U S dollars)
EMDE ECA excluding Russian Federation, TOrkiye,
and Ukraine, GDP
Source: World Bank.
Note: e = estimate; f = forecast. EMDE= emerging market and developing economy; PPP= purchasing powerparity. World Bank forecasts are frequently updated based on new information and changing (global) circumstances Consequently. projections presented here may differfrom those contained in otherWorld Bank documents,even if basic assessments ofcountries' prospects do not differat any given moment in time The World Bank is currently not publishing economic output, income, orgrowthdata for Turkmenistan owing to a lack of reliable data of adequate quality. Turkmenistan is excluded from cross-country macroeconomic aggregates Since Croatia became a memberof the euro area on January 1,2023,it has been added to the euro area aggregate and removed from the ECA aggregate in all tables to avoid double counting
1. GDP and expenditure components are measured in average 2010-19 prices and market exchange rates thus aggregates presented here may differ from other World Bank documents
2. Aggregates presented here exclude Azerbaijan, Bosnia and Herzegovina,Kazakhstan, Kosovo,the Kyrgyz Republic,Montenegro,Serbia, Tajikistan,and Uzbekistan
3. Exports and imports of goods and nonfactor services (GNFS).
4. Includes Armenia, Azerbaijan Kazakhstan the Kyrgyz Republic Kosovo the Russian Federation Tajikistan Ukraine and Uzbekistan
5. Includes Albania, Belarus, Bosnia and Herzegovina,Bulgaria,Georgia, Hungary, Moldova, Montenegro, North Macedonia, Poland, Romania, Serbia,and TOrkiye
6. Includes Bulgaria, Hungary, Poland,and Romania
7. Includes Albania Bosnia and Herzegovina Kosovo Montenegro North Macedonia,and Serbia
8. Includes Belarus, Moldova,and Ukraine
9. Includes Armenia,Azerbaijan,and Georgia
10. Includes Kazakhstan the Kyrgyz Republic Tajikistan and Uzbekistan
(Real GDP growth at market prices in percent, unless indicated otherwise)
Source: World Bank.
Note : e = estimate; f = forecast. World Bank forecasts are frequently updated based on new information and changing (global) circumstances Consequently,projections presented here may differfrom those contained in other World Bank documents even if basic assessments of countries prospects do not significantly differat any given moment in time The World Bank is currently not publishing economic output income orgrowth data for Turkmenistan owing to a lack of reliable data of adequate quality Turkmenistan is excluded from cross-country macroeconomic aggregates.
1. Data are based on GDP measured in average 2010-19 prices and market exchange rates,unless indicated otherwise 2. GDP growth rate at constant prices is based on production approach.
Growth in Latin America and the Caribbean (LAC) is forecast to remain steady at 2.3 percent in 2025 and then firm to 2.5 percent, on average, in 2026-27. While Mexico is expected to be the economy most directly affected by the recent rise in trade barriers, the entire region will be indirectly impacted. Mexico, Central America, and the Caribbean are highly integrated into the US. economy through trade, investment, remittances, and financial linkages. Although domestic demand remains resilient, exports throughout the region are expected to weaken this year amid rising trade protectionism and policy uncertainty. The projected softening in commodity prices is set to weigh moderately on regional growth, as many countries are commodity exporters Risks to the outlook remain tilted to the downside. More persistent or heightened policy uncertainty, additional trade barriers, and weaker-than-expected growth in major economies could further dampen activity. Tightening global financial conditions may continue to raise debt-servicing costs, possibly delaying ongoing fiscal consolidation in key LAC economies. The relatively subdued regional outlook, combined with lingering structural bottlenecks, could weaken momentum in job creation and further constrain per capita income gains.
Rising trade barriers and heightened uncertainty globally are weighing on activity in Latin America and the Caribbean (LAC), particularly through exports, investment, remittances, and confidence channels. Mexico, the region's second-largest economy, has been the most directly affected, with 25 percent tariff on non-United States-MexicoCanada-Agreement (USMCA)-compliant imports into the United States. This has dampened Mexico's exports and increased uncertainty regarding its future trade with the United States, where 80 percent of its exports were destined in 2024, about half of which were non-compliant with the USMCA. Other major LAC economies, such as Argentina and Brazil, have been less impacted than Mexico because their share of exports to the United States is much smaller and they do not have the same tight manufacturing links (figure 2.3.1.A). Besides Mexico, all countries in the region face an increase in U.S. tariffs of 10 percent. Some countries, notably Brazil and Jamaica, also face tariffs on U.S.-bound
and Valerie Mercer-Blackman
steel and aluminum exports. However, key commodities, such as energy and copper, have been excluded from tariffs, reducing the overall impact on the region.
After a generally solid regional growth performance in the second half of 2024, early indicators for the first quarter of 2025 point to some weakening across large economies, particularly in industry. A continued rebound in Argentina and steady growth in Chile and Colombia were offset by weaker or subdued growth elsewhere. In Brazil and Mexico, a strong recovery in the agricultural sectors in the first quarter countered a contraction in industrial activity and nearly stagnant service sector growth. Recent Purchasing Managers' Indexes (PMls) have signaled continued softness in activity. Consumer and business confidence in several large LAC economies have been volatile, with a gradual decline in consumer confidence in Brazil amid fiscal concerns. Indicators have been generally solid in Argentina (figures 2.3.1.B and 2.3.1.C).
Progress continues in keeping inflation relatively contained, although the final part of the disinflation process is proving difficult to tackle given the recent uptick in food inflation and the slowdown
LAC countries face a 10 percent tariff increase on exports to the United States, except for Mexico, which faces a 25 percent tariff on non-USMCAcompliant goods Eighty percent of Mexico's goods exports go to the United States, heightening its vulnerability to shifting U.S. trade policy PMls have softened in Mexico while remaining relatively volatile in Brazil and Colombia. In recent months, business confidence has gradually declined in Brazil amid fiscal concerns, while it has increased in Argentina on the back of key structural reforms Headline inflation in some of the largest economies has hovered around 5 percent since early 2024 amid a recent uptick in food prices, while core inflation remains slightly above central bank targets
A. U.S. tariffs and good exports to the U S.
B. Purchasing managers' indices
policy rate. Chile's policy rates remained unchanged as inflation hovers around the upper end of its 4 percent target In contrast, inflation rates in both Mexico and Peru have returned to targets as disinflationary policies have taken effect and demand has moderated Mexico's central bank hastened the pace of policy rate cuts this year following a period of more cautious easing. Meanwhile, inflation in Colombia has remained above target as the monetary policy approach has led to continued easing.
C. Consumer and business confidence
D Consumer price inflation
Sources: HaverAnalytics; White House; UN Comtrade (database); World Bank.
Note : EU = European Union; LAC = Latin America and the Caribbean
A. Bars denote general ad valorem tariffs on imports from trading partners imposed by the United States as of May 2025 Excludes product-specific tariffs. Shares of exports to the U S. are calculated as the average of annual goods exports to the U.S from 2020 to 2023 expressed as a percentage of each country's total goods exports. Central America includes Costa Rica El Salvador, Guatemala, Honduras, and Panama South America includes Argentina, Bolivia,Brazil, Chile, Colombia, Ecuador, Paraguay, Peru, and Uruguay. The Caribbean includes Antigua and Barbuda,The Bahamas, Barbados, Belize, Dominica, the Dominican Republic, Grenada, Guyana, Jamaica, St. Kitts and Nevis, St. Lucia, St. Vincent and the Grenadines, Suriname, and Trinidad and Tobago
B. A purchasing managers' index (PMI) of 50 or higher (lower) indicates expansion (contraction).
Panel shows the composite PMI for Brazil and manufacturing PMI for Colombia and Mexico. Last observation is May 2025.
C Panel shows the z-scores for business confidence in Chile and consumer confidence in Argentina, Brazil, Colombia,and Mexico Last observation is May 2025.
D Year-over-yearconsumer price inflation Aggregate is 12-month moving weighted average for Brazil, Chile, Colombia,Mexico, and Peru Last observation is April 2025.
in the pace of interest rate reductions. Twelvemonth headline and core inflation have changed little since late 2023 despite easing commodity price pressures and slower demand growth (figure 2.3.1.D). In Brazil, inflation has exceeded 5 percent in recent months-above the central bank's target range-prompting increases in the
Fiscal vulnerabilities have persisted amid declining commodity prices. Falling oil prices have complicated government finances in Colombia, Ecuador, and Mexico-and especially in Colombia, where the central government's budget deficit widened in 2024 and worsened further at the start of this year. In Brazil, the general government's primary fiscal deficit narrowed in 2024, driven by strong revenue growth and reduced expenditures. Overall, fiscal deficits remained in negative territory in 2024 in all the major South American countries except for Argentina, in large part due to high debt-servicing costs amid high interest rates.
In contrast, improved private savings led to an improvement in external balances. Falling oil prices helped to improve the external finances of net oil importers such as Chile, Peru, and most of Central America and the Caribbean. In contrast, agriculturally dependent economies, such as Brazil and Paraguay saw a dampening of export revenues as global grain prices moderated.
Regional growth is projected to hold steady at 2 3 percent in 2025, with most major economies outside the Caribbean showing little dynamism, with the exception of Argentina, which is undergoing a recovery after two years of recession. It will then edge up to 2.5 percent on average in 2026-27, slightly above the region's subdued rate of potential growth (figure 2.3.2 A; table 2.3 1) Despite the projected improvement over the forecast horizon, LAC's growth is expected to be the lowest of all six emerging market and developing economy (EMDE) regions. Given the changes in the external environment, including
increased trade tensions and falling commodity prices, the forecast implies a downward revision for the region's growth of 0.2 percentage point, with more than half of LAC economies experiencing a downgrade from previous projections
Following a rise in trade barriers with the United States and an associated increase in uncertainty, weaker export demand and private consumption growth are set to act as the main drag on growth in 2025. The baseline projections assume that the tariffs in place as of late May will prevail for the rest of the forecast horizon. Crude oil is exempt from U.S. tariffs, except for a 10 percent tariff on imports from Canada and a 25 percent tariff in imports from Mexico. Canada accounted for 77 percent of heavy U .S. crude oil imports in 2024. Consequently, oil exporters such as Colombia, Ecuador, and Guyana could benefit on the margin from trade diversion For most other products, the region is unlikely to see gains from tariff-induced trade diversion toward China or other countries but instead will be weighed down by the dampening effect of uncertainty.
The growth forecast is constrained by limited room for policy maneuver. As inflation is forecast to remain close to the upper end of central bank target ranges in the short run in several countries, particularly in Brazil and Colombia, some central banks are expected to have little scope to reduce policy rates (figures 2.3.2.B and 2.3.3.C). Fiscal policies are projected to remain broadly contractionary in 2025, shifting toward a more neutral stance in 2026-27 (figure 2.3.2.D).
Growth in Brazil is expected to fall by a third, from 3.4 percent in 2024 to 2.4 percent in 2025, owing to slower consumption and much weaker investment growth amid tighter financial conditions and external headwinds, and is projected average 2.2 percent in 2026-27. The tightening of monetary policy since last September-with increases in the policy rate from 10.50 to 14.75 percent-should help reduce inflationary pressures, though it will weigh on investment and consumer spending. Fiscal sustainability concerns, combined with statutory limitations on adjusting the size and composition of its budget, are expected to limit Brazil's ability to strengthen growth through fiscal expansion in the short run.
Growth in the region is expected to hold steady at 2.3 percent in 2025 and then pick up slightly in 2026-27 to stay above potential. Inflation in the largest LAC economies is generally expected to remain close to the upper limit of most central banks' target ranges. Consequently, market participants expect real policy interest rates to remain close to 2024 levels, apart from Brazil, where interest rates are expected to remain relatively high. The forecast assumes that fiscal consolidation in LAC will continue over the next few years.
A. GDP growth forecast and potential growth
B. Inflation expectations and official targets
Sources: Bloomberg; Consensus Economics; Haver Analytics; IMF World Economic Outlook (database); World Bank.
Note: e = estimate;f = forecast. ARG = Argentina; BRA = Brazil; CHL = Chile; COL = Colombia; EMBI = Emerging Market Bond index; LAC = Latin America and the Caribbean;MEX = Mexico; PER = Peru RHS = right-hand side axis.
A. Period averages of annual GDP-weighted values. GDP weights are based on average real U.S. dollar GDP (at average 2010-19 prices and market exchange rates) for the period 2000-24. Data for 2022-30 are forecasts. Potential growth estimates are based on the production function approach Country coverage for potential growth is based on data availability: South America includes Argentina, Bolivia, Brazil, Chile, Colombia, Ecuador, Peru, Paraguay, and Uruguay. Mexico and Central America include Costa Rica, Guatemala, Honduras, Mexico, and Nicaragua. The Caribbean includes the Dominican Republic and Jamaica.
B. Red lines show one-year-ahead inflation expectations reported in the January 2025 Global Economic Prospects report. Yellow diamonds show the latest one-year-ahead inflation expectations based on Consensus Economics in May 2025. Blue bars denote inflation target ranges,which are set by the respective central banks.
C. Yellow diamonds denote the December2024 policy rate minus the 2024 inflation expectation from Consensus Economics. Blue diamonds denote the 30-day rolling average of the one-yearahead market-implied policy rate,using daily data from December2024,minus the 2025 inflation expectation from Consensus Economics. Bars show the expected change in real interest rates from 2024 to 2025. Last observation is December 31 2024.
D. Fiscal impulse is the annual change in the structural primary balance for 18 LAC economies, using data from the April 2025 IMF World Economic Outlook (database). A positive value indicates fiscal expansion, while a negative value indicates contraclion. The structural primary balance refers to the general government structural balance excluding net interest costs.
However, maintaining credible fiscal consolidation efforts will yield growth dividends beyond the short term.
Mexico's growth forecast for this year has been downgraded markedly-by 1.3 percentage
points-relative to previous projections, reflecting the impact of higher U.S. tariffs and slower U .S. growth, owing to Mexico's close integration with the U.S economy Growth is projected to drop to 0.2 percent in 2025 and then firm to 1.5 percent on average in 2026-27. Uncertainty related to the review of the USMCA is expected to dampen investor confidence and exports. Given Mexico's strong linkages with the U.S auto industry, manufacturing exports are expected to be hard-hit. Additionally, real interest rates, though decreasing, are likely to remain elevated, which, combined with a declining fiscal deficit, is expected to restrain domestic demand.
Argentina's economy is forecast to rebound this year, expanding 5.5 percent, following two years of recession. For 2026-27, growth is projected to average 4.3 percent. The recovery is expected to be driven mainly by developments in the agriculture, energy, and mining sectors. Growth will be supported by macroeconomic stabilization, the elimination of currency controls, and newly enacted business-friendly reforms, which should enhance consumer and investor confidence. As part of the stabilization process, disinflation is expected to lead to real income gains for households, further supporting the recovery. The government is expected to continue maintaining fiscal surpluses in line with the new IMFsupported policy program
Colombia's growth is projected to firm to 2.5 percent in 2025 and 2.8 percent on average in 2026-27, driven by private consumption and a partial recovery in private investment, supported by easing monetary conditions as inflation continues to moderate The forecast assumes that the authorities will stabilize public debt through credible measures to reduce large budget deficits. Still, persistent uncertainty surrounding structural economic policies is expected to continue weighing on investor confidence, posing risks to medium-term growth prospects.
Chile's economy is projected to grow 2.1 percent in 2025, and an average of 2.2 percent in 202627. Domestic demand is expected to strengthen gradually as inflation returns to the central bank's target by the second half of 2025. Mining investments will bolster growth in the medium
term. Continuing external demand for copper and lithium, critical inputs into renewable-energy technologies, should support export performance, particularly strong demand from China's renewable technologies sector. This would partially offset the impact of weak growth in the Chinese real estate sector, which was traditionally the largest buyer of copper and other industrial metals.
Peru's growth is expected to moderate slightly-to 2.9 percent in 2025 and an average of 2.5 percent in 2026-27. The slowdown reflects waning private consumption growth, an increase in uncertainty regarding domestic policy, heightened global volatility, and fiscal consolidation amid greater moderation in government consumption. Like Chile, growth is nonetheless expected to be underpinned by sustained investment in the mining sector, particularly in copper production, and in infrastructure projects.
Growth in the Caribbean economies is projected to remain solid, reflecting Guyana's continuing oil boom, with aggregate GDP expanding by 3 9 percent in 2025 and 6 2 percent on average in 2026-27. Guyana's strong performance has significantly boosted the subregion's overall growth prospects despite international oil price volatility. Growth in the subregion excluding Guyana will moderate to 3 percent in 2025 and 3.3 percent on average in 2026-27, underpinned by tourism and other services activities. The Dominican Republic is forecast to grow by 4 percent in 2025 and by an average of 4.3 percent in 2026-27, as it benefits from structural reforms aimed at attracting foreign investment. Jamaica's growth is projected to be more tepid, at 1.7 percent on average over 2025-27, mainly supported by reconstruction efforts, but converging to its potential growth rate. Haiti's economic outlook remains fragile and highly uncertain amid persistent political instability and security challenges, with the economy expected to contract 2.2 percent in 2025.
Central America's economic growth is projected to be 3.3 percent in 2025 and to rise to an average of 3.7 percent in 2026-27, despite headwinds from weaker growth in the United States. Activity is expected to be primarily supported by services exports and improved consumption amid
gradually easing monetary policies across the subregion. Panama's growth is expected to rebound to 3.5 percent in 2025 and average 4 1 percent in 2026-27, bolstered by solid trade services growth related to the Panama Canal Costa Rica's growth is projected to remain solid at 3.5 percent in 2025 and average 3.8 percent in 2026-27, supported by buoyant household consumption
The estimated potential economic growth rate of LAC during 2011-21 was the lowest of all EMDE regions. Projected potential growth for the remainder of the 2020s implies a further slowdown amid declines in the growth rates of both total factor productivity and the labor force (figure 2.3.2 A; Kose and Ohnsorge 2023) While real wages have risen in most large countries amid tight labor markets, the challenge ahead will be to boost employment while raising comparatively low labor productivity. Although the region is projected to see only modest additions to its working-age population over the coming decades, some LAC economies are expected to see significant increases, compounding the jobs challenge.
Risks are firmly tilted to the downside, reflecting the uncertain policy environment. Many of the identified risks, if they materialize, could have compounding effects. The direct effects of escalating trade barriers, the indirect dampening effects on export demand, and lower-thanexpected commodity prices amid sluggish global growth could contribute to lower export revenue and undermine ongoing fiscal consolidation efforts in the region. The risks of weaker remittance flows is also a key obstacle to LAC's prospects.
Trade restrictions had been nsmg globally even before the increase in U.S. tariffs earlier this year, leaving growth in LAC vulnerable to downside risks from additional restrictive measures. For example, the USMCA contains a clause allowing for revisions in 2026, which could potentially trigger new protectionist actions and further weigh on Mexico's exports and economic outlook. The share of goods exports to GDP of Mexico, Chile,
Downside risks to the outlook include a potential increase in trade tensions, which could dampen exports-particularly in Mexico, where exports to the U.S. alone comprise a large share of GDP Lower global growth could affect remittance receipts, which are an important source of income, especially in Central America and the Caribbean Lower growth could also make the needed fiscal consolidation more challenging, as LAC's major economies aim to lower government debt to levels closer to pre-pandemic averages Although they are currently stable, bond spreads could increase if risk appetite weakens .
A. Exports of goods
B. Personal remittances received
Government debt
D Bond spreads and exchange rate appreciation
Sources: Haver Analytics; J.P. Morgan; UN Comtrade (database); World Bank.
Note: f = forecast. ARG = Argentina; BRA = Brazil; CHL = Chile; COL = Colombia; ECU = Ecuador; EMBI = Emerging Market Bond Index.; GTM = Guatemala; HND = Honduras; HTI = Haiti; JAM = Jamaica; MEX = Mexico; NIC = Nicaragua; SA = South America; SLV = El Salvador; PER = Peru.
A. Goods exports to the United States and China as a share of GDP. Last observation is 2023. B. Bars show personal remittances received as a percentage of GDP in 2023. "Others" refers to other Central American and Caribbean countries not displayed individually in the figure.
C. General government gross debt as apercentage of GDP. Period averages of general government gross debt during 2010-19. Data for 2025 are projections.
D. EMBI bond spread and currency exchange rate in LAC countries. Exchange rate change refers to the nominal change in value against the U.S. dollar since end-2024. Last observation is May 19, 2025 for bond spreads and June 3,2025 for exchange rates.
Ecuador, and Peru is between 25 and 35 percent, though exports from the latter three countries are much-more geographically diversified than Mexico's (figure 2.3.3.A). Additional trade measures would reduce growth by lowering demand for LAC's exports.
A sharper-than-expected slowdown in U.S. growth would significantly reduce demand for LAC countries' goods and services. Mexico is most vulnerable to a slowdown via its large manufacturing exports to the United States, which are part of tightly linked North American supply chains.
Activity in Central American and Caribbean economies would be affected, as these economies rely on the U S as a key market for their exports, particularly tourism and remittances. Remittance receipts could become less stable with slower U.S. growth or reduced employment opportunities for migrants: Labor markets in some LAC countries are already stretched as they integrate migrants from neighboring countries (World Bank 2025i). An erosion in the ability for migrants to transmit remittances could have additional negative impacts on incomes of remittance-receiving households; particularly in some Central American and Caribbean countries where remittances constitute about 20 percent of GDP (Figure 2 3.3 B). Aggregate spillover effects from the United States are significant, as declines in U .S. growth are generally associated with even larger growth declines in most EMDE economies (World Bank 2025h).
In many LAC economies-particularly those in South America-China is a key trading partner
and commodity importer. If China's demand slowed, especially demand for metals, prices of industrial commodities such as copper could fall further (World Bank 2025d). This could dampen growth and fiscal revenues through lower demand for exports, particularly from Chile and Peru
Fiscal positions have deteriorated since the decade before the pandemic, with increased debt burdens and higher borrowing costs (figure 2 3.3.C). While fiscal deficits across most LAC economies have narrowed since the pandemic's peak, they remain substantial. Should investors' concerns about the sustainability of these deficits increase amid tighter financial conditions, demand for government bonds issued by some governments in the region could fall. This could trigger further increases in borrowing costs, despite appreciating currencies amid an elevated current account deficit (figure 2.3 3.D) The resultant increase in debtservicing costs could force more aggressive fiscal adjustments than currently planned, with contractionary effects on growth
(Real GDP growth at market prices in percent, unless indicated otherwise)
Percentage-point differences from January 2025 projections
(Average including countries that report expenditure components in national accounts)2
EMDE LAC, GDP2
PPP GDP
Private consumption
Public consumption
Fixed investment
Exports, GNFS3
Imports, GNFS3
Net exports, contribution to growth
Memo items: GDP
South America4
Central America 5
Caribbean6
Caribbean excluding Guyana
Brazil
Mexico
Argentina
Source : World Bank
Note : e = estimate; f = forecast. EMDE =emerging market and developing economy; PPP = purchasing power parity. World Bank forecasts are frequently updated based on new information and changing (global) circumstances Consequently,projections presented here may differ from those contained in other World Bank documents,even if basic assessments of countries' prospects do not differat any given moment in time The World Bank is currently not publishing economic output, income orgrowth data for Republica Bolivariana de Venezuela owing to a lack of reliable data of adequate quality. Republica Bolivariana de Venezuela is excluded from cross-country macroeconomic aggregates
1 GDP and expenditure components are measured in average 2010-19 prices and market exchange rates
2 Aggregate includes all countries in notes 4 5 and 6 plus Mexico but excludes Antigua and Barbuda Barbados Dominica Grenada Guyana Haiti St. Kitts and Nevis St. Lucia St. Vincent and the Grenadines,and Suriname
3 Exports and imports of goods and nonfactor services (GNFS)
4 Includes Argentina, Bolivia,Brazil,Chile,Colombia, Ecuador, Paraguay, Peru, and Uruguay
5 Includes Costa Rica El Salvador Guatemala, Honduras, Nicaragua and Panama
6 Includes Antigua and Barbuda, The Bahamas, Barbados,Belize, Dominica,the Dominican Republic,Grenada,Guyana, Haiti, Jamaica,St. Kitts and Nevis,St. Lucia, St. Vincent and the Grenadines,Suriname,and Trinidad and Tobago
TABLE 2.3.2 Latin America and the Caribbean country forecasts 1
Source : World Bank
Note: e = estimate; f = forecast. World Bank forecasts are frequently updated based on new information and changing (global) circumstances. Consequently projections presented here may differfrom those contained in otherWorld Bank documents even if basic assessments of countries prospects do not significantly differ at any given moment in time
1. Data are based on GDP measured in average 2010-19 prices and market exchange rates
2 GDP is based on fiscal year, which runs from Octoberto Septemberof nextyear
3 Percentage point differences are relative to the World Bank's October2024 forecast. TheJanuary 2025 Global Economic Prospec ts did not include forecastfor Trinidad and Tobago
Growth in the Middle East and North Africa (MNA) region is projected to strengthen to 2.1 percent in 2025 and average 3.9 percent in 2026-27, mainly due to an expansion of oil activity in oil exporters, which more than offiets the adverse effects of weakening external demand and lower oil prices. Growth in oil importers is also expected to rise, reflecting an assumed stabilization of armed conflicts in the region and waning inflationary pressures. Despite firming activity, growth forecasts for MNA this year and next have been downgraded from January projections amid a rise in trade barriers. Moreover, weaker growth prospects will exacerbate the regions looming jobs challenge, hindering the job creation needed to keep pace with rapidly expanding working-age populations. Downside risks to the outlook stem from the possibility that global trade tensions escalate further, policy uncertainty remains elevated, or global financial conditions deteriorate, possibly driven by higher global inflation Also, lower-than-expected oil prices could adversely affect growth and fiscal revenue prospects in oil exporters, while a re-escalation of armed conflicts in the region could increase uncertainty and dampen growth.
Despite the rise in global trade tensions and heightened uncertainty, activity in MNA has strengthened, partly reflecting increased oil production and easing geopolitical tensions in the region. In oil exporters, oil activity is recovering following the April 2025 announcement of the phase-out of the voluntary oil production cuts by member countries of the Organization of the Petroleum Exporting Countries and other affiliated oil producers (OPEC+). Growth of nonoil activity in oil exporters has been resilient, particularly in the manufacturing and services sectors (figure 2.4.1.A).
In oil importers, growth of private sector activity, particularly industrial production, resumed in 2024, partly owing to reduced political tensions and macroeconomic stabilization in several economies, including the Arab Republic of Egypt (figure 2.4.1.B). Industrial activity, particularly in construction, has strengthened in Morocco, accompanied by a recovery in domestic demand.
N ote: This section was prepared by Naotaka Sugawara.
In contrast, activity in West Bank and Gaza has been devastated, with significant destruction of physical capital and massive humanitarian costs in Gaza, as well as heightened tensions in West Bank.
Geopolitical tensions in the Middle East moderated somewhat following ceasefires in late 2024 and early 2025 involving Israel, Lebanon, and West Bank and Gaza However, violence has resumed in Gaza and Lebanon, and the situation remains highly fragile and uncertain. Tensions have remained high in other countries in fragile and conflict-affected situations (PCS). In the Syrian Arab Republic, the fragile situation has continued since the regime change last December. Transit of ships through the Suez Canal has remained limited by security concerns in the Republic of Yemen (figure 2.4.1.C).
The external positions of member countries of the Gulf Cooperation Council (GCC) have remained resilient. Growth of non-oil merchandise and services exports, including transportation and tourism, has been robust, mitigating the impact of reduced oil production on current accounts A worsening of goods trade balances has heightened external sector pressures in non-GCC oil export-
Economic activity has been recovering in oil exporters, mainly reflecting a gradual increase in oil production with a phase-out of voluntary oil production cuts by major producers. In oil importers, growth in industrial production has strengthened, partly because of moderating political tensions and stabilizing macroeconomic conditions, and inflation has continued to decline. With the security situation in the Middle East remaining highly fragile, transit through the Suez Canal has remained low by historical standards.
A. Gross value added in GCC countries
B. Industrial production in oil importers
addition to international financing. However, external accounts have continued to face pressure, as evidenced by the weak foreign asset position of commercial banks. In addition, the increases in U.S. import tariff rates announced in early April have raised uncertainty about prospects for exports from the region.
Inflation has remained well-contained in GCC countries, partly aided by their fixed exchange rate regimes. Headline and core inflation have eased in non-GCC oil exporters, primarily because of tight monetary policies, albeit with still-elevated price pressures, in the Islamic Republic of Iran. In oil importers, headline inflation has declined, while core inflation has remained persistent, keeping policy rates elevated (figure 2.4 1.D)
C Transit of ships
Sources : Bloomberg; Haver Analytics; World Bank.
D. Consumer prices in oil importers
Note: EGY = Arab Republic of Egypt; FCS = fragile and conflict-affected situations; GCC = Gulf Cooperation Council; JOR = Jordan; MAR = Morocco; MNA = Middle East and North Africa; PSE = West Bank and Gaza;TUN = Tunisia
A Percent change in non-seasonally adjusted real output (gross value added) from a year earlier and contributions of respective components Aggregates are calculated as weighted averages using value added at 2019 prices and market exchange rates as weights Sample includes up to sixcountries
B Percent change in non-seasonally adjusted industrial production (or manufacturing production in the case of Morocco) from a year earlier. Latest refers to: March 2025 for the Arab Republic of Egypt,Jordan, and West Bank and Gaza; December2024 for Tunisia; and 202404 for Morocco.
C. The number of commercial ships-including container ships bulk carriers and tankers-that transit the Suez Canal and the Cape of Good Hope Data are shown as a 7-day rolling sum. Last observation is May 30, 2025.
D. Percent change in non-seasonally adjusted headline and core consumer prices from a year earlier. Aggregates are calculated as weighted averages using nominal GDP in U S. dollars as weights. Sample includes up to five oil importers excluding FCS countries. Last observation is April 2025.
Growth in MNA is expected to pick up to 2.7 percent in 2025 and strengthen further to 3.7 percent in 2026 and 4 1 percent in 2027. This primarily reflects a gradual expansion of oil production more than offsetting the effects of lower oil prices and weaker global demand, and despite the constraints on export activity from rising trade barriers (figure 2.4.2.A; table 2.4.1). Projected growth rates for 2025 and 2026 have been downgraded by 0 7 and 0.4 percentage point, respectively, from January projections, mainly due to the impact of increased trade restrictions and uncertainty on investment and export activity in the region, and for 2026, an expected delay in the start of reconstruction in West Bank and Gaza Growth forecasts for 2025 or fiscal year (FY) 2025/26 have been downgraded in more than half of the countries
ers, particularly those implementing OPEC+ production adjustments, including Algeria and Iraq. In oil importers, external pressures have eased, partly reflecting recoveries in tourism, spurred in part by moderating regional tensions. Foreign exchange reserves in Egypt have continued to rise, supported by a one-off large-scale investment deal with the United Arab Emirates, in
The growth projections assume a continuation of the ceasefire agreement in Lebanon, and a resumption of truce involving West Bank and Gaza, as well as political stability in Syria, but there is considerable uncertainty surrounding these assumptions. The outlook also assumes that the tariffs in place in late May will prevail for the rest of the forecast horizon, with crude oil, natural gas, and refined products exempted from these tariffs.
Growth in GCC countries is forecast to increase to 3.2 percent in 2025, 4.5 percent in 2026, and 4.8 percent in 2027. The phase-out of OPEC+ oil production cuts starting in April 2025 is expected to lead to rising oil production, despite projected lower oil prices amid weakening global demand. Growth is also anticipated to continue to be boosted by expanding non-oil activity, particularly in the manufacturing, construction, and services sectors, in several economies, including Bahrain, Kuwait, Oman, and the United Arab Emirates. In Saudi Arabia, growth is set to increase to 2.8 percent this year, reflecting a gradual expansion of oil production (table 2.4.2). However, the forecast for 2025 has been downgraded by 0.6 percentage point, mainly because of expected lower oil prices and fiscal revenues leading to lower export proceeds, as well as heightened uncertainty curbing investment
Among the oil exporters outside the GCC, GDP in the Islamic Republic of Iran is projected to contract by 0.5 percent in FY2025/26 (late-March 2025 to late-March 2026) and then increase at a subdued rate of 1.1 percent a year, on average, in the next two fiscal years. The outlook is weaker than in January, partly reflecting reduced oil demand from China, energy shortages, and elevated uncertainty constraining non-oil activity. Growth in Algeria is forecast to slow in 2025, mainly because of weaker public investment driven by lower oil prices and revenues, despite a production increase (World Bank 2025j) An expected adjustment in oil productioncompensating for past over-production-and slower growth in non-oil activity are projected to moderate a rebound in activity in Iraq this year. In Libya, stronger growth in 2025 will be driven by an expansion of oil production and oil-related investments, assuming the maintenance of political stability.
In oil importers, growth is projected to pick up to 3.6 percent in 2025, 3.9 percent in 2026, and 4.3 percent in 2027, mostly owing to strengthening private consumption as inflation softens, a recovery in agricultural output, and assumed moderation of geopolitical tensions. In Egypt, growth is expected to inch up from 3.8 percent in FY2024/25 (July 2024 to June 2025) to 4 2
Growth in MNA is expected to strengthen to 2 7 percent in 2025 and to an average of 3 9 percent in 2026-27, driven mainly by a gradual expansion in oil production by oil exporters. In oil importers, growth is also expected to increase, supported partly by moderating inflation stimulating private consumption, even though fiscal policies are expected to become contractionary Lower oil prices will contribute to a decline in current account deficits in oil importers but shrink surpluses in oil exporters.
Source: World Bank. B. Fiscal balances
Current account balances
D. Headline inflation
Note: e = estimate; f = forecast. GCC = Gulf Cooperation Council; MNA = Middle East and North Africa.
A. Aggregates are calculated as weighted averages using GDP at average 2010-19 prices and market exchange rates as weights. Diamonds for January 2025 refer to data presented in the January 2025 edition of the Global Economic Prospects report.
B.-D. Aggregates are calculated as weighted averages using nominal GDP in U.S. dollars as weights.
percent in FY2025/26 and 4.6 percent in FY2026/27, reflecting stronger private consumption, higher private investment-spurred by the implementation of the investment deal with the United Arab Emirates and anticipated monetary easing-and a gradual rebound in manufacturing activity. Growth in Jordan is projected to pick up over the forecast horizon, benefiting from expected greater stability in the region.
Growth in Morocco and Tunisia is expected to pick up to 3.6 percent and 1.9 percent, respectively, in 2025, assuming an improvement in weather conditions that allows a recovery in agricultural production (Cali et al. 2025). Industrial activity is set to weaken in Morocco, partly reflecting lower
phosphate prices amid reduced external demand. In Djibouti, growth is projected to soften to a still-healthy 5.1 percent a year, on average, over the forecast period, fueled by port activity, export earnings, and major foreign investments in port infrastructure development.
In Lebanon, growth is projected to reach 4 7 percent this year, reflecting a rebound in tourism, a recovery in private sector activity, and a gradual increase in capital inflows, assuming the truce holds. In West Bank and Gaza, growth is expected to strengthen to 4 percent in 2026 and 16 percent in 2027 after a contraction of 1.6 percent in 2025, assuming reconstruction starts in 2026. Compared to previous projections, growth in 2026 has been downgraded by 12.5 percentage points, reflecting the recent resumption of violence, the lingering effects of the massive destruction of fixed assets in Gaza and mobility restrictions in West Bank, and resulting delays in expected reconstruction activity. In these two economies, the costs of recovery and reconstruction from the conflict are expected to be heightened (World Bank 2025k, 20251). In Syria, activity is forecast to expand this year after two years of negative growth, mainly reflecting the improvement of foreign relations with major economies. In contrast, given the security situation, GDP in the Republic of Yemen is projected to contract again this year (World Bank 2025m).
Fiscal deficits in GCC countries are expected to widen in 2025, with declines in revenue stemming from lower global oil prices outweighing reductions in expenditure. In 2026, oil revenues are projected to increase, but deficits are anticipated to remain, partly owing to spending pressures, including in Saudi Arabia. Fiscal deficits in nonGCC oil exporters are forecast to deteriorate, mainly reflecting the effect of lower oil prices on revenues. In Libya, larger oil receipts, due to production expansion, are expected to improve fiscal balances. Fiscal deficits in oil importers are projected to widen in 2025, partly because of Egypt's higher interest payments and decline in non-tax revenues after a significant one-time increase from the investment deal with the United Arab Emirates. Fiscal policies in other oil importers, including Djibouti, Jordan, Morocco,
and Tunisia, are expected to be contractionary this year. In 2026, deficits in oil importers are projected to decline slightly, as fiscal consolidation proceeds in Egypt in FY2025/26, by implementing a reduction in energy subsidies and enhancing tax revenue mobilization efforts.
GCC countries' current account surpluses are projected to shrink this year, with downward pressures on oil export receipts due to lower global oil prices (figure 2.4 2.C) In non-GCC oil exporters, current account balances are expected to deteriorate, mainly reflecting lower oil prices and a slowdown in oil exports, with increases in imports in Algeria and Iraq. In several oil importers, including Jordan, recoveries in tourism are expected to contribute to a shrinking of current account deficits, but in Morocco, increasing domestic demand is expected to contribute to a widening of its deficit In Egypt, the current account deficit is forecast to narrow in FY2025/26, partly reflecting lower oil and natural gas prices, sustained strong remittances, and a vibrant tourism sector. Additionally, the non-oil trade deficit is likely to decrease as the effects of clearing import backlogs from FY2024/25 subside
Inflation in GCC countries is projected to remain contained (figure 2.4.2 D) In contrast, it is expected to rise in non-GCC oil exporters, including the Islamic Republic of Iran, where rising fiscal and currency pressures are forecast to translate into rising prices In oil importers, inflation is anticipated to decline further, allowing central banks to lower interest rates in several of them, supporting activity
In oil importers, per capita income growth is projected to rise to 2 3 percent in 2025 and 2.8 percent a year, on average, in 2026-27, but the expected pace of growth is mixed across the group. Poverty rates will then increase this year in oil importers, particularly in PCS countries, including Syria and West Bank and Gaza Poverty is also expected to remain elevated in Egypt, partly owing to persistent, though reduced, inflation, especially for food Over 2026-27, poverty is forecast to decline gradually in oil importers, as per capita growth strengthens and inflationary pressures moderate.
Progress in reducing poverty will remain challenging in the longer term, absent structural reforms to lift growth and reduce labor market bottlenecks, especially in the context of a growing jobs challenge In several economies, including Algeria, Egypt, Morocco, and Tunisia, expected average annual growth in the working-age population over the forecast horizon exceeds the average annual employment growth seen over 2010-19.
Risks to the outlook are tilted to the downside. The possibility of an intensification of trade protectionist measures by the region's trading partners remains a key risk. Heightened uncertainty regarding global trade policies, if sustained for an extended period, could also dampen business confidence, reducing investment in the region. Tighter-than-expected monetary policies due to stronger global inflationary pressures could raise borrowing costs and lead to capital outflows and currency depreciations. In oil exporters, declines in oil prices beyond what is embedded in the baseline could reduce fiscal revenues and growth prospects. A re-escalation of armed conflicts in the region, as well as surges in domestic violence and social unrest, along with more frequent and severe natural disasters could also dampen activity in the region.
Unexpected shifts in global trade policy, particularly intensified protectionist measures by trading partners, including Europe and the United States, could not only have direct effects on the region's exports-especially in oil importers-but also could have severe indirect effects on the region's economies through reduced external demand, affecting oil exporters as well. In most economies in the region, the direct impact of U.S. trade policy shifts is likely to be limited, given the small shares of exports to that country (figure 2.4.3.A). However, the intensification of protectionist policies against major export destinations, specifically in Europe, could indirectly damage economic activity in the region.
The recently heightened level of global economic policy uncertainty could reduce activity, including investment, in the region. Elevated uncertainty, especially if it is sustained for a longer period,
While the increase in U.S. tariffs may have limited direct effects on most economies in the region, they could be indirectly affected through lower growth of global trade and output, highlighting the possible impact of a further escalation in trade barriers. Heightened policy uncertainty could reduce investor confidence, raising borrowing costs, particularly in oil importers, where interest rates are already expected to remain high. The impact of tightening financial conditions could be exacerbated in economies with already high financial sector vulnerabilities, including bank balance sheets burdened by extensive non-performing loans. As foreign aid has been critical in fragile economies, further reductions in assistance could significantly worsen the situation in these economies.
A Merchandise exports, by destination
B Interest rates and payments on public debt in oil importers
C. Nonperforming loans
D Official development assistance receipts, by donor
Sources: International Monetary Fund;Organisation for Economic Co-operation and Development; United Nations Conference on Trade and Development;World Bank.
Note : e = estimate; f = forecast. DJI = Djibouti; DZA = Algeria;GCC = Gulf Cooperation Council; IRO = Iraq;JOR = Jordan; LBN = Lebanon; LBY = Libya;MAR= Morocco; MNA = Middle East and North Africa; PSE = West Bank and Gaza; SYR = Syrian Arab Republic;TUN = Tunisia. Europe includes members of the European Union and the European FreeTrade Association European microstates. the United Kingdom and their dependentterritories.
A. Merchandise exports to the United States and Europe as a percent of GDP in 2024.
B. The effective interest rate is computed as interest payment divided bythe average of government debt at the end of the current and previous years. Aggregates are calculated as weighted averages using nominal GDP in U.S. dollars (tor the effective interest rate) and government revenues in U.S. dollars (tor interest payment) as weights.
C. Blue bars are for the latest period with data: 202404 for Iraq; 202403 for GCC and Jordan; 202402 tor Djibouti and West Bank and Gaza;202204 for Morocco;and 2022 for Algeria. Data tor GCC are computed as simple averages of data for Kuwait, Saudi Arabia,and the United Arab Emirates; a vertical yellow line shows the minimum-maximum range.
D. Gross official development assistance from donors,and receipts of remittances, asa percentof GDP in 2023.
could dampen business sentiment, resulting in reduced foreign investment in the region and increasing borrowing costs. In addition, increased trade policy uncertainty, such as the lack of clarity in future global trade arrangements, could lead to higher producer prices, as firms may raise prices to protect their profits amid reduced demand and
heightened uncertainty. It could subsequently bring about increases in consumer prices and inflation expectations
Global inflationary pressures could be higher, possibly triggered by price impacts of the rising trade restrictions and damage to global supply. A bout of higher inflation could pose substantial challenges to central banks and force a slowerthan-expected pace of monetary policy easing, especially if inflation expectations show signs of de-anchoring. The resulting higher borrowing costs would weigh on private consumption and investment and also raise costs to service public debt, particularly in oil importers, whose debtservicing burdens are projected to remain heavy (figure 2.4.3.B).
Tightening financial conditions, or weaker confidence, could also trigger capital outflows, particularly from countries in the region with weak and vulnerable financial sectors (figure 2.4.3.C). External financing needs remain large in several economies, and reduced access to foreign borrowing could dampen activity. In economies with constrained fiscal positions, further deteriorations of financial conditions could amplify macroeconomic vulnerabilities, raising inflation expectations.
In oil exporters, further declines in oil pricesresulting, for instance, from weaker global growth-and weaker demand from major export destinations, including China, could increase fiscal pressures and diminish growth prospects. While the phase-out of oil production cuts by OPEC+ members will benefit growth in oil exporters, lower oil prices could lessen the positive effects, including on revenue collection. If faced with a decline in oil revenues, several oil exportersincluding the GCC countries-particularly those more dependent on oil, might need to tighten fiscal policy, which would weaken growth and slow economic diversification efforts. In contrast, lower oil prices could mitigate fiscal and external
pressures in oil importers However, such benefits could be partially offset by lower remittances, as the GCC countries are major destinations of workers in most oil importers (Gatti et al. 2025)
A re-escalation of armed conflicts, including in West Bank and Gaza, and of attacks in the Red Sea, could worsen consumer and business sentiment, particularly in neighboring economies. It could also trigger a wider increase in policy uncertainty and a tightening of financial conditions, dampening investment and overall activity. Heightened levels of domestic violence and social unrest could weigh on productivity and investment, particularly in FCS economies, and also worsen food insecurity in these economies and undermine economic development. In FCS economies, official aid from donor countries and institutions tends to be larger than remittance inflows and has been critical in reducing poverty and accelerating growth and development (figure 2.4.3.D). Further shrinkage of such assistance could amplify the risks of growth slowdown and stalled poverty reduction
Many economies in the region are prone to severe weather events, including extreme heat, droughts, and floods, which could lower the growth of output and productivity Drought conditions could acutely affect economies with large agricultural sectors, including Morocco and Tunisia, worsening living standards and increasing poverty (World Bank 2025n). More frequent and widespread severe weather events could also cause food price spikes and exacerbate poverty and food insecurity. They could displace workers and reduce employment opportunities, while disruptions to schooling due to such events could impair learning, diminishing human capital over the long run. Other natural disasters, including earthquakes, could also cause massive and lingering humanitarian and physical capital losses, particularly in economies with limited fiscal and institutional capacity to maintain infrastructure.
(Real GDP growth at market prices in percent, unless indicated otherwise)
Source: World Bank.
Note: e = estimate; f = forecast. EMDE = emerging market and developing economy;GCC = Gulf Cooperation Council;GNFS = goods and non-factor services; MNA = Middle East and North Africa; PPP = purchasing power parity. World Bank forecasts are frequently updated based on new information and changing (global) circumstances. Consequently,projections presented here may differ from those contained in otherWorld Bank documents, even if basic assessments of countries' prospects do not differ atany given moment in time
1. GDP and expenditure components are measured in average 2010-19 prices and market exchange rates. Excludes Lebanon, the Syrian Arab Republic and the Republic of Yemen as a result of the high degree of uncertainty.
2. Aggregate includes all economies in notes 3 and 6 except Jordan, for which data limitations prevent the forecasting of GDP components.
3. Algeria, Bahrain, the Islamic Republic of Iran, Iraq, Kuwait, Libya, Oman, Qatar, Saudi Arabia, and the United Arab Emirates
4. Bahrain, Kuwait,Oman, Qatar, Saudi Arabia, and the United Arab Emirates
5. Algeria, the Islamic Republic of Iran, Iraq,and Libya.
6. Djibouti the Arab Republic of Egypt Jordan Morocco Tunisia and West Bank and Gaza.
(Real GDP growth at market prices in percent, unless indicated otherwise)
year basis
Source: World Bank.
Note: e = estimate; f = forecast. World Bank forecasts are frequently updated based on new information and changing (global) circumstances Consequently,projections presented here may differ from those contained in other World Bank documents, even if basic assessments of economies' prospects do not significantly differ at any given moment in time
1 Data are reported on a factor cost basis
2. Forecasts for Lebanon (beyond 2025), the Syrian Arab Republic (beyond 2025),and the Republic of Yemen (beyond 2026) are excluded because of a high degree of uncertainty Forecasts for Lebanon (2025) and the Republic of Yemen (2026) were not included in January 2025 Global Economic Prospects ; therefore,the differencesfrom January 2025 projection are not computed.
3. The fiscal year runs from March 21 to March 20 in the Islamic Republic of Iran,and from July 1to June 30 in the Arab Republic of Egypt.

Although growth in South Asia (SAR) is projected to remain the fastest among the emerging market and developing economy regions, regional prospects are dimming alongside a rise in global trade barriers and elevated uncertainty. Growth is expected to moderate to 5.8 percent in 2025, and then average 6.2 percent in 2026-27, remaining below the pre-pandemic average and limiting the scope to spur a rapid expansion in jobs. Regional per capita income growth is anticipated to average 5 percent over the forecast period; however, excluding India, the pace is projected to be far more tepid, implying weak progress in poverty reduction and per capita income catch-up gains. Risks to the growth outlook are tilted to the downside, with intensified trade barriers and heightened global policy uncertainty representing the most pressing risks. Other downside risks include a tightening ofglobal financial conditions-driven either by unexpectedly higher global inflation or a decline in global risk appetite-instability in the financial sector, surges in violence and social unrest, further declines in official aid, and extreme weather events.
After an unexpectedly weak outturn of 6 percent in 2024, activity in SAR is decelerating amid rising global trade barriers, heightened policy uncertainty, and financial market volatility. In India, growth moderated, reflecting a slowdown in investment on the demand side and a deceleration in industrial output growth on the supply side (figure 2.5.1.A). However, growth in construction and services acnv1ty remained steady, and agricultural output recovered from earlier severe drought conditions, supported by resilient demand in rural areas.
Growth in SAR excluding India has generally firmed. In Pakistan, growth is estimated to have inched up to 2.7 percent in FY2024/25 Quly 2024 to June 2025), from 2.5 percent in the previous fiscal year, with modest expansions in both agricultural production and industrial output. In several countries, including Bhutan, Maldives, and Sri Lanka, the tourism sector performed strongly in early 2025. Industrial output growth rebounded in Sri Lanka in 2024, backed by increasing construction activity, while hydropower produc-
tion in Bhutan gained steam, boosting cross-border sales and revenues. In Nepal, manufacturing production benefited from increased hydroelectricity generation.
However, in Bangladesh, growth is estimated to have slowed to 3 3 percent in FY2024/25 Quly 2024 to June 2025), mainly reflecting the adverse effects of political turmoil in 2024. Heightened uncertainty and increased input costs impeded private investment, while industrial output declined due to a slowdown in imports of capital goods.
Inflation in the region, on average, has declined gradually (figure 2.5 1.B) Headline inflation has recently been within central banks' target ranges or below the targets in most economies, allowing for policy interest rate cuts. In India, the policy rate, which had remained unchanged since early 2023, was lowered in early 2025. In Pakistan, headline inflation fell below 2 percent in early 2025, while Sri Lanka has experienced deflation since September 2024. However, in Bangladesh, headline inflation has remained persistently above target, even after several increases in interest rates last year.
Expansion of private sector credit by commercial banks has slowed in India, mainly reflecting the
Activity has moderated in India-South Asia 's largest economy-largely reflecting a slowdown in industrial production, offsetting steady services activity and the recovery in agricultural output. Inflation has declined in the region since early 2023, to rates within or below official target ranges in most countries. Although credit growth has weakened in most countries in the region, it strengthened in Pakistan and Sri Lanka as these economies recovered from earlier downturns Goods trade balances have worsened in several countries, in part reflecting a rise in trade barriers A Gross value added
account balances have improved m several countries in the region. However, India's merchandise trade deficit widened in April 2025, with imports-particularly of oil-increasing faster than exports, while services trade remained in surplus. In Pakistan, an increase in the merchandise trade deficit in April largely reflected a sharp decline in exports, which was in part attributable to increases in U S import tariff rates in early April (figure 2.5.1.D)
C. Credit to the private sector by commercial banks D. Merchandise trade balances
Sources : Haver Analytics; World Bank.
Note: BGD = Bangladesh; BTN = Bhutan; IND = India; LKA = Sri Lanka; MDV = Maldives; NPL = Nepal; PAK = Pakistan; SAR = South Asia.
A Percent change in non-seasonally adjusted real output (gross value added) from a yearearlier and contributionsof respectivecomponents.
B Percent change in headline consumer price index from a year earlier Aggregates are calculated as weighted averages, using nominal GDP in U.S dollars as weights Last observation is April 2025. Sample includes up to eight countries.
C. Percent change in non-seasonally adjusted real credit to the private sectorfrom a year earlier. Price levels are adjusted by headline consumer prices. Diamonds for 202401 refer to average growth from January to March 2024. Latest refers to: April 2025 for Maldives,Nepal,and Pakistan; March 2025 for Bangladesh India, and Sri Lanka;and November 2024 for Bhutan.
D. Merchandise trade balances in billions of U S. dollars. Last observation is April 2025.
central bank's efforts to curb risks from unsecured credit (figure 2.5. LC). Rising interest rates have led to softer credit growth in Bangladesh. In Nepal, bank credit expansion has remained low, due in part to subdued demand, while the quality of bank assets has deteriorated. In contrast, credit growth has increased in Pakistan and Sri Lanka, accompanied by recovering domestic demand and lower policy interest rates.
The region has seen solid inflows of remittances and large tourist revenues, contributing to reductions m external imbalances. Current
Growth in SAR is expected to slow to 5.8 percent in 2025, as rising trade barriers weigh on exports, dampen business confidence, and weaken investment in the region (figure 2.5.2.A; table 2.5.1). As a result, the forecast for SAR growth has been downgraded by 0.4 percentage point relative to previous projections. Growth is then set to increase to 6.2 percent a year, on average, in 202627, supported by improving activity in India and accelerations elsewhere, broadly consistent with the region's potential growth estimates (Kose and Ohnsorge 2024). Still, the pace of projected growth will make tackling the looming jobs challenge in SAR difficult. In some countries, including Pakistan, the expected average annual growth in the working-age population over the forecast period exceeds the average annual employment growth seen over 2010-19. Meanwhile, in other countries, including Bhutan and Sri Lanka, the challenge is associated with emigration, especially among skilled workers, partly due to limited employment opportunities
Excluding India, regional growth is forecast to inch up to 3.6 percent in 2025 and firm to 4.4 percent a year in 2026-27, on average. Compared with previous forecasts, the projection for 2025 is 0.4 percentage point lower, mainly due to weaker projected activity in major economies in the region The growth outlook assumes that the tariffs in place in late May will prevail for the rest of the forecast horizon.
India is projected to maintain the fastest growth rate among the world's largest economies, at 6.3 percent in FY2025/26 (April 2025 to March 2026; table 2.5.2) Nevertheless, the forecast for
growth in FY2025/26 has been downgraded by 0.4 percentage point relative to January projections, with exports dampened by weaker activity in key trading partners and rising global trade barriers. Investment growth is expected to slow, primarily reflecting a surge in global policy uncertainty. In FY2026/27 and FY2027/28, growth is expected to recover to 6 6 percent a year, on average, partly supported by robust services activity that contributes to a pickup in exports.
Growth in Bangladesh is projected to increase to 4.9 percent in FY2025/26 and 5.7 percent in FY2026/27. Despite rising global policy uncertainty, investment is expected to rebound, predicated on improving political stability and the successful implementation of reforms to strengthen the business environment and advance job creation. Resilient remittances and easing inflation are anticipated to contribute to stronger growth in private consumption, despite a slowdown in export activity due to weaker growth in major trading partners and higher trade barriers (Sharma et al. 2025).
In Pakistan, growth is expected to strengthen to 3.1 percent in FY2025/26 and 3.4 percent in FY2026/27. With inflation contained and borrowing costs declining, industrial and services activity is forecast to firm, and business confidence is anticipated to continue improving owing to reduced domestic policy uncertainty. However, projected growth will remain subdued, reflecting still-high-though easing-real interest rates and fiscal consolidation intended to mitigate vulnerabilities and rebuild policy buffers (World Bank 20250).
Growth in Sri Lanka is forecast to decelerate to 3.5 percent this year, reflecting the scarring effects of the crisis, structural impediments to growth, and heightened global economic uncertainty. In 2026-27, growth will moderate further to an average of 3.1 percent, with a slowdown in overall investment, while the adverse effect is projected to be eased by the implementation of structural reforms. In Maldives, GDP is expected to expand by 5.7 percent this year and then moderate to 5.3 percent in 2026, partly reflecting global trade uncertainty and a projected weakening in external demand. The forecasts are upgraded by 1 and 0 7
Growth in SAR is expected to moderate to 5 8 percent in 2025 and then strengthen to an average of 6 2 percent in 2026-27. Excluding India, growth in the region will be weaker over the forecast horizon While fiscal consolidation is forecast to proceed in India, fiscal policies elsewhere in the region are envisaged to support demand and activity. The region is projected to run modest current account deficits, with large merchandise trade deficits. Easing inflationary pressures are likely to bolster growth and contribute to the reduction in poverty.
percentage point for 2025 and 2026, respectively, relative to previous projections, mainly because of stronger tourism sector performance, supported by the completion of a new airport terminal, which will underpin a rise in tourist arrivals (World Bank 2025p).
In Nepal and Bhutan, growth is anticipated to strengthen over the forecast period Growth m Nepal is expected to rise to 5.2 percent in FY2025/26 (mid-July 2025 to mid-July 2026) and 5.5 percent in the following fiscal year. Services sector activity is expected to pick up, while further expansion of hydroelectricity generation will support the growth of industrial production and allow exports to neighboring
countries, including India (World Bank 2025q). In Bhutan, growth is projected to increase to 7 6 percent in FY2025/26 Ouly 2025 to June 2026)-1 percentage point higher than projected in January-mainly reflecting the commissioning of a large hydropower plant and stronger construction activity associated with new power plants, supporting investment and exports (World Bank 2025r)
Growth in Afghanistan 1s expected to remam subdued at 2.2 percent in FY2025/26 (late-March 2025 to late-March 2026), partly reflecting disruptions in aid from donor countries (World Bank 2025s). Assuming no further external shocks, growth is set to inch up to 2 5 percent a year, on average, over the following two fiscal years, supported by steady growth in agricultural output.
Fiscal consolidation is expected to continue in India over the forecast horizon, with growing tax revenues and declining current expenditures projected to contribute to a gradual decline in the public debt-to-GDP ratio. Elsewhere in the region, on average, primary deficits are likely to increase gradually, supporting activity in several economies (figure 2.5.2.B). Capital expenditures are forecast to increase in Bhutan and Nepal, while in Bangladesh, a projected decline in capital spending will be offset by increases in current expenditures, including subsidies. In contrast, fiscal consolidation is expected to continue in Sri Lanka. Overall fiscal deficits as a share of GDP are forecast to remain large in the region, partly due to elevated interest payments, including in Pakistan.
The region is forecast to run moderate current account deficits over the forecast horizon (figure 2.5.2.C). India's projected merchandise trade deficits are expected to be only partly offset by surpluses in the services trade. In SAR excluding India, current account deficits are anticipated to widen slightly in 2025, mainly due to an increase in merchandise trade deficits stemming from a slowdown in exports, despite stronger remittance inflows in most countries. The deficits will widen further in 2026 as imports increase amid recoveries in domestic demand in several countries, including Pakistan and Sri Lanka.
In most countries in the region, inflation is expected to ease over the forecast horizon, allowing monetary policy to become more supportive of activity (figure 2.5.2.D). In Bangladesh, inflation is projected to moderate from FY2025/26, leading to gradual monetary easing. In India, inflation will remain contained over the forecast horizon, assuming normal seasonal conditions. In contrast, in Pakistan and Sri Lanka, inflation is expected to increase amid strengthening demand (World Bank 2025t)
Per capita income growth in SAR is forecast to stabilize at 5 percent a year, on average, over 2025-27, further reducing poverty in the region Excluding India, per capita income growth is expected to accelerate from 2.1 percent in 2025 to 3 percent in 2027 However, the forecasts for per capita income growth in Bangladesh, Pakistan, and Sri Lanka are lower than the average growth rates in the decade preceding the COVID-19 pandemic, implying a slower pace of poverty reduction amid persistently high poverty rates. In addition, food insecurity will remain widespread, particularly in Afghanistan, exacerbated by a decline in aid flows.
Risks to the growth outlook are tilted to the downside. Key risks include a possible further intensification of trade barriers by major trading partners and heightened global trade policy uncertainty. Higher-than-expected global inflation and a decline in risk appetite could lead to a tightening of global financial conditions, potentially weakening regional currencies and causing capital outflows. Other downside risks include the possibility of a surge in violence and social unrest in the region, as well as more frequent and severe natural disasters.
Additional trade barriers could reduce the growth of global trade and external demand, lowering regional growth prospects. Because economies in the region are less open to global trade, the direct effects of such shifts in trade policy would likely be relatively small. However, the United States is a major export destination for several economies, including Sri Lanka (figure 2.5.3.A). In addition,
a surge in protectionist policies targeting other major export destinations, specifically in Europe, could indirectly hurt activity in the region.
Heightened global economic policy uncertainty could weigh on business and investor confidence, reducing investment, including foreign investment. It could also cause a tightening of financial conditions and lead to an increase in domestic borrowing costs. Heightened policy uncertainty could lead firms to delay investment and raise prices to maintain their profits amid reduced demand. An increase in producer prices could translate into higher consumer prices and inflation expectations, leading to tighter monetary policy stances and weighing on activity
Higher-than-expected global inflation-possibly arising from higher trade barriers and damage to global supply chains-or a sudden decline in global risk appetite could also cause the pace of monetary policy easing to slow and global financial conditions to tighten As a result, interest rates could rise, worsening debt-servicing dynamics (figure 2.5.3.B). Tightening global financial conditions could also trigger capital outflows from the region, particularly from economies with large macroeconomic vulnerabilities, including Maldives and Pakistan Unfavorable domestic developments, including an unexpected increase in inflation, could also result in large capital outflows (World Bank 2025u).
Pressures stemming from high government indebtedness could be amplified by instability in financial markets in the region. Market sentiment and funding pressures could worsen suddenly due to a change in global financial conditions, leading to a deterioration in commercial banks' balance sheets, which have weakened in some economies since the 2010s (figure 2.5.3.C). Such weakening in the banking sector could exacerbate fiscal vulnerabilities, particularly in economies where commercial banks hold a significant portion of public debt. Fragile financial systems could lead to reduced credit availability, with repercussions on economic activity. In addition, with limited fiscal space, delays in reform efforts to improve spending effectiveness and strengthen the financial sector could constrain the impact of increased
Additional trade tensions and a further increase in policy uncertainty could dampen external demand, particularly from major trading partners such as Europe and the United States Further increases in interest rates on public debt would increase debt-service burdens Financial system instability could exacerbate pressures related to high government indebtedness, especially because several economies have tight linkages between the government and the banking sector Foreign aid has been vital to several economies, and further reductions could weigh on development progress and weaken growth prospects
A. Merchandise exports, by destination
B. Effective interest rates on public debt
D Official development assistance receipts, by donor
Sources : International Monetary Fund;Organisation for Economic Co-operation and Development; United Nations Conference on Trade and Development;World Bank.
Note : e = estimate; f = forecast. AFG = Afghanistan; BGD = Bangladesh;BTN = Bhutan; IND = India; LKA = Sri Lanka; MDV = Maldives;NPL = Nepal; PAK = Pakistan;SAR = South Asia. Europe includes members of the European Union and the European Free Trade Association, European microstates, the United Kingdom,and their dependent territories.
A. Merchandise exports to the United States and Europe as a percent of GDP in 2024.
B. The effective interest rate is computed as interest payment divided bythe average of government debt at the end of the current and previous years.
C. Based on the Financial Soundness Indicators by the International Monetary Fund Blue bars are for the latest period with data:202404 for Maldives and Pakistan;202403 for Nepal;202402 for Bangladesh and Bhutan; 202304 for India;and 202303 for Sri Lanka.
D. Gross official development assistance from donors,and receipts of remittances,as a percentof GDP in 2023.
public investment, weighing on growth, including in Nepal.
Elevated domestic violence and social unrest, as well as the eruption of cross-border conflict, could weigh on investment and productivity, increase uncertainty, and weaken investor confidence, reducing foreign investment and weakening financial market performance in affected countries. The incidence of political violence has
increased in several countries in the region, and the region has experienced a number of large-scale protest events. These events could also destroy physical capital, including essential infrastructure, and disrupt businesses, causing economic losses and resulting in surges in food insecurity and poverty. Moreover, adverse effects could be more pronounced in countries with weak institutional frameworks and limited policy space (World Bank 2024f). If the incidence intensifies, increased military spending could deteriorate the fiscal position, possibly leading ro spending cuts in other areas, including growth-enhancing public investment. Any response perceived negatively by creditor countries could curtail access to external financing, increasing macroeconomic vulnerabilities, particularly in countries with high financing needs.
In several economies in the region-particularly Afghanistan and, to a lesser extent, Bhutan and Maldives-official aid from donor countries and institutions has exceeded remittance inflows and contributed significantly to improved living
standards and economic development (figure 2 5.3 D) Further reductions of foreign official assistance, beyond those recently announced, particularly from major donor countries, would likely weigh heavily on development progress in these economies.
More frequent extreme weather events could cause declines in food production, increasing inflation in food prices and dampening consumption The poor and vulnerable are disproportionately affected by higher prices as food accounts for a significant share of household consumption baskets across the region, resulting in an increase in poverty and inequality In addition, employment could be reduced due to the displacement of workers, while impaired learning through disruptions to schooling could diminish human capital over the long run. Other types of natural disasters, including earthquakes, could also cause major damage to infrastructure and lower growth and productivity, particularly in economies with limited capacity to maintain infrastructure (Dieppe, Kilic Celik, and Okou 2020).
(Real GDP growth at market prices in percent, unless indicated otherwise)
including
report
Source : World Bank
Note : e = estimate; f = forecast. EMDE =emerging market and developing economy; GNFS = goods and non-factor services; PPP = purchasing
frequently updated based on new information and changing (global) circumstances. Consequently. projections presented here
documents, even if basic assessments of countries' prospects do not differ atany given moment in time.
1 GDP and expenditure components are measured in average 2010-19 prices and market exchange rates Aggregates are presented in calendar year terms
2 Aggregate excludes Maldives, for which data limitations prevent the forecasting of GDP components.
3 The fiscal year runs from April 1to March 31.
(Real GDP growth at market prices in percent, unless indicated otherwise)
Source: World Bank.
Note: e =estimate; f =forecast. World Bank forecasts are frequently updated based on new information and changing (global) circumstances. Consequently,projections presented here may differfrom those contained in other World Bank documents,even if basic assessments of countries' prospects do not significantly differat any given moment in time
1. The fiscal year runs from March 21 to March 20 in Afghanistan; from April 1to March 31 in India; from July 1to June 30 in Bangladesh,Bhutan,and Pakistan; and from July 16 to July 15 in Nepal.
2. Estimates and forecasts were not included in January 2025 Global Economic Prospects; therefore the differences from January 2025 projections are notcomputed.
3. Data are reported on a factor cost basis.
Growth in Sub-Saharan Africa (SSA) is forecast to edge up from 3.5 percent in 2024 to 3. 7 percent this year and then average 4.2 percent in 2026-27 Growth this year and next is anticipated to be weaker than previously expected, owing to the deterioration in the external environment and domestic headwinds. Elevated government debt, still-high interest rates, and rising debt-servicing costs have narrowed fiscal space, prompting fiscal consolidation efforts in many countries, especially as financing needs remain high as international development assistance is cut back. Per capita income gains will remain inadequate to make significant progress in reducing extreme poverty in the region, which is home to most of the world's poor. Progress in these areas is likely to be impeded by the looming jobs challenge, which is expected to be the most acute in SSA relative to other regions, as the pace ofjob creation struggles to match the rapid expansion of working-age populations. Risks to the outlook remain tilted to the downside. The more significant risks are the possibility of weaker external demand in response to heightened trade policy tensions and a sharper-than-expected slowdown in China. Increased regional political instability poses an important risk to the growth outlook. Rising sovereign spreads and the possibility of higher-for-longer global interest rates, along with further reductions in donor support, risk pushing even more SSA economies into government debt distress. Intensification of ongoing droughts and greater frequency and intensity ofother adverse weather events represent persistent risks to the SSA outlook.
Growth in SSA picked up to an estimated 3.5 percent in 2024, largely owing to increased public investment and rising commodity exports. The strengthening in activity was broad-based, with over 60 percent of the region's economies experiencing an acceleration in growth. However, in the region's two largest economies-Nigeria and South Africa-growth diverged. Elsewhere in the region, growth improved overall. Angola's growth picked up, driven by commerce and transport services, diamond extraction, the oil industry, and fishing. Similarly, Ethiopia grew thanks to strong harvests, increased mining activity, and electricity generation. Survey data indicate that economic activity held up well in some of the major economies in the region in early 2025 (figure 2 6.1.A).
In Nigeria, growth rose to 3.4 percent in 2024, primarily driven by financial and telecommunica-
tion services, a recovery in the transportation sector, and a slight rebound in oil production. In response to high inflation, the central bank raised its policy rate six times last year. Although inflation has cooled somewhat in recent months, it remains elevated relative to the central bank target and pre-pandemic trends. Nigeria's fiscal position strengthened last year owing to a surge in revenues driven by the elimination of the implicit foreign exchange subsidy, ongoing improvements in revenue administration, increased revenues at the state level, and higher remittances from government-owned enterprises.
In South Africa, growth edged down in 2024 to 0.5 percent. Ongoing structural constraints, inefficient fiscal spending, and bad weather offset the boost to business activity from improved electricity supply, easing inflation, and lower monetary policy rates. Severe drought conditions caused by the 2023/2024 El Nino event contributed to the sharpest contraction in agricultural production in nearly three decades. Moreover, persistent structural constraints-especially transport bottlenecks, inefficient state-owned enterprises, and insuffi-
High-frequency data point to an improvement in private sector economic activity in some SSA economies in early 2025 Food price inflation remains a challenge in many SSA economies Droughts in Eastern Africa , especially in Kenya, Rwanda, and Uganda, have led to a sustained decline in agricultural conditions and crop yields , increasing pressure on food prices While monetary policy continues to ease, persistent inflation in some countries has pushed central banks to pause easing or to increase policy rates.
Composite Purchasing Managers' Indexes
Sources: Bloomberg; HaverAnalytics;The Humanitarian Data Exchange; USDA;World Bank. Note : GDP = gross domestic product; NDVls = normalized difference vegetation indices; PMI = purchasing managers' index;SSA = Sub-Saharan Africa
A. GDP-weighted average includes Ghana, Kenya,Mozambique, Uganda, and Zambia Last observation is April 2025
B. Change in food prices from 12 months earlier The sample includes 19 SSA EMDEs
C Chart shows the average changes in NDVls for countries in subregions where January to March overlaps with the main growing season. NDVls for each country are weighted by subnational region based on relative crop production using USDA weights. Eastern Africa sample includes Kenya, Rwanda, the Federal Republic of Somalia,Tanzania,and Uganda;Southern Africa sample includes Angola, Botswana, Democratic Republic of Congo, Madagascar, Mozambique, Malawi, South Africa, Zambia,and Zimbabwe.
D Median for the sample of 14 SSA EMDEs.
cient job creation-continued to impede economic activity as the industrial and construction sectors contracted.
Elsewhere in the region, growth in industrialcommodity-exporting countries, excluding Sudan, improved to 4.2 percent in 2024. In the Democratic Republic of Congo, growth was driven by the copper and cobalt extractive sector, which continued to expand at double-digit rates due to increased domestic production from the KamoaKakula mining project. By contrast, in Sudan and South Sudan, continued violent conflict caused output to contract for a third consecutive year,
leaving GDP 40 percent and 9 percent below the pre-conflict levels, respectively.
Growth in non-resource-rich countries dropped to 5.7 percent in 2024, mainly driven by a slowdown in Kenya-where growth eased to 4.7 percent as construction softened, and Zimbabwe-where growth more than halved to 2 percent due to a steep decline in agricultural output. However, two -thirds of non-resource-rich economies still experienced an uptick in growth Ethiopia's strong harvests, increased mining, and higher electricity generation helped offset the slowdown, while oilrelated investments boosted Uganda's growth above 6 percent.
Disinflation in SSA has stalled as consumer price inflation edged up in early 2025, driven by rising food prices (figure 2.6.1.B). Recent droughts in parts of Eastern Africa have worsened agricultural conditions, with falling crop yields increasing pressure on food prices and inflation (figure 2.6 1.C) Yet, central banks continued easing monetary policy as broader inflationary pressures waned (figure 2.6.1.D). Some large economies that experienced high inflation, such as Angola, Ethiopia, and Nigeria, have paused further policy rate hikes due to progress in the disinflation process.
Food insecurity remained elevated across the region in 2024, affecting almost a third of the population (Cardell et al. 2024). This partly reflects ongoing conflict in the region, as well as adverse weather events such as severe droughts in Southern Africa and floods elsewhere Continued violent conflict has exacerbated hunger vulnerability. In particular, more than half of the populations of South Sudan and Sudan suffered high levels of acute food insecurity in 2024, while the Federal Republic of Somalia and the Central African Republic faced persistently high levels of it (FSIN and GNAFC 2024).
Growth in SSA is forecast to firm to 3 7 percent in 2025 and strengthen to an average of 4.2 percent in 2026-27, assuming the external environment does not deteriorate further, inflation eases as anticipated, and conflict de-escalates (figure
2.6.2.A). Against a backdrop of weakening EMDE growth, SSA is one of two regions where growth is projected to increase through the forecast horizon. However, this growth is expected to fall short of its long-term average over 2000-19, and it is insufficient to make significant strides in reducing extreme poverty. Moreover, growth projections have been revised down by 0.4 percentage point for 2025 and 0.2 percentage point for 2026 (figure 2 6 2 B) The region's outlook has worsened following the deterioration in global conditions, dampened by the rise in trade barriers, heightened trade policy uncertainty, and weakening confidence. Although the direct effects of escalating trade tensions and a weakening global investor appetite are expected to be moderate, the outlook for SSA is affected by global spillovers from these shocks, primarily through lower global commodity demand.
The baseline projections assume that the tariffs in place as of late May will prevail for the rest of the forecast horizon. The regional outlook is also predicated on a gradual easing of monetary policy interest rates within the region, which should bolster private consumption and investment. However, elevated public debt and high borrowing costs necessitate continued fiscal consolidation efforts, which will weigh on demand. Fiscal balances are expected to improve, with the average primary fiscal deficit projected to reach balance within the forecast horizon This reflects budgetary discipline in 2024 and narrowing primary deficits in non-resource-rich countries. However, weaker export demand means revenues for commodity exporters are set to fall, increasing pressure on their public finances Furthermore, interest rate burdens across the region are set to rise further in 2025, partly offsetting the expected improvements in primary fiscal balances (figure 2.6.2.C).
Growth in Nigeria is forecast to strengthen to 3.6 percent in 2025 and to an average of 3.8 percent in 2026-27. Following monetary policy tightening in 2024 to address rapid currency depreciation, inflation is projected to decline gradually. Domestic reforms have helped spur investment, supporting growth in the services sector, especially in financial services and information and communication technology. Services activity will continue
Growth in SSA is forecast to pick up in 2025 and further firm in 2026-27 as industrial-commodity-exporting economies recover, while non-resourcerich countries are expected to expand above their long-term trend rates. However, revisions to growth forecasts relative to previous projections are generally downward. While primary fiscal balances are expected to improve amid continued consolidation efforts and firming growth, interest rate burdens are likely to weigh on public finances. Per capita incomes in the region are projected to rise at a faster pace in the forecast horizon, but the income gap with other EMDEs excluding China and India is set to widen.
A. Growth in SSA
B. Revisions to growth forecasts relative to January 2025
C. Interest rate payments burden
D. Per capita GDP
Sources: International Monetary Fund; J.P. Morgan; World Bank.
Note: e = estimates;f = forecast. EMDEs = emerging market and developing economies; GDP = gross domestic product; SSA = Sub-Saharan Africa
Industrial-commodity exporters exclude Nigeria, South Africa, and Sudan. Non-resource-rich countries represent agricultural-commodity-exporting and commodity-importing countries.
A. Aggregate growth rates are calculated using constant GDP weights at average 2010-19 prices and market exchange rates.
B. Revisions relative to forecasts published in the January 2025 edition of the Global Economic Prospects report.
C. Bars show interest payments as a share of government debt. Simple averages of country groupings. The sample includes 45 SSA economies. Blue whiskers represent the sovereign spreads of a sample of 14 SSA economies. Last observation is May29,2025.
D. Chart shows the evolution of real percapita GDP in constant U.S. dollars at average 2010-19 prices and market exchange rates, rebased to 100 in 2019. SSA comprises 47 countries.
to be the main driver of growth, while the industrial sector will remain constrained by subdued crude oil production as last year's slight rebound wanes
Growth in South Africa is projected to improve marginally to 0.7 percent in 2025 and to increase to a still weak average of 1.2 percent in 2026-27. For 2025 and 2026, this represents an average downgrade of 1 percentage point a year from previous forecasts. The significant downward
The direct impact on SSA growth of further escalation in global trade tensions may be contained owing to the limited direct exposure to export markets in China and the United States, apart from commodity demand. Levels of violence in SSA remain high, weighing on economic activity. While public debt-to-GDP ratios are expected to decline gradually, debt servicing costs remain elevated, limiting fiscal space in many SSA economies for development-promoting expenditures, especially given the recent rise in sovereign spreads. Further declines in official development assistance inflows risk worsening humanitarian and fiscal challenges. The share of the population affected by adverse weather events, which destroy crops and dampen economic activity, has increased sharply in recent years
revision throughout the forecast horizon reflects a more challenging environment marred by global trade tensions, rising export tariffs, and low potential growth. Despite the growth downgrades, the weak recovery will be supported by rising consumption and investment amid a more accommodative monetary policy stance in the context of subdued inflation. Increased energy availability and improvements in freight transport infrastructure and logistics are also expected to underpin activity. Additionally, several planned reforms aim to strengthen the capacity of local governments to deliver better social services and infrastructure to firms and households.
events
Sources : ACLED (database); EM-DAT (database); International Monetary Fund; J P. Morgan; World Bank.
Note: e = estimates; EMDE= emerging market and developing economy; FCS = fragile and conflictaffected situations; f = forecast; GDP= gross domestic product;GNI = gross national income; LICs = low-income countries; SSA = Sub-Saharan Africa
A Share of total exports by destination. Data from 2024 (estimates) Sample includes 48 SSA countries.
B Three-month moving av erage Violent events include battles,explosions,riots,and violence against civilians Last observation is April 2025.
C Simple averages of country groupings The sample includes 45 SSA economies Industrialcommodity exporters exclude Nigeria and South Africa Non-resource-rich countries represent agricultural-commodity-exporting and commodity-importing countries.
D Ten-yearsovereign spreads of government bonds ov er 10-yearU S treasuries The EMDE excluding SSA median is from a sample of 56 EMDEs and the SSA median is from a sample of 14 SSA economies. Data are shown as 5-day moving averages The last observation is May29 2025
E Median of official developmentassistance. The blue line shows the median across 45 SSA economies; the red line shows the median across 20 FCS economies in SSA F Bars indicate the percentage of the population affected
While non-resource-rich countries are expected to expand above their long-term trend rates, growth in industrial-commodity exporters is expected to lag, given that rising trade tensions are set to weigh on external demand. Growth in industrialcommodity exporters, excluding the region's two largest economies and Sudan, is projected to decelerate to 3.6 percent in 2025, before recovering to an average of 4.4 percent a year in 2026-27. In Angola, slower growth in oil output is expected to be partly offset by non-oil activity. In particular, service activity is set to benefit from further moderation in inflation. Conversely, in non-resourcerich countries, growth is forecast to steady at 5 7 percent in 2025 and to an average of 6.1 percent a year in 2026-27 The momentum is driven by an oil discovery boom in Uganda, where oil production is expected to start during the forecast horizon, as growth plateaus in most other economies.
Per capita income in SSA is projected to expand by an average of 1.6 percent a year in 2025-27, with growth in 2025 revised down by 0.4 percentage point. This pace would mean that, in terms of living standards, the region would fall even further behind other emerging markets and developing economies, excluding China and India (figure 2 6.2 D). These per capita income gains will remain inadequate for significantly reducing extreme poverty in the region, home to most of the world's poor. Per capita income growth in SSA is also expected to remain uneven, with incomes falling in some countries, particularly those plagued by violent conflict By 2027, per capita income in over one-fourth of the region's economies will not
have recovered to their pre-pandemic levels. Lifting per capita incomes and reducing extreme poverty in the region are likely to remain difficult as the jobs challenge intensifies in the coming years. The projected increase in SSA's working-age population is set to rise rapidly over the next five years and almost double between 2025-50, the largest numerical increase that any region has recorded over a 25-year period. Absent the policies needed to reinvigorate growth and address longstanding structural bottlenecks, it is unlikely that economies in SSA will be able to generate the job growth needed to keep pace with this unprecedented expansion in the region's working-age population.
Risks to the SSA growth outlook are tilted to the downside. Global growth could be weaker than projected if global trade tensions were to escalate further (chapter 1). The direct effects of the increased U.S. trade barriers on SSA economies are expected to be contained, as the region exports relatively few manufacturing goods to the United States (figure 2.6.3.A). However, should trade fragmentation increase further or lead to a sharper slowdown in global growth, the adverse effects on SSA economies could be considerable due to their dependence on commodity trade (Bolhuis et al. 2024). Indeed, a worse-than-expected economic slowdown in China would adversely affect the demand for minerals and metals. Lower prices for these commodities, which are the main exports of several SSA countries, would have particularly negative effects on these countries through diminished economic activity and even tighter fiscal space. Conversely, should global trade tensions subside, the growth outlook for SSA would benefit from improved global economic activity, lower export tariffs, higher demand for commodities, reduced uncertainty, and stronger global investors' risk appetite.
Another prominent downside risk is the possibility of worsening political instability within SSA, with violent conflicts lasting longer or escalating further, especially in East Africa and the Sahel. An intensification of armed conflict in Sudan could drive up food prices in parts of SSA due to re-
duced supply and increased transportation costs. The conflict in the eastern part of the Democratic Republic of Congo, which started in 2022, adds to the humanitarian challenges in the region. Even without these conflicts escalating, food insecurity in SSA is expected to exceed that in other regions over the next decade (Cardell et al. 2024). Further destabilization of East and Central Africa could result in a rise in violence that would lead to extended humanitarian crises in many of SSA's most economically vulnerable countries (figure 2.6.3.B).
The rise of protests and social unrest in the region is also a byproduct of insufficient economic opportunities and inadequate public service provision (World Bank 2025v). Besides the risk of rising food price inflation from intensifying conflicts, broader inflationary pressures could be reignited by disruptions to international trade.
If regional or global policy interest rates decline more slowly than expected, there may be adverse effects on debt-servicing costs and debt dynamics Similarly, a decrease in global investors' risk appetite could increase the costs of debt refinancing. Coping with high debt servicing costs is already a challenge for many countries in the region (figure 2 6.3 C) Persistently high global interest rates could heighten the risk of government debt distress by further increasing interest rates on nonconcessional debt. Indeed, heightened global uncertainty and reduced investor risk appetite have already led to sharp jumps in the cost of government borrowing in SSA, putting at risk the recent progress in fiscal consolidation. Following the surge in trade tensions and uncertainty in April, the median SSA sovereign spreads jumped by almost 300 basis points but later retreated somewhat, highlighting the vulnerability of financial conditions in the region to external conditions (figure 2.6.3.D).
Fiscal challenges in SSA countries could be further exacerbated by reductions in donor support, which could also worsen humanitarian conditions, especially in the region's poorest countries. Although reliance on international aid has declined materially since the 1990s and early 2000s, further withdrawals of donor support could jeopardize debt sustainability in several of the poorest countries in the region and add to humanitarian cha!-
lenges, especially in countries that face fragile and conflict-affected situations (figure 2.6.3.E).
The SSA region has become more vulnerable to extreme weather events related to climate change, with the number of droughts, Roods, and storms more than doubling from 2015-19 to 2020-24 (figure 2 6 3 F) This vulnerability is especially pronounced in the Horn of Africa, the Sahel, and Southern Africa, where recurring drought cycles
TABLE 2.6.1 Sub-Saharan Africa forecast summary
(Real GDP growth at market prices in percent, unless indicated otherwise)
have devastated livestock and crops (FAO et al. 2023). In particular, a further increase in the frequency or severity of these weather events would exacerbate poverty across fragile economies like Niger, and Mozambique, and South Sudan, with low-income agrarian communities hit particularly hard In the longer term, increases in average temperatures could hurt crop yields across the region, reducing food supplies and exports while worsening food insecurity.
Percentage-point differences from January 2025 projections
(Average including countries that report expenditure components in national accounts) 2
Source: World Bank.
Note: e = estimate; f = forecast. PPP = purchasing power parity; EMDE = emerging market and developing economy. World Bank forecasts are frequently updated based on new information and changing (global) circumstances. Consequently,projections presented here may differfrom those contained in otherWorld Bank documents, even if basic assessments of countries' prospects do not differat any given moment in time.
1. GDP and expenditure components are measured in average 2010-19 prices and market exchange rates.
2. Subregion aggregate excludes the Central African Republic, Eritrea,Guinea, Nigeria, Sao Tome and Principe, Somalia, and South Sudan, for which data limitations prevent the forecasting of GDP components.
3. Subregion growth rates may differfrom the most recent edition of Africa's Pulse (https://www.worldbank.org/en/publication/africa-pulse) because ofdata revisions.
4. Exports and imports of goods and nonfactor services (GNFS).
5 Includes Angola,Cameroon,Chad, the Republic of Congo,Equatorial Guinea,Gabon,Ghana, Nigeria,and South Sudan.
6. The African Financial Community (CFA) franc zone consists of 14 countries in Sub-Saharan Africa, each affiliated with one of two monetary unions The Central African Economic and Monetary Union (CEMAC) comprises Cameroon the Central African Republic Chad, the Republic of Congo Equatorial Guinea and Gabon; the West African Economic and Monetary Union (WAEMU) comprises Benin Burkina Faso, C6te d'Ivoire Guinea-Bissau Mali Niger Senegal and Togo
TABLE 2.6.2 Sub-Saharan Africa country forecasts 1
Source: World Bank.
Note: e = estimate; f = forecast. World Bank forecasts are frequently updated based on new information and changing (global) circumstances. Consequently projections presented here may differfrom those contained in other Bank documents, even if basic assessments of countries prospects do not significantly differat any given moment in time.
1. Data are based on GDP measured in average 2010-19 prices and market exchange rates.
2. Fiscal-year-based numbers.
ACLED (Armed Conflict Location & Event Data Project) database. Accessed on May 30, 2025. https:// adeddata.com/data-export-tool/.
Atamanchuk, M., A. Hajdenberg, D Kadissi, G. Lisi, and N. H. Rao. 2025. "Drivers of Inflation in the Caucasus and Central Asia." IMF Working Paper 25/3, International Monetary Fund, Washington, DC.
Bolhuis, M., H. Mighri, H. Rawlings, I. Reyes, and Q. Zhang. 2024. "How Vulnerable Is Sub-Saharan Africa to Geoeconomic Fragmentation?" IMF Working Paper 24/83, International Monetary Fund, Washington, DC.
Cali, M., M. H. Zitouna, J. Abidi, R. Ammari, A. Bouraoui Khouja, and M. Ben Salah 2025. Tunisia Economic Monitor: Better Connectivity to Grow Spring. Washington, DC: World Bank.
Cardell, L., Y. A. Zereyesus, K. Ajewole, J. Farris, M. E. Johnson, J. Lin, C. Valdes, and W. Zeng. 2024. International Food Security Assessment, 2024-34 (GFA-35) U.S Department of Agriculture, Economic Research Service
Cazzaniga, M., F. Jaumotte, L. Li, G. Melina, A. J. Panton, C. Pizzinelli, E. J. Rockall, and M. Mendes Tavares. 2024. "Gen-Al: Artificial Intelligence and the Future of Work." IMF Staff Discussion Note 2024/001, International Monetary Fund, Washington, DC.
Dalvit, N., R. De Hoyos, L. Iacovone, I. Pantelaiou, A. Peeva, and I. Torre. 2023. The Future of Work: Implications for Equity and Growth in Europe. Washington, DC: World Bank.
Dieppe, A., S. Kilic Celik, and C. Okou. 2020. "Implications of Major Adverse Events on Productivity." Policy Research Working Paper 9411, World Bank, Washington, DC.
EBRD (European Bank for Reconstruction and Development). 2025. "Regional Economic Prospects: Weaker Momentum amid Fragmenting Trade and Investment." European Bank for Reconstruction and Development, London.
EM-DAT (The International Disaster Database) database. Centre for Research on the Epidemiology of Disasters (CRED), UCLouvain, Brussels. Accessed on May 30, 2025. https://emdat.be.
FAO, IFAD, UNICEF, WFP, and WHO. 2023. The State of Food Security and Nutrition in the World
2023. Urbanization, Agrifood Systems Transformation, and Healthy Diets across the Rural-Urban Continuum. Rome: FAO
FSIN (Food Security Information Network) and GNAFC (Global Network Against Food Crises). 2024. Global Report on Food Crises 2024. Rome: Food Security Information Network and Global Network Against Food Crises
Gatti, R., H. Onder, A. M. Islam, J. Torres, G. Mele, F Bennett, S. Chun, R Lotfl, and I. Suvanov 2025. Shifting Gears: The Private Sector as an Engine of Growth in the Middle East and North Africa. MENA Economic Update. April. Washington, DC: World Bank.
Gorodnichenko Y., I. Korhonen, and E. Ribakova. 2024. "The Russian Economy on a War Footing: A New Reality Financed by Commodity Exports." CEPR Policy Insights 131, Center for Economic and Policy Research, Washington, DC.
Iacovone. L, I. V. Izvorski, C. Kostopoulos, M. M. Lokshin, R. Record, I. Torre, and S. Doczi. 2025. Greater Heights: Growing to High Income in Europe and Central Asia. Europe and Central Asia Studies. Washington, DC: World Bank.
IEA (International Energy Agency). 2025. Oil Market Report. May. Paris: International Energy Agency.
Korhonen I., H Simola, and L. Solanko. 2025 "The Impacts of War on Russia's Economic Future." BOFIT Policy Brief 2025 No. 4, Bank of Finland.
Kose, M A., and F Ohnsorge, eds 2024. Faffing LongTerm Growth Prospects: Trends, Expectations, and Policies Washington, DC: World Bank.
Macro Poverty Outlook (database). "Country-byCountry Analysis and Projections for the Developing World " World Bank. Accessed on May 30, 2025. https://www.worldbank.org/en/publication/macropoverty-outlook.
Sharma, D., N. S. Khan, M. S. Naoaj, T. Ono, S. A. Jahan, R. Ghosh, and F. Jonaed 2025. Bangladesh Development Update: Special Focus-Restoring Financial Sector Stability. April. Washington, DC: World Bank.
Trebesch, C., A. Antezza, K. Bushnell, A. Frank, P. Frank, L. Franz, I. Kharitonov, B. Kumar, E. Rebinskaya, and S. Schramm. 2023. "The Ukraine Support Tracker: Which Countries Help Ukraine and How?" Kiel Working Paper 2218, Kiel Institute for the World Economy, Kiel, Germany.
World Bank. 2022. Kazakhstan-Country Climate and Development Report. CCDR Series. November. Washington, DC: World Bank.
World Bank. 2024a. Mongolia Country Climate and Development Report. CCDR Series. Washington, DC: World Bank.
World Bank. 20246. East Asia and Pacific Economic Update: jobs and Technology. October. Washington, DC: World Bank.
World Bank. 2024c. Bosnia and Herzegovina-Country Climate and Development Report. CCDR Series. November. Washington, DC: World Bank.
World Bank. 2024d. Tajikistan-Country Climate and Development Report. CCDR Series. November. Washington, DC: World Bank.
World Bank. 2024e. Digital Progress and Trends Report 2023. Washington, DC: World Bank.
World Bank. 2024f. Women, jobs, and Growth. South Asia Development Update, October. Washington, DC: World Bank.
World Bank. 2025a. East Asia and Pacific Economic Update: A Longer View. April. Washington, DC: World Bank.
World Bank. 20256. Taking Stock: Electrifying journeys, £ -mobility Transition in Viet Nam. March. Washington, DC: World Bank.
World Bank. 2025c. Thailand Economic Monitor: Unleashing Sources of Growth: Innovation, SMEs and Startups. February. Washington, DC: World Bank.
World Bank. 2025d. Commodity Markets Outlook. April. Washington, DC: World Bank.
World Bank. 2025e. Ukraine Rapid Damage and Needs Assessment (RDNA4), February 2022-December 2024. Washington, DC: World Bank.
World Bank. 2025f. Adapting far Sustainable Growth. Western Balkans Regular Economic Report 27. April. Washington, DC: World Bank.
World Bank. 2025g. Accelerating Growth through Entrepreneurship, Technology Adoption, and Innovation. Europe and Central Asia Economic Update. April. Washington, DC: World Bank.
World Bank 2025h. Global Economic Prospects. January. Washington, DC: World Bank.
World Bank. 2025i. Latin America and the Caribbean Economic Review. April. Washington, DC: World Bank.
World Bank. 2025j. Algeria Economic Update: Accelerating Productivity Gains far Diversified and Resilient Growth. Spring. Washington, DC: World Bank.
World Bank. 2025k. Lebanon Rapid Damage and Needs Assessment (RDNA). March. Washington, DC: World Bank.
World Bank. 20251. Impacts of the Conflict in the Middle East on the Palestinian Economy. April. World Bank Economic Monitoring Report. Washington, DC: World Bank.
World Bank. 2025m. Yemen Economic Monitor: Persistent Fragility amid Rising Risks. Spring. Washington, DC: Wodd Bank.
World Bank. 2025n. Morocco Economic Monitor: Prioritizing Reforms to Boost the Business Environment. Winter. Washington, DC: World Bank.
World Bank. 20250. Pakistan Development Update: Reimagining a Digital Pakistan. April. Washington, DC: Wodd Bank.
World Bank. 2025p. Maldives Development Update. April. Washington, DC: World Bank.
World Bank. 20259. Nepal Development Update: Leveraging Resilience and Implementing Reforms far Boosting Economic Growth. April. Washington, DC: World Bank.
World Bank. 2025r. Bhutan Development Update: Bridging the Future-Addressing Challenges and Harnessing Opportunities of Migration. Spring. Washington, DC: World Bank.
World Bank. 2025s. Afghanistan Development Update: Unlocking Youth Potential far Resilience and Economic Recovery. April. Washington, DC: World Bank.
World Bank. 2025t. Sri Lanka Development Update: Staying on Track. April. Washington, DC: World Bank.
World Bank. 2025u. South Asia Development Update: Taxing Times. April. Washington, DC: World Bank.
World Bank. 2025v. Africa's Pulse: Improving Governance and Delivering far People in Africa Spring. Washington, DC: Wodd Bank.
Foreign direct investment (FD!) inflows to emerging market and developing economies (EMDEs) have steadily weakened, to about 2 percent of GDP in the last several years-less than half the share at the peak in 2008. This trend jeopardizes economic development. FD! inflows are a vital source offunding to catalyze economic growth, facilitate domestic private capital mobilization, and create jobs. FD! inflows are especially critical for low-income countries (LICs), where domestic capital resources are scarce and infrastructure gaps are vast In the average EMDE, a 10-percent increase in net FD! inflows is associated with a GDP boost of 0.3 percent after three years. The effects rise to 0. 8 percent in countries with greater trade openness, stronger institutions, better human capital development, and lower informality. FD! inflows to EMDEs-composed mostly of greenfield investment-are strongly correlated with economic growth and international trade. Because of elevated trade tensions, policy uncertainty, and heightened macroeconomic and geopolitical risks, the outlook for FD! flows remains subdued. Policy makers in EMDEs need to accelerate domestic reforms that will help attract FD! and amplify its benefits. All countries need to work to advance global cooperation to uphold a rules-based system that promotes cross-border investment and trade flows.
Investment growth across the world has trended down since the 2008-09 global financial crisis. 1 In emerging market and developing economies (EMDEs), the average annual investment growth rate halved, dropping from about 10 percent in the 2000s to 5 percent in the 201 Os-the slowest pace in three decades, reflecting weakness in both public and private investment growth (World Bank 2024a). The slowdown occurred in all EMDE regions and income groups, and in commodity-exporting and commodity-importing countries (Kose and Ohnsorge 2023).
The prolonged and widespread investment weakness in EMDEs has contributed to a large backlog of unmet infrastructure needs. Weak investment growth is undermining efforts to achieve key development goals, including tackling climate change and accelerating the energy transition, and reducing poverty and inequality. By some estimates, EMDEs need to invest at least an additional 1.4 percent of GDP through 2030 just to address climate change and the energy transition. These needs are especially large in lowincome countries (LICs), which are estimated to require an additional annual investment of 8 percent of GDP through 2030 (World Bank 2022a).
Note: This chapter was prepared by Amat Adarov and Hayley Pallan, with contributions from Peter Pedroni.
1 Investment refers to gross fixed capital formation. For derails about the slowdown in investment growth, see World Bank (2023a, 2024a). On investment needs, see Kase and Ohnsorge (2023), Rozenberg and Fay (2019), and World Bank (2022a).
Foreign direct investment (FOi), which has averaged almost $2 trillion per year globally during the past decade, can be an important source of financing investment needs in EMDEs, especially in countries with scarce domestic capital and large infrastructure gaps. For instance, over the period 2012-23, net FOi inflows in the median EMDE averaged about 3 percent of GDP-similar to the average levels of remittance inflows or net official development assistance (ODA) inflows-while portfolio inflows amounted to less than 1 percent of GDP over the same period in a typical EMDE. 2 However, the potential benefits of FOi extend far beyond the provision of funding. FOi inflows can spur technology spillovers, efficiency gains, job creation, and productivity improvements, leading to higher workers' compensation. FOi also enables domestic firms to access cross-border production networks and markets. As a result, FOi can boost economic growth and foster equitable economic development, helping recipient economies address poverty and inequality, and bridge gender gaps.
2 The analysis in rhis chapter focuses on net FOi inflows (gross FOi inflows less disinvestment), unless otherwise stared. The data on net FOi inflows are from the World Bank's World Development Indicators (WO[) database. FOi is defined as cross-border investment made by a resident in one economy in an enterprise residing in anorher economy, with the objective of establishing a lasting interest This definition follows rhe OECD Benchmark Definition of FOi (OECD 2009, 2025), which sets a consolidated framework for compiling FOi statistics and discusses specific criteria for determining the lasting interest, measurement issues, taxonomy, and other conceptual aspects. For measurement issues, including roundtripping and phantom FOi, see also Aykur, Sanghi, and Kosmidou (2017) and Damgaard, Elkjaer, and Johannesen (2024).
FDI inflows bring private long-term capital to the recipient economy from abroad, while also promoting domestic private capital mobilization. FDI can spur the modernization of infrastructure and encourage the provision of goods and services by foreign-owned firms to domestic companies, thereby enabling and expanding their business operations and inducing additional investment. FDI signals profitable investment opportunities, which can crowd in private investment by domestic and foreign invesrors. FDI can also aid the transition to cleaner energy and facilitate adaptation to climate change in EMDEs, by channeling capital to sustainable projects and climate-resilient infrastructure and by transferring environmentally friendly technologies and business practices.
The sharp increase in global FDI flows during the 2000s coincided with a growth acceleration in many EMDEs. However, this period was followed by a broad-based slowdown in FDI inflows during the 201 Os as macroeconomic shocks and structural headwinds to investment were accompanied by a rise in global economic fragmentation fueled by concerns about access by foreign firms to domestic assets and sectors sensitive from a national security standpoint. Heightened trade tensions and fragmentation, alongside policy uncertainty and macroeconomic risks, are likely to continue to weigh on investment flows and reshape global FDI patterns-posing challenges for EMDEs and calling for prompt policy action
Against this backdrop, this chapter presents a comprehensive assessment of FDI inflows to EMDEs. The analysis addresses the following main questions:
How have global FOi flows evolved, particularly to EMOEs?
What are the macroeconomic implications of FOi for EMDEs?
What are the main factors driving FOi?
What policies can help EMDEs attract FOi and maximize its benefits?
The chapter makes several contributions to the literature:
Examination of FD! trends with a special focus on EMDEs. The literature on FOi has mostly explored short-run dynamics and has devoted limited attention to EMDEs. This chapter offers a broader historical perspective on the evolution of FOi and examines the principal differences in FOi between EMDEs and advanced economies It also analyzes the evolution of FOi during major adverse events, such as recessions and financial crises.
Examination of the macroeconomic implications of FDI The chapter provides a detailed account of the macroeconomic effects of FOi with a focus on EMDEs, including its implications for economic growth and the energy transition. The analysis examines a wide range of effects across EMDEs and identifies the conditions under which the benefits of FDI have been greatest.
Analysis of the key factors driving FDI The chapter offers a detailed analysis of push, pull, global, and bilateral drivers of FDI, including the implications of international integration and fragmentation. Although previous research has analyzed many of these factors separately, this chapter integrates them into a consistent empirical framework using consolidated bilateral FOi data for a large sample of countries over a period of several decades.
Priorities for national and global policy makers. The chapter presents a detailed set of policy interventions that governments in EMDEs can pursue to attract FOi and maximize its benefits in the context of arising challenges. It also examines global policy priorities needed to facilitate cross-border cooperation and reduce the potential costs of global economic fragmentation.
The chapter presents the following key findings:
FDI inflows to EMDEs as a share of GDP have weakened considerably, halving in 2012-23 relative to 2000-11. Net FOi inflows as a share of
GDP in EMDEs have trended downward since the global financial crisis, reversing a prior twodecade rise driven by rapid financial integration, international trade growth, and the expansion of global value chains. During the boom years of 2000-08, FOi inflows to EMDEs grew fivefold, and their share of global FOi expanded from onetenth to one-third. Since 2008, the nominal value of FOi inflows to EMDEs has averaged about $700 billion per year, yet inflows relative to EMDEs' GDP have declined significantly. In the typical EMDE, the FOi-to-GDP ratio peaked at about 5 percent in 2008 but has since more than halved, standing at just over 2 percent in 2023. Three-fifths of EMDEs experienced a decline in FOi inflows in 2012-23 relative to 2000-11. Recent FOi project announcements suggest a decline in greenfield FOi inflows to EMDEs in 2024 by almost one-quarter relative to 2023.
FDI inflows to EMDEs are highly concentrated in a few large economies. Over two-thirds of total FOi inflows to EMDEs are received by just ten countries. During 2012-23, about one-third of net FOi inflows to EMDEs went to China-the largest recipient country. The other largest destinations, Brazil and India, jointly received about one-sixth of FOi inflows to EMDEs. LICs accounted for just 2 percent of FOi inflows to EMDEs and less than 1 percent of global FOi inflows.
FDI inflows to EMDEs are nearly all greenfield investment and have been shifting toward the services sector. More than nine-tenths of FOi inflows to EMDEs are greenfield investment, which is generally more closely associated with domestic investment and economic growth in recipient economies than FOi inflows in the form of mergers and acquisitions (M&A). 3 Since 2000, the sectoral composition of FOi has shifted significantly from manufacturing to services: the share of the latter increased from less than one-half in the early 2000s to almost twothirds in 2019-23.
3 Greenfield FD! refers to investmenrs in new assers, when the foreign investor establishes a new venture in the recipient economy M&A refers to acquisition of existing assets by a foreign enterprise in the recipient economy, also known as "brownfield" investments.
FDI can spur economic growth in EMDEs, but the magnitude ofthe effect varies, depending on country characteristics. Empirical analysis based on data for 74 EMDEs over 1995-2019 suggests that a IO-percent increase in FOi inflows is associated with a 0.3 percent boost to real GDP in the average EMOE after three years. The effect is much larger-up to 0.8 percent-in countries with stronger institutions, lower informality, better human capital development, and greater trade openness. Conversely, in countries that lag in these dimensions, the benefits of FOi for output growth are much smaller-and in some cases, absent.
Conducive structural conditions are crucial for attracting FDI. Factors important for attracting FOi include solid macroeconomic fundamentals; high-quality institutions; political and regulatory stability; strong human capital and productivity growth; openness to trade and investment; and financial development. For instance, an improvement in institutional quality or the investment climate from the median to the highest quartile of the global sample can boost FOi inflows by up to one-fifth. A I-percent increase in labor productivity can increase FOi inflows by up to 0.7 percent.
The outlook for FDI to EMDEs is subdued amid elevated trade tensions, policy uncertainty, and heightened macroeconomic and geopolitical risks. Trade and investment openness, as well as integration into global value chains, have historically been important factors for FOi flows. Investment treaties, for instance, are estimated to have boosted mutual investment flows between signatory states by more than twofifths, on average On the contrary, rising geopolitical tensions significantly inhibit crossborder investment: FOi flows between countries with the most pronounced differences in foreign policy are found to be about one-eighth below the global sample median. Trade growth has weakened significantly in 2020-24, to the slowest pace since 2000. Economic policy uncertainty has also reached the highest levels since the turn of the century, while the number of new trade and investment agreements implemented dropped significantly. Tit-for-tat escalation of international trade disputes, waning investment integration, and
rising restrictions on FDI-such as foreign ownership barriers and FDI screening measures, now increasingly adopted by many countries-will result in additional fragmentation of economic networks, dampening FDI inflows to EMDEs.
In light ofthese findings, EMDEs should follow a three-pronged strategy to attract FDI, amplify the benefits of FDI, and advance global cooperation to support FDI flows. The beneficial effects of FDI on growth and economic development are not guaranteed without sustained conducive conditions in recipient economies. Although specific policies depend on country circumstances, broad priorities for all EMDEs include reforms that foster a favorable investment climate, macroeconomic stability, strong institutions, human capital development, financial deepening, and reduction of economic informality The right policies can steer foreign investment to projects that address pressing sustainable development issues and mobilize additional domestic capital Reducing barriers to international trade and investment-still high in many EMDEs-including through investment treaties, is important to attract FDI directly and through enhanced trade and value-chain integration All of these policies are becoming even more important as EMDEs face rising global economic fragmentation. Policies that strengthen global cooperation to uphold a rules-based international system for investment and trade, channel FDI toward countries with the largest investment gaps, and provide technical and financial assistance for structural reform efforts are essential for boosting FDI inflows and enhancing their impact in EMDEs.
FDI plays a pivotal role in the world economy, channeling capital, technology, and expertise across borders. However, global FDI flows relative to GDP-and FDI inflows to EMDEs specifically-have trended downward since the global financial crisis. Both global and domestic factors have contributed to this decline, including weak macroeconomic conditions, higher debt levels and
sovereign risk, geopolitical tensions and policy uncertainty, and a slowdown in structural reforms.
The rise of international trade and financial integration, and the expansion of global value chains, was accompanied by an unprecedented surge in FDI that lasted through most of the 1990s and the 2000s This was interrupted by the global downturn of 2001 and subsequently halted by the global financial crisis of 2008-09. The surge in FDI was especially strong in the run-up to the global financial crisis, with aggregate FDI flows peaking at more than $3 trillion in 2007-about 5 percent of global GDP (figure 3.1.A).
The 2009 recession triggered by the financial crisis had a lasting adverse impact on global cross-border investment FDI flows as a share of world GDP were lower in each of the years 2018 through 2024 than the average for 2000-17. The global recession was followed by a series of adverse developments-continued weak economic growth; trade disputes between major economies, the shocks of the COVID-19 pandemic and Russia's invasion of Ukraine, which disrupted international supply networks and raised global inflation; and the consequent tightening of financial conditions. As a result, FDI inflows as a share of global GDP declined from over 5 percent in 2007 to below 1 percent in 2023 and 2024-the lowest level since the turn of the century (figure 3.1.B). Over the past decade, average annual aggregate FDI flows stood at less than $2 trillion-more than twofifths below the peak of 2007. Large fluctuations from year to year partly reflected the high volatility of FDI inflows related to mergers and acquisitions in advanced economies.
Historically, global FDI flows have been positively correlated with the growth rates of global output and investment (gross fixed capital formation) and, more strongly, with international trade, where the correlation has been close to 0.5 (figures 3.1.C and 3 1.D) On the contrary, rising fragmentation has been strongly associated with the decline in global FDI flows. With global GDP and investment projected to slow sharply in the near term and remain below the pre-pandemic average in the medium term-and with global
trade hindered by higher trade restncnons and acute trade policy uncertainty-FD! inflows as a share of GDP may remain weak.
The rise of cross-border production contributed to a rise in net FDI inflows to EMDEs in nominal terms. Between 2000 and 2008, net FDI inflows to EMDEs grew almost fivefold-from a little over $160 billion to almost $800 billion. Since then, the growth of net FDI inflows has not kept pace with GDP growth. In 2023, the FDl-toGDP ratio in the median EMDE was just over 2 percent, less than half its peak of about 5 percent in 2008 (figure 3.2.A). As a result, FDI inflows to EMDEs, relative to GDP, reached similar FDl-toGDP ratio levels of advanced economies, which also declined over the past fifteen years (figure 3.2.B). The decline in FDl-to-GDP ratios was broad based: in three-fifths of EMDEs, the average FDl-to-GDP ratio was lower in 2012-23 than in 2000-11 (figure 3.2 C).
Both global and domestic factors have contributed to the decline in FDl-to-GDP ratios The deep recession triggered by the global financial crisis depressed fixed investment and FDI flows. The macroeconomic challenges many EMDEs experienced in the post-cns1s period were exacerbated by the COVID-19 recession of 2020. These shocks contributed to heightened risks and uncertainty, weighing heavily on investors' confidence in EMDEs (World Bank 2024a). An event study suggests that recessions in general have deep adverse effects on FDI lasting for over a year (box 3.1). High debt levels and increasing sovereign risk in some EMDEs, the postpandemic inflation surge, and subsequent monetary policy tightening in major economies have restrained financial markets and capital flows to EMDEs (Kose et al. 2021; UNCTAD 2024a).4
Elevated geopolitical tensions, including those associated with U.S.-China trade disputes, Russia's invasion of Ukraine, and conflict in the Middle
FD/ inflows relative to global GDP have steadily declined, from over 5 percent in 2007 to below 1 percent in 2023 and 2024. Following a rapid rise during 2000-08, FD/ inflows to EMDEs relative to GDP have trended down. Historically, global FD/ flows have been positively correlated with the growth rates of global output and gross fixed capital formation and, more strongly, with international trade.
4The decline in FD! inflows to EMDEs also reflects a broader trend of slowing private debt and equity capital flows co developing countries (Ratha et al 2023).
C Global FDI inflows, investment, and GDP growth
D Correlation of global FDI with GDP growth, investment growth, trade,and fragmentation
Sources: UNCTAD; World Bank.
Note: EMDEs = emerging market and developing economies.
A. Sample includes 36 advanced economies and 153 EMDEs
B. Global net FDI inflows as a percent of world GDP. Data for 2024 are estimates based on UNCTAD and World Bank data. Gray markers show global recessions and downturns.
C. Investment refers to gross fixed capital formation. FDI as a percent of GDP is estimated for2024 based on data from UNCTAD and the World Bank.
D Investment refers to gross fixed capital formation. Bars show correlation coefficients between the global FDl-to-GDP ratio and the following variables: real global GDP growth real global investment growth, global trade as a share of GDP, and the geopolitical fragmentation index from FernandezVillaverde Mineyama, and Song (2024). Sample includes annual data over 1990-2023 •·,and• denote statisticalsignificance at the 1, 5, and 1o percent levels, respectively.
East, have further worsened the international investment climate (IMF 2023a). These tensions have fueled efforts to realign global value chains toward geopolitically aligned countries (friendshoring) and to localize production and supply chains in sensitive sectors and operations (nearshoring and re-shoring). International and domestic economic policy uncertainty has also increased in the past decade, weighing on investor sentiment in EMDEs (World Bank 2024a)
Structural reforms in many EMDEs have stalled over the past decade-including reforms to
The FOi-to-GDP ratio in the median EMDE was just over 2 percent in 2023, less than half its peak of about 5 percent in 2008 Advanced economies experienced a sharper slowdown The decline in FD/ inflows to EMDEs was broad-based: the average FOi-to-GDP ratio was lower in 2012-23 than in 2000-11 in three-fifths of EMDEs Announced greenfield FD/ to EMDEs fell by almost one-quarter in 2024 relative to 2023
A FDI inflows to EMDEs
PercentofGDP
C Share of countries with declining FDl-to-GDP ratios
B FDI inflows to advanced economies
improve the investment climate and tackle regulatory barriers to FOL EMDEs, especially LICs, lag advanced economies in such critical dimensions for investment climate as rule of law, regulatory environment, and control of corruption.5
Historically, FOi inflows to EMDEs have been closely associated with economic growth and especially with foreign trade dynamics-more than FOi inflows to advanced economies (figure 3 2.D). The correlation between FOi inflows and trade, taken as a share of GDP, reached 0.8 in EMDEs in the past three decades By contrast, higher import tariffs and nsmg economic fragmentation were strongly associated with a decline in FDI inflows.
D. Correlation of FDI with GDP growth, trade, tariffs, and fragmentation
E. Announced greenfield FDI to EMDEs
F. FDI inflows to and outflows from EMDEs
Therefore, amid elevated trade tensions and global economic fragmentation, policy uncertainty, and weak macroeconomic backdrop, the outlook for FOi inflows to EMDEs remains challenging in the near term Reflecting these developments and deteriorating investor sentiment, the recent data on FOi project announcements indicates a decline in greenfield FOi inflows to EMDEs in 2024 by almost one-quarter relative to 2023 (figure 3.2 E)
Sources: fDi Markets; World Bank.
Note: EMDEs =emerging market and developing economies; RHS = right-hand side.
A.B. Annual medians and interquartile ranges of FDl-to-GDP ratios. Balanced sample of 35 advanced economies and 134 EMDEs.
C. Share of countries with a decline in the FDl-to-GDP ratio from 2000-11 to 2012-23 and their GDP value as a share of aggregate group GDP (2023 values). Sample includes 35 advanced economies and 134 EMDEs
D. Bars show correlation coefficients between annual average FDl-to-GDP ratio and the following variables: real GDP growth, trade as a share of GDP, import tariff rate,and the geopolitical fragmentation index from Fernandez-Villaverde, Mineyama, and Song (2024) Correlations are based on the period 1990-2023. ••• and •• denote statistical significance at the 1and 5 percent levels, respectively
E. Announced greenfield FDI capital expenditures Sample includes 141 EMDEs.
F Median net FDI inflows and outflows as percent of GDP for period averages. Sample includes 107 EMDEs
Most of the FOi received by EMOEs-almost 90 percent of the total cumulative FOi stock in the past decade---comes from advanced economies. About 45 percent of these investments were from the European Union and the United States. In general, EMDEs do not play a major role as a source of FOi to other EMDEs, and their FOi outflows are much smaller than inflows (figure 3.2.F). Between 2000 and 2023, net FOi outflows, defined as investment outflows less disinvestment, were equivalent to less than 0.5 percent of GDP in EMOEs, on average. Although advanced economies remain the source of most FOi inflows to EMDEs, FOi flows from EMDEs to other EMDEs-also referred to as South-South FOi-have grown faster than flows from advanced
5Structural reforms in EMOEs proceeded rapidly during major liberalization waves in the 1980s and 1990s. However, following significant deregulation in such areas as international trade and finance, and labor and product markets, progress has stalled since the 2000s, as the scope for additional reforms narrowed and the reform momentum in many EMDEs waned (IMF 2019).
economies to other advanced economies during the 2000s and 2010s (Broner et al. 2023; Ratha et al 2023) For LICs, in particular, South-South FDI is significant and can help address development challenges, including job creation (Aykut and Rath 2004; Saha et al. 2020)
FDI inflows to EMDEs are concentrated in the largest economies Over two-thirds of total FDI inflows to EMDEs are received by just ten countries. During 2012-23, nearly one-third of total FDI inflows to EMDEs went to China, making it the largest recipient (figure 3.3 A). 6 The other largest destinations, Brazil and India, received far lower shares of FDI inflows-about 10 and 6 percent of total FDI inflows to EMDEs, respectively. By contrast, only 2 percent of total FDI inflows to EMDEs went to LICs.
FDI inflows to EMDEs have long been concentrated in three geographic regions, which together represent more than 80 percent of total inflows to EMDEs. During 2012-23, East Asia and Pacific (EAP) received more than two-fifths of FDI inflows to EMDEs. Latin America and the Caribbean (LAC) and Europe and Central Asia (ECA) were the other main regional destinations, receiving about one-quarter and one-sixth of FDI inflows to EMDEs, respectively (figure 3.3.B).
Median FDl-to-GDP ratios in EMDEs declined in most regions in 2012-23 relative to 2000-11, especially in ECA and LAC (figure 3.3.C). ECA experienced an FDI boom in the 2000s on the back of rapid liberalization in transition economies and their integration into trade and financial networks, both globally and in relation to the European Union (UNCTAD 2010). With the collapse of commodity prices in 2014-16 and rising geopolitical tensions related to Russia's invasion of Ukraine in 2022, FDI inflows to many ECA countries declined significantly. Median FDl-to-GDP ratio in ECA declined from 5 percent to 3 percent. Four-fifths of ECA economies had FDl-to-GDP ratios lower in 2012-23
Almost one-third of FD/ inflows to EMDEs during 2012-23 went to China Brazil and India were the next largest destinations but received much lower shares EAP accounted for over two-fifths of FD/ inflows to EMDEs during 2012-23 LAC and EGA were the other main regional destinations, receiving about one-quarter and one-sixth, respectively. In most regions, FOi-to-GDP ratios declined from 2000-11 to 2012-23
B. Cumulative FDI inflows in
by region
6 However, after a major collapse of FD! inflows to China in 2023, its share of total FD! received by EMDEs fell from one-third to one-tenth.
C.
D. Share of economies with lower average FDl-to-GDP ratios in 2012-23 than in 2000-11
Source: World Bank.
Note: EAP = East Asia and Pacific; ECA = Europe and Central Asia; EMDEs = emerging market and developing economies; LAC = Latin America and the Caribbean; LICs = low-income countries; MNA = Middle East and North Africa; SAR = South Asia; SSA = Sub-Saharan Africa.
A. Share of FDI net inflows among EMDEs. Sample includes up to 153 EMDEs.
B.-D. Sample includes 134 EMDEs, including 19 EAP, 20 ECA, 31 LAC, 15 MNA, 6 SAR, and 43 SSA economies.
C. Bars show median net FDI inflows as a share of GDP by region.
D. Horizontal line denotes 50 percent.
than in 2000-11, the largest share of any region (figure 3.3.D). Economies in LAC also experienced a decline in average FDl-to-GDP ratios during this period, as fragmentation of trade and financial networks contributed to downward pressures from macroeconomic challenges and commodity market volatility in many countries (World Bank 20236). Median FDl-to-GDP ratio in LAC dropped from 5 percent to 4 percent during this period.
The composition of FDI by entry mode differs significantly between EMDEs and advanced
The composition of FOi by entry mode differs significantly between EMDEs and advanced economies Greenfield investment has accounted for over nine-tenths of FD/ inflows into EMDEs since 2000, while FD/ to advanced economies is about equally split between greenfield investment and mergers and acquisitions (M&A). In EMDEs , both greenfield and M&A FOi as a share of GDP declined significantly in 2012-23 compared to 2000-11. Greenfield FOi in EMDEs declined throughout 2024 on a year-on-year basis
A Greenfield FDI inflows
B M&A FDI inflows
C Greenfield FDI inflows in EMDEs in 2024
D Share of countries with declining greenfield FDI inflows
deeper capital markets and stronger institutional and legal frameworks that lower the risks of largescale acquisitions.
In EMDEs, both greenfield and M&A FDI as a share of GDP declined significantly over the past decade. Greenfield FDI as a share of GDP fell by more than half in the median EMDE between 2000-11 and 2012-23. Over the same period, M&A FDI as a share of GDP fell by about threefourths Recent data on FDI project announcements suggests that greenfield FDI continued to weaken throughout 2024 relative to the previous year, and that more than two-thirds of EMDEs experienced a decline in greenfield FDI in 2024 (figures 3.4.C and 3.4.D).
Sources : fDi Markets; UNCTAD;World Bank.
Note: EMDEs = emerging markets and development economies; M&A = mergers and acquisitions.
A.B. Bars show group medians. Sample includes 36 advanced economies and 125 EMDEs. Greenfield FDI data available from 2003 onward.
C Year-on-year change in announced greenfield FDI project capital expenditures. Sample includes 130 EMDEs.
D Percent of countries that have a smallervalue of announced greenfield FDI project capital expenditures in 2024 compared to 2023 Horizontal line denotes 50 percent. Sample includes 26 advanced economies and 111 EMDEs.
The sectoral composition of FDI in EMDEs has changed significantly since the early 2000s. In both advanced economies and EMDEs, nearly 65 percent of FDI inflows in recent years have gone to the services sector (figure 3.5.A). The share of services in total FDI inflows to EMDEs is now almost 20 percentage points higher than in 200004. Services-related FDI inflows in EMDEs have displaced manufacturing-related inflows, which dropped from about 45 percent in 2000-04 to less than 30 percent in 2019-23.
economies. Greenfield investment has accounted for over nine-tenths of FDI inflows into EMDEs since 2000. During 2012-23, while greenfield FDI inflows were equivalent to 2.6 percent of GDP in the median EMDE, M&A accounted for only 0.1 percent of GDP (figures 3.4.A and 3.4.B). By contrast, M&A is a much more prominent mode of FDI in advanced economies, comprising about 1 percent of GDP over the same period, the same level as greenfield FDI inflows. These differences reflect a greater number of companies in advanced economies that are large enough to be attractive acquisition targets for multinational enterprises (MNEs), along with
The growing role of services in EMDEs, and the associated realignment of cross-border production and domestic investment patterns, reflect long-run structural shifts in global production (UNCTAD 2015; World Bank 2023c). The services sector now accounts for more than two-thirds of GDP and creates more new jobs than other sectors (Nayyar, Hallward-Driemeier, and Davies 2021; World Bank and WTO 2023). Rapid technological progress, particularly the increasing importance of intangible capital and digitalization, is evident in the broad trend of "servitization" in manufacturing.
As a result, MNEs have been allocating an increasing share of their investment to the services sector. This was also facilitated by policies promoting FDI in the services sector-according to UNCTAD's Investment Policy Monitor Database, the share of investment incentives directed toward the services sector increased from
Disruptive events-such as recessions, financial crises, and natural disasters-can be associated with a significant deterioration in FD! inflows for both emerging market and developing economies (EMDEs) and advanced economies. During recessions, the growth ofFD! inflows to EMDEs contracts by about 15 percentage points, on average. FD! remains weak for an additional year in the wake of recessions. FD! dynamics around financial crises and natural disasters yield less clear patterns.
Introduction
The behavior of FOi flows is linked to prevailing economic conditions. Not infrequently, countries face highly disruptive events. For example, between the early 1970s and 2020s there were five global recession years, over 400 episodes of financial crises and more than 200 episodes of large natural disasters-with at least a 2percent loss of GDP-in the global sample of countries examined in this analysis. The dynamics of FOi flows around disruptive events are diverse, in terms of both the magnitude of the change in flows and the duration of the effect The global financial crisis of 2008-09, for example, had a deep impact on FOi flows, especially for EMOEs (Kekic 2009). However, the effects of the 2020 global recession during the COVID-19 pandemic were more transitory, and FDI flows recovered quickly to pre -pandemic levels. This box rakes a broad historical perspective, using event studies to examine whether major disruptive events have systematic effects on FOL
This box addresses two questions:
How does FDI evolve around recessions, financial crises, and natural disasters?
How do the effects of adverse events differ between EMDEs and advanced economies?
The distinction between EMDEs and advanced economies is important given the differing nature of FDI inflows: in EMDEs, FDI primarily takes the form of greenfield investment, whereas in advanced economies it is more commonly directed to mergers and acquisitions.
Data and methodology
The analysis is based on a global sample of 186 countries, including 150 EMDEs, over the period 1971-2022. The adverse events include global and national recessions (sourced from Kose, Sugawara, and
Note: This box was prepared by Amat Adarov and Hayley Pallan
Terrones 2020), financial crises (from Laeven and Valencia 2020), and natural disasters (from the EMDAT database). FOi is sourced from the World Bank's World Development Indicators (WDI) database. Outliers-negative FOi values and values in the upper decile of the FDI growth distribution-are dropped. The event study framework regresses growth rates of real inward FDI flows on dummy variables for the adverse events at the time of the shock ( = O) and three-year windows around the event ( - 3 and + 3). The estimates are reported along with 90-percent confidence intervals to gauge statistical significance.
The analysis shows that global and national recessions are associated with a significant deterioration in FOL FDI starts to weaken in the run-up to recessions, aggravating macroeconomic conditions. a In EMOEs, the growth of FDI inflows declines by about 15 percentage points in recessions relative to pre-recession trends, on average. 6 The impact of global recessions tends to be even stronger in advanced economies, with FDI growth declining by about 25 percentage points (figures B3.l.l.A and B3.l.l.B; table B3.1.l). These effects are sizable in the context of long-run FDI trends: over the sample period, average annual FDI growth was about 5 percent in EMDEs and about 11 percent in advanced economies.
Certain recessions, however, may produce much deeper adverse effects. In the case of the two most recent global recessions, in 2009 and 2020, FDI inflows to advanced economies were weakened much more severely during the 2009 episode than during the 2020 episode. By contrast, both recessions had similar effects on FOi inflows to EMOEs (figure B3. l. LC).
a. The causality is bi-directional-a decline in output, in turn, also inhibits FDI inflows See the analysis in the section on the drivers of FDI.
b. The results are consistent with the dynamics of net FDI inflow in EMDEs around adverse events For instance, during global recessions, annual net FDI in the sample dropped by 11 percent, while outside global recessions, net FDI inflow growth averaged about 7 percent in the sample.
Global and national recessions are associated with a significant decline in FD/ inflows to EMDEs , with FD/ remaining weak for an additional year in the wake of recessions An assessment of FD/ dynamics around financial crises and natural disasters yields Jess clear patterns
A. Growth in FDI inflows to EMDEs around global recessions
B. Growth in FDI inflows to EMDEs around national recessions
C. Growth in FDI inflows during global recessions
D. Growth in FDI inflows to EMDEs during global recessions by sector and mode
E. Growth in FDI inflowsto EMDEs around financial crises
F. Growth in FDI inflows to EMDEs around natural disasters
Source : World Bank
Note : EMDEs = emerging market and developing economies; M&A = mergers and acquisitions. Event studies show estimates of annual FDI growth regressed on dummy variables for the years of recessions, financial crises, and natural disasters, as well as the three-year windows around adverse events. Dashed lines and whiskers show 90-percent confidence intervals.
A.B Global recession years are 1975, 1982, 1991, 2009,and 2020, following Kose,Sugawara, and Terrones (2020) National recession years are years with negative real GDP growth
C.D Bars show point estimates for the years of global recessions.
D M&A estimate is scaled by a factor of ten
E.F Financial crisis years are from Laeven and Valencia (2020) and include systemic banking, debt, and currency crises Natural disaster years are from EM-DAT, for disasters with damage estimated to be 2 percent of GDP or higher.
In EMDEs, recessions have a more protracted impact on FDI than in advanced economies: EMDEs take about a year longer to recover. This may be due to the prevalence of greenfield FDI in EMDEs, which tends to be more sensmve to macroeconomic turbulence. Additional estimations for countries with available detailed data by sectors and the FDI mode of entry suggest that during recessions greenfield FDI tends to suffer a large dip. However, this effect is highly heterogeneous across countries and is not statistically significant (figure B3 1.1.D). LICs are particularly hardhit by national recessions, during which FOi growth drops by about 28 percentage points.
Unlike in recessions, dynamics in FDI around financial crises, including debt, currency, and systemic banking crises, differ between EMDEs and advanced economies. While no significant effects are observed in the case of advanced economies, the growth of FDI inflows to EMDEs tends to decline by about 7 percentage points in the year following financial crises (figure B3.1.1.E). Thus, on average, the impact of financial crises appears to be much milder than that of recessions, consistent with findings in the previous literature reporting greater resilience of FDI during financial crises outside
A. Global recessions
B. National recessions
D. Natural
Source: World Bank.
Note : EMDEs = emerging market and developing economies; LICs = low-income countries.
inflows on dummy variables for the four types of adverse events during three-year windows around the event. Global recessions dates are from Kose, Sugawara, and Terrones (2020); national recession years are defined as years with negative real GDP growth; financial crisis years are from Laeven and Valencia (2020) and reflect episodes of systemic banking, currency,and debt crises; natural disasters resulting in damage equivalent to at least 2 percent of GDP are from EM-DAT.•••,••,• indicate statistical significance at the 1, 5, and 10 percent level, respectively.
recessions (Calderon and Didier 2009; Loungani and Razin 2001). This effect can also be attributed to "firesale FDI," or a surge in FDI inflows around crises, as liquidity constraints for domestic firms lead to an increase in foreign acquisitions when asset values deteriorate (Krugman 1998). However, the latter effects are less relevant for EMDEs, which have only a small share of total FDI inflows in the form of M&A. c
However, financial crises are accompanied by much greater declines in FDI flows to low-income countries
c. Historically, M&A FD! flows have often been negatively affected by financial crises (Stoddard and Noy 2015) However, the 1997 Asian financial crisis was a notable exception and was associated with a rise of M&A FD! (Acharya, Shin, and Yorulmazer 2011; Aguiar and Gopinath 2005).
(LICs), which generally suffer from deeper debt sustainability challenges, shallow financial markets, and lower capacity to manage and mitigate financial risks than other EMDEs (table B3.1.1). FDI growth in LICs drops by over 20 percentage points in the year before and during a financial crisis.
The event studies do not reveal clear patterns in FDI responses to natural disasters, including climate, biological, and geophysical disasters (figure B3.1.1.F; table B3.1.1) Natural disasters are examined both jointly and individually for each type. The responses of FDI, however, are highly heterogeneous across countries. The analysis suggests that FDI inflows tend to
increase following natural disasters in both advanced economies and EMOEs. This effect is associated with large geophysical disasters and may be related to rising demand for rebuilding after such disasters--a market opportunity that encourages foreign capital inflows (similar findings are reported in Neise et al. 2022).
Conclusion
Recessions are associated with a sharp decline in FOi inflows in both advanced economies and EMOEs. While FOi flows to advanced economies tend to recover relatively quickly after recessions, the adverse
effects on FOi growth in EMOEs are more prolonged. Financial crises and recessions tend to produce particularly strong negative effects on the growth of FOi inflows to LICs. Given the importance of FOi for growth in many EMOEs, the results highlight the need to strengthen domestic policies to foster resilience to shocks and curtail the risks of FOi retrenchments during periods of economic downturns and crises. LICs are particularly vulnerable to adverse shocks with limited capacity to address them, and therefore require financial and technical support from the global community to mitigate these challenges effectively.
about one-third in 2014-18 to almost one-half in 2019-23. However, the shift to services in FDI tends to be more beneficial for larger and more competitive EMDEs than for less developed countries that find it more challenging to capture the benefits of technology spillovers and upgrading of the production processes that come with FDI (UNCTAD 20246). From a labor market perspective, the services sector tends to employ workers with higher skill levels than those in manufacturing or agriculture (World Bank 2024e). Therefore, it is important for EMDEs to strengthen their human capital development to take advantage of the structural shift of FDI toward services and ensure it is conducive to productivity growth and creation of better-paying jobs.
Within the services sector, the largest share of FDI in EMDEs during 2019-23 was in business activities-about one-third of the total (figure 3.5.B). Financial services accounted for about onefifth, followed by trade and information and communications technology (ICT) services (nearly one-seventh each). Within manufacturing, the largest FDI inflows were in motor vehicle production (about one-fifth of FDI inflows into manufacturing), with food, electrical, metal, and petroleum products each accounting for about one-tenth (figure 3.5.C). In the primary sector associated with natural resource extraction, most FDI inflows were in mining and quarrying (figure 3.5.D).
Policy makers in EMDEs have commonly viewed FDI as an important source of economic growth and development, providing financing for domestic capital formation, technological spillovers, and jobs (Alfaro and Chen 2018; UNCTAD 2001). Therefore, the weakening of FDI inflows is concerning, especially in light of EMDEs' mounting investment needs to address infrastructure gaps and meet key development goals.
The growing focus of policy makers on climate change, poverty, and inequality has triggered additional policy interest in the potential benefits of FDI associated with the transfer of green technologies and socially responsible corporate practices. Although theoretical considerations point to a wide range of benefits of FDI, the evidence shown in empirical literature is mixed. This section examines the evidence on the macroeconomic effects of FDI, outlining transmission channels, synthesizing the literature, and reporting new empirical analysis of the impact of FDI on output.
Transmission channels
FDI entails a long-term ownership relationship between a foreign direct investor in the source
economy and a foreign direct investment enterprise in the recipient economy. This lasting economic link enables a range of effects on the enterprise receiving FOI, many of which extend to the rest of the host economy. The strength of the spillovers depends in part on the willingness of the FOI enterprise to transfer the benefits it acquires from the foreign direct investor-corporate know-how and other competitive advantages-to local firms in the recipient economy. It also depends on the capacity of the domestic economy to absorb such spillovers. These effects work through the following transmission channels.
Effects on the foreign direct investment enterprise
A foreign direct investor-typically an MNEcan expand the productive capacity of its foreign direct investment enterprise by helping it accumulate capital, create jobs, and accelerate productivity improvements.7 Among these channels, transfers of environmentally friendly technologies and superior safety standards are increasingly important for sustainable development. Positive effects through these channels tend to be stronger for vertical FOI-the type of FOI that occurs within a value-added chain and is aimed at improving production efficiency-than for horizontal FOi, which takes place in the same industry and is aimed at expanding market access CTavorcik 2004; UNCTAD 2001).
Foreign-owned firms generally have greater capacity than domestic firms to access international cross-border production networks in both upstream and downstream industries, as well as final goods markets. MNEs can leverage access to resources, efficiency-enhancing innovations, and economies of scale across the world economy via trade, financial, and communications networks. Integration into cross-border production and supply chains can be particularly important for economies with small domestic markets and less competitive private sectors. In this regard, FOI inflows also provide signaling effects, demonstrat-
In both advanced economies and EMDEs, about 65 percent of FD/ inflows in 2019-23 went to the services sector For EMDEs, this was almost 20 percentage points higher than in 2000-04. Within services, the largest share of FD/ in EMDEs goes to business activities. Within manufacturing, the largest share of FD/ inflows is directed to motor vehicle production, and within the primary sector, most FD/ inflows go to mining and quarrying
7 For derails, see Alfaro (2017); Amighini, McMillan, and Sanfllippo (2017); Hale and Xu (2016); Kose, Prasad, and Terrones (2009); and Mercer-Blackman, Xiang, and Khan (2021).
C FDI inflows in EMDEs by manufacturing sectors, 2019-23
D FDI inflows in EMDEs by primary sectors, 2019-23
Sources: UNCTAO; World Bank.
Note: EMOEs = emerging market and developing economies; ICT = information and communication technology.
A. Stacked bars show sectoral FOi shares in total FOi for the period indicated Sample includes 32 advanced economies and 86 EMOEs. B.-0. Sample includes up to 97 EMOEs.
ing the commercial viability of investing in a given country or sector. 8
Positive spillovers to domestically owned firms may occur as they acquire more advanced technologies from FOi enterprises (Blalock and Genier 2008; lvarsson and Alvstam 2005). Similarly, domestic firms may improve their business processes and productivity by adopting
8 On rhe relationship bervveen FDI and global value chains, see Adarov and Stehrer (2021), Farole and Winkler (2014), and Qiang, Liu, and Steenbergen (2021). For rhe role ofFDI in improving access to final goods markers see Ekholm, Forslid, and Markusen (2007), Tintelnot (2017), and World Bank (2020)
the management practices and organizational know-how of foreign-owned firms to remain competitive (Fu 2011) Domestic sectors also benefit from efficiency and productivity spillovers from the outsourcing of activities by foreignowned firms through value-added chains. In EMDEs, greenfield FDI has positive productivity spillovers, particularly to domestic firms in upstream sectors (Ahn, Aiyar, and Presbitero 2024)
Human capital gains may extend beyond the foreign direct investment enterprise as workers who have gained experience in foreign-owned firms move to domestic companies, further boosting labor productivity in the recipient economy. Additionally, economic activity by foreign-owned firms generally helps to create new jobs, although the net effect on employment may be negative if competition from foreign firms crowds out jobs in domestic firms or if efficiency gains lead to redundancies. Jobs created via FDI tend to pay higher wages, while providing more training, although some studies suggest that a "race to the bottom" in labor standards is associated with FDI.9
Demand effects and access to value chains by domestic companies
Local sourcing by foreign-owned firms benefits domestic suppliers and boosts aggregate demand in the recipient economy CTavorcik 2004). FDI may facilitate access by domestic firms to international production networks and foreign markets. This transformational impact may also include the provision of services such as digital connectivity and transport infrastructure supporting the recipient economy at large (World Economic Forum 2020).
Foreign investor firms are generally more efficient than domestic ones and are likely to add to competitive pressures in domestic markets. This
9 For labor market benefits from FD!, see Javorcik (2015) and Markusen and Trofimenko (2009) For labor market risks of FD!, see Hijzen et al (2013) and Messerschmidt and Janz (2023)
may stimulate productivity improvements by domestic firms but may also crowd out economic activity if less efficient domestic firms are unable to survive the increased competition (Alfaro and Chen 2018; Fons-Rosen et al. 2017; World Bank 2018). Greater competitive pressure in the recipient economy may also lead to second-order effects, such as expanding the variety and affordability of goods and services for domestic firms and households
Large cross-border financial flows may induce currency volatility, balance of payments pressures, and contribute to financial asset bubbles. However, these risks are more relevant to portfolio investment than to FDI. Excessive reliance on foreign investment and the political influence that MNEs may wield as a result can also be concerns, particularly in recipient countries with large inward FDI stocks. Access by foreign firms to strategic domestic assets and sectors via FDI has increasingly fueled anxieties related to national security considerations and supply chain resilience (IMF 2023a; UNCTAD 2023; World Bank 2023c). These concerns have intensified reshoring, friend-shoring, and global economic fragmentation.
Through these channels, FDI can also facilitate domestic private capital mobilization in recipient economies, beyond the private long-term capital that MNEs bring through new investment and retained earnings (Amighini, McMillan, and Sanfilippo 2017) In particular, foreign firms can stimulate economic activity in several ways. They help improve infrastructure-especially in countries that lack the resources to finance such investments themselves. They also provide goods and services to local businesses and generate demand for their output through upstream and downstream value-added linkages. Together, these effects can encourage greater domestic investment. Increased competitive pressures induced by foreign-owned firms also encourage domestic businesses to invest more. FDI inflows also provide a signal about profitable investment opportunities that may encourage additional private investment by both domestic and foreign investors.
The wide range of direct effects and spillovers from FDI can help EMDEs address pressing developmental challenges and accelerate progress toward key development goals. FDI can be instrumental in helping recipient economies address poverty and inequality challenges It does so by facilitating job creation, human capital improvements that raise the productivity of domestic labor, and enhancing access to goods and services-especially in rural areas and for disadvantaged communities. These dynamics are particularly important for LICs, which face deeper structural challenges and limited public and private investment capacity. Empirical work suggests that the strength of these positive effects also depends on institutional quality and the level of economic development in the recipient country (Aloui, Hamdaoui, and Maktouf 2024; Huang, Sim, and Zhao 2020).
FDI can also improve the economic participation of women-by transmitting best practices on talent allocation to the recipient economy, providing women with job opportunities, and bridging pay gaps. Foreign affiliates of MNEs tend to have a greater share of female employees than domestic firms. That may reflect a greater tendency among MNEs to implement nondiscrimination policies in hiring, equal pay, promotion, trammg, and maternity leave. However, domestic legal and regulatory systems play an important role for how effectively MNEs contribute to gender equality and the effects are often greater for low- and mid-level jobs compared to higher-level positions. 10
In addition, FDI can support the energy transition and climate change adaptation in EMDEs by providing capital for sustainable projects and climate-resilient infrastructure, and by transferring environmentally friendly technologies and business practices.
Empirical studies of the impact of FOi on economic growth in EMDEs show mixed
results-the estimates in most studies suggest positive effects of FDI, but the magnitudes of these effects vary considerably and are often only weakly statistically significant For instance, a 1 percentage point increase in FDI-to-GDP ratio is found to be associated with an increase in per capita GDP growth of about 0 7 percentage point in Borensztein, De Gregorio and Lee (1998) and about 0.5 in Bengoa and Sanchez-Robles (2003). Other studies reported smaller effects-reaching about 0.4 percentage point (Alguacil, Cuadro, and Orts 2011; Alfaro et al. 2004) or 0 2 percentage point (Makki and Somwaru 2004) in response to an equivalent increase in the FDI-to-GDP ratio. Previous summaries of the empirical literature on FDI and economic growth have noted lack of consensus in the findings (Kose et al. 2009; Kose and Ohnsorge 2023).
The wide dispersion of estimated effects may be attributed to differences in the samples examined and the structural characteristics of the recipient economies that influence the growth effects of FDI. For instance, financial development, human capital, and institutional quality are factors found to be important in determining the effects of For.11
The extent to which structural characteristics affect the FOi-growth relationship varies across countries and over time. For instance, many studies have found that financial development has facilitated the growth effects of FDI, but this relationship may have weakened over time (Benetrix, Pallan, and Panizza 2022). Deeper and more efficient financial markets are likely to facilitate the funding of domestic firms that supply foreign firms with inputs. Nevertheless, the rapid growth of financial markets can also lead to an increased incidence of financial crises, dampening the growth benefits of FDI (Osei and Kim 2020).
The mode of entry may also matter, with greenfield FDI having greater growth effects than
1°For details on FOi and the economic participation of women, see Heckl, Lennon, and Schneebaum (2025), Montinari (2023), and UNCTAD (2021).
11 For the role of institutional quality, see Alguacil, Cuadros, and Orts (2011) and Driffield and Jones (2013). For the implications of human capital, see Bengoa and Sanchez-Robles (2003), Borensztein, De Gregorio, and Lee (1998), and Wang and Wong (2011) For the role of financial development, see Alfaro et al. (2004) and AzmanSaini, Law, and Ahmed (2010)
M&A FDI (Harms and Meon 2018; Luu 2016). However, some firm-level studies have found positive effects of M&A on productivity, fixed capital upgrading, and job creation in certain countries. For example, Bircan (2019) found that productivity in manufacturing firms in Ti.irkiye improved after their acquisition by MNEs. Similarly, Ragoussis (2020) reported that wages increased in acquired enterprises in a sample of six EMDEs.
Growth effects of FDI tend to vary across recipient sectors. FDI in the manufacturing sector, especially in high-tech, capital-intensive, and highskill industries, has been found to induce strong growth effects via increases in productivity, employment, and investment. The output effect of FDI in the services sector has been found to be less clear-cut, with some studies reporting insignificant or even negative impacts. This may be related to the prevalence of market-seeking M&A FDI in this sector. Likewise, the effects of FDI in the primary sector on growth have been found to be mostly negligible or, in some cases, negative. These findings may reflect the generally weaker economic linkages between the primary sector and the rest of the economy, lower technological spillovers between foreign and domestic firms compared to other sectors, and barriers to entry related to greater economies of scale in the primary sector.
12
The mixed evidence reported in past empirical work on the FDI-growth relationship reflects significant heterogeneity in effects across countries that cannot be precisely estimated, as well as other methodological caveats. Conventional panel data estimation strategies often fail to take account of several issues-such as the two-way causality between FDI and growth, heterogeneity across countries, and the dynamic nature of the effects. To address these issues, a heterogeneous panel VAR framework (Pedroni 2013) is used to
12 For the effects of FD! in the manufacturing, primary, and services sectors see Alfaro (2003), Alfaro and Charlton (2013), Aykut and Sayek (2007), Chakraborry and Nunnenkamp (2008), and Cipollina et al. (2012).
quantify the effects of FDI on output growth in EMDEs based on a sample of 74 countries over the period 1995-2019 The detailed results of this analysis are reported in box 3.2.
In summary, the analysis finds a generally positive and statistically significant effect of FDI inflows on output in recipient economies. For the average EMDE, a IO-percent increase in real net FDI inflows leads to an increase in real GDP of 0.15 percent in the same year. The effect increases further to 0.3 percent after three years.
The effects of FDI, however, vary considerably across countries. In the 25 percent of countries with the largest effects, output increases by about 0.8 percent after three years in response to a 10percent increase in FDI inflows. But output effects of FDI are significantly weaker in LICs than in other EMDEs. This heterogeneity is consistent with the results reported in previous empirical work and is generally attributed to differences in the absorptive capacity of recipient economies. These, in turn, are linked to such characteristics as low institutional quality, weak human capital development, shallow financial markets, and other factors (Alfaro et al. 2004; Borensztein, De Gregorio, and Lee 1998). The results show that some country-specific characteristics amplify these effects. In particular, countries with the largest output effects of FDI tend to have stronger institutions, better human capital development, lower levels of economic informality, and higher trade openness, on average
FOi can play an important role in supporting the energy transition and addressing climate change. In fact, the share of greenfield FOi involving investment in environmental technologies has been rising in recent years in both advanced economies and EMDEs (figure 3.6.A). FOi can facilitate the adoption of environmentally friendly technologies and business practices that contribute to the energy transition It can also help to close investment gaps related to climate change issues.
The effects of FD! on output growth are not clear-cut, as the literature to date does not provide consistent evidence. An empirical framework that accounts for the shortcomings of conventional estimations suggests that FD! inflows tend to have a positive impact on output in emerging market and developing economies (EMDEs). In the average EMDE, a 10-percent increase in real net FD! inflows is followed by a 0.3 percent increase in the level of real GDP after three years. Countries with lower economic informality, higher trade openness, better human capital development, and stronger institutions tend to have larger output effects ofFDI-up to 0. 8 percent over the same period.
The empirical literature presents mixed evidence on the effects of FOi on output growth. These results are sensitive to the country composition and sample period examined, and have been found to depend on recipient economy conditions such as human capital, institutional quality, and financial development (Alfaro et al. 2004; Borensztein, De Gregorio, and Lee 1998; Jude and Levieuge 2017).
Conventional panel data estimation frameworks generally do not address several empirical challenges in assessing the growth effects of FOi: (1) broad heterogeneity of the macroeconomic effects of FOi across countries-aggregate or partially pooled estimates tend to be statistically insignificant as a result; (2) twoway causality between FOi and output growth, which may lead to inconsistent estimates; and (3) heterogeneous time horizons over which the effects of FOi may manifest.
To address these issues, this box employs a heterogeneous panel vector autoregressive (PVAR) framework developed by Pedroni (2013) to study the relationship between FOi and output growth. This approach makes it possible to incorporate fully endogenous covariates and to examine the mutual impacts of these variables over time, accounting for the heterogeneity of responses across countries. The analysis is based on strongly balanced annual data for 74 EMDEs spanning the period 1995-2019 (annex 3.1 provides methodological details). This box addresses the following questions:
What are the effects of FOi inflows on output growth?
How do EMDEs differ in terms of the growth impacts of FOi?
Note: This box was prepared by Amat Adarov, Hayley Pallan, and Peter Pedroni.
What country characteristics help increase the positive effects of FOi?
The model yields cumulative impulse responses for each country in the sample. The results suggest that for most EMDEs, FOi inflows have a positive and statistically significant impact on output On average, a IO-percent increase in real net FOi inflows is associated with an increase in real GDP of 0.15 percent in the same year, peaking after three years and flattening out afterward at about 0.3 percent (figure B3.2.1.A). a In most countries, the effects are positive and significant. In the quartile of countries with the largest effects, a positive FOi shock leads to an increase in output of 0.8 percent after three years. However, the analysis also shows that for about a quarter of countries in the sample the positive effects are absent or insignificant.
These results highlight the highly heterogeneous impacts of FOi on output growth across countries, consolidating a wide variety of estimates in past empirical studies, which reported positive, negative, and insignificant output effects of FOi. Previous literature has attributed such variation to differences in the absorptive capacity of the recipient economy, the sectoral composition of FOi, and the mode of entry (Alfaro 2003; Alfaro et al. 2004; Aykut and Sayek 2007; Borensztein, De Gregorio, and Lee 1998; Harms and Meon 2018).
Country characteristics that impact the effects of FOi
Further analysis explores the ongms of heterogeneity and identifies common patterns in the effects of FOi conditional on various structural characteristics of recipient economies. Separating the sample of EMDEs
a. The magnitude of the FDI shock (10 percent) roughly corresponds ro the average annual growth of real net FDI inflows for the EMDE sample used in the analysis, excluding outliers. In the median EMDE, FDI growth is about 5 percent, with a standard deviation of 38.
A 10-percent increase in real net FD/ inflows is associated with a 0 15 percent increase in real GDP in the same year, peaking at 0 3 percent after three years. The output effects of FD/ are much weaker in L/Cs than in other EMDEs Countries with greater growth effects from FD/ inflows tend to have better institutions, lower levels of economic informality, higher trade openness, and better human capital development.
A Impact of FDI on output B Impact of FDI on output by income group
Source : PRS Group's International Country Risk Guide (ICRG); World Bank.
Note: EMDEs = emerging market and developing economies; LICs = low-income countries; RHS = right-hand side. Sample includes 74 EMDEs.
A. Impulse response functions from the baseline heterogeneous PVAR specification (bivariate model with short-run orthogonalization). Solid lines show the average GDP responses to an FDI inflow shock for the full EMDE sample and for the upper and lowerquartile of the distribution of impulse responses. Dashed lines show associated 90-percent confidence bands.
B. Bars show the GDP response to an FDI inflows shock three years atter impact. Whiskers indicate 90 percent confidence intervals. Sample includes 74 EMDEs of which 11 are LICs.
C -F. "High FDI impact" and "low FDI impact"samples consist of countries with estimated GDP response to an FDI shock above the 75th percentile and below the 25th percentile respectively. Bars indicate the averages and whiskers represent 90-percent confidence intervals. "Trade openness" is the sum of exports and imports (in percent of GDP),"human capital" is the share of the population with completed secondary education and "informality" refers to informal employment (in percentof total employment) Control of corruption democratic accountability and investment profile are ICRG indexes. A higher index value is associated with better institutional quality.
into low-income countries (LICs) and higher income EMDEs suggests that the growth impacts of FDI are significantly weaker in LICs (figure B3.2.1.B). A review of the properties of sub-samples with strong and weak responses of output to FDl-defined as the lower and upper quartiles of the estimated coefficient-points to certain structural characteristics that magnify the positive effects of FDI (figures B3.2.1.GF; additional results are reported in table B3.2.1).
In particular, better institutions-such as a sound business environment, control of corruption, and strong
regulatory quality-amplify the growth effects of FDI. Trade openness (measured as the sum of exports and imports as a percent of GDP) is higher by 16 percentage points in the high-FDI impact sample compared to the low-FDI impact sample. Educational attainment also matters: the share of the population with completed secondary education is higher by 10 percentage points in the high-FDI impact countries. Countries with high informality tend to have lower returns to FDI. In the low-FDI impact sample informal employment (as a share of total employment) is higher by about 16 percentage points compared to the high-
impact sample. Countries with larger output effects also tend to have a greater intensity in greenfield FDI, confirming the findings in previous literature (Harms and Meon 2018).
Conclusion
The analysis presented in this box suggests that FDI has a positive and statistically significant effect on economic growth in the average EMDE. The magnitudes of these
effects, however, vary substantially across the sample, which helps explain inconclusive results reported in the existing empirical literature. Structural differences between countries with a high impact of FDI on output and those with a low FDI impact help explain these diverse effects and provide support for reforms that improve the quality of institutions, reduce economic informality, facilitate human capital development, and foster economic integration.
TABLE 83.2.1 Characteristics of countries with high and low growth effects of FDI
Sources: PRS Group's International Country Risk Guide (ICRG); World Bank Country Policy and Institutional Assessment (CPIA) dataset.
Note : FDI refers to real net FDI inflows."High FDI impact' and "low FDI impact''samples consist of countries with the estimated GDP response to an FDI shock above the 75th percentile and below the 25th percentile, respectively The column "Difference between samples A and B" reports the difference between the sample means of the high·and the low-FDIimpact groups for each variable Sample includes 74 EMDEs; each quartile includes 18 EMDEs Highervalues of the institutional quality indexes reflect better institutional outcomes
The share of greenfield FD/ projects involving investment in the environmental technology sector has increased in recent years , alongside an increase in the stringency of environmental policies. In EMDEs, environmental policy stringency is positively correlated with FD/ inflows FD! restrictions in climate-sensitive sectors are generally greater in EMDEs than in advanced economies.
A Share of FDI capital expenditures in B Environmental policy stringency the environmental technology sector
promote the energy transition and environmental sustainability in the recipient economy through the transfer of environmentally friendly technologies and capital by MNEs, improvements in the energy efficiency in business activities, and the introduction of renewable energy technologies with positive spillovers to domestic enterprises (Cole, Elliott, and Zhang 2017; Copeland 2008)
C Correlation between environmental policy stringency and FDI inflows as a share of GDP
D FDI restrictiveness in climatesensitive sectors
Both the "halo" and "haven" effects have influenced FOi location decisions, and empirical studies to date do not provide clear evidence supporting the dominance of either hypothesis. Some studies find that stringent environmental regulations tend to deter FOi associated with high pollution, while others reported only a weak impact of environmental laws on FOi inflow. 13 However, more recent analysis shows that FOi specifically related to environmental technologies, such as renewable energy, has been boosted by stronger climate policies in recipient economies (Jaumotte et al. 2024; Pienknagura 2024).
Sources: fDi Markets;OECD; World Bank.
Note : EMDEs = emerging market and developing economies; LICs = low-income countries.
A. Capital expenditures associated with FDI announcements. Environmental technology sectors are defined by fDi Markets and include electric vehicles, wind technologies,and othersectors that are intensive in environmental technologies
B.C. The environmental policy stringency (EPS) index incorporates information on market-based, non-market-based, and technology support policies (Botta and Kozluk 2014; Kruse et al. 2022) Sample includes 24 advanced economies and 9 EMDEs between 1990-2020
C Stars denote statistically significant correlations at 1 percent ('") or 5 percent (") levels
D Sample includes 32 advanced economies and 51 EMDEs Averages for 2010-20
FOi inflows can exert both positive and negative effects on the environment in a recipient economy. The outcome depends on the recipient economy's environmental regulations and how they influence the investment incentives of MNEs. According to the pollution haven hypothesis, foreign investors, especially those involved in highly polluting activities, are drawn to countries with more lenient environmental regulations. This impedes the energy transition and exacerbates environmental problems. By contrast, the pollution halo hypothesis suggests that FOi can
Several empirical studies suggest that foreignowned enterprises tend to produce less pollution than domestic firms, supporting the pollution halo hypothesis (Eskeland and Harrison 2003; Xiahou, Springer, and Mendelsohn 2022). In a metaanalysis of 65 studies, Oemena and Afesorgbor (2020) reported a generally negative relationship between FOi and environmental em1ss10ns. However, some studies focusing on individual countries or regions also reported a positive association between FOi and emissions (Abdo et al. 2020; Acharyya 2009; Blanco, Gonzalez, and Ruiz 2013).
The mixed empirical evidence on the environmental effects of FOi may be related to differences in the strength of various transmission channels, including the following:
13 Negative effects of environmental regulations on FDI are found in Bialek and Weichenrieder (2015), Chung (2014), and Mulatu (2017). See also a related discussion of "investment leakage"-the loss of industrial production due ro relocation to countries with less stringent environmental standards in De Beule, Schoubben, Struyfs (2022). Javorcik and Wei (2003) and Poelhekke and Van der Ploeg (2015) found a weak relationship between environmental laws and FDI.
Foreign direct investors can influence the decisions of their foreign subsidiaries, branches, and affiliated enterprises, to invest in green production processes. This typically involves spending on environmentally friendly technologies, business operations, machinery, and equipment (Balaguer, Cuadros, and Carda-Quevedo 2023). FDI may facilitate greater specialization in green technologies in recipient economies (Castellani et al. 2022).
FDI can promote a shift in energy consumption toward renewables through technological spillovers that promote more energy-efficient practices (Doytch and Narayan 2016) Recent analysis finds that FDI has been shifting toward activities that consume renewable energy and away from the use of fossil fuels (Knutsson and Flores 2022). Investments that involve renewable energy tend to outperform those reliant on fossil fuels in terms of risk and return, and the cost of capital tends to be lower for renewable energy companies than for fossil fuel companies (IEA and Centre for Climate Finance & Investment 2021). The transition to renewable energy can help mitigate economic volatility and uncertainty driven by reliance on fossil fuels and elevated commodity market volatility. Amid the accelerating transition to renewable energy, FDI inflows are likely to increase to countries that supply critical minerals essential for the energy transition (Hund et al. 2020).
Foreign-owned firms tend to be more energy efficient than their domestic counterparts. For instance, using sectoral analysis for a global sample of countries, Borga et al. (2022) showed that the carbon intensity of foreign-owned firms is lower than that of domestic firms. Brucal, Javorcik, and Love (2019) came to similar conclusions regarding the energy intensity of manufacturing plants in Indonesia.
Foreign-owned firms tend to use environmental management systems more intensively than
domestic companies (Albornoz et al. 2009; Kannen, Semrau, and Steglich 2021) Firm-level analysis using data from World Bank Enterprise Surveys finds that foreign companies are more likely to pursue green management strategies and prionuze environmental concerns in their operations (Kannen, Semrau, and Steglich 2021). Furthermore, a larger share of foreign-owned firms than domestic firms tend to meet various environmental goals, including the use of strategic objectives and the monitoring of energy consumption (OECD 2022) MNEs may also have reputational incentives to locate their operations in countries with strict environmental regulations (Poelhekke and Van der Ploeg 2015)
FDI can be an important source of funding to help EMDEs address the rising challenges of climate change-especially with respect to meeting climate adaptation needs. The current lack of FDI directed toward climate mitigation and adaptation needs is associated with the uncertain investment environment, large costs, and the long horizons of climate-related investment projects (Botwright and Stephenson 2023) Unclear country-level plans for adaptation, the scarcity of information on climate risks and costs, and insufficient risk reduction incentives for private investors also tend to limit private investment in climate adaptation (World Bank 202la). 14
The continued decline in biodiversity has massive adverse consequences-by some estimates, the collapse of ecosystems could result in a 2.3 percent annual decline in global real GDP by 2030 (World Bank 20216). FDI can help to finance projects focused on nature preservation and implement sustainable practices (Karadima 2021). At the same time, the ecological footprint associated with FDI can be significant, particularly in the extractive and manufacturing sectors
14
(Ooytch, Ashraf, and Nguyen 2024). This underscores the importance of environmental standards and regulations to mitigate these risks and promote environmentally friendly FOi.
The strength of these transmission channels and the net effects of FOi on the energy transition and environmental sustainability depend on country characteristics and may also vary by sector (Borga et al. 2022; Ooytch, Ashraf, and Nguyen 2024; Kannen, Semrau, and Steglich 2021). Thus, the positive environmental effects of FOi have been found to be stronger in countries with higher income levels, better human capital, and stronger institutions, particularly those with less corruption (Cole, Elliott, and Fredriksson 2006; Lan, Kakinaka, and Huang 2012).
Internationally comparable data on the stringency of environmental policy overtime are limited, especially for developing countries. However, available data for a sample of 24 advanced economies and 9 EMOEs since the 1990s indicate that environmental policy has generally become more stringent (figure 3.6.B). Such stringency has been significantly positively correlated with FOi inflows in EMOEs, although the correlation is weak in advanced economies (figure 3.6.C). Stricter environmental regulations thus do not appear to have discouraged FOi inflows in EMOEs at least in this limited sample of countries. Among environmental policies, technology support policies, such as rules promoting lowcarbon research and development expenditures in the public sector and price support for solar and wind technologies, tend to be more strongly correlated with FOi than market-based policies that involve em1ss1ons trading schemes or pollution taxes and non-market-based policies implementing hard limits on pollutants.
Many EMOEs are highly vulnerable to climate change, and FOi can provide important financial support toward climate adaptation and mitigation. Certain economic sectors have been identified as more susceptible to the adverse effects of climate change, including agriculture, electricity, fishing,
forestry, and transportation.15 These climatesensitive sectors also tend to have significant funding gaps for climate change adaptation To some extent, these gaps could be reduced by FOi. However, regulatory restrictions on FOi in many of these sectors in EMOEs tend to be stronger than in other sectors, as well as stronger than in advanced economies (figure 3.6.0)
As shown in the previous sections, FOi can boost economic growth and development-provided that recipient economies nurture a conducive environment. Especially for LICs, small, and capital-scarce economies, FOi can be an important source of funding, technology spillovers, and improved access to foreign markets. The recent trend toward fragmentation of international trade and investment networks has made EMOEs particularly vulnerable to declines in FOi, underscoring the need to promote and sustain FOi inflows. This section examines the key factors that can foster FOi, drawing on the literature and evidence from new empirical analysis
Motives for FOi
FOi flows depend on the motives that drive companies based in one country to acquire ownership of productive assets located in another. In brief, market-seeking FOi and export-platform FOi are driven by the desire of multinational enterprises (MNEs) to gain access to broader international markets for their goods and services. MNEs may also seek to optimize their crossborder production processes and secure access to productive inputs at lower costs, and these aims may drive efficiency-seeking, resource-seeking, and strategic asset-seeking FOi.
Companies may also attempt to mitigate regulatory obstacles to trade and production by engaging in regulatory-arbitrage FOi to exploit differences in
15 For a discussion on the role of FDI in climate adaptation and mitigation, see Botwright and Stephenson (2023), World Economic Forum (2023), and UNCTAD (2022b) For a discussion of climate sensitive secrors, see Lovei (2017), Oh et al (2019), UNCTAD (2022a), and World Bank (2012).
regulatory frameworks between countries. This includes tariff and non-tariff-barrier-jumping FOL More specifically, FOI can be used to take advantage of a laxer regulatory environment and avoid labor market, financial market, and other regulations or market restrictions. For instance, when import tariff protection or non-tariff barriers are high, MNEs can use FOI to gain access to the recipient market as an alternative to more costly exports (Adarov and Ghodsi 2023; Javorcik and Spatareanu 2005). A particular type of regulatoryarbitrage FOI is phantom FDl which is motivated by MNEs' profit shifting and tax optimization Such capital flows are often routed through offshore financial centers and shell companies and may not involve any real economic activity in recipient economies (Aykut, Sanghi, and Kosmidou 2017; Oamgaard, Elkjaer, and Johannesen 2024).
These corporate motives for FOI are influenced by a wide range of pull and push factors in the recipient and source economies, as well as by global and bilateral factors. Push factors are structural characteristics and macroeconomic conditions in the source country that encourage FOI outflows. Pull factors are characteristics of recipient economies that attract FOI inflows. Bilateral factors refer to the strength of social, political, legal, and economic ties between the source and recipient economies. Global factorssuch as global economic growth and financial conditions, commodity market fluctuations, shifts in risk and uncertainty, and other common shocks-also affect FOI flows.
Among the push factors that tend to encourage FOI outflows from the source country are its weak growth prospects, macroeconomic risks, political instability, rising production costs, and deterioration of the regulatory environment. On the pull side, some of the main factors boosting FOi inflows are the recipient economy's market size or its proximity to large markets in other countries; the availability of inputs that offer higher productivity at lower costs; financial deepening; better quality of institutions and infrastructure; and a favorable regulatory environment. At the global level, FDI is facilitated by reductions in
international transport and communication costs. Shifts in risk perceptions and liquidity may also lead to synchronized cross-border capital flows, forming a global financial cycle. However, the latter is more relevant for portfolio investment than for FOL 16
Factors relating to the bilateral ties between FOI source and recipient economies include mutual transaction costs, trade and investment treaties, migration, political relations, information frictions, and regulatory barriers such as FOI screening mechanisms-regulations for authorizing or prohibiting FOI on grounds of national security or strategic policy considerations. 17
Empirical evidence suggests that the importance of these factors may vary across FOI recipient sectors For instance, in manufacturing and services, market size and output growth tend to play important roles in driving FOL Trade openness has been found to matter for FOI in manufacturing, particularly export-oriented sectors. 18 FOI in export-oriented manufacturing sectors is also facilitated by currency depreciation in the recipient economy, as domestic assets become cheaper in foreign currency terms and exports become more competitive (Blonigen 1997; Walsh and Yu 2010). Other pull factors found to encourage FOI, especially in tradable sectors, include financial development, labor market flexibility, and high-quality infrastructure (Kinoshita 2011).
16 For the implications of financial development for FDI, see Desbordes and Wei (2017); for the role of human capitalNoorbakhsh, Paloni, and Youssef (2001); for institutions-Bailey (2018) and Benassy-Quere, Couper, and Mayer (2007); and for infrastructure-Mensah and Traore (2024). For a discussion of global financial cycles, see Adarov (2022), Claessens, Kose, and Terrones (2011), and Miranda-Agrippino and Rey (2021).
17For the association between trade and FDI, see Adarov and Stehrer (2021), Blanchard et al. (2021), and Blonigen and Piger (2014). The role of geopolitical factors is discussed in Aiyar et al. (2023) and Aiyar and Ohnsorge (2024); regulatory divergence-in Fournier (2015); and migration networks-Kugler and Rapoport (2007). Implications of information frictions related to the familiarity with the investment environment and financial marker efficiency for FDI inflows and their persistence are discussed in Khraiche and de Araujo (2021).
18 See Chen, Geiger, and Fu (2015), Kinoshita (2011), and Makki, Somwaru, and Bolling (2004) for the heterogeneous effects of trade openness, marker size, and other country characteristics on sectoral FDI.
Better macroeconomic conditions and strong institutions are help to attract FDI. International economic integration including through trade openness, investment treaties, and participation in global value chains also promotes FDI. By contrast, statutory restrictions on FDI and geopolitical tensions inhibit FDI.
A Effects of an improvement in macroeconomic characteristics on FDI inflows
B Effects of an improvement in institutions on FDI inflows
To assess the key drivers of FOi in a single consistent framework, a structural gravity model is applied to bilateral FOi flows data for a global sample of 188 countries over the period 2000-19. The gravity model-a workhorse empirical tool in international trade and investment analysisexplains FOi flows between any given pair of countries by their economic sizes, geographical distance, structural characteristics, macroeconomic conditions, policy factors, and strength of bilateral linkages and mutual barriers to capital flows (methodological details are provided in annex 3.2).
C Effects of investment integration and diplomatic disagreement on FDI inflows
D Effects of trade integration on FDI inflows
Sources: Bailey, Strezhnev,and Voeten (2017); CEPII; OECD; PRS Group's International Country Risk Guide (ICRG); UNCTAD; World Bank.
Note: The marginal effects are based on gravity model estimates reported in table A3.2.1. Methodology details are reported in annex 3 2 GVC = global value chain.
A Bars show marginal effects on FDI inflows of a 1-percent increase in real GDP and labor productivity,and a 1-percentage-point increase in the average private credit-to-GDP ratio
B Bars show marginal effects on FDI inflows of an increase from the sample median to the top quartile of ICRG law and order and investment profile indexes
C. Bars show marginal effects on FDI inflows of the existence of an investment treaty with the FDI source country,an increase from the sample median to the top quartile of the FDI restrictiveness index (OECD) and an index measuring diplomatic disagreement with the FDI source country (Bailey, Strezhnev,and Voeten 2017).
D. Bars show marginal effects on FDI inflows of a 1-percentage-point increase in trade openness (sum of exports and imports as a percent of GDP) and GVC participation (value-added trade as a percent of exports).
By contrast, FOi in the primary sector, largely driven by resource-seeking motives, is much less sensitive to macroeconomic conditions in the recipient economy (Walsh and Yu 2010) While the quality of institutions still matters for FOi in the primary sector in general, some studies find that its role has varied across sub-sectors: institutions have little impact on FOi in extractive sectors, but strong institutions that promote democracy and property rights have been beneficial to FOi in agriculture (Campos and Kinoshita 2003; Rygh, Torgersen, and Benito 2022).
Macroeconomic factors and structural characteristics
Market size. The results produced by the gravity model show that the market size of the recipient economy, as measured by its GDP, is positively associated with FOi inflows (table A3.2.l). A 1percent increase in the real GDP of a recipient country is associated with an increase of about 1 percent in FOi inflows (figure 3.7.A).19 This result is consistent with a meta-analysis of the literature and points to the significance of market-seeking motives underpinning FOi (Blonigen and Piger 2014).
The results also suggest that a recipient economy's proximity to other sizable markets matters, providing evidence of the export-platform FOi motive. FOi inflows increase by about 0.5 percent for every I-percent increase in the recipient country's surrounding market potential, measured by the aggregate output of other countries weighted by the inverse of their distance to the recipient country. The capacity to bring this type of FOi is particularly beneficial for small economies whose own market size and production capacity make them less attractive as an FOi destination (Ekholm, Forslid, and Markusen 2007)
19 Since the gravity model uses a non-linear exponential specification, the estimated coefficients of log-transformed variables can be directly interpreted as elasticities, while the marginal effects of non-transformed variables are computed as 100*( - 1), where is the exponent and is the estimated coefficient from the gravity model. Annex 3.2 provides further details.
e b e b
Productivity and technological intensity. Higher labor productivity facilitates FDI inflows: a I-percent increase in labor productivity is associated with an increase in FDI inflows of about 0.7 percent (figure 3.7.A). Moreover, improvements in labor skills and R&D investment in the recipient economy relative to the source country encourage investment inflows from the latter to the former (table A3.2.1). These results suggest that human capital development and technological progress should be among the priorities for EMDEs seeking to boost their FDI inflows.
Financial market development. The analysis shows that countries with better-developed financial markets tend to attract more FDI: an increase in the long-run average private credit-toGDP ratio of 1 percentage point is associated with an increase in FDI inflows of about 0.6 percent (figure 3.7.A). This is consistent with findings in the literature showing that deep and liquid financial markets reduce the costs of financial transfers between MNEs and their foreign affiliates and business partners, and can thus facilitate FDI Qude 2019; Mileva 2008).
Other country characteristics. The costs of starting a business and sovereign risk are among the factors that can negatively affect FDI inflows. Both factors affect investors' perceptions of riskadjusted returns on planned investment, particularly for greenfield investment (Cai, Gan, and Kim 2018). Therefore, elevated debt levels and rising debt-service burdens in many EMDEs constitute serious risks to FDI inflows (World Bank 2024a). The results also highlight the significance of natural resource-seeking motives of FDI, which are important for commodityexporting EMDEs (table A3.2.1). Large natural resource discoveries can also trigger FDI inflows into sectors other than the primary sector (Toews and Vezina 2022). Although empirical evidence generally suggests that FDI in extractive sectors tends to yield little growth dividend in recipient economies, access to critical minerals needed for the energy transition has gained importance as a motive of FDI (UNCTAD 2024a).
Strong institutions are especially important for greenfield FDl-the dominant form of FDI in
EMDEs, which is often associated with substantial initial sunk costs and long planning horizons of investment projects. An investor-friendly business environment in the recipient economy is critical for attracting FDI. The results suggest that an improvement in the investment climate or institutional quality from the median to the highest quartile of the global sample tends to boost FDI inflows by up to one-fifth (figure 3.7.B).20 Likewise, the analysis shows that improvements in other institutional dimensions, such as the quality of the government bureaucracy are conducive to FDI (table A3.2.1).
Investment integration. Investment agreements are found to be associated with a significant boost in FDI: on average, investment treaties tend to increase FDI flows between signatory states by over two-fifths, controlling for other factors (figure 3.7.C). Further, the results indicate that statutory FDI restrictions significantly inhibit FDI flows: tightening FDI restrictions from the median to the highest quartile of the global sample tends to reduce FDI by over 7 percent 21 These results also corroborate previous findings (Ghosh, Syntetos, and Wang 2012; Mistura and Roulet 2019).
Geopolitical factors. Escalating geopolitical tensions in recent years have undermined progress made in global economic integration and raised the risks of a retrenchment in FDI. To gauge the role of geopolitical factors in determining FDI, the analysis uses the bilateral diplomatic disagreement index constructed by Bailey, Strezhnev, and Voeten (2017) based on the similarity of UN voting patterns by a given pair of countries. The index ranges from 0 to 5, with higher values indicating a greater degree of diplomatic disagreement between pairs of countries. The results
20 In chis exercise, investment climate and institutional quality are measured by the ICRG investment profile and rule of law indexes, respectively. The estimates reported in table A3.2 l are converted ro marginal effects in the context of the sample median and interquartile ranges to ease interpretation.
21 A tightening of FDI regulations, as measured by the OECD's FD! Restrictiveness index, from the most liberal level in the sample (countries such as Portugal and Slovenia) co the most restrictive level (for instance, Libya), is associated with a decline in FD! inflows by four-fifths.
The formation of investment and trade agreements has slowed, while geopolitical risk and policy uncertainty have risen notably in the 2020s Major economies have experienced a slowdown in their inward and outward FOi between 2013-17 and 2018-23 Connector economies managed to capitalize on the trade and investment reorientation strategies of China and the United States to drive up their FOi inflows from one or both of these countries in recent years.
Investment agreements
agreements C. Fragmentation and geopolitical risk
E FDI to and from major economies F Greenfield FDI inflows to connector economies
suggest that greater geopolitical disagreement between country pairs is associated with lower FDI flows between them Mutual FDI flows tend to be lower by about one-eighth between pairs of countries that are in the top quartile of this index than between those at the global sample median (figure 3.7.C). The results corroborate and expand recent empirical evidence on greenfield FDI (Aiyar, Malacrino, and Presbitero 2024)
Trade linkages. International trade is an integral part of cross-border production sharing and is closely intertwined with FDI (Adarov and Stehrer 2021). The analysis indicates that countries that are more open to trade tend to receive more FDI-an extra 0.6 percent in FDI for each percentage-point increase in the ratio of exports plus imports to GDP (figure 3.7.D). Greater integration into global value chains is also found to be conducive to both inward and outward FDI (table A3.2.1)
The rise in geopolitical tensions in recent years has been accompanied by increased restrictions on FDI flows and international trade. Although EMDEs are generally more open to cross-border capital flows now than they were in the early 2000s, progress with global financial integration has stalled in recent years. EMDEs maintain more restrictive investment environments than advanced economies Major economies are contemplating further trade and investment restrictions, jeopardizing FDI flows to EMDEs.
Sources : Baker, Bloom and Davis (2016); Caldara and lacoviello (2022); fDi Markets; FernandezVillaverde Mineyama, and Song (2024); UNCTAD; World Bank; World Trade Organization.
Note: EU = European Union; RHS = right-hand side; U.S. = United States.
A. Data include new international investment agreements that are in force as of April 2025.
B. Average number of new trade agreements in force per year calculated through September 2024 Sample excludes agreements signed by the United Kingdom
C Diamonds show five-year averages of the monthly Caldara and lacoviello global geopolitical risk index, and bars show five-year averages of the quarterly Fernandez-Villaverde,Mineyama, and Song fragmentation index, where the lastobservations are April 2025 and 202401, respectively.
D Period averages of the monthly Baker, Bloom, and Davis economic policy uncertainty index. Last observation is March 2025
E. Bars show average annual net FDI inflows or outflows.
F. Bars show cumulative values of announced greenfield FDI inflows to Indonesia, Mexico, Morocco, Poland, and Viet Nam in 2010-14 and 2020-24,by source economies
The global financial crisis and the associated global recession of 2009, the disruptions to global supply networks in 2020 and 2021 resulting from the COVID-19 pandemic, and worsening relations between some major economies have all had negative consequences for international trade and investment. The number of new investment agreements implemented since 2010 has more than halved relative to the first decade of the century, contributing to the slowdown in FDI
Rows (figure 3.8.A; UNCTAD 2024a). Moreover, in the past three years, the number of terminations of international investment treaties exceeded the number of new treaties signed over the same period (UNCTAD 2024a) Similarly, while trade fell to the slowest pace since 2000, trade integration has also slowed: the number of new trade agreements fell from an average of 11 in the 201 Os to only 6 in the 2020s (figure 3 8.B; World Bank 2024a, 2025). Meanwhile, negotiations on reforming and reviving the multilateral trading system have stalled.
Given these developments, geopolitical risk has risen notably in recent years, reaching its highest levels since 2003 (figure 3.8.C). Economic policy uncertainty has climbed to the highest levels on record, in part reflecting global supply chain disruptions and macroeconomic shocks triggered by the COVID-19 pandemic (figure 3.8.D). High trade policy uncertainty undermines trade and output growth (World Bank 2024a). One outcome of elevated uncertainty is that crossborder investment has become increasingly concentrated in a declining number of MNEs (Ragoussis, Rigo, and Santoni 2024). Given the strong relationship between international trade and cross-border financial Rows, these adverse trends are likely to put additional downward pressure on FDI in EMDEs (Nebe, Economou, and Abruzzese 2024; UNCTAD 2024a).
FDI Rows show increasing signs of decoupling along geopolitical fault lines (ECB 2024; UNCTAD 2024a; World Bank 2024d). The United States has reduced its sourcing from China while concurrently increasing its trade and FDI linkages with India, Mexico, and Viet Nam (Alfaro and Chor 2023; Freund et al. 2024; Kallen 2025). Russia's invasion of Ukraine in 2022 was followed by rapid divestment by foreign firms from Russia (Evenett and Pisani 2023; World Bank 2023c).
The net effects of further fragmentation on FDI patterns are not yet fully clear, in part reflecting the fact that major adjustments of FDI activities involve substantial costs and require time to implement by MNEs, while in the environment of high policy uncertainty many investors adopt a "wait-and-see" approach (Blanchard et al. 2021;
Myles 2025). Global economic fragmentation so far has primary affected certain "strategIC industries, such as ICT, transport, and professional, scientific, and technical services (Tan 2024).
That said, recent surveys of global investors indicate that rising geopolitical risk, supply chain disruptions, and a more restrictive business regulatory environment are among the key factors shaping investors' decisions that could significantly shift their usual FDI location choices (Citi 2025; Kearney 2025) Amid rising trade tensions and geopolitical risks, MNEs have been increasingly considering strategies to de-risk their business activities by shifting their production and trade toward geopolitically aligned countries (friend-shoring), countries in geographic proximity (near-shoring), or back to their home countries with local sourcing of intermediate inputs (reshoring). Tit-for-tat escalation of international trade disputes and restrictions on cross-border investment will result in additional fragmentation of economic networks.
Higher trade costs driven by tariff hikes may incentivize MNEs to use FDI as an alternative way to gain access to the market of the country imposing tariffs (tariff-jumping FDI) By contrast, higher tariffs increase the cost of production along global value chains, discouraging efficiencyseeking FDI. Most MNEs, however, are neither purely market-seeking nor efficiency-seeking, and the net effects of tariffs depend on specific investment project characteristics (Blanchard et al. 2021).22
Amid rising geopolitical tensions, the largest economies-China, the European Union, and the United States-experienced sizable contractions in both their inward and outward FDI Rows in the past five years (figure 3.8.E). Outward FDI Rows from the European Union and the United States more than halved as a share of GDP in 2018-23 relative ro 2013-17. In these economies, the fiveyear average of FDI outflows as a share of GDP fell to a 20-year low during 2018-23.
22 See also Roeger and Welfens (2022) for analysis of the cost effects ofimport tariffs offsetting the tariff-jumping effect on FDI.
Announced FOi policy measures announced in EMOEs have become more restrictive in the 2020s. Regulatory restrictions on FOi remain much higher in EMOEs than in advanced economies, with the exception of FOi screening mechanisms The number of countries with FOi screening in place more than doubled in the past decade, while the number of tradedistorting policy measures has escalated in recent years.
redirection of FDI flows to "connector" economies chat have a favorable mix of FDI policies and structural characteristics. "Connector" countries are geopolitically non-aligned countries and can serve as conduits in trade and investment flows between geopolitical blocs (Aiyar and Ohnsorge 2024; Gopinath et al. 2024). Some connector economies-for instance, Indonesia, Mexico, Morocco, Poland, and Viet Nam-managed to capitalize on the trade and investment reorientation strategies of China and the United States to drive up FDI inflows from one or both of these countries in recent years (Bloomberg 2023; figure 3.8.F).
FOi screening and other regulatory restrictions
Fragmentation trends are likely to be accelerated by the increasing use of regulatory restrictions on international investment and trade aimed at reducing FDI and trade exposures to non-aligned geopolitical blocs.
Sources: GTA (database); OECD FDI Regulatory Restrictiveness Index; UNCTAD World Investment Report 2024; World Bank.
Note: EMDEs = emerging market and developing economies.
A. Sample includes 83 EMDEs. The line shows the number of announced restrictive FDI measures,and bars show the share of announced restrictive FDI measures in all announced FDI policy measures 2025 includes announcements between January and April 2025 Dashed line denotes 50 percent.
B. Averages of indexes for overall FDI restrictions, foreign equity limits for FDI foreign personnel restrictions, and screening and approvals for FDI. Sample includes 32 advanced economies and 51 EMDEs,and covers the period 2016-20.
C Numberof countries with FDI screening mechanisms in place, introduced,orexpanded.
D Data include policy measures affecting goods trade Implemented interventions that discriminate against foreign commercial interests. Contingent trade-protective measures include trade defense instruments such as safeguard investigations and anti-circumvention, antidumping, and countervailing measures Subsidies cover state loans financial grants loan guarantees production subsidies,and otherforms of state support, excluding export subsidies Adjusted data (for reporting lags) as of April 9,2025
However, some EMDEs may also benefit from the reorientation of FDI flows driven by tariffjumping and export-platform motives of FDI, occurring when an MNE establishes production in a host country primarily to export goods or services onward to third-country markets rather than to serve the host country market itself. More specifically, FDI may be redirected to geopolitically aligned countries or chose chat satisfy criteria for political stability, regulatory quality, and other factors conducive to investment. Such developments have been reported with regard to the
Over the years, EMDEs have gradually eased statutory FDI restrictions-legal limits on the extent of foreign equity ownership, employment, investment, and other limitations on foreign firms. However, progress by EMDEs in reducing regulatory restrictions on FDI inflows made in the 201 Os has stalled and reversed recently (figure 3.9.A). Since 2019, the number of restrictive FDI measures announced in EMDEs and their relative share in all FDI policy measures have increased. The level of restrictions remains much higher in EMDEs than in advanced economies, on average, particularly for foreign investors' equity and foreign personnel (figure 3.9.B). Overall, capital accounts have remained more open in advanced economies than in EMDEs, especially LICs.
FDI screening mechanisms have become more widespread in recent years (figure 3.9.C). The number of countries with FDI screening in place more than doubled in the past decade, from 17 countries in 2014 to 41 countries in 2023. Some countries have adopted a general safeguard clause on national security in their investment laws. Ochers have imposed restrictions on FDI in specific sectors deemed to be sensitive from a national security standpoint, such as limits on
foreign paruopation, which may provide formal grounds for rejecting unwanted FDI. Sectors deemed security-sensitive have included semiconductors, ICT, and critical energy and transport infrastructure (Aiyar et al. 2023; IMF 2023a) Screening of outward FDI by advanced economies may also pose a potential threat to FDI Rows to EMDEs (Myles 2024).
Likewise, the number of restrictions and tradedistorting policy measures has escalated in recent years (figure 3.9.D). Among newly introduced trade-distorting policies, the use of subsidies has risen sharply since the pandemic. These policies have often been coupled with "buy local" provisions that further incentivize localized production and reduce reliance on foreign-sourced inputs
As a result of these developments, further reconfiguration of global value chains will likely be accompanied by a shift in FDI to alternative locations, possibly including the source economies. For example, U.S. firms have recently diverted some investment from China to Mexico and Viet Nam, while U.S.-based MNEs in some sectors, such as semi-conductors, plan to establish more activity within the United States (Alfaro and Chor 2023; Kurilla 2024; World Bank 2024d). Such reconfiguration of trade and investment networks could hinder global economic growth. For instance, re-shoring may lead to global output losses of up to 5 percent (IMF 20236; Javorcik et al. 2022).
Unlike advanced economies, many EMDEs have continued to adopt policies favorable to foreign investors. Over four-fifths of the policy measures adopted by developing countries in 2023 were conducive to foreign investment, especially investment facilitation measures taken to increase the transparency and efficiency of investmentrelated regulations (UNCTAD 2024a). Similarly, FDI screening mechanisms are more widespread among advanced economies than EMDEs. As of 2023, about 40 countries had investment screening mechanisms in place, and a further eight countries were expected to implement new ones. However, only 10 EMDEs had established screening mechanisms, and none were expected to implement new ones (UNCTAD 2023)
The challenges associated with escalating trade tensions and fragmentation, policy uncertainty, and macroeconomic risks jeopardize global FDI Rows and call for redoubled policy efforts in EMDEs. A comprehensive policy strategy should focus on a three-pronged approach: attract FDI, amplify FDI benefits, and advance global cooperation to mitigate the costs of fragmentation. Key policy pnonnes include strengthening institutions, promoting macroeconomic stability, deepening financial markets, easing restrictions on cross-border investment and trade, reducing economic informality, and improving human capital. These policies can also help EMDEs to leverage FDI inflows to address key development challenges, including reduction of poverty and inequality, job creation, climate change, and greater economic inclusion for women. Coordinated global efforts are needed to uphold a rulesbased international system for investment and trade, channel FDI toward countries with the largest investment gaps, and provide support for structural reforms.
To attract FDI to their economies, policy makers in EMDEs should improve institutional quality, promote macroeconomic stability, and ease trade and investment restrictions. They should also pursue FOi-specific policies-in particular, easing regulatory restrictions on FDI. Other FDI-specific policies should be implemented after carefully considering their potential effects and tradeoffs, as evidence of their effectiveness has been mixed
Strengthen institutions andfoster an investment-friendly business environment
In light of heightened geopolitical tensions, EMDEs should seek to assuage investor concerns by demonstrating a strong and stable commitment to improving the investment environment EMDEs generally, and LICs in particular, have far lower institutional quality than advanced economies (figure 3.10.A-D) Yet progress in the quality of the business regulatory environment, control of corruption, and other institutional measures has largely stalled during the past decade in both LICs and EMDEs excluding LICs. Besides
Progress with institutional reform has stalled in the past decade. EMDEs score lower than advanced economies across a range of measures of institutional quality. Institutions tend to be especially weak in L!Cs. These conditions hinder both FOi inflows and their macroeconomic benefits.
Sources: PRS Group's International Country Risk Guide (ICRG);World Bank;World Bank's Country Policy Institutional Assessment (CPIA) database.
Note: EMDEs = emerging market and developing economies; LICs = low-income countries. Bars show group medians of institutional quality index values A.-C ICRG's investment profile, control of corruption, and democratic accountability indexes Sample includes 36 advanced economies and 102 EMDEs, of which 18 are LICs D CPIA's business regulatory environment index Sample includes 83 EMDEs of which 22 are LICs
other factors important for the investment climate, expropriation risks can adversely affect investor sentiment (Akhtaruzzaman, Berg, and Hajzler 2017; Busse and Hefeker 2007).
Structural reforms should be prioritized, especially in economies that are lagging in terms of institutional quality, such as many in SSA. Besides facilitating FOi inflows and bolstering their positive macroeconomic effects directly, strengthening institutions is important for improving other key structural characteristics that are conducive to FOi inflows, such as human capital development and financial market depth
Promote macroeconomic stability, growth, and financial markets
Reforms promoting economic growth and macroeconomic stability are critical to attracting
FOi. Policies that facilitate financial development and reduce sovereign risk also improve the investment climate EMOEs-and LICs m particular-have much-less-developed financial markets than advanced economies Sovereign risk in EMOEs also tends to be worse than in advanced economies, with only marginal improvement between 2000-11 and 2012-23 (World Bank 2024a) Although economic growth in EMOEs is stabilizing, significant downside risks remain.
Reduce barriers to cross-border trade and financial flows, including through investment and deep trade agreements
More open economies tend to be attractive destinations regardless of FOi motive. Integration agreements, especially those with deep trade and investment integration prov1s10ns, have been effective in facilitating cross-border investment (Mattoo, Rocha, and Ruta 2020; World Bank 20236). Regional integration can be increasingly important for EMOEs to facilitate a conducive investment environment and mitigate the adverse effects of global economic fragmentation (Baek et al. 2023; Parente and Moreau 2024; UNCTAO 20246). For the effectiveness of such agreements, it is crucial to align domestic investment laws with the standards set out in international agreements, ensure streamlined investment processes-via simplification of work permits, electronic access to laws and regulations, and technology transfer promotion-facilitate navigation of the country's regulatory landscape, and strengthen institutions that prevent and resolve investor disputes (World Bank 2024£). To facilitate integration, regional infrastructure improvements will be critical, while support for small and medium-sized enterprises (SMEs)-via transparency of regulations and simplified procedures-will be important as regional FOi is more likely to involve SMEs rather than large MNEs (UNCTAD 20246).
Investment treaties are particularly effective in encouraging FOi in sectors and projects with higher sunk costs and capital intensity, which may face greater challenges in raising private sector funding (Colen, Persyn, and Guariso 2016). For instance, the African Continental Free Trade Area has the potential to increase FOi received in Africa
by up to about 85 and 120 percent from countries in the region and from the rest of the world, respectively (Echandi, Maliszewska, and Steenbergen 2022).
The trend in EMOEs has been to reduce FOi restrictions, but policies in EMOEs still tend to be more restrictive than those in advanced economies (figures 3 7.E and 3.9). Reductions in statutory restrictions on FOi have been found to boost cross-border investments (Mistura and Roulet 2019). For instance, in Tiirkiye, the reduction of FOi screening, accompanied by a simplified registration process for foreign firms, was associated with a ten-fold increase in FOi inflows between 2003 and 2006 (World Bank 2021c).
Carefully consider investment promotion agencies, special economic zones, and fiscal incentives
Investment promotion agencies (IPAs) can establish a broad framework of arrangements to attract foreign investors with such goals as job creation and productivity and technology spillovers (EBRO 2024; Harding and Javorcik 2011, 2013; Steenbergen 2023). IPAs can facilitate a strategic approach to FDI that is consistent with national development strategies. Among other objectives, they can help steer investment toward sectors with the greatest needs and projects that support the energy transition and sustainable development. However, the effectiveness of IPAs depends on the quality of monitoring, evaluation, and other investment management processes (OECO 2019; World Bank 2021c; World Bank 20226). EMOEs, especially LICs, often suffer from the poor quality of their investment management processes and need to accelerate structural reforms to improve relevant institutions and regulatory frameworks (Adarov and Panizza 2024; World Bank 2024c).
Special economic zones (SEZs)-specific geographic areas within which governments establish preferential regulations for private investors-have been used to attract FOi via tax incentives, import duty exemptions, special customs procedures, land
access, streamlined employment regulations, and other measures.23 After the creation of the Masan SEZ in the Republic of Korea in 1970, for example, the SEZ succeeded in attracting more than $80 million in FOi in 1975-this resulted in over a ten-fold increase in the share of locally sourced inputs in the country's electronics sector over 1971-86 (Aggarwal 2012; Parole 20116) In Poland, 14 SEZs had, by 2018, cumulatively attracted investments worth $35 billion and created nearly half a million jobs (UNCTAD 2019). Although SEZs can help attract FOi and steer investment to where it is needed most, they can also be costly, and the net benefits are not always clear. By some estimates, many of the over 5,000 SEZs active in the world fail to generate significant investment or create much positive economic impact (UNCTAD 2019)
Taxes and subsidies can alter the incentives of MNEs to invest in a country However, fiscal incentives should be used judiciously by policy makers to avoid market distortions and ensure that their long-run economic benefits outweigh the costs. FOi can be stimulated through investment allowances, as well as tax credits and deductions related to investment and reinvested earnings. Fiscal incentives can also be implemented to steer or discourage FDI in certain sectors or business activities. For instance, emissions can be penalized or accelerated depreciation may be offered to investors (Sauvant, Stephenson, and Kagan 2021; Wermelinger 2023). Subsidies have also been used extensively to increase the attractiveness of certain locations or sectors for foreign investors. However, subsidies can also be costly and distortive, and thus their net long-run benefits must be carefully assessed. For instance, subsidies given with the goal of job creation may lead to employment in MNEs, but without an increase in employment in non-targeted firms and with little improvement in human capital and technology (Burger, Jaklic, and Rojec 2012; Oelevic 2020). Similarly, tax incentives can lead to a loss in government revenue (UNCTAD 2000).
23 For SEZs, see also Farole (2011a), Javorcik and Steenbergen (2017), UNCTAD (2019), and World Bank (2017)
Beyond attracting FOi, it is equally important for EMDEs to accelerate policy interventions that amplify the social and economic benefits of FOi. The policies outlined below-some of which also help to attract FOi-can help ensure that EMDEs reap benefits that align with country-specific needs.
Undertake reforms to maximize the positive effects ofFD/
A range of country-specific conditions and policies can support stronger positive effects of FOi. For example, stronger institutions not only promote FOi inflows but also help to improve the effects of FOi on output growth. The empirical analysis in this chapter suggests that FOi may fail to generate significant growth benefits when country characteristics are not conducive. The results indicate that facilitating trade integration, improving the quality of institutions, fostering human capital, and decreasing informality can all boost the macroeconomic benefits of FOi. With supportive conditions in place, FOi can help trigger sustained investment accelerations, facilitate job creation, and support potential output growth in recipient countries.24
Channel FD/ to areas that generate greater impact
It is critical for EMDEs to implement policies to attract FOi that generates greater returns in terms of macroeconomic outcomes, including private capital mobilization and creation of new jobs. Greenfield FOi is particularly important in EMDEs for output growth and domestic investment. Manufacturing sector FOi has often delivered especially large macroeconomic benefits for recipient countries. With conducive reforms, FOi can also help reduce poverty and income inequality, and increase economic opportunities for women. For example, recent evidence shows that foreign affiliates of MNEs tend to have a higher share of female employees than domestic firms, and legal frameworks promoting non-
discrimination in hiring, equal pay, and promotion are important for reducing wage disparities between men and women.25
Ensure that FD/ supports the energy transition and helps address climate change
Policy makers should aim to align their FOi frameworks and related environmental policies more closely with key development goals. Policies in recipient countries can incentivize investment in projects that contribute to climate adaptation and mitigation. They can also encourage greater use of renewable energy and clean technologies while strengthening biodiversity and nature conservation. Recent analysis, however, suggests that private investment in climate adaptation has not been sufficient. FOi can boost the contribution of private capital to addressing these pressing issues (World Bank 2021a, 20216).
EMDEs can take steps to mitigate risks and reenergize FOi by avoiding restrictive measures and promoting global economic cooperation, including through multilateral organizations
Improve global cooperation to mitigate risks
Despite rising geopolitical tensions, cooperation through international fora should be reinforced wherever possible, with the goal of restoring a rules-based order. In 2024, for example, 125 members of the World Trade Organization reached an agreement to strengthen cross-border cooperation on FOi to support sustainable development and investment in developing countries. The agreement aims to enhance the transparency and predictability of investmentrelated measures, facilitate interactions between investors and governments, and encourage sustainable investment.
When formal agreements establishing a consultative helpful. UNCTAD, for are not feasible, framework can be example, recently
24 For investment accelerations and implications for potential output, see World Bank (2024g) and Kose and Ohnsorge (2023), respectively.
25 For the effects of FDI on poverty reduction and income inequality, see Aloui, Hamdaoui, and Makrouf (2024) and Huang, Sim, and Zhao (2020). For the implications of FDI for gender equality, see Heck!, Lennon, and Schneebaum (2025), Mominari (2023), and UNCTAD (2021).
launched a Multi-Stakeholder Platform on IIA Reform to foster cross-country dialogue and identify ways to fast-track reforms to bolster international investment agreements (UNCTAD 2024a). The OECD/G20 Inclusive Framework on BEPS (base erosion and profit shifting) is another example. The framework is designed to create a level playing field for high-tax and low-tax jurisdictions by eliminating distortions affecting investment, which give rise to profit shifting by MNEs. This is particularly important for EMDEs adversely affected by profit shifting in terms of losses of government revenue (Crivelli, De Mooij, and Keen 2016). The framework will also help create a more favorable business environment, as competition for investment will be more likely to occur through non-tax measures (Owens and Wamuyu 2024).
Enhance multilateral support for private capital mobilization and structural reforms, especially inLICs
The global community should accelerate policy initiatives that can help direct FDI Rows to countries with the largest investment gaps, especially LICs. Technical and financial assistance are essential to support the implementation of reforms critical for promoting FDI inflows and maximizing their benefits. LICs have particularly large investment gaps but limited capacity to implement the necessary structural reforms.
Multilateral development banks and development finance institutions have taken an increasingly active role in mobilizing private capital. In 2023, these institutions mobilized a record $88 billion in private capital for investment in low- and middleincome countries (African Development Bank et al. 2025). Greater cooperation among multilateral institutions can maximize such outcomes. The World Bank and the African Development Bank, for example, formed a partnership to provide electricity to 300 million people in Africa by 2030, an initiative that is expected to generate $9 billion in private investment for renewable energy (World Bank 2024c). The World Bank's recent initiatives to accelerate global policy efforts to reduce barriers to private investment, such as the Private Sector Investment Lab and the new World Bank Group Guarantee Platform, can help
mmgate risks for private investors and mobilize private capital in EMDEs, including FDI (Bjerde et al. 2024; World Bank 20246).
For much of the last 50 years, global economic integration has powered the growth and development of EMDEs-with FDI constituting one of the main propellants. Slowing momentum in global integration could leave EMDEs-especially LICs-in a particularly precarious position, given their large investment gaps. It risks derailing progress toward key development goals Turning the tide will depend on robust policy responses, both at the national and global levels
Investment growth in EMDEs has slowed markedly over the past decade. This slowdown has left vast infrastructure gaps unmet and severely hampered efforts to end global poverty, inequality, and address the urgent challenges of climate change. FDI offers an important source of funding to close investment gaps and can bring multiple additional benefits by boosting economic growth, facilitating private capital mobilization, creating jobs, and contributing to progress toward development and climate related goals.
In the typical EMDE, the ratio of net FDI inflows to GDP dropped from a peak of almost 5 percent in 2008 to just over 2 percent in 2023 This decline was widespread, with FDI-to-GDP declining in three-fifths of EMDEs in 2012-23 relative to 2000-11. The weakness in FDI is likely to continue in the near term in light of subdued growth prospects and loss of reform momentum in EMDEs, elevated global trade tensions, policy uncertainty, and heightened geopolitical risks.
A three-pronged strategy involving national and global policy interventions is needed to attract FDI, nurture its positive effects, and advance global cooperation to support FDI Rows. Attracting more FDI and unlocking its full potential to boost economic growth requires sustained policies to strengthen institutions, improve the investment climate, liberalize trade and investment, foster stable macroeconomic conditions, reduce economic informality, and
improve human capital development. These policies are critical especially for LICs that lag behind in most of these dimensions. FDI can play an instrumental role in mobilizing additional private capital, and reforms that enhance the potential of FDI to crowd in domestic private investment should be prioritized.
Cooperative policy efforts at both bilateral and multilateral levels are essential to uphold a rulesbased system that promotes cross-border investment flows and mitigates the costs of fragmenta-
tion. The balance of risks and opportunities should be considered judiciously by policy makers in the design of FDI policies to avoid market distortions and uphold a non-discriminatory regulatory framework. The global communiry should also accelerate policy initiatives that can help direct FDI flows ro countries with the largest investment gaps, especially LICs, including through the provision of technical and financial assistance to aid implementation of the structural reforms critical for promoting FDI inflows and maximizing their benefits.
This annex describes the data and the methodological framework used in the estimation of the effects of FOi on economic growth discussed in box 3.1.
The analysis is based on strongly balanced annual data of 74 EMDEs spanning the period 19952019. Real net FOi inflows, real GDP, and real gross fixed capital formation data (all in constant 2015 U.S. dollars) are from the World Bank's World Development Indicators (WDI) database, as are private credit, trade openness (sum of exports and imports as a share of GDP), and educational attainment data. T oral factor productivity (TFP) and employment data are from Penn World Table 10.1. Institutional quality indexes are from the PRS Group's International Country Risk Guide (ICRG) and the World Bank's Country Policy and Institutional Assessment (CPIA) datasets. Greenfield FOi and mergers and acquisitions (M&A) FOi data are obtained from UNCTAD. Informal employment and output are from Elgin et al. (2021).
The analysis employs a heterogeneous PVAR framework developed by Pedroni (2013) to study the relationship between FOi and output growth This approach addresses a range of limitations in conventional panel data estimation approaches that have been used to study the growth effects of FOi, including cross-country heterogeneity of the macroeconomic effects of FOi, two-way causality between FOi and output growth, and heterogeneous time horizons over which the effects of FOi may manifest. These caveats may result in inconsistent or imprecise estimates.
The approach used in this report accounts for cross-country heterogeneity and interdependence among countries Besides ensuring consistent estimation of endogenous responses-given that the underlying dynamics are likely to be heterogeneous for the relationship between FOi
and growth in a broad sample-this approach also enables the analysis of country characteristics that can accentuate or temper the causal mechanisms through which FOi affects growth. If unaddressed, latent heterogeneity would arise in the lagged dependent variables of the VAR, leading to inconsistent estimation. Addressing other limitations in the related empirical literature, this framework can be implemented for a relatively short annual time series-a binding constraint for EMDEs-in contrast to estimating individual country VAR models.
The baseline estimations use a bivariate heterogeneous PVAR system that includes the log of FOi and the log of output. The equations are estimated in their demeaned log differenced forms so that, for example, the initial two-variable system can be represented by the vector below, for countries and years
The estimation procedure includes the following steps:
Step 1. A VAR model based on the specified variables is estimated individually for each country i of the sample This can be represented as where
such that represents the country-specific matrices of VAR coefficient estimates for lags j = 1 where the country-specific lag lengths are selected using the standard Akaike Information Criterion.
Step 2. These country VAR models are then supplemented with one additional global-level VAR, based on the cross-sectional averages of the same variables, namely, so that the VAR for th':_cross-~ctional averages takes the analogous form Each of these VAR systems is then inverted into its respective orthogonalized vector moving average representation from which impulse responses can be derived, namely where for the country-specific VAR models, and analogously - - - for the global VAR model based on the cross-sectional averages.
The objects of interest are the responses of the log levels. The VAR estimation is done using the stationary log-differences form, and the responses
of the variables of interest are recovered by accumulating the resulting impulse responses.
The baseline analysis uses the standard Cholesky decomposition of the short-run covariance matrix, which implies a recursive short-run impact matrix. The ordering of the variables in the system implies that FDI impacts output in the same year, because of the direct effect on capital formation incorporated in GDP and productivity spillovers affecting growth. By contrast, FDI is assumed to respond to changes in GDP with a lag as both greenfield and brownfield investment transactions require time to plan and implement in the recipient economy by foreign investors.
For any given orthogonalization of the shocks, the correlation between country-specific shocks and global shocks can be used to obtain consistent estimates of the loading vector and to decompose the composite shocks into common global shocks and idiosyncratic country-specific shocks in a standard factor representation form. These loadings can in turn be used to obtain the country-specific impulse resp~nses to the idiosyncratic and common shocks as and This sectional distribution of impulse responses to each shock. yields a crosscountry-specific
it
()()()i i iiALALI=−
()()i iiALAL=
i N 1/2
As a robustness check, a second scheme is based on the Cholesky decomposition of the long-run covariance matrix which implies a recursive longrun response matrix, sometimes also referred to as a Blanchard and Quah decomposition. The ordering of the endogenous variables is the same as in the first scheme but applied to the long-run covariance matrix rather than the short-run covariance matrix. This approach allows for the assessment of long-run growth responses to permanent shocks in FOi. As part of robustness checks, the analysis also explored models with alternative ordering schemes and a five-variable system that included net FOi inflows, TFP, employment, gross fixed capital formation, and GDP as endogenous variables. The results in all cases were consistent with the baseline model.
This annex describes the data and the methodological framework used in the estimation of the factors that affect bilateral FDI flows.
The analysis is based on bilateral FOi data from the IMF, OECD, UNCTAD, and national sources, consolidated by the World Bank (World Bank Group Harmonized Bilateral FDI Database-Steenbergen et al. 2022). The data for the macroeconomic variables are obtained from CEPII Gravity, the World Bank's World Development Indicators (WDI), and Penn World Table 10.1 databases. Institutional quality indexes are from the PRS Group's International Country Risk Guide (ICRG) dataset The FDI restrictiveness index is from the OECD The FDI openness index is sourced from the IMF's Structural Reform Database. The investment treaty variable is developed based on data from the Electronic Database of Investment Treaties (Alschner, Elsig, and Rodrigo 2021). The bilateral geopolitical disagreement index based on Bailey, Strezhnev, and Voeten (2017) is sourced from CEPII. The country-specific geopolitical risk index is from Caldara and lacoviello (2022). Bilateral global value chain (GVC) participation is computed as the share of GVC-related output of an exporter in its gross exports to an importing country, based on data from Borin, Mancini, and Taglioni (2021). Nominal variables are converted to 2015 constant U.S. dollars. The sample includes 189 economies over the period 2000-19.
Under the gravity framework (Bergstrand 1989; Tinbergen 1962), bilateral FDI flows or stocks between FOi source and recipient countries i and j in the basic form are modeled as a function of their economic size, proxied by GDP, and the distance between them. The later empirical literature, in order to capture multilateral and bilateral resistance factors, incorporates a range of additional variables-macroeconomic conditions
and structural characteristics of the source and recipient countries, global factors, and bilateral frictions, such as the existence of an integration agreement, and social and cultural proximity (Anderson and van Wincoop 2003). This analysis consolidates a variety of push, pull, and bilateral factors in a single consistent framework and uses harmonized global bilateral FDI data to gauge their relative importance.
Most of these characteristics can be captured via country-year and country pair fixed effects. However, as the purpose of this analysis is to identify country-specific and bilateral factors influencing FDI flows, the following specification is estimated as a baseline:
FDIijt = exp [β1 GDPit + β2GDPjt + β3distij + γ1Xit + γ2Xjt + ΨYijt] + εijt ,
where FDIijt denotes the real value of FDI flow from country i to country j in year t; GDPit and GDPjt are the real GDP values of the source and recipient countries (in logs); distij is the bilateral population-weighted distance between them (in log). Yijt is the vector of other bilateral variables, both time-varying and time-invariant, that are conjectured to explain FDI flows from country i to country j, such as the existence of a common border, investment and trade treaties between the countries, and other variables outlined further.
The vectors of variables Xit and Xjt include country -specific factors that may affect FDI. These variables enter symmetrically in the gravity model specification—that is, they are included for both the source and the recipient country. Conceptually, the characteristics of the source country i can be viewed as “push” factors, while those of the recipient country j—as “pull” factors impacting FDI flows. For clearer exposition, the explanatory variables are partitioned into several thematic categories: macroeconomic characteristics, institutional quality, and economic integration and fragmentation.
Macroeconomic characteristics. The set of variables includes real GDP of the source and recipient countries (in logs); surrounding market potential of the recipient country, computed as the GDP of all countries, weighted by the distance
to the recipient country, excluding the latter (log); bilateral exchange rate (source country currency to the recipient country currency, log); financial development (private credit as a percent of GDP); sovereign risk (based on Fitch, Moody’s, and S&P ratings, converted to a numerical scale from 1 to 21, where higher values indicate higher risk); labor productivity (output per hour worked, log); cost of business start-up procedures as a percent of GNI per capita; and natural resource rents as a percent of GDP.
Furthermore, to gauge the importance of relative human capital and technological intensity differential between the source and destination countries on a bilateral basis, the model incorporates the following variables.
Relative skill endowment, computed as follows:
where skilled and unskilled are the population shares with and without tertiary education, respectively. Higher values indicate relatively more skilled labor in the recipient country j than in the source country i.
R&D expenditure ratio differential, computed as the ratio of R&D expenditures in the recipient country (share of GDP) to the R&D expenditures in the source country (share of GDP). Higher values indicate greater R&D intensity in the recipient country relative to the source country.
In line with the literature, each specification includes bilateral gravity variables capturing geographic and cultural proximity between country pairs: population-weighted distance (log), and dummy variables for a common border, common language, common colonizer in the past, common origin of the country’s legal system, and common religion.
Institutionalquality. The set of variables includes ICRG indexes of investment profile, law and order, bureaucracy quality, and political risk. Higher values of these indexes indicate better institutional quality.
Economic integration and fragmentation. The vector of variables includes the following bilateral variables: an investment agreement dummy variable (= 1 if there is a bilateral or multilateral investment agreement between the source and the destination countries); a trade agreement dummy variable; the diplomatic disagreement index (higher values indicate greater diplomatic disagreement between the source and the destination countries, based on Bailey, Strezhnev, and Voeten 2017); and bilateral GVC participation (share of GVC-related output in bilateral trade). Country-specific variables include the FDI openness index; the FDI restrictiveness index; trade openness (the sum of exports and imports as a percent of GDP); and the geopolitical risk index (Caldara and Iacoviello 2022).
The model is estimated via a Poisson pseudomaximum likelihood estimator, which accounts for zero FDI flows and allows for consistent estimation of fixed effects (Santos Silva and T enreyro 2006). To mitigate possible collinearity, the explanatory variables listed above are included in the model sequentially, controlling for the canonical gravity variables-log of GDP of the source and recipient countries, log of bilateral distance, and
dummy variables for common border, language, religion, historical colonizing country, and origin of the legal system. In addition, each specification includes country fixed effects for source and recipient countries to control for time-invariant country characteristics, as well as year fixed effects to control for common shocks such as global commodity shocks and changes in global risk perception. Standard errors are clustered by country pair and year. In addition to the baseline specification, the impact of investment treaties between the source and the recipient countries is estimated using country pair fixed effects and year fixed effects to mitigate endogeneity issues. For robustness, in addition to the full-sample baseline specification, the model was also estimated dropping offshore financial centers (both FDI source and destination countries)-the results were similar to the baseline model.
As the model has a non-linear exponential form, the estimated coefficients for the variables expressed in logarithms directly convey elasticities, while for other variables the marginal effect-the impact on FDI in percent-is computed as JOO* ( ), where is the exponent and is the estimated coefficient.
e b - 1 e b
A. Macroeconomic characteristics
A1 Market size
Real GDP (log)
Surrounding market potential (log)
A2 Macroeconomic conditions
Exchange rate, source-to-recipient currency (log)
Financial development (private credit, percent of GDP)
Sovereign risk rating (1-21 ; 21 = high risk)
A3 Productivity and competitiveness
Relative skill endowment
R&D expenditure ratio differential
Labor productivity (log)
Cost of starting a business (percent of GNI per capita)
Natural resource rents (percent of GDP)
B. Institutional quality
Investment profile index, ICRG (0-12; 12 = high)
Law and order index, ICRG (0-6; 6 = high)
Bureaucracy quality index, ICRG (0-6; 6 = high)
Political risk index, ICRG (0-100; 100 = low risk)
C. Economic integration and fragmentation
C1 Investment integration
Investment agreement
FOi openness index (0 5-2; 2 = high)
FOi restrictiveness index (0-1 ; 1 = high restrictiveness)
C2 Trade integration
Trade agreement
Trade openness (sum of exports and imports, percent of GDP)
GVC participation (value-added exports, percent of gross exports)
C3. Geopolitical factors
Diplomatic disagreement index (0-5; 5 = high disagreement)
Geopolitical risk index (log)
Source : World Bank.
Note : The table shows estimated coefficients from gravity model regressions of bilateral real net FDI flows (in logs) on a set of country-specific and bilateral variables Additional details are provided in annex 3 2 For brevity, only point estimates are shown, along with their statistical significance based on standard errors clustered by
significance at the 1O,5, and 1-percent levels, respectively.
Abdo, A. B., B. Li, X. Zhang, J. Lu, and A. Rasheed. 2020. "Influence of FDI on Environmental Pollution in Selected Arab Countries: A Spatial Econometric Analysis Perspective." Environmental Science and Pollution Research 27 (22): 28222-46.
Acharyya, J. 2009. "FDI, Growth and the Environment: Evidence from India on CO 2 Emissions During the Last Two Decades." Journal of Economic Development 34 (1): 43-58.
Acharya, V., H. S. Shin, and T. Yorulmazer. 2011. "Fire Sale FOL" The Korean Economic Review 27: 163202.
Adarov, A. 2022. "Financial Cycles Around the World." International journal of Finance and Economics 27 (3): 3163-201.
Adarov, A., and M. Ghodsi. 2023. "Heterogeneous Effects of Non-tariff Measures on Cross-border Investments: Bilateral Firm-level Analysis." Review of International Economics 31 (1): 158-79.
Adarov, A., and U. Panizza. 2024. "Public Investment Quality and Its Implications for Sovereign Risk and Debt Sustainability." Policy Research Working Paper 10877, World Bank, Washington, DC.
Adarov, A., and R. Stehrer. 2021. "Implications of Foreign Direct Investment, Capital Formation and its Structure for Global Value Chains." The World Economy 44 (11): 3246-99.
African Development Bank, Asian Infrastructure Investment Bank, Asian Development Bank, et al. 2025. Mobilization of Private Finance by Multilateral Development Banks and Development Finance Institutions. Washington, DC: International Finance Corporation.
Aggarwal, A. 2012. "SEZ-led Growth in Taiwan, Korea, and India: Implementing a Successful Strategy." Asian Survey 52 (5): 872-99.
Aguiar, M., and G. Gopinath. 2005. "Fire-Sale Foreign Direct Investment and Liquidity Crises." Review of Economics and Statistics 87 (3): 439-52.
Ahn, J., S. Aiyar, and A. F. Presbitero. 2024. "Productivity Spillovers from FOi: A Firm-Level CrossCountty Analysis." Working Paper 15/2024, Bruegel, Brussels.
Aiyar, S., J. B. Ahn, A. Habib, D. Malacrino, D. Muir, and A. Presbitero. 2023. "Geopolitics and the Cost of
FOi Fragmentation." In Geoeconomic Fragmentation: The Economic Risks from A Fractured World Economy, edited by S. Aiyar, A. Presbitero, and M. Ruta, 117-26. Paris: Center for Economic Policy Research.
Aiyar, S., D. Malacrino, and A. Presbitero. 2024. "Investing in Friends: The Role of Geopolitical Alignment in FOi Flows." European journal of Political Economy 83: 102508.
Aiyar, S., and F. Ohnsorge. 2024. "Geoeconomic Fragmentation and 'Connector' Countries." CEPR Discussion Paper 19352, Center for Economic Policy Research, London.
Akhtaruzzaman, M., N. Berg, and C. Hajzler. 2017. "Expropriation Risk and FOi in Developing Countries: Does Return of Capital Dominate Return on Capital?" European journal of Political Economy 49 (September): 84-107.
Albornoz, F., M. A. Cole, R. ]. R. Elliott, and M. G. Ercolani. 2009. "In Search of Environmental Spillovers." World Economy, 32 (1): 136-63.
Alfaro, L. 2003. "Foreign Direct Investment and Growth: Does the Sector Matter." Working Paper, Harvard Business School, Boston, MA.
Alfaro, L. 2017. "Multinational Activity in Emerging Markets: How and When Does Foreign Direct Investment Promote Growth." Geography, Location, and Strategy-Advances in Strategic Management 36: 429-62.
Alfaro, L., A. Chanda, S. Kalemli-Ozcan, and S. Sayek. 2004. "FOi and Economic Growth: The Role of Local Financial Markets " Journal of International Economics 64 (1): 89-112.
Alfaro, L., and A. Charlton. 2013 "Growth and the Quality of Foreign Direct Investment." In The Industrial Policy Revolution I, edited by J. E. Stiglitz and J. Y. Lin, 162-204. London: Palgrave Macmillan.
Alfaro, L., and M. X. Chen. 2018. "Transportation Cost and the Geography of Foreign Investment." In Handbook of International Trade and Transportation, edited by B. Blonigen and W. W. Wilson, 369-406. London: Edward Elgar Publishing.
Alfaro, L., and D. Chor. 2023. "Global Supply Chinas: The Looming "Great Reallocation." NBER Working Paper 31661, National Bureau of Economic Research, Cambridge, MA.
Alguacil, M., A. Cuadros, and V. Orts. 2011. "Inward FOi and Growth: The Role of Macroeconomic and
Institutional Environment." fournal of Policy Modeling 33 (3): 481-96
Aloui, Z., M. Hamdaoui, and S. Maktouf. 2024. "Does Governance Matter to Ensure Significant Effect of Foreign Direct Investment on Poverty Reduction? Evidence from Developing and Emerging Countries." Transnational Corporations Review, 16 (2): 200058.
Alschner, W., M. Elsig, and P. Rodrigo. 2021. "Introducing the Electronic Database of Investment Treaties (EDIT): The Genesis of a New Database and Its Use." World Trade Review 20 (1): 73-94.
Amighini, A. A., M. S. McMillan, and M. Sanfilippo. 2017. "FDI and Capital Formation in Developing Economies: New Evidence from Industry-Level Data." NBER Working Paper 23049, National Bureau of Economic Research, Cambridge, MA.
Anderson, J. E. and E. van Wincoop. 2003. "Gravity with Gravitas: A Solution to the Border Puzzle." American Economic Review 93 (1): 170-92.
Aykut, D., and D. Ratha 2003. "South-South FDI Flows: How Big Are They?" Transnational Corporations 13 (1).
Aykut, D., A. Sanghi, and G. Kosmidou. 2017. "What to Do When Foreign Direct Investment is Not Direct or Foreign: FDI Round Tripping." Policy Research Working Paper 8046, World Bank, Washington, DC.
Aykut, D., and S. Sayek. 2007. "The Role of the Sectoral Composition of Foreign Direct Investment on Growth." In Do Multinationals Feed Local Development and Growth?, edited by L. Piscitello and G. D. Santangelo, 35-59. Amsterdam: Elsevier.
Azman-Saini, W. N. W., S. H. Law, and A.H. Ahmad. 2010. "FDI and Economic Growth: New Evidence on the Role of Financial Markets." Economics Letters 107 (2): 211-13
Baek, N., K. Chahande, K. M. Eklou, T. Kinda, V. Nahata, U. Rawat, and A. Stepanyan. 2023. "ASEAN5: Further Harnessing the Benefits of Regional Integration amid Fragmentation Risks." IMF Working Paper 23/191, International Monetary Fund, Washington, DC.
Bailey, M., A. Strezhnev, and E. Voeten. 2017. "Estimating Dynamic State Preferences from United Nations Voting Data." fournal of Conflict Resolution 2 (61): 430-56.
Bailey, N. 2018. "Exploring the Relationship between Institutional Factors and FDI Attractiveness: A Meta-
Analytic Review." International Business Review 27 (1): 139-48.
Baker, S. R., N. Bloom, and S. J. Davis. 2016. "Measuring Economic Policy Uncertainty." The Quarterly Journal ofEconomics 131 (4): 1593-636.
Balaguer, J., A. Cuadros, and J. Garcia-Quevedo. 2023. "Does Foreign Ownership Promote Environmental Protection? Evidence from Firm-Level Data." Small Business Economics 60: 227-44.
Benassy-Quere, A., M Coupet, and T. Mayer. 2007. "Institutional Determinants of Foreign Direct Investment." The World Economy 30 (5): 764-82.
Benetrix, A., H . Pallan, and U. Panizza. 2022. "The Elusive Link between FDI and Economic Growth." CEPR Discussion Paper 17692, Center for Economic Policy Research, London.
Bengoa, M., and B. Sanchez-Robles. 2003. "Foreign Direct Investment, Economic Freedom and Growth: New Evidence from Latin America." European Journal ofPolitical Economy 19 (3): 529-45.
Bergstrand, J. H. 1989. "The Generalized Gravity Equation, Monopolistic Competition and the FactorProportions Theory in International Trade." Review of Economics and Statistics 71 (1): 143-53.
Bialek, S., and A. Weichenrieder. 2015. "Do Stringent Environmental Policies Deter FDI? M&A versus Greenfield." CESIFO Working Paper 5262, Center for Economic Studies, University of Munich.
Bircan, c;:. 2019. "Ownership Structure and Productivity of Multinationals." / ournal of International Economics 116 Qanuary): 125-43.
Bjerde, A, M. Diop, A. Kant, H Marano, A. van Trotsenburg, and W . Zhang. 2024. "New Platform Leverages Power of Guarantees to Boost Private Financing." Voices (blog). July 15, 2024
Blalock, G., and P. J. Gertler. 2008. "Welfare Gains from Foreign Direct Investment through Technology Transfer to Local Suppliers." fournal of International Economics 74 (2): 402-21.
Blanchard, E. J., A. U. Santos-Paulino, C. Trentini, and E. Milet. 2021. "Implications of Rising Trade Tensions for FDI Projects." Transnational Corporations fournal28 (2): 161-83.
Blanco, L., F. Gonzalez, and I. Ruiz. 2013. "The Impact of FDI on CO2 Emissions in Latin America." Oxford Development Studies 41 (1): 104-21.
Blonigen, B. A. 1997. "Firm-Specific Assets and the Link between Exchange Rates and Foreign Direct Investment." American Economic Review 87 (3): 44765.
Blonigen, B. A. 2005. "A Review of the Empirical Literature on FDI Determinants." Atlantic Economic fournal 33 (4): 383-403.
Blonigen, B. A., and J. Piger. 2014. "Determinants of Foreign Direct Investment." Canadian Journal of Economics 47 (3): 775-812.
Bloomberg. 2023. "These Five Countries Are Key Economic 'Connectors' in a Fragmenting World." Bloomberg November 2, 2023. www.bloomberg.com/ news/articles/2023-11-02/vietnam-poland-mexicomorocco-benefit-from-us-china-tensions.
Borensztein, E., J. De Gregorio, and J.-W. Lee. 1998. "How Does Foreign Direct Investment Affect Economic Growth?" fournal of International Economics 45 (1): 115-35.
Borga, M., A. Pegoue, G. M. H. Legoff, A. S. Rodelgo, D Entaltsev, and K. Egesa. 2022. "Measuring Carbon Emissions of Foreign Direct Investment in Host Economies." IMF Working Paper 22/86, International Monetary Fund, Washington, DC.
Borin, A., M. Mancini, and D. Taglioni 2021. "Economic Consequences of Trade and Global Value Chain Integration: A Measurement Perspective." Policy Research Working Paper 9785, World Bank, Washington, DC.
Botta, E., and T. Kozluk. 2014. "Measuring Environmental Policy Stringency in OECD Countries: A Composite Index Approach." OECD Economics Department Working Paper 1177, OECD Publishing, Paris.
Botwright, K., and M. Stephenson 2023 "Climate Foreign Direct Investment: Here's Everything You Need to Know." World Economic Forum (blog). July 26, 2023.
Broner, F., T. Didier, S. L. Schmukler, S.L. and G. Von Peter. 2023. "Bilateral International Investments: The Big Sur?" fournal of International Economics 145 (November): 103795.
Brucal, A., B. Javorcik, and I. Love. 2019. "Good for the Environment, Good for Business: Foreign Acquisitions and Energy Intensity." fournal of International Economics 121 (November): 103247.
Burger, A., A, Jaklic, and M. Rojec. 2012. "The Effectiveness of Investment Incentives: The Slovenian
FDI Co-financing Grant Scheme." Post-Communist Economies 24 (3): 383-401.
Busse, M., and C. Hefeker. 2007. "Political Risk, Institutions and Foreign Direct Investment." European fournal ofPolitical Economy 23 (2): 397-415.
Cai, P., Q. Gan, and S. Kim. 2018. "Do Sovereign Credit Ratings Matter for Foreign Direct Investments?" fournal of International Financial Markets, Institutions and Money 55 Quly): 50-64.
Caldara, D., and M. Iacoviello. 2022. "Measuring Geopolitical Risk." American Economic Review 112 (4): 1194-225.
Calderon, C., and T. Didier. 2009. "Will FOi be Resilient in this Crisis?" In Latin America Beyond the Crisis: Impacts, Policies and Opportunities, Washington, DC: World Bank
Campos, N. F, and Y. Kinoshita. 2003. "Why Does FOi Go Where It Goes? New Evidence from the Transition Economies." IMF Working Paper 03/228, International Monetary Fund, Washington, DC.
Castellani, D., G. Marin, S. Montresor, and A. Zanfei. 2022. "Greenfield Foreign Direct Investments and Regional Environmental Technologies." Research Policy 51 (1): 104405.
Chakraborty, C., and P. Nunnenkamp. 2008. "Economic Reforms, FOi, and Economic Growth in India: A Sector Level Analysis." World Development 36 (7): 1192-212.
Chen, G., M. Geiger, and M. Fu. 2015. Manufacturing FDI in Sub-Saharan Africa: Trends, Determinants, and Impacts Washington, DC: World Bank.
Chinn, M 0., and H Ito 2006 "What Matters for Financial Development? Capital Controls, Institutions, and Interactions." fournal of Development Economics 18 (1): 163-92.
Chung, S. 2014. "Environmental Regulation and Foreign Direct Investment: Evidence from South Korea." fournal of Development Economics, 108 (May): 222-36.
Cipollina, M., G. Giovannetti, F. Pietrovito, and A. F. Pozzolo. 2012. "FOi and Growth: What CrossCountry Industry Data Say." The World Economy 35 (11): 1599-629.
Citi. 2025. "Foreign Direct Investment: Global Implications of 'America First' Policies." Citigroup Global Markets, New York.
Claessens, S., M. A. Kose, and M. E Terrones. 2011. "Financial Cycles: What? How? When?" NEER International Seminar on Macroeconomics 7 (1): 303-44.
Cole, M. A., R. J. R. Elliott, and P. G. Fredriksson. 2006. "Endogenous Pollution Havens: Does FDI Influence Environmental Regulations?" Scandinavian fournal ofEconomics 108 (1): 157-78.
Cole, M. A., R. J. R. Elliott, and L. Zhang. 2017. "Foreign Direct Investment and the Environment." Annual Review of Environment and Resources 42 (1): 465-87.
Colen, L., 0. Persyn, and A. Guariso. 2016. "Bilateral Investment Treaties and FDI: Does the Sector Matter?" World Development, 83 Quly): 193-206.
Copeland, B. R. 2008. "The Pollution Haven Hypothesis." In Handbook on Trade and the Environment, edited by K. P. Gallagher, 60-70. Cheltenham, U.K : Edward Elgar Publishing.
Crivelli, E., R. De Mooij, and M. Keen. 2016. "Base Erosion, Profit Shifting and Developing Countries." FinanzArchiv/Public Finance Analysis 73 (3): 268 -301.
Damgaard, J., Elkjaer, T., and N. Johannesen. 2024. "What Is Real and What Is Not in the Global FDI Network?" fournal of International Money and Finance 140 (February): 102971.
De Beule, F., F. Schoubben, and K. Struyfs. 2022. "The Pollution Haven Effect and Investment Leakage: The Case of the EU-ETS." Economics Letters 215 Qune): 110536.
Delevic, U. 2020. "Employment and State Incentives in Transition Economies: Are Subsidies for FDI Ineffective? The Case of Serbia." Transnational Corporations 27 (2): 31-63.
Demena, B.A., and S.K. Afesorgbor. 2020. "The Effect of FDI on Environmental Emissions: Evidence from a Meta-Analysis." Energy Policy 138 (March): 111192.
Desbordes, R., and S. J. Wei. 2017. "The Effects of Financial Development on Foreign Direct Investment." fournal ofDevelopment Economics 127 Quly): 153-68.
Doytch, N., A. Ashraf, and C. P. Nguyen. 2024. "Foreign Direct Investment and Forest Land: A Sectoral Investigation." Environmental and Sustainability Indicators, 22 Qune): 100353.
Doytch, N., and S. Narayan. 2016. "Does FOi Influence Renewable Energy Consumption? An Analysis of Sectoral FOi Impact on Renewable and
Non-Renewable Industrial Energy Consumption." Energy Economics 54 (February): 291-301.
Driffield, N., and C. Jones. 2013. "Impact of FOi, ODA and Migrant Remittances on Economic Growth in Developing Countries: A Systems Approach." The European journal of Development Research 25 (2): 17396.
EBRO (European Bank for Reconstruction and Development). 2024. Transition Report 2024-25: Navigating Industrial Policy. London: European Bank for Reconstruction and Development.
ECB (European Central Bank) 2024. Economic BuLletin. Issue 7. European Central Bank, Frankfurt.
Echandi, R., M. Maliszewska, and V. Steenbergen. 2022. Making the Most of the African Continental Free Trade Area: Leveraging Trade and Foreign Direct Investment to Boost Growth and Reduce Poverty. Washington, DC: World Bank.
Ekholm, K., R. Forslid, and J. R. Markusen. 2007. "Export-Platform Foreign Direct Investment." fournal ofthe European Economic Association 5 (4): 776-95.
Elgin, C., M.A. Kose, F Ohnsorge, and S. Yu. 2021. "Understanding Informality " CEPR Discussion Paper 16497, Center for Economic Policy Research, London.
EM-DAT (The International Disaster Database). Centre for Research on Epidemiology of Disasters (CRED), UCLouvain, Brussels. Accessed on December 9, 2023. https://www emdat be.
Eskeland, G. S., and A. E. Harrison. 2003. "Moving to Greener Pastures? Multinationals and the Pollution Haven Hypothesis." fournal of Development Economics 70 (1): 1-23.
Evenett, S. J., and N. Pisani. 2023. "Geopolitics, Conflict, and Decoupling: Evidence of Western Divestment from Russia during 2022." fournal of International Business Policy 6 (4): 511-40.
Farole, T. 201 la. "Special Economic Zones: What Have We Learned?" Economic Premise 64: 1-5. World Bank, Washington, DC.
Farole, T. 2011 b. Special Economic Zones in Africa: Comparing Peiformance and Learning from Global Experience. Washington, DC: World Bank.
Farole, T., and 0. Winkler, eds. 2014. Making Foreign Direct Investment Work for Sub-Saharan Africa Washington, DC: World Bank.
Fernandez-Villaverde, J., T. Mineyama, and D. Song. 2024. "Are We Fragmented Yet? Measuring Geopolitical Fragmentation and its Causal Effects." NBER Working Paper 32638, National Bureau of Economic Research, Cambridge, MA.
Fons-Rosen, C., S. Kalemli-Ozcan, B. E. Sorensen, C. Villegas-Sanchez, and V. Volosovych. 2017. "Foreign Investment and Domestic Productivity: Identifying Knowledge Spillovers and Competition Effects." NBER Working Paper 23643, National Bureau of Economic Research, Cambridge, MA.
Fournier, J.M. 2015. "The Negative Effect of Regulatory Divergence on Foreign Direct Investment." OECD Economics Department Working Paper 1268, OECD Publishing, Paris.
Freund, C. A. Mattoo, A. Mulabdic, and M. Ruta. 2023. "Is US Trade Policy Reshaping Global Supply Chains?" journal of International Economics 152 (November): 104011.
Fu, X. 2011. "Processing Trade, FDI, and the Exports of Indigenous Firms: Firm-Level Evidence from Technology-Intensive Industries in China." Oxford Bulletin ofEconomics and Statistics 73 (6): 792-817.
Ghosh, M., P. Syntetos, and W. Wang. 2012. "Impact of FDI Restrictions on Inward FDI in OECD Countries." Global Economy journal 12 (3): 1850265.
Global Trade Alert (database). Accessed on April 9, 2025. https://globaltradealert.org.
Gopinath, G., P.-O. Gourinchas, A. F. Presbitero, and P. Topalova. 2024. "Changing Global Linkages: A New Cold War?" IMF Working Paper 24/0076, International Monetary Fund, Washington, DC.
Hale, G., and M. Xu. 2016. "FOi Effects on the Labor Market of Host Countries." Working Paper 2016-25, Federal Reserve Bank of San Francisco.
Harding, T., and B. Javorcik. 2011. "Roll Out the Red Carpet and They Will Come: Investment Promotion and FOi Inflows." The Economic journal 121 (557): 1445-76.
Harding, T., and B. Javorcik. 2013. "Investment Promotion and FOi Inflows: Quality Matters." CESifo Economic Studies 59 (2): 337-59.
Harms, P., and P.-G. Meon. 2018. "Good and Useless FOi: The Growth Effects of Greenfield Investment and Mergers and Acquisitions." Review of International Economics 26 (1): 37-59.
GLOBAL ECONOMIC PROSPECTS
Heckl, P., C. Lennon, and A. Schneebaum. 2025. "How is Global Commerce Affecting the Gender Composition of Employment? A Firm-Level Analysis of the Effects of Exposure to Gender Norms via Trade and FOi." Labour Economics 94 Qune): 102696.
Hijzen, A., P. S. Martins, T. Schank, and R. Upward. 2013. "Foreign-Owned Firms around the World: A Comparative Analysis of Wages and Employment at the Micro-Level." European Economic Review 60 (May): 170-88.
Huang, K., N. Sim, and H. Zhao. 2020. "Does FOi Actually Affect Income Inequality? Insights from 25 Years of Research." Journal of Economic Surveys, 34 (3): 630-59.
Hund, K., D. La Porta, T. P. Fabregas, T. Laing, and J. Drexhage. 2020. Minerals for Climate Action: The Mineral Intensity of the Clean Energy Transition. Washington, DC: World Bank.
IEA (International Energy Agency) and Centre for Climate Finance & Investment. 2021. Clean Energy Investing: Global Comparison of Investment Returns. Paris: International Energy Agency.
IMF (International Monetary Fund). 2019. World Economic Outlook. October. Washington, DC: International Monetary Fund.
IMF (International Monetary Fund). 2023a. "Geoeconomic Fragmentation and Foreign Direct Investment." In World Economic Outlook. Washington, DC: International Monetary Fund.
IMF (International Monetary Fund). 20236. "How Will Trend Growth in China Impact the Rest of Asia?" In Regional Economic Outlook. Washington, DC: International Monetary Fund.
lvarsson, I., and C. G Alvstam. 2005. "Technology Transfer from TNCs to Local Suppliers in Developing Countries: A Study of AB Volvo's Truck and Bus Plants in Brazil, China, India, and Mexico." World Development 33 (8): 1325-44
Jaumotte, F., J. Kim, S. Pienknagura, and G. Schwerhoff. 2024. "Policies to Foster Green FOi: Best Practices for Emerging Market and Developing Economies." Staff Climate Note 2024/004, International Monetary Fund, Washington, DC.
Javorcik, B. 2004. "Does Foreign Direct Investment Increase the Productivity of Domestic Firms? In Search of Spillovers Through Backward Linkages." American Economic Review 94 (3): 605-27.
Javorcik, B. 2015. "Does FDI Bring Good Jobs to Host Countries?" The World Bank Research Observer 30 (1): 74-94.
Javorcik, B., L. Kitzmuller, H. Schweiger, and M. Yildirim. 2022. "Economic Costs of Friend-Shoring." CEPR Discussion Paper 17764, Center for Economic Policy Research, London.
Javorcik, B., and M. Spatareanu. 2005. "Do Foreign Investors Care about Labor Market Regulations?" Review of World Economics 141 (3): 375-403.
Javorcik, B., and V. Steenbergen. 2017. "Analysing the Impact of the Kigali Special Economic Zone on Firm Behaviour." Working Paper F-38419-RWA-l, International Growth Centre, London.
Javorcik, B., and S. J. Wei. 2003. "Pollution Havens and Foreign Direct Investment: Dirty Secret or Popular Myth?" Contributions in Economic Analysis & Policy 3 (2).
Jude, C. 2019. "Does FDI Crowd Out Domestic Investment in Transition Countries?" Economics of Transition and Institutional Change 27 (1): 163-200.
Jude, C., and G. Levieuge. 2017. "Growth Effect of Foreign Direct Investment in Developing Economies: The Role of Institutional Quality." The World Economy 40 (4): 715-42.
Kallen, C. 2025. "How ls Geopolitical Fragmentation Reshaping U.S. Foreign Direct Investment?" FEDS Notes. Board of Governors of the Federal Reserve System, Washington, DC.
Kannen, P., F. 0. Semrau, and F. Steglich. 2021. "Green Gifts from Abroad? FDI and Firms' Green Management." Kiel Working Paper 2200, Kiel Institute for the World Economy, Kiel, Germany
Karadima, S 2021. "How FDI Can Help in the Fight Against Biodiversity Loss." Investment Monitor (blog). August 10, 2021.
Kearney. 2025. "World at Inflection: The 2025 FOi Confidence Index." Kearney Foresight Global Business Policy Council.
Kekic, L. 2009. "The Global Economic Crisis and FDI Flows to Emerging Markets." Columbia FD! Perspectives 15. Columbia Center on Sustainable Investment, Columbia University, New York.
Khraiche, M., and P. de Araujo. 2021. "The Effect of Information Frictions on FOi Persistence." Economic Modelling94 (C): 14-27.
Kinoshita, Y. 2011. "Sectoral Composition of Foreign Direct Investment and External Vulnerability in Eastern Europe." IMF Working Paper 11/123, International Monetary Fund, Washington, DC.
Knutsson, P., and P. L Flores. 2022. "Trends, Investor Types and Drivers of Renewable Energy FOL" OECD Papers on International Investment 2022/02, OECD Publishing, Paris.
Kose M. A., P. Nagle, F. Ohnsorge, and N. Sugawara. 2021. Global Waves of Debt. World Bank: Washington, DC.
Kose, M.A., and F. Ohnsorge, eds. 2023. Falling LongTerm Growth Prospects: Trends, Expectations, and Policies. Washington, DC: World Bank.
Kose, M.A., E. Prasad, K. Rogoff, and S.-J. Wei. 2009. "Financial Globalization: A Reappraisal." IMF Staff Papers 56 (1): 8-62.
Kose, M.A., E. S. Prasad, and M. E. Terrones. 2009. "Does Openness to International Financial Flows Raise Productivity Growth?" / ournal of International Money and Finance 28 (4): 554-80.
Kose, M.A., N. Sugawara, and M. E. Terrones. 2020. "Global Recessions." Policy Research Working Paper 9172, World Bank, Washington, DC.
Krugman, P. 1998. "Fire-Sale FOL" In Capital Flows and the Emerging Economics: Theory, Evidence, and Controversies, edited by S. Edwards, 43-58. Chicago: University of Chicago Press.
Kruse, T., A. Dechezlepretre, R. Saffar, and L. Robert 2022 "Measuring Environmental Policy Stringency in OECD Countries-An Update of the OECD Composite EPS Indicator." OECD Economics Department Working Paper 1703, OECD Publishing, Paris.
Kugler, M , and H. Rapoport. 2007. "International Labor and Capital Flows: Complements or Substitutes?" Economics Letters 92 (2): 155-62.
Kurilla, M. 2024. "What Is the CHIPS Act?" Council on Foreign Relations (blog). April 29, 2024.
Laeven, L., and F. Valencia. 2020. "Systemic Banking Crises Database II." IMF Economic Review 68 (2): 30761.
Lan, J., M. Kakinaka, and X. Huang. 2012. "Foreign Direct Investment, Human Capital and Environmental Pollution in China." Environmental and Resource Economics 51 (2): 255-75.
Loungani, P., and A. Razin. 2001. "How Beneficial Is Foreign Direct Investment for Developing Countries?" Finance and Development (38), Number 2.
Lovei, M. 2017. "Climate Impacts on African Fisheries: The Imperative to Understand and Act " Nasikiliza: Sharing Stories of Development from Africa (blog). November 11, 2017.
Luu, H. 2016. "Greenfield Investments, Cross-Border M&As, and Economic Growth in Emerging Countries." Economics and Business Letter 5 (3): 87-94.
Makki, S. S., and A. Somwaru. 2004. "Impact of Foreign Direct Investment and Trade on Economic Growth: Evidence from Developing Countries." American journal of Agricultural Economics 86 (3): 795-801.
Makki, S. S., A. Somwaru, and H. C. Bolling. 2004. "Determinants of Foreign Direct Investment in the Food-Processing Industry: A Comparative Analysis of Developed and Developing Economies." journal of Food Distribution Research 35 (3): 60-7.
Markusen, J. R., and N. Trofimenko. 2009. "Teaching Locals New Tricks: Foreign Experts as a Channel of Knowledge Transfers." journal of Development Economics 88 (1): 120-31.
Mattoo, A., N. Rocha, and M. Ruta. 2020. Handbook of Deep Trade Agreements World Bank: Washington, DC.
Mensah, J. T., and N. Traore. 2024. "Infrastructure Quality and FDI Inflows: Evidence from the Arrival of High-Speed Internet in Africa." The World Bank Economic Review (38) 1: 1-23.
Mercer-Blackman, V., W. Xiang, and F. Khan. 2021. "Understanding FDI Spillovers in the Presence of GVCs." Policy Research Working Paper 9645, World Bank, Washington, DC.
Messerschmidt, L., and N. Janz. 2023. "Unravelling the 'Race to the Bottom' Argument: Foreign Direct Investment and Different Types of Labour Rights." World Development 161 (1): 106097.
Mileva, E. 2008. "The Impact of Capital Flows on Domestic Investment in Transition Economies." European Central Bank Working Paper 871, European Central Bank, Frankfurt.
Miranda-Agrippino, S., and H. Rey. 2021. "The Global Financial Cycle." NBER Working Papers 29327, National Bureau of Economic Research, Cambridge, MA.
Mistura, F., and C. Roulet. 2019. "The Determinants of Foreign Direct Investment: Do Statutory Restriction Matter?" OECD Working Paper on International Investment 2019/01, OECD Publishing, Paris.
Montinari, L. 2023. "Harnessing Foreign Direct Investment for Gender Equality." In joining Forces for Gender Equality: What Is Holding Us Back? Paris: OECD Publishing.
Mulatu, A. 2017. "The Structure of UK Outbound FDI and Environmental Regulation." Environmental and Resource Economics 68 (1): 65-96.
Myles, D. 2024. "US Outbound Screening Countdown Enters Final Stretch." FD! Intelligence. August 8, 2024. https://www.fdiintelligence.com/content/news/ us-outbound-screening-countdown-enters-final-stretch84034.
Myles, D. 2025. "Tariff Uncertainty Threatens US FDI Appeal." FD! Intelligence. April 9, 2025. https:// www.fdiintelligence.com/content/d69bcc8a-5a55-4392 -867c-3cc95e8dle78.
Nayyar, G., M. Hallward-Driemeier, and E. Davies. 2021. At Your Service? The Promise of Services-Led Development. Washington, DC: World Bank.
Nebe, M., P. Economou, and L. Abruzzese. 2024. Shifting Shores: FD! Relocations and Political Risk. Washington, DC: Multilateral Investment Guarantee Agency, World Bank.
Neise, T., F. Sohns, M. Breul, and J. Revilla Diez. 2022. "The Effect of Natural Disasters on FDI Attraction: A Sector-Based Analysis Over Time and Space." Natural Hazards 110 (2): 999-1023.
Noorbakhsh, F., A. Paloni, and A. Youssef. 2001. "Human Capital and FDI Inflows to Developing Countries: New Empirical Evidence." World Development 29 (9): 1593-610.
OECD (Organisation for Economic Cooperation and Development). 2009. OECD Benchmark Definition of Foreign Direct Investment 2008. Fourth Edition. Paris: OECD Publishing.
OECD (Organisation for Economic Cooperation and Development). 2019. "Monitoring and Evaluation: A Brief Guide for Investment Promotion Agencies." OECD Investment Insights. OECD Publishing: Paris.
OECD (Organisation for Economic Cooperation and Development). 2022. FD! Qualities Indicators. Paris: OECD Publishing.
OECD (Organisation for Economic Cooperation and Development). 2025. OECD Benchmark Definition of Foreign Direct Investment 2025. Fifth Edition. Paris: OECD Publishing.
Oh, J. E., M. Cordeiro, J.A. Rogers, K. Nguyen, D. Bongardt, L.T. Dang, and V.A. Tuan. 2019. Addressing Climate Change in Transport. Volume 1: Pathway to Low Carbon Transport Washington, DC: World Bank.
Osei, M ]., and J. Kim 2020. "Foreign Direct Investment and Economic Growth: Is More Financial Development Better?" Economic Modeffing 93 (December): 154-61.
Owens,]., and R. Wamuyu. 2024. "How Will Countries Compete for FDI in Light of the New Global Tax Environment?" Columbia FD! Perspectives 390. Columbia Center on Sustainable Investment, Columbia University, New York.
Parente, R. M., and F. Moreau. 2024. "The Dynamics of Trade Integration and Fragmentation in LAC." IMF Working Paper 24/253, International Monetary Fund, Washington, DC.
Pedroni, P 2013 Structural Panel VARs. Econometrics 1 (2): 180-206.
Pienknagura, S. 2024. "Climate Policies as a Catalyst for Green FDI." IMF Working Paper 24/46, International Monetary Fund, Washington, DC.
Poelhekke, S., and F. Van der Ploeg. 2015."Green Havens and Pollution Havens." The World Economy, 38 (7): 1159-78.
Qiang, C. Z., Y. Liu, and V. Steenbergen. 2021. An Investment Perspective on Global Value Chains Washington, DC: Wodd Bank.
Ragoussis, A. 2020. "How Beneficial Are Foreign Acquisitions of Firms in Developing Countries? Evidence from Six Countries." In Global Investment Competitiveness Report Washington, DC: World Bank.
Ragoussis, A., D. Rigo, and G. Santoni. 2024. "The Rising Concentration of Foreign Direct Investment." Policy Research Working Paper 10815, World Bank, Washington, DC.
Ratha, D., E. J. Kim, A. Mahmood, S. Plaza, W. Shaw, and X. Zhu. 2023. Market Finance for Development: Taking Stock Washington, DC: Multilateral Investment Guarantee Agency, World Bank.
Roeger W., and P. J. J. Welfens 2022. "The Macroeconomic Effects of Import Tariffs in a Model with Multinational Firms and Foreign Direct Investment."
International Economics and Economic Policy 19 (2): 245-66.
Rozenberg,]., and M. Fay, eds. 2019. Beyond the Gap: How Countries Can Afford the Infrastructure They Need While Protecting the Planet Washington, DC: World Bank.
Rygh, A., K. Torgersen, and G. R. Benito. 2022. "Institutions and Inward Foreign Direct Investment in the Primary Sectors." Review of International Business and Strategy 33 (2).
Saha, A., J. Thorpe, P. O'Flynn, and H. Bucher. 2020. Designing for Impact: South-South Trade and Investment. Geneva: International Trade Centre.
Santos Silva, J. M C., and S Tenreyro. 2006. "The Log of Gravity." Review of Economics and Statistics 88 (4): 641-58.
Sauvant, K. P., M. Stephenson, and Y. Kagan. 2021. "Green FDI: Encouraging Carbon-Neutral Investment." Columbia FD! Perspectives 316. Columbia Center on Sustainable Investment, Columbia University, New York.
Steenbergen, V 2023. "What Makes an Investment Promotion Agency Effective? Findings from a Structural Gravity Model." Policy Research Working Paper 10376, World Bank, Washington, DC.
Steenbergen, V., Y. Liu, M. P. Latorre, and X. Zhu. 2022. "The World Bank's Harmonized Bilateral FDI Databases: Methodology, Trends, and Possible Use Cases." World Bank, Washington, DC.
Stoddard, 0., and I. Noy. 2015. "Fird81Sale FDI? The Impact of Financial Crises on Foreign Direct Investment." Review of Development Economics 19 (2): 38799.
Tan, J. 2024. "How Widespread Is FDI Fragmentation?" IMF Working Paper 2024/179, International Monetary Fund, Washington, DC.
Tinbergen, J. 1962. Shaping the World Economy: Suggestions for an International Economic Policy. New York: Twentieth Century Fund.
Tintelnot, F. 2017. "Global Production with Export Platforms." The Quarterly journal of Economicsl32 (1): 157-209.
Toews, G., and P.-L. Vezina. 2022. "Resource Discoveries, FDI Bonanzas, and Local Multipliers: Evidence from Mozambique " The Review of Economics and Statistics 104 (5): 1046-58.
UNCTAD (United Nations Conference on Trade and Development). 2000. Tax Incentives and Foreign Direct Investment: A Global Survey. Geneva: United Nations.
UNCTAD (United Nations Conference on Trade and Development). 2001. World Investment Report 2001: Promoting Linkages Geneva: United Nations.
UNCTAD (United Nations Conference on Trade and Development). 2010. World Investment Report 2010: Investing in a Low-Carbon Economy. Geneva: United Nations.
UNCTAD (United Nations Conference on Trade and Development). 2015. World Investment Report 2015: Reforming International Investment Governance. Geneva: United Nations
UNCTAD (United Nations Conference on Trade and Development). 2019. World Investment Report 2019: Special Economic Zones Geneva: United Nations.
UNCTAD (United Nations Conference on Trade and Development). 2021. Multinational Enterprises and the International Transmission of Gender Policies and Practices. Geneva: United Nations.
UNCTAD (United Nations Conference on Trade and Development). 2022a. "Investment Policy Trends in Climate Change Sectors, 2010-2022." Investment Policy Monitor 9.
UNCTAD. 20226. Foreign Direct Investment in LDCs: Investment Trends and Policies Since LDC IV and the Way Forwa rd. Geneva: United Nations.
UNCTAD (United Nations Conference on Trade and Development). 2023. "Evolution of FDI Screening Mechanisms." Investment Policy Monitor 25.
UNCTAD (United Nations Conference on Trade and Development). 2024a. World Investment Report 2024. Geneva: United Nations.
UNCTAD (United Nations Conference on Trade and Development). 20246. Global Economic Fractu ring and Shifting Investment Patterns. Geneva: United Nations.
Walsh, J. P., and J. Yu. 2010. "Determinants of Foreign Direct Investment: A Sectoral and Institutional Approach." IMF Working Paper 10/187, International Monetary Fund, Washington, DC.
Wang, M., and M. C. Wong. 2011. "FDI, Education, and Economic Growth: Quality Matters." Atlantic Economic]ournal39 (2): 103-15.
Wermelinger, M. 2023. "What Can Governments Do to Boost FDI for Sustainable Development?" Columbia
FD! Perspectives 354. Columbia Center on Sustainable Investment, Columbia University, New York.
World Bank. 2012. "Climate-Smart Agriculture." World Bank, Washington, DC.
World Bank. 2017. "Special Economic Zones: An Operational Review of Their Impacts." World Bank: Washington, DC.
World Bank. 2018. Global Investment Competitiveness Report 2017/2018: Foreign Investor Perspectives and Policy Implications. Washington, DC: World Bank.
World Bank. 2020. World Development Report 2020: Trading for Development in the Age of Global Value Chains. Washington, DC: World Bank
World Bank. 2021a Enabling Private Investment in Climate Adaptation and Resilience. Washington, DC: World Bank.
World Bank. 20216. The Economic Case for Nature: A Global Earth-Economy Model to Assess Development Policy Pathways Washington, DC: World Bank
World Bank. 2021c. "Investment Policy and Promotion: Attracting Foreign Investment and Maximizing Impact for the Local Economy." World Bank, Washington, DC.
World Bank 2022a. "Climate and Development: An Agenda for Action-Emerging Insights from World Bank Group 2021-22 Country Climate and Development Reports." World Bank, Washington, DC.
World Bank. 20226. "Investment Policy and Promotion Operational Guide " World Bank, Washington, DC.
World Bank. 2023a Global Economic Prospects. January. Washington, DC: World Bank.
World Bank. 20236. The Promise of Integration: Opportunities in a Changing Global Economy. Latin America and the Caribbean Economic Review. April. Washington, DC: World Bank.
World Bank. 2023c. Changing Foreign Direct Investment Dynamics and Policy Responses-White Paper for Japan's G7 Presidency. Washington, DC: World Bank.
World Bank. 2024a. Global Economic Prospects. June. Washington, DC: World Bank.
World Bank. 20246. "Private Sector Investment Lab." Accessed August 15 2024. https://www.worldbank.org/ en/about/unit/brief/private-sector-investment-lab
World Bank. 2024c. "New Partnership Aims to Connect 300 Million to Electricity by 2030." Press release. World Bank, Washington, DC.
World Bank. 2024d. World Bank East Asia and the Pacific Economic Update. October 2024: Jobs and Technology. October. Washington, DC: World Bank.
World Bank. 2024e. Services Unbound: Digital Technologies and Policy Reform in East Asia and Pacific. East Asia and Pacific Development Studies. Washington, DC: Wodd Bank.
World Bank. 2024f. "African Continental Free Trade Area (AfCFTA): Supporting Implementation with a Focus on Investment " World Bank, Washington, DC.
World Bank. 2024g. Global Economic Prospects. January. Washington, DC: World Bank.
World Bank. 2025. Global Economic Prospects. January. Washington, DC: World Bank.
World Bank and World Trade Organization (WTO). 2023. Trade in Services for Development: Fostering Sustainable Growth and Economic Diversification Geneva: Wodd Trade Organization.
World Bank-WDI (World Development Indicators) database. "World Development Indicators." https:// databank.worldbank.org/source/world-developmentindicators.
World Economic Forum. 2020. "Digital FDI Policies, Regulations and Measures to Attract FDI in the Digital Economy." White Paper. World Economic Forum, Geneva.
World Economic Forum. 2023. "Guidebook on Facilitating Climate FOL" White Paper, World Economic Forum, in collaboration with fDi Strategies, Geneva.
Xiahou, Q., C. H. Springer, and R. Mendelsohn. 2022. "The Effect of Foreign Investment on Asian Coal Power Plants." Energy Economics 105 Qanuaty): 105752.
Home to more than one billion people, the 39 emerging market and developing economies (EMDEs) classified as being in .fragile and conflict-affected situations (FCS) are plagued by instability and weak institutions, hindering their ability to attain the robust, sustained economic growth needed for development. These economies exhibit lower per capita incomes, slower economic growth, and greater volatility than other developing countries Conflicts impose a high human and economic toll on many FCS economies. High-intensity conflicts are associated with a cumulative loss in per capita GDP ofabout 20 percent five years after their onset, relative to pre-conflict projections. A 1 percent increase in conflict-related fatalities per million population in FCS economies is estimated to reduce per capita GDP by around 3. 7 percent after five years. FCS economies experienced far deeper contractions than other EMDEs during the COVID-19 pandemic, while their recovery has been much weaker. About 70 percent of FCS economies are either at high risk of or already in debt distress-up .from around 40 percent a decade ago. Employment growth continues to lag population growth. Tailored policies, reforms, and sustained global support are needed to expand opportunities for economic growth and job creation in FCS economies. Case studies .from a diverse group of economies that were formerly afflicted by conflict in Africa, Asia, and Europe provide policy insights.
Economies in fragile and conflict-affected situations (FCS) are home to around one billion people. 1 These 39 economies comprise a mix of lowand middle-income economies, spread across all regions, with Sub-Saharan Africa (SSA) accounting for about one-half, East Asia and Pacific for about one-fifth, and the Middle East and North Africa for nearly one-sixth (table 4.1; figures 4.1.A and 4.1.B). They include populous as well as small, geographically remote economies Seventy percent of the total population in FCS economies resides in SSA.
FCS economies face deep, intertwined challenges
Just over half of them are in active conflict, while others are in an early post-conflict phase Some have had minimal or no recent experience of conflict but suffer from enduring fragility. FCS economies tend to have weak government capacity and are highly exposed to large adverse shocks-
Note : This chapter was prepared by Samuel Hill, Jeecendra Khadan, and Peter Selcuk, with contributions from Peter Pedroni
1Unless otherwise seated, chis chapter uses the World Bank's 2025 PCS list as the primary group of economies for analysis. The comparator groups, unless otherwise indicated, consists of EMDEs excluding chose classified as PCS and advanced economies. "Fragility" is defined as a systemic condition or situation characterized by extremely low institutional and governance capacity, which significanrly impedes the state's ability to function effectively, maintain peace, and foster economic and social development. "Conflict" is defined as a situation of acute insecurity involving the use of deadly force by a group--including state forces, organized non -state groups, or ocher irregular entities-with a political purpose or motivation (World Bank 2024a)
such as natural disasters, commodity price swings, and global economic downturns-in addition to conflict Global poverty and food insecurity are increasingly concentrated in FCS economies. Indicators of human development in these economies lag well behind those in other emerging market and developing economies (EMDEs). Underscoring the persistence of their challenges, around three-quarters of current FCS economies have been classified as such for at least a decade, and half for at least 15 years (figure 4.LC).
Most indicators suggest that the incidence and severity of conflicts have increased in recent decades, with the number of conflicts involving at least one state reaching 61 in 2024 Since the 2000s, the number of individual conflict events and conflict-related fatalities has more than tripled, with most of the increase having occurred since around 2010 (figures 4.1.D and 4.1.E). The most severe conflicts in recent years, including those FCS economies such as Ethiopia, Sudan, Ukraine, and the West Bank and Gaza, have resulted in tens of thousands of fatalities.
By several measures, state capacity is far lower in FCS economies than in other EMDEs (figure 4.1.F) 2 Moreover, conditions have worsened in
2 For consistency, the World Bank's 2025 PCS list is applied retroactively throughout the chapter to allow for comparability of the same group of economies over time. Comparisons of key trends and aggregate indicators using a time-varying list of PCS economiesreflecting their entry into or graduation from the World Bank's PCS list-show chat the main findings presented in the chapter are broadly unchanged
FCS economies are found in all regions of the world and include both lowand middle-income groups. Around three-quarters of current FCS economies have been classified as such for at least a decade. Elevated levels of conflict and weak government institutions are key development challenges facing these economies.
Sources: Uppsala Conflict Data Program (database); World Bank; Worldwide Governance Indicators (database)
Note: EAP = East Asia and Pacific; ECA = Europe and Central Asia; EMDEs = emerging market and developing economies; FCS = fragile and conflict-affected situations; LAC = Latin America and the Caribbean; LICs = low-income countries; LMCs = lower middle-income countries; MNA = Middle East and North Africa; SAR= South Asia; SSA= Sub-Saharan Africa; UMC = uppermiddle-income countries. The FCS group is based on the current World Bank classification,unless otherwise specified
A.B Sample includes 36 FCS in 2010 and 39 FCS in 2025, based on the numberof economies classified as FCS in the respective years.
C Sample includes the 39 economies classified as FCS in 2025 grouped by the number ofyears each economy has held this status since 2006, when the World Banks current FCS classification system was established.
D E. Solid lines show the simple average for the period indicated. Last observation is December 2024 Sample includes conflict associated with state-based, non-state,and one-sided violence in up to 82 economies The Uppsala Conflict Data Program defines a conflict "event"as an incident in which armed force was used by an organized actor against anotherorganized actor,oragainst civilians resulting in at least one direct death. (D) Bars show the numberof conflicts per year; (E) Bars show the number of fatalities peryear.
F Panel shows simple averages Highervalues reflect betteroutcomes across each indicator, which range from a minimum of -2 5 to a maximum of 2 5 Sample includes 148 EMDEs,of which 34 are FCS.
FCS economies since around 2010, while those in other EMDEs have improved slightly. Weak institutional conditions reduce the capacity of policy makers in FCS economies to respond to shocks, whether they originate from external or domestic sources.
Against this backdrop, this chapter reviews the characteristics, recent developments, and prospects of FCS economies. It aims to highlight the challenges they face and the opportunities and policies that can help them achieve a durable exit from conflict and fragility, and attain sustained, inclusive growth and development The chapter addresses three questions:
What are the key economic characteristics of FCS economies?
What are the features and economic effects of conflict?
What are the policy priontres for improving development outcomes and leveraging growth opportunities in FCS economies?
Contributions. The chapter makes several contributions to the literature
Main features and peiformance of PCS economies. The chapter provides the first comprehensive analysis of the economic performance and structural characteristics of FCS economies in the 2020s. This includes an analysis of the poor performance of FCS economies in the face of the COVID-19 pandemic and subsequent shocks. While broad challenges and policy priorities in FCS economies were examined in World Bank (2011), that study predates the pandemic and other recent shocks, including the ramp-up of conflicts in recent years Other recent studies have examined economic developments in different groups of EMDEs, including low- and middleincome countries, and particular aspects of FCS economies such as their macroeconomic policies (Chami et al. 2021; Chrimes et al. 2024; World Bank 2025a) In contrast, this chapter covers the broader range of challenges, often intertwined, that FCS economies face specifically.
Costs of conflict and other shocks. The chapter uses complementary analytical approaches-including event studies, counterfactual exercises, and econometric analysis-to estimate the economic costs of conflict. This analysis extends the existing literature by taking a global perspective, incorporating recent conflicts, and applying novel methods that provide insights into the heterogeneous effects of conflict as well as the structural and institutional factors that can influence their costs.
Growth prospects, opportunities, and risks . Although the post-pandemic recovery in FCS economies has been weak and the growth outlook is challenging, there are meaningful opportunities for growth. The chapter explores a variety of scenarios for medium-term growth prospects. It then examines how demographic conditions, resource endowments-particularly those involving minerals linked to the energy transition-and tourism could contribute to growth. The analysis also considers the challenges associated with leveraging these opportunities, including those related to governance, institutional capacity, and the need for investment in human capital and infrastructure.
Policy priorities. The chapter outlines key policy priorities to address the persistent risks of violence, instability, and fragility in FCS economies. It emphasizes conflict prevention through earlywarning systems, inclusive development, and resilience-building, while also highlighting the importance of efforts to protect critical infrastructure, provide humanitarian aid, and preserve institutions during violent conflicts. Drawing on the literature and on case studies of five economies, the chapter highlights the importance of post-conflict recovery efforts-such as reintegration programs, social investments, and governance reforms-for long-term stability. The policy analysis underscores the critical role of international support in fostering peace and resilience, including through concessional financing, debt relief, and technical assistance.
The main findings of the chapter are as follows:
Weak macroeconomic performance. Since the turn of the century, average GDP per capita growth in FCS economies has lagged behind that
of other EMDEs-and, since 2020, has also fallen behind the pace in advanced economies FCS suffered an output contraction of nearly 6 percent in the pandemic year of 2020-more than three times that of other EMDEs Their post-pandemic rebound has been markedly weaker, with growth less than half the average of other EMDEs since 2021. The pandemic downturns were deepened by limited fiscal space and increased borrowing costs, which constrained the ability of governments to respond. As a result of persistently weak growth, per capita GDP in FCS economies has fallen further behind other EMDEs and, more recently, advanced economies as well. This underperformance reflects exposure to adverse shocks and several underlying weaknesses, including weak capital formation and underemployment of labor. In addition, structural transformation has remained limited: These economies have smaller industrial and services sectors than other EMDEs and are more dependent on commodity exports
Lagging human development and rising poverty. Health and education outcomes tend to be markedly worse in FCS economies than in other EMDEs, a consequence of limited government capacity, government services, and personal security. These conditions, along with weak growth and frequent adverse shocks, have contributed to increases in extreme poverty. FCS economies now account for about one-half of the world's extreme poor, although they have less than 15 percent of the global population. Fueled by escalating conflict, acute food insecurity in these economies has also surged: It affected nearly 200 million people in FCS economies in 2024, or 18 percent of their populations. In other EMDEs, the incidence of acute food insecurity is about 1 percent of their populations.
High economic costs of conflict. The results from the event study, counterfactual exercise, and econometric analysis indicate that conflict has tended to lead to slower output growth, and in many cases, to large and persistent output losses. These costs tend to increase with conflict intensity. High-intensity conflicts have been associated with a cumulative decline in per capita GDP of about 20 percent five years afrer the onset of a conflict, relative to pre-conflict projections. The
impact on per capita GDP of a 1 percent rise in conflict-related fatalities per million population is estimated to be nearly 3.7 percent after five years in FCS economies. Conflicts have tended to have adverse effects on all sectors of production, but particularly on industrial sectors. Several institutional and structural features, including stronger governance, higher levels of human development, deeper financial markets, and greater readiness for climate-related disasters, have been associated with lower costs of conflict.
Growth opportunities amid a challenging outlook. Medium-term growth scenarios suggest that FCS economies will struggle to reach output levels projected before the COVID-19 pandemic, even by the end of the current decade. By 2030, the output of these economies is projected to be about 9 percent below its pre-pandemic projected trend if growth matches its 2010-19 average, and over 20 percent below if recent, much weaker, growth persists. However, while conditions vary, these economies have significant growth opportunities, particularly in the form of demographic tailwinds, natural resource endowments, and tourism potential. Their expanding working-age populations could be a key driver of output growth, with the share projected to reach about 60 percent by 2040 and, by about 2055, to exceed the share in other EMDEs. Some resource-rich FCS economies are well-positioned to benefit from rising demand for critical minerals amid the energy transition In economies where conflict has subsided, tourism holds untapped potential for job creation and economic diversification Realizing these opportunities requires targeted policies that enhance securiry, strengthen governance, create jobs, and prioritize investment, including in human capital and infrastructure.
Important domestic and global policy priorities. Policy makers in FCS economies can take steps to reduce fragility, foster stability, and expand economic opportunities. Fragile states need to strengthen governance, build institutional capacity, and address deep-seated grievances that may lead to conflict. Those in conflict need to prioritize humanitarian access, safeguard critical infrastructure and institutions-which can save lives, reduce reconstruction costs-and support
inclusive recoveries. As countries transition out of conflict, sustained investments in infrastructure, education, healthcare, and social protection, alongside efforts to broaden financial inclusion and harness the private sector to expand economic opportunities and generate jobs, will be key to laying the foundation for lasting peace and stability. The global community must deepen its engagement with FCS economies and strengthen coordination of support through concessional financing, debt relief, and technical assistance. The continued provision of emergency relief, reinforcement of peace-building efforts, and investment in long-term resilience are also essential to stabilize these economies.
The characteristics of FCS economies reflect the significant challenges they have faced in recent years, particularly in the wake of rising global conflict and the COVID-19 pandemic. They also indicate the difficulties these economies are likely to encounter in the years ahead. They have experienced major setbacks, including substantial falls in aggregate and per capita output, as well as elevated economic volatility and inflation. Amid limited and shrinking fiscal capacity, conflict and other adverse shocks have had substantial negative effects on already weak investment, employment, and human capital, eroding both potential and actual economic growth. This profound economic underperformance has manifested itself in stubbornly high poverty and worsening food insecurity.
Growth of GDP per capita in FCS economies has persistently fallen short of growth in other EMDEs since the turn of the century, reflecting conflicts, other adverse shocks and FCS economies' limited capacity for policy support or response (figure 4.2.A). In 2000-09, average annual growth of GDP per capita in FCS economies was more than 1.5 percentage points lower than in other EMDEs. Over 2010-19, as the incidence of conflicts in PCS economies rose, their average annual per capita GDP growth fell to nearly 3
percentage points below that in other EMDEs. Since 2020, average annual growth of per capita GDP in FCS economies has been negative. In contrast, other EMDEs and advanced economies have seen subdued but still positive growth. Gaps in the annual average rate of per capita GDP growth relative to other EMOEs have widened both for FCS economies that have experienced conflict and for those that have not. On average, during 2020-24, the gap between FCS economies and other EMDEs was about 5 percentage points
Reflecting FCS economies' feeble growth record, since 2000 their average per capita GDP has fallen further behind that of other EMDEs, and since 2020, behind that of advanced economies as well. In 2000, average per capita GDP in FCS economies was a little under half of that in other EMDEs, but by 2024 the ratio had slumped to less than a quarter (figure 4 2.B). Similarly, the share of FCS economies making progress in narrowing the gap in per capita GDP with advanced economies has dwindled (figure 4 2.C). Whereas around two-thirds of FCS economies were catching up to advanced economies in the first decade of this century, the share declined to around onehalf in the second decade and to less than onequarter during 2020-24.
Besides persistently slow economic growth, FCS economies have experienced greater economic volatility than other EMDEs, with more variable growth of output, private consumption, and investment (figure 4.2.D). These economies are also more vulnerable to global shocks, including shifts in commodity prices, external demand, and financial conditions (Boussard et al. 2024). This reflects, in part, weaker fiscal capacity and procyclical fiscal responses, a lack of broad access to financial resources, and other structural features. Large swings in commodity prices can have a marked impact on activity in FCS economies, given that about three-quarters of them are heavily reliant on commodity exports. Many FCS economies also face price volatility stemming from high dependence on imported food and energy. Difficulty managing fixed or heavily regulated exchange rates-the most common exchange rate arrange-
On average, GDP per capita growth in FCS economies has lagged behind that of other EMDEs since the turn of the century and has been negative since 2020. Consequently, GDP per capita in FCS economies has fallen further behind other EMDEs, and the share converging with advanced economy levels has dwindled. FCS economies also experience greater economic volatility than other EMDEs.
A. Average annual growth of GDP per capita
GDP per capita
Output volatility
Note : AEs = advanced economies; EMDEs = emerging market and developing economies; FCS = fragile and conflict-affected situations. The FCS group is based on the current World Bank classification
A. Bars show simple averages of GDP percapita growth rates in each group of economies across the indicated years.
A.B. GDP percapita for each group is calculated as aggregate GDP divided bythe aggregate population GDP is measured in real U.S. dollars at average 2010-19 prices and market exchange rates. Sample includes 34 FCS, 113 EMDEs excluding FCS,and 37 advanced economies. B. Lines show GDP percapita (in thousands of real U.S. dollars) for each group of economies across the indicated years.
C. Bars show the share of FCS with (simple) average GDP per capita growth exceeding that of advanced economies in the indicated years. Sample includes 34 FCS.
D. Bars for consumption and investment use data forthe private consumption and investment components of GDP. Volatility is measured as the median ofthe standard deviation of annual percent changes by component,across country groups. Sample spans a maximum period of 1981-24and 149 EMDEs (of which 37 are FCS) for GDP,and 102 EMDEs (of which 19 are FCS) for GDP components.
ments in FCS-coupled with weak institutional capacity, can also contribute to economic volatility (Adam and Wilson 2021). Authorities sometimes respond to exchange rate pressures with administrative measures like import restrictions, which can exacerbate volatility. Misaligned exchange rates can also force sudden sharp devaluations and high inflation, as seen recently in Myanmar and Nigeria.
The COVID-19 pandemic led to a larger drop in output and a weaker recovery in FCS economies than in other EMDEs. Globally, extreme poverty has become more concentrated in FCS economies since 2020, while food inflation is higher than in other EMDEs. Borrowing costs in FCS economies remain elevated relative to pre-pandemic levels , and the gap between their borrowing costs and those of other EMDEs has widened.
A GDP growth
C. Per capita GDP loss relative to prepandemic projections for FCS economies
B Cumulative output losses relative to pre-pandemic projections
Disproportionate impacts of the COVID-19 pandemic
D. FCS economies' share of global population living in extreme poverty
In 2020, the first year of the COVID-19 pandemic, the output of FCS economies contracted by an average of almost 6 percent, compared with less than 2 percent in other EMDEs (figure 4.3.A). The subsequent recovery was much weaker in FCS economies than in other EMDEs. As the global economy contended with successive shocks, including surging inflation and interest rates, volatile commodiry prices, and rising conflict, GDP growth in FCS economies averaged less than 2 percent a year between 2021 and 2024, compared with about 5 percent in other EMDEs. By the end of 2024, the cumulative output loss suffered by FCS economies relative to pre-pandemic projections was almost 13 percent, about three times the cumulative loss in other EMDEs (figures 4.3.B and 4.3.C).
E. Food inflation
F. Sovereign spreads
Sources: Haver Analytics; J P. Morgan;Mahler, Yonzan,and Lakner (2022); World Bank;World Bank Poverty and Inequality Plattorm (database)
Note : AEs = advanced economies; EMDEs = emerging market and developing economies;e = estimate; f =forecast; FCS =fragile and conflict-affected situations The FCS group is based on the current World Bank classification.
A Bars show simple averages of annual GDP-weighted averages Aggregates are calculated as weighted averages using GDP at average 2010-19 prices and market exchange rates as weights Sample includes 147 EMDEs of which 34 are FCS
B Lines show the percent deviation between the latest growth projections and those published in the January 2020 edition of Global Economic Prospects (World Bank 2020a) For2023 and beyond,the January 2020 baseline is extended using the projected growth for 2022. Sample includes 37 advanced economies and 143 EMDEs,of which 32 are FCS.
C. The area between the two lines shows the difference in the level of percapita GDP between the June 2025 and January 2020 editions of Global Economic Prospects. For2023 and beyond, the January 2020 baseline is extended using the projected growth for 2022. Sample includes 143 EMDEs,of which 32 are FCS
D. Extreme poverty is defined as living on less than $3 perday in 2021 purchasing power parity (PPP) Estimates after2023 are nowcasts Sample includes 192 economies,of which 39 are FCS
E Year-over-yearchange in prices. Lines show median food price inflation for an unbalanced sample of up to 95 EMDEs of which up to 14 are FCS Last observation is March 2025
F. Aggregates are the median from a sample of up to 57 EMDEs,of which 9 are FCS. Last observation is April 25,2025.
Meanwhile, extreme poverty has risen in these economies, with the share of global poor living in FCS economies climbing by 10 percentage points, to about 50 percent, since 2020-and projected to rise by a further 6 percentage points by 2030 (figure 4.3.D). Since 2020, FCS economies have also experienced higher inflation than other EMDEs, with food inflation soaring to a peak of about 19 percent in 2022 from about 2.5 percent in 2019, accompanied by rising food insecurity and malnutrition (figure 4.3.E; IMF 2021; World Bank, UNESCO, and UNICEF 2021).
The larger post-pandemic output losses in FCS economies compared to other EMDEs may indicate greater economic scarring. Extensive school closures in some countries led to considerable learning losses, eroding both human capital and likely future earnings (Schady et al. 2023; World Bank, UNESCO, and UNICEF 2021). Since the pandemic, governments in FCS have also faced greater difficulties borrowing from private lenders, constraining their scope to invest. Sovereign spreads for FCS economies have remained higher than they were at the start of the pandemic, in contrast to other EMDEs (figure 4.3.F). Reliance on official sources of borrowing in FCS economies has also increased, with just over three-quarters of external public debt now owed to official bilateral and multilateral lenders, up from about 70 percent in 2019.
Sustained, strong investment in physical and human capital is critical for faster economic growth in EMDEs and progress toward development objectives, including improved infrastructure and the renewable-energy transition (World Bank 20246, 2024c). Foreign direct investment (FDI), which generally embodies not only capital bur also new technology and know-how, can be particularly beneficial in terms of enhanced productivity (Alfaro 2017) However, fragility and conflict tend to deter both domestic and foreign investment, resulting in weak capital formation and a lack of capital deepening in FCS economies 3 Between 2000 and 2019, for example, there appears to have been much less capital-deepening in FCS economies than in other EMDEs. In 2000, physical capital stocks per capita in FCS economies were about one-third of the level in other EMDEs, but by 2019, this ratio had declined (figure 4.4 A). Consistent with these trends, FCS economies have long received much smaller inflows of FDI relative to GDP than other EMDEs. Since the pandemic, their ratio of FDI inflows to GDP has fallen even further (figure 4.4.B).
In FCS economies experiencing active conflict, governments may be unable to perform critical functions needed to enable investment, such as ensuring security, enforcing the rule of law, and providing essential infrastructure. In the absence of conflict, weak state capacity or legitimacy can still heighten policy uncertainty and regulatory risk. Where conflict is present, it can deter investment both immediately and over the long term (Alfar, Elheddad, and Doytch 2024; De Roux and Martinez 2022). Conflict can disrupt production and damage or destroy buildings, capital equipment, and inventories, thereby reducing firm profitability and disincentivizing investment, including in working capital (Custodio, Mendes, and Mendes 2025). The threat of conflict, particularly in fragile post-conflict environments, increases investor risk, raising the bar for required rates of return and reducing investment viability. Dimin-
With fragility and conflict hindering investment in FCS economies, capital stocks per capita are now less than one-third of those in other EMDEs , with the ratio declining since 2000 FD/ inflows to FCS economies have long been lower than in other EMDEs Weak investment in FCS economies partly reflects lagging financial development and weak credit supply to the private sector. The share of the working-age population in employment has steadily declined in FCS economies since 2000. Roughly 90 percent of the world 's displaced population are from FCS economies
A. Capital stock per capita
3 See Blair, Christensen, and Wirtschafter (2022); Dieppe, Kilic Celik, and Okou (2020); and Ghossein and Rana (2022).
C Domestic credit to the private sector
B Foreign direct investment, net inflows
D Employment as a share of the working-age population in FCS economies
E. Cumulative changes in employment F. Global displaced population and working-age population in FCS economies since 2000
Sources: International Labor Organization; Penn World Table (database); United Nations High Commissionerfor Refugees; WDI (database);World Bank.
Note: EMDEs = emerging market and developing economies; FCS = fragile and conflict-affected situations; UNHCR= United Nations High Commissionerfor Refugees The FCS group is based on the current World Bank classification
A. Lines show population-weighted averages. Capital stock is measured using purchasing power parity (PPP) exchange rates in real 2017 U.S. dollars. Sample includes 135 EMDEs,of which 26 are FCS. Last observation is2019.
B. Bars show medians. Sample includes 140 EMDEs,of which 29 are FCS.
C. Bars show medians of the average domestic credit to the private sector to GDP ratio overthe period 2020-23. Markers represent the medians for the year 2010. Sample includes up to 135 EMDEs,of which up to 33 are FCS
D. Line shows the simple average of modelled estimates of employment to population (overage 15). Sample includes 33 FCS.
E. The working-age population includesthose ages 15years and above. Sample includes 33 FCS.
F. Bars show displaced people based on country oforigin,including refugees,asylum seekers,and internally displaced populations. Sample includes up to 152 EMDEs,of which up to 37 are FCS.
ished fiscal capacity-reflected in lower government revenues and reduced scope for borrowingcan reduce public investment, which plays an outsized role in poorer countries (World Bank 2024c).
For foreign invesrors, risks in FCS economies can be prohibitive-often because of inadequate legal and regulatory transparency, lack of effective legal recourse, and prohibitive or burdensome investment and currency restrictions (World Bank 20206). Fragility and conflict can also skew foreign investment toward sectors where returns are sufficiently high to compensate for additional risks, including in capital-intensive resource extraction and sectors where competition is limited (World Bank 20246). These limitations hinder the benefits, including value-added in the domestic economy, as well as the scale of FOi in FCS economies.
Since financial development relies particularly on the presence of well-functioning institutions that protect property rights, it has tended to lag in FCS economies, limiting the supply of credit to the private sector. Not only do financial markets lack depth in these economies, but financial inclusion is also often weak, particularly in the most fragile economies (Barajas, Chami, and Fullenkamp 2021). In the median FCS economy, the private sector credit to GDP ratio is about one-third the level observed in other EMDEs (figure 4.4.C). Moreover, since 2010 this ratio has stagnated in FCS economies, while in other EMDEs, on average, there has been steady progress.
Given their rapid population growth, FCS economies must generate a higher number of productive jobs to sustain growth, reduce poverty, and support inclusive development (Chrimes et al. forthcoming). However, employment growth in these economies has fallen short of population growth since at least the turn of the century: During 2000 -22, the working-age population of FCS economies increased by 270 million, but employment increased by only 140 million, so that the average ratio of employment to the working-age popula-
tion fell from just under 60 percent ro less than 55 percent (figures 4.4.D and 4.4.E). In contrast, in other EMDEs, employment on average has broadly kept pace with population growth.
Fragility and conflict have a wide range of adverse effects on labor markets-restricting labor mobility, reducing labor supply, weakening labor demand, and reducing the welfare and health of workers (Adelaja and George 2019; Di Maio and Sciabolazza 2023; Utar 2024).
Underemployment of labor-particularly among women, especially young women-limits household incomes and savings, which, in turn, constrain domestic investment and reinforce weak capital formation (Hossain, Bazarkulova, and Compton 2024). Although the high prevalence of informality in EMDEs, including FCS economies, can help buffer job losses during adverse economic shocks, it is also associated with broader development challenges, including a tendency for conflict to shift activity toward illicit activities (Galdo, Acevedo, and Rama 2021; Loungani, Luttini, and Pallan 2025; Ohnsorge and Yu 2022). Finally, dependence on resource extraction in many FCS economies may limit job opportunities in more labor-intensive tradeable sectors, notably manufacturing (Gollin, Jedwab, and Vollrath 2016).
Conflict can also lead to a loss of skilled workers through emigration and population displacement, as well as through death and injury, compounding labor-market challenges in FCS economies Emigration from FCS economies is driven mainly by two motives: safety and improved economic circumstances (World Bank 2023a) In 2024, over 90 percent of the world's refugees and internally displaced people originated from FCS economies, especially those that had experienced severe conflict and instability in recent years, including Afghanistan, Myanmar, South Sudan, the Syrian Arab Republic, Ukraine, and the Republica Bolivariana de Venezuela (figure 4.4 F; World Bank 2023a). Although remittances are an income lifeline for some FCS populations, many refugees fleeing conflict relocate to neighboring countries, which are often fragile themselves and offer limited opportunities for displaced populations (Chami et al. 2018; World Bank 2023a).
One sign of lagging development in many FCS economies is their continued dependence on primary commodities-particularly agriculturedue to limited structural transformation (Mijiyawa 2017; Schlogl and Sumner 2020). This often stems from limited investment and an unfavorable environment for fostering technological progress and the adoption of new technologies. In some FCS economies, small domestic markets and geographic isolation from key export destinations further limit opportunities to reap economies of scale (World Bank 2022a). On average, agriculture accounts for just over 20 percent of output and 40 percent of employment in FCS economies-about twice the shares in other EMDEs (figures 4.5.A and 4.5.B). The industrial and services sectors, accordingly, account for smaller shares. The limited presence of manufacturing and services in FCS economies limit the scope for growth in labor productivity, while much of the potential productivity growth available from a shift of resources out of agriculture remains to be tapped The relatively stagnant sectoral structure of production may also contribute to inequality (Morsy, Shimeles, and Nabassaga 2023). In addition, high dependence on agricultural and other primary commodities leaves FCS economies more vulnerable to adverse shocks, especially from sharp movements in global commodity prices and climate-related weather events Qaramillo et al. 2023).
Pardy because their industrial and service sectors account for smaller shares of GDP than in other EMDEs, FCS economies are less open to international trade. The median ratio of trade (exports plus imports) to GDP is around 10 percentage points lower in FCS economies than in other EMDEs, a gap that has remained unchanged for more than a decade (figure 4.5.C). Many factors hinder international trade in fragile situations, including weak regulatory frameworks, corruption, inadequate trade facilitation, transport disruptions, and political instability (Cali 2015; Chacha and Edwards 2019). In addition to damaging transport infrastructure, conflict reduces trade by raising transport costs, causing the closure
Agriculture accounts for far greater shares of output and employment in FCS economies than in other EMDEs , while industry and services contribute smaller shares FCS economies are less open to trade than other EMDEs and are more dependent on commodities. About threequarters of FCS economies are classified as commodity exporters, compared with a little over half of other EMDEs
lSources: WDI (database);World Bank.
Note: EMDEs = emerging market and developing economies; FCS = fragile and conflict-affected situations. The FCS group is based on the current World Bank classification.
A. Bars show simple averages. Data are for 2022 Sample includes 146 EMDEs,of which 33 are FCS.
B. Bars show simple averages. Data are for 2022 Sample includes 141 EMDEs,of which 33 are FCS.
C. Panel shows exports plus imports of goods and services as a share of GDP in the median economy. Sample includes 118 EMDEs,of which 25 are FCS.
D. Share of FCS and other EMDEs by type of commodity exporter and importer. The taxonomy of commodity exporters follows the definition in chapter 1of the June 2025 Global Economic Prospects. Sample includes 154 EMDEs of which 39 are FCS.
of border points, reducing mobility, and destroying the social capital that facilitates exchanges across borders (Korovkin and Makarin 2023; WCO 2022). Conflict is particularly harmful to those engaged in informal trade-typically the poor and often women-as well as small firms and those that lack stable contractual relationships in export markets (Ksoll, Macchiavello, and Morjaria 2023; Rauschendorfer and Shepherd 2022).
FCS economies lack diversified export bases and are more dependent on commodity exports than other EMDEs (Cali 2015). Around three-quarters of FCS economies are classified as commodity
FCS economies tend to be more fiscally constrained than other EMDEs, with lower revenues despite greater spending needs. Fiscal deficits have been persistently larger in FCS economies than in other EMDEs , pushing debt-to-GDP ratios higher and raising concerns about debt sustainability. Almost three-quarters of FCS economies are in, or at high risk of, debt distress, compared with fewer than half of other EMDEs.
Government
and expenditure, 2020-24
Sources : World Economic Outlook (database); World Bank; World Bank-IMF Debt Sustainability Framework
Note: EMDEs = emerging market and developing economies; FCS = fragile and conflict-affected situations. The FCS group is based on the current World Bank classification.
A. Bars show the medians of country averages for 2020-24. Sample includes 151 EMDEs of which 36 are FCS. Data refers to general government revenues and expenditures
B Bars show the median of country averages for different periods Sample includes 144 EMDEs,of which 33 are FCS.
C. Line shows the median of a sample of 33 FCS economies
D. Sample covers economies where the Joint World Bank-International Monetary Fund Debt Sustainability Framework for Low-Income Countries is applied,as of end-March 2025,including 67 EMDEs,of which up to 28 are FCS.
Weak governance, poor resource management, and instability limit their ability to reap the benefits of their resource endowments, leaving them particularly vulnerable to the resource curse" (Biresselioglu et al. 2019). Natural resources can be an important catalyst for development in FCS economies, but if managed poorly, they can fuel tensions and lead to conflict (Collier and Hoeffler 2005; Maconachie 2016).
Weak state capacity and slow, erratic growth constrain governments' ability to raise revenue in FCS economies, as indicated by the median ratio of revenues to GDP, which is about 6 percentage points lower than in other EMDEs (figure 4.6.A). This weak revenue generation capacity severely limits governments' role, especially their ability to use fiscal policy to offset shocks-an issue made worse by the absence of exchange rate flexibility and independent monetary policy. Inadequate revenue generation in FCS economies also impedes government spending on investment and public goods needed to meet development goals. Small FCS economies, in particular, face elevated spending needs due to diseconomies of scale in the provision of public goods and services (Hill and Khadan 2024; World Bank 2024c).
exporters, compared with a little over half of other EMDEs, and they exhibit greater commodityexport dependence across all major commodity groups, including agriculture, energy, and metals (figure 4.5.D). At the same time, FCS economies' manufacturing exports represent only about half the share seen in other EMDEs. Similarly, in FCS economies, services exports account for only about 5 percent of GDP, on average, compared with about 12 percent in other EMDEs. This lack of output and exports diversification limits opportunities for FCS economies to integrate into global value chains.
Inadequate revenue collection in FCS economies reflects structural and institutional weaknesses, including limited state capacity, political instability, corruption, and pervasive informality (Akitoby, Honda, and Primus 2020; World Bank 20256). Low tax compliance, reflecting not only poor administration and enforcement but also weak taxpayer morale, rooted in perceptions that the state lacks legitimacy or may not use revenues in the interests of citizens, adds to these challenges (Besley and Mueller 2021). In addition, in conflict-affected areas where governments lack control, non-state armed groups may establish their own tax systems to fund their operations, further undermining the state's revenue-raising efforts (Bandula-lrwin et al. 2024). Conversely, limited fiscal capacity can undermine government legitimacy, reinforce state weakness, and exacerbate fragility (Eissa et al. 2023).
Lacking secure revenue bases, FCS economies are more dependent than other EMDEs on grants and
concessional loans from foreign governments and multilateral institutions In recent years, the median tax revenue-to-GDP ratio in FCS economies was below thresholds commonly associated with an acceleration in growth (Choudhary, Ruch, and Skrok 2024). Among FCS economies with the highest revenue-to-GDP ratios, revenues are often heavily reliant on more volatile sources, notably natural resource rents. As a result of these revenue constraints and more limited avenues to borrow commercially, the median government spendingto-GDP ratio in FCS economies is about 7 percentage points lower than in other EMDEs. If external assistance becomes harder to access, financing pressures in FCS economies are likely to worsen.
Successive adverse shocks and slower economic growth have strained government finances in FCS economies. Fiscal deficits have been persistently larger in FCS than in other EMDEs, both before and after the pandemic (figure 4.6.B; World Bank 20256). The median government debt-to-GDP ratio in FCS economies rose steadily between 2014 and 2019, to around 40 percent, before jumping to about 50 percent of GDP in 2021 (figure 4.6.C). Since then, the ratio has moderated, but there has been no consistent fiscal consolidation or reduction in debt, and sovereign spreads and borrowing costs have increased in some FCS economies As of mid-2025, about 70 percent of FCS economies are in, or at high risk of, debt distress-a sharp increase from around 40 percent a decade ago-as a result of rising debt burdens and broader economic challenges (figure 4.6.D; Mawejje 2025).
Weak state capacity and a lack of personal safety in FCS economies can have wide-ranging adverse effects on education and health conditions, limiting opportunities for individuals and exacerbating economic weaknesses.
The disruption of education and destruction of education-related infrastructure during conflict can result in years of forgone education (Ito et al. 2024). Conflict also impedes learning through increased psychological stress caused by exposure to, and risk of, violence, and reduced quality of
the learning environment, such as greater classroom overcrowding (Bruck, Di Maio, and Miaari 2019; Michaelsen and Salardi 2020) The average duration of schooling is also shorter in FCS economies, averaging just under six years, approximately three years less than in other EMDEs (figure 4 7.A) Secondary school enrollment rates in FCS economies are typically around 50 percent, compared with close to 100 percent in other EMDEs (figure 4.7 B) Learning poverty, measured by the share of children who lack basic reading and writing skills in early school years, is markedly higher in FCS economies than in other EMDEs. The likelihood that education levels in these economies will catch up to those in other EMDEs in the foreseeable future is slim
Key health indicators in FCS economies also lag well behind other EMDEs. In FCS economies that have recently experienced or continue to experience severe conflict, these indicators are among the lowest globally. Life expectancy in the median FCS economy is 64 years, more than seven years lower than in other EMDEs, while infant mortality rates are more than twice as high (figure 4.7.C). These outcomes are worse in economies experiencing conflict than in those that are fragile. Conflict can have pernicious effects on the health of large swaths of civilian populations Qawad et al. 2020). Conflict can reduce access to clean water, increase challenges of maintaining basic sanitation, and raise exposure to toxic substances.
FCS economies also face acute challenges in maintaining health infrastructure and retaining skilled healthcare workers, particularly in unstable and conflict-affected environments where they may need to relocate repeatedly due to safety concerns (Bogale et al. 2024). Limited state capacity in these economies also reduces governments' ability to respond to health emergencies. Even after controlling for policies, death rates during the COVID-19 pandemic were higher in countries with weaker governments (Serikbayeva, Abdulla, and Oskenbayev 2021). The incidence of undernourishment is about four times as high in FCS economies as in other EMDEs, and the incidence of stunting is more than double (figure 4.7.D).
Fragility and conflict undermine education and health-particularly for children-with long-
The duration of schooling in FCS economies Jags well behind that in other EMDEs , while school enrollment rates are much lower and "learning poverty " -defined as deficient reading ski/ls among primary school leavers-is higher. FCS economies also perform worse than other EMDEs across a range of health-related indicators , including life expectancy, infant mortality, and the incidence of undernourishment and stunting.
A Average years of schooling B. School enrollment and "learning poverty"
and overall economic development (Deming 2022). Poor health and inadequate nutrition can compound these effects, further diminishing individuals' chances of success in the labor market later in life (Karbownik and Wray 2025).
C Life expectancy and infant mortality, 2022
Sources : WDI (database);World Bank.
Note : EMDEs = emerging market and developing economies; FCS = fragile and conflict-affected situations. The FCS group is based on the current World Bank classification.
A Bars show averages for indicated time periods Sample includes up to 154 EMDEs, of which up to 39 are FCS.
B Panel shows medians. Data for gross secondary school enrollment rates are for 2021 for a sample of 102 EMDEs including 14 FCS. Data for learning poverty-defined as the share of children at the end-of-primary-school age below minimum reading proficiency-are for 2019 for a sample of 39 EMDEs including 8 FCS
C. Bars show group medians Data are for 2022 Sample includes up to 154 EMDEs, of which up to 39 are FCS.
D Bars showgroup medians. Data for undernourishment are for 2021 and for stunting (of children underage 5) are for 2022. Sample includes up to 142 EMDEs of which up to 37 are FCS.
lasting negative consequences for people's wellbeing, labor productivity, and the economic potential of individuals and countries (Acemoglu and Johnson 2007; Almond, Currie, and Duque 2018; Currie and Vogl 2013). Maternal exposure to conflict-related violence can adversely affect the emotional development of children and increase their risk of engaging in criminal behavior (Hidalgo-Arestegui et al. 2025). Limited access to early education or disruptions to schooling can reduce the likelihood that children will enter and complete higher levels of education, with negative consequences for human capital, future earnings,
The incidence of extreme poverty in FCS economies is both higher and more difficult to reduce than in other EMDEs (Corral et al. 2020) After a steady decline of close to 20 percentage points in the two decades leading up to the mid-201 Os, the fall in extreme poverty rates in FCS economies stalled in the mid-201 Os, as global conflict accelerated (figure 4.8.A). In 2025, almost 40 percent of the population in FCS economies is estimated to live on less than $3 per day, compared with 6 percent in other EMDEs. The incidence of extreme poverty is similar in FCS economies that have recently experienced severe conflict and those that have not.
Amid rapid population growth, the number of people living in extreme poverty in FCS economies has risen in the past decade, in contrast with the continuing decline in other EMDEs. In 2025, the number of people living in extreme poverty in FCS economies is expected to reach about 421 million-having, for the first time in 2024, exceeded the number of extreme poor elsewhereeven though these economies make up just under 15 percent of the world's total population. The outlook for poverty reduction in FCS economies is grim, given their slow, erratic growth, and weak growth potential. Projections suggest that by 2030, more than 435 million people will be living in extreme poverty in FCS economies, accounting for almost 60 percent of the world's extreme poor (figure 4.8.B).
Global food insecurity is also concentrated in FCS economies, where it has given rise to major humanitarian crises. In recent years, the number of people in these economies experiencing acute food insecurity has increased sharply, to around 200 million in 2024, compared with fewer than 60 million in other EMDEs (figure 4.8.C). Within FCS economies, this represents around 18 percent of the population, compared with just 1 percent in other EMDEs (figure 4.8 D) The increase in food
insecurity in PCS economies has been driven overwhelmingly by surging conflict, although shocks such as the pandemic and extreme weather events have play role (FSIN and GNAFC 2024). Conflict increases food insecurity by disrupting local food production, food imports, food transportation, and the functioning of domestic markets and supporting infrastructure. Moreover, conflicts involving major agriculture exporters, such as Russia's invasion of Ukraine, have worsened food insecurity by curtailing global supplies of food and fertilizer (Lin et al. 2023). In some PCS economies, natural disasters, including more frequent and severe extreme weather events related to climate change, have exacerbated food insecurity (Rogal!, Rudolfsen, and Vesco 2025; Yolchi, Wang, and Pede 2024). Food insecurity, in turn, can also drive instability and conflict by generating sudden spikes in food prices and fueling social unrest.
The origins of conflict are complex and shaped by a variety of context-specific factors. In many cases, conflicts stem from deep-rooted inequality, exclusion, and systemic injustice, in addition to other factors such as colonial legacies and entrenched social or religious divisions In recent decades, many conflicts have stemmed from grievances over unequal access to political power, economic opportunities, land ownership and tenancy rights, extractive industries, public services, and justice (United Nations and World Bank 2018). These grievances are often rooted in identity-based divisions-ethnic, regional, or religious divisionswhere persistent marginalization fuels conflict, and higher ethnic fractionalization amplifies its costs (Costalli, Moretti, and Pischedda 2017; 0stby 2013; World Bank 2018a). State-sanctioned abuses, including political imprisonment, torture, and extra-judicial disappearances or killings, can intensify perceptions of injustice and further fuel conflict (Cingranelli et al. 2019; United Nations and World Bank 2018). In recent decades, the declining number of mature democracies and
The share of people living in extreme poverty is much higher in FCS economies than in other EMDEs. After a steady decline over the two decades to the mid-2010s, extreme poverty rates in FCS economies stalled at around 37 percent in the following decade . The number of people living in extreme poverty in FCS economies surpassed that in other EMDEs last year, and is expected to continue rising through 2030. Food insecurity has also increased markedly in FCS economies, largely due to rising conflict. Almost 20 percent of the population in these economies suffers from food insecurity, a much higher share than in other EMDEs
Extreme poverty rate
C Number of people experiencing food insecurity
B Number of people in extreme poverty
D Incidence of food insecurity, 2024
Sources: Food Security Information Network; Mahler Yonzan and Lakner (2022); World Bank; World Bank Poverty and Inequality Plattorm (database).
Note: EMDEs = emerging market and developing economies; f = forecast; FCS = fragile and conflict-affected situations. The FCS group is based on the current World Bank classification A.B. Extreme poverty is defined as living on less than $3 perday in 2021 purchasing power parity (PPP). The observation for 2024 is estimated;data from 2025 onward are forecasts. Sample includes 154 EMDEs, of which 39 are FCS.
C. Bars show the numberof people in food crisis, as classified by the Integrated Food Security Phase Classification Phase 3, that is, in acute food insecurity crisis or worse Sample includes up to 54 EMDEs, of which up to 26 are FCS. Data are for the period 2016-24.
D. Bars show the share of people in food crisis, as classified by the Integrated Food Security Phase Classification Phase 3-that is, experiencing acute food insecurity crisis or worse. Data are for 2024. Sample includes 45 EMDEs, of which 21 are FCS.
weakening of intergovernmental institutions have also contributed to cross-border conflicts. 4
The frequency and intensity of conflicts have increased since the turn of the century, as indicated by the rising number of conflicts and conflict-
4 See, for example, Boehmer, Gartzke and Nordstrom (2004), Fausett and Volgy (2010), Karreth (2017), and Szayna et al. (2017).
related fatalities, especially since 2010. These conflicts have been concentrated in low- and middle-income countries and have caused significant and multifaceted damage.
The number of conflict-related fatalities relative to population is a widely used marker for identifying the onset of a conflict and measuring its intensity.5 Although approaches vary, a conflict is typically considered to begin when annual conflict-related fatalities reach at least 10 per million population, with different thresholds used to characterize conflict intensity. The World Bank's PCS classification characterizes medium-intensity conflicts as those where annual conflict-related fatalities range from 10 to 100 per million population, and highintensity conflicts as those with annual fatalities exceeding 100 per million (World Bank 2020c). Studies of conflicts and their impacts typically use a range of ratios of annual fatalities to population to determine a conflict's onset and intensitycommon thresholds include at least 50, 100, and 150 annual fatalities per million population (Novta and Pugacheva 2021). 6 The year of conflict onset is identified by a fatalities-population ratio that exceeds a given intensity threshold in that year, but not in the four preceding years (Novta and Pugacheva 2021)
For the analysis in this chapter, "mediumintensity" conflicts are defined as those where conflict-related fatalities are at least 50 per million population in the year of onset, while "highintensity" conflicts are defined as those where conflict-related fatalities exceed at least 150 per million in the year of onset. The 50 fatalities threshold is near the midpoint of the 10-100 range of the World Bank's PCS classification of a medium-intensity conflict. At the medium intensity level, conflict-related fatalities of well over 50 per million can occur, and in many cases reach the level of fatalities in high intensity conflicts. Con-
5See, for example, Dunne and Tian (2019), Fang et al (2020), IMF (2019, 2024), and Novta and Pugacheva (2021).
6 Alternatively, some studies use distribution-based approaches to determine conflict severity For example, a conflict is considered high intensity if the rario of fatalities to popularion in the world distriburion falls in the rop quartile (roughly about 25 ro 30 fataliries per million), and as mild if it falls in the bottom quartile (Fang et al. 2020; IMF 2019, 2024)
flier-related fatalities include those directly related to combat between warring parties or violence against civilians and those associated with statebased, non-state, and one-sided violence Since 2010, several conflicts have been classified as highintensity (see annex 4.1).
The analysis here examines conflicts commencing at the medium-intensity and high-intensity thresholds, from a sample of 130 economies-both PCS and non-PCS-using annual data, and is limited to conflicts beginning between 2006 and 2023.7 In high-intensity conflicts during this period, annual fatalities numbered almost 1,000 per million population, on average, at their peak (figure 4 9 A) Conflict-related fatalities totaled, on average, more than 3,500 per million in the five years following the outbreak of hostilities (figure 4.9.B).
In many cases, conflicts that initially commenced at the medium-intensity threshold also resulted in substantial loss of life, with an average peak of over 500 annual fatalities per million and cumulative fatalities of nearly 2,000 per million in the five years after the conflict's onset (figure 4.9.C). In many cases, significant conflict-related loss of life also occurred before the onset threshold was met, as tension gradually mounted.
Most conflicts that started at least at the mediumintensity level lasted a year or less but some spanned five years or more. The duration of highintensity conflicts was somewhat longer, on average, although about one-third lasted less than a year (figure 4.9.D). In some economies there were several separate conflicts, while in others, several conflict episodes could be viewed as one drawnout conflict, such as a civil war, punctuated with pauses.
Conflicts tend to be subject ro a degree of "duration dependence," meaning that the longer they last, the more difficult they are to resolve 8 Conflict occurrence, duration, and intensity, more generally, are also related to economic factors such as per capita income levels and inequality
7 The analysis follows the approach taken in Novta and Pugacheva (202 I) to mark conflict episodes.
8 See, for example, Bennett and Stam (1996), Clark and Hart (1998), Collier et al. (2004), DeRouen and Sobek (2004), Fearon (2004), and Regan and Stam (2002).
(Chaudoin, Peskowitz, and Stanton 2017; Collier and Hoeffler 2002, 2004a) Social and institutional factors, including group fragmentation, state capacity, and the involvement of different domestic or international actors, can also shape the course and intensity of hostilities. 9
Conflicts can inflict enormous and long-lasting economic losses (Abdel-Latif et al. 2024; Federle et al. 2024; Novta and Pugacheva 2021). Empirical estimates from the literature suggest that conflicts ranging broadly from the medium-to highintensity thresholds have been associated with reductions in GDP per capita of around 13 percent after five years, on average (figure 4.10.A). However, losses from particularly intense or lengthy conflicts have been substantially higher, exceeding 20 percent of per capita GDP. For example, GDP in the West Bank and Gaza contracted by 27 percent in 2024, while, in the absence of conflict, GDP per capita in the Central African Republic, South Sudan, and the Syrian Arab Republic could have been at least twice as high. 10
Conflicts can also have considerable international spillovers, reducing growth in other countries by deterring private investment in the surrounding region and decreasing trade flows through disruptions to transportation networks and demand (Rauschendorfer and Shepherd 2022; Rother et al. 2016; Sesay 2004). Fiscal balances in neighboring countries also tend to suffer as spending needs for defense, peace operations, and support for refugees increase, often at the expense of investment in education, health, and infrastructure (Ezeoha et al 2023). Moreover, neighboring countries may become more prone to conflict themselves (AbdelLatif et al. 2024; Buhaug and Gleditsch 2008; Couttenier et al. 2024).
To shed light on the varying economic impacts of conflict, an assessment is made using two analyti-
9 See, for example, Chaudoin, Peskowitz, and Stanton (2017), Collier et al. (2004), DeRouen and Sobek (2004), Regan and Stam (2002), and Siberdt (2024).
10 See, for example, Gatti et al. (2024), Mawejje and McSharry (2021), Mandon, Nossek, and Sandjong (2024), World Bank (20256).
In high-intensity conflicts, annual fatalities peak at an average of nearly 1,000 per million population. Even when using a lower threshold to define a conflict event the human toll is heavy, with peak averages of over 500 annual fatalities per million population. Most conflicts last one to two years, but high-intensity conflicts are more likely than those commencing at a lower threshold to persist beyond two years
A Fatalities around onset of high-intensity conflicts
B. Cumulative fatalities five years following onset of high-intensity conflicts
C Fatalities around onset of conflict at the medium-intensitythreshold
D Duration of conflicts
Sources: Uppsala Conflict Data Program; World Bank.
Note: AZE = Azerbaijan;BFA = Burkina Faso;CAF = Central African Republic; ETH = Ethiopia; FCS = fragile and conflict-affected situations; GEO = Georgia; LKA = Sri Lanka;MU = Mali; PSE = West Bank and Gaza; SDN = Sudan; SSD = South Sudan;SYR = Syrian Arab Republic; TCD = Chad; UKR = Ukraine; YEM = Republic of Yemen.
A.B. High-intensity conflicts are those in which there are at least 150conflict-related fatalities per million population in the year of onset and where conflict-related deaths did not exceed that threshold in the four years prior. Sample includes conflicts that began between 2006 and 2023 in 11 current FCS and 3 non-FCS EMDEs;see table A4.2
B. Bars show the total numberof fatalities recorded in the five years following the onset of conflict. Solid line shows the average numberof fatalities per million across high-intensity conflicts,summed by year, over the five years following onset;see table A4.2.
C. Medium-intensity conflicts are those in which there are at least 50 conflict-related fatalities per million population in the year of onset and where conflict did not exceed that threshold of intensity in the four years prior. Sample includes conflicts that began between 2006 and 2023 in 15current FCS and 6 non-FCS EMDEs;see table A4.2.
D. Bars show the numberof conflicts that surpass the medium or high-intensity threshold based on the number ofconflict-related fatalities per million population in the year of onset by duration (in years) until the conflict subsides. The medium-intensity (high-intensity) onset threshold sample includes 27 (21) conflicts in 24 (18) economies that began between 2006 and 2024.
cal methods: a counterfactual exercise, and an event analysis. For the counterfactual exercise, cumulative losses of GDP per capita associated with conflict are estimated by comparing the realized path of GDP per capita with the forecast made by the World Bank in the year prior to the outbreak of conflict (see annex 4.1). The results indicate that high-intensity conflicts have been associated with large and long-lasting losses in per
Conflicts are linked to large and long-lasting output losses. High-intensity conflicts lead to cumulative per capita GDP losses of about 20 percent five years after onset, with even greater losses in some FCS economies. Across a broader set of conflicts, cumulative losses amount to about 9 percent for the same period. Scarring-slower per capita GDP growth after conflict than before-is more common following high-intensity conflicts.
A Effect of conflict on per capita GDP after five years
C Cumulative loss of per capita GDP following the onset of recent highintensity conflicts
B Cumulative loss of per capita GDP following the onset of high-intensity conflicts
capita GDP, accumulating to almost 20 percent, at the median, five years after the onset of conflict compared to pre-conflict expectations (figure 4.10.B). This is similar to findings from the literature In several high-intensity conflicts since 2010, losses have been even larger, including in South Sudan, Sudan, the Syrian Arab Republic, Ukraine, and the Republic of Yemen (figure 4.10.C; annex 4.1). In most high-intensity conflicts, per capita GDP losses have been concentrated in the first two to three years of conflict.
D Cumulative loss of per capita GDP following the onset of conflict at least at the medium-intensity threshold
Conflicts that have commenced at least at the medium-intensity threshold have been associated with cumulative losses of per capita GDP of about 9 percent after five years, at the median, with the losses tending to be more evenly spread over the years following conflict onset compared to highintensity conflicts alone (figure 4.10.D). However, the counterfactual exercise may underestimate the cost of conflict, as in some cases, tensions build years before the number of fatalities surpasses a given conflict intensity threshold, damaging confidence, expectations, and macroeconomic performance before the threshold is met (Besley and Mueller 2012).
E Difference between per capita GDP growth following conflict onset and pre-conflict average
F. Difference between pre- and postconflict average per capita GDP growth
Sources : Dunne and Tian (2019); Fang et al. (2020); IMF (2019, 2024d); Novta and Pugacheva (2021); Uppsala Conflict Data Program; World Bank
Note: SDN = Sudan; SYR = Syrian Arab Republic; UKR = Ukraine; YEM = Republic of Yemen.
A. Per capita GDP losses are estimated using three methods: (1) local projections (2) pre-conflict forecasts versus outcomes and (3) synthetic control methods. Multiple estimates from a single source reflect different methods orcountry groupings. Conflict intensity is defined by fatalities per million ranging from 25-30 to over 150
B -F. Medium- (high-) intensity conflicts involve at least 50 (150) fatalities per million at onset, with no exceedance of that threshold in the four prioryears.
B.C Lines show the average cumulative gap between forecasted and actual per capita GDP following high-intensity conflict. Forecasts are from Glob al Economic Prospects one year before onset. Sample includes 14 conflicts in 14 EMDEs (3 not currently FCS) for the period 2006-23; see annex 4 1
D As in B-C,but for conflicts commencing at least at the medium-intensity threshold Sample includes 23 conflicts in 21 EMDEs (7 not currently FCS), for the period 2006-23;see annex 4 1
E. Bars show the real percapita GDP growth atterconflict onset compared to the three-year preconflict average. Includes up to 12 conflicts in 12 EMDEs for the period 2006-20, see annex 4 2
F. Bars showaverage percapita GDP growth in the three years post-conflict compared to the three years pre-conflict. Includes up to 12conflicts in 12 EMDEs for the period 2006-20; see annex 4.2.
The event analysis also compares GDP per capita growth before, during, and after conflicts that began at either the medium or high intensity thresholds (see annex 4.2). The event analysis shows that median per capita GDP growth drops by about 2.7 percentage points, relative to the three years preceding conflict onset, for conflicts that escalate to at least the medium-intensity threshold. A sharper decline-nearly 4.5 percentage points-is observed only in conflicts that commence at least at the high-intensity threshold (figure 4.10.E).
Growth dynamics following conflicts suggest that some economies have experienced recoveries in activity, likely driven in part by reconstruction, while others have suffered from scarring. For conflicts that commenced at least at the mediumintensity threshold, growth in the three years postconflict is, on average, characterized by a "catchup" phase, with per capita GDP growth exceeding the pre-conflict average by about 1.3 percentage points at the median (figure 4.10.F). This stronger
post-conflict growth rate suggests that some economies have been able to recover at least part of the per capita GDP losses incurred during conflict once peace is restored. This pattern is consistent with findings from other event studies of conflict, even ones employing different methodologies (Chen, Loayza, and Reynal-Querol 2008)
In contrast, economies that have experienced conflict at or above the high-intensity threshold appear to have suffered economic scarring postconflict, with median per capita GDP growth nearly a full percentage point below its pre-conflict rate in the three years following the end of hostilities. However, this approach may also understate the damage to economic activity from conflict, as growth may have slowed in the years prior to the onset of a conflict as hostilities gradually escalated.
The greater damage inflicted by higher-intensity conflicts partly reflects their more destructive impact on human and physical capital. For example, these conflicts are associated with harsher malnutrition, learning losses that may never be fully recovered, and greater physical injuries and damage to health (Akresh et al. 2012; Hoddinott et al. 2013; Makinde et al. 2023; Schady et al 2023). Greater displacement of refugees may also more severely, and permanently, weaken human capital and labor productivity (Novta and Pugacheva 2021; Schady et al. 2023).
Similarly, high-intensity conflict can cause extensive damage to key infrastructure, resulting in substantial and lasting losses of output and income (Chupilkin and Koczan 2022). The destruction of electricity generation capacity, sanitation networks, and transportation systems can delay the return of economic activity and trade, while reconstruction costs can be high. These challenges are compounded by insufficient financing for investment in FCS economies, as limited access to credit hinders the recovery of both human and physical capital, thereby restrammg growth (Barajas, Chami, and Fullenkamp 2021). Conflict also undermines the business environment and confidence, disrupting small and medium-sized enterprises and, in some cases, pushing them into informal or illicit activities (Ganson and Hoelscher 2020; Miklian and Hoelscher 2022). More broad-
ly, the economic damage from violent conflicts can be long-lasting, with per capita GDP remaining below estimated counter-factual paths for as long as a quarter-century after conflict ends (Chupilkin and Koczan 2022)
Building on the preceding analysis and extending the related literature, this section quantifies the economic costs of conflict using a heterogeneous panel vector autoregression (PVAR) model. Following Pedroni (2013), the methodology leverages cross-country variation in conflict exposure to estimate the macroeconomic costs associated with conflict-related fatalities (see annex 4.3). Specifically, it assesses the average impact of a 1 percent increase in conflict-related fatalities per million population-relative to a country's average rate over the sample period-on key economic indicators, including GDP per capita, and agricultural and industrial gross value added. 11 The sample includes 80 economies, of which 28 are FCS economies, using annual data from 1989 to 2024.
The results of the PVAR analysis point to substantial and persistent output losses associated with conflict. 12 For economies currently classified as FCS, the impact is estimated to be particularly pronounced; GDP per capita declines by about 2.5 percent in the first year, on average, and accumulates to 3.7 percent after five years (figure 4.1 LA). For other EMDEs, on average, a 1 percent increase in conflict-related fatalities per million population is estimated to reduce per capita GDP by about 1.8 percent in the first year, cumulating to about 3.3 percent after five years. This result of growing conflict-related output loss over time aligns with the expectation that heightened violence and widespread damage to human and physical capital result in prolonged economic scarring and weaker post-conflict recoveries. The estimates also broadly align with recent empirical
11 These averages are about 2 15 fatalities per million for FCS economies and 0 4 per million in other EMDEs.
12 Figures 4 11 and 4 12 show the variables most affected by increases in conflict-related fatalities, along with the institutional and structural factors most strongly associated with a lower impact of conflict. Notably, although not shown in these figures, the estimations include a broad set of macroeconomic indicators-such as headline GDP per capita and its expenditure and production components-which generally show negative responses to increases in conflict-related fatalities, particularly for the current list ofFCS.
Conflict-related per capita GDP losses have been significantly larger in FCS economies than in other EMDEs at all horizons through five years. Conflicts have had severe impacts on both industrial and agricultural sectors in FCS economies, with particularly large impacts on the industrial sector.
A Impact of a 1 percent increase in conflict-related fatalities per million on GDP per capita
B Impact of a 1 percent increase in conflict-related fatalities per million on GDP per capita after five years
PVARestimates NovtaandPugacheva (2021)estimates
ed with a 7 percent cumulative loss in industry value added and a 2 percent cumulative loss of agriculture value added after five years. For other EMDEs, the estimated effects are around 2 percent for industry value added and 1 percent for agriculture (figures 4.11.C and 4.11.D). The substantial and lasting output losses in these sectors have knock-on effects, particularly in FCS economies, including job losses, increased food insecurity, higher food price inflation, and worsened living conditions
C Impact of a 1 percent increase in conflict-related fatalities per million on industry value added
D Impact of a 1 percent increase in conflict-related fatalities per million on agriculture value added
Sources: Nov1a and Pugacheva (2021); Uppsala Conflict Data Program; World Bank Note: EMDEs = emerging market and developing economies; FCS = fragile and conflict-affected situations; PVAR = panel vectorautoregression The FCS group is based on the current World Bank classification.
A Estimates are obtained using a heterogeneous PVAR model. Whiskers represent the upper and lower bounds of the 95 percent confidence interval. The sample is based on an unbalanced panel of up to 80 economies, including 28 FCS 46 EMDEs excluding FCS and 6 advanced economies using annual data for the period 1989-2024; see annex 4.3.
B The Novta and Pugacheva (2021) estimates have been adjusted to reflect an approximate "1 percent increase in conflict-related fatalities per million" by scaling the original estimated costs of conflict on per capita GDP against an estimated numberof fatalities covered in their sample of conflicts "PVAR estimates" refer to estimates derived from the heterogeneous PVAR model five years following the initial shock, following Pedroni (2013) Annex 4.3 provides additional methodological and sample details.
C.D. Estimates are obtained using a heterogeneous PVAR model.Whiskers represent the upperand lower bounds of the 95 percent confidence interval.The sample is based on an unbalanced panel of 71 economies, including 25 FCS, 42 EMDEs excluding FCS,and 4 advanced economies, using annual data for the period 1989-2024;see annex 4 3
findings, although they are somewhat larger than those reported in similar studies employing alternative methodologies (figure 4.11.B).
A separate set of results-estimating the effects of a rise in conflict-related fatalities on sectoral value added-finds especially large impacts on the industrial sector. In FCS economies, the sectoral impacts of conflict are estimated to have been particularly severe: a 1 percent increase in conflictrelated fatalities per million population is associat-
Structural and institutional characteristics of countries, along with their vulnerability to shocks, can amplify or mitigate the economic impact of conflicts Stronger governance, superior human development, deeper financial markets, and greater readiness for climate-related disasters are associated with smaller adverse effects of conflict on GDP per capita All of these factors-along with larger shares of manufacturing in merchandise exports-are also associated with smaller adverse impacts of conflict on investment, a key driver of long-term growth, and on industry value added. In contrast, higher dependence on natural resources and greater vulnerability to climate-related disasters are associated with larger adverse impacts of conflict on GDP per capita, investment, and industry (figures 4 12.D-E). These results highlight the importance of policies that strengthen governance, human capital, financial markets, and climate resilience to reducing the burden of conflict, as well as promoting inclusive development. Notably, many of these same factors also help prevent the outbreak of violent conflict.
The post-pandemic growth recovery in FCS economies has been weak, and the outlook remains subdued amid persistent fragility, heightened global trade tensions, and policy uncertainty. Even if average annual GDP growth during 2025-30 were to recover to its 2010-19 pre-pandemic rate, GDP in 2030 would still be about 9 percent below the path implied by extrapolating prepandemic growth projections published in the
January 2020 Global Economic Prospects Meanwhile, under similar assumptions, output in other EMDEs would catch up to-and that in advanced economies would exceed-that same extrapolated trajectory (figure 4.13.A). Even in a more optimistic scenario, where growth during 2025-30 is assumed to recover to its 2000-09 average rate, FCS economies' output would still fall short of the pre-pandemic extrapolated path by about 2 percent. In a less favorable scenario, where growth in FCS economies during 2025-30 matches the 2021 -24 average rate, their output gap would widen to more than 20 percent by 2030 (figure 4.13.B).
FCS economies, particularly those classified as low -income or lower-middle-income, have significant potential to accelerate development. With appropriate policies and sustained international support, they can harness key structural growth drivers to improve their development outcomesparticularly favorable demographics, abundant natural resources (including in agriculture), and untapped tourism potential. However, these opportunities also carry risks if not managed effectively. Without inclusive job creation and investment in human capital and infrastructure, ongoing demographic trends could exacerbate fragility and conflict. In addition, natural resource wealth can heighten the risks of conflict and mismanagement in the absence of strong governance and institutions. These challenges underscore the urgent need for targeted and well-sequenced policy action.
FCS economies have an opportunity to capitalize on a demographic transition marked by their expanding working-age populations (Canning, Raja, and Yazbeck 2015). Because fertility rates in FCS economies are higher than those in other EMDEs, as well as advanced economies, and are expected to remain so, their working-age populations are expected to grow steadily over the next four to five decades (figure 4.13.C). By around 2040, the working-age share of the populations of FCS economies is projected to be 60 percent, exceeding the share in advanced economies; and by about 2055, it is expected to exceed that of other EMDEs (figures 4 13 D-E)
Stronger governance, better human development, deeper financial markets, and greater readiness for climate change have been associated with smaller conflict-related losses to GDP per capita, industry value added, and investment. Natural resource dependence and climate change vulnerability have been associated with larger economic losses.
A Governance
Sources : Notre Dame Global Adaptation Initiative (ND-GAIN); World Bank.
Note : Positive coefficients indicate a reduced impact of conflict, while negative coefficients suggest higherconflict-related costs. The coefficients in this figure are based on pairwise cross-sectional regressions, where heterogeneous economy-specific accumulated impulse response values at the 5th horizon- representing the response of GDP per capita, industry value added, and investment (that is,gross fixed capital formation) to a conflict shock- are regressed on the economy's structural and institutional characteristics. Annex 4.3 provides additional methodological and sample details. Sample includes up to 71 economies. Data are for the period 1989-2024 indicates statistical significance at the 1percent level,•• at the 5percent level,and• atthe 10percent level.
A.-F. Bars show regression coefficients of economy-specific conflict costs and the following variables: the World Bank'sWorldwide Governance Indicators,collapsed into a single index using principal components analysis (A);the UN Human Development Index (B);domestic credit to the private sector as a percent of GDP (C);climate change vulnerability and readiness measures (D);manufacturing exports' share in merchandise exports (E);and the share of natural resource rents in GDP (F).
Realizing the potential benefits of this demographic shift, however, will depend on the creation of sufficient productive jobs. Otherwise, the growth of the working-age population could lead to rising
Post-pandemic economic recoveries have been far weaker in FCS economies than in other EMDEs. In a medium-growth scenario, output in FCS economies in 2030 is projected to remain about 9 percent below the trajectory implied by pre-pandemic projections. Even in a high-growth scenario, these economies would struggle to reach the level of GDP implied by that trajectory by 2030 But alongside their major challenges, FCS economies possess immense growth potential, including expanding working-age populations, abundant natural resources , and untapped tourism sectors.
A. GDP in 2030: Gap between prepandemic projection and 2010-19 trend-based projection
B. GDP in FCS economies: Three growth scenarios
E Top 10 EMDEs by projected working-age population growth, 2025-30
Sources: UN World Population Prospects (database); WDI (database);World Bank Note : AEs = advanced economies;AGO = Angola; BDI = Burundi; GAF = Central African Republic; COD= Congo Dem Rep.; EMDEs = emerging market and developing economies; f= forecast; FCS = fragile and conflict-affected situations; MLI = Mali; MOZ = Mozambique;MWI = Malawi;NER = Niger; SOM= Federal Republic of Somalia; ZMB =Zambia.The FCS group is based on the current World Bank classification.
A. Bars show the difference between a growth scenario based on the 2010-19 average growth rate and 2030 projections from the January 2020 Global Economic Prospects. For 2023,the baseline is extended with a trend using 2022 projected growth. Sample includes 179economies, of which 37 are advanced economies and 142 are EMDEs including up to 39 FCS.
B. Lines show three growth scenarios through 2030, applying average growth rates from 2000-09 (high) 2010-19 (medium) and 2021-24 (low),based on a sample of up to 39 FCS
C Panel shows average total fertility rate by group Sample includes 36 advanced economies, 39 FCS and up to 115 EMDEs excluding FCS.
D Lines show working-age population as a share of the total population. Sample includes 38 advanced economies and 150 EMDEs, of which 36 are FCS
E. Bars show the 10 EMDEs with largest projected increases in working-age population,2025-30
F Bars show simple averages by economy group for 2017-21. Natural resources rents include oil gas coal mineral and forest rents. Sample includes up to 151 EMDEs including up to 37 are FCS
GLOBAL ECONOMIC PROSPECTS
unemployment and under-employment, exacerbating existing fragilities Therefore, policies are needed to promote the creation and growth of private sector enterprises and improve employability through better education, trammg, and healthcare. For example, policies that promote proper nutrition can boost labor force participation, while improved access to reproductive healthcare and family planning can enable women to engage in productive employment (Development Committee 2025; Fornino and Tiffin 2024; Hanmer et al. 2024). Complementary investments in infrastructure, such as for the provision of water, transport, and energy, are also important to expand access to jobs and economic opportunities (Development Committee 2025; Rohner 2024; World Bank 20256).
If productive employment grows in line with population growth, declining dependency ratios could also present an opportunity to boost domestic savings and improve fiscal balances. However, financial systems in FCS economies must be strengthened to effectively mobilize and allocate these savings toward productive investment that supports growth and job creation.
A significant share of FCS economies are commodity exporters with substantial natural resources, including agricultural land, mineral deposits, and oil and gas reserves Natural resource rents accounted for 13 percent of GDP in FCS economies during 2017-21, three times higher than the average for other EMDEs (figure 4 13.F) The growing adoption of renewable-energy technologies-such as solar panels, wind turbines, electric vehicles, and energy storage-is likely to continue increasing both demand and prices for the minerals essential to their production. Several FCS economies, including the Democratic Republic of Congo, Mozambique, and Zimbabwe, possess substantial mineral endowments and are well positioned to capitalize on these trends (Church and Crawford 2020; World Bank 2018a).
Resource wealth alone does not guarantee broadbased, inclusive per capita income growth; without strong institutions, it can exacerbate fragility. If
governance is weak and institutions defending the rule of law are ineffective-and if property rights are poorly defined, with unresolved disputes over resource ownership--instability can be exacerbated, and conflicts can be fueled. Mitigating these risks and harnessing natural resource wealth for sustainable development require transparent, accountable governance and policies that direct resource revenues toward equitable development (Nkoa, Song, and Bikoula 2024; Same 2009; World Bank 2025c) Investments in infrastructure and human capital, along with the promotion of local content are also necessary to enable technological improvements, including through technology transfer, to increase domestic value added and create jobs (El Saghir and Maur 2023).
With roughly one-third of FCS economies classified as agricultural exporters, and agriculture accounting for outsized shares of employment, this sector has substantial potential to contribute to faster economic growth-particularly through improvements in labor productivity that would facilitate the redeployment of workers to the industrial and services sectors. Thus, FCS economies' large-scale employment in agriculture potentially offers them a further demographic dividend, beyond that stemming from the growth of the working-age population. However, growth in agricultural output, as well as improvements in its productivity and resilience is also important, including for enhancing food security and promoting development in rural areas, where alternative employment opportunities are limited (Townsend et al. 2021).
Many FCS economies-including, for example, those in SSA and Pacific island economies such as Papua New Guinea and the Solomon Islandshave strong potential for enhanced productivity and economic returns in agriculture through welltargeted, tailored reforms (World Bank 2015a, 2017a, 20186). These may include improving access to fertilizers to boost yields; investing in transport infrastructure to enhance market access; making it easier to secure land tenure; expanding credit availability; and scaling up agricultural extension services (World Bank 2016a, 20186). The adoption of locally adapted technologiessuch as drought-resistant seeds, sustainable irrigation systems, and mobile-based advisory tools-is
also crucial to unlock broad-based growth (Kassem et al. 2020; Townsend et al. 2021; World Bank 20156).
In FCS economies, international tourism receipts, relative to GDP, are only half the level seen in other EMDEs, indicating the sector's untapped potential (Kenworthy, Mawejje, and Steinbach 2025). Many FCS economies possess cultural and natural assets with potential for rourism-driven growth of output and jobs, though realizing this will depend on improved security, institutional capacity, and infrastructure (Safi, Safi, and Mujeeb 2024). Fragile small island states, such as Papua New Guinea and the Solomon Islands, have strong potential in niche tourism markets, particularly in adventure and cultural tourism (IFC 2019a) Growth in tourism, a labor-intensive sector, can create jobs-many of them suitable for women and young people-foster entrepreneurship, and attract investment in infrastructure and services (World Bank 20176). In addition, sustainable tourism, when paired with effective governance and community engagement, can enhance social cohesion and aid post-conflict recovery (Novelli, Morgan, and Nibigira 2012). However, with insecurity and institutional fragility being major constraints in many FCS economies, tourism development must be approached pragmatically. Where conditions permit, targeted efforts to strengthen security, governance, and infrastructure can help unlock the sector's potential. For example, tourism formed an important part of Sri Lanka's recovery from its 1983-2009 civil war, with global promotion and targeted infrastructure investments helping to quadruple tourist arrivals by 2015, with positive spillovers elsewhere in the economy, including in conflict-affected areas (box 4.1).
Policies in FCS economies are typically shaped by complex political dynamics, involving both formal institutions and informal power structures-such as patronage networks and clientelism-set against enduring legacies of violence and external intervention (Brinkerhoff 2005; World Bank 2018a)
Strong recoveries following severe conflict-characterized by faster growth, falling poverty, and improvements in other development metrics-have typically been driven by targeted reforms and institution-building efforts. These recoveries were often anchored in political transitions, including peace agreements, which helped stabilize the security environment and strengthened state legitimacy. Sustained progress often involved the restoration of basic services, reforms to core institutions, and the reconstruction of infrastructure, backed by financial and technical support from the international community. Macroeconomic and structural reforms to improve public financial management, liberalize trade, and attract investment in strategic sectors such as natural resources and tourism were critical to boosting growth, productivity, and private sector confidence. Equally important were investments in human capital, including education, health, and social protection, to ensure that recovery benefits reached those affected by conflict and vulnerable populations. In several cases, international peace-keeping efforts reinforced peace and stability, both essential for sustaining progress, by supporting the implementation ofpeace agreements and helping to prevent a relapse into conflict. These experiences highlight that while conflict leaves deep and lasting scars, recovery is achievable when reforms are well sequenced, domestically led, tailored to local conditions, and backed by the international community.
The analysis in this chapter highlights the significant costs associated with conflict, and a tendency for conflict-affected economies to experience weak and incomplete recoveries once fighting ends. However, experiences vary considerably. Some economies have achieved strong, sustained post-conflict growth chat has supported broad improvements in living standards, including marked declines in poverty rates. This box examines several of these episodes in detail. It focuses on recoveries from severe conflict, defined by high levels of conflict-related fatalities, in the decade following the end of fighting in five diverse economies: Bosnia and Herzegovina, Cambodia, Nepal, Rwanda, and Sri Lanka.a The box addresses the following questions:
How do economies evolve after conflict?
What policies support favorable economic outcomes and helped to promote peace and stability?
Conflict and economic performance. Bosnia and Herzegovina experienced severe economic turmoil during the 1992-95 conflict, marked by extensive infrastructure destruction, loss of productive capacity, and an average of nearly 4,000 conflict-related deaths per million people annually (figure B4. l.A). By the end of the war, the country had lost about 60 percent of its
Note: This box was prepared by Samuel Hill, Jeecendra Khadan, Gitanjali Kumar, Mathilde Lebrand, Jiwon Lee, Edoardo Palombo, and Peter Selcuk.
a None of these economies are currencly classified as PCS by the World Bank.
housing, 50 percent of its schools, and 30 percent of its hospitals, while industrial output fell to just 5 percent of its pre-conflict level (Bisogno and Chong 2002).
Following the end of conflict and the signing of the 1995 Dayton Peace Agreement, the economy rebounded, with GDP per capita growth averaging four percentage points higher in the decade that followed than during the conflict period (figure B4. l.B). In the three years after the conflict, GDP per capita nearly doubled from $1,013 in 1995 to $1,973 in 1997. Continued strong growth pushed it higher to $3,217 in 2005. This rapid expansion helped the country regain upper-middle-income status in 2008, marking one of the strongest post-conflict recoveries globally.
The remarkable economic recovery led to significant poverty reduction and improved living standards. The poverty rate at the lower-middle-income threshold plummeted from 31 percent during the conflict period to 1.7 percent in 2000, and fell further to 0.8 percent in 2005 (figure B4. LC). Beyond poverty reduction, broader socioeconomic indicators also improved substantially. Life expectancy at birth increased by about 15 years-from 60 years during the conflict period to just over 75 years in 2005-while tertiary enrollment rates jumped from 15.8 percent in 2000 to 24.7 percent by 2005.
Policy drivers. Bosnia and Herzegovina's successful post-conflict recovery was driven by strategic policy interventions alongside substantial international support. Between 1996 and 1999, international donors provided approximately $6 billion (constant 2021 U.S. dollars) in reconstruction aid-equivalent to about 20 percent of GDP annually. These funds were primarily
Conflict-related fatalities
Per capita GDP growth
Poverty
Sources: Mahler, Yonzan, and Lakner (2022); Uppsala Conflict Data Program; World Bank Poverty and Inequality Platform (database); WDI (database); World Bank Note : A.B. Bars show annual averages for conflict and post-conflict periods.
A. Average annual numberof fatalities per million population for the conflict period (1992-95) and the post-conflict period (1996-2005).
B. Average annual growth rate of GDP percapita in 2015 constant U S. dollars during the conflict period (1992-95) and the post-conflict period (1996-2005).
C Line shows the average poverty rate during the conflict period (1992-95),based on a poverty threshold of $4.20 perday in 2021 purchasing power parity (PPP). Bars show the poverty rate in 2000 (5 years post-conflict) and 2005 (10 years post-conflict).
allocated to rebuilding critical infrastructure, restoring basic services, and strengthening institutional capacity, Technical assistance from global partners was key to facilitating effective and timely policy implementation (Collier and Hoeffler 20046; Dobbins et aL 2003) In addition, international peace-keeping, initially led by the North Atlantic Treacy Organization (NATO) and lacer by the European Union (EU), safeguarded economic recovery and prevented a relapse into conflict. As a result, conflict-related deaths fell to zero (figure B4.l.A).
Early macroeconomic and strucrural reforms were crucial to economic stabilization. In 1997, two years after the war, the country adopted a currency board, pegging the Bosnian convertible mark to the Deutsche mark-lacer transitioning to the euro-to curb inflation and restore monetary stability (Kovacevic 2003). Despite reconstruction pressures, credible monetary and fiscal policies kept inflation contained. Structural reforms in the banking sector, including the privatization of state-owned banks and entry of foreign banks, helped to restore financial intermediation and supported private sector growth (Tesche 2000). These measures were foundational to the recovery, driving investmentled growth-investment more than doubled, rising from 12 percent of GDP in 1995 to an average of 28 percent between 1998 and 2005. In addition, Bosnia and Herzegovina benefited from preferential trade agreements with the EU, while the prospect of eventual
EU accession anchored policy reforms and institutional development (Bartlett 2008; World Bank 2000). For example, exports to the euro area surged from 2.4 percent of GDP in 1995 to 14 percent in 2005. FOi increased significantly from 1.6 percent of GDP in 1998 to 5.6 percent in 2005.
Bosnia and Herzegovina's institutional capacity was weak in 1995 but improved markedly by 2001. Although the Dayton Agreement's governance structure was complex, it nonetheless laid the foundation for more effective economic management, and the gradual strengthening of state capacity supported the recovery process (Kathuria 2008). Targeted social protection programs also ensured chat economic growth translated into broader welfare gains, contributing to significant poverty reduction. Bosnia and Herzegovina's experience highlights the importance of a balanced post-conflict recovery strategy chat promotes both growth and equity (Del Castillo 2008).
Conflict and economic performance. Following years of conflict, Cambodia's transition to peace began in the late 1980s and was formalized by the 1991 Paris Peace Accords. Despite the establishment of a coalition government following the UN-sponsored elections in 1993, internal tensions persisted and ultimately erupted into violent conflict in 1997. Military challenges to
Sources: Mahler, Yonzan,and Lakner (2022); Uppsala Conflict Data Program; World Bank Poverty and Inequality Platform (database); WDI (database);World Bank
Note: A B. Bars show annual averages for conflict and post-conflict periods
A Average annual number of fatalities per million population for the conflict period (1989-98)and the post-conflict period (1999-2008)
B. Average annual growth rate of GDP per capita in 2015 constant U S dollars during the conflict period (1989-98) and the post-conflict period (1999-2008)
C. Line shows the average poverty rate during the conflict period (1989-98), based on a poverty threshold of$4 20 perday in 2021 purchasing power parity (PPP) Bars show the poverty rate in 2003 (5 years post-conflict) and 2008 (1o years post-conflict)
political rivals ended only after a new coalition government emerged from the 1998 national elections, bringing an end to three decades of war. 6 The prolonged conflict devastated infrastructure, human capital, and institutions, leaving Cambodia among the world's poorest countries. Between 1989 and 1998, GDP per capita fell by an average of 4.3 percent annually, reaching a historical low in 1997, with 80 percent of the population living in poverty, alongside a substantial loss of life (figure B4.2 A).
Cambodia's economy grew rapidly after the end of conflict in 1999 and as it recovered from the Asian financial crisis. In the decade that followed, GDP per capita increased by an average of 8.2 percent annually, doubling living standards (figure B4.2.B). The poverty rate fell sharply from 59 percent in 2003 to 43 percent in 2008-down from 82 percent during the conflict period-marking one of the fastest reductions among low-income countries (figure B4.2.C; Leo and Barmeier 2010). Stronger growth also drove improvements in
b After a coup d'erar in 1970, Cambodia underwent mulciple inrernal conflicts, the most devastating being the Khmer Rouge revolution from 1975 co 1979 This period was marked by the abolition of personal property, forced labor, mass displacement, imprisonmenr, and widespread executions Throughout the 1980s, Cambodia remained trapped in low-inrensity conflict and inrernational isolation. Estimates of the death coll from 1970 co 1987 vary widely, ranging from approximately 2.4 co 4.0 million people-nearly one-third ro one-half of Cambodia's population of7. l million in 1970 (Rummel 1994).
health and education-primacy education became nearly universal and child and maternal mortality rates declined significantly in the post-conflict period.
Policy drivers. Cambodia's strong economic performance following the end of conflict was driven by policies that promoted peace, macroeconomic stability, trade liberalization, and investment-fostering expansion in tourism, construction, and the garment industry. After the 1998 elections, the new government established key institutions, including the legislature and judiciary, and enacted laws to support growth and fiscal sustainability. The 1999 Financial Institutions Law enabled relicensing of banks, the adoption of new accounting standards, and strengthening of banking regulations. At the same time, prudent fiscal and monetary policies supported macroeconomic stability and strengthened the economy's resilience to shocks. For instance, improved customs and tax administration, supported by substantial foreign assistance, boosted fiscal revenues, while reduced reliance on bank financing helped maintain single-digit inflation (IMF 2007). In 2004, the government launched the "Rectangular Strategy" to accelerate reforms focused on agricultural development, private sector growth, human capital, and infrastructure. Sustained political stability also fueled tourism growth, enabling Cambodia to capitalize on its rich natural and cultural assets (Coe et al. 2009)
The end of conflict paved the way for Cambodia's integration into global markets, spurring industrial
Sources: Mahler, Yonzan, and Lakner (2022); Uppsala Conflict Data Program; World Bank Poverty and Inequality Platform (database); WDI (database); World Bank
Note : A.B. Bars show annual averages for conflict and post-conflict periods.
A. Average annual numberof fatalities per million population for the conflict period (1996-2006) and the post-conflict period (2007-2016).
B. Average annual growth rate of GDP percapita in 2015 constant U S. dollars during the conflict period (1996-2006) and the post-conflict period (2007-2016).
C Line shows the average rate during the conflict period (1996-2006),based on a poverty threshold of $4.20 perday in 2021 purchasing power parity (PPP) Bars show the poverty rate in 2011 (5 years post-conflict) and 2016 (10 years post-conflict).
expansion, particularly m the apparel industry. Cambodia joined the Association of Southeast Asian Nations (ASEAN) in 1999 and the World Trade Organization in 2004. From the mid-1990s, the country benefited from preferential trade access to the United States and EU markers under the Mulrifiber Agreement (MFA), reinforcing its commitment to trade -led growth. The MFA was phased out in 2005. This growth generated employment-especially for lowskilled workers-and accelerated poverty reduction. In addition, the transition to a market-oriented economy brought significant economic benefits, including increased foreign direct investment and official development assistance, which fueled activity in the construction sector (Hughes 2003; World Bank 2006, 2013). A pro-investment policy framework-offering equal treatment for domestic and foreign investors, tax incentives, and an open trade regime with low tariff rates-further attracted foreign investment (Guimbert 2010).
Conflict and economic performance. Nepal endured a violent conflict between 1996 and 2006, driven by the Maoist insurgency against the government. The conflict caused a substantial loss of life, widespread instability, and economic turmoil, leading to severe infrastructure damage and mass displacement. During this period, conflict-related deaths averaged 44 per million people
annually, while GDP per capita grew modestly at 2.4 percent, with over 75 percent of the population living in poverty (figure B4.3.A-C).
The Comprehensive Peace Accord in 2006 ended the conflict, paving the way for Nepal's social and economic recovery. GDP per capita growth averaged 1.2 percentage points higher in the decade after the conflict ended, compared to the conflict period. Poverty fell by about two-thirds within a decade. Nepal also made significant strides in human capital development, with rising life expectancy, declining infant morraliry, and increased school enrollment at all levels-primary, secondary, and tertiary-for both boys and girls.
Policy drivers. The end of the Maoist insurgency in 2006, followed by the abolition of the monarchy in 2008, ushered in a new political order chat fostered stability and supported sustained development gains. This transition was reinforced by key governance reforms, including Nepal's transition to a federal democratic republic, which culminated in the 2015 Constitution and decentralization of power to local and provincial governments.
Structural policies were instrumental in fostering economic resilience, strengthening governance, and promoting inclusive growth in Nepal's post-conflict period. Financial sector reforms enhanced stability and broadened financial inclusion, with the central bank
Sources: Mahler, Yonzan, and Lakner (2022); Uppsala Conflict Data Program; World Bank Poverty and Inequality Platform (database); WDI (database); World Bank.
Note : A.B Bars show annual averages for conflict and post-conflict periods.
A. Average annual numberof fatalities per million population for the conflict period (1990-2001) and the post-conflict period (2002-2011).
B. Average annual growth rate of GDP percapita in 2015 constant U S dollars during the conflict period (1990-2001) and the post-conflict period (2002-2011)
C Line shows the average poverty rate during the conflict period (1990-2001), based on a poverty threshold of$3 00 perday in 2021 purchasing power parity (PPP)
Bars show the poverty rate in 2006 (5 years post-conflict) and 2011 (10 years post-conflict)
strengthening governance of state-owned banks and encouraging consolidation among private institutions. The expansion of banks and microfinance firms significantly improved access to credit in both urban and rural areas.
Infrastructure investment played a critical role in supporting economic development, particularly in hydropower, which helped address power shortages and enabled exports of surplus electriciry. Additionally, improved road networks connected previously isolated districts, enhancing mobiliry and economic participation (IMF 2020). Social sector reforms, such as the school sector reform plan and the expansion of basic health services, improved access to education and healthcare, contributing to long-term social and economic progress (Ezemenari and Joshi 2019).
Building on the liberalization policies of the 1990s, Nepal pursued post-conflict reforms to attract foreign capital and expand exports. These included reducing trade barriers and improving trade facilitation, which allowed Nepal to leverage the growth of its neighbors and key trading partners, particularly India. Their economic ties were further strengthened by the South Asian Free Trade Area agreement, signed in 2004 and ratified by India in 2009.
Conflict and economic performance. Rwanda experienced repeated conflict from the 1990s to 2001.
During this period, conflict-related deaths were staggering, estimated to average over 10,000 per million people annually, underscoring the scale of human loss (figure B4.4.A). Rwanda's GDP per capita growth averaged less than 2 percent during the conflict period, making it one of the poorest countries in the world by 2001 (figure B4.4.B). As conflict subsided, an initially tentative recovery saw mostly positive annual per capita GDP growth in the first half of the 2000s, breaking a cycle of stop-start growth. In the decade following the end of the conflict, GDP per capita growth averaged 5.6 percent-substantially higher than in the pre-conflict period.
The period of sustained growth was associated with broad improvements in development outcomes. Ten years after the conflict ended, the poverry rate in Rwanda had declined by 15 percentage points to about 70 percent, compared to the conflict period (figure B4.4.C). Stronger growth also led to significant improvements in non-monetary measures of well-being, particularly in maternal and child health, as well as life expectancy. In parallel, primary and secondary school enrollment rose sharply for both boys and girls in the post-conflict period.
Policy drivers. Following over a decade of conflictrooted in a long history of escalating ethnic tension and violence-Rwanda restored peace through a comprehensive strategy combining political, judicial, and social reforms. Early efforts focused on re-establishing the
legitimacy of public institutions and rebuilding trust among the population. These initiatives included implementing a zero-tolerance policy for corruption, creating an efficient and transparent justice system, and reintegrating former combatants into society and government. The international community played a key role by providing financing, policy advice, and technical assistance to strengthen state capacity (Redifer et al. 2020)
Broader institutional reforms-such as decentralizing governance, introducing merit-based civil service recruitment, and modernizing public administrationfurther enhanced the public sector's effectiveness. Rwanda's reforms enabled the country to build a bureaucracy that not only maintained order but also delivered services more efficiently while keeping corruption low (Chemouni 2017). These gains endured well beyond the conflict; indeed, according to the 2024 Business Ready report by the World Bank, Rwanda ranked among the top 10 of 50 evaluated economies in public services and operational efficiency (World Bank 2024d).
Rwanda adopted a public investment strategy aimed at restructuring its economy toward high-return sectors, focusing on three primary areas. These included investment in health and education services to improve the country's human capital; expanding growthenhancing public infrastructure such as electricity, water, and roads; and promoting new enterprises in sectors with strong potential, notably agro-processing and tourism services (Redifer et al. 2020). This strategic focus was carefully tailored to reflect Rwanda's challenges, including its landlocked geography, persistently low labor productivity, and high input costs.
Various macroeconomic and structural reforms were implemented to improve efficiency in the banking sector, liberalize the capital account, and reduce trade barriers (Malunda and Musana 2012). These reforms raised productivity by steering the economy from an administered one to a market-based one (Coulibaly, Ezemenari, and Duffy 2008). Other policy measures sought to improve the business environment by eliminating excessive tax, legal, and regulatory burdens on firms. In parallel, well-targeted social protection programs and efforts to advance gender equality-such
as gender-focused budgeting, inclusive educational and financial opportunities, and empowering women-not only unlocked previously underused resources to drive economic growth but also sped up the reduction of poverty and income inequality (Redifer et al. 2020). The country's private sector has become one of the most competitive in the region, ranking above peers on various measures of doing business (Schwab 2019). Rwanda has also been successful in developing some services-led export sectors, particularly tourism, information and communication technology, and transport (Newfarmer, Page, and Tarp 2018).
Debt relief initiatives and development assistance supported by the international community also played a significant role in supporting Rwanda's growth acceleration (IMF 2005). Rwanda's participation in these initiatives helped to expand fiscal space, enabling increased investment in long-term growth enhancing sectors such as education and healthcare.
Conflict and economic performance. Sri Lanka endured a protracted civil war from 1983 to 2009 (figure B4.5.A). The conflict had a profound impact on poverty and economic growth. Although GDP per capita growth averaged 3.6 percent during the conflict period, over two-fifths of the population lived in poverty (figure B4.5.B). The destruction of infrastructure and embargoes enacted during the war led to significantly higher poverty rates in conflict-affected areas compared to the rest of the country (World Bank 2007).
After the civil war ended in 2009, Sri Lanka's economy rebounded with GDP per capita growth averaging 5 percent a year in the post-conflict period. Post-conflict growth was accompanied by broad-based improvements in development outcomes with poverty falling sharply to about 16 percent five years after the conflict, and to around 12 percent a decade later (figure B4.5.C). Other key markers of well-being and health also showed significant improvements, with infant mortality declining from 13 to 8 deaths per 1,000 live births and undernutrition declining from 30 to 25 percent between 2002 and 2012 (Newhouse, Suarez-Becerra, and Doan 2016). Sri Lanka demonstrated educational resilience during the conflict, maintaining healthy school enrollment rates, which helped cultivate one of
Sources: Mahler Yonzan, and Lakner (2022); Uppsala Conflict Data Program; World Bank Poverty and Inequality Platform (database); WDI (database); World Bank
Note : Although Sri Lanka's civil conflict is widely recognized to have begun in 1983,figure B4 1 5A uses 1989-2009 as the reference period for conflict-related fatalities due to data limitations. A B. Bars show annual averages for conflict and post-conflict periods
A. Average annual numberof fatalities per million population for the conflict period (1989-2009) and the post-conflict period (2010-19)
B. Average annual growth rate of GDP percapita in 2015 constant U S dollars during the conflict period (1983-2009) and the post-conflict period (2010-19)
C Line shows the average poverty rate during the conflict period (1983-2009),based on poverty threshold of$4 20 perday in 2021 purchasing power parity (PPP) Bars show the poverty rate in 2014 (5 years post-conflict) and 2019 (10 years post-conflict).
South Asia's most educated workforces-an asset that contributed significantly to its post-conflict recovery (Dundar et al. 2014).
Policy drivers. Sri Lanka's post-conflict recovery focused on infrastructure investment, tourism, and poverry reduction-with support from the international communiry (IMF 2009). Early reconstruction efforts focused on infrastructure development in the conflictaffected Northern and Eastern provinces, with the aim of promoting peace and supporting economic recovery. This included major investments in roads, schools, hospitals, highways, railways, bridges, power plants, and ports to reconnect these regions with the rest of the country. Government borrowing increased substantially as a result, which was facilitated by low interest rates globally in the aftermath of the global financial crisis of 2008-09.
These investments not only improved access to basic services and economic opportunities, but also helped stimulate local job creation, facilitated trade and mobiliry, and laid the groundwork for inclusive development In parallel, poverry reduction was aided
by increased labor earnings, across both agricultural and non-agricultural sectors, including construction, commerce, transport, and communications. These efforts were backed by the international communiry through macroeconomic stabilization, structural reform, and poverry reduction programs supported by the IMF and the World Bank (World Bank 20166). However, high debt burdens, insufficient institutional reforms, political instabiliry, and loose fiscal and monetary policies led to an economic crisis in 2022 when Sri Lanka defaulted on its foreign debt
Tourism was part of the recovery efforts, with Sri Lanka introducing the Tourism Development Strategy in 2011. This included aggressive marketing campaigns to promote the country as a safe destination, alongside investments in hospitaliry infrastructure to support the sector's growth As a result, tourist arrivals quadrupled between 2009 and 2015. Infrastructure investments in conflict-affected provinces were also aimed at stimulating tourism, and were complemented by targeted subsidies to support fisheries and restore livelihoods in these regions
Economic and political power typically rests with entrenched elites, and while external stakeholders-such as donors, lenders, and peacekeeping missions-may influence reform agendas, including through technical assistance and conditional concessional resources, these elites may resist reforms that threaten their interests, strengthen governance, and increase incentives to support inclusive development (IDS 2010; World Bank 2018a). Deep societal cleavages-typically along ethnic, religious, or regional lines-as well as contested sovereignty, and persistent insecurity further hinder effective reform and increase the risks of elite capture and reform reversals (World Bank 2011, 20156).
Despite these constraints, transmon momentsoften triggered by natural disasters, economic shocks, leadership changes, or shifting public sentiment-can disrupt entrenched dynamics and create opportunities for reform. When seized effectively by policy makers, they can provide scope to address grievances, recalibrate institutions, and rally support for reforms that can promote inclusive growth and political stability (LSEOxford Commission on State Fragility, Growth and Development 2018; United Nations and World Bank 2018). It is notable that reforms that build state legitimacy and stability, and that promote growth and development, have often emerged from negotiated political settlements balancing elite interests with broader societal demands Qohn and Putzel 2009; OECD 2011).
Reforms in fragile contexts are inevitably shaped by deep-rooted structural factors-such as colonial legacies and deeply embedded social divisionsand by more proximate drivers, including political institutions, social norms, and elite incentives (Acemoglu, Johnson, and Robinson 2001). The former are difficult to address directly, but the latter are more amenable to policy intervention. However, progress even in these areas is usually constrained by path dependencies and institutional inertia (Acemoglu 2003; Acemoglu, Johnson, and Robinson 2001). Reforms to strengthen institutions and governance must take these constraints into account and may require an iterative process that allows for learning from setbacks (Andrews, Pritchett, and Woolcock 2017; Booth
and Unsworth 2014). This calls for contextsensitive approaches that build on local capabilities, align with political realities, and deliver early, visible gains. Effective reform sequencing in such settings also requires agile leadership, guided by fragility- and conflict-sensitivity analyses that reflect the complexities on the ground.
Taking into account these challenges, it is clear that mitigating the risks of violence and instability in FCS economies requires targeted efforts and careful prioritization to address the causes, particularly the proximate drivers of fragility and conflict. Such efforts include tailored interventions aimed at preventing conflict, reducing exclusion and inequality, and building long-term resilience.
During periods of active conflict, efforts to safeguard critical infrastructure and institutions, alongside the provision of humanitarian relief, can help contain damage and future reconstruction costs and enable faster recoveries. To support durable transitions out of conflict, policies must be designed on the basis of a planned pathway toward growth and institution-building. Stability can be sustained through reintegration programs for former combatants, comprehensive institutional reforms, and investment in infrastructure and essential services. International support through concessional financing, debt relief, technical assistance, and policy advice is essential for the success of such efforts.
Preventing conflicts and addressing fragility are the foremost development priorities for FCS economies. Although the causes of conflicts are context-specific, they often include experiences or perceptions of exclusion and injustice (Abbs 2021; Rosen 2023; United Nations and World Bank 2018). In fragile settings, weak governance and economic inequality can fuel group-based grievances, increasing the likelihood of violence, conflict, and civil war (Abdel-Latif and El-Gama! 2024; Collier and Hoeffler 2004a; 0stby 2008). Even the expectation of conflict can worsen fragility by fueling uncertainty, depressing asset values, and deterring investment (Chami, Espinoza, and Montiel 2021; Garcia-Uribe, Mueller, and Sanz 2024; Tapsoba 2023).
Effective prevention of conflict demands policies to tackle its root causes. These policies should promote strong economic growth, financial stability, inclusive development, and job creation, which are critical for addressing the economic drivers of fragility and reducing the risk of violence (Collier and Hoeffler 2004a; United Nations and World Bank 2018c). Proactive implementation of such policies can help prevent conflict and reduce the likelihood of escalation when it occurs. These efforts should be reinforced by initiatives to reduce economic and political inequalities, promote peaceful conflict resolution, and rebuild public trust in government (Abbs 2021; Basedau and Roy 2020; Lessmann and Steinkraus 2019). Additionally, institutional reforms that enhance accountability and transparency, ensure fair access to resources-such as land, water, and extractives-and expand basic infrastructure are critical for building durable peace and strengthening state legitimacy (Rosen 2023; World Bank 2020a). Moreover, strong domestic leadership, reinforced by coordinated international support, is crucial for helping countries move from conflict and fragility to long-term stability, domestic peace, and resilience (Gowan and Ungar 2023; United Nations and World Bank 2018).
Investing in conflict prevention can yield high returns. PCS economies need robust systems to monitor, identify, and reduce fragility and conflict risks while enhancing resilience to a wide range of shocks through risk-informed policies and frameworks (IMF 2022; United Nations and World Bank 2018; World Bank 2020c). Recent research shows that integrating prevention strategies-such as strengthening state capacity, reducing exclusion, and improving tax compliance-into macroeconomic policies can deliver substantial returns in countries recently affected by violence (Mueller et al. 2024; World Bank 2020c). For instance, counter-cyclical policies that cushion downturns in fragile states can lower conflict risks, while job programs-including reintegration opportunities for former combatants-can help to reduce violence and instability (Akanbi et al. 2021; Blattman and Annan 2016; Fetzer 2020). Moreover, early conflict-warning systems-particularly those that detect real-time shifts in risks-can enable timely interventions, which are far more cost-effective
than responding after violence erupts (Mueller and Rauh 2022).
Humanitarian relief and security
Recent conflicts-including those in Europe, the Middle East, and Sub-Saharan Africa-have caused extensive civilian fatalities and injuries (United Nations Security Council 2024). In such situations, strengthening security and stability, including through effective peace-keeping operations, can help protect civilians and aid workers, and can facilitate safe, sustained access to humanitarian aid (Fjelde, Hultman, and Nilsson 2019; Levin 2023; Scott 2022). At the same time, neutral actors must take proactive steps to ensure that all parties to a conflict comply with international humanitarian and human rights law, particularly regarding civilian protection (United Nations Security Council 2024). This includes establishing humanitarian corridors, protected zones, and nofly zones to facilitate the movement of civilians and the delivery of humanitarian assistance. In addition, establishing humanitarian notification arrangements to safeguard civilians and aid workers, facilitate the evacuation of civilians from dangerous areas, and implementing ceasefires or temporary suspensions of hostilities can save lives and reduce injuries (Gillard 2024).
Investing in effective disarmament, demobilization, and reintegration (DDR) programs can support the disarmament of combatants, the dismantling of military structures, and social and economic reintegration of former fighters into civilian life-especially in post-conflict settings (Ayissi 2021; Banholzer 2014; World Bank 2009). Well-designed DDR programs also help rebuild trust between communities and former combatants, strengthen local stability, and contribute to broader peace-building goals after conflict ends (United Nations 2010; World Bank 2020c). These efforts can be complemented by inclusive dialogue that brings together governments, civil society, and other stakeholders to resolve disputes, ease tensions, and foster social cohesion-even in active conflict settings (Marley 2020).
Conflicts can damage infrastructure, disrupt essential services, and lead to acute food insecurity and mass displacement (HLPE-FSN 2024; World
Bank 2017c). In such circumstances, fragile government institutions can be overwhelmed both in conflict-affected countries and their neighbors. Sudan, for example, now hosts about 11 million displaced persons-more than any other country-nearly half of whom are children (HLPEFSN 2024; IOM 2024). The destruction of health systems can be particularly alarming. In Gaza, more than 80 percent of health facilities, including three-quarters of hospitals, were damaged or destroyed in the early months of conflict with Israel that began in late 2023, leaving the remaining facilities struggling with severe shortages of electricity, fuel, and medicine (World Bank, European Union, and United Nations 2024; United Nations Security Council 2024). Such conditions underscore the urgent need for international and national actors to prioritize rapid emergency reliefincluding food, medical care, shelter, and safe drinking water-to meet immediate humanitarian needs, especially for vulnerable populations, and prevent escalation (UNOCHA 2024).
Beyond immediate relief, meeting the needs of forcibly displaced populations requires pairing humanitarian assistance with sustained development support backed by strong coordination between humanitarian and development actors (World Bank 2024e). Without sufficient and wellcoordinated support, initial displacements can evolve into protracted humanitarian crises, disproportionately affecting women and children (Bendavid et al. 2021; Ghobarah, Huth, and Russett 2003). Inclusive policies and sustained investment in durable solutions-such as job creation and training, local integration, and safe and voluntary return-can help mitigate the challenges faced by displaced populations and promote social cohesion (Harild, Christensen, and Zetter 2015; World Bank 20226). Where feasible, national institutions can play a central role in delivering humanitarian assistance directly or through contracting arrangements, thereby reinforcing domestic capacity and aligning emergency responses with long-term development objectives. These measures must be carefully tailored to the specific context of each country and fully embedded within broader conflict response and recovery strategies.
Efforts to safeguard legitimate institutions during conflict-such as service-oriented government ministries, central banks, small and medium enterprises, and social investment funds-are both a humanitarian imperative and a strategic investment in post-conflict recovery (World Bank 2020c). Functioning institutions, even in the midst of conflict, can help preserve social cohesion, reduce grievances, and mitigate the risk of conflict recurrence (World Bank 2011). Equally important is the protection of human capital, particularly for vulnerable populations, through sustained access to healthcare, education, and social protection systems (Rutkowski and Bousquet 2019; Vandeninden, Grun, and Semlali 2019). Disruptions to education and healthcare, including in conflict settings, can have severe longterm consequences for inclusive economic recovery and human development (Garry and Checchi 2020; George, Adelaja, and Weatherspoon 2020; Vesco et al. 2025) Additionally, preserving the operations of the justice system and legal institutions, including the adoption of transitional justice measures can help resolve disputes peacefully, foster trust in government, and lay foundations for post-conflict reconciliation (Loyle and Appel 2017; N aumkina, Kokoriev, and Yatveska 2024). Finally, protecting critical infrastructureincluding schools, hospitals, transportation networks, and basic utilities-during conflict can reduce reconstruction costs, support faster recovery, and restore livelihoods.
"Fragility" refers to a state of severely limited governance and institutional capacity, in which a government's ability to operate effectively, sustain peace, and promote economic and social progress is critically undermined (World Bank 2024a). Addressing fragility necessitates comprehensive, context-specific reforms that take into account the underlying sources of fragility, the domestic political system, and sociocultural constraints. Strategic sequencing of reforms is often crucial for success and should be informed by economic opportunities, institutional capacity, and political commitment. An inclusive, participatory approach, such as structured public-private dialogue, can further
FCS economies face significant governance challenges that hinder political and
and the establishment of a predictable environment for investment and growth Compared to other EMDEs, these economies have lower constraints on government power, weaker sanctions for official misconduct, less accessible justice systems, a lower likelihood of peaceful transition of power, and less civic participation.
enhance the legitimacy, feasibility, and durability of reform efforts.
FCS governments face significant accountability challenges because of weak legislative and judicial oversight, poor law enforcement, and limited civil society engagement compared to levels seen in other EMDEs (figure 4.14.A; Pompe and Turkewitz 2022; World Bank 2020d). Strengthening governance systems to build public trust is central to addressing these shortcomings (World Bank 2017d). Targeted reforms should focus on bolstering legislative and judicial institutions, which can lay the foundation for establishing effective checks on executive power, a necessary step in combating corruption (Stapenhurst, Johnston, and Pelizzo 2006). These efforts should be complemented by reinforcing oversight bodies, enforcing accountability measures, and empowering civil society to play a more active role in governance (figures 4.14.B-D; World Bank 2020d). Strengthening these mechanisms can reduce corruption, enhance public trust in institutions, and help put countries on a path toward more inclusive and sustained growth (Newiak, Segura-Ubiergo, and Wane 2022). For example, after conflict ended in Rwanda, the country prioritized restoring institutional legitimacy and public trust through anticorruption efforts and broader governance measures. These contributed to more effective institutions, a stronger rule of law, and renewed confidence among the public and investors (box 4.11).
Sources : World Justice Project;World Bank.
Note: AEs = advanced economies; EMDEs = emerging market and developing economies;FCS = fragile and conflict-affected situations; NGO = nongovernmental organization The FCS group is based on the current World Bank classification Panels show simple averages of each index for 2024 Sample includes 33 advanced economies,91 EMDEs excluding FCS, and 18 FCS.
A The legislative index measures how effectively legislative bodies oversee government actions The judiciary index assesses judicial independence and its ability to check government power.
B The independent auditing index measures whether auditors and ombudsman agencies are independent and can oversee the government effectively The NGO checks index assesses whether the media, civil society, political parties,and individuals can freely report on government actions without fear of retaliation.
C. The sanctions for official misconduct index measures whetherofficials in the executive, legislature, judiciary, and the police are investigated and punished for misconduct.
D. The civic participation index measures the effectiveness of civic participation mechanisms, including freedoms of expression, assembly, association, and the right to petition the government. The complaint mechanisms index measures whether people can file complaints to the government about public services or officials and whether these are addressed.
E The civil justice system index measures access to courts, including affordability, legal support, and freedom from physical and linguistic barriers The criminal justice system index measures effectiveness and integrity of lawenforcementand prosecution.
F The peaceful transition of power index measures whether government officials are elected or appointed in accordance with constitutional rules.
Strengtheningjustice and electoral systems
Justice systems in FCS economies are generally weaker than in other EMDEs, with more limited access and affordability, lower judicial independence, and weaker law enforcement (figure 4.14.E; Bosio and Palacio 2023). Building a more impartial, fair, and independent justice system could strengthen state legitimacy, facilitate conflict resolution, better protect human and property rights, and foster a more predictable business environment-all essential for recovery and for long-term stability (World Bank 2020d). Making executive and legislative processes more inclusive
through independent election mechanisms and active civil society participation can also help facilitate peaceful political transitions (figure 4.14.F). This is especially critical in FCS economies, where political instability has been an important source of fragility and violence, undermmmg investment and economic growth (Polachek and Sevastianova 2011).
FCS economies spend less on education, healthcare, and social protection than other EMDEs, despite their more severe human development challenges. In particular, they have far fewer healthcare professionals relative to their populations (figures 4.15.A-D; Longhurst and Slater 2022; UNICEF 2024). Successful transition from fragility demands increasing investment in human capital, including in quality education, healthcare, and skills development, as well as social protection programs for vulnerable populations (Burde et al. 2023; Forichon 2020; Ovadiya 2015). Gender inequality also remains a pressing issue in FCS economies, with women and girls in many cases facing limited access to education, jobs, and political participation; this is apart from the higher risk of violence faced by women during conflicts (World Bank 20236, 2024f, 2024g). Investments in human capital, particularly in social protection programs, have to be tailored to each country's development needs and demographic challenges (Bruck, Cuesta, De Hoop, et al. 2019). These investments are key not only to supporting economic recovery and building resilience to shocks, but also to reducing inequalities and mitigating risks of relapsing into conflict (UNDP 2008).
Conflicts often cause significant damage to critical infrastructure, severely disrupting the supply of essential public services. However, fragility alone, marked by weak governance and corruption, tends to erode the state's ability to deliver basic services. A smaller share of FCS populations has access to basic utilities-such as safe drinking water, electricity, and sanitation-than in other EMDEs, which increases their vulnerability to disease and reduces productivity and quality of life. Expanded
access to basic services, including those provided in schools, has been linked to reduced hygienerelated diseases and increased school attendance, particularly among girls (figure 4.15.E). 13 Similarly, expanding access to electricity, telecommunications, and transport networks can spur economic growth and reduce violence by attracting investment, fostering small business development, and creating opportunities for youth entrepreneurship-thereby helping to integrate the large inactive youth population in FCS economies into employment (figure 4.15.F; Lebrand et al. 2025; World Bank 2022c). For instance, in Nepal, postconflict investments in hydropower and road infrastructure helped alleviate power shortages, expand electricity access, and improve connectivity, fostering broader economic participation (box 4.1).
Supporting business resilience and growth can help break cycles of fragility, conflict, and poverty (IFC 2019a). Private enterprises are often a key source of resilience in FCS economies, given that government capacity tends to be limited. They may provide essential goods and services-such as food, education, healthcare, financial services, and infrastructure-while also sustaining economic activity and tax revenue generation (Assaf et al. 2021).
Reforms that improve security, political and financial stability, governance, and the rule of law can foster a conducive business climate-----critical for attracting private investment and unlocking broader development opportunities (figure 4.16.A; Ghossein and Rana 2022). Policies that enhance access to finance, electricity, property rights, and digital connectivity can also promote sustained and inclusive private sector growth (figures 4.16.B-E; Calice 2023). Nepal's post-conflict experience shows how structural reforms, particularly in the financial sector, can strengthen economic resilience, with expanded microfinance and improved bank governance helping to boost access to credit and support private enterprise in both
13 See for example, Dreibelbis et al. (20 I 3), Morgan et al. (20 I 7), Nauges and Strand (2013), and Rohner (2024)
Strengthening human capital in FCS economies demands greater investment in quality education, skills development, and healthcare alongside tailored social protection programs to support vulnerable populations. Expanding access to essential services is crucial for improving human development and expanding economic opportunities in FCS economies, including for their large inactive youth populations
urban and rural areas (box 4.1). Artificial intelligence (AI) offers significant productivity gains. FCS economies could harness its potential by investing in foundational reforms to strengthen digital infrastructure and human capital (figure 4.16.F; Bakker et al. 2024; Cazzaniga et al. 2024).
The private sector can support post-conflict reconstruction by investing in infrastructure, including roads, electricity, telecommunications, and sanitation. Public-private partnerships can accelerate recovery by leveraging private sector expertise and financing. Businesses can also take a leading role in increasing trust and social cohesion-key ingredients for long-term peace-by adopting inclusive employment practices and promoting good governance. In several economies, including Nepal, Rwanda, and Sri Lanka, the private sector has played a stabilizing role by engaging in mediation, conflict prevention, and peace-building efforts (IFC 2019a; Porter 2011)
Note : AEs = advanced economies; EMDEs = emerging market and developing economies; FCS = fragile and conflict-affected situations The FCS group is based on the current World Bank classification
A. Panel shows simple averages of government expenditure on primary and secondary education per student as a percent of GDP percapita for the latest available year. Sample includes 36 advanced economies 98 EMDEs excluding FCS and 26 FCS.
B. Bars show simple averages of domestic general government health expenditure as percentage of GDP per capita for FCS and EMDEs excluding FCS for 2022 The line shows the simple averages of AEs. Sample includes 36 advanced economies and 115 EMDEs excluding FCS, and 37 FCS.
C Bars show median of annual social assistance spending as a percentage of GDP for the latest available yearbetween 2015-21. Sample includes 83 EMDEs excluding FCS and 25 FCS.
D Bars show group medians of countries' average numberof nurses and physicians (per 1000 people) for the period 2018-22. Sample includes 153 EMDEs excluding FCS and 38 FCS.
E. Bars show group medians based on countries' average share of the population using basic drinking water and sanitation services for the period 2018-22. Sample includes 146 EMDEs, of which 37 are FCS
F Bars show the average share of individuals ages 15-24 who are not in education employment or training in each group of economies for the period 2019-23 in a sample of 108 EMDEs excluding FCS and 34 FCS
Global and regional integration through multilateral trade systems and agreements can boost exports, attract investment, create jobs, and promote peace, thereby supporting recovery and political stability in FCS economies (WTO 2025). Participation in multilateral organizations, such as the World Trade Organization (WTO), can reinforce these gains by strengthening institutions, reducing corruption, improving the business climate, and fostering regional cooperation (WTO 2025) For instance, following the end of conflict, Cambodia's integration into ASEAN in 1999 and the WTO in 2004 spurred investment in manufacturing and garment exports, contributing to strong growth, job creation, and poverty reduction (box 4.1) Trade agreements can also support credible reform commitments and strengthen governance, as demonstrated by Bosnia and Herzegovina's preferential trade arrangements with the European Union since 2015 (box 4 1)
However, concerns about global trade fragmentation, including recent increases in tariffs, pose growing risks for FCS economies. They can reduce their access to global markets, disrupt supply chains, heighten uncertainty (thereby deterring much needed investment), and weaken reform
incentives tied to trade integration. These effects are particularly threatening for FCS economies that rely on a narrow range of exports, generally primary commodities. Protectionist policies and associated fragmentation can also raise import costs in FCS economies, exacerbating inflation, poverty, and social unrest. These developments underscore the importance of safeguarding an open, rules-based trading system, not only to preserve FCS economies' access to global markets and sustain their recoveries, but also to strengthen reform momentum and long-term development.
lncreasingfinancial inclusion
Financial systems in FCS economies remain largely underdeveloped, with significant gaps in access, depth, and efficiency compared to other EMDEs (Barajas, Chami, and Fullenkamp 2021). Strengthening financial sector development, including through digital financial inclusion, can help address both the drivers and the effects of fragility by promoting stronger and more inclusive growth (IMF 2022). Realizing this potential will likely require investment in enabling infrastructure, including reliable electricity, broadband internet, and access to digital devices-areas where FCS economies ofren lag behind (Mahmood 2024; Pazarbasioglu et al. 2020). Expanding tailored financial services and fintech solutions can further improve economic resilience and create opportunities for vulnerable populations.
Remittances, which reached record levels across FCS economies after the pandemic, are a key source of household income and financial resilience (Ratha et al. 2022). Their benefits can be amplified by policies that reduce transaction costs and enhance the resilience of remittance flows, such as measures that make remittance pricing more transparent, improve financial literacy, and advance digital infrastructure (Kpodar and Imam 2024).
Macroeconomic stability in FCS economies is commonly undermined by a wide range of shocks-including conflict, natural disasters, commodity price swings, and population displacement. It is also weakened by poor policy manage-
Businesses in FCS economies commonly face challenges such as instability, limited access to finance, basic infrastructure, corruption, and weak property rights. Strengthening private sector resilience and growth requires policies to improve the business climate and attract investment. These economies must also address gaps in digital development, which hinder firms and workers from harnessing productivity gains from new technology, including Al.
Access to electricity and internet, 2018-22
Sources: Cazzaniga et al. 2024; World Bank Enterprise Surveys (database); WDI (database); World Bank.
Note: AEs = advanced economies; EMDEs = emerging market and developing economies; FCS = fragile and conflict-affected situations. The FCS group is based on the current World Bank classification.
A. Bars show the percentage of firms in FCS that identify each aspect of the businessenvironment as the biggest obstacle to their operations. Sample includes 30 FCS.
B. Panel showsthe percent of firms with a bank loan or line of credit Sample includes 16 advanced economies, 100 EMDEs excluding FCS,and 30 FCS.
C. Panel shows the percent of respondents who report having an account (by themselves or together with someone else) at a bank oranother type of financial institution based on the latest data available. Sample includes 37 advanced economies 92 EMDEs excluding FCS and 26 FCS.
D. Bars show group medians ofthe countries' average share of the population with access to electricity and internet for the period 2018-22 Sample includes 144 EMDEs, of which 37 are FCS.
E. Bars show the average of the World Banks Country Policy and Institutional Assessment (CPIA) property rights and rule-based governance rating for the latestavailable year. Sample includes 44 EMDEs excluding FCS and 32 FCS.
F. Bars show the average score for the four components of Al Preparedness Index for each country group,reflecting factors relevant forAl adoption Sample includes 37 advanced economies,31 FCS, and 104 EMDEsexcluding FCS for 2023.
Strengthening fiscal capacity in FCS economies requires improved tax and expenditure policies, the establishment of clear frameworks for fiscal and debt management, and effective donor coordination. As institutional capacity improves, these economies need to adopt debt management frameworks and strengthen budget processes to enhance transparency. Where feasible, the introduction of fiscal rules , independent fiscal councils, and sovereign wealth funds could also be beneficial Macroeconomic stability would benefit from greater central bank independence, which is currently more limited in FCS economies than elsewhere.
ment, such as procyclical fiscal policies, inadequate public expenditure controls, weak government revenue collection, limited access to financing, and politically driven monetary policy (Boussard et al. 2024; IDMC 2022; Jaramillo et al. 2023). Reforms of the conduct of fiscal, monetary, and financial sector policies are generally needed both to improve the management of shocks and to help establish stable, sustainable financial conditions that support medium- to long-term growth.
Fiscal transparency, 2023
Central bank independence, 2019-23
Sources : Davoodi et al. (2022);Garriga (2025);Global SWF; Herrera et al. (forthcoming); International Budget Partnership (database); McNabb, Danquah,and Tagem (2021); World Bank. Note : AEs = advanced economies; EMDEs = emerging market and developing economies; FCS = fragile and conflict-affected situations;SWF= Sovereign Wealth Funds The FCS group is based on the current World Bank classification
A. Tax effort is the gap between actual and potential tax revenue based on the true random effects method reported in McNabb, Danquah,and Tagem (2021) Sample includes 35 advanced economies, 101 EMDEs excluding FCS,and 25 FCS
B. Bars show average efficiency score for the period 2010-20 using up to fivedifferent methods for investment and education (13 FCS),and health (31 FCS) from Herrera et al. (forthcoming) Sample includes up to 115 EMDEs excluding FCS and up to 37 advanced economies
C. Bars show the share of FCS classified as "full," "limited," and "not available" based on the publicly available Debt Management Strategy and Annual Borrowing Plan indicators. Sample includes up to 33 FCS.
D Indices are unweighted averages of responses to questions in the 2023 Open Budget Survey. Sample includes 28 FCS 79 EMDEs excluding FCS,and 18advanced economies.
E Share of economies with fiscal rules,fiscal council and Sovereign Wealth Funds as of 2021 Sample includes 38 advanced economies, 115 EMDEs excluding FCS and 39 FCS.
F. Panel shows the median scores over the period of 2019-23 in each group of economies. Sample includes 38 advanced economies, 115 EMDEs excluding FCS,and 39 FCS.
Strengthening fiscal policy in FCS economies typically requires establishing a clearer legal framework for fiscal management and a central fiscal authority with responsibility for conducting sound tax and expenditure policies, implementing related reforms, and coordinating effectively with donors (IMF 2017). Sound fiscal policy is particularly important for FCS economies because some shocks-for example, negative commodity terms of trade and extreme weather events-if not mitigated by policy action, can reinforce each other and increase the risk of conflict (Leepipatpiboon, Castrovillari, and Mineyama 2023; Rehman and Jaramillo 2024). Reforms are typically needed to improve tax revenues, increase the efficiency of public expenditure, and reinforce fiscal frameworks.
Tax revenue in FCS economies is generally well below its potential-more so than in other EMDEs-highlighting the need and opportunity for stronger revenue administration (figure 4.17.A; Akitoby, Honda, and Primus 2020). FCS economies should prioritize taxing high-revenue sectors and implementing quick-win measures to meet immediate financing needs while developing a medium-term revenue strategy that prioritizes well -sequenced reforms (IMF 2017; Mansour and Schneider 2019) For FCS economies, simple taxes that are broad but require low administrative capaciry-such as taxes on gross values, including turnover or imports-offer the greatest potential, as they have a broad base and are relatively easy to collect. Such taxes can also pave the way for introducing an effective value-added tax. These efforts should be supported by the establishment of simple organizational structures and processes in tax and customs administrations. As institutional capaciry improves, FCS economies should aim to gradually modernize tax administration, including
through the use of electronic tax services (World Bank 20256). Maintaining reform momentum, however, will heavily depend on sustained political commitment, supported by effective engagement with the international community.
FCS economies also need to strengthen expenditure policies. A key priority in many cases is to strengthen basic budget and payment practices, such as spending controls and to consolidate cash resources to meet financial obligations. As institutional capacity develops, FCS economies should enhance public financial management (PFM) systems to increase the efficiency of spending, which has been markedly lower than in other EMDEs in key areas (figure 4.17.B). This requires bolstering accountability mechanisms to combat corruption, including in state-owned enterprises. In fragile contexts, efficient public spending can play a key role not only in delivering essential services but also in rebuilding public trust, fostering social cohesion, and supporting long-term peace. To maximize these broader social benefits, spending and subsidies should be allocated equitably (Chami et al. 2021). In addition, early action to protect incomes and consumption during adverse shocks is not only socially beneficial but also fiscally prudent, as it reduces the cost of crisis response and supports faster recovery. Finally, gradually reallocating public expenditures toward social programs and infrastructure-away from unproductive outlays, public sector wages and, where feasible, security-can help achieve more balanced, equitable, and socially responsive budgets (Baer et al. 2021).
Strengthening fiscal frameworks and institutions can improve the credibility of policy, boost confidence in government, and build resilience to future shocks (IMF 2021). As FCS economies' institutional capacity improves, they should strengthen debt management frameworks to monitor borrowing risks more effectively, while enhancing budget processes to strengthen planning, transparency, and execution (figures 4.17.C-D). Where feasible, fiscal rules, independent fiscal councils, and sovereign wealth funds can be introduced to reinforce fiscal discipline and resilience (figure 4.17.E; Besley and Mueller 2021; Fatas, Gootjes, and Mawejje 2025)
Integrated and well-sequenced reforms that align tax policy, revenue administration, and public financial management into a cohesive strategytailored to each country's institutional and administrative capacity-will be important for success
Bolstering central bank independence can promote not only macroeconomic and financial stability but also trust in policy-making and government (Chami et al. 2021). An independent central bank can anchor inflation expectations, prevent politically driven monetary interventions, and enhance the credibility of economic policykey challenges in many FCS economies (figure 4.17 F; Jacome and Pienknagura 2025; Masciandaro and Romelli 2018). Although the primary objective of monetary policy is low inflation and price stability, it can be used to support demand and employment when inflationary pressures are low, including in fragile settings where high unemployment poses risks to social and political stability (Diallo, Gui-Diby, and Imam 2023) .
Reforms that strengthen regulatory and supervisory frameworks for banks and nonbank financial intermediaries-particularly in combating money laundering and the financing of terrorism-can help deter corruption and illicit financial flows while restoring confidence in financial institutions (Barajas, Chami, and Fullenkamp 2021). By aligning with international standards, such reforms can also facilitate smoother access to global financial markets, boost investor confidence and foster private sector development (Antwi et al. 2023; IFC 20196). Complementary efforts to develop deep and well-regulated domestic capital markets can further strengthen financial resilience, improve resource mobilization, and reduce reliance on external financing (World Bank 20256).
Fragility and conflict present complex, long-term challenges that require sustained international engagement to support conflict resolution and prevention, recovery, stability, and development. The international community must strengthen its engagement with FCS economies to help them overcome challenges and build long-term resilience Sustained international assistance is needed
FCS economies will continue to rely on international support for peacekeeping and emergency relief. Sustained and we/I-coordinated global assistance, including concessional financing, debt relief, and technical assistance, will also be essential to help these economies invest in inclusive development initiatives, strengthen governance and institutions, and create conditions for private sector-led growth. In addition, support to help FCS economies enhance resilience , including to climate-related disasters, is key to mitigating the impact of conflicts and other types of shocks.
in several key areas-peace-building, concessional finance, humanitarian aid, climate change adaptation, technical assistance, and debt relief.
Supporting peace-building and conflict prevention
Peacekeeping missions, which in recent years have primarily been deployed in FCS economies, can help resolve conflicts, protect civilians, and facilitate the safe return of displaced populations (figure 4 18.A; Bove, Di Salvatore, and Elia 2024; Collier, Hoeffl.er, and Soderbom 2008). In many cases, they have effectively contained the spread of violence, including into neighboring countries; shortened its duration; and reduced the risk of recurrence. 14 For example, international peacekeeping efforts were crucial in restoring peace and preventing renewed conflict in Bosnia and Herzegovina after the 1992-95 war (box 4 1). With strong mandates and resources, multidimensional peace-keeping m1ss10ns that support political processes, protect civilians, aid disarmament and reintegration, and restore the rule of law provide a cost-effective way of restoring peace and supporting stability (Hegre, Hultman, and Nygard 2019). However, evolving challenges call for more coordinated and context-specific approaches to strengthen the global community's effectiveness in preventing conflict, supporting recovery, and fostering long-term stability in FCS economies.
Sources: EM-DAT (database); International Monetary Fund; Notre Dame Global Adaptation Initiative (ND-GAIN);OECD CRS; United Nations Department of Peacekeeping Operations; WDI (database); World Bank (2024h); World Bank.
Note : AEs = advanced economies; EMDEs = emerging market and developing economies;FCS = fragile and conflict-affected situations; IDA= International Development Association. The FCS group is based on the current World Bank classification
A Areas show the number of deployed UN peace-keeping forces. Sample includes up to 13 FCS and up to 8 EMDEs excluding FCS. Last observation is February 2020.
B. Bars show the share of economies eligible for IDA resources. Sample includes 154 EMDEs. of which 39 are FCS.
C. Panel shows net official development assistance (constant 2021 U.S dollars) for 37 FCS.
D Bars show the top five sectors receiving donor commitments in FCS during the period 2010-22, in US$ billions at 2022 prices
E Panel shows weighted average natural disaster costs as percent of GDP (2001-24) using nominal U.S. dollar GDP as weights Disaster types include droughts storms floods extreme temperatures and others Sample includes up to 121 EMDEs,of which 28 are FCS.
F. Panel shows averages of climate change adaptation measures.Vulnerability measures a country s exposure to the negative effects of climate change. Readiness measures a country's ability to convert investments into adaptation actions Lowervalues are desirable for vulnerability (bars), higher values are preferable for readiness (diamonds). Sample include up to 36 advanced economies, up to 115 EMDEs excluding FCS,and up to 36 FCS Last observation is 2022
Many FCS economies are unlikely to meet key Sustainable Development Goals (SDGs) related to basic needs by 2030 (Samman et al. 2018). Financing gaps remain substantial, including for climate adaptation (Jones et al. 2024) Fiscal constraints, together with limited access to domestic and international credit markets, highlight the need for concessional financial support as well as improving the effectiveness of aid (World Bank 20256). Reflecting this, 27 of the 39 current FCS economies are IDA-eligible, with 6 more classified as IDA-blend economies (figure 4.18.B).
14 See Beardsley (2011), Beardsley and Gleditsch (2015), Doyle and Sambanis (2000), Fortna (2008), and Ruggeri, Dorussen, and Gizelis (2017).
The exceptional needs of FCS economies, which have increased in recent years, call for the international community to continue prioritizing official development assistance (ODA) to them, building on an increase of about 80 percent, in real U S dollar terms, between 2010-19 and 2022 (figure 4.18.C; World Bank 2024h). An example of ODA's role is provided by Bosnia and Herzegovina, where, following the end of conflict in 1995, international financial assistance was critical to rebuilding infrastructure, restoring essential services, and strengthening resilience (box 4.1).
International financial institutions can also help FCS economies attract private investment by mitigating risk through guarantees, blended finance, and political risk insurance, and by leveraging public-private partnerships (PPPs) and concessional capital to catalyze investment in high-risk markets (World Bank 2022d). For example, in 2023, the Multilateral Investment Guarantee Agency, supported private investment in a hybrid solar power plant in the Federal Republic of Somalia by providing political risk guarantees to mmgate expropriation and conflict-related risks (MIGA 2023). Similarly, through the Africa Fragility Initiative, the International Finance Corporation is working to mobilize private investment and support job creation across fragile African economies by providing targeted advisory services and investment support tailored to highrisk environments (IFC 2022).
Supporting emergency relief efforts
Civilians bear the brunt of violent conflicts, especially since hostilities have increasingly shifted to urban areas (Muhammedally 2022; United Nations 2022). Conflicts can result in mass casualties, severe injuries, destruction of infrastructure, and the collapse of essential services (Gillard 2024). Displaced populations, including refugees, asylum seekers, and the internally displaced, face heightened security risks and limited access to essential services. To mitigate these impacts, the international community should prioritize sustained, well-coordinated humanitarian responses that deliver life-saving assistance, including food, clean water, healthcare, shelter, sanitation, and protection to conflict-affected and forcibly displaced populations (figure 4.18.D). For instance,
in response to Yemen's 2017 conflict-induced food emergency, food aid was quickly scaled up and strategically allocated to the most severely affected areas, helping to mitigate the impact of the crisis (Tandon and Vishwanath 2021). However, such assistance must be carefully targeted to prevent unintended consequences, such as exacerbating violence or inadvertently prolonging hostilities, as has occurred in some cases (Crost, Felter, and Johnston 2014).
Many FCS economies lack the capacity for sufficient investment in climate adaptation and receive less financial assistance than some other lowincome countries Qones et al. 2024). Yet, FCS economies are generally more vulnerable to natural disasters such as droughts, floods, and storms, and have faced larger economic costs from them than other EMDEs (figure 4.18.E). Such disasters have worsened humanitarian crises in many of these economies, particularly by increasing food insecurity and hunger (Townsend et al. 2021). Extreme weather affects three times more people annually in FCS economies than in other countries, with related displacements twice as high and accounting for 10 percent of all internal population displacements Qaramillo et al. 2023).
As climate-related disasters become more frequent and intense, FCS economies are expected to face increasingly severe weather events. Common fragilities-such as conflict, dependence on agriculture, geographical locations, limited access to basic services, weak infrastructure, and weak state capacity-exacerbate the damage to livelihoods and economies that extreme weather events cause Qaramillo et al. 2023). Moreover, climate-related shocks can fuel conflict in fragile contexts, underscoring the need to embed climate resilience and adaptation policies into peace and conflict prevention efforts (Rehman and Jaramillo 2024)
Given the vulnerability of FCS economies to the growing threats of climate change, sustained global support for their adaptation efforts-through grants, concessional financing, and capacitybuilding-is needed to strengthen resilience (figure 4.18.F). These efforts include climate-
smart agriculture-such as the use of droughtresistant crops and efficient irrigation systems-to enhance food security, and adaptive social protection programs that can rapidly scale up in response to weather and other shocks They also include policies to help workers adapt to shifting labor market demands in the green transition (for example, through active labor market programs and reskilling initiatives); expanding financial inclusion to women and other vulnerable groups; investing in green infrastructure to strengthen household and community resilience; and enhancing fiscal sustainability, including, where feasible, through catastrophe risk insurance instruments to reduce the fiscal burden of disaster response. 15 Most importantly, climate resilience must be embedded into peace plans and broader governance efforts to ensure that adaptation strategies are conflict-sensitive and supportive of long-term stability.
Providing technical assistance
FCS economies are characterized by substantial deficiencies in state capacity, including shortages of skilled personnel in critical sectors, inadequate technical expertise to implement reforms effectively, and insufficient data for evidence-based policies (IMF 2022; World Bank 2020c). By providing tailored technical assistance and support for capacity building, the international community can help FCS economies overcome these difficulties (Adrian et al. 2023; Cas, Alem, and Shirakawa 2022; World Bank 2020c). Strengthening statistical capacity is important because data gaps can significantly hinder effective policy-making. While technical assistance has helped improve national accounts and government finance statistics in some FCS economies, such as Haiti and Myanmar, more coordinated and tailored donor efforts are needed to better reflect these economies' weak absorptive capacity (Cas, Alem, and Shirakawa 2022).
Support for the training of public financial management professionals is another key area, given the importance of helping FCS economies im-
15 See for example, Jaramillo et al. (2023), Azour and Selassie (2023), World Bank (2024i), World Bank (2014)
prove the management of their public finances (Charaoui, Frank, and Wiest 2023; Keller and Nogueira-Budny 2022). In addition, technical support from international financial institutions can help the private sector in FCS economies capitalize on investment opportunities through investment and advisory services (IFC 2019a). More broadly, technical assistance by the international community can help rebuild trust in public institutions-a key condition for sustainable peace and inclusive development (United Nations Economic and Social Council 2024).
FCS economies face mounting debt sustainability challenges. For FCS economies where debt is unsustainable, the G20 Common Framework should provide the basis for debt treatments by official creditors. Recently, with the active coordination of major creditor and debtor countries, along with support of the Global Sovereign Debt Roundtable, case-by-case debt treatment under the Common Framework has improved. Among FCS economies, Chad finalized an agreement on debt treatment under the framework in 2022, and Ethiopia is expected to finalize an agreement soon. Recent experiences with debt restructuring, including in FCS economies, underscore the need for faster coordination, greater transparency, and improved information-sharing to accelerate restructuring and secure adequate debt relief for long-term sustainability (Chen and Hart 2025; IMF 2021). At the same time, debtor countries must ensure that public resource utilization is efficient and that there is sufficient governance capacity to manage sovereign debt. When effectively implemented, debt relief has enabled countries such as Rwanda to expand fiscal space in the aftermath of conflict, supporting investment and growth (box 4.1).
FCS economies face an array of daunting development challenges stemming from the intertwined issues of volatility, fragility, and conflict. Weak state capacity, political instability, and insecurity hinder investment, limit labor market participation, and are detrimental to economic growth.
Continuing reliance on the production and export of primary commodities increases FCS economies' vulnerability to adverse shocks and limits opportunities for productivity gains. Limited fiscal capacity-evidenced by weak revenue mobilization, constrained public spending, large deficits, and rising debt burdens-continues to impede economic progress. Moreover, conflict and fragility have had pernicious effects on health, education, and other development outcomes. Since the 201 Os, progress on reducing the rate of severe poverty in FCS economies has stalled, while the number of people experiencing food insecurity has risen markedly.
Conflict imposes especially heavy costs on FCS economies, including loss of life, physical and mental injury, destruction of capital, and lost economic output. More intense conflicts are associated with deeper, more persistent losses and weaker economic recoveries. The COVID-19 pandemic and subsequent global shocks have added to these challenges, exacerbating vulnerabilities in areas such as poverty, food insecurity, and debt and contributing to incomplete recoveries. However, FCS economies also have notable opportunities for growth, including favorable demographics, abundant natural resources, and potential for tourism. In particular, their growing working-age populations can support economic growth and fiscal sustainability Yet wellfunctioning labor markets and investment in
education, training, healthcare, and infrastructure, are needed to support the creation of sufficient productive jobs and avoid a rise in unemployment that would exacerbate existing fragilities.
Many FCS economies are rich in natural resources and are well placed to benefit from the increasing demand for critical minerals needed for the energy transition. Additionally, the end of conflict can create opportunities to harness tourism for economic diversification, growth, and employment in many FCS economies.
With targeted policies and sustained international support, policy makers in FCS economies can prevent conflict, strengthen governance, and build resilience Effective conflict prevention requires tackling the root causes, including, in many cases, exclusion and injustice; strengthening governance and institutional capacity; and investing in earlywarning systems to mitigate risks before they escalate Safeguarding critical infrastructure, protecting institutions, and ensuring humanitarian access during conflicts are crucial for minimizing disruption and reducing human and economic costs. As countries transition out of conflict, reintegration programs for former combatants, institutional reforms, and the strengthening of electoral and justice systems can support stability Lasting peace and development will also depend on continued international support for peacebuilding, climate adaptation, and economic resilience in FCS economies
Burkina Faso
Central
Chad
Comoros
Congo, Dem Rep
Congo, Rep.
Eritrea
Guinea-Bissau
Marshall Islands X
Micronesia, Fed Sis.
Mozambique
Sao Tome and Principe X
Solomon Islands X
Somalia, Fed Rep X
South Sudan X X
Sudan X X
Syrian Arab Republic X
Timor-Leste X
Moderate
IDA Moderate
IDA High
IDA In distress
IDA
Blend Moderate
Tuvalu X UMC IDA High
Ukraine X X LMC IBRD
Venezuela, RB X X IBRD
West Bank and Gaza X X UMC Not classified Yemen, Rep. X X
Zimbabwe X X
IDA
Blend In distress
Note: FCS=Fragile and conflict affected situations; IBRD = International Bank for Reconstruction and Development; IDA= International DevelopmentAssociation;LIC = low-income country; LMC = lowermiddle-income country;UMC = upper middle-income country.The identification of fragile and conflict situations is based on the World Bank's list of fragile and conflict-affected situations as of June 2024.This list is updated annually. Some economies classified as conflict-affected are also potentially fragile Additional details about the classification of FCS are available at: https://thedocs.worldbank org/en/doc/fb0f93e8e3375803bce211ab1218ef2a-0090082023/original/Classification-of-Fragility-and-Conflict-Situations-FY24.pdf. Commodity exporters are defined as economies where on average in 2017-19 either (1) total commodities exports accounted for 30 percent or more of total exports or (2) exports of any single commodity accounted for 20 percent ormore of total exports Economies meeting these thresholds due to re-exports are excluded The "blend" income group category indicatesthat an economy has access to both IBRD and IDA financing. Debt distress risk ratings reflect the latest published IMF-World Bank Debt Sustainability Analyses underthe Joint Debt Sustainability Framework for Low-Income Countries (LIC-DSF) available as of March 2025. Economies without a debt distress indicator were either not analyzed underthe LIC-DSF or do not have a publicly available Debt SustainabilityAnalysis as of March 2025.
The counterfactual analysis considers how per capita GDP growth evolved following the onset of conflicts, relative to forecasts made prior to their start. A conflict event is considered to have started in a given year if conflict-related fatalities per million surpass the thresholds of at least 50 (for medium intensity) and at least 150 (for high intensity), provided that fatalities remained below the corresponding thresholds during the preceding four years (Novta and Pugacheva 2021). The year of conflict onset is marked as an event, represented by a categorical variable set to one. In subsequent years where conflict-related deaths remain above the threshold, the variable also takes a value of one, for up to four years following the initial onset.
In a second step, the analysis compares the realized path of GDP per capita to the forecast made in the year prior to the outbreak of conflict to estimate the cumulative output losses associated with
conflict. These forecasts are drawn from the World Bank's Global Economic Prospects. This exercise is not intended to identify causal relationships. Instead, the objective is to illustrate how per capita GDP evolved following the onset of conflict compared to the pre-conflict forecast.
The sample of EMDEs covered in this exercise is limited to those that experienced at least medium intensity conflicts and for which forecast vintages from the year prior to conflict onset are available. For conflicts commencing after 2021, forecasts from the January 2025 Global Economic Prospects for 2025 onward were used if realized GDP per capita outturns were not available. The sample includes a total of 21 EMDEs at the mediumintensity conflict threshold, and 14 at the high intensity threshold. The exercise is applied to annual data, and is limited to conflicts that commenced between 2006 and 2023. The sample includes both economies currently classified as conflict-affected by the World Bank and those that are not currently classified as such but that may have been previously.
Armenia
Azerbaijan
Burkina Faso x
Cameroon x
Central African Republic x
Chad x
Congo, Dem. Rep. x Cote d'Ivoire
Ethiopia X
Georgia
Israel
Mali x
Mozambique x
Myanmar x
Nigeria x
Sri Lanka
Sudan x
Syrian Arab Republic x Ukraine x
West Bank and Gaza x
Yemen, Rep. x
Sources: Uppsala
Onset
Azerbaijan 2020
Burkina Faso X 2023
Central African Republic X 2013
Chad X 2006
Ethiopia X 2020
Georgia 2008
Mali X 2022
South Sudan X 2013
Sri Lanka 2008
Sudan X 2023
Syrian Arab Republic X 2011
Ukraine X 2022
West Bank and Gaza X 2023
Yemen, Rep X 2015
The event analysis considers the evolution of per capita GDP growth around the onset of mediumand high-intensity conflicts. The onset of a conflict event is determined by using the methodology described in annex 4.1, applying thresholds of 50 (for medium-intensity) and 150 (for highintensity) conflict-related fatalities per million people. In a second step, the average per capita GDP growth rates before, during, and after a conflict are compared. Specifically, average growth rates of per capita GDP are computed for the three years prior to conflict onset and for the three years following the end of hostilities. The average per capita GDP growth rate for the conflict period is computed on a country-by-country basis, considering only the years in which a conflict is
Onset at medium-intensity conflict threshold
Azerbaijan
Central African Republic x Cameroon x
Congo, Dem. Rep. x Cote d'Ivoire
Georgia
Lebanon
Mali
Mozambique
Nigeria
Sri Lanka
Ukraine
considered to be occurring by the methodology outlined in annex 4.1. This exercise is not intended to uncover causal relationships. Rather, its objective is to describe how macroeconomic variables evolve over the course of a conflict.
The sample consists of EMDEs that experienced medium or high-intensity conflicts, between 2006 and 2020, and for which at least three years have elapsed since the conflict ended. Specifically, the sample includes a total of 12 medium-intensity conflicts (in 12 EMDEs), and nine high-intensity conflicts (in eight EMDEs). The analysis uses annual data and is restricted to conflicts that commenced between 2006 and 2020 The country sample includes economies currently classified as conflict affected by the World Bank as well as those not currently in this category but that may have been previously.
This annex outlines the data and methodological framework used to estimate the economic cost of conflict discussed in the chapter.
Data
The sample includes all economies that have experienced conflict-related fatalities and for which relevant economic data are available. This includes a maximum sample of 80 economies, including 74 EMDEs-28 of which are FCS-with annual data spanning 1989 to 2024 (table A4.3). Data on conflict-related fatalities are sourced from the Uppsala Conflict Data Program while GDP per capita and its expenditure and production components are drawn from the World Bank. Countryspecific data-including governance and institutional indicators, private sector credit, natural resource rents, and manufacturing exports-are drawn from the World Bank's Development Indicators, while climate change adaptation indicators are sourced from the Notre Dame Global Adaptation Initiative, and the Human Development Index from the United Nations.
Estimation framework
The economic cost of conflict is estimated using the heterogeneous panel VAR methodology developed by Pedroni (2013). This approach is particularly well-suited to capturing the complex dynamics and cross-country variation in conflict-affected contexts. It addresses several limitations of conventional approaches used in earlier studies to estimate the macroeconomic cost of conflict In particular, it accounts for cross-country heterogeneity in the economic effects of conflict and the issue of dual causality-where conflict affects variables such as per capita GDP, and economic deterioration may in turn increase the risk of conflict. Ignoring these factors can lead to inconsistent or imprecise estimates. The cost of conflict often unfolds over an extended period of time following its onset, with the magnitude varying depending on how much time has elapsed since the conflict began. These costs also tend to differ across country experiences. Accounting for such cross-country heterogeneity improves the accuracy of estimates
by addressing latent variation in lagged dependent variables. If unaddressed, latent heterogeneity in the lagged dependent variables of the VAR could result in inconsistent estimates. In addition, this framework can be applied to relatively short annual time series-a key constraint for EMDEs-and especially some low-income countries and FCSunlike approaches that require estimating individual country VAR models.
The estimation approach first derives countryspecific impulse responses ro conflict using the heterogeneous panel VAR model and then explains the heterogeneity among countries through cross-sectional regressions on country attributes. In the first stage, the baseline estimations make use of a bivariate heterogeneous PVAR system, including up to 80 economies, employing a parsimonious specification that includes the pseudo-log of conflict related fatalities per million (CRF) and the pseudo log of per capita gross domestic product (PCGDP) or other macroeconomic variables such as agricultural and industry gross value added. The baseline equations are estimated in demeaned, log-differenced forms. For example, the initial two-variable system can be represented by the vector below, for countries = 1, , and years t= 1, ... ,T : (:j,Z;, = (f:j,lnCRF,, /:j,lnPCGDP;,)'. The estimation procedure applies the following steps:
Step 1. A VAR model based on these variables is estimated individually for each country i of the sample. This can be represented as: R; (L)f:j,Z;, = µ;, where
R ;,j represents the country-specific matrices of VAR coefficient estimates for lags = 1, , where the country-specific lag lengths are chosen using the standard Akaike information criterion
Step 2. These country-level VAR models are supplemented with one additional global-level VAR based on the cross-sectional averages of the same variables:
The VAR for the cross-sectional averages takes the analogous form:
Step 3. Each of these VAR systems is then inverted into their respective orthogonalized vector moving average representation to obtain impulse responses as follows.
For the country-specific VAR models: where
i Qj i j1ij A(L)AL = =
And analogously, for the global VAR model based on the cross-sectional average:
() ttZAL =
The objects of interest are the responses of the log levels. The VAR estimation is conducted in the stationary, log-differenced form, and the responses of the variables of interest are then recovered by accumulating the resulting impulse responses.
To give the impulse responses a standard interpretation as dynamic elasticities, they are accumulated and transformed to represent the percentage response of per capita GDP (or of other variables) to shocks that increase conflict-related deaths by 1 percent. A one-percent increase is measured relative to a country's average rate of conflict-related fatalities per million, which corresponds on average to about 2.15 fatalities per million in FCS, and 0.4 per million in EMDEs excluding FCS.
=+
ititit
Λi itiitZA(L) =
it
it
i
The baseline analysis uses the standard Cholesky decomposition of the short-run covariance matrix, which implies a recursive short-run impact matrix. The order of the variables implies that conflictrelated fatalities impact output in the same year. For any given orthogonalization of the shocks, the correlation between country-specific shocks and global shocks is used to obtain consistent estimates of the loading vector and decompose the composite shocks into common global shocks and idiosyncratic country-specific shocks in a standard factor representation form:
l i ii A(L)A(L)(I) =−
1/2
t εit
These loadings are then used to derive countryspecific impulse responses to the idiosyncratic and common shocks as follows: and
l iiA(L)A(L)=
This yields a cross-sectional sample distribution of N country-specific impulse responses to each shock.
Although broadly comparable, the estimates of the impact of conflict on GDP per capita are somewhat larger than those reported in similar studies employing alternative methodologies. The heterogeneous panel VAR approach used here treats conflict as a continuous variable, capturing the impact of varying levels of violence on macroeconomic variables, and not just after violence has exceeded a prespecified and arbitrary "threshold" as in many other studies. This feature may partly explain the larger estimated impact of conflict on GDP per capita, as tensions and violence often escalate years before the number of fatalities surpass a given conflict intensity threshold, negatively impacting confidence, expectations and macroeconomic performance. Another potential factor is the more recent sample used in this study (which ends in 2024), and includes several particularly large and costly conflicts not considered in earlier studies
In the second stage, the cross-sectional distribution of impulse responses at each response horizon is projected in a regression with country-specific attributes that potentially interact with the effect of conflict on economic variables such as per capita GDP. This stage facilitates identifying which attributes are associated with either an attenuation or amplification of the economic costs induced by conflict at various time horizons
Afghanistan Egypt, Arab Rep
Madagascar Somalia, Fed Rep
Algeria Eritrea Mali South Africa
Angola Ethiopia Mauritania South Sudan
Armenia France Mexico Spain
Azerbaijan Georgia Mozambique Sri Lanka
Bangladesh Ghana Myanmar Sudan
Brazil Guatemala Namibia Syria Arab Republic
Burkina Faso Guinea Nepal Tajikistan
Burundi Haiti Niger Tanzania
Cambodia Honduras Nigeria Thailand
Cameroon India Pakistan Tunisia
Canada Indonesia Papua New Guinea Turkiye
Central African Republic Iran, Islamic Rep Paraguay Uganda
Chad Iraq Peru Ukraine
China Israel Philippines
United Kingdom
Colombia Kenya Russian Federation United States
Congo, Dem Rep Lao PDR Rwanda Uzbekistan
Congo, Rep Lebanon Saudi Arabia West Bank and Gaza
Cote d'Ivoire Liberia Senegal Yemen, Rep
Djibouti Libya Sierra Leone Zimbabwe
Source: World Bank.
Abbs, L. 2021. "The Language of the Unheard? ErhnoPolitical Exclusion and Ethnic Riots in Africa." / ournal of Global Security Studies 6 (2).
Abdel-Latif, H., A. C. David, R. Ouedraogo, and M. Specht. 2024. "Echoes Across Borders: Macroeconomic Spillover Effects of Conflict in Sub-Saharan African Countries." IMF Working Paper 24/100, International Monetary Fund, Washington, DC.
Abdel-Latif, H., and M. El-Gama!. 2024. "Fraying Threads: Exclusion and Conflict in Sub-Saharan Africa." IMF Working Paper 2024/4, International Monetary Fund, Washington, DC.
Acemoglu, D. 2003. "Root Causes: A Historical Approach to Assessing the Role of Institutions in Economic Development." Finance & Development 40 (2): 2730.
Acemoglu, D., and S. Johnson. 2007. "Disease and Development: The Effect of Life Expectancy on Economic Growth." fournal of Political Economy 115 (6): 925-85.
Acemoglu, D., S. Johnson, and J. A. Robinson. 2001. "The Colonial Origins of Comparative Development: An Empirical Investigation. " American Economic Review 91 (5): 1369-401.
Adam, C., and J. Wilson. 2021. "Monetary and Exchange Rate Policy in Fragile States." In Macroeconomic Policy in Fragile States, edited by R. Chami, R. Espinoza, and P. ]. Montiel, 367-405. Oxford, U.K.: Oxford University Press.
Adelaja, A., and J. George. 2019. "Effects of Conflict on Agriculture: Evidence from the Boko Haram Insurgency." World Development 117 (May): 184-95.
Adrian, T., F. Bousquet, D. Desruelle, V. Gaspar, and B. Kroese. 2023. "Fragile States Need Customized Support to Strengthen Institutions." IMF Blog. September 21, 2023. www.imf.org/en/Blogs/Articles/2023/09/21 I fragile-states-need-customized-support-to-strengtheninstitutions.
Akanbi, 0. A., N. Gueorguiev, J. Honda, P. Mehta, K. Moriyama, K. Primus, and M. Sy. 2021. "Avoid a Fall or Fly Again: Turning Points of State Fragility." IMF Working Paper 2021/133, International Monetary Fund, Washington, DC.
Akitoby, B., ]. Honda, and K. Primus. 2020. "Tax Revenues in Fragile and Conflict-Affected States-Why Are They Low and How Can We Raise Them?" IMF
Working Paper 2020/143, International Monetary Fund, Washington, DC.
Akresh, R., S. Bhalotra, M. Leone, and U. 0. Osili. 2012. "War and Stature: Growing Up during the Nigerian Civil War." American Economic Review 102 (3): 273-77.
Alfar, A. ]., M. Elheddad, and N. Doyrch. 2024. "Impact of Political Conflict on Foreign Direct Investments in the Mining Sector: Evidence from the Event Study and Spatial Estimation." fournal of Environmental Management 350 Qanuary): 119590.
Alfaro, L. 2017. "Gains from Foreign Direct Investment: Macro and Micro Approaches." The World Bank Economic Review 30 (1): S2-S15.
Alkhalil, M., A. Abbara, C. Grangier, and E. Abdulkarim. 2024. "AI in Conflict Zones: The Potential to Revitalize Healthcare in Syria and Beyond." BM] Global Health 9 (8): e015755
Almond, D., J. Currie, and V. Duque. 2018. "Childhood Circumstances and Adult Outcomes: Act II." / ournal ofEconomic Literature 56 (4): 1360-446.
Andrews, M., L. Pritchett, and M. Woolcock. 2017. Building State Capability: Evidence, Analysis, Action. New York: Oxford University Press.
Antwi, S., A. B. Tetteh, P. Armah, and E. 0. Dankwah. 2023. "Anti-Money Laundering Measures and Financial Sector Development: Empirical Evidence from Africa." Cogent Economics and Finance 11 (1): 2209957.
Artuc, E., G. Porto, and B. Rijkers. 2025. "Crops, Conflict and Climate Change." Policy Research Working Paper 11018, World Bank, Washington, DC.
Assaf, N., M. Engman, A. Ragoussis, and S. Agrawal. 2021. "The Private Sector in Fragile Situations." In Macroeconomic Policy in Fragile States, edited by R. Chami, R. Espinoza, and P. J. Montiel. 127-85. Oxford, U.K.: Oxford University Press.
Ayissi, A. 2021. "Three Decades of Disarmament, Demobilization, and Reintegration of Ex-Combatants in Africa: Lessons Learned and Challenges Ahead." In The State of Peacebuilding in Africa, edited by T. McNamee, M. Muyangwa, 141-62. Cham, Switzerland: Palgrave Macmillan.
Azour, ]., and A. Selassie. 2023. "Africa's Fragile States Are Greatest Climate Change Casualties." IMF Blog. August 30, 2023. www.imf.org/en/Blogs/Articles/2023 IO 8 I30/africas-fragile-states-are-greatest-climate-changecasualties.
Baer, K., S. Gupta, M. Mansour, and S. Pattanayak. 2021. "Building Fiscal Institutions in Fragile States: A Two-Step Approach." In Macroeconomic Policy in Fragile States, edited by R. Chami, R. Espinoza, and P. J. Montiel. 297-333. Oxford, U.K.: Oxford University Press.
Bakker, B. B., S. Chen, D. Vasilyev, 0. Bespalova, M. Chin, D. Kolpakova, A. Singha!, et al. 2024. "What Can Artificial Intelligence Do for Stagnant Productivity in Latin America and the Caribbean?" IMF Working Paper 2024/219, International Monetary Fund, Washington, DC.
Bandula-Irwin, T., M. Gallien, A. Jackson, V. van den Boogaard, and F. Weigand. 2024. "Beyond Greed: Why Armed Groups Tax." Studies in Conflict & Terrorism 47(12): 1599-622.
Banholzer, L. 2014. "When Do Disarmament, Demobilisation and Reintegration Programmes Succeed?" Discussion Paper 8/2014, Deutsches Institut fiir Entwicklungspolitik, Bonn.
Barajas, A., R. Chami, and C. Fullenkamp. 2021. "The State of Finance in Fragile States." In Macroeconomic Policy in Fragile States, edited by R. Chami, R. Espinoza, and P. J. Montiel, 186-208. Oxford, U.K: Oxford University Press.
Bartlett, W. 2008. Europe's Troubled Region: Economic Development, Institutional Reform and Social Welfare in the Western Balkans. London: Routledge.
Basedau, M., and V. Roy. 2020. "Sleep, Bark, or Bite: Do Natural Resources Make the Difference Regarding Peaceful or Violent Conflict?" International Area Studies Review 23 (1): 73-92.
Beardsley, K. 2011. "Peacekeeping and the Contagion of Armed Conflict." The journal of Politics 73 (4): 1051-64.
Beardsley, K., and K. S. Gleditsch. 2015. "Peacekeeping as Conflict Containment." International Studies Review 17 (1): 67-89.
Bendavid, E., T. Boerma, N. Akseer, A. Langer, E. Bwenge Malembaka, E. A. Okiro, P. H. Wise et al. 2021. "The Effects of Armed Conflict on the Health of Women and Children." The Lancet 397 (10273): 52232.
Bennett, D. S., and A. C. Stam. 1996. "The Duration of Interstate Wars, 1816-1985." American Political Science Review 90 (2): 239-57.
Besley, T., and H. Mueller. 2012. "Estimating the Peace Dividend: The Impact of Violence on House
Prices in Northern Ireland." American Economic Review 102 (2): 810-33.
Besley, T., and H. Mueller. 2021. "Fiscal Capacity and State Fragility." In Macroeconomic Policy in Fragile States, edited by R. Chami, R. Espinoza, and P. J. Montiel, 235-70. Oxford, U.K.: Oxford University Press.
Biresselioglu, M. E., M. H. Demir, A. Gonca, 0. Kolcu, and A. Yetim. 2019. "How Vulnerable Are Countries to Resource Curse? A Multidimensional Assessment." Energy Research & Social Science 47 0anuary): 93-101.
Bisogno, M., and A. Chong. 2002. "Poverty and Inequality in Bosnia and Herzegovina After the Civil War." WorldDevelopment30 (1): 61-75.
Blair, G., D. Christensen, and V. Wirtschafter. 2022. "How Does Armed Conflict Shape Investment? Evidence from the Mining Sector." The journal of Politics 84 (1): 116-33.
Blattman, C., and J. Annan. 2016. "Can Employment Reduce Lawlessness and Rebellion? A Field Experiment with High-Risk Men in a Fragile State." American Political Science Review 110 (1): 1-1 7.
Boehmer, C., E. Gartzke, and T. Nordstrom. 2004. "Do Intergovernmental Organizations Promote Peace?" World Politics 57 (1): 1-38.
Bogale, B., S. Scambler, A. N. Mohd Khairuddin, and J.E. Gallagher. 2024. "Health System Strengthening in Fragile and Conflict-Affected States: A Review of Systematic Reviews." PLOS One 19 (6): 0305234.
Booth, D., and S. Unsworth. 2014. Politically Smart, Locally Led Development. London: Overseas Development Institute.
Bosio, E , and A. Palacio. 2023 Increasing Access to Justice in Fragile Settings . Washington, DC: World Bank.
Boussard, J., C. Castrovillari, T. Mineyama, M. Spinella, B. Tabti, and M. Tuuli. 2024. "Global Shocks Unfolding: Lessons from Fragile and Conflict-affected States." IMF Working Paper 2024/214, International Monetary Fund, Washington, DC.
Bove, V., J. Di Salvatore, and L. Elia. 2024. "What It Takes to Return: UN Peacekeeping and the Safe Return of Displaced People." Journal of Conflict Resolution 69 (5): 898-924.
Brinkerhoff, D. W. 2005. "Rebuilding Governance in Failed States and Post-Conflict Societies: Core Con-
cepts and Cross-Cutting Themes." Public Administration and Development 25 (1): 3-14.
Bri.ick, T., J. Cuesta, J. De Hoop, U. Gentilini, and A. Peterman. 2019. "Social Protection in Contexts of Fragility and Forced Displacement: Introduction to a Special Issue." The Journal of Development Studies 55 (1): 1-6.
Bri.ick, T., M. Di Maio, and S. H. Miaari. 2019. "Learning the Hard Way: The Effect of Violent Conflict on Student Academic Achievement." journal of the European Economic Association 17 (5): 1502-37.
Buhaug, H., and K. S. Gleditsch. 2008. "Contagion or Confusion? Why Conflicts Cluster in Space." International Studies Quarterly 52 (2): 215-33.
Burde, D., A. Coombes, T. Hoop, 0. Guven, 0. Okhido, H. Ring, V. Rothbard, and C. Udayakumar Holla. 2023. Forced Displacement and Education: Building the Evidence for What Works-Case Study Summary. Washington, DC: World Bank.
Cabra-Ruiz, N., S. Rozo, and M. M. Sviatschi. 2025. "Forced Displacement, the Perpetuation of Autocratic Leadership, and Development in Origin Countries." Policy Research Working Paper 11049, World Bank, Washington, DC.
Cali, M. 2015. Trading Away from Conflict: Using Trade to Increase Resilience in Fragile States. Washington, DC: World Bank.
Calice, P. 2023. "Unlocking SME Finance in Fragile and Conflict Affected Situations." Let's Talk Development (blog). April 4, 2023. www.blogs.worldbank.org/ en/developmenttalk/unlocking-sme-finance-fragile-andconflict-affected-situations.
Canning, D., J. S. Raja, and A. S. Yazbeck, eds. 2015. Africa's Demographic Transition: Dividend or Disaster? Africa Development Forum Series. Washington, DC: World Bank.
Cas S. M., Y. Alem, and J. B. Shirakawa. 2022. "Building Statistical Capacity in Fragile and ConflictAffected States." IMF Working Paper 2022/045, International Monetary Fund, Washington, DC.
Cazzaniga, M., F. Jaumotte, L. Li, G. Melina, A. J. Panton, C. Pizzinelli, E. J. Rockall, et al. 2024. "GenAl: Artificial Intelligence and the Future of Work." Staff Discussion Note 2024/001, International Monetary Fund, Washington, DC.
Cederman, L. E., K. S. Gleditsch, and H. Buhaug. 2014. Inequality, Grievances and Civil War. Cambridge, U.K.: Cambridge University Press.
Chacha, P. W., and L. Edwards. 2019. "Exporting to Fragile States in Africa: Firm level Evidence." Review of Development Economics 23 (3): 1177-201.
Chami, R., M. Coppo, R. Espinoza, and P. Montiel. 2021. "Macroeconomic Policy Issues in Fragile States: A Framework." In Macroeconomic Policy in Fragile States, edited by: R. Chami, R. Espinoza, and P. Montiel, 1-38. Oxford U.K.: International Monetary Fund.
Chami, R., E. Ernst, C. Fullenkamp, and A. Oeking. 2018. "Are Remittances Good for Labor Markets in LICs, MICs and Fragile States? Evidence from CrossCountry Data." IMF Working Paper 2024/214, International Monetary Fund, Washington, DC.
Chami, R., R. Espinoza, and P. J. Montiel. eds. 2021. Macroeconomic Policy in Fragile States. Oxford U.K.: Oxford University Press.
Charaoui, ]., ]. Frank, and B. Wiest. 2023. "Delivering PFM Capacity Development in Fragile and ConflictAffected States-Learning from Recent Experience." IMF-METAC Regional Note 2013/9, International Monetary Fund, Washington, DC.
Chaudoin, S., Z. Peskowitz, and C. Stanton. 2017. "Beyond Zeroes and Ones: The Intensity and Dynamics of Civil Conflict." The Journal of Conflict Resolution 61 (1): 56-83.
Chemouni, B. 2017. "The Politics of Core Public Sector Reform in Rwanda." Working Paper 88, Effective States and Inclusive Development Research Centre, University of Manchester, Manchester, England.
Chen, S., N V. Loayza, and M. Reynal-Querol. 2008. "The Aftermath of Civil War." The World Bank Economic Review 22 (1): 63-85.
Chen, Y., and T . Hart. 2023. "Common Framework, Uncommon Challenges: Lessons from the PostCOVID Debt Restructuring Architecture." Insight, 001 Global, London.
Choudhary, R., F. Ulrich, and E. Skrok. 2024. "Taxing for Growth: Revisiting the 15 Percent Threshold " Policy Research Working Paper 10943, World Bank, Washington, DC.
Chrimes, T., B. Gootjes, M. A. Kose, and C. Wheeler. 2024. The Great Reversal: Prospects, Risks, and Policies in International Development Association (IDA) Countries. Washington, DC: World Bank.
Chrimes, T., M. A. Kose, and K. Stamm eds. (Forthcoming). The Global jobs Challenge. Washington, DC: World Bank.
Chupilkin, M., and Z. Koczan. 2022. "The Economic Consequences of War: Estimates Using Synthetic Controls." EBRO Working Paper 271, European Bank for Reconstruction and Development, London.
Church, C., and A. Crawford. 2020. "Minerals and the Metals for the Energy Transition: Exploring the Conflict Implications for Mineral-Rich, Fragile States." In The Geopolitics of the Global Energy Transition, edited by M. Hafner, and S. Tagliapietra, 279-304. Cham, Switzerland: Springer.
Cingranelli, D., S. Mark, M. Gibney, P. Haschke, R. Wood, and D. Amon. 2019. "Human Rights Violations and Violent Internal Conflict." Social Sciences 8 (2): 41.
Clark, D. H., and R. A. Hart. 1998. "Controlling Duration Dependence in Conflict Analyses: A Replication and Extension of 'Regime Types and Status Quo Evaluations."' American journal of Political Science 42 (4): 1335-42.
Coe, D. T., I. Lee, W. F. Abdelati, R. H. Eastman, S. Ishikawa, A. Lopez-Mejia, S. Mitra, and P. Collier. 2009. "The Political Economy of State Failure." Oxford Review ofEconomic Policy 25 (2): 219-40.
Collier, P., and A. Hoeffler. 1998. "On Economic Causes of Civil War." Oxford Economic Papers 50 (4): 563-73.
Collier, P., and A. Hoeffler. 2002. "On the Incidence of Civil War in Africa." journal of Conflict Resolution 46 (1): 13-28.
Collier, P., and A. Hoeffler. 2004a. "Greed and Grievance in Civil War." Oxford Economic Papers 56 (4): 563-95.
Collier, P., and A. Hoeffler. 20046. "Aid, Policy and Growth in Post-Conflict Societies." European Economic Review 48 (5): 1125-45.
Collier, P., and Hoeffler, A. 2005. "Resource Rents, Governance, and Conflict." journal of Conflict Resolution, 49 (4): 625-33.
Collier, P., A. Hoeffler, and M. Soderbom. 2004. "On the Duration of Civil War." journal of Peace Research 41 (3): 253-73.
Collier, P., A. Hoefler, and M. Soderbom. 2008. "PostConflict Risks." journal of Peace Research 45 (4): 46178.
Compaore, A., M. Mlachila, R. Ouedraogo, and S. Sourouema. 2020. "The Impact of Conflict and Political Instability on Banking Crises in Developing
Countries." IMF Working Paper 2020/41, International Monetary Fund, Washington, DC.
Corral, P., A Irwin, N. Krishnan, D. N. Mahler, and T. Vishwanath. 2020. Fragility and Conflict: On the Front Lines of the Fight against Poverty. Washington, DC: World Bank.
Costalli, S., L. Moretti, and C. Pischedda. 2017. "The Economic Costs of Civil War: Synthetic Counterfactual Evidence and the Effects of Ethnic Fractionalization." jou rna l ofPeace Research 54 (1): 80-98.
Coulibaly, K., K. Ezemenari, and N. E. Duffy. 2008. "Productivity Growth and Economic Reform: Evidence from Rwanda." Policy Research Working Paper 4552, World Bank, Washington DC.
Couttenier, M., J. Marcoux, T. Mayer, and M. Thoenig. 2024. "The Gravity of Violence." CEPR Discussion Paper 19527, Center for Economic and Policy Research, Paris and London.
Crost, B., J. Felter, and P. Johnston. 2014. "Aid Under Fire: Development Projects and Civil Conflict." American Economic Review 104 (6): 1833-56.
Currie, J., and T. Vogl. 2013. "Early-Life Health and Adult Circumstance in Developing Countries." Annual Review ofEconomics 5 (August): 1-36.
Custodio, C., B. Mendes, and D Mendes 2025. "Inventory Decisions under Political Violence." Economics Letters 247 (February): 112158
Davoodi H. R., P. Elger, A. Fotiou, D. Garcia-Macia, X. Han, A. Lagerborg, W. R. Lam, and P. Medas. 2022. "Fiscal Rules and Fiscal Councils: Recent Trends and Performance during the Pandemic." IMF Working Paper 2022/11, International Monetary Fund, Washington, DC.
De Roux, N., and LR. Martinez. 2022. "Forgone Investment Amid Conflict: Evidence from Credit Microdata in Colombia." STEG Working Paper 023, Structural Transformation and Economic Growth, Foreign, Commonwealth & Development Office, London
Del Castillo, G. 2008. Rebuilding War-Torn States: The Challenge of Post-Conflict Economic Reconstruction. Oxford, U.K.: Oxford University Press.
Deming, D. J. 2022. "Four Facts about Human Capital." journal ofEconomic Perspectives 36 (3): 75-102.
DeRouen, Jr., K. R., and D. Sobek. 2004. "The Dynamics of Civil War Duration and Outcome." journal ofPeace Research 41 (3): 303-20.
Development Committee. 2025. 2025 Development Committee Communique. Washington, DC: World Bank and International Monetary Fund.
Diallo, 0., S. L. Gui-Diby, and P. A. Imam. 2023. "Do Monetary Policy Outcomes Promote Stabiliry in Fragile Settings?" Applied Economics 56 (4): 483-99.
Di Maio, M., and V. L Sciabolazza. 2023. "Conflict Exposure and Labour Market Outcomes: Evidence from Longitudinal Data for the Gaza Strip." Labour Economics 85 (December): 102439.
Dieppe, A., S. Kilic Celik, and C. Okou. 2020. "Implications of Major Adverse Events on Productivity." Policy Research Working Paper 9411, World Bank, Washington, DC.
Dobbins, J., J. G. McGinn, K. Crane, S. G. Jones, R. Lal, A. Rathmell, R. M. Swanger, and A. Timilsina. 2003. America's Role in Nation-Building: From Germany to Iraq. Santa Monica, CA: RAND Corporation.
Doyle, M. W., and N. Sambanis. 2000. "International Peacebuilding: A Theoretical and Quantitative Analysis." American Political Science Review 94 (4): 779-801.
Dreibelbis, R., L. E. Greene, M. C. Freeman, S. Saboori, R. P. Chase, and R. Rheingans. 2013. "Water, Sanitation, and Primary School Attendance: A MultiLevel Assessment of Determinants of HouseholdReported Absence in Kenya." International journal of Educational Development 33 (5): 457-65.
Dundar, H., B. Millot, Y. Savchenko, A. Harsha, and T. A. Piyasiri. 2014. Building the Skills for Economic Growth and Competitiveness in Sri Lanka. Directions in Development. Washington, DC: World Bank.
Dunne, J. P., and N. Tian. 2019. "Costs of Civil War and Fragile States in Africa." Review of Development Economics 23 (3): 1220-37.
Edwards, B., S. Yilmaz, and J. Boex. 2015. "Decentralization as a Post-Conflict Strategy: Local Government Discretion and Accountability in Sierra Leone." Public Administration and Development 35 (I): 46-60.
Eissa, N. 0., A. Jensen, J. L. Weigel, J. Aguilera-Mesa, H. Gali, S. Logan, and C. Sacchetto. 2023. "Tax Capacity in Fragile States: Trends, Challenges, and Policy Options." Policy Brief, Tax and State Fragility Initiative, International Growth Centre, London.
El Saghir, S., and J. Maur. 2023. "Case Study 1: Mining (EV battery) Value Chains." Democratic Republic of the Congo Country Economic Memorandum, World Bank, Washington, DC.
GLOBAL ECONOM IC PROSPECTS
Ezemenari, K. M., and N. K. Joshi. 2019. Nepal Development Update: Investing in People to Close the Human Capital Gap. Washington, DC: World Bank.
Ezeoha, A., A. Igwe, C. Okoyeuzu, and C. Uche. 2023. "The Fiscal Effects of Armed Conflicts in Africa." African Development Review 35 (4): 444-56.
Fang, X., S. Kothari, C. Mcloughlin, and M. Yenice. 2020. "The Economic Consequences of Conflict in Sub-Saharan Africa." IMF Working Paper 20/221, International Monetary Fund, Washington, DC.
Fatas, A., B. Gootjes, and J. Mawejje. 2025. "Dynamic Effects of Fiscal Rules. Do Initial Conditions Matter?" Policy Research Working Paper 11066, World Bank, Washington, DC.
Fausett, E., and T. J. Volgy. 2010. "Intergovernmental Organizations (IGOs) and Interstate Conflict: Parsing Out IGO Effects for Alternative Dimensions of Conflict in Post communist Space." International Studies Quarterly 54 (I): 79-101.
Fearon, J. D. 2004. "Why Do Some Civil Wars Last So Much Longer Than Others?" Journal of Peace Research 41 (3): 275-30 I.
Federle, J., A. Meier, G. Muller, W. Mutschler, and M. Schularick. 2024. "The Price of War." CEPR Discussion Paper 18834, Center for Economic and Policy Research, Washington, DC.
Fetzer, T. 2020. "Can Workfare Programs Moderate Conflict? Evidence from India." Journal of the European Economic Association 18 (6): 3337-75.
Fjelde, H., L. Hultman, and D. Nilsson. 2019. "Protection Through Presence: UN Peacekeeping and the Costs of Targeting Civilians." International Organization 73 (1): 103-31.
Forichon, K. 2020. "Considering Human Capital in a Multidimensional Analysis of Fragility." OECD Development Co-operation Working Paper 80, Organisation for Economic Co-operation and Development, Paris.
Fornino, M., and A. Tiffin. 2024. "Sub-Saharan Africa's Growth Requires Quality Education for Growing Population." IMF Blog. April 25, 2024. www.imf.org/ en/Blogs/Articles/2024/04/25/sub-saharan-africasgrowth-requires-quality-education-for-growingpopulation.
Fortna, V. P. 2008. Does Peacekeeping Work? Shaping Belligerents' Choices after Civil War. Princeton, NJ: Princeton University Press.
FSIN (Food Security Information Network) and GNAFC (Global Network Against Food Crises). 2024. Global Report on Food Crises 2024. Rome: Food Security Information Network and Global Network Against Food Crises.
Galdo, V., G. L. Acevedo, and M. Rama. 2021. "Conflict and the Composition of Economic Activity in Afghanistan." IZA journal of Development and Migration 12 (1).
Canson, B., and K. Hoelscher. 2021. "Theorising MSMEs in Contexts of Urban Violence." fournal of Ifficit Economies and Development 2 (2): 222-41.
Ganum, P., and C. Sever. 2025. "Frayed Societies: Decoding the Interplay between Conflicts and Gender Inequality." IMF Working Paper 25/12, International Monetary Fund, Washington, DC.
Garcia-Uribe, S., H. Mueller, and C. Sanz. 2024. "Economic Uncertainty and Divisive Politics: Evidence from the Dos Espafias." The journal ofEconomic History 84 (1): 40-73.
Garriga, A. C. 2025. "Revisiting Central Bank Independence in the World: An Extended Dataset." International Studies Quarterly 69 (2): sqaf024.
Garry, S., and F. Checchi. 2020. "Armed Conflict and Public Health: Into the 21st Century." fournal of Public Health 42 (3): 287-98.
Gatti, R , J. Torres, N. Elmallakh, G. Mele, D. Faures, M. E. Mousa, and I. Suvanov. 2024. Growth in the Middle East and North Africa. MENA Economic Update, October. Washington, DC: World Bank.
George, J., A. Adelaja, and D. Weatherspoon 2020. "Armed Conflicts and Food Insecurity: Evidence from Boko Haram's Attacks." American journal ofAgricultural Economics 102 (1): 114-31.
Ghobarah, H. A., P. Huth, and B. Russet. 2003. "Civil Wars Kill and Maim People-Long After the Shooting Stops." American Political Science Review 97 (2): 189202.
Ghossein, T., and A. N. Rana. 2022. Business Environment Reforms in Fragile and Conflict-Affected Situations: What Works and Why?Washington, DC: World Bank.
Gillard, E. 2024. "Enhancing the Security of Civilians in Conflict: Notifications, Evacuations, Humanitarian Corridors, Suspensions of Hostilities and Other Humanitarian Arrangements." Research Paper, Royal Institute oflnternational Affairs, London.
Gollin, 0., R. Jedwab, and D. Vollrath. 2016. "Urbanization with and without Industrializa-
tion." fournal of Economic Growth 21 (November): 3570.
Gowan, R., and M. Ungar. 2023. Pathways for Peace: Regional Trends in Conflict and Prevention. Washington, DC: World Bank.
Guimbert, S. 2010. "Cambodia 1998-2008: An Episode of Rapid Growth." Policy Research Working Paper 5271, World Bank, Washington DC.
Hanmer, L., U. Ekhator-Mobayode, A Al-Ahmadi, and L. Rawlings. 2024. "Increasing Gender Equality in Fragile, Conflict, and Violence Settings." Gender Thematic Policy Notes Series: Evidence and Practice Note, World Bank, Washington, DC.
Harild, N., A. Christensen, and R. Zetter. 2015. "Sustainable Refugee Return: Triggers, Constraints, and Lessons on Addressing the Development Challenges of Forced Displacement." GPFD Issue Note Series, August, World Bank, Washington, DC.
Hegre, H., L. Hultman, and H. M. Nygard. 2019. "Evaluating the Conflict-Reducing Effect of UN Peacekeeping Operations." The journal of Politics 81 (1): 215-32.
Herrera, S., M . Massimo, J. N. D. Francois, H. Isaka, and H. Sahibzada. Forthcoming. "Global Database on Spending Efficiency" (database) World Bank, Washington, DC.
Hidalgo-Arestegui, A., C. Porter, A. Sanchez., and S. Singha!. 2025. "The Long Shadow of Conflict on Human Capital: Intergenerational Evidence from Peru." fournal of Development Economics 174 (May): 103468.
Hill, S., and J. Khadan. 2024. "Fiscal Challenges in Small States: Weathering Storms, Rebuilding Resilience." Policy Research Working Paper 10913, World Bank, Washington, DC.
HLPE-FSN (High Level Panel of Experts on Food Security and Nutrition). 2024. "Conflict-Induced Acute Food Crises: Potential Policy Responses in Light of Current Emergencies." Rome: CFS HLPE-FSN.
Hoddinott, J., H. Alderman, J. R. Behrman, L. Haddad, and S. Horton. 2013. "The Economic Rationale for Investing in Stunting Reduction." Maternal and Child Nutrition 9 (S2): 69-82.
Hossain, I., D. Bazarkulova, and J. Compton. 2024. "Effects of Conflicts on Labor Market Outcome and Intimate Partner Violence: Evidence from Nepal." Feminist Economics 30 (4): 75-105.
Hughes, C. 2003. The Political Economy of the Cambodian Transitions. Abingdon, U.K.: Routledge.
IDMC (Internal Displacement Monitoring Center). 2022. Global Report on Internal Displacement 2022: Children and Youth in Internal Displacement. Geneva: Internal Displacement Monitoring Center.
IDS (Institute of Development Studies). 2010. An Upside-down View of Governance. Brighton, U.K.: Institute of Development Studies.
IFC (International Finance Corporation). 2019a. Generating Private Investment in Fragile and Conflict-affected Areas. Washington, DC: International Finance Corporation.
IFC (International Finance Corporation). 20196. "Anti -Money-Laundering (AML) and Countering Financing of Terrorism (CFT) Risk Management in Emerging Market Banks." Good Practice Note, IFC. Washington, DC.
IFC (International Finance Corporation). 2019c. Shaping the Future ofAdventure and Cultural Travel. Washington, DC: International Finance Corporation.
IFC (International Finance Corporation). 2022. "IFC Launches Africa Fragility Initiative to Promote Responsible Private Sector Development in Fragile and Conflict-Affected Countries." Press Release, International Finance Corporation, Washington, DC.
IMF (International Monetary Fund). 2005. "Rwanda: Enhanced Initiative for Heavily Indebted Poor Countries-Completion Point Document." IMF Country Report 05/173, International Monetary Fund, Washington, DC.
IMF (International Monetary Fund). 2007. Cambodia: 2007 Article IV Consultation . Washington, DC: International Monetary Fund.
IMF (International Monetary Fund). 2009. Sri Lanka: First Review Under the Stand-By Arrangement-Staff Report. Washington, DC: International Monetary Fund.
IMF (International Monetary Fund). 2015. Fiscal Monitor: Strengthening the Credibility of Public Finances. Chapter 2. October. Washington, DC: International Monetary Fund.
IMF (International Monetary Fund). 2017. "Building Fiscal Capacity in Fragile States." Policy Paper, International Monetary Fund, Washington, DC.
IMF (International Monetary Fund). 2019. Regional Economic Outlook: Sub-Saharan Africa-Recovery Amid
Elevated Uncertainty. April. Washington, DC: International Monetary Fund.
IMF (International Monetary Fund). 2020. Nepal Selected Issues. Washington, DC: International Monetary Fund.
IMF (International Monetary Fund). 2021. "Macroeconomic Developments and Prospects in LowIncome Countries-2021." International Monetary Fund, Washington, DC.
IMF (International Monetary Fund). 2022. The IMF Strategy for Fragile and Conflict-Affected States. Washington, DC: International Monetary Fund.
IMF (International Monetary Fund). 2024. Regional Economic Outlook: Middle East and Central Asia-An Uneven Recovery Amid High Uncertainty. April. Washington, DC: International Monetary Fund.
IOM (International Organization for Migration). 2024. "Displacement in Sudan Crosses 11 Million as Devastating Crisis Reaches New Heights: IOM Chief." International Organization for Migration, March 27, 2024. www.iom.int/news/displacement-sudan-crosses11-million-devastating-crisis-reaches-new-heights-iomchief.
Ito, T., J. Li, R. Usoof-Thowfeek, and K. Yamazaki. 2024. "Educational Consequences of Firsthand Exposure to Armed Conflict: The Case of the Sri Lankan Civil War." World Development 173 Qanuary): 106430.
Jacome, L., and S Pienknagura 2025 "Central Bank Independence and Inflation Tail Risks-Evidence from Emerging Markets " Journal of International Money and Finance 153 (March): 103285
Jawad, M., T. Hone, E. P. Vamos, P. Roderick, R. Sullivan, and C. Millet. 2020. "Estimating Indirect Mortality Impacts of Armed Conflict in Civilian Populations: Panel Regression Analyses of 193 Countries, 1990-2017." BMC Medicine 18 (266).
Jaramillo, L., A. Cebotari, Y. Diallo, R. Gupta, Y. Koshima, C. Kularatne, J. D. Lee, et al. 2023. "Climate Challenges in Fragile and Conflict-Affected States." IMF Staff Climate Note 2023/001, International Monetary Fund, Washington, DC.
John, J. D., and J. Putzel. 2009. Political Settlements. Birmingham, U.K.: University of Birmingham.
Jones, L., J. Banga, B. Notkin, and A. Brochen. 2024. Closing the Gap: Trends in Adaptation Finance for Fragile and Conflict-affected Settings. Washington, DC: World Bank.
Kaminski, B., and M. de la Rocha. 2003. "Stabilization and Association Process in the Balkans: Integration Options and their Assessment." Policy Research Working Paper 3108, World Bank, Washington DC.
Karbownik, K , and A. Wray. 2025. "Lifetime and Intergenerational Consequences of Poor Childhood Health." fournal ofHuman Resources 60 (1): 187-223.
Karreth, J. 2017. "The Economic Leverage of International Organizations m Interstate Disputes." International Interactions 44 (3): 463-90.
Kassem, H. S., B. A. Alotaibi, Y. A. Ghoneim, and A. M. Diab. 2020. "Mobile-Based Advisory Services for Sustainable Agriculture: Assessing Farmers' Information Behavior." Information Development 37 (3): 483-95.
Kathuria, S., ed. 2008. Western Balkan Integration and the EU- An Agenda for Trade and Growth. Washington, DC: World Bank.
Keller, J., and D. Nogueira-Budny. 2022. "Debt Sustainability in Fragile and Conflict-Affected States: Heightened Risks and Needs." IEG Blog, February 23, 2022. www.ieg.worldbankgroup.org/blog/debt-sustaina bility-fragile-and-conflict-affected-states-heightenedrisks-and-needs.
Kenworthy, P., J. Mawejje, and M. R. Steinbach. 2025. "Falling Graduation Prospects: Low-Income Countries in the Twenty-First Century" In Global Economic Prospects, January. Washington, DC: World Bank.
Korovkin, V., and A. Makarin. 2023. "Conflict and Intergroup Trade: Evidence from the 2014 RussiaUkraine Crisis." American Economic Review 113 (1): 34-70.
Kovacevic, D. 2003. "The Currency Board and Monetary Stability in Bosnia and Herzegovina." BIS Papers 17 (May): 59-61.
Kpodar, K., and P.A. Imam. 2024. "How Do Transaction Costs Influence Remittances?" World Development 177 (May): 106537.
Ksoll, C., R. Macchiavello, and A. Morjaria. 2023. "Electoral Violence and Supply Chain Disruptions in Kenya's Floriculture Industry." Review ofEconomics and Statistics 105 (6): 1335-51.
Lebrand, M., H. Mueller, P. Schouten, and J. Steinbuks. 2025. "Road Investment and Violence in DRC: Perishable Peace Dividends." Policy Research Working Paper Series 11071, World Bank, Washington, DC.
Leepipatpiboon, P., C. Castrovillari, and T. Mineyama. 2023. "Macroeconomic Shocks and Conflict." IMF Working Paper 2023/068, International Monetary Fund, Washington, DC.
Leo, B , and J. Barmeier. 2010. "Who Are the MDG Trailblazers? A New MDG Progress Index." CGD Working Paper 222, Center for Global Development, Washington, DC.
Lessmann, C., and A. Steinkraus. 2019 "The Geography of Natural Resources, Ethnic Inequality and Civil Conflicts." European Journal of Political Economy 59 (September): 33-51.
Levin, A. 2023. "The Composition of UN Peacekeeping Operations and Aid Worker Security." fou rnal of Peace Research 6 l (5): 726-43.
Lin, F., X. Li, N. Jia, F. Feng, H. Huang, J. Huang, S. Fan, P. Ciais, and X. P. Song. 2023. "The Impact of Russia-Ukraine Conflict on Global Food Security." Global Food Security 36 (March): 100661.
Longhurst, D., and R Slater. 2022. "Financing m Fragile and Conflict Contexts: Evidence, Opportunities, and Barriers". BASIC Research Working Paper 15, Institute of Development Studies, University of Sussex, Brighton, U.K.
Loungani, P., E. E. Luttini, and H. M. Pallan. 2025. "Buffering Recessions: Labor Market Asymmetries and the Role of Self-Employment." Policy Research Working Paper 11089, World Bank, Washington, DC.
Loyle, C. E., and B. J. Appel. 2017 "Conflict Recurrence and Post-Conflict Justice: Addressing Motivations and Opportunities for Sustainable Peace." International Studies Quarterly 61 (3): 690-703.
LSE-Oxford Commission on State Fragility, Growth and Development. 2018. Escaping the Fragility Trap. London: International Growth Centre
Maconachie, R. 2016. "The Extractive Industries, Mineral Sector Reform and Post-Conflict Reconstruction in Developing Countries." The Extractive Industries and Society 3 (2): 313-15.
McNabb, K., M. Danquah, and A. Tagem. 2021. "Tax Effort Revisited: New Estimates from The Government Revenue Dataset." WIDER Working Paper 170, United Nations University World Institute for Development Economics Research, Helsinki.
Mahler, D. G., N. Yonzan, and C. Lakner. 2022. "The Impact of COVID-19 on Global Inequality and Poverty." Policy Research Working Paper 10198, World Bank, Washington, DC.
Mahmood, S. 2024. Policy Toolkit on Challenges and Opportunities for Solar Mini-Grids. London: International Growth Center.
Makinde, 0. A., E. Olamijuwon, I. Mgbachi, and R. Sato. 2023. "Childhood Exposure to Armed Conflict and Nutritional Health Outcomes in Nigeria." Conflict and Health 17 (15): 1-12.
Malunda, D., and S. Musana. 2012. "Rwanda Case Study on Economic Transformation." Report for the African Centre for Economic Transformation (ACET), Institute of Policy Analysis and Research, Kigali, Rwanda.
Mandon, P., V. Nossek, and D. Sandjong Tomi. 2024. "Stuck in a Fragility Trap: The Case of the Central African Republic Civil War." Defence and Peace Economics 36 (4): 1-34.
Mansour, M., and]. Schneider. 2019. "How to Design Tax Policy in Fragile States." IMF How-to Note 2019/004, International Monetary Fund, Washington, DC.
Marley, J. 2020. "Peacebuilding in Fragile Contexts." OECD Development Co-operation Working Papers 83, Organisation for Economic Co-operation and Development, Paris.
Masciandaro, D., and D. Romelli. 2018. "Beyond the Central Bank Independence Veil: New Evidence." BAFFI CAREFIN Working Paper 1871, Centre for Applied Research on International Markets Banking Finance and Regulation, Bocconi University, Milan.
Mawejje, J. 2025. Fiscal Vulnerability in Low-Income Countries: Evolution, Drivers, and Policies. Washington, DC: W odd Bank.
Mawejje, J., and P. McSharry. 2021. "The Economic Cost of Conflict: Evidence from South Sudan." Review ofDevelopment Economics 25 (4): 1969-90.
Michaelsen, M. M., and P. Salardi. 2020. "Violence, Psychological Stress and Educational Performance During the 'War on Drugs' in Mexico." Journal of Development Economics 143 (March): 102387.
MIGA (Multilateral Investment Guarantee Agency). 2023. "MIGA Supports Ground-Breaking Solar Project in Somalia." Press Release, Multilateral Investment Guarantee Agency, Washington, DC.
Mijiyawa, A.G., 2017. "Drivers of Structural Transformation: The Case of the Manufacturing Sector in Africa." World Development99 (November): 141-59.
Miklian, J., and K. Hoelscher. 2022. "SMEs and Exogenous Shocks: A Conceptual Literature Review and Forward Research Agenda." International Small Business Journal 40 (2): 178-204.
Morgan, C., M. Bowling, J Bartram, and G. L. Kayser. 2017. "Water, Sanitation, and Hygiene in Schools: Status and Implications of Low Coverage in Ethiopia, Kenya, Mozambique, Rwanda, Uganda, and Zambia." International Journal of Hygiene and Environmental Health 220 (6): 950-59.
Morsy, H., A. Shimeles, and T. Nabassaga. 2023. "Structural Change and Inequality in Africa." Journal of African Economies 32 (2): 228-45.
Mueller, H , and C. Rauh 2022. "The Hard Problem of Prediction for Conflict Prevention." Journal of the European Economic Association 20 (6): 2440-67.
Mueller, H., C. Rauh, B. R. Seimon, and R. A. Espinoza. 2024. "The Urgency of Conflict Prevention-A Macroeconomic Perspective." IMF Working Paper 2024/256, International Monetary Fund, Washington, DC.
Muhammedally, S. 2022 A Primer on Civilian Harm Mitigation in Urban Operations Washington, DC: Center for Civilians in Conflict.
Munoz, S., K. Nakamura, N. Rendak, and S. Yelten. 2006. Cambodia: Rebuilding for a Challenging Future. Washington DC: International Monetary Fund.
Nauges, C., and J. Strand 2013 "Water Hauling and Girls' School Attendance: Some New Evidence from Ghana." Policy Research Working Paper 6443, World Bank, Washington DC.
Naumkina, S., 0 . Kokoriev, and H. Yatvetska. 2024. "Transitional Justice as an Efficient Mechanism for Overcoming the Consequences of Armed Conflicts: World Experience." European Political and Law Discourse 11 (3): 13-23
ND-GAIN (Notre Dame Global Adaptation Initiative Country Index) database. Accessed on November 8, 2024. www.gain.nd.edu/our-work/country-index/ download-data/.
Newfarmer, R., J. Page, and F. Tarp, eds. 2018. Industries without Smokestacks Industrialization in Africa Reconsidered Oxford: Oxford University Press.
Newhouse, D. L., P. Suarez-Becerra, and D. Doan. 2016 Sri Lanka-Poverty and Welfare: Recent Progress and Remaining Challenges. Washington, DC: World Bank.
Newiak, M., A. Segura-Ubiergo, and A. A. Wayne. ed. 2022. Good Governance in Sub-Saharan Africa: Opportunities and Lessons. Wahington, DC: International Monetary Fund.
Nkoa, B., J. S. Song, and B. M. Bikoula. 2024. "Natural Resource Rents in Developing Countries: Is the Positive Influence on the Fragilities Real?" Resources Policy 89 (February): 104541.
Novelli, M., N. Morgan, and C. Nibigira. 2012. "Tourism in a Post-Conflict Situation of Fragility." Annals of Tourism Research 39 (3): 1446-69.
Novta, N., and E. Pugacheva. 2021. "The Macroeconomic Costs of Conflict." f ournal of Macroeconomics 68 Qune): 103286.
OECD (Organisation for Economic Cooperation and Development). 2011. Supporting Statebuilding in Situations of Conflict and Fragility: Policy Guidance. DAC Guidelines and Reference Series. Paris: Organisation for Economic Cooperation and Development.
Ohnsorge, F., and S. Yu, eds. 2022. The Long Shadow of Informality: Challenges and Policies. Washington, DC: World Bank.
0stby, G. 2008. "Polarization, Horizontal Inequalities and Violent Civil Conflict." fournal of Peace Research 45 (2): 143-62.
0stby, G. 2013. "Inequality and Political Violence: A Review of the Literature." International Area Studies Review 16 (2): 206-31.
Ovadiya, M., A. Kryeziu, S. Masood, and E. Zapatero. 2015. "Social Protection in Fragile and ConflictAffected Countries: Trends and Challenges." Social Protection and Labor Discussion Paper 1502, World Bank, Washington, DC.
Pazarbasioglu, C., A. Garcia, M. Uttamchandani, H. Natarajan, E. Feyen, and M. Saal. 2020. Digital Financial Services. Washington, DC: World Bank.
Pedroni, P. 2013. "Structural Panel VARs." Econometrics 1 (2): 180-206.
Polachek, S. W., and D. Sevastianova. 2011. "Does Conflict Disrupt Growth? Evidence of the Relationship between Political Instability and National Economic Performance." The journal of International Trade and Economic Development21 (3): 361-88.
Pompe, S., and J. Turkewitz. 2022. "Addressing Corruption in Fragile Country Settings." In Good Governance in Sub-Saharan Africa: Opportunities and Lessons, edited by M. Newiak, A. Segura-Ubiergo, and A. A.
Wane, 125-52. Washington, DC: International Monetary Fund.
Porter, M. 2011. "The Role of the Private Sector in Fragile and Conflict-Affected States." World Development Report 2011 Background Paper, World Bank, Washington, DC.
Ratha, D., E. J. Kim, S. Plaza, E. J. Riordan, V. Chandra, and W. Shaw. 2022. "Remittances Brave Global Headwinds. Special Focus: Climate Migration." Migration and Development Brief 37, KNOMAD-World Bank, Washington, DC.
Rauschendorfer, ]., and B. Shepherd. 2022. "Trade, Conflict and Informality: Evidence from the South Sudanese Civil War." The World Economy 45 (3): 86794.
Redifer, L., E. Alper, N. Meads, N. Gursoy, T. Newiak, M. Thomas, and S. Kwalingana. 2020. The Development Path Less Traveled: The Experience of Rwanda. Washington, DC: International Monetary Fund.
Regan, P. M., and A. C. Stam. 2002. "In the Nick of Time: Conflict Management, Mediation Timing, and the Duration of Interstate Disputes." International Studies Quarterly 44 (2): 239-60.
Rehman, S., and L. Jaramillo. 2024. "Adding Fuel to the Fire: How Weather Shocks Intensify Conflict." IMF Working Paper 2024/112, International Monetary Fund, Washington, DC.
Rogall, T., I. Rudolfsen, and P. Vesco. 2025. "Conflict Worsens the Impact of Flood on Food Insecurity: Evidence from the Nargis Cyclone in Myanmar." VIEWS Forecasting. March 20, 2025. www.viewsforecasting. org/news/conflict-worsens-the-impact-of-flood-onfood-insecurity-evidence-from-the-nargis-cyclone-inmyanmar/.
Rohner, D. 2024. The Peace Formula: Voice, Work and Warranties, Not Violence. Cambridge, U.K.: Cambridge University Press.
Rosen, N. 2023. "Five Years After Pathways: Evolving Research on Inequality, Grievance, and Inclusion." Pathways for Peace, World Bank, Washington, DC; United Nations, New York.
Rother, B., G. Pierre, D. Lombardo, R. Herrala, P. Toffano, E. Roos, G. Auclair, and K. Manasseh. 2016. "The Economic Impact of Conflicts and the Refugee Crisis in the Middle East and North Africa." IMF Staff Discussion Note 2016/008, International Monetary Fund, Washington, DC.
Ruggeri, A., H. Dorussen, and T. Gizelis. 2017. "Winning the Peace Locally: UN Peacekeeping and Local Conflict." International Organization 71 (1): 163-85.
Rummel, R. ]. 1994. Death by Government. New Brunswick, N.J.: Transaction Publishers.
Rutkowski, M., and F. Bousquet. 2019. "Social Protection: Protecting the Poor and Vulnerable During Crises." Development for Peace (blog). December 12, 2019. www.blogs.worldbank.org/en/dev4peace/socialprotection-protecting-poor-and-vulnerable-duringcnses.
Safi, L., A. G. Safi, and M. Mujeeb. 2024. "Identifying Afghanistan's Extraordinary Natural Sites for Ecotourism: A Review of Ideal Ecosystems." journal of Natural Science Review 2 (4): 147-68.
Same, A. T. 2009. "Transforming Natural Resource Wealth into Sustained Growth and Poverty Reduction: A Conceptual Framework for Sub-Saharan African Oil Exporting Countries." Policy Research Working Paper 4852, World Bank, Washington, DC.
Samman, E., P. Lucci, J. Hagen-Zanker, T. Bhatkal, A. T. Simunovic, S. Nicolai, E. Stuart, et al. 2018. SDG Progress: Fragility, Crisis and Leaving No One Behind. London: Overseas Development Institute and International Rescue Committee.
Schady, N., A. Holla, S. Sabarwal, J. Silva, and A. Y. Chang. 2023. Collapse and Recovery: How the COVID19 Pandemic Eroded Human Capital and What to Do about It. Washington, DC: World Bank.
Schlogl, L., and A. Sumner. 2020. "Economic Development and Structural Transformation " In Disrupted Development and the Future of Inequality in the Age of Automation. Rethinking International Development Series, 11-20. Cham, Switzerland: Palgrave Pivot.
Schwab, K. 2019. lhe Global Competitiveness Report. Geneva: World Economic Forum.
Scott, E. K M 2022. "Compromising Aid to Protect International Staff: The Politics of Humanitarian Threat Perception after the Arab Uprisings." journal of Global Security Studies 7 (1): ogab024
Serikbayeva, B., K. Abdulla, and Y. Oskenbayev. 2021. "State Capacity in Responding to COVID19." International journal of Public Administration 44 (11-12): 920-30.
Sesay, F. L. 2004. "Conflict in Neighbouring (Developing) Countries: Direct and Indirect Effects on Economic Growth." TIGER Working Paper Series 68,
Transformation, Integration and Globalization Economic Research (TIGER), Warsaw, Poland
Siberdt, B. 2024. "Why Onset Matters: Warfare, Intensity, and Duration in Civil War." journal of Conflict Resolution O (O): 1-35.
Singh, M. K 2023. "What Is State Capacity and How Does It Matter for Energy Transition?" Energy Policy 183 (December): 113799.
Stapenhurst, R., N. Johnston, and R. Pelizzo. eds. 2006. lhe Role of Parliament in Curbing Corruption. Washington, DC: World Bank.
Szayna, T. S., A. O'Mahony, ]. Kavanagh, S. Watts, B. Frederick, T. C. Norlen, and P. Voorhies. 2017. Confbct Trends and Conflict Drivers: An Empirical Assessment of Historical Conflict Patterns and Future Conflict Projections. Santa Monica, CA: RAND Corporation.
Tandon, S., and T. Vishwanath. 2021. "How Well Is Humanitarian Assistance Targeted in Fragile Environments? Evidence from the Announcement of a Food Emergency in Yemen." Food Policy 102 Quly): 102071.
Tapsoba, A. 2023. "The Cost of Fear: Impact of Violence Risk on Child Health during Conflict." journal of Development Economics 160 Qanuary): 102975.
Tesche,]. 2000. "Banking in Bosnia and Herzegovina." MOCT-MOST: Economic Policy in Transitional Economies 10 (3): 311-24.
Townsend, R., D. Verner, A. Adubi, J. Saint-Geours, I. Leao, A. Juergenliemk, T. Robertson, et al. 2021. Future of Food: Building Stronger Food Systems in Fragility, Conflict, and Violence Settings. Washington, DC: World Bank.
UCDP (Uppsala Universitet). 2024. "Record Number of Armed Conflicts in the World-Press Release." Uppsala Universitet, Uppsala, Sweden.
UN (United Nations). 2010. "Second Generation Disarmament, Demobilization and Reintegration (DDR) Practices in Peace Operations: A Contribution to the New Horizon Discussion on Challenges and Opportunities for UN Peacekeeping." New York: United Nations.
UN (United Nations). 2022. "Urban Warfare Devastates 50 Million People Worldwide, Speakers Tell Security Council, Calling for Effective Tools to End Impunity, Improve Humanitarian Response." Meeting Coverage and Press Releases, United Nations, New York
UN (United Nations) and World Bank. 2018. Pathways for Peace: Inclusive Approaches to Preventing Violent Conflict. Washington, DC: World Bank.
UNICEF (United Nations Children's Fund). 2024. "Financing Social Services in Humanitarian Settings." Social Spending Monitor Series: Policy Brief 4. United Nations Children's Fund, New York.
UNDP (United Nations Development Programme). 2008. Crisis Prevention and Recovery Report 2008: PostConflict Economic Recovery-Enabling Local Ingenuity. New York: United Nations Development Programme.
UN (United Nations) Economic and Social Council. 2024. "Sound Public Financial Management in Fragile and Conflict-Affected Settings to Eradicate Poverty in All its Forms." Note by the Secretariat, E/C16/2024/8. United Nations, New York.
UNOCHA (United Nations Office for the Coordination of Humanitarian Affairs). 2024. "Global Humanitarian Overview 2025." United Nations Office for the Coordination of Humanitarian Affairs, Geneva.
UN (United Nations) Security Council. 2024. "Protection of Civilians in Armed Conflicts." Report of the Secretary-General, S/2024/385. United Nations, New York.
Utar, H., 2024. "Firms and Labor in Times of Violence: Evidence from the Mexican Drug War." The World Bank Economic Review O(O): 1-31.
Vandeninden, F., R. Grun, and A. Semlali. 2019. The Way Forward for Social Safety Nets in Burkina Faso. Washington, DC: World Bank.
Vesco, P., G. Baliki, T. Bri.ick, S. Doring, A. Eriksson, H. Fjelde, D. Guha-Sapir, et al. 2025. "The Impacts of Armed Conflict on Human Development: A Review of the Literature." World Development 187 (March): 106806.
World Bank. 2000. Bosnia and Herzegovina: PostConflict Reconstruction and the Transition to a Market Economy. Washington, DC: World Bank.
World Bank. 2006. Cambodia: Halving Poverty by 2015? Poverty Assessment 2006. Washington, DC: World Bank.
World Bank. 2007. Sri Lanka-Poverty Assessment: Engendering Growth with Equity: Opportunities and Challenges Washington, DC: World Bank.
World Bank. 2009. "Disarmament, Demobilization and Reintegration." World Bank Conflict, Crime and Violence Note 119, Washington, DC: World Bank, Washington, DC.
World Bank. 2011. World Development Report 2011: Conflict, Security, and Development. Washington, DC: World Bank.
World Bank. 2013. Where Have All the Poor Gone? Cambodia Poverty Assessment 2013. Washington, DC: World Bank.
World Bank. 2014. Financial Protection Against Natural Disasters: An Operational Framework for Disaster Risk Financing and Insurance. Washington, DC: World Bank.
World Bank. 2015a. Democratic Republic of Congo Systematic Country Diagnostic. Washington, DC: World Bank.
World Bank. 20156. Republic of South Sudan Systematic Country Diagnostic. Washington, DC: World Bank.
World Bank. 2016a. Afghanistan Systematic Country Diagnostic. Washington, DC: World Bank.
World Bank. 20166. Sri Lanka Development Update. September. Washington, DC: World Bank.
World Bank. 2017a. Priorities for Supporting Poverty Reduction and Promoting Shared Prosperity. Solomon Islands Systematic Country Diagnostic. Washington, DC: World Bank.
Wodd Bank. 20176. Tourism for Development: 20 Reasons Sustainable Tourism Counts for Development. Washington, DC: World Bank.
World Bank. 2017c. Forcibly Displaced: Toward a Development Approach Supporting Refugees, the Internally Displaced, and Their Hosts. Washington, DC: World Bank.
World Bank. 2017d. World Development Report 2017: Governance and the Law. Washington, DC: World Bank.
Wodd Bank. 2018a. Policy Priorities for Poverty Reduction and Shared Prosperity in a Post-Conflict Country and Fragile State. Democratic Republic of Congo Systematic Country Diagnostic. Washington, DC: World Bank.
World Bank. 20186. The Independent State of Papua New Guinea Systematic Country Diagnostic. Washington, DC: World Bank.
World Bank. 2020a. Global Economic Prospects. January. Washington, DC: World Bank.
World Bank. 20206. Global Investment Competitiveness Report 2019/2020: Rebuilding Investor Confidence in Times of Uncertainty. Washington, DC: World Bank.
Wodd Bank. 2020c. World Bank Group Strategy for Fragility, Conflict, and Violence 2020--2025. Washington, DC: Wodd Bank.
Wodd Bank. 2020d. Enhancing Government Effectiveness and Transparency: The Fight Against Corruption. Washington, DC: World Bank.
World Bank. 2022a. The International Finance Corporation's and Multilateral Investment Guarantee Agency's Support for Private Investment in Fragile and ConflictAffected Situations, Fiscal Years 2010--21. Independent Evaluation Group. Washington, DC: World Bank.
World Bank. 20226. Social Cohesion and Forced Displacement: A Synthesis of New Research. Washington, DC: World Bank.
World Bank. 2022c. Boosting Shared Prosperity in a Landlocked Country Beset by Fragility and Conflict. Chad Systematic Country Diagnostic. Washington, DC: World Bank.
World Bank. 2022d. The International Finance Corporation's and Multilateral Investment Guarantee Agency's Support for Private Investment in Fragile and ConflictAffected Situations, Fiscal Years 2010-21. Independent Evaluation Group. Washington, DC: World Bank.
Wodd Bank. 2023a. World Development Report 2023: Migrants, Refugees, and Societies. Washington, DC: World Bank.
World Bank. 20236. Accelerating the Building of Inclusive Institutions for Resilience and jobs. Somalia Systematic Country Diagnostic. Washington, DC: World Bank.
World Bank. 2024a. "Classification of Fragility and Conflict Situations (FCS) for World Bank Group Engagement." Brief, World Bank, Washington, DC.
World Bank. 20246. Global Economic Prospects. January. Washington, DC: World Bank.
World Bank. 2024c. Global Economic Prospects. June. Washington, DC: World Bank.
World Bank. 2024d. Business Ready 2024. Washington, DC: World Bank.
World Bank. 2024e. "Learning from the Evidence on Forced Displacement: Program Brief." World Bank, Washington, DC.
World Bank. 2024f. A Development Approach to Advancing Gender Engagement and Addressing Gender Inequalities in Fragile, Conflict and Violent Situations. Washington, DC: World Bank.
Wodd Bank. 2024g. Women, Business and the Law 2024. Washington, DC: World Bank.
Wodd Bank. 2024h. Empowering Fragile States: IDA 's Strategic Role in Conflict-Affected Areas and Vulnerable Countries. Washington, DC: World Bank.
World Bank. 2024i. "Preparing the Workforce for the Green Transition: How to Promote the Green Transition, Competitiveness, and Employability by Focusing on Skills Development in South Africa." Synthesis Note July, 2024, World Bank, Washington, DC.
World Bank. 2025a. Global Economic Prospects. January. Washington, DC: World Bank.
World Bank. 20256. "Financing for Development. The World Bank Group's Contribution to the International Financing for Development Agenda." World Bank, Washington, DC.
World Bank. 2025c. "Note on the Impacts of the Conflict in the Middle East on the Palestinian Economy." World Bank, Washington, DC.
World Bank. 2025d. Prosperity Unearthed: WealthSharing Mechanisms for Peace and Equitable Growth in the Middle East and North Africa. International Development in Focus. Washington, DC: World Bank.
World Bank-WDI (World Development Indicators) database. "World Development Indicators." Accessed on December 18, 2024. www.databank.worldbank.org/ source/world-development-indicators
World Bank, European Union, and United Nations. 2024. "Gaza Strip Interim Damage Assessment." Summary Note, World Bank, Washington, DC.
World Bank, UNESCO, and UNICEF 2021. The State of the Global Education Crisis: A Path to Recovery. Washington, DC: World Bank.
WCO (World Customs Organization). 2022. "Secretariat Note on the Role of Customs in Fragile and Conflict-Affected Situations." World Customs Organization, Brussels, Belgium.
WTO (World Trade Organization). 2025. Trade for Peace: Pathways to Sustainable Trade and Peace. Geneva: World Trade Organization.
Yolchi, ]., H. Wang, and V. Pede. 2024. "Impact of Floods on Food Security in Rural Afghanistan." International journal of Disaster Risk Reduction 112 (October): 104746.
Annual estimates and forecasts 1 (Percent change)
Sub-Saharan Africa (continued)
Sources : Haver Analytics; World Bank
Note: e = estimate; f = forecast.
1. Aggregate growth rates calculated using GDP weights at average 2010-19 prices and market exchange rates.
2. Quarterly estimates are based on non-seasonally-adjusted real GDP,except for advanced economies, as well as Algeria, Ecuador, Morocco,and Tunisia. In some instances, quarterly growth paths may not align to annual growth estimates, owing to the timing of GDP releases Quarterly data for Iraq, Jamaica, Nepal, and Pakistan are gross value added. Quarterly data for Montenegro are preliminary.
Regional averages are calculated based on data from the following economies.
East Asia and Pacific: China, Indonesia,Malaysia, Mongolia, the Philippines, Thailand,and Viet Nam.
Europe and Central Asia: Albania, Armenia, Belarus Bosnia and Herzegovina Bulgaria Georgia Hungary Kazakhstan Moldova Montenegro North Macedonia Poland Romania the Russian Federation Serbia Turkiye and Ukraine.
Latin America and the Caribbean: Argentina, Belize, Bolivia, Brazil,Chile,Colombia,Costa Rica, the Dominican Republic, Ecuador, El Salvador,Guatemala,Guyana, Honduras, Jamaica, Mexico, Nicaragua, Panama, Paraguay, Peru,Trinidad and Tobago,and Uruguay
Middle East and North Africa: Algeria, Bahrain, the Arab Republic of Egypt, the Islamic Republic of Iran, Iraq, Jordan, Kuwait, Morocco, Oman,Qatar, Saudi Arabia, Tunisia, the United Arab Emirates,and West Bank and Gaza.
South Asia: Bangladesh, India, Maldives, Nepal, Pakistan,and Sri Lanka
Sub-Saharan Africa: Angola, Benin, Botswana, Ghana, Kenya, Lesotho, Mauritius,Mozambique, Namibia, Nigeria, Rwanda, the Seychelles, South Africa, Uganda,and Zambia.
3. Annual GDP is on fiscal year basis as per reporting practice in the country. For Bangladesh Bhutan Egypt Nepal and Pakistan the column for 2022 refers to FY2021/22. For Afghanistan India and the Islamic Republic of Iran the column for 2022 refers to FY2022/23
4. Data for Lebanon (beyond 2025), Myanmar (beyond 2026), the Syrian Arab Republic (beyond 2025),and the Republic of Yemen (beyond 2026) are excluded because of a high degree of uncertainty.
5. Data for Bosnia and Herzegovina are from the production approach. Annual data for Iraq and Pakistan are based on factor cost. Data for Timor-Leste represent non-oil GDP.
The macroeconomic forecasts presented in this report are prepared by staff of the Prospects Group of the Development Economics Vice Presidency, in coordination with staff from the Economic Policy Global Practice of the Prosperity Vice Presidency and from regional and country offices, and with input from regional Chief Economist offices. They are the result of an iterative process that incorporates data, macroeconometric models, and judgment.
Data. Data used to prepare country forecasts come from a variety of sources National Income Accounts (NIA), Balance of Payments (BOP), and fiscal data are from Haver Analytics; the World Development Indicators by the World Bank; the World Economic Outlook, Balance of Payments Statistics, and International Financial Statistics by the International Monetary Fund. Population data and forecasts are from the United Nations World Population Prospects. Country- and lendinggroup classifications are from the World Bank. The Prospects Group's internal databases include high-frequency indicators such as industrial production, consumer price indexes, emerging markets bond index (EMBI), exchange rates, exports, imports, policy rates, and stock market indexes, based on data from Bloomberg, Haver Analytics, IMF Balance of Payments Statistics, IMF International Financial Statistics, and J.P. Morgan.
Aggregations. Aggregate growth rates for the world and all subgroups of countries (such as regions and income groups) are weighted averages of country-specific growth rates, calculated using
GDP weights at average 2010-19 prices and market exchange rates. Income groups are defined as in the World Bank's classification of country groups.
Output growth forecast process. The process starts with initial assumptions about advancedeconomy growth and commodity price forecasts. These are used as conditioning assumptions for the first set of growth forecasts for EMDEs, which are produced using macroeconometric models, accounting frameworks to ensure national account identities and global consistency, estimates of spillovers from major economies, and high-frequency indicators. These forecasts are then evaluated to ensure consistency of treatment across similar EMDEs. This is followed by extensive discussions with World Bank country teams, who conduct continuous macroeconomic monitoring and dialogue with country authorities and finalize growth forecasts for EMDEs. The Prospects Group prepares advanced-economy and commodity price forecasts. Throughout the forecasting process, staff use macroeconometric models that allow the combination of judgment and consistency with model-based insights.
Global trade growth forecast process. Global trade growth is calculated as the percentage change in the average of global exports and imports of goods and nonfactor services, both measured in real U.S. dollars. Forecasts for global exports and imports are derived from a bottom-up approach, using country-level forecasts for real exports and imports produced during the forecasting process as described above.
Economics of pandemics
Impact of COVID-19 on global income inequality
Regional macroeconomic implications of COVID-19
Lasting scars of the COVID-19 pandemic
Adding fuel to the fire: Cheap oil during the pandemic
How deep will the COVID-19 recession be?
Scenarios of possible global growth outcomes
How does informality aggravate the impact of COVID-19?
The impact of COVID-19 on global value chains
How do deep recessions affect potential output?
How do disasters affect productivity?
Reforms after the 2014-16 oil price plunge
The macroeconomic effects of pandemics and epidemics: A literature review
Informality
Inflation
How does informality aggravate the impact of COVID-19?
Growing in the shadow: Challenges of informality
Linkages between formal and informal sectors
Regional dimensions of informality: An overview
Casting a shadow: Productivity in formal and informal firms
Under the magnifying glass: How do policies affect informality?
Global stagflation
Emerging inflation pressures: Cause for alarm?
Low for how much longer? Inflation in low-income countries
Currency depreciation, inflation,and central bank independence
The great disinflation
Growth prospects
January 2022, chapter 4
June 2020, special focus
June 2020, chapter 3
June 2020,chapter 4
June 2020, box 1 1
June 2020, box 13
June 2020, box 1.4
June 2020, box SF1
June 2020, box 3 1
June 2020, box 3 2
June 2020, box 4 1
June 2020, annex 3 1
June 2020, box 1.4
January 2019, chapter 3
January 2019, box 3 1
January 2019, box 3 2
January 2019, box 3 3
January 2019, box 3.4
June 2022, special focus 1
June 2021 ,chapter 4
January 2020, special focus 2
June 2019, special focus 12
January 2019, box 1 1
From tailwinds to headwinds: Emerging and developing economies in the twenty-first century January 2025, chapter 3
Falling graduation prospects: Low-income countries in the twenty-first century
Small states: Overlapping crises, multiple challenges
Global stagflation
Global growth scenarios
The macroeconomic effects of pandemics and epidemics: A literature review
How deep will the COVID-19 recession be?
Lasting Scars of the COVID-19 Pandemic
Regional macroeconomic implications of COVID-19
Growth in low-income countries: Evolution, prospects, and policies
Long-term growth prospects: Downgraded no more?
Global output gap
Is the global economy turning the corner?
Potential growth
Global economy: Heading into a decade of disappointments?
How do deep recessions affect potential output in EMDEs?
Building solid foundations: How to promote potential growth
What is potential growth?
Understanding the recent productivity slowdown: Facts and explanations
Moving together? Investment and potential output
The long shadow of contractions over potential output
Productivity and investment growth during reforms
Cross-border spillovers
Who catches a cold when emerging markets sneeze?
Sources of the growth slowdown in BRIGS
Understanding cross-border growth spillovers
Within-region spillovers
January 2025, chapter 4
January 2023, chapter 4
June 2022, special focus 1
January 2021 , box 1.4
June 2020, annex 3 1
June 2020, box 1 1
June 2020,chapter 3
June 2020, special focus
June 2019, special focus 2 1
June 2018, box 1 1
January 2018, box 1 1
January 2021 , chapter 3
June 2020, box 3 1
January 2018, chapter 3
January 2018, box 3 1
January 2018, box 3 2
January 2018, box 3 3
January 2018, box 3.4
January 2018, box 3 5
January 2016, chapter 3
January 2016, box 3 1
January 2016, box 3 2
January 2016, box 3 3
Productivity
How do disasters affect productivity?
Fading promise: How to rekindle productivity growth
EMDE regional productivity trends and bottlenecks
Sectoral sources of productivity growth
Patterns of total factor productivity: A firm perspective
Debt, financial crises, and productivity
Investment
Forecast uncertainty
Fiscal space
Other topics
Foreign direct investment in retreat: Policies to turn the tide
Harnessing the benefits of public investment
Public investment dynamics around adverse events
Macroeconomic impacts of public investment: A literature review
The magic of investment accelerations
Sparking investment accelerations: Lessons from country case studies
Investment growth after the pandemic
Investment: Subdued prospects, strong needs
Weak investment in uncertain times: Causes, implications, and policy responses
Investment-less credit booms
Implications of rising uncertainty for investment in EMDEs
Investment slowdown in China
Interactions between public and private investment
Scenarios of possible global growth outcomes
Quantifying uncertainties in global growth forecasts
Having space and using it: Fiscal policy challenges and developing economies
Fiscal policy in low-income countries
What affects the size of fiscal multipliers?
Chile's fiscal rule-an example of success
Narrow fiscal space and the risk of a debt crisis
Revenue mobilization in South Asia: Policy challenges and recommendations
Fragile and conflict-affected situations: Intertwined crises, multiple vulnerabilities
Education demographics and global inequality
Recent developments in emerging and developing country labor markets
Linkages between China and Sub-Saharan Africa
What does weak growth mean for poverty in the future?
What does a slowdown in China mean for Latin America and the Caribbean?
Financial spillovers of rising U S interest rates
Asset purchases in emerging markets: Unconventional policies, unconventional times
The fourth wave: Rapid debt buildup
Price controls: Good intentions, bad outcomes
Low for how much longer? Inflation in low-income countries
Currency depreciation, inflation, and central bank independence
The great disinflation
Corporate debt: Financial stability and investment implications
Recent credit surge in historical context
Peg and control? The links between exchange rate regimes and capital account policies
Negative interest rates in Europe: A glance at their causes and implications
Hoping for the best, preparing for the worst: Risks around U.S. rate liftoff and policy options
Countercyclical monetary policy in emerging markets: Review and evidence June
June 2025, chapter 3 June 2024, chapter 3
2024, box 3 1 June 2024, box 3 2 January 2024, chapter 3 January 2024, box 3 1
January 2023, chapter 3
June 2019, special focus 1 1 January 2017, chapter 3 January 2017, box 3 1 January 2017, box 3 2 January 2017, box 3 3 January 2017, box 3.4 June
June 2025, chapter 4
2018, special focus 2
2015, box 1 3 June 2015, box 2 1 January 2015, box 1 1 January 2015, box 2 2
June 2023, chapter 3
January 2021 , chapter 4
January 2020, chapter 4
January 2020, special focus 1
January 2020, special focus 2
June 2019, special focus 1 2
January 2019, box 1 1
June 2018, special focus 2
June 2016, special focus 1
January 2016, chapter 4
June 2015, box 1 1
June 2015, special focus 1
January 2015, box 1 2
Fiscal challenges in small states: Weathering storms, rebuilding resilience
Fiscal policy in commodity exporters: An enduring challenge
How does procyclical fiscal policy affect output growth?
Do fiscal rules and sovereign wealth funds make a difference? Lessons from country case studies
Fiscal policy challenges in low-income countries
Resolving high debt after the pandemic: lessons from past episodes of debt relief
How has the pandemic made the fourth wave of debt more dangerous?
The fourth wave: Rapid debt buildup
Debt: No free lunch
Debt in low-income countries: Evolution, implications, and remedies
Debt dynamics in emerging market and developing economies: Time to act?
Having fiscal space and using it: FiscFal challenges in developing economies
Revenue mobilization in South Asia: Policy challenges and recommendations
Fiscal policy in low-income countries
What affects the size of fiscal multipliers?
Chile's fiscal rule-an example of success
Narrow fiscal space and the risk of a debt crisis
Russia's invasion of Ukraine: Implications for energy markets and activity
Commodity price cycles: Underlying drivers and policy options
Reforms after the 2014-16 oil price plunge
Adding fuel to the fire: Cheap oil in the pandemic
The role of major emerging markets in global commodity demand
The role of the EM? in commodity production
Commodity consumption: Implications of government policies
With the benefit of hindsight: The impact of the 2014-16 oil price collapse
From commodity discovery to production: Vulnerabilities and policies in LICs
After the commodities boom: What next for low-income countries?
Low oil prices in perspective
Understanding the plunge in oil prices: Sources and implications
What do we know about the impact of oil prices on output and inflation? A brief survey
High trade costs: causes and remedies
The impact of COVID-19 on global value chains
Poverty impact of food price shocks and policies
Arm's-length trade: A source of post-crisis trade weakness
The U S economy and the world
Potential macroeconomic implications of the Trans-Pacific Partnership Agreement
Regulatory convergence in mega-regional trade agreements
China's integration in global supply chains: Review and implications
Can remittances help promote consumption stability?
What lies behind the global trade slowdown?
June 2024, chapter 4
January 2024, chapter 4
January 2024, box 4 1
January 2024, box 4 2
June 2023, chapter 4
January 2022, special focus
January 2021, box 1 1
January 2020, chapter 4
June 2019, box 1 1
January 2019, chapter 4
June 2017, special focus 1
January 2015, chapter 3
January 2015, box 2 3
January 2015, box 3 1
January 2015, box 3 2
January 2015, box 3 3
January 2015, box 3.4
June 2022, special focus 2
January 2022, chapter 3
June 2020, box 4 1
June 2020, chapter 4
June 2018, special focus 1
June 2018, SF1 , box SF1 1
June 2018, SF1 , box SF1 2
January 2018, special focus 1
January 2016, special focus
June 2015, special focus 2
June 2015, box 1 2
January 2015, chapter 4
January 2015, box 4 1
June 2021 , chapter 3
June 2020, box SF1
January 2019, chapter 4
June 2017, Special Focus 2
January 2017, Special Focus
January 2016, chapter 4
January 2016, box 4 1 1
January 2015, box 2 1
January 2015, chapter 4
January 2015, chapter 4
Post-pandemic commodity cycles: A new era?
Commodity price synchronization: A new era?
Forecasting industrial commodity prices: An assessment
Potential near-term implications of the conflict in the Middle East for commodity markets: A preliminary assessment
Forecasting industrial commodity prices
Pandemic, war, recession: Drivers of aluminum and copper prices
The impact of the war in Ukraine on commodity markets
Urbanization and commodity demand
Causes and consequences of metal price shocks
Persistence of commodity shocks
Food price shocks: Channels and implications
The implications of tariffs for commodity markets
The changing of the guard: Shifts in industrial commodity demand
Oil exporters: Policies and challenges
Investment weakness in commodity exporters
OPEC in historical context: Commodity agreements and market fundamentals
From energy prices to food prices: Moving in tandem?
Resource development in an era of cheap commodities
Weak growth in emerging market economies: What does it imply for commodity markets?
Understanding El Niiio: What does it mean for commodity markets?
How important are China and India in global commodity consumption?
Anatomy of the last four oil price crashes
Putting the recent plunge in oil prices in perspective
Inflation: Concepts, evolution, and correlates
Understanding global inflation synchronization
Sources of inflation: Global and domestic drivers
Inflation expectations: Review and evidence
Inflation and exchange rate pass-through
Inflation in low-income countries
Poverty impact of food price shocks and policies
A decade after the global recession: Lessons and challenges
What happens during global recessions?
Macroeconomic developments
Financial market developments
Macroeconomic and financial sector policies
Prospects, risks, and vulnerabilities
Policy challenges
The role of the World Bank Group
Debt: Evolution, causes, and consequences
Benefits and costs of debt: The dose makes the poison
Global waves of debt: What goes up must come down?
The fourth wave: Ripple or tsunami?
Debt and financial crises: From euphoria to distress
Policies: Turning mistakes into experience
1
Chapter4
Chapter
Chapter6
Global productivity trends
What explains productivity growth
What happens to productivity during major adverse events?
Productivity convergence: Is anyone catching up?
Regional dimensions of productivity: Trends, explanations, and policies
Productivity: Technology, demand, and employment trade-offs
Sectoral sources of productivity growth
Overview
Understanding the informal economy: Concepts and trends
Growing apart or moving together? Synchronization of informal- and formal-economy business cycles
Lagging behind: informality and development
Informality in emerging market and developing economies: Regional dimensions
Tackling informality: Policy options
The evolution of commodity markets over the past century
Commodity demand: Drivers, outlook, and implications
The nature and drivers of commodity price cycles
Causes and consequences of industrial commodity price shocks
Potential not realized: An international database of potential growth
Regional dimensions of potential growth: Hopes and realities
The global investment slowdown: Challenges and policies
Regional dimensions of investment: Moving in the right direction?
Potential growth prospects: Risks, rewards and policies
Trade as an engine of growth: Sputtering but fixable
Services-led growth: Better prospects after the pandemic?
Introduction
Characteristics of IDA countries
Recent developments amid overlapping crises: 2020-23
Near-term growth prospects: 2024-25
Output losses, growth, convergence, and poverty
Risks to the outlook
Natural resources and demographic dividends
Investment needs and policies
Domestic policy priorities
Global support
Conclusion
Introduction
Evolution of fiscal positions in LICs
Fiscal vulnerability to shocks
Fiscal policy options in LICs
Conclusion
Chapter 1
Chapter 2
Chapter 3
Chapter4
Chapter 5
Chapter 6
Chapter 7
Chapter 1
Chapter 2
Chapter 3
Chapter4
Chapter 5
Chapter 6
Chapter 1
Chapter 2
Chapter 3
Chapter4
Chapter 1
Chapter 2
Chapter 3
Chapter4
Chapter 5
Chapter6
Chapter?
Chapter 1
Chapter 2
Chapter 3
Chapter4
Chapter 5
Chapter6
Chapter?
Chapter 8
Chapter9
Chapter 10
Chapter 11
Section 1
Section 2
Section 3
Section 4
Section 5
Environmental Benefits Statement
The World Bank Group is committed to reducing its environmental footprint. In support of this commitment, we leverage electronic publishing options and print-on-demand technology, which is located in regional hubs worldwide. Together, these initiatives enable print runs to be lowered and shipping distances decreased, resulting in reduced paper consumption, chemical use, greenhouse gas emissions, and waste.
We follow the recommended standards for paper use set by the Green Press Initiative. The majority of our books are printed on Forest Stewardship Council (FSC)-certified paper, with nearly all containing 50-100 percent recycled content. The recycled fiber in our book paper is either unbleached or bleached using totally chlorine-free (TCF), processed chlorine-free (PCF), or enhanced elemental chlorine-free (EECF) processes.
More information about the Bank’s environmental philosophy can be found at http://www.worldbank.org/corporateresponsibility.