East Asia & Pacific Economic Update
East Asia & Pacific Economic Update
Industrial Policy in the Digital Age
© 2026 International Bank for Reconstruction and Development / The World Bank 1818 H Street NW, Washington, DC 20433
Telephone: 202-473-1000; Internet: www.worldbank.org
Some rights reserved
1 2 3 4 29 28 27 26
This work is a product of the staff of The World Bank with external contributions. The findings, interpretations, and conclusions expressed in this work do not necessarily reflect the views of The World Bank, its Board of Executive Directors, or the governments they represent. The World Bank does not guarantee the accuracy, completeness, or currency of the data included in this work and does not assume responsibility for any errors, omissions, or discrepancies in the information, or liability with respect to the use of or failure to use the information, methods, processes, or conclusions set forth. The boundaries, colors, denominations, links/footnotes and other information shown in this work do not imply any judgment on the part of The World Bank concerning the legal status of any territory or the endorsement or acceptance of such boundaries. The citation of works authored by others does not mean the World Bank endorses the views expressed by those authors or the content of their works. Certain artificial intelligence (“AI”) tools may have been used in creating this work, as indicated in the work, but all transformative and creative effort expressed in the work was performed by the World Bank staff or external contributors. The World Bank is not responsible for any claims, including for errors or inaccurate information, generated by AI programs not controlled or owned by the World Bank.
Nothing herein shall constitute or be construed or considered to be a limitation upon or waiver of the privileges and immunities of The World Bank, all of which are specifically reserved.
Rights and Permissions

This work is available under the Creative Commons Attribution 3.0 IGO license (CC BY 3.0 IGO) http://creativecommons.org/ licenses/by/3.0/igo. Under the Creative Commons Attribution license, you are free to copy, distribute, transmit, and adapt this work, including for commercial purposes, under the following conditions:
Attribution—Please cite the work as follows: World Bank. 2026. Industrial Policy in the Digital Age. East Asia and Pacific Economic Update (April 2026). World Bank, Washington, DC. doi: 10.1596/978-1-4648-2327-5. License: Creative Commons Attribution CC BY 3.0 IGO.
Translations—If you create a translation of this work, please add the following disclaimer along with the attribution: This translation was not created by The World Bank and should not be considered an official World Bank translation. The World Bank shall not be liable for any content or error in this translation
Adaptations—If you create an adaptation of this work, please add the following disclaimer along with the attribution: This is an adaptation of an original work by The World Bank. Views and opinions expressed in the adaptation are the sole responsibility of the author or authors of the adaptation and are not endorsed by The World Bank
Third-party content—The World Bank does not necessarily own each component of the content contained within the work. The World Bank therefore, does not warrant that the use of any third-party-owned individual component or part contained in the work will not infringe on the rights of those third parties. The risk of claims resulting from such infringement rests solely with you. If you wish to re-use a component of the work, it is your responsibility to determine whether permission is needed for that re-use and to obtain permission from the copyright owner. Examples of components can include, but are not limited to, tables, figures, or images.
All queries on rights and licenses should be addressed to World Bank Publications, The World Bank, 1818 H Street NW, Washington, DC 20433, USA; e-mail: pubrights@worldbank.org.
ISBN (electronic): 978-1-4648-2327-5
DOI: 10.1596/978-1-4648-2327-5
Cover design: Design and Creative Services, Global Corporate Solutions, World Bank Group.
The cutoff date for the data used in the report was March 19, 2026.
O.13 Global economic policy uncertainty, especially around trade, remains elevated, and could hurt investment, employment, and quality of jobs ..................................................................................... 11
O.14 Generative AI investment is surging globally, driving investments in data center capacity across EAP 12
O.15 Exports of AI-related goods, including equipment and data center hardware, are rising across EAP 12
O.16 Early evidence suggests AI is diffusing slowly in much of EAP 13
O.17 A longer view: Capital accumulation, not productivity improvements, has driven recent growth in the region
O.18 In recent years, the share of manufacturing in GDP declined in EAP economies (other than Cambodia and Viet Nam), and the share of services in GDP increased ...................................................... 15
O.19 Firms at the national frontier in EAP countries are falling behind the global frontier, especially in digital-intensive sectors 15
O.20 Most developing EAP countries have significant deficits in human capital; China shows how the expansion of tertiary education can boost productivity 16
O.21 In EAP, services remain relatively protected; Viet Nam shows how liberalizing services can increase productivity ............................... 17
O.22 The number of new trade and industrial policy measures has increased significantly after 2020, with differences between countries in types of measures chosen .................................................. 18
O.23 Export promotion and direct transfers have positive productivity effects in the G-20 economies, but not in other emerging economies; subsidized loans can affect factor markets—leading firms to choose machines over workers 18
O.24 Direct subsidies are concentrated in relatively few firms that tend to be state owned; tax incentives are less concentrated and directed more to foreign firms .......................................................................... 19
O.25 China’s direct subsidies are associated with falling productivity, in contrast to tax incentives, which are more dispersed and correlated with productivity increases .................................................................. 19
O.26 Chinese SOEs patent more, but they are less efficient innovators, than privately owned firms 20
O.27 In the Republic of Korea, the industrial policies in the 1970s increased labor productivity of affected industries as well as welfare 20
O.28 State interventions in China’s shipbuilding industry significantly increased China’s global market share, but the costs of the interventions were greater than the benefits ......................
O.30 The Republic of Korea’s progression to the technology frontier accompanied sustained investment in the three pillars
O.31 Cloud computing data center expansion is concentrated in a few EAP countries 22
O.32 Public procurement contracts with access to government data led to Chinese AI firms developing new commercial software ...............................................................................................
O.33 Export promotion policies are more effective when implemented by more able bureaucrats .....................................................................
I.1 Overall growth in EAP is forecast to decline in 2026, but recover in 2027 in the region outside China 31
I.2 While output per capita is well above pre-COVID-19 levels in most of the larger economies, it remains below those levels in several Pacific Island Countries and Myanmar 31
I.3 Poverty rates are expected to decline further, and the share of the middle class is expected to increase........................................................ 32
I.4 Consumption supported growth but was lower than the pre-COVID-19 levels; manufacturing exports were strong across the region, while private investment surged in Malaysia and Thailand....... 33
I.5 Retail sales continue to increase, but momentum weakened in some countries in the second half of 2025; consumer confidence remains weak across EAP 34
I.6 Consumption growth is projected to remain soft in China as the impact of policy support wanes 34
I.7 Industrial production growth is strong in China but remains below pre-COVID-19 trends in the rest of EAP ..................................
I.8 Private investment as a share of GDP is below pre-COVID-19 levels across EAP, as is business confidence ..........................................
I.9 China’s growth is being dampened by slowing investment driven by continued weakness in the property sector and emerging weakness in manufacturing..................................................................
I.10 Goods exports accelerated in 2025, primarily driven by the electronics sector
I.11
I.14 Prices of commodities, such as oil and natural gas, have increased considerably since the escalation of conflict in the Middle East; oil futures are higher for the rest of 2026
I.B1.1
I.18
I.20
I.21
I.22
I.23
I.24 Increasingly stringent—still undisclosed—rules of origin could challenge Chinese input-dependent exporters in some countries and sectors
I.25 Global economic policy uncertainty, especially around trade, remains elevated, and could hurt investment and employment 50
I.26 Uncertainty abroad increases informality and lowers wages
I.27 Global private investment in generative AI has skyrocketed in recent years, and investment in data center construction is also rising in EAP.............................................................................
I.28 AI has the fastest adoption rate, and some evidence suggests we are likely in the early stages of a productivity boom ........................
I.29 EAP’s technology exports have been increasing in recent years; intermediate goods dominate AI-related trade in EAP, but trade in equipment, such as data center hardware, has increased meaningfully in recent years 53
I.30 Early evidence suggests AI is diffusing slowly in much of EAP
I.31 EAP economies show mixed AI readiness, with computing strengths offset by connectivity gaps and an underdeveloped startup ecosystem outside
I.32 Concentration risk has risen to historically high levels, with a narrow group of IT- and AI-related stocks predominantly driving
I.33 Price-to-earnings ratios in the region are low compared to the United States, but stock prices of top-large firms have significantly increased recently in China and Indonesia
I.34 Most countries in EAP expect consolidation of their fiscal policy stance
I.35 Public debt is higher than pre-COVID-19 in the majority of EAP economies, while interest payments have increased ......................
I.36 Monetary stance has been supportive as inflation
I.37 Financial conditions have improved as expectations of further US policy rate reductions have increased and sovereign spreads in EAP economies have
I.38 Real interest differentials with advanced economies increased in some EAP countries earlier in 2025 but have stabilized, leading to capital outflows in some countries
I.B2.1
I.39 EAP countries will need to address the significant structural “reform
I.40 A longer view: Capital accumulation, not productivity improvements, has driven recent growth in the region
I.41 In recent years, the share of manufacturing in GDP declined in EAP economies other than Cambodia and Viet Nam, and the share of services in GDP increased ......................................................
I.42 Firms at the national frontier in EAP countries are falling behind the global frontier, especially in digital-intensive sectors...........
II.1 The augmented Human Capital Index increased in several EAP countries; in some others, it
II.7
II.8 In Viet Nam, removing barriers to entry and competition in services increased labor productivity of services firms (+2.9 percent yearly) as well as manufacturing firms (+3.1 percent yearly)
II.9 In many EAP developing countries, non-tariff measures are higher than in advanced economies as well as higher than tariff barriers on goods .................................................................................88
II.10 Cross-border data flows are more restricted in several EAP countries than advanced economies .....................................................89
II.11 Restrictions on digital services trade are still high in several EAP countries compared to advanced economies ................................89
II.12 In the case of subsidies, the number of measures strongly correlates with the dollars spent, with an elasticity close to one............91
II.13 At the global level, the number of new trade and IP measures has increased significantly after 2020 ...................................................91
II.14 The increase in measures is common across most EAP countries; the annual average number of policies announced after 2019 vastly exceeds the pre-2019 average .....................................................92
II.15 EAP countries, except China, exhibit less new trade and IP measures than predicted by their size ...................................................92
II.16 In China, the Philippines, and Thailand, subsidies are the most prevalent form of IP measures; export incentives are prevalent in Japan and the Republic of Korea .....................................................93
II.17 The Republic of Korea uses more direct subsidies; the Philippines and Indonesia use more tax incentives .................................................94
II.18 China, Thailand, and the Philippines display a high share of firm-specific instruments .....................................................................94
II.19 Chinese subsidies are concentrated in relatively few firms ....................94
II.20 Foreign firms receive more tax incentives, whereas subsidies are directed towards state-owned firms; past recipients are much more likely to receive either measure .........................................95
II.21 Export promotion and direct transfers have positive productivity effects in the G-20 economies, but not in other emerging economies ............................................................................95
II.22 Subsidized loans can affect factor markets—leading firms to choose machines over workers .............................................................96
II.23 More generous tax incentives are associated with productivity increases, whereas direct subsidies are correlated with falling productivity 97
II.24 In the Republic of Korea, the industrial policies in the 1970’s increased output of affected industries by more than 100 percent, as well as employment and exports ......................................................97
II.B2.1 Chinese SOEs experienced a rise in patenting 2011–13, relative to pre-crisis years 2003–07 ......................................................
II.B2.2 Private firms are more efficient at turning subsidies or R&D expenses into patents .........................................................................
II.B2.3 Sectors with higher SOE subsidies, patent concentration, and incumbent patenting have lower patent quality.
II.B3.2 Impact of Subsidies on Chinese Firms’ Revenue Growth with and without Foreign AD/CVD Duty Retaliation
II.25 In the Republic of Korea, the share of subsidized credit was allocated towards sectors where the (model-computed) welfare multiplier of industrial policy was higher. .........................................
II.26 In the United Kingdom, industrial subsidies were found to increase employment, but the effects were only found in firms with less than 50 employees ..............................................................
II.27 State interventions in the China’s shipbuilding industry significantly increased China’s global market share
II.28
II.29
II.B4.1
II.B5.1
II.B6.1 Thailand outperforms comparators on broader EV value chain exports (including components used in both ICE vehicles or EVs)
II.B6.2 The impact of EV adoption on auto parts producers, by sales
II.B6.3 BEV production and sales versus national targets ..............................
II.B7.1 EVs sales reflect genuine growth but are still far below the trajectory required to meet 2030 goals...............................................
II.30
II.31
II.B8.1
II.B8.2 The Republic of Korea’s progression to the technology frontier accompanied sustained investment in the three pillars
II.B9.1 Manufacturing’s share of GDP rose from under 9 percent in 1970 to a peak of about 23 percent in 2023 ......................................
II.B9.2 Malaysia’s R&D-to-sales ratio is relatively low ...................................
II.B10.1 Foreign value-added share of gross exports ........................................
II.32 Cloud computing data center expansion is concentrated in a few EAP countries
II.33 Cloud computing data centers remain scarce in much of EAP, especially those with AI computing capability
II.34 AI models (LLMs) are developed mostly in China and the United States .....................................................................................
II.35 Chinese open-source AI models are widely used in other developing countries..........................................................................
II.36 Development of AI software is mostly in advanced economies ..........
II.B12.1 Some EAP languages are poorly covered in online data that are used to train AI models
II.37 Public procurement contracts with access to government data led to Chinese firms developing new commercial software
II.38 Chinese restrictions on rare earth exports from 2010–15 led to increased innovation in downstream sectors that relied
II.40 The benefits of further investments in energy and transport exceed their costs in almost all EAP countries ....................................
II.41 The regulatory frameworks Business-Ready scores are well below the levels expected at their level of development for many small EAP countries, especially in the Pacific.
II.42 Export promotion policies are more effective when implemented by more able bureaucrats.
IA.1 Adopting
II.B3.1
II.B6.1
II.1 EAP participates mainly in downstream semiconductor value chain activities, such as fabrication and assembly, testing, and packaging
Preface and Acknowledgments
This report is produced by the East Asia and Pacific Chief Economist’s Office, in collaboration with the Prosperity Vertical of the EAP region, the Prospects Group, the DEC Research Group, EAP IFC, and the Digital Transformation Vertical of EAP.
It was prepared by a core team comprising Omar Arias, Alessandro Barattieri, Daisuke Fukuzawa, Ergys Islamaj (Task Team Leader), Duong Le, Aaditya Mattoo, and Jonathan Timmis. Other members of the team were Nan An, Maria Laura Gonzalez Canosa, Yusha Li, Haiqin Liu, Ruth Nikijuluw, Narya Ou, Yan Wang, and Cecile Wodon.
Indermit S. Gill, Chief Economist and Senior Vice President for Development Economics; Carlos Felipe Jaramillo, Vice President of the EAP region; and Sarvesh Suri, Regional Vice President, Asia and the Pacific, provided valuable guidance and helpful comments.
Significant contributions were made by Kiatipong Ariyapruchya, Felippo Belloc, Benu Bidani, Yu Cao, Kevin C. Chua, Erwin Corong, Rodrigo Deiana, Reno Dewina, Sacha Samuel Jacques Dray, Federico Ganz Jongrim Ha, Tehmina S. Khan, Seunghan Lee, Haishi Li, Wael Mansour, David McKenzie, Paula Marie Mella Bonilla, Elitza Mileva, Thu-Ha Thi Nguyen, Ou Nie, Natsuko Kiso Nozaki, Mochamad Pasha, Pattawee Puangchit, Warunthorn Milk Puthong, Apurva Sanghi, William Hutchins Seitz, Deisigan Shammugam, Shakira Binti Teh Sharifuddin, Jose Signoret, Sailesh Tiwari, Gonzalo Varela, Ekaterine T. Vashakmadze, Marius Vismantas, Fionne Lim Jing Wen, David Stephen Knight, and Min Zhu.
We are grateful for stimulating discussions, comments, and inputs from Sharmista Appaya, Benu Bidani, Julian Casal, Marco Hernandez, Ana Margarita Fernandes, Camilla Holmemo, David Stephen Knight, Ayhan Kose, Gitanjali Kumar, Csilla Lakatos, Dara Lenkong, Yan Liu, Neni Lestari, Wael Mansour, Ilsa Meidina, Lalita M. Moorty, Elvira Morella, Zafer Mustafaoglu, Franziska
Ohnsorge, Habib Rab, Mariam Sherman, Katherine Stapleton, Marlon Rolston Rawlins, Tristan Reed, Waleed Saraf, Ilias Skamnelos, Francesco Strobbe, Carolyn Turk, Mahesh Uttamchandani, Gonzalo Varela, and Ashley Wan; the WDR 2026 “Artificial Intelligence for Development” team; and staff of the EAP region who participated in the review meetings on February 5 and March 17, 2026, and the EAP Regional Management Team meetings on March 19, 2026, and March 24, 2026. We greatly appreciate the support for dissemination provided by Geetanjali Chopra, Nansia Constantinou, Yi Gu, and Ngan Hong Nguyen.
The following staff from the EAP Fiscal Policy and Growth prepared country-specific macroeconomic outlook pages: Dwi Endah Abriningrum, Vishesh Agarwal, Sharon Faye Alariao Piza, Tanida Arayavechkit, Kiatipong Ariyapruchya, Irene Jo Arzadon, Mehwish Ashraf, Undral Batmunkh, Patrizia Secuya Benedicto, Cigdem Celik, Yew Keat Chong, Kevin C. Chua, Paul Andres Corral Rodas, Amina Coulibaly, Somneuk Davading, Reno Dewina, Jose Luis Diaz Sanchez, Dung Doan, Sacha Samuel Jacques Dray, Kim Alan Edwards, Kevin Thomas Garcia Cruz, Jun Ge, Indira Maulani Hapsari, Faya Hayati, Taufik Indrakesuma, Alexandra Jarotschkin, Tehmina S. Khan, David Stephen Knight, Fionne Lim Jing Wen, Ypsse (Lydia) Kim, Marko Kwaramba, Csilla Lakatos, Yusha Li, Maria Ana Lugo, Sodeth Ly, Kemoh Mansaray, Wael Mansour, Naomi Muthoni Mathenge, Elitza Mileva, Sandra Kapota Murray, Thi Da Myint, Darian Naidoo, Shohei Nakamura, Thu-Ha Thi Nguyen, Ruth Nikijuluw, Natsuko Kiso Nozaki, Samuel Nursamsu, Yus Medina Pakpahan, Mochamad Pasha, Remrick Espin Patagan, Keomanivone Phimmahasay, Rully Prasetya, Ririn Salwa Purnamasari, Warunthorn Puthong, Ratih Dwi Rahmadanti, Jaffar Al Rikabi, Apurva Sanghi, William Hutchins Seitz, Imam Setiawan, Deisigan Shammugam, Shakira Binti Teh Sharifuddin, Hilda Shijaku, Reshika Singh, Sutirtha Sinha Roy, Bambang Suharnoko Sjahrir, Liliana Do Couto Sousa, Tihomir Stucka, Sharad Alan Tandon, Sailesh Tiwari, Kimsun Tong, Tuimasi
Radravu Ulu, Ekaterine T. Vashakmadze, Ralph Van Doorn, Gonzalo J. Varela, Matthew Wai-Poi, Samuel Wills, and Christopher Samuel Wong.
The country-specific macroeconomic outlook was managed by Benu Bidani, Marco Hernandez, and Habib Rab. Paola Alejandra Alvarado Castillo, Andrew Burns, Alexander Haider, Kristina Catherine Tan Mercado, and Welkin Gem Mayhew Galindez made contributions to the model, table production, and assisting staff with their forecasts. Mingjie Li and Sandra Buana Sari provided production support.
Throughout the report, geographic groupings are defined as follows:
Developing East Asia and Pacific comprises Cambodia, China, Indonesia, Lao People’s Dem-
ocratic Republic (PDR), Malaysia, Mongolia, Myanmar, Papua New Guinea, the Philippines, Thailand, Timor-Leste, Viet Nam, and the Pacific Island Countries.
The Pacific Island Countries comprise Fiji, Kiribati, the Marshall Islands, the Federated States of Micronesia, Nauru, Palau, Samoa, the Solomon Islands, Tonga, Tuvalu, and Vanuatu.
The ASEAN member countries comprise Brunei Darussalam, Cambodia, Indonesia, Lao PDR, Malaysia, Myanmar, the Philippines, Singapore, Thailand, and Viet Nam.
The ASEAN-5 comprise Indonesia, Malaysia, the Philippines, Thailand, and Viet Nam.
The analysis in this report is based on the latest country-level data available as of March 19, 2026.
Executive Summary
Growth in developing East Asia and Pacific (EAP) remains above the global average but is likely to slow down from 5.0 percent in 2025 to 4.2 percent in 2026 and 4.4 percent in 2027. Underlying the regional trend is China’s continued deceleration and the negative growth effect on the rest of the region of higher energy prices. In China, growth is projected to decline from 5.0 percent in 2025 to 4.2 percent in 2026 and to 4.3 percent in 2027, as domestic demand remains subdued, the difficulties in the property sector persist, and external demand weakens. Growth in the rest of the region is projected to slow from 4.9 percent in 2025 to 4.1 percent in 2026 as the region copes with the oil price shock, and to rebound to 5.0 percent in 2027 as geopolitical tensions ease and uncertainty diminishes. Pacific Island Countries are expected to grow at about 2.8 percent in 2026 and 3.0 percent in 2027, with the increase in oil prices imposing a cost in the near term.
Private consumption continues to support growth across the region, but consumer confidence remains weak. Exports of artificial intelligence (AI)-related electronics were a bright spot in 2025, with shipments surging across Malaysia, the Philippines, Thailand, and Viet Nam, but exports of other products grew more slowly. Private investment as a share of GDP remains below pre-pandemic levels across most of the region, amid elevated policy uncertainty and recent shocks.
Three external factors are shaping the regional outlook.
• First, the conflict in the Middle East has triggered sharp energy price increases—natural gas indices are up 90 percent, and oil is up 30 percent in the immediate aftermath— which directly hurt net energy importers such as Thailand and Pacific Island Countries, where oil imports represent 5 to 13 percent of GDP. A 30 percent (US$20) increase in crude oil prices would raise inflation by 0.62 and 0.67 percentage points in the Philippines and Thailand after 6 months. Economic activity is also likely to suffer from tighter financing conditions and reduced remittances from Gulf-based workers. Hitherto resilient global growth may also suffer, especially if the conflict continues or escalates, leading to indirect effects on the region—a 1 percentage point reduction in G-7 growth can reduce developing EAP output by around 0.6 percentage points.
• Second, tariffs on exports to the United States remain above 2024 levels despite the recent US Supreme Court ruling, which reduced tariffs but also led to a narrowing of the tariff advantage of EAP countries relative to China. At the same time, US trade policies are contributing to elevated economic policy uncertainty, which inhibits investment and induces a shift toward short-term and informal employment.
• Third, the AI boom is spurring investment globally and reshaping technology supply chains. Malaysia and Viet Nam are emerging as major exporters of AI-related products, with these exports accounting for one-third of their GDP in 2025. Data center investment is also accelerating across the EAP region. In the near term, AI could lead to higher productivity growth, but diffusion in EAP remains limited because of gaps in connectivity, skills, and startup ecosystems. Only 13 percent to 17 percent of multinational subsidiaries in China and Thailand currently use AI, compared to 37 percent in the United States.
Sustaining longer-term growth in EAP will depend on reversing a structural productivity slowdown. In the past two decades, growth has been driven by capital accumulation even as improvements in productivity have declined; workers are leaving lowproductivity agriculture, not for high-productivity manufacturing but for low-productivity services; and frontier firms in the region are falling further behind the global frontier in productivity
and innovation—particularly in digital-intensive sectors.
Industrial policy is increasingly viewed by policy makers as a tool to counter these adverse effects. We take a broad view of industrial policy as remedying inadequacies in foundational public goods, like infrastructure, human capital, and institutions; addressing policy failures, such as regulatory barriers to entry and competition, that constrain the reallocation of resources toward more productive activities and dampen incentives for firms, thus slowing growth and the creation of better jobs; and addressing market failures, such as asymmetric information that limits access to credit, inadequate coordination between linked sectors, or limited investment by firms in R&D and training (since the benefits may accrue to other firms), all of which inhibit desirable economic activity in specific sectors. This special focus delves briefly into the first two pillars and then explores in some depth the third pillar drawing on original research.
Basic human capital, infrastructure, and institutions. The structural transformation and economic dynamism in China, Malaysia, Thailand and, more recently, Viet Nam are largely attributable to the state’s role in ensuring adequate foundational public goods. But progress has been uneven and gaps limit further progress. For example, Indonesia, the Philippines and even Malaysia still have many children who lack basic literacy and numeracy, while Viet Nam’s remarkable school education coexists with weak tertiary education. Rapid progress on basic infrastructure in China, Malaysia, and Thailand contrasts with big gaps in Indonesia and the Philippines, despite significant improvements. Institutions of macroeconomic management are generally robust; sectoral ministries and regulators less so. Though priorities differ, returns on further investment in these fundamental public goods far exceed costs in most countries.
Policy distortions in services, non-tariff barriers. Pervasive restrictions on trade and investment in many EAP countries limit growth potential. For example, Indonesia’s marginalization from global value chains in manufacturing can in part be attributed to the non-tariff barriers that make it
hard for exporters to import. The benefits of even partial liberalization are evident in China, Viet Nam, and, more recently, the Philippines. In Viet Nam, the liberalization of telecommunications, finance, and other services on the altar of WTO accession produced significant productivity gains not just in these sectors but also in the manufacturing sectors that use these services. Advancing services reform may well be the most effective and efficient industrial policy.
Targeted interventions can complement—but not substitute for—the enabling framework created by addressing the first two pillars described above. Targeted support, in the form of subsidies, tax exemptions, trade measures, etc., is rising globally and in the EAP region. Export promotion and direct transfers to firms are positively correlated with productivity in the G-20 economies, but not in other emerging economies, suggesting that stronger institutions are a precondition for successful intervention. Furthermore, in both types of countries, subsidized loans can affect input choices—leading firms to substitute machines for workers.
Targeted policy needs to be not just effective but also efficient. Recent research shows an interesting contrast between the Republic of Korea’s promotion of heavy manufacturing industries in the 1970s, which has been found to be both effective and efficient, and the more recent case of China’s interventions in the shipbuilding sector, which have been found to be highly effective, but mostly inefficient (i.e., costs of providing support exceeded their benefits).
The AI value chain illustrates how the three pillars of industrial policy can work in tandem. While several countries are introducing financial and energy incentives to attract data centers, infrastructure quality and administrative efficiency can remain binding constraints. Much can be learned from the Republic of Korea’s remarkable progress in semiconductors. In the first stage, the state attracted foreign capital and technology by offering a workforce with sound basic education and reasonable infrastructure, as well as legal certainty and tax exemptions. In the second stage,
greater engagement by domestic firms was facilitated by offering cheap finance. And in the third stage, domestic innovation was encouraged by the state through support for R&D and coordination between dominant firms.
While domestic firms in Malaysia and Thailand have succeeded in participating in global value chains in semiconductors, the sector remains dominated by foreign firms in Viet Nam. Very few Southeast Asian firms have succeeded in emulating Korean firms in innovative activity. In this respect, the innovative activity of China’s firms stands out. Here, state support has helped. For example, public procurement contracts with access to government data led to Chinese AI firms developing new commercial software.
The overarching policy message is ideally to prioritize foundations and address policy failures before considering targeted interventions. In fact, the effectiveness of the third pillar is likely to depend on the implementation of the first two. The success
of new export promotion policies in Korea, for instance, hinged crucially on prior policy reform and the quality of public institutions as reflected in the technical and managerial capacity of bureaucrats. Since economywide improvements in the first two pillars may be hard to accomplish in the near term, countries have initially created special economic zones (SEZs). These zones are demarcated areas within a country that typically offer investors better infrastructure, a streamlined regulatory and administrative regime, and a favorable fiscal regime. Where successful, as in the East coast of China, SEZs have become growth poles whose scope and development impact gradually expanded.
Targeted support can facilitate investment but creates fiscal and rent-seeking risks. It must therefore include sunset clauses, transparent reporting, and strict performance benchmarks. Policy makers should prioritize instruments that closely target market failures, ensuring support that fosters competition and local spillovers rather than serving to entrench incumbents.
Abbreviations
3mma 3-Month Moving Average
4qma 4-Quarter Moving Average
6mma 6-Month Moving Average
12mma 12-Month Moving Average
AAPL Apple
AD Anti-Dumping
AEs Advanced Economies
AI Artificial Intelligence
AIKOD AI Knowledge on Demand (OECD database)
AMZN Amazon
APO Asian Productivity Organization
ASEAN Association of Southeast Asian Nations
ASEAN-5 ASEAN 5 (Indonesia, Malaysia, Philippines, Thailand, Viet Nam)
ATP Assembly, Testing & Packaging (semiconductor industry)
AWS Amazon Web Services
BACI International Trade Database at the CEPII
BEVs Battery Electric Vehicles
BIS Bank for International Settlements
BOI Board of Investment (Thailand)
BoP Balance of Payments
CBU Completely Built-Up
CCDR Country Climate and Development Report
CDBP Consolidated Distance to Breakpoint
CEIC CEIC Data
CHIPS Creating Helpful Incentives to Produce Semiconductors (US Act)
CKD Completely Knocked-Down
CPC Central Product Classification
CPI Consumer Price Index
CREATE MORE CREATE Maximizing Opportunities for Reinvigorating the Economy (Philippines)
CREATE Corporate Recovery and Tax Incentives for Enterprises Act (Philippines)
CSET Center for Security and Emerging Technology
CSI Corporate Subsidy Inventory
CVD Countervailing Duty
DESAC Digital Ecosystem Acceleration Scheme (Malaysia)
DOSM Department of Statistics Malaysia
DRAM Dynamic Random-Access Memory
DSTRI Digital Services Trade Restrictiveness Index
E&E Electronics and Electrical (manufacturing)
EBET Enterprise-Based Education and Training
EEC Eastern Economic Corridor (Thailand)
EMDEs Emerging Market and Developing Economies
ETRI Electronics and Telecommunications Research Institute (Republic of Korea)
EV Electric Vehicle
FATF Financial Action Task Force
FDI Foreign Direct Investment
Fed Federal Reserve (US central bank)
FIZs Free Industrial Zones
FOMC Federal Open Market Committee
G20 Group of Twenty
G7 Group of Seven
GDP Gross Domestic Product
GDPR General Data Protection Regulation (EU)
GNI Gross National Income
GOOGL Google
GPT Generative Pre-trained Transformer
GPU Graphics Processing Unit
GTA Global Trade Alert
GW Gigawatt
HAI Human-Centered Artificial Intelligence (Stanford)
HCI Human Capital Index
HHI Herfindahl-Hirschman Index
HS Harmonized System (customs codes)
IBRD International Bank for Reconstruction and Development
ICT Information and Communication Technology
IEEPA International Emergency Economic Powers Act (US)
IIF Institute of International Finance
IMF International Monetary Fund
IP Industrial Policy
ISIC International Standard Industrial Classification
IT Information Technology
ITU International Telecommunication Union
JCI Jakarta Stock Exchange
KIET Korea Institute of Electronics Technology (Republic of Korea)
LCMB Low Carbon Mobility Blueprint (Malaysia)
LFS Labor Force Survey
LLM Large Language Model
LMWs Licensed Manufacturing Warehouses
LNG Liquefied Natural Gas
MAA Malaysian Automotive Association
MDS Malaysia Digital Status
MIDA Malaysian Investment Development Authority
MiT Made-in-Thailand
MITI Ministry of International Trade and Industry (Malaysia)
MSCI Morgan Stanley Capital International
MSFT Microsoft
MW Megawatt
NBS National Bureau of Statistics (China)
NCD Non-Communicable Diseases
NETR National Energy Transition Roadmap (Malaysia)
NIMP New Industrial Master Plan (Malaysia)
NIPO New Industrial Policy Observatory
NPI Nickel Pig Iron
NPL Non-Performing Loan
NTMs Non-Tariff Measures
OECD Organisation for Economic Co-operation and Development
OLS Ordinary Least Squares (regression)
P/E
Price-to-Earnings (ratio)
PC Personal Computer
PEZA Philippine Economic Zone Authority
PHC Primary Health Care
PHEVs Plug-in Hybrid Electric Vehicles
PIC-11 Pacific Island Countries (11 countries)
PPI Producer Price Index
PPP Purchasing Power Parity
PSA Public Services Act (Philippines)
Q Quarter
Q/Q, Y/Y Quarter-on-Quarter, Year-on-Year
R&D Research and Development
REE Rare Earth Elements
RoW Rest of the World
SCM Subsidies and Countervailing Measures (WTO Agreement)
SEA-6 Southeast Asia 6 countries
SIPP Strategic Investment Priorities Plan (Philippines)
SLMs Small Language Models
SMEs Small and Medium Enterprises
SOEs State-Owned Enterprises
SPX S&P 500 Index
STA State Taxation Administration (China)
STEM Science, Technology, Engineering, and Mathematics
STRI Services Trade Restrictiveness Index (WTO-WB)
TFP Total Factor Productivity
TSLA Tesla
TSMC Taiwan Semiconductor Manufacturing Company (Taiwan, China)
TTF Title Transfer Facility
TTM Trailing Twelve Months
TVET Technical and Vocational Training
UNCTAD United Nations Conference on Trade and Development
USD United States Dollar
VAR Vector Autoregression
VAT Value-Added Tax
VLSI Very Large Scale Integration
WDI World Development Indicators
WEO World Economic Outlook (IMF)
WGI Worldwide Governance Indicators
WITS
World Integrated Trade Solution
WTO World Trade Organization
Regions—World Bank Classification and Country Groups
EAP East Asia and Pacific
ECA Eastern Europe and Central Asia
LAC Latin America and the Caribbean
MNA Middle East, North Africa, Afghanistan, and Pakistan
SAR South Asia
SSA Sub-Saharan Africa
Country/Economy Abbreviations
CHN China
EU European Union
FJI Fiji
FSM Federated States of Micronesia
HKG Hong Kong SAR, China
IDN Indonesia
JPN Japan
KHM Cambodia
KIR Kiribati
KOR Republic of Korea
LAO Lao People’s Democratic Republic
MNG Mongolia
MMR Myanmar
MYS Malaysia
NRU Nauru
PHL Philippines
PICs Pacific Island Countries
PLW Palau
PNG Papua New Guinea
RMI Republic of the Marshall Islands
SLB Solomon Islands
THA Thailand
TLS Timor-Leste
TON Tonga
TUV Tuvalu
TWN Taiwan, China
UK United Kingdom
USA / US United States
VNM Viet Nam
VUT Vanuatu
WSM Samoa
Currency Units
CR Cambodian riel
D Vietnamese dong
F$ Fiji dollar
K Myanmar kyat
K Papua New Guinea kina
Kip Lao kip
P Philippine peso
RM Malaysian ringgit
RMB Chinese renminbi
Rp Indonesian rupiah
THB Thai baht
SI$ Solomon Islands dollar
Tog Mongolian tugrik
US$ Timor-Leste (US dollar)
US$/USD United States dollar





















Industrial Policy in the Digital Age
Overview
I. Recent developments
and outlook
Projected growth
Growth in developing East Asia and Pacific (EAP) remains above the global average but is likely to slow down from 5.0 percent in 2025 to 4.2 percent in 2026 and to 4.4 percent in 2027. Underlying the regional trend is China’s continued deceleration and the negative growth effect of higher energy prices on the rest of the region, which relies significantly on oil imports from the Middle East. In China, growth is projected to decline from 5.0 percent to 4.2 percent in 2026 and to 4.3 percent in 2027 as domestic demand remains subdued, the difficulties in the property sector persist, and external demand weakens. The rest of the region is likely to see growth slowing from 4.9 percent to 4.1 percent in 2026 before rebounding to 5.0 percent in 2027 as geopolitical tensions ease, uncertainty diminishes and external demand recovers. Pacific Island Countries are expected to grow at about 2.8 percent in 2026 and 3.0 percent in 2027, with the increase in oil prices imposing a cost in the near term (figure O.1; table O.2).
Consumption, investment, and exports
Private consumption has supported growth in all major economies in 2025, although its contribution has remained below prepandemic levels in China, Malaysia, and the Philippines (figure O.2). Manufacturing exports have boosted growth across the region, driven by strong demand for AI-related electronics, front-loading ahead of tariff increases, and value-chain reallocations in favor of the region. Meanwhile, the contribution of services exports has narrowed in most economies, with Malaysia a notable exception. Public investment has supported growth in China and Indonesia, while private investment has been a significant driver in Malaysia, buoyed by new investments in data centers.
Consumption
Private consumption continues to serve as a primary growth engine for most economies in the region, yet underlying dynamics reveal fragility. Consumer confidence indexes across the region are at only about 80 percent of their prepandemic baselines. In China, consumer spending has remained cautious
Source: world Bank.
FIGURE O.1 Overall growth in EAP is forecast to decline in 2026 but recover in 2027 in the region outside China.
FIGURE O.2 Consumption supported growth but was lower than the prepandemic levels; manufacturing exports were strong across the region, while private investment surged in Malaysia and Thailand.
Sources: Haver Analytics; world Bank.
Note: The dark blue bar for China denotes total final consumption and includes household and government consumption. Share of private and public investment is estimated for China, indonesia, and the Philippines. Share of commodity and manufacturing exports are estimated from balance of payments statistics. Q = quarter.
FIGURE O.3 Consumer confidence remains weak across the region; in China, the impact of consumption subsidies is fading.
Source: Haver Analytics.
Note: 3mma = 3-month moving average; y/y = year-over-year.
A. The blue line shows the median of China, indonesia, the Philippines, and Thailand. Gray area shows 25th to 75th percentile range. retail sales of Thailand is calculated by the average of durable goods and nondurable goods.
amid a soft labor market and a weak housing market (figure O.3). Accommodative policies lifted final consumption growth to 4.6 percent year over year in 2025 from 3.9 percent in 2024, although the boost from consumer subsidies began to fade in the second half of 2025.
Investment
Strong manufacturing performance in selected sectors notwithstanding, private investment as a share of GDP remains below prepandemic levels across developing EAP (figure O.4). Similarly, regional
Sources: Haver Analytics; world Bank.
Note: B. Blue line shows the median of China, Indonesia, Malaysia, the Philippines, and Thailand. Gray area shows 25th–75th percentile range. 3-month moving average.
FIGURE O.5 Goods exports accelerated in 2025, primarily driven by the electronics sector.
Source: Haver Analytics.
Note: 3mma = 3-month moving average; EAP = East Asia and Pacific; y/y = year-over-year.
business confidence remains below prepandemic baselines, partly because of elevated economic policy uncertainty, both domestically and globally. During periods of heightened uncertainty firms adopt a “wait-and-see” attitude, delaying or scaling back capital expenditures (World Bank 2025a).
Exports
In 2025, goods exports across East Asia showed generally positive trends, but the growth has
moderated in the recent months, especially in Indonesia (figure O.5). The 2025 rally was supported by a global cyclical upswing in technology demand. Electronics export growth outpaced nonelectronics categories; for example, electronics shipments surged by roughly 32 percent in Thailand, 28 percent in Viet Nam, and 17 percent in the Philippines, compared to 8 percent, 11 percent, and 13 percent in nonelectronic exports, respectively. Furthermore, Malaysia’s 18 percent jump in electronics effectively offset nonelectronic contractions.
FIGURE O.4 Private investment as a share of GDP is below prepandemic levels across the region, as is business confidence.
Index: 2019 Dec. = 100
Business confidence
Growth of electronics exports and others
Factors affecting growth
Economic performance across EAP countries is shaped by both external and domestic factors. External factors include: geopolitical tensions, more recently the conflict in the Middle East; trade restrictions, particularly the escalation of tariffs and nontariff barriers, as well as the associated global economic policy uncertainty; the ongoing AI boom, which is immediately reshaping global technology supply chains and creating new opportunities for electronics and semiconductor exporters, and could in the near term lead to higher productivity growth as well as labor market disruptions. Domestic factors include the macroeconomic policy response to these shocks and structural reforms that support growth (figure O.6).
External factors
Geopolitical tensions
The conflict in the Middle East since February 28 has triggered a significant global energy price shock. Natural gas benchmark indices surged 90 percent, and crude oil prices rose over 30 percent in the immediate aftermath, and oil futures shifted upward, reflecting supply reductions (figure O.7). The region is also a major supplier of fertilizers, aluminum, and petrochemicals, with Qatar and Saudi Arabia together accounting for over 10 percent of global nitrogen fertilizer exports.
The conflict can affect EAP economies through multiple channels (figure O.8). First, higher energy,
fertilizer, and food prices raise production costs across the region. Second, supply chain disruptions— through production interruptions, maritime chokepoint pressures, and elevated transport costs—disrupt production.1 Third, tighter financing conditions may emerge as investor flight to safety raises borrowing costs. Fourth, slower global growth, due to heightened uncertainty and weaker consumer and investor sentiment, could reduce external demand for the region’s exports. Finally, reduced remittances from Gulf-based workers and higher food and energy costs would compress real incomes, weighing disproportionately on poor households and widening inequality.
The impact on EAP countries will depend on their exposure to the oil shock, the extent of their vulnerability, and the policy space to respond (figure O.9; table O.1).
Exposure: EAP economies are directly exposed through their dependence on energy imports. Pacific Island nations and major importers like the Lao People’s Democratic Republic, Mongolia, and Thailand—where oil imports represent 5 to 13 percent of GDP—face the greatest burden, as higher energy prices compress household purchasing power and raise industrial input costs. In contrast, Malaysia and Papua New Guinea, as net exporters of oil and gas, stand to benefit from improved terms of trade.
Vulnerability: Vulnerability of economies to external shocks arises from inadequate energy buffers, high external financing needs, and fragile price stability. Most developing EAP economies fall short of the IEA’s 90-day strategic petroleum reserve benchmark; Cambodia, Indonesia, and Viet Nam hold only 1 to 2 months of coverage, whereas China and Thailand align more closely to the standard. Mongolia and Timor-Leste are more vulnerable macroeconomically, with external financing needs around 40 percent of GDP. External financing needs are also high in Malaysia, driven by private short-term debt, such as trade credits and banking sector flows. Furthermore, elevated baseline inflation constrains the monetary policy space to
1One-fifth of global oil and liquefied natural gas (LNG) transits the Strait of Hormuz without viable alternative routes.
FIGURE O.6 External factors affecting economic performance in EAP countries.
O.7
Sources: Bloomberg; world Bank.
Notes:
A. Daily Brent prices, and ICE Dutch TTF gas price. Last observation is March 12, 2026.
B. Futures curve for May 2026 contract onwards. Last observation is March 17, 2026.
FIGURE O.8 Conflict in the Middle East can affect EAP economies through multiple channels.
respond to new shocks in Myanmar (~20 percent), Lao PDR, and Mongolia (>6 percent), contrasting sharply with the flexibility afforded by subdued or negative inflation in China and Thailand.
Policy space: The impact of the energy price shock will vary across EAP economies depending also on their capacity to respond. Among the most vulnerable are Pacific Island nations—including Fiji, the Federated States of Micronesia, Tonga, and Vanuatu—alongside continental importers like Thailand and Mongolia, which face significant trade balance pressures, limited fiscal buffers and, in the case of the Pacific Islands, low debt-carrying capacity. Lao PDR, China (at the local level), and Thailand are particularly constrained, with high government debt and limited fiscal space. By contrast, economies with stronger buffers— including Cambodia, Viet Nam, and Indonesia— have greater capacity to absorb the shock through strategic reserves, domestic refining capacity, or
FIGURE O.9 Exposure, vulnerability, and policy space determine the impact of geopolitical tensions on EAP economies.
world Bank.
commodity export revenues that provide a natural hedge. On monetary policy, central banks with well-anchored inflation expectations can afford to accommodate energy supply shocks—but a severe or sustained price increase that threatens to dislodge expectations may warrant a shift toward a less
Source:
TABLE O.1 EAP countries differ in exposure, vulnerability, and policy space
Sources: BACI; Haver Analytics; IMF; world Bank.
Note: Color scale represents country quantiles relative to the group of EMDEs. Color coding of the general government debt for PICs is based on the risk of external debt distress in the latest debt sustainability analysis. EMDE = emerging market and developing economies.
accommodative stance, particularly in economies where inflation is already elevated.
Assessing policy space in Pacific Island Countries requires looking beyond conventional debt-to-GDP ratios, as even countries with relatively low gross debt levels face high risk of debt distress—including Kiribati, Tonga, and Tuvalu. This reflects the Island economies’ structurally limited debt-carrying capacity, itself a product of narrow export bases, high
import dependence, and vulnerability to external shocks. Limited access to commercial borrowing and underdeveloped social transfer systems further constrain the ability of Pacific governments to cushion households from shocks such as rising energy prices, making their effective policy space considerably more restricted than headline debt figures suggest.
Higher oil prices transmit to inflation through two channels: directly, via fuel and energy costs, and
Source: world Bank.
Note: Bars show annualized percentage point increase in inflation after 6 months for a US$20 increase in crude oil prices, based on current oil futures for 2026. Bayesian hierarchical panel vAR estimated monthly over 2000–25 with 8 lags. Shaded bands denote 68 percent posterior intervals.
indirectly, as higher input costs for transportation, manufacturing, and agriculture ripple through supply chains, compressing household purchasing power and firm margins. A US$20 increase in crude oil prices would raise inflation by 0.67 and 0.62 percentage points in Thailand and the Philippines after 6 months—among the more exposed economies given their reliance on imported oil (figure O.10). Malaysia and Indonesia show more moderate responses, cushioned by subsidies and administered pricing, while China is least affected at 0.22 percentage points, reflecting ample oil reserves. The drag on industrial production follows the same pattern, with Thailand and the Philippines most affected and China the most resilient.
The welfare impact of imported inflation is notably regressive; household expenditure data from the Philippines, for instance, demonstrate that lowerincome quintiles allocate a disproportionately larger share of their total consumption to fuel and related transport costs, rendering them highly vulnerable to energy price shocks. Across the region, a sustained 50 percent increase in fuel prices could lead to a 3–4 percent loss in income for households in the region through both direct and indirect effects. In addition, an escalation of the conflict is likely to increase food insecurity (World Food Programme 2026).
In addition to these direct effects, the conflict in the Middle East could have an indirect impact on the region through its effect on global economic activity. A sustained 10 percent increase in oil prices is associated with a reduction in annual global growth of roughly 0.1 percentage point (Lebrand et al. 2024). A prolonged and more intense conflict could significantly reduce global growth. As the scale of disruptions increases, additional channels may emerge. For instance, a prolonged shutdown of Middle East shipping routes could disrupt production in energy-intensive industries, reducing output and triggering broader supply chain disruptions. Some pessimistic scenarios also involve a substantial tightening of global financial conditions, due to higher inflation and mounting risk aversion, generating stronger headwinds to growth.
So far, global growth has been resilient and global financial markets relatively stable. But slower growth in the rest of the world, more likely if the conflict is prolonged, would exert a significant negative impact on developing EAP. A 1 percentage point decrease in G-7 growth is estimated to lower output growth in developing EAP by about 0.6 percentage points within the following year (figure O.11). In addition, China’s growth is projected to decline. A 1 percentage point decline in FIGURE
A. Inflation response to a US$20 increase in crude oil prices
B. Industrial production response to a US$20 increase in crude oil prices
China’s growth is estimated to reduce growth in the rest of developing EAP by 0.3 percentage points, underscoring China’s significant influence on economic activity across the region.
Trade restrictions and economic policy uncertainty
Tariffs on exports to the United States remain above 2024 levels despite the US Supreme Court
O.11
Source: world Bank.
Note: EAP = East Asia and Pacific.
B. Figure shows the impact of one percentage point increase in G-7 and China growth. Effects estimated using a structural Bayesian vAR model that includes the following variables: US monetary policy reaction shock, US real GDP growth, China real GDP growth, commodity weighted prices for recipient country, recipient country real GDP growth, and recipient country exchange rate to the US dollar. EAP countries included in the estimation are Indonesia, Malaysia, the Philippines, and Thailand. The models are estimated from 2000Q1 to 2022Q4, except in Malaysia which starts in 2005Q1.
ruling on the tariffs imposed under the International Emergency Economic Powers Act (IEEPA) (figure O.12A). The so-called “reciprocal” tariffs were quickly replaced with a global 10% tariff imposed under Section 122. This tariff is a provisional measure lasting until July 2026. Importantly, also the US tariffs on imports from China are now overall lower, which implies that the tariff differential between US tariffs applied to China and those applied to EAP economies has narrowed for most countries compared to end-2025 levels, although it remains above year-ago levels (figure O.12B).
Micro simulations show the expected negative effects of tariffs on real income for several EAP countries under three different scenarios: (1) the US protection level as of February 7, that is, before the pronouncement of the US Supreme Court; (2) the US protection level without the International Emergency Economic Powers Act (IEEPA) tariffs but before the imposition of the global 10 percent tariff; and (3) the current scenario. Not surprisingly, the countries most exposed to the potential negative effects of the US tariffs are Cambodia, Thailand, and Viet Nam.
Economic policy uncertainty—particularly regarding trade policy—remains elevated, which can negatively affect the region’s economic activity. Uncertainty weighs on investment and employment across EAP, as firms adopt a “wait-and-see” approach, delaying capital expenditures and prioritizing
FIGURE O.12 US tariffs have increased for all EAP countries, but the differential vis-à-vis China is now lower than at the end of 2025.
Impact on Real Income, different US
Source: world Bank.
Note: EAP = East Asia and Pacific; Feb = February.
FIGURE
Slower growth in the rest of the world will negatively affect growth in developing East Asia.
Percentage points
Estimates of impacts of a 1 percentage point G-7 and China growth shocks to EAP
FIGURE O.13 Global economic policy uncertainty, especially around trade, remains elevated, and could
Sources: Caldara et al. 2020; Ha et al. 2026; authors’ estimates using viet Nam’s LFS 2011–23.
Note: OLS = ordinary least squares; RHS = right-hand side.
A. Trade policy uncertainty index tracks frequency of uncertainty-related articles in major English-language newspapers, normalized so that 1 equals the 2000–15 average.
B. Firm quarterly panel OLS regression. Sample covers listed firms in Indonesia, Malaysia, the Philippines, Thailand, and viet Nam, 2000–24.
C. Sector-level local projection estimates of labor market outcomes on external trade-weighted uncertainty. Dots show responses to a one-sector-standard-deviation increase in uncertainty abroad; bars are 95 percent confidence intervals clustered at the sector level. Blue lines control for trade-weighted external growth; red lines additionally control for sector trade volumes. X axis shows numbers of years ahead.
liquidity; evidence from firms in the region shows that a one-standard-deviation increase in external policy uncertainty significantly reduces investment growth and slows hiring, with effects transmitted through production networks (figure O.13). Further, evidence from Viet Nam shows that spikes in global uncertainty negatively affect the quality of jobs in the region, raising the likelihood of workers being in temporary contracts and depressing wages.
AI boom
The rise of AI holds potential to drive growth across EAP, but realization depends on whether AI delivers broad-based productivity gains globally, and how effectively EAP economies absorb these gains given varying infrastructure, human capital, and institutional capacity. Global private investment in generative AI has surged from near zero in 2019 to US$34 billion in 2024, translating into rapid data center buildout across EAP (figure O.14). Malaysia leads with roughly 700 megawatts (MW) operational and a pipeline exceeding 3,000 MW; Indonesia and Thailand are also seeing significant investment.
AI-related exports have expanded rapidly across several EAP economies in recent years (figure O.15).
Intermediate goods—particularly semiconductors— remain the backbone of AI-related trade across the region, although equipment exports such as data center hardware have grown meaningfully. Viet Nam and Malaysia stand out, with AI export shares rising from around 20 and 28 percent of GDP in 2023 to approximately 32 and 34 percent by 2025, respectively—among the highest shares globally. Thailand also shows a meaningful increase in AI exports over the period, rising from around 12 to 16 percent of GDP. By contrast, Indonesia’s AI export share remains negligible, and the Philippines shows a modest decline. These shares dwarf those of major advanced economies, where AI export shares range from around 2 percent of GDP for the United States and the EU to 4 percent for Japan.
Early evidence suggests that AI is diffusing slowly across EAP, although assessing the true pace of adoption is complicated by the absence of a universal or consistent measure of AI use (figure O.16). What evidence does exist points to a region that remains in the early stages of AI diffusion: Only about 13–17 percent of multinational enterprise subsidiaries in China and Thailand use AI, compared to 37 percent in the United States, and AI adoption is heavily concentrated among multinationals,
FIGURE O.14 Generative AI investment is surging globally, driving investments in data center capacity across EAP.
Data center capacity in EAP (2025Q2)
Source: Quid 2025; Cushman and wakefield 2025. Note: AI = artificial intelligence; EAP = East Asia and Pacific.
FIGURE O.15 Exports of AI-related goods, including equipment and data center hardware, are rising across EAP.
Source: world Bank calculations based on world Trade Report 2025.
Note: AI-related exports follow the wTO (2025) classification of AI-enabling products covering raw materials, processed chemicals, intermediate inputs, and equipment. The left-hand scale shows total AI and non-AI exports as a percent of GDP. The right-hand scale shows the two largest AI components separately: intermediate inputs (e.g., processors, integrated circuits, semiconductor wafers) and equipment (e.g., semiconductor manufacturing machinery). See wTO (2025), Annex A, for the full product list. AI = artificial intelligence; RHS = right-hand side.
with domestic firms lagging well behind. Moreover, the share of EAP jobs involving tasks that are complementary to AI—and thus positioned to benefit from it—is only about 10 percent, compared to 30 percent in advanced economies, reflecting the region’s higher concentration of employment in agriculture and routine manual occupations. Taken together, these patterns suggest that while AI
FIGURE O.16 Early evidence suggests AI is diffusing slowly in much of EAP.
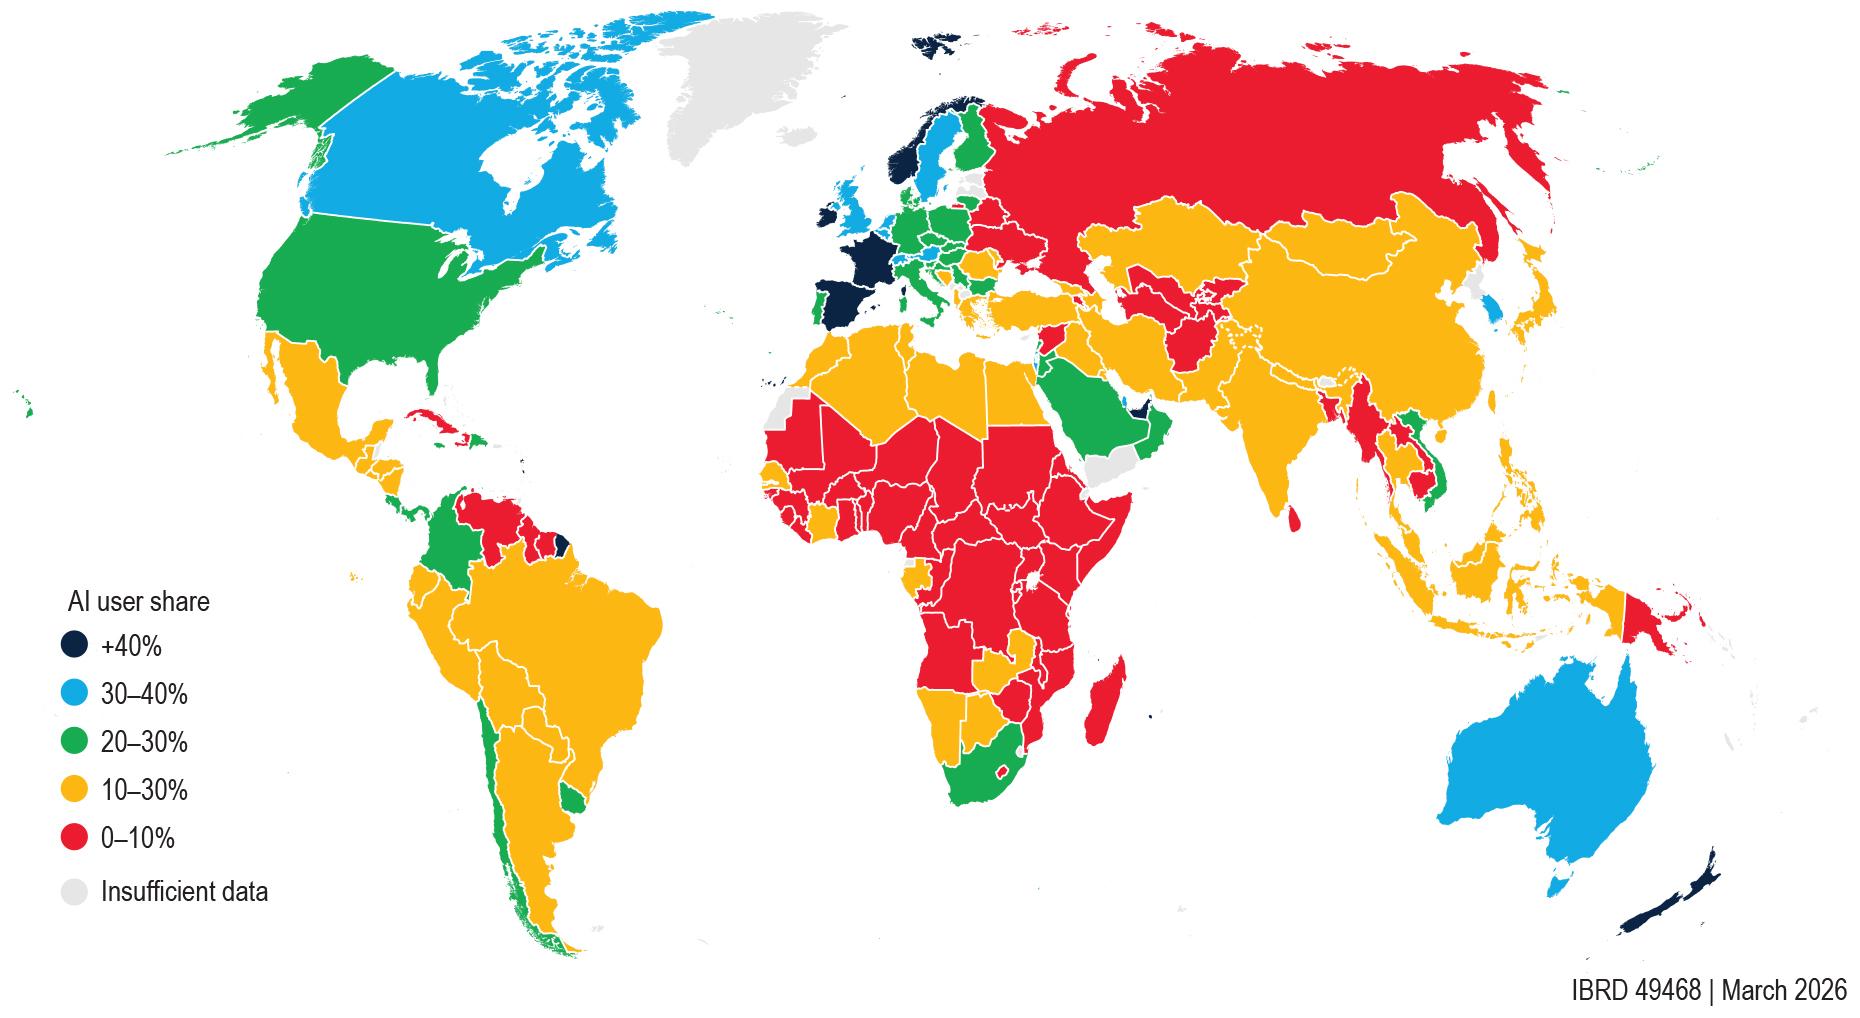
Source: Microsoft.
Note: AI = artificial intelligence; EAP = East Asia and Pacific.
investment is flowing into the region, its diffusion into the broader economy remains nascent.
Domestic policy
Macroeconomic policy
The oil price shock confronts the regional policy makers with the challenge of dealing with the twin threats of inflation and growth deceleration. The challenge is most evident in the case of monetary policy. The supply-side energy price shock may merit “looking through” rather than “overreacting” unless it leads to expectations of higher inflation and therefore to higher nominal wages and prices of other inputs.2 In the latter case, if the authorities seek to contain inflation by increasing interest rates, there would be an adverse impact on already-slowing growth. In economies such as Lao PDR, Mongolia and, especially, Myanmar and Tuvalu, where inflation is already relatively high and expectations are less strongly anchored, a prolonged commodity price shock may necessitate a less accommodative stance. Even where inflation is
2https://www.ft.com/content/e70ea434-f585-4271-bb75-7265b3f02a 37?syn-25a6b1a6=1.
relatively low, as in Indonesia and the Philippines, close monitoring remains warranted, as a sustained shock could dislodge inflation expectations.
On the fiscal side, if the government seeks to protect households (or firms) from the price shock by providing energy subsidies, the resulting higher deficits could also lead to increased borrowing and debt, which could result in higher interest rates that inhibit investment and growth. These risks are particularly acute in economies with already-elevated debt levels and limited fiscal space. Lao PDR faces debt sustainability concerns, while several Pacific Island Countries are constrained by small revenue bases and dependence on external financing, leaving little room to absorb additional spending pressures without risking unsustainable fiscal positions. Given the difficult trade-off, better-targeted support—for both the poor and the vulnerable in the middle class—can help those most in need at a more reasonable fiscal cost.
Structural reforms
Even in a difficult external environment, EAP countries can forge a dynamic path. But supporting near term growth through fiscal measures may deliver less
durable development benefits than deeper domestic reforms.
Growth in some EAP countries is relatively high, but measures to sustain growth today may not be conducive to growth tomorrow. In China and Indonesia, for example, current growth (of about 5 percent per annum) exceeds estimates of potential growth largely thanks to government support. In both countries, reforms, such as addressing nontariff barriers, especially in services, as well as deregulation and business licensing simplification (in the case of Indonesia), could enhance potential growth and productive job creation.
In other countries, recent structural reforms are likely to improve economic efficiency and support growth. For instance, the Philippines has opened key sectors to greater competition—including logistics, telecoms and renewable energy—and is seeking to build the capabilities of the labor force through the newly enacted Enterprise-Based Education and Training (EBET) framework. Viet Nam, too, has launched a wave of institutional reforms aimed at creating a more efficient state. In late 2024, the government began significant bureaucratic restructuring, reducing ministries and agencies, consolidating local governments (reducing provinces from 63 to 34 and removing district-level governments); streamlining public employees (reducing staff by
20 percent or at least 100,000 employees over 5 years); and reforms such as the new Land Law, State Budget Law, and streamlined business services to improve the investment climate. In both countries, improved economic performance will depend on the implementation of the reforms.
A longer view
A longer-run perspective reveals structural growth challenges across the region. In EAP excluding China, capital accumulation has driven growth for decades, but TFP contributions have declined sharply—from 1.3 percentage points in 2000–05 to near zero in 2010–15—and the contribution of labor has diminished as populations age (figure O.17). China has relied more on TFP and ICT-related investment, though both have slowed, and a shrinking labor force now subtracts from output growth. As returns to capital accumulation diminish, sustaining growth will increasingly depend on productivity gains that have so far remained elusive.
Two structural factors help explain the productivity slowdown. First, the pattern of sectoral change has shifted: manufacturing’s share of GDP—a high-productivity sector—rose across the region through the early 2000s but has declined since, limiting the scope for productivity gains through
Source: APO. Note:
FIGURE O.17 A longer view: Capital accumulation, not productivity improvements, has driven recent growth in the region outside China.
FIGURE O.18 In recent years, the share of manufacturing in GDP declined in EAP economies (other than Cambodia and Viet Nam), and the share of services in GDP increased.
Agriculture
Source: wDI.
Note: Advanced Asia includes Japan, the Republic of Korea, and Singapore. Country groups exclude those with less than 1 million population. EAP = East Asia and Pacific; EMDE = emerging market and developing economies.
FIGURE O.19 Firms at the national frontier in EAP countries are falling behind the global frontier, especially in digital-intensive sectors.
A. Distance between national and global frontier, digital-intensive sectors
Index (First year = 0)
VNM—Manufacturing MYS—Manufacturing CHN—Manufacturing IDN—Manufacturing PHL—Manufacturing PHL—Services
B. Distance between national and global frontier, less digital-intensive sectors
Index (First year = 0)
Sources: world Bank calculations using Statistical Office micro-data and Criscuolo 2023 for global frontier.
VNM Manufacturing MYS—Manufacturing CHN—Manufacturing IDN—Manufacturing PHL—Manufacturing PHL—Services
Note: National frontier is defined as the 90th percentile firm productivity for each country and industry. Digital intensity of sectors is defined according to Eurostat.
EAP = East Asia and Pacific.
labor reallocation (figure O.18). Second, frontier firms in EAP are falling further behind the global technological frontier, particularly in digital-intensive sectors (figure O.19). In digital manufacturing, global frontier productivity rose by 76 percent between 2005 and 2015, while national frontier firms in Indonesia, Malaysia, the Philippines, and Viet Nam achieved average gains of only 31 percent—underscoring a widening gap in the region’s capacity to absorb and deploy frontier technologies. Over the longer run, sustaining
growth will depend on reversing a structural productivity slowdown.
II. Industrial policy in the digital age
EAP countries face a triple challenge. Their exportled, labor-intensive development model is increasingly threatened by rising protectionism in advanced economies and by automation. Moreover,
as highlighted in the first part of the report, the contribution of total factor productivity to growth has markedly declined across most EAP countries in recent decades, with the productivity of leading firms lagging global leaders, especially in the most technologically advanced sectors. In this context, industrial policy is increasingly viewed by policy makers as a tool to counter the adverse effects of foreign protection, to revive productivity and generate more and better jobs.
We propose an approach to industrial policy based on three pillars:
1. Foundational public goods: Remedying inadequate provision by the market of public goods needed for all economic activity, notably foundational infrastructure and basic human capital–as well as institutions, including those that ensure macroeconomic stability.
2. Addressing policy failures: Reforming existing policies that impede desirable economic activity, such as barriers to competition in transport, communication, and financial services, and barriers to international trade.
3. Addressing market failures: Targeted interventions to address market failures that inhibit desirable economic activity in specific sectors.
In this special focus, we first briefly delve into the first two pillars and then devote the core of the material to the third pillar drawing on original research. Across pillars, we spotlight an area currently of interest to policy makers in the region: the AI value chain.
Pillar 1: Foundational public goods
The new World Bank Human Capital Index shows how EAP’s relative edge in human capital lies in education, while the region trails on health. Mongolia and Viet Nam’s relative overperformance on education contrasts with their underperformance on health. Malaysia and Thailand show similar imbalances. Most other EAP countries underperform on both dimensions (figure O.20A). China’s HCI stands out with both education and health outcomes that approach high-income benchmarks. Notwithstanding the relative edge in education, absolute endowments remain weak in many countries. For example, Viet Nam’s stellar performance in school education contrasts with the relative weakness of its tertiary education. This weakness matters, since, for instance, in China the massive expansion of tertiary education since the early 2000s boosted the productivity, exports, and innovation of firms engaged in skill-intensive manufacturing (figure O.20B).
Percent change
B. Productivity effects of increasing college graduates in China
A. HCI+ index in education and health
Pillar 2: Addressing policy failures
While the EAP countries have been open to trade and investment in goods, services–ranging from transport and telecommunications to finance and the professions–are relatively restricted in most EAP countries (figure O.21A). A range of rules condition or restrict the entry and operations of foreign firms, as well as their ability to deliver services across borders. Amid the digital revolution, countries also restrict cross-border data movement and require data to be stored or processed domestically. The gains from services liberalization are large. For example, even the partial liberalization in Viet Nam over 2008–16 generated a sizeable increase in productivity not only in the services sectors, but also in the manufacturing sectors using services as intermediate inputs (figure O.21B).
Pillar 3: Addressing market failures
Moving to targeted support, the report shows that these measures are on the rise both globally (figure O.22A) and in most EAP countries, though the bulk of activity is concentrated in the G-20 countries. Countries choose different instruments, and different levels of targeting. In China, the Philippines, and Thailand, subsidies (including tax breaks) are the most prevalent form of IP measure utilized. Export incentives are prevalent in Japan
and the Republic of Korea, while Indonesia utilizes relatively more export measures (such as export restrictions).
The report provides evidence on the impact of these policies drawing from three different sources: (1) a new cross-country analysis, (2) a new firm-level analysis from China, and (3) drawing lessons from existing studies on specific sectors and countries.
Analysis conducted by merging firm-level data with sectoral-level IP information reveals that the effects of IP measures on firm performance are heterogeneous. Instruments targeting export performance and production capacity are correlated with increase in revenues and productivity in G-20 countries but not in other developing economies (figure O.23A). These findings suggest that a certain level of institutional development may be a precondition for effective deployment of industrial policy. Moreover, some IP measures might introduce distortions in input choices: subsidized loans correlate with an increase in capital intensity but decrease in employment, both in G-20 (figure O.23B) and developing economies.
Preliminary firm-level evidence from China suggests that industrial policy support is substantial (2.2 percent to 2.4 percent of total value-added in the sample). Foreign firms tend to receive larger
FIGURE O.21 In EAP, services remain relatively protected; Viet Nam shows how liberalizing services can increase productivity.
Marginal effect (Percent)
B. Productivity effects of service liberalization
A. Protection in goods and services
FIGURE O.22 The number of new trade and industrial policy measures has increased significantly after 2020, with differences between countries in types of measures chosen.
Share of different IP measures, 2009–25
Subsidy Import policy Export policy Trade defense Export incentive
Sources: A: GTA Database (global sample). B: NIPO. As explained in the report these databases, while widely used, are subject to some methodological caveats.
Note: IP = industrial policy.
B. The most prevalent instruments by category. Subsidies include financial grants, production subsidies, state loans, loans guarantee interest rate subsidies and tax exemptions. Import policy includes tariffs, quotas, import ban, import licensing requirements. Export policies include export bans, export licensing requirements and export taxes. Export incentives include trade finance, financial assistance in foreign markets, tax-based export incentives.
FIGURE O.23 Export promotion and direct transfers have positive productivity effects in the G-20 economies, but not in other emerging economies; subsidized loans can affect factor markets—leading firms to choose machines over workers.
Productivity effects of subsidies
Effects of loans on capital intensity and employment
of loans on input choice, G-20
Sources: GTA; ORBIS.
Note: The econometric specification used in the analysis is an augmented three-way fixed effects difference-in-differences model. The time-varying dependent variables, at the firm level, are alternatively: TFP (estimated with the wooldridge (2009)’s method), logs of capital intensity (capital-to-employees ratio), logs of employment (number of employees). Subsidies are measured with dummy variables at the country-sector-year level, with sectors defined at a 3-digit level. The model controls for country-sector, sector-time and country-time fixed effects and for firm-level fixed effects. Standard errors are robust to heteroskedasticity and clustered at the firm level. The period of analysis is 2012 to 2019. TFP = total factor productivity.
tax incentives (than domestic firms), whereas stateowned enterprises (SOEs) receive more direct subsidies (figure O.24A). Past recipients are much more likely to continue to receive subsidies or tax incentives in the future, suggesting persistence of policy support and limited use of sunset clauses. Subsidies also appear to be concentrated in relatively
few firms ( figure O.24B), which could dampen aggregate productivity by entrenching incumbents and slowing reallocation toward more productive firms. Conversely, support distributed across a broader range of firms has been shown to foster competition and innovation in China (Aghion et al. 2015).
to be state owned; tax incentives are less concentrated and directed more to foreign firms.
Source: world Bank calculations based on Chinese State Taxation Administration data.
Note: Std. dev. = standard deviation.
A. Reflects pooled cross-section regressions of outcomes: tax incentives (as a share of their statutory tax bill) or direct subsidies (as a share of sales), including zeroes for non-recipients. All firm characteristics are included in a single regression, which also controls for labor productivity, employment, a negative profit dummy, and year and 2-digit sector fixed effects. Depicts fully standardized regression coefficients to enable comparability across different units of the variables above, i.e., they show the change in tax incentives or direct subsidies, in standard deviation units (std. dev. units), associated with a 1 standard deviation increase in firm characteristics (foreign ownership, labor productivity, etc.). For comparability all variables are standardized, including dummy variables. The negative bars reflect that increases in the firm characteristic (e.g., higher labor productivity) is associated with lower direct subsidies.
B. Bars reflect the share of total tax incentives / direct subsidies accounted for by the top 1, 5, 10, or 20 percent of firms.
The choice of industrial policy instrument may influence Chinese firm performance (figure O.25). Tax incentives are associated with increases in labor productivity and exports, whereas direct subsidies are correlated with declines in both. These estimates are correlations and may partly reflect differing trends between the low-performing firms that tend to receive subsidies and the high performers that receive tax incentives. Nevertheless, the results align with findings for listed firms, where subsidies often support inefficient firms preserving jobs rather than funding productive R&D or growth (Branstetter et al. 2023).
FIGURE O.25 China’s direct subsidies are associated with falling productivity, in contrast to tax incentives, which are more dispersed and correlated with productivity increases.
Firm performance and industrial policy
Note: Labor productivity reflects real value added per worker, export intensity denotes exports as a share of sales. Chart depicts the estimated percentage change in firm outcomes for a 10 percentage point increase in tax incentives as a share of the firm’s statutory corporate tax bill (in blue) or direct subsidies as a share of firm sales (in red). Estimates obtained via two-way fixed effects regressions including firm and year dummies. All coefficients are statistically significant at the 1 percent level, except for employment for direct subsidies. Similar estimates are found when restricting the data to only firms with positive profits, rather than all firms in the data. FIGURE O.24 Direct subsidies are concentrated in relatively few firms that tend
Government R&D support became increasingly targeted towards SOEs, which is correlated with a substantial increase in their patenting after the Global Financial Crisis (figure O.26A). Each SOE applied for nearly twice as many patents as the average private manufacturing firm over the period 2011–13, an increase of 150 percent compared to the pre-financial crisis period. The disparity may reflect other differences between SOEs and private firms, although a significant difference persists even conditional on firm size, age, export status, and sector. However, this growth in SOE patenting coincided with increases in government R&D support that were increasingly targeted toward SOEs. In fact, SOEs are less efficient innovators than their
Source: world Bank calculations based on Chinese State Taxation Administration data.
privately owned counterparts, with much smaller increases in patenting for a given increase in subsidy (figure O.26B). Similar evidence from Zhan and Zhu (2020) shows that privatizing Chinese SOEs increased their patenting with no change in their R&D expenditure (i.e., privatization increased their
Sources: Betts and Cao 2025 and world Bank calculations based on ASM-PATSTAT data for manufacturing firms.
Note: SOE = state-owned enterprise; R&D = research and development.
A. Average number of utility patent applications per firm, by year and firm ownership type.
B. The bar is the estimated coefficient of each measurement on subsidy, conditional on firm size, firm age, firm’s export status, firm fixed effect, industry-year fixed effect, and location fixed effect. Regressions are weighted by the inverse of the number of utility patents filed by the firm in a given year (1/N_it), so that each firm-year contributes equally to the estimates. The whisker is the 95 percent confidence interval.
FIGURE O.27 In the Republic of Korea, the industrial policies in the 1970s increased labor productivity of affected industries as well as welfare.
Sources: A. Lane 2025. B. Choi and Levchenko 2024.
Note: RHS = right-hand side.
A. Increase in labor productivity in treated industries versus non-treated.
B. Changes in welfare in the short run (blue bars), long run (red bars), and in total (orange bars) from giving each sector a subsidy in the amount of 1 percent of the initial GDP (left-hand side), and the share of the aggregate credit received by each sector (yellow line, right-hand side).
innovation efficiency). The innovation support could have been more effective had it been directed towards these more efficient privately owned firms.
Lastly, the report draws on rigorous academic evidence on specific countries and sectors. The key theme here is the distinction between the effectiveness of IP interventions (meaning the ability
to increase production or revenues) and their efficiency, namely, whether the effects of the interventions justify their costs. Recent research shows an interesting contrast between the case of the Republic of Korea’s drive for heavy manufacturing industries in the 1970s, which has been found to be both effective and efficient (figure O.27), and the more recent case of the Chinese interventions in
FIGURE O.28 State interventions in China’s
Sources: A. Barwick et al. 2025. B. Barwick et al. 2024.
Note:
A. Market shares by country are computed from quarterly ship orders.
B. Ratio of estimated delta profits per subsidy unit from table 1 in Barwick et al. 2024. A number below
subsidy (i.e., the subsidy is inefficient).
the shipbuilding sector, which have been found to be highly effective, but mostly inefficient, i.e., with costs exceeding their benefits (figure O.28). While these studies are country-specific, a recent article examines the efficiency of industrial policy across many countries (Barteleme et al. 2025). The main message is quite sobering—even optimally designed industrial policies only increase GDP (equivalent to welfare in their model) about 1 percent on average globally and for China and Viet Nam.
Spotlight: AI value chain
The AI value chain represents an interdependent sequence of activities, beginning with semiconductor production (design, fabrication, assemblytesting-packaging) and data infrastructure required to train foundational models (figure O.29). These inputs enable the development of downstream AI applications—from chatbots to autonomous vehicles—that deliver services to firms and households.
a. Chips
The experience of Korea illustrates the ideal trajectory, moving from assembly to global leadership in fabrication (now 22 percent of global output)
Source: Adapted from Gambacorta and Shreeti 2025.
Note: AI = artificial intelligence; GPT = generative pre-trained transformer; GPU = graphics processing unit.
through decades of sustained investment in human capital, targeted incentives, and strategic consolidation (figure O.30). Yet this path is demanding: Korea’s success required decades of coordinated policy and significant public risk-taking. Malaysia, the Philippines, and Viet Nam have established strong footholds in assembly and testing (ATP) but face “middle-income” bottlenecks—skill shortages and infrastructure gaps—that prevent them from replicating this ascent into higher-value segments.
b. Cloud data centers
While several countries are introducing financial and energy incentives to attract data centers, infrastructure quality and administrative efficiency can remain binding constraints. Data centers are large, capital-intensive investments for which time to
FIGURE O.29 AI value chain
Semiconductors (e.g., GPUs) Cloud data centers to process training data (e.g., AWS, Alibaba) Large language model development (e.g., OpenAI GPT, DeepSeek, Google Gemini)
DeepL)
FIGURE O.30 The Republic of Korea’s progression to the technology frontier accompanied sustained investment in the three pillars.
Assembly Phase (1960s)

Pillar 1: Foundational Public Goods
Pillar 2: Addressing Policy Failures
Pillar 3: Addressing Market Failures
Intensive public investment in education
Boosting FDI (Foreign Capital Inducement Act)
Capital-Transition (1970s~80s)


Establishment of KIET (now ETRI) backed by IBRD loan
Phased import liberalization of the 1980s
Electronics Industry Promotion Act (‘69): Provision of financial and infrastructure support
Tech Frontier (1990s)

Building the information superhighway
Capital-Realignment (Late 90s~Mid 00s)


Restoring macroeconomic stability after Crisis
Tech Expansion (2010s~Present)

Source: world Bank.
-Government-led joint semiconductor R&D project
-Strategic coordination in semiconductor trade disputes
-‘Big Deal’ restructuring to form Hynix and minimize redundant investment
-Debt restructuring of Hynix and SK’s acquisition




Cultivating non-memory human capital

-Strong tax support under K-Chips Act
-Designating specialized industry complexes
-Providing special funds to internalize value chain
Note: ETRI = Electronics and Telecommunications Research Institute; FDI = foreign direct investment; IBRD = International Bank for Reconstruction and Development; KIET = Korea Institute for Industrial Economics and Trade; R&D = research and development.
Green Lane Pathway illustrates what is possible when these coordination failures are addressed: by establishing a One-Stop-Centre and fast-tracking grid connections, Malaysia reduced the time from application to data center operation from 36–48 months to just 12 months. Malaysia has experienced a data center boom in recent years (figure O.31). However, timely access to reliable infrastructure and access to finance remains a constraint for new data centers in several EAP countries.
c. AI applications
Source: Straub et al. 2026.
Note: The figure shows the annual sum of data center projects completed or scheduled to be completed in each year. The database was constructed manually by merging multiple sources, primarily TeleGeography, GlobalData, and DataCentersMap.
market is a critical determinant of returns. In several EAP countries, projects have been delayed due to both insufficient investment in power and fiber infrastructure, and the challenges of coordinating across multiple government agencies. Malaysia’s
Despite the potential gains, policies in EAP countries are mostly focused on earlier stages of the AI value chain rather than AI applications. In previous ICT waves, most productivity gains were based on how technology was used rather than on building the underlying hardware. Since AI is a general-purpose technology, the range of potential applications is huge. Furthermore, the barriers to entry in AI applications (such as data and skills), although high, are much lower than in developing AI models.
FIGURE O.31 Cloud computing data center expansion is concentrated in a few EAP countries.
Access to government data is a form of industrial policy that can spur development of downstream AI applications. For instance, Chinese AI firms awarded government procurement contracts that included access to large-scale data sets (such as video or image archives) increased their commercial software development by roughly 20 percent in the three years following the contract award (figure O.32). While the majority of EAP countries has policies related to open government data, implementation has typically been limited.
Conclusion
To conclude, we bring together our main findings and cast them in our three-pillars framework.
1. Basic human capital, infrastructure, and institutions. Investment in human capital, infrastructure, and effective institutions generate benefits for all firms and sectors. Viet Nam’s transformation from an agrarian, centrally planned economy to Asia’s most tradeintensive economy was driven primarily by these economy-wide reforms, not by sector-picking. The same is true for the development trajectories of many EAP countries: from China to the Philippines, from Thailand to Malaysia. The benefits to costs ratio of investments in infrastructure and human capital are found to be high for many EAP countries.
2. Address policy failures by liberating services, eliminating nontariff barriers, and providing the right business environment, including for the digital economy. In many EAP countries, including China, Indonesia, Malaysia, and Thailand, the pervasive use of restrictions in services, the persistence of nontariff barriers, and burdensome licensing limit the scope for development. The benefits of opening up to trade and investment in goods have been amply demonstrated in the region; the benefits of even partial liberalization of services are evident in countries like China and Viet Nam, and more recently in the Philippines, which reformed its restrictive Public Services Act. State-owned firms account for a large share of activity in some EAP countries in key sectors
O.32 Public
Half-years since contract award
Note: Estimates from an event study regression showing the cumulative software releases intended for commercial uses in periods before and after the award of a government procurement contract and resulting from data-rich public security contracts, relative to data-scarce ones. Regressions control for firm and time period fixed effects.
(such as banking), which can limit competition and misallocate resources (World Bank 2023). Spurring productivity growth and avoiding the middle-income trap requires action across these pillars to give firms the right incentives (by strengthening competition) and the capabilities (through better skills and infrastructure) to invest in innovation (De Nicola et al. 2025).
3. Targeted interventions can complement—but not substitute for—the enabling framework created by 1 and 2 above. While it is difficult to establish the efficiency of industrial policy, strengthening the first two foundational pillars is not only efficient, but might also improve the effectiveness of targeted support. For example, aspects of industrial policy in China and Viet Nam, such as tax exemptions for investors, were implemented in a strong institutional and infrastructural context, alongside significant liberalization on the altar of WTO accession. In contrast, industrial policy in Indonesia, in the form of export restrictions, is being implemented when complementary public goods are not well developed and barriers to trade in goods and services persist, which limits access to key complementary inputs. In general, allocating
FIGURE
procurement contracts with access to government data led to Chinese AI firms developing new commercial software.
New software releases (Number)
Source: Beraja et al. 2023.
support to firms operating in more competitive sectors has been shown to spur greater increases in productivity (Aghion et al. 2015). In addition, the effectiveness of new export promotion policies in Korea depended crucially on the quality of public institutions as reflected in the ability of the bureaucrats (figure O.33).
Proactive sector-specific industrial policy is more likely to be effective where fundamentals are sound and major policy failures have been addressed. However, achieving such conditions nationwide is unlikely in the near term, so countries can use special economic zones (SEZs) to prioritize reforms. SEZs are demarcated areas within a country which typically offer investors better infrastructure, a streamlined regulatory and administrative regime (including improved customs), and a fiscal regime with reduced corporate income tax, value added tax, and other taxes and labor contributions, sometimes complemented by training or other subsidies (World Bank 2020). Although evidence on their impact is mixed, several EAP countries have clear success stories where SEZs are well-governed,
engage the private sector, and form strong linkages with the rest of the domestic economy (World Bank 2024b). Recent SEZs have also moved beyond the traditional focus on manufacturing, as illustrated by the Johor–Singapore SEZ, which combines cross-border trade and migration facilitation, streamlined regulations, digital infrastructure, and fiscal incentives to attract investment in AI and data centers, as well as high-tech manufacturing.
The AI value chain also illustrates how the three pillars of industrial policy should work in tandem. Foundational horizontal policies are critical: without investments in high-speed digital infrastructure, energy, and a skilled workforce, participation will remain limited. Second, removing distortions is essential to reducing the cost of key inputs, such as opening access to public data and cross-border data. Finally, targeted interventions need to be carefully considered and seen as complements rather than substitutes for the first two pillars. While several countries are introducing financial and energy incentives to attract data centers, infrastructure quality, availability of financing sources, and administrative efficiency can remain binding constraints.
The case for industrial policy has always been compelling in principle, whereas the practice of industrial policy has usually been less principled. While this special focus provides a policy framework, practical implementation requires careful instrument design (Fernandes and Reed 2026). Targeting specific sectors or firms can catalyze investment but carry fiscal and rent-seeking risks; they must therefore be transparently implemented, include sunset clauses, and have strict performance benchmarks. Policy makers should prioritize instruments that closely target market failures, ensuring that support fosters competition and local spillovers rather than entrenching incumbents.
FIGURE
Source: Barteska and Lee 2025.
Source: world Bank.
Note: Percent growth of GDP at market prices. values for 2025 for the small island economies refer to GDP growth estimates. values for Timor-Leste represent non-oil GDP. For the following countries, values correspond to the fiscal year: Federal States of Micronesia, Myanmar, Palau, and Republic of the Marshall Islands (October 1–September 30); Nauru, Samoa, and Tonga (July 1–June 30).
References
Aghion, P., J. Cai, M. Dewatripont, L. Du, A. Harrison, and P. Legros. 2015. Industrial Policy and Competition. American Economic Journal: Macroeconomics 7 (4): 1–32. https://doi.org/ 10.1257/mac.20120103.
Bartelme, D., A. Costinot, D. Donaldson, and A. Rodríguez-Clare. 2025. The Textbook Case for Industrial Policy: Theory Meets Data. Journal of Political Economy 133 (5), 1457–1510. https://doi. org/10.1086/734129.
Barteska, P., and J. E. Lee. 2025. Personnel Is Policy (Implementation): Bureaucrats and the Korean Export Miracle. Discussion Paper No. 2099, Centre for Economic Performance, London School of Economic and Political Science, London.
Barwick, P. J., M. Kalouptsidi, and N. B. Zahur. 2024a. Industrial Policy: Lessons from Shipbuilding. Journal of Economic Perspectives 38 (4): 55–80. https://doi.org/10.1257/jep.38.4.55.
Barwick, P. J., M. Kalouptsidi, and N. B. Zahur. 2024b. Industrial Policy Implementation: Empirical Evidence from China’s Shipbuilding Industry. The Review of Economic Studies 92 (6): 3611–3648.
Beraja, M., D. Y. Yang, and N. Yuchtman. 2023. Data-Intensive Innovation and the State: Evidence from AI Firms in China. The Review of Economic Studies 90 (4): 1701–23. https://doi.org/10.1093/ restud/rdac056.
Betts, C. M., and Y. Cao. 2025. How Does State Ownership Affect Firm Innovation? Evidence from Chinese Manufacturing Firms. The World Bank Economic Review 39 (1): Article lhaf024. https:// doi.org/10.1093/wber/lhaf024.
Branstetter, L. G., G. Li, and M. Ren. 2023. Picking Winners? Government Subsidies and Firm Productivity in China. Journal of Comparative Economics, 51 (4): 1186–1199.
Caldara, D., M. Iacoviello, P. Molligo, A. Prestipino, and A. Raffo. 2020. The Economic Effects of
Trade Policy Uncertainty. Journal of Monetary Economics 109: 38–59. https://doi.org/10.1016/j. jmoneco.2019.11.002.
Che, Y., and L. Zhang. 2017. Human Capital, Technology Adoption and Firm Performance: Impacts of China’s Higher Education Expansion in the late 1990s. The Economic Journal 128 (614): 2282–2320. https://doi.org/10.1111/ecoj.12524.
Choi, J., and A. A. Levchenko. 2024. The LongTerm Effects of Industrial Policy. Journal of Monetary Economics 145: 103557. https://doi.org/10.1016/j. jmoneco.2024.103557.
Criscuolo, C. 2023. “Productivity Growth and Structural Change in the Era of Global Shocks.” PowerPoint, KDI–Brookings Joint Seminar: Productivity in a Time of Change, April 11. https://www.brookings.edu/wp-content/uploads/ 2023/04/2.1-KDI-Brookings-Jointt-Seminarrevised-ppt_Chiara-Criscuolo.pdf.
Cushman & Wakefield. 2025. Asia Pacific Data Center Market Report Q2 2025. Cushman & Wakefield.
De Nicola, F., A. Mattoo, and J. Timmis. 2025. Firm Foundations of Growth: Productivity and Technology in East Asia and Pacific. World Bank. https://doi.org/10.1596/978-1-4648-2200-1.
Fernandes, A. M., and T. Reed. 2026. Industrial Policy for Development: Approaches in the 21st Century. Policy Research Reports. Washington, DC: World Bank. https://doi.org/10.1596/978-14648-2276-6.
Gambacorta, L., and V. Shreeti. 2025. The AI Supply Chain. BIS Papers No. 154, Bank for International Settlements.
Ha, J., E. Islamaj, H. Liu, and A. Mattoo. 2026. Economic Effects of Heightened Global Uncertainty: Evidence from East Asia and the Pacific Region. Policy Research Working Paper, World Bank.
Lane, N. 2025. Manufacturing Revolutions: Industrial Policy and Industrialization in South
Korea. The Quarterly Journal of Economics 140 (3): 1683–1741. https://doi.org/10.1093/qje/qjaf025.
Lebrand, M., G. Vasishtha, and H. Yilmazkuday. 2024. Energy Price Shocks and Current Account Balances: Evidence from Emerging Market and Developing Economies. Energy Economics 129: 107205. https:// doi.org/10.1016/j.eneco.2023.107205.
Quid. 2025. Global Private Investment in Generative AI Database. Quid.
Straub, S., H. He, Y. Li, X. Lyu, J. Steinbuks, E. Vergara Cobos, C. Dann, M. Garcia Santana, and H. Selod. 2026. Infrastructure Foundations: From Current Assets to Future Growth. World Bank. https://doi.org/10.1596/978-1-4648-1112-9.
Wooldridge, J. M. 2009. On Estimating FirmLevel Production Functions Using Proxy Variables to Control for Unobservables. Economics Letters 104 (3): 112–14. https://doi.org/10.1016/j.econlet. 2009.04.026
World Bank. 2023. The Business of the State. World Bank. https://doi.org/10.1596/978-1-4648-1998-8.
World Bank. 2024. Services Unbound: Digital Technologies and Policy Reform in East Asia And Pacific. East Asia and Pacific Development Studies. World Bank.
World Bank. 2025. A Longer View. East Asia and Pacific Economic Update, April. World Bank.
World Food Programme. (2026, March 24). Projected increase in acute food insecurity due to the Middle East conflict. “https://www.wfp. org/ publications/projected-increase-acute-foodinsecurity-due-middle-east-conflict.
Zhan, J., and J. Zhu. 2020. The Effects of State Ownership on Innovation: Evidence from the State-Owned Enterprises Reform in China. Applied Economics 53 (1): 145–63. https://doi.org/10.1080 /00036846.2020.1796918.
PART I
Recent Developments and Outlook
I. Recent Developments and Outlook
I.1 Recent developments
Growth in developing East Asia and Pacific (EAP) remains above the global average, but it is set to slow down in 2026 and 2027. Regional growth is projected to decline from 5.0 percent in 2025 to 4.2 percent in 2026 amid China’s continued deceleration and the negative growth effects of higher energy prices on the rest of the region following the conflict in the Middle East (figure I.1). China’s growth is forecast to decelerate, from 5.0 percent in 2025 to 4.2 percent in 2026, as domestic demand remains subdued, difficulties in the property sector persist, and slowing growth in the rest of the world dampens export growth. Growth in the rest of region is projected to ease from 4.9 percent in 2025 to 4.1 percent in 2026. Growth in the Pacific Island Countries is projected to ease from 3.2 percent in 2025 to 2.8 percent in 2026, with the increase in oil prices imposing a cost in the near term.
In 2027, the region is projected to grow by 4.4 percent. While growth in China is expected to stay at 4.3 percent under the weight of demographic aging, elevated debt, and diminishing returns to investment, growth in the rest of the region is likely
to strengthen to 5.0 percent in 2027, as global economic policy uncertainty dissipates and external demand recovers. Growth in the Pacific Island Countries is projected to be 3.0 percent in 2027.
Recovery in per capita output has been uneven across the region (figure I.2). Most larger EAP economies
FIGURE I.2 While output per capita is well above pre-COVID-19 levels in most of the larger economies, it remains below those levels in several Pacific Island Countries and Myanmar.
Sources:
FIGURE I.1 Overall growth in EAP is forecast to decline in 2026, but recover in 2027 in the region outside China.
have surpassed pre-pandemic levels, with per capita output in China and Viet Nam expected to reach 40 percent above their 2019 levels this year. By contrast, output in several Pacific Island Countries and in Myanmar remained below pre-pandemic levels in 2026. In the Pacific Islands, recovery has been repeatedly set back by natural disasters, including severe cyclones in 2023 and a major earthquake in Vanuatu in 2024. In Myanmar, persistent political instability and conflict continue to suppress
economic activity; the human toll and widespread infrastructure damage from a recent earthquake have worsened the situation.
Poverty continues to decline across the region. An estimated 36 million people have escaped poverty between 2024 and 2025 at the upper-middleincome poverty line (US$8.30, 2021 PPP). China remains the primary driver, with 27 million people crossing the threshold, while the rest of the region lifted a further 8 million out of poverty, reducing poverty rates by 1.6 percentage points (figure I.3). Despite this progress, vulnerability remains widespread. Many households remain only marginally above the poverty line, and transition into the middle class—defined as US$15 per day—has been uneven. In China, the middle class is expected to account for 51 percent of the population by end2026, up from 40 percent in 2022. In the rest of the region, the middle class accounted for only 23 percent of the population in 2025—reflecting that most households remain a significant distance from achieving durable economic security.
Private consumption has supported growth in all major economies in 2025, although its contribution has remained below pre-pandemic levels in China, Malaysia, and the Philippines (figure I.4). Manufacturing exports have boosted growth across the region, driven by strong demand for AI-related electronics, front-loading ahead of tariff increases, and value-chain reallocations in favor of the region. Meanwhile, the contribution of services exports has narrowed in most economies, with Malaysia a notable exception. Public investment has supported growth in China and Indonesia, while private investment has been a significant driver in Malaysia, buoyed by new investments in data centers.
Consumption
Private consumption continues to serve as a primary growth engine for most economies in the region, yet underlying dynamics reveal persistent fragilities. While retail sales have maintained positive yearover-year growth into early 2026, the momentum is highly heterogeneous; economies such as Viet Nam exhibit robust retail expansion, whereas consumption growth in China and Thailand remains
notably subdued and below pre-pandemic trends (figure I.5; figure IA.1). Broader consumer sentiment reflects this fragility, with regional consumer confidence indices at only 80 percent of their prepandemic baselines.
In China, consumer spending has remained cautious, with retail sales below pre-pandemic trends, amid a soft labor market and a weak housing market (figure I.6A). The labor market is characterized by high youth unemployment, slack hiring, and slow wage growth, all of which have weighed on consumer confidence. Falling house prices have depressed consumption primarily through deterioration in homeowner balance sheets (BIS 2025; IMF 2025).1 Accommodative policies lifted final consumption growth to 4.6 percent y/y in 2025 from 3.9 percent in 2024, although the boost from consumer subsidies began to fade in the second half of 2025 (figure I.6B).
1BIS (2025) finds that in Tier 1 and Tier 2 cities, a 10 percent fall in house prices reduces consumption by about 1.6 percent, with effects strongest among homeowners and older households, although this effect is not observed in lower-tier cities. IMF (2025) finds that a decline of 0.5 standard deviations in the net housing asset–to–income ratio—roughly equivalent to a 20 percent fall in house prices—is associated with an increase in the urban household savings rate of about 0.35 percentage points.
Looking ahead, the trajectory for household spending is constrained by elevated economic uncertainty and the structural drag of substantial household debt. These debt burdens are particularly high in China, Malaysia, and Thailand, posing significant downside risks to future consumption growth as debt-servicing obligations weigh on discretionary incomes (World Bank 2025b).
Industrial production and investment
Industrial production across East Asia exhibits a marked divergence in post-pandemic recovery trajectories. In China, industrial output has surpassed its 2015–19 trendline (figure I.7). This outperformance is partly driven by resilient exports and policy support for strategic industrial sectors and advanced manufacturing (World Bank 2025a, 2026a). Conversely, industrial production across major Association of Southeast Asian Nations (ASEAN) economies remains below pre-pandemic trend. There are, nonetheless, pockets of manufacturing strength; economies such as Malaysia, the Philippines, and Viet Nam have benefited from a cyclical pickup in demand for semiconductors and AI-related hardware.
FIGURE I.5 Retail sales continue to increase, but momentum weakened in some countries in the second half of 2025; consumer confidence remains weak across EAP.
B. Consumer confidence
Index (Dec. 19 = 100)
Source: Haver Analytics.
Note: 3mma = 3-month moving average; y/y = year-over-year.
B. Red line shows the median of China, Indonesia, Thailand, and the Philippines. Grey area shows 25th–75th percentile range. Retail sales of Thailand is calculated by the average of durable goods and nondurable goods.
FIGURE I.6 Consumption growth is projected to remain soft in China as the impact of policy support wanes. A. Retail sales index
(Jan. 2015 = 100)
B. Real retail sales components, percent, y/y growth, 3mma
Sources: China National Bureau of Statistics; world Bank estimates.
Note: Policy supported goods refer to those included in consumer trade-in programs. 3mma = 3-month moving average; y/y = year-over-year.
Strong manufacturing performance in selected sectors notwithstanding, private investment share of GDP remains below pre-pandemic levels across developing EAP (figure I.8). Similarly, regional business confidence remains below pre-pandemic baselines, partly driven by elevated economic policy uncertainty, both domestically and globally. During periods of heightened uncertainty firms across the region adopt a “wait-and-see” attitude, delaying
or scaling back capital expenditures (World Bank 2025a).
In China, investment growth is slowing due to continued weakness in the property sector and emerging weakness in manufacturing and infrastructure. A pronounced shift in investment from real estate to manufacturing has taken place in China, supported in part by bank lending (figure I.9). However,
FIGURE I.7 Industrial production growth is strong in China but remains below pre-COVID-19 trends in the rest of EAP.
A. Industrial Production in ASEAN-5 (excluding China)
Index 2015–19 trend2023–25 trend
COVID-19
Industrial Production in China
Source: Haver Analytics.
FIGURE I.8 Private investment as a share of GDP is below pre-COVID-19 levels across EAP, as is business confidence.
B. Business confidence
Index (Dec. 2019 = 100)
Sources: Haver Analytics; world Bank estimates.
Note: B. The red line shows the median of China, Indonesia, Malaysia, Thailand and the Philippines. Grey
supply continues to outpace demand, challenging the sustainability of this expansion, putting pressure on prices and profitability. China’s Producer Price Index (PPI) has remained in deflationary territory for four consecutive years and declined by 2.6 percent year-over-year in 2025. Consistent with these pressures, the share of industrial firms operating at a loss has risen steadily, alongside a buildup of accounts receivable, pointing to mounting balance-sheet stress in the sector.
Manufacturing investment declined in the second half of 2025—a slowdown foreshadowed by an earlier weakening in bank credit to the industrial sector. This retrenchment may reflect an emerging correction after rapid capacity expansion, as firms and lenders reassess expected returns amid persistent price deflation and deteriorating profitability. Meanwhile, infrastructure investment also weakened in the second half of 2025, constrained by tighter local government finances.
B.
FIGURE I.9 China’s growth is being dampened by slowing investment driven by continued weakness in the property sector and emerging weakness in manufacturing.
A. Change in new bank loans by sector, RMB trillion, 4qma
C. Producer prices index
PPI: Headline PPI: Non–energy Brent oil price (RHS)
D. Share of loss-making industrial enterprises and account receivables of listed firms
(July 2019 = 100, 12mma)
Share of loss-making industrial enterprises
Account receivables / business sales
Account receivables average payback days
Source: China National Bureau of Statistics, People’s Bank of China, wind.
Note: RHS = right-hand side; PPI = producer price index; y/y = year-over-year; 4qma = 4-quarter moving average; 12mma = 12-month moving average.
D. “Account receivables/business sales” is using the monthly stock of accounts receivable and the trailing 12 months (TTM) of business sales.
Exports
In 2025, goods exports across East Asia showed generally positive trends, but the growth has moderated in the recent months, especially in Indonesia (figure I.10). The 2025 rally was highly asymmetric, supported by a global cyclical upswing in technology demand. Electronics export growth outpaced non-electronics categories; for example, electronics
shipments surged by roughly 32 percent in Thailand, 28 percent in Viet Nam, and 17 percent in the Philippines, compared to 8 percent, 11 percent, and 13 percent in non-electronic exports, respectively. Malaysia’s 18 percent jump in electronics effectively offset non-electronic contractions.
In China, merchandise exports grew by 6.1 percent year-over-year in 2025, supported by
FIGURE I.10 Goods exports accelerated in 2025, primarily driven by the electronics sector.
Goods export (3mma, value, y/y growth)
Source: Haver Analytics.
Note: EAP = East Asia and Pacific; y/y = year-over-year; 3mma = 3-month moving average.
ChinaIndonesiaMalaysiaPhilippinesThailandViet Nam
FIGURE I.11 Tech-intensive products led export growth in China, reflecting strengthened competitiveness and deeper integration into regional supply chain.
A. Exports by product, China
(July 2019 = 100, 6mma)
(July 2019 = 100, 6mma)
Source: China Customs.
Note: Product categories follow the UNCTAD classification. “Commodities” comprise mineral products, precious metals, and base metals. “Machinery and equipment” includes machinery and mechanical appliances, electrical equipment, and their parts. “Transport and specialized equipment” covers vehicles, aircraft, vessels, related transport equipment, and optical and precision instruments. “Low-tech manufacturing goods” encompass chemicals, plastics, rubber, leather, wood, paper, textiles, footwear, ceramics, and glass. “Other” includes food, beverages, and miscellaneous goods. 6mma = 6-month moving average.
shipment front-loading, continued market diversification, and strengthened competitiveness. Gains in emerging markets more than offset weaker shipments to the United States. Export growth was especially strong for green consumer products (e.g., electric vehicles) and intermediate
goods linked to regional supply chains (e.g., machinery and equipment). Strengthened competitiveness in the auto sector is also evident in growing market shares of domestic products and a sustained decline in transport equipment imports (figure I.11).
I.12
Travel-related services and tourist arrivals have recovered to pre-pandemic levels in some countries but remain below them in others (figure I.12). Cambodia, Fiji, Malaysia, and Viet Nam have seen arrivals return to or exceed pre-pandemic numbers, while in other EAP economies, arrivals have plateaued, in part due to the slower rebound of China’s outbound tourism. In addition, discretionary spending by tourists remains below pre-pandemic levels in countries such as Cambodia and Thailand, limiting the overall contribution of travel to domestic economic activity.
I.2 Factors affecting growth
External factors
Economic performance across EAP countries is shaped by both external and domestic factors. External factors include: geopolitical tensions, more recently the conflict in the Middle East; trade restrictions, particularly the escalation of tariffs and non-tariff barriers, as well as the associated global economic policy uncertainty; and the ongoing AI boom, which is immediately reshaping global technology supply chains and creating new opportunities for electronics and semiconductor exporters, and which could in the near term lead to higher productivity growth, as well as labor market disruptions. Domestic factors include the macroeconomic policy response to these shocks and structural reforms that support growth (figure I.13).
Geopolitical tensions
The conflict in the Middle East since February 28 has triggered a significant global energy price shock. Natural gas benchmark indices surged 90 percent, and crude oil prices rose over 30 percent in the immediate aftermath, and oil futures shifted upward, reflecting supply reductions (figure I.14). The region is also a major supplier of fertilizers, aluminum, and petrochemicals, with Qatar and Saudi Arabia together accounting for over 10 percent of global nitrogen fertilizer exports.
The conflict can affect EAP economies through multiple channels (figure I.15). First, higher energy, fertilizer, and food prices raise production costs across the region. Second, supply chain disruptions—through production interruptions, maritime chokepoint pressures, and elevated transport costs—disrupt production.2 Third, tighter financing conditions may emerge as investor flight to safety raises borrowing costs. Fourth, slower global growth, driven by heightened uncertainty and weaker consumer and investor sentiment as the conflict prolongs, would reduce external demand for the region’s exports. Finally, reduced remittances
2One-fifth of global oil and LNG transit the Strait of Hormuz without viable alternative routes.
FIGURE I.13
FIGURE
FIGURE I.14 Prices of commodities, such as oil and natural gas, have increased considerably since the escalation of conflict in the Middle East; oil futures are higher for the rest of 2026.
Sources: Bloomberg; world Bank.
Note:
A. Daily Brent prices, and ICE Dutch TTF gas price. Last observation is March 12, 2026.
B. Futures curve for May 2026 contract onwards. Last observation is March 17, 2026.
FIGURE I.15 Conflict in the Middle East can affect EAP economies through multiple channels.
Higher costs of production
- Energy
- Fertilizer
- Food Supply chain disruptions
- Production disruptions
- Maritime chokepoints
- Higher transport costs
Source: world Bank.
Tighter financing conditions
- Flight to safety
- Higher borrowing costs
from Gulf-based workers and higher food and energy costs would compress real incomes, weighing disproportionately on poor households and widening inequality.
The impact on EAP countries will depend on their exposure to the oil shock, the extent of their vulnerability, and the policy space to respond (figure I.16; table I.1).
Exposure
The shock’s impact across EAP varies sharply with individual economies’ net energy trade positions. Pacific Island nations—including Fiji, Samoa, and Vanuatu—and major importers like Thailand face the greatest vulnerability, with oil imports representing 5 to 13 percent of GDP (table I.1). Higher energy prices act as a regressive tax on consumption and raise industrial input costs, weighing
Slower global growth
- Higher uncertainty
- Weaker business sentiment
- Lower investment
Lower remittances, increased inequality
- Remittances from Gulf
- Share of poor household budget on oil and food
FIGURE I.16 Exposure, vulnerability, and policy space determine the impact of geopolitical tensions on EAP economies.
Source: world Bank.
on growth. Malaysia and Papua New Guinea, as substantial net exporters of oil and gas, are better positioned to absorb the shock and benefit from improved terms of trade.
TABLE
I.1 EAP countries
differ in exposure, vulnerability, and policy space
Sources: BACI; Haver Analytics; IMF; world Bank.
Note: Color scale represents country quantiles relative to the group of EMDEs. Color coding of the general government debt for PICs is based on the risk of external debt distress in the latest debt sustainability analysis. EMDE = emerging market and developing economies.
Vulnerability
Vulnerability of economies to external shocks arises from inadequate energy buffers, high external financing needs, and fragile price stability. Most developing EAP economies fall short of the IEA’s 90-day strategic petroleum reserve benchmark; Cambodia, Indonesia, and Viet Nam hold only 1 to 2 months of coverage, whereas China and Thailand align closer
to the standard. Mongolia and Timor-Leste are more vulnerable macroeconomically, with external financing needs around 40 percent of GDP. External financing needs are also high in Malaysia, driven by private short-term debt, such as trade credits and banking sector flows. Furthermore, elevated baseline inflation constrains the monetary policy space to respond to new shocks in Myanmar (~20 percent), Lao PDR, and Mongolia (>6 percent), contrasting
sharply with the flexibility afforded by subdued or negative inflation in China and Thailand.
Policy space
The impact of the energy price shock will vary across EAP economies depending also on their capacity to respond. Among the most vulnerable are Pacific Island nations—including Fiji, Tonga, Vanuatu, and the Federated States of Micronesia, alongside continental importers like Thailand and Mongolia, which face significant trade balance pressures, limited fiscal buffers and, in the case of the Pacific Islands, low debt-carrying capacity. China (at the local level), Lao PDR, and Thailand are particularly constrained, with high government debt and limited fiscal space. By contrast, economies with stronger buffers—including Cambodia, Indonesia, and Viet Nam—have greater capacity to absorb the shock through strategic reserves, domestic refining capacity, or commodity export revenues that provide a natural hedge. On monetary policy, central banks with well-anchored inflation expectations can afford to accommodate energy supply shocks—but a severe or sustained price increase that threatens to dislodge expectations may warrant a shift toward a less accommodative stance, particularly in economies where inflation is already elevated.
Assessing policy space in Pacific Island Countries requires looking beyond conventional debt-to-GDP ratios, as even countries with relatively low gross debt levels face high risk of debt distress—including Kiribati, Tonga, and Tuvalu. This reflects the Islands economies’ structurally limited debt-carrying capacity, itself a product of narrow export bases, high import dependence, and vulnerability to external shocks. Limited access to commercial borrowing and underdeveloped social transfer systems further constrain the ability of Pacific governments to cushion households from shocks such as rising energy prices, making their effective policy space considerably more restricted than headline debt figures suggest.
How far an increase in oil prices is likely to generate inflationary pressure and weigh on economic activity in EAP economies depends on their
exposure, vulnerability and policy space. Higher oil prices transmit to inflation through two principal channels: a direct effect, as fuel and energy costs feed immediately into consumer price indices (fuel comprises about 5 percent of the CPI basket in most EAP countries), and an indirect effect, as higher input costs across transportation, manufacturing, and agriculture ripple through supply chains and push up the prices of a broad range of goods and services. On the activity side, oil price increases act as a supply-side tax—raising production costs, compressing firm margins, and reducing households’ real disposable income, which together dampen both output and consumption.
Empirical estimates suggest significant impacts of higher oil prices for EAP economies. Inflation in Thailand and the Philippines could increase by 0.67 and 0.62 percentage points, respectively, after 6 months if the crude oil price increases by US$20, reflecting their heavy reliance on imported oil (figure I.17). Malaysia and Indonesia show more moderate responses, partly reflecting domestic subsidy and administered pricing mechanisms that insulate consumers from the full shock, while China is the least sensitive at about 0.22 percentage points, benefiting from a more diversified energy mix and stronger government control over domestic energy prices. The drag on industrial production follows a similar pattern: all five economies experience output losses, with Thailand and the Philippines again most affected at about 0.19 percentage points, and China the most resilient at 0.06 percentage points. Investment and employment also decline when oil prices increase.
Furthermore, the welfare impact of imported inflation from fuel price shocks is regressive, threatening to slow the region’s pace of poverty reduction and expand the vulnerable population. Microsimulations in economies like the Philippines and Viet Nam demonstrate that lower-income households suffer the most acute relative welfare losses from oil price spikes, as they allocate a disproportionately larger share of their budgets to energy and transport (World Bank 2024a; box I.1). These impacts are expected to be transmitted relatively evenly through both direct fuel costs and indirect price hikes on broader goods and services.
FIGURE I.17
Investment and employment response
Source: world Bank estimates.
Note: Bars show annualized percentage point increase in inflation after 6 months. Estimates are based on a Bayesian hierarchical panel vAR model estimated at monthly frequency over 2000–2025, with 8 lags. The endogenous system includes US and Chinese macro-financial conditions alongside domestic output, prices, equity prices, and the exchange rate. Oil price shocks are identified recursively via Cholesky ordering and normalized so that a unit shock corresponds to a 1 percent increase in the world oil price. Results are reported for a US$20 increase in crude oil prices. Shaded bands denote 68 percent posterior intervals.
Across the region, a sustained 50 percent increase in fuel prices could lead to a 3–4 percent loss in income for households in the region through both direct and indirect effects. In addition, an escalation of the conflict is likely to increase food insecurity (World Food Programme 2026).
While some governments could consider subsidies and price controls to mute consumer price increases, these measures would strain fiscal budgets and deplete the macroeconomic policy space needed to adequately buffer vulnerable groups. Consequently, real-time monitoring indicates a severe surge in economic anxiety; media analysis reveals that uncertainty surrounding fuel prices and broader inflation has recently spiked to post-COVID or multiyear highs across major EAP economies, including China, Indonesia, Japan, and the Philippines.
In addition to these direct effects, the conflict in the Middle East could have an indirect impact on the region through its effect on global economic activity. A sustained 10 percent increase in oil prices is associated with a reduction in annual global growth of roughly 0.1 percentage point (Lebrand et al. 2024). A prolonged and more intense conflict could significantly reduce global growth. As the scale of disruptions increases, additional channels may emerge. For instance, a prolonged shutdown of Middle East shipping routes could disrupt
production in energy-intensive industries, reducing output and triggering broader supply chain disruptions. Some pessimistic scenarios also involve a substantial tightening of global financial conditions, due to higher inflation and mounting risk aversion, generating stronger headwinds to growth.
EAP economies are deeply integrated with the rest of the world, particularly through trade, leaving them highly exposed to external demand conditions. Domestic value added embedded in gross exports reaches about 50 percent of GDP in Viet Nam and Malaysia, and about 40 percent in Lao PDR, Thailand, and Cambodia (figure I.18A). In rapidly industrializing economies, this integration has deepened substantially since 1995—domestic value added linked to foreign consumption has roughly doubled as a share of GDP in Viet Nam and Cambodia. While the United States and the European Union remain vital consumer bases, intra-regional demand— from ASEAN partners and China—now absorbs a significantly larger share of regional value added than it did three decades ago.
So far, global growth has been resilient. But slower growth in the rest of the world would exert a significant negative impact on developing EAP. A 1 percentage point decrease in G-7 growth is estimated to lower output growth in developing East Asia by
BOX I.1 Distributional Impacts of Fuel Price Increases in EAP Countries
While global indexes such as WTI crude oil surged by about 50 percent in March 2026, in the region, benchmark Singapore Gasoil index rose by 114 percent and tanker arrivals at major EAP ports fell 5.4 percent (figure I.B1.1A). As the region most reliant on exports from the Persian Gulf, the systemic severity of price increases across EAP has limited countries’ ability to buffer shocks through trade or regional arbitrage.
Exposure to the shock reflects each country’s import dependence. Most EAP economies rely on gasoline and diesel imports; liquefied petroleum gas (LPG) is an additional significant import for some countries such as Kiribati, Lao PDR, and the Philippines. At the household level, fuel’s share of the consumption basket
varies considerably—in Timor-Leste, it accounts for under 2 percent of a typical household budget, but in most other countries it accounts for more than 4 percent (figure I.B1.1BC).
Fuel subsidies are a highly regressive tool to cushion the impact of rising prices. Since higher-income households spend much more on fuel in absolute terms, the benefits of subsidies accrue largely to these households. For instance, in Viet Nam, which has the EAP’s most equal distribution of fuel consumption, the top quintile still uses four times as much fuel as the bottom; and in Fiji the ratio is 32:1. But low-income households are far from insulated. Motorcycle ownership extends across the income
FIGURE I.B1.1 Shipments of fuel have declined; fuel constitutes a significant share of consumption across income groups.
A. Change in fuel tanker arrivals, March 2026 compared to March 2025
B. Fuel share of consumption, East Asia
BOX I.1 Distributional
Impacts of Fuel Price Increases in EAP Countries (continued)
distribution in many EAP countries—90 percent of households in Viet Nam’s poorest decile own one— and the use of kerosene and LPG for cooking is prevalent in the middle of the distribution. The poor and vulnerable households often lack the resources to smooth shocks, making them most at risk of falling into poverty and suffering increased food insecurity. Targeting support to the poor and the vulnerable would alleviate economic distress without creating excessive fiscal strains.
Simulations for EAP economies suggest welfare losses across the income distribution. Effects reach households both directly—through higher pump prices and LPG costs—and indirectly, as fuel is an input into nearly all goods and services, pushing up consumer prices economywide. A uniform 50 percent fuel price
increase leads to the typical household in the bottom decile of a country’s distribution losing 3.2 percent of its welfare, while the top decile loses about 4 percent (figure I.B1.2). The impact is largest for the region excluding China.
World Bank monitoring recorded little or no change in subsidized consumer fuel prices in Indonesia, Malaysia, Fiji, Samoa, and Tonga, where prices are often administratively controlled. Elsewhere, passthrough ranged from 3–20 percent in China, Papua New Guinea, the Philippines, and Viet Nam, to 50–100 percent in Cambodia, Lao PDR, Myanmar, and Thailand. In countries where governments have absorbed higher prices through subsidies, muted consumer price changes come at the expense of growing fiscal pressure on government budgets.
I.B1.2 Top/bottom quintile fuel consumption multiples; average welfare losses by national welfare quintile
A. Multiple of top quintile compared to bottom quintile fuel consumption
Sources: world Bank, using EAPPOv household surveys; world Bank, using EAPPOv household surveys, national input-output tables, and harmonized statistics from the Climate Policy Assessment Tool (CPAT).
EAP = East Asia and Pacific.
about 0.6 percentage points within the following year (figure I.18B). In addition, China’s growth is projected to decline. A 1 percentage point decline in China’s growth is estimated to reduce growth in the rest of developing East Asia by 0.3 percentage
points, underscoring China’s significant influence on economic activity across the region.
The specific impact of China’s growth on countries in the EAP region has depended on their stage of
FIGURE
B. Estimated total direct and indirect effects of uniform fuel price shocks in EAP (Welfare loss)
I.18
Sources: OECD Tiva data set; world Bank estimates.
Note: EAP = East Asia and Pacific; EU = European Union.
B. Figure shows the impact of one percentage point increase in G-7 and China growth. Effects estimated using a structural Bayesian vAR model that includes the following variables: US monetary policy reaction shock, US real GDP growth, China real GDP growth, commodity weighted prices for recipient country, recipient country real GDP growth, and recipient country exchange rate to the US dollar. EAP countries included in the estimation are Indonesia, Malaysia, the Philippines, and Thailand. The models are estimated from 2000Q1 to 2022Q4, except in Malaysia which starts in 2005Q1.
development and pattern of comparative advantage. Most of the relatively industrialized countries— Malaysia, Thailand, the Philippines, Viet Nam, and even Indonesia—have faced direct competition at home and abroad from China in manufactured goods. But countries have also benefited from the impact on increased Chinese demand for commodities (Indonesia, Mongolia, Myanmar, and Lao PDR); services (e.g., Philippines, Thailand, and the Pacific Islands); from integration into global- and Chinalinked manufacturing value chains (e.g., Malaysia and Viet Nam); and from relocation of Chinese production (e.g., Cambodia and Viet Nam). The positive impact of China’s demand and supply has been felt not just through direct trade with China but also through changes in prices in global markets for EAP products that China demands and supplies.
Empirical analysis of the dual aspects of China’s influence in export and import markets shows that growth in other developing economies benefited more, on average, from China’s increasing demand for imports than it was hurt by China’s increasing competition in export markets. The net incremental effect is positive and statistically significant. The estimates suggest that a 1 percent increase in
China’s GDP per capita growth was associated with a 0.11 percentage-point increase in EMDE’s GDP per capita growth during 1995–2007, a 0.14 percentage-point increase in 2008–19, and a 0.13 percentage-point increase in 2020–23. Even though China’s per capita growth slowed down during 2020–23, the overall effect of its growth on average EMDE growth was still positive, at 0.67 percentage points—although smaller than the 1.1 percentage points during the 2008–19 period (figure I.19).
Trade restrictions and policy uncertainty
Tariffs on exports to the US remain above 2024 levels despite the US Supreme Court ruling on the tariffs imposed under the International Emergency Economic Powers Act (IEEPA) (figure I.20A). The so-called “reciprocal” tariffs were quickly substituted with a global 10 percent tariff imposed under Section 122. This is a provisional measure lasting until July 2026. Overall, the US tariffs imposed on most EAP countries decreased, especially for Lao PDR and Myanmar.
Importantly, the US tariffs on imports from China are now overall lower, which implies that the tariff
ASEAN EU US Others
FIGURE I.19 Developing economies’ growth benefited more from China’s increased demand for imports than was hurt by its increased competition in export markets, but the positive impact is declining.
A. Effect of China’s per-capita GDP growth through EMDE countries’ export similarities to Chinese imports and exports
Effect of China growth through export similarities to China imports Effect of China growth through export similarities to China exports
Estimated effect (Percentage points)
B. Aggregate effects of China per-capita GDP growth driven by countries’ export similarities to Chinese imports and exports
Net effect of China growth through similarities to China imports and exports
Net effect (Percentage point)
Source: world Bank 2024b.
Note: EMDE = emerging market and developing economies.
A. Estimated effects from regressing EMDE’s per-capita GDP growths on the interaction terms between China’s per-capita GDP growth and EMDE country’s export similarities to China’s imports (blue) and exports (red). Regression controls for country and year fixed effects, and EMDE’s lagged GDP per capita growth. Each bar height is a product of the estimated coefficients and EMDE’s average similarities calculated separately for the periods 1995–2007, 2008–19, and 2020–23. whiskers represent 90-percent confidence intervals. Export similarity to China’s exports and imports are measured using the definition proposed by Finger and Kreinin (1979), using detailed product-level data at the 4-digit level. This index takes values between zero and one. The higher the value, the closer the product distribution of exports in the two countries.
B. Estimated total effect is computed as the product of China’s average GDP per-capita growth and the effects shown in panel A, separately for each period.
differential between US tariffs applied to China and those applied to EAP economies has narrowed for most countries compared to end-2025 levels, although it remains above year-ago levels (figure I.20B). Malaysia, Mongolia, and the Philippines saw the sharpest compression, with differentials declining by 5–10 percentage points from their 2025 peaks. The differential, however, is still above 2024 levels. The tariff differentials for Cambodia, Indonesia, Thailand, and Viet Nam are comparable to their 2024 levels. This narrowing does not, however, constitute definitive evidence of a decrease in a competitive edge visà-vis China. The effective competitive edge relative to China depends not only on tariff differentials but also on relative changes in producer prices, markups, and demand elasticities.
Lastly, micro simulations show the expected negative effects of tariffs on real income for several EAP countries under three different scenarios: (1) the US protection level as of February 7, that is, before the pronouncement of the US Supreme Court; (2) the US protection level without the IEEPA tariffs but
before the imposition of the global 10 percent tariff; and (3) the current scenario. Not surprisingly, the countries most exposed to the potential negative effects of the US tariffs are Viet Nam, Thailand and Cambodia (figure I.20C).
Looking at the implications for trade flows, since 2017, China has reoriented its export flows markedly toward the developing EAP region and other EMDEs, with exports to both destinations more than doubling in nominal terms by 2025, while exports to the United States have declined and growth toward other advanced economies has been comparatively modest (figure I.21). ASEAN-5 economies doubled their exports to China and the US, with exports to other developing EAP economies rising by about 50 percent. These trends reflect strengthening intra-regional trade ties in intermediate and final goods, as well as a broader redirection of trade.
Underlying China’s expanding footprint in the region is an increasingly competitive pricing from
FIGURE I.20 US tariffs have increased for all EAP countries, but the differential vis-à-vis China is now lower than at the end of 2025.
Source: world Bank estimates. Note: EAP = East Asia and Pacific.
I.21
ASEAN-5
Source: Haver Analytics.
Note: 12-month moving average indexed to December 2017 level. AE = advanced economies; EAP = East Asia and Pacific; EMDE = emerging market and developing economies.
Chinese exporters. Across both apparel and automotive products, China’s exports to EAP have grown substantially in volume relative to global trends since 2017, while prices have remained consistently below global averages and trended lower over time (figure I.22). Together, these dynamics point to strengthening intra-regional trade ties in intermediate and final goods, driven in part by China’s ability to offer higher volumes at more competitive prices to its regional partners.
China’s exports to the region are dominated by intermediate goods, which have grown from
approximately US$13 billion in early 2020 to about US$25 billion by 2025—far exceeding exports of consumption goods, which have remained relatively stable at about US$5 billion to US$6 billion over the same period (figure I.23). The composition of these imports matters significantly for employment outcomes in recipient economies. Evidence from Viet Nam shows that imports of consumption goods are associated with a decline in employment of approximately 0.3 percent, as imported final goods compete directly with domestic producers. By contrast, imports of intermediate goods are associated with a rise in employment of
B. China
FIGURE I.22 China is exporting higher volumes at lower prices to the rest of EAP.
Sources: BACI; world Bank. Note: Fixed
–
Automotives include HS code 87. EAP = East Asia and Pacific.
FIGURE I.23 China exports mostly intermediate goods to EAP; evidence from Viet Nam suggests that final goods imports hurt employment whereas intermediate good imports increase employment.
A. Decomposition of China’s exports to ASEAN-5
B. Effect of imports to employment
Source: BACI; viet Nam’s LFS 2011–23; world Bank estimates. Note:
A. BACI data using BEC classification. B. variables are all in log terms. Bars denote regression coefficient for consumption goods and intermediate goods. Lines show confidence intervals.
approximately 0.5 percent, as imported inputs support domestic production and export activity. Since China’s exports to the region consist predominantly of intermediate goods, the net employment effect of trade with China is likely positive for most EAP economies—a finding with important implications for how trade restrictions on Chinese goods could affect labor markets across the region.
A key unresolved trade issue going forward is the implications of an increase in the stringency of the rules of origin applied by the United States to avoid “transshipment” or even high imported input
content from specific sources. While not yet fully specified in the recent bilateral agreements, there are likely to be tougher rules and a stronger demand for a more accurate tracing of the origin of the exported products.
More stringent rules of origin could represent a challenge for some EAP countries, whose exports often rely on imported intermediate inputs, notably from China. As figure I.24 shows, a significant share of production in several important export sectors in many EAP countries is represented by foreign value added. Clear examples are, for
A. China’s export price and quantity of apparel products
instance, textiles in Cambodia and Viet Nam, computer and electronics in the Philippines, Malaysia, Viet Nam and Thailand, and motor vehicles in Thailand.
Increased global policy uncertainty
Economic policy uncertainty, especially regarding trade policy, remains high: A news-based index reached its highest level since 1997 in June 2025, and though it has eased slightly, it remains elevated (figure I.25). Increased uncertainty about future economic policies at home and abroad can hurt investment and employment decisions in EAP. Firms adopt a “wait-and-see” approach, delaying or scaling back capital expenditures to avoid committing resources under unpredictable conditions. Evidence from firms in the region shows that a 1 standard deviation increase in economic policy uncertainty abroad significantly reduces investment growth and slows employment expansion, as firms prioritize liquidity and flexibility over longterm commitments. These effects are transmitted upstream and downstream through production networks.
Furthermore, economic policy uncertainty abroad can lead to shorter term contracts for workers and increase in informality. Evidence from Viet Nam’s Labor Force Survey (2011–23) shows that spikes in external trade-weighted uncertainty have significant and lasting effects on labor market outcomes (figure I.26). A one-sector-standard-deviation increase in uncertainty abroad raises the likelihood of workers holding temporary contracts by approximately 3–5 percentage points across the first three years following the shock—an effect that is positive, statistically significant, and robust to controlling for trade demand and general equilibrium effects on sector trade volumes (panel A). The impact on wages follows a different dynamic: the effect is statistically indistinguishable from zero in the first year, but becomes strongly and significantly negative by year two, and deepens further by year three (panel B). As uncertainty abroad rises, firms respond by shifting workers toward more precarious employment arrangements, and wages decline with a lag as these adjustments compound over time. These findings underscore that the labor market costs of global
FIGURE I.24 Increasingly stringent—still undisclosed— rules of origin could challenge Chinese input-dependent exporters in some countries and sectors.
020406080
Textile
Agriculture products
Food products
Paper products
Computer and electronics
Food products
Electrical equipment
Chemical products
Computer and electronics
Food products
Mining products
Refined oil products
Textile
Computer and electronics
Food products
Mining products
Mining products
Food products
Textile
Chemical products
Computer and electronics
Food products
Motor vehicles
Chemical products
Source: OECD Trade in value-added database. Data for 2019.
Note: Row = rest of world.
economic policy uncertainty extend well beyond short-term output losses, eroding both job quality and earnings over a multi-year horizon.
AI boom
The rise of AI and the surge in AI-related investment hold genuine potential to contribute to economic growth across the EAP region, but the extent to which this potential is realized will hinge on three key factors. The first is how productive AI ultimately proves to be at the global level—whether the technology delivers the broad-based efficiency and output gains that current enthusiasm anticipates. The second is how rapidly AI diffuses across EAP economies and whether the region is well positioned to absorb and leverage a productivity boom, including through adequate digital infrastructure, human capital, and institutional capacity. The third is the risk that AI expectations disappoint—a scenario in which the gap between hype and realized returns triggers a correction in financial markets, with potential spillovers to investment, capital flows, and
FIGURE I.25 Global economic policy uncertainty, especially around trade, remains elevated, and could hurt investment and employment.
Sources: Caldara et al. 2020; Ha et al. 2026.
Note: RHS = right-hand side.
A. Trade policy uncertainty index tracks frequency of uncertainty-related articles in major English language newspapers. The indices for global economic uncertainty and trade policy uncertainty are normalized such that 1 equals their 2000–2015 average.
B. Firm quarterly panel, OLS regression on each Uncertainty Measure: Ln(Yit
; Yit:
or Employment; ���� : firm fixed effects; Xit: leverage, Tobin’s Q, ln(total assets). Sample includes all listed firms in Indonesia, Malaysia, Philippines, Thailand, and viet Nam for the period 2000–24.
FIGURE
I.26
Uncertainty abroad increases informality and lowers wages.
A. Likelihood of workers having temporary contracts after spikes in uncertainty abroad
Ln(Wage) B. Wages of workers after spikes in uncertainty abroad
Sources: Fukuzawa et al. 2026; viet Nam’s LFS 2011–23.
Note: This figure reports sector-level local projection estimates of regressing labor market outcome variables (indicated in the subtitles) on external trade-weighted uncertainty. Dots show estimated responses to a one–sector-standard-deviation increase in uncertainty abroad. Bars are 95 percent confidence intervals computed using standard errors clustered at the sector level. All specifications include worker characteristics controls. Blue lines include the first-moment trade-demand control (trade-weighted external growth); red lines include the general equilibrium controls for sector trade volumes (ln exports and ln imports).
Sources: Quid 2025; Cushman and wakefield 2025.
Note: AI = artificial intelligence; EAP = East Asia and Pacific.
growth prospects across the region. How these three forces play out will largely determine whether AI becomes a meaningful driver of prosperity in EAP or a source of new vulnerabilities.
Global private investment in generative AI has grown at a remarkable pace, rising from near zero in 2019 to approximately US$34 billion in 2024, with the most dramatic acceleration occurring after 2022 as large language models and related applications captured widespread commercial interest. This global investment surge is beginning to translate into tangible infrastructure buildout across the EAP region, where data center capacity is expanding rapidly (figure I.27). Malaysia stands out as the clear regional leader, with roughly 700 megawatts (MW) already in operation and a substantial pipeline of capacity under construction and planned that could push its total to over 3,000 MW.3 Indonesia and Thailand are also seeing meaningful investment, with planned capacity far exceeding what is currently operational in both countries. Across the region, the dominance
3Data centers are extremely energy-intensive facilities, and measuring their capacity in megawatts of power consumption or power supply infrastructure is the standard industry metric—it captures how much electricity a facility requires to run its servers, cooling systems, and other equipment. A single large hyperscale data center can consume anywhere from 100 to several hundred megawatts, so the figures in the chart reflect substantial and growing electricity demand associated with AI infrastructure investment in the region.
of planned and under-construction capacity signals that the bulk of this investment wave is still to come, underscoring both the scale of anticipated demand for AI infrastructure in EAP and the potential economic implications—positive and otherwise—that this buildout may bring.
Productivity benefits of AI
A growing body of recent empirical research points to meaningful productivity gains from the adoption of generative AI tools across a range of professional tasks, with implications for labor costs and workforce efficiency. Studies conducted between 2023 and 2025 find consistent improvements in both the speed and quality of work: GitHub Copilot increased programming speed by 56 percent in JavaScript coding tasks and raised task completion rates in software development by 26 percent; ChatGPT-3.5 boosted professional writing speed by 40 percent while improving output quality by 18 percent; and GPT-4 raised task completion rates by 12 percent and speed by 25 percent in a management consulting setting. Similar gains are documented in customer service, job matching, and recruitment (annex table IA.1). Taken together, these findings suggest that generative AI tools can allow workers to accomplish more in less time— effectively reducing the labor input required per unit of output and, by extension, the associated
labor costs—although the ultimate impact on employment and wages will depend on how firms choose to deploy these productivity gains.
Suggestive evidence points to AI’s potential to contribute meaningfully to productivity growth. First, generative AI has been adopted at a pace that outstrips any previous general-purpose technology: within just 2 to 3 years of its introduction, adoption rates already exceeded 50 percent—a threshold that took the internet roughly 7 years and personal computers more than 2 decades to reach (figure I.28). Second, the historical record offers a useful, if imperfect, parallel: both PC adoption in the 1980s and internet adoption in the late 1990s were followed by sustained upswings in US nonfarm business labor productivity. Productivity growth, which had been trending downward since the mid-2010s, appears to have begun turning upward again around 2020— coinciding with the early stages of AI diffusion. These patterns are consistent with the possibility that AI could catalyze a new wave of productivity growth, much as earlier general-purpose technologies did, although the historical analogies are imperfect and the ultimate magnitude and breadth of any AI-driven productivity boom remain deeply uncertain.
The academic literature, however, offers no consensus on the likely magnitude of the productivity gain of AI, and estimates vary enormously depending
on the assumptions made. Projected annual productivity or total factor productivity (TFP) gains range from as little as 0.07 percentage points per year—in Acemoglu’s (2024) conservative scenario, which assumes narrow task coverage, slow diffusion, and limited economic reorganization—to as much as 0.6 percentage points per year in more optimistic assessments such as Bergeaud (2024), which emphasizes reallocation toward frontier firms (annex table IA.2). Cumulative level effects span an equally wide range, from just 0.7 percent over a decade to as much as 12 percent over 10 to 20 years. The key source of disagreement across studies is not the technology itself but the assumptions about how broadly and quickly AI will diffuse across firms and sectors, and whether it will trigger the kind of deep economic reorganization that amplifies productivity gains—as occurred during the late-1990s IT boom. Taken together, the literature suggests that AI could deliver meaningful productivity dividends, but the uncertainty surrounding the timing, breadth, and ultimate scale of those gains remains substantial.
AI diffusion and readiness in EAP
AI-related exports have expanded rapidly across several EAP economies in recent years (figure I.29). Viet Nam and Malaysia stand out, with AI export shares rising from about 20 and 28 percent of GDP in 2023 to approximately 32 and 34 percent by
Source: Generative AI Adoption Tracker (Bick et al.): Apollo Chief Economist.
FIGURE I.28 AI has the fastest adoption rate, and some evidence suggests we are likely in the early stages of a productivity boom.
A. Adoption of different technologies
B. US labor productivity
years.
Sources: world Bank calculations based on world Trade Report 2025. Note: AI-related exports follow the wTO (2025) classification of AI-enabling products covering raw materials, processed chemicals, intermediate inputs, and equipment. The left-hand scale shows total AI and non-AI exports as a percent of GDP. The right-hand scale shows the two largest AI components separately: intermediate inputs (e.g., processors, integrated circuits, semiconductor wafers) and equipment (e.g., semiconductor manufacturing machinery). See wTO (2025), Annex A for the full product list. AI = artificial intelligence; EAP = East Asia and Pacific.
2025, respectively—among the highest shares globally. Thailand also shows a meaningful increase in AI exports over the period, rising from about 12 to 16 percent of GDP. By contrast, Indonesia’s AI export share remains negligible, and the Philippines shows a modest decline. These shares dwarf those of major advanced economies, where AI export shares range from about 2 percent of GDP for the United States and the EU to 4 percent for Japan.
Intermediate goods—particularly semiconductors— remain the backbone of AI-related trade across the region, although equipment exports such as data center hardware have grown meaningfully. Viet Nam is especially notable, with equipment exports rising from about 7 to over 15 percent of GDP, pointing to its emergence as a significant hub for AI-related hardware assembly. Malaysia and Thailand similarly show growth in both components, although intermediates remain the larger share. At the other end of the spectrum, the Philippines’ AI exports are modest
and predominantly intermediate-based, while Indonesia’s AI export footprint remains negligible. Taken together, the figure underscores that EAP’s role in the global AI supply chain is deepening, with the region contributing across both the upstream (intermediates) and downstream (equipment) segments—although the degree of participation varies considerably across economies.
Early evidence suggests that AI is diffusing slowly across EAP, although assessing the true pace of adoption is complicated by the absence of a universal or consistent measure of AI use (figure I.30). Depending on how AI adoption is defined and measured— whether through firm-level surveys, online job postings, machine learning software use, or AI-related task exposure at the occupational level—estimates can vary considerably; most available data sources are biased toward larger firms, English-speaking markets, or advanced economies where data are more readily available. What evidence does exist points to a region that remains in the early stages of AI FIGURE I.29 EAP’s technology exports have been increasing in recent years; intermediate goods dominate AI-related trade in EAP, but trade in
FIGURE I.30 Early evidence suggests AI is diffusing slowly in much of EAP.
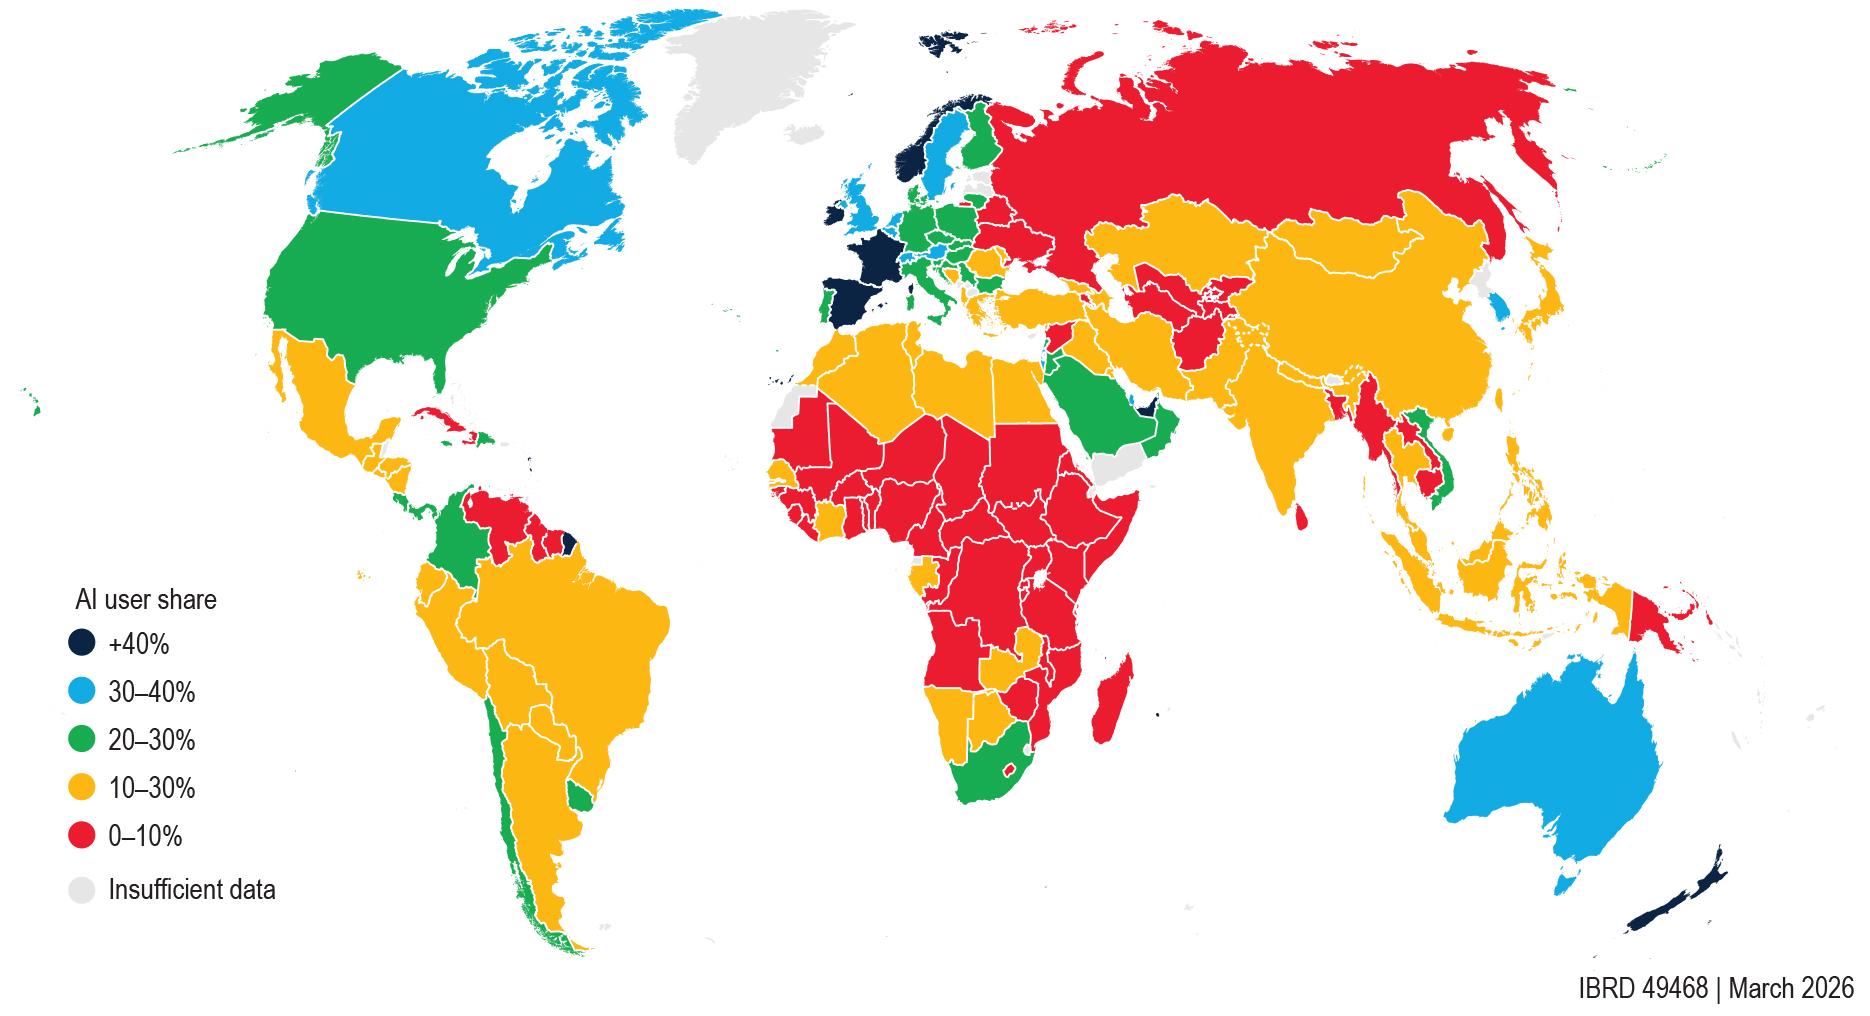
Source: Microsoft.
Note: AI = artificial intelligence; EAP = East Asia and Pacific.
diffusion: only about 13 to 17 percent of multinational enterprise subsidiaries in China and Thailand use AI, compared to 37 percent in the United States, and AI adoption is heavily concentrated among multinationals, with domestic firms lagging well behind. Moreover, the share of EAP jobs involving tasks that are complementary to AI—and thus positioned to benefit from it—is only about 10 percent, compared to 30 percent in advanced economies, reflecting the region’s higher concentration of employment in agriculture and routine manual occupations. Taken together, these patterns suggest that while AI investment is flowing into the region, its diffusion into the broader economy remains nascent, and the region’s ability to translate that investment into widespread productivity gains will depend critically on closing gaps in digital infrastructure, skills, and firm-level technological readiness.
Over the longer term, AI holds considerable promise as a driver of productivity growth across EAP. AI readiness across EAP, and the ability to take advantage of the productivity benefits of AI, can be assessed through four dimensions—connectivity, computing, context, and competency (World Bank
2025c). On connectivity, most large EAP economies lag advanced economies, weighed down by relatively low fixed broadband penetration (figure I.31). Computing capacity is a relative strength, with Malaysia and Indonesia having made substantial investments in data centers. On context, EAP hosts 7 percent of global AI startups and draws 8 percent of venture capital funding, but activity is heavily concentrated in China; most other economies— including Indonesia, Malaysia, the Philippines, Thailand, and Viet Nam—each have fewer than 40 AI startups and attract very limited VC funding, pointing to significant room to strengthen practical AI innovation and commercialization.
On competencies, over one-third of the EAP workforce has received tertiary education, with China and Mongolia leading the region. More than half the population in most EAP economies possesses basic or intermediate digital skills, although disparities are wide: intermediate digital skills are present in 64 percent of the population in Malaysia but only 17 percent in Viet Nam, underscoring the uneven foundation on which economies across the region are building their AI capabilities (World Bank 2025c).
Sources: wDI, ITU, Telegeography, CB Insights, world Bank calculations based on Digital Progress and Trends Report 2025. Note: vertical and horizontal dashed lines indicate the global medians of the variables shown in each chart.
Financial risk of AI
China stands apart, with a scale of investment, talent, and data infrastructure that is difficult to match and that is essential for driving frontier innovation. For example, China dominates the development of notable machine learning models within EAP, responsible for 75 percent of the region’s models and 12 percent of the global total (World Bank 2025c). Other large EAP economies—including Indonesia, Malaysia, the Philippines, and Thailand—demonstrate only moderate levels of AI readiness, while smaller and lower-income economies in the region lag further behind, raising concerns about their capacity to absorb and benefit from the technology (figure I.31). Smaller economies need not aim to lead at the frontier; they can still generate meaningful gains by focusing on AI adoption and customization in high-value niches or sectors where local context and domain knowledge confer a comparative advantage. But even this more modest path requires a baseline of digital infrastructure, human capital, and institutional capacity that remains underdeveloped across much of the region.
Financial market indicators point to growing risks from AI-related exuberance in advanced economies, with potential adverse spillovers for developing EAP. Both the overall S&P 500 priceto-earnings (P/E) ratio and the tech sector P/E ratio have risen sharply since the mid-2010s, with tech valuations again reaching levels reminiscent of the dot-com era (figure I.32). Compounding this, market concentration—measured by an inverse Herfindahl-Hirschman index—has climbed to its highest level since 2008, as a narrow group of AIand IT-related stocks has come to dominate index performance. This combination of stretched valuations and extreme concentration amplifies the risk of a sharp correction: if AI-related earnings disappoint or investor sentiment shifts, the unwinding of positions in a small number of heavily weighted stocks could trigger outsized marketwide declines. A significant repricing of AI assets in US equity markets could tighten financial conditions across EAP, dampening investment at a time when AI infrastructure buildout is still gaining momentum.
FIGURE I.31 EAP economies show mixed AI readiness, with computing strengths offset by connectivity gaps and an underdeveloped startup ecosystem outside China.
Number of AI startups
Share of workforce having tertiary education (Percent)
B. AI startups and labor skills
Asia AEs Other EMDEs
FIGURE I.32 Concentration risk has risen to historically high levels, with a narrow group of IT- and AI-related stocks predominantly driving the S&P 500.
A. Valuation of US stocks
S&P 500 P/E ratio
S&P 500 tech P/E ratio
(RHS, inverted)
(1/HHl, inverted)
B. AI stocks vs. overall index in the US
(30Nov22 = 100)
AI (Apple, META, MSFT, AMZN, GOOGL and TSLA)
S&P 500 Index
Sources: S&P Dow Jones Indices LLC (via MacroMicro); wind Financial Terminal; world Bank calculations.
Note: Forward P/E is the 12-month-forward price-to-earnings ratio. Concentration risk is measured by the inverse Herfindahl-Hirschman Index (1/HHI), plotted on an inverted right scale—upward movement indicates greater concentration. HHI is calculated from S&P 500 constituent market capitalizations. AI = artificial intelligence; AMZN = Amazon; AAPL = Apple; GOOGL = Google; IT = information technology; MSFT = Microsoft; P/E = price-to-earnings ratio; RHS = right-hand side; SPX = S&P 500 Index. TSLA = Tesla.
P/E ratios across emerging market economies in the region remain well below those of the US. The S&P 500 P/E ratio has climbed toward 30 in recent years, while most regional markets have hovered in the 10–20 range over the same period (figure I.33). Despite this relative undervaluation, stock prices of the largest firms—measured by market capitalization—especially those in tech sector, have risen sharply in some of the region’s economies. The increase is most notable in China, the Philippines and Viet Nam, where the median stock price of the top 10 firms increased by nearly four-fold and three-fold, respectively, since January 2022, far outpacing the broader market indices in those countries. This divergence points to a pattern of concentrated gains among a narrow set of large-cap and tech firms, even as regional equity markets appear modestly valued overall.
Domestic policy
While external conditions shape the environment in which EAP economies operate, domestic policy remains a powerful determinant of economic performance. Three broad categories of domestic policy levers are identified: (1) macroeconomic
policy, encompassing fiscal and monetary decisions that influence aggregate demand, price stability, and public debt sustainability; (2) structural reforms, which improve the functioning of markets and institutions; and (3) industrial policy, through which governments actively promote specific sectors or industries to foster innovation, enhance competitiveness, and support job creation. Together, these domestic policy choices determine how effectively EAP economies can harness external tailwinds and buffer against external headwinds.
Macroeconomic policy
Fiscal policy
Fiscal policy continues to support growth, although most countries are expected to gradually consolidate their fiscal positions over 2025–26 (figure I.34). China’s fiscal deficit stands at about 7–8 percent of GDP—well above its 2015–19 average of approximately 3.5 percent—reflecting the scale of recent stimulus measures, including infrastructure investment, equipment and consumer subsidies, and increased social spending. Malaysia and the Philippines are running deficits of about 4 and
Sources: CEIC; Macromicro and Gurufocus; Haver Analytics; Bloomberg.
Note: Firm size is based on market capitalization. Technology firms are those in ICT or electronics sector among the
medium-term fiscal consolidation, particularly as rising public debt constrains the space for further stimulus.
Source: world Economic Outlook, IMF. Note: EAP = East Asia and Pacific.
3.5–4 percent of GDP, respectively, both above their pre-pandemic averages, as governments continue to support growth amid elevated uncertainty. Indonesia’s deficit remains relatively close to its historical norm at about 2–3 percent of GDP. Thailand presents the starkest shift: from a pre-pandemic fiscal surplus of about 0.5–1 percent of GDP, it is now projected to run deficits of approximately 2–2.5 percent of GDP through 2026, reflecting the cost of recent stimulus programs. The persistence of elevated deficits across the region underscores the tension between near-term growth support and
Public debt across EAP remains elevated relative to pre-pandemic levels in the majority of economies in the region. Comparing current and projected debt-to-GDP ratios for 2024–26 against the 2015–19 average, most economies—including China, Indonesia, Malaysia, the Philippines, Thailand, Fiji, Lao PDR, Palau, and Solomon Islands—show substantially higher debt burdens (figure I.35). Some of the most dramatic increases are seen in Lao PDR and Palau, where debt now approaches or exceeds 90–100 percent of GDP, compared to roughly 30–55 percent before the pandemic. A few economies, notably Viet Nam, Mongolia, and Samoa, are exceptions where debt ratios have declined or stabilized relative to the pre-pandemic period. Compounding fiscal pressures, interest payments as a share of GDP have also risen across much of the region, with Lao PDR and the Philippines among the most affected, and several Pacific island economies similarly facing higher debt servicing costs relative to their pre-pandemic baselines. Together, these trends point to a tighter fiscal space across EAP, as governments contend with both larger debt stocks and rising costs of servicing them.
FIGURE I.33
FIGURE I.35 Public debt is higher than pre-COVID-19 in the majority of EAP economies, while interest payments have increased.
Source: world Bank Macro Poverty Outlook, available at https://data360.worldbank.org/en/int/dataset/wB_MPO (panels A–B); world Economic Outlook (panels C–D).
Note: Bars show 2024–26 projections; light blue markers denote 2015–19 averages.
Monetary policy
Monetary policy across much of the region has remained broadly accommodative, supporting economic activity as inflation stays largely anchored within central bank target bands in most major economies. However, notable divergences have emerged. In Myanmar, elevated inflation continues to reflect significant currency depreciation alongside persistent supply-side disruptions stemming from ongoing conflict and trade restrictions (World Bank 2025a). Indonesia presents another exception, where headline inflation faced upward pressure from the expiration of temporary electricity subsidies, recent adjustments to water tariffs, and rising food prices (figure I.36). Specifically, Indonesian food inflation climbed to 3.5 percent, driven by a combination of adverse weather
conditions and increased demand associated with the rollout of the new free school meals program. In China, supply continues to outpace demand, exerting downward pressure on consumer and producer prices. Cuts to policy rates and the reserve requirement ratio, together with support for the property sector and equity markets, are easing financial conditions, although weak credit demand and a slow housing market may limit the growth impact.
Global financial markets remain cautious. Central banks in major advanced economies lowered policy rates in 2025 (figure I.37). And, in the region, sovereign spreads declined, partly due to falling interest rates in the United States (box I.2). However, this trajectory shifted in the first quarter of 2026, with spreads widening across EAP economies,
FIGURE I.36 Monetary stance has been supportive as inflation remains low.
A. Policy rate
Source: Haver Analytics.
Note: CPI = consumer price index.
FIGURE I.37 Financial conditions have improved as expectations of further US policy rate reductions have increased and sovereign spreads in EAP economies have declined.
Sovereign spreads, selected EAP economies
Basis points
China Indonesia Malaysia Philippines
Sources: JP Morgan; Haver Analytics and the United States Federal Reserve Bank of Atlanta.
Note: EAP = East Asia and Pacific.
likely due to heightened external uncertainties, shifting expectations around global monetary policy, and the recent commodity price volatility stemming from geopolitical developments. Specifically, as illustrated by recent futures pricing, market expectations for the US federal funds rate trajectory have adjusted upward between January and March 2026, signaling a more cautious outlook on the pace of further monetary easing.
Narrowing yield differentials weighed on portfolio capital flows across the region in 2025. As median bond yields in developing EAP trended downward while US yields remained elevated, the yield spread
compressed, reducing the relative attractiveness of regional assets (figure I.38). The result was largely subdued and divergent capital flows. China saw the sharpest contraction, recording cumulative outflows exceeding US$80 billion by year-end. Major ASEAN economies—including Indonesia, Thailand, and Viet Nam—also faced persistent net outflows as investors adjusted to less favorable rate differentials.
Exchange rate trajectories across EAP diverged in 2025, reflecting a mix of shifting external conditions and domestic fundamentals. The Malaysian ringgit and Thai baht benefited most from the
BOX I.2 US Federal Monetary Policy and EAP Economy Premiums
Empirical evidence suggests that United States Federal Reserve monetary policy easing is associated with lower bond spreads across EAP emerging economies (figure I.B2.1). Fed actions that decrease the 10-year treasury note by 1 percentage point consistently reduce spreads in all five economies examined, with the largest effects in Thailand and the Philippines (more than 100 basis points), followed by Malaysia (approximately 75 basis points), and China and Indonesia (less than 30 basis points).
FIGURE I.B2.1 US federal monetary policy easing is correlated with lower spreads
Source: Liu 2026.
Note: The bars show daily effects on the day of the US Federal Reserve’s Federal Open Market Committee announcements.
FIGURE I.38 Real interest differentials with advanced economies increased in some EAP countries earlier in 2025 but have stabilized, leading to capital outflows in some countries.
Long-term real 10-year government bond yield
Cumulative capital flows
C. Exchange rates, US dollar to local currency unit
Sources: Haver Analytics; IIF.
Note: EAP = East Asia and Pacific; LCU = local currency unit; RHS = right-hand side.
A. Based on data for China, Indonesia, Malaysia, and the Philippines.
B. Red line shows the median of developing EAP; gray area indicates the 25th–75th percentile range. Series are 3-month moving averages.
C. Capital flow includes equity flow and debt flow. viet Nam only shows equity flow.
Federal Reserve’s easing cycle. Malaysia’s exchange rate appreciated nearly 15 percent, further supported by a surge in foreign direct investment (FDI) into semiconductor and AI infrastructure. The Thai baht’s appreciation was also supported by strong gold re-export activity, which boosted Thailand’s trade surplus and generated sustained foreign exchange inflows. By contrast, the Indonesian rupiah depreciated roughly 4 percent, weighed down by market concerns over fiscal policy and capital outflows triggered by MSCI’s decision to freeze Indonesian securities in its index, prompting Bank Indonesia to intervene. The Vietnamese dong also saw net depreciation, while the Chinese renminbi appreciated modestly and the Philippine peso ended the period broadly flat after early gains were eroded by fluctuating trade dynamics.
Structural reforms
Major economies in the EAP region undertook wide-ranging structural reforms from the early 1980s through the early 2000s, spanning trade, domestic finance, and product markets. Since then, however, the pace of reforms has slowed (World Bank 2023). To an extent, the slowing reform is a consequence of significant prior liberalization that leaves limited room for further reforms, especially the politically difficult “last mile” improvements in policy. Nevertheless, the latest available data across all reform areas suggest that there are still sizeable gaps in reforms of developing EAP countries relative to a sample of advanced economies (figure I.39).
Even in a difficult external environment, EAP countries can forge a dynamic path. But supporting near-term growth through fiscal measures may deliver less durable development benefits than deeper domestic reforms. Growth in China and Indonesia is relatively high, but measures to sustain growth today may not be conducive to growth tomorrow. Current growth (of about 5 percent per annum) exceeds estimates of potential growth, largely thanks to government support (World Bank 2025a). Reforms, such as addressing non-tariff barriers, especially in services, as well as deregulation and business licensing simplification (in the case of Indonesia), could enhance potential growth and productive job creation.
China has formulated a medium-term policy strategy to navigate three structural transitions—economic rebalancing, technological advancement, and the green transition—while addressing ongoing financial vulnerabilities. For 2026, China has set a GDP growth target of 4.5–5.0 percent, below the 5.0percent target in 2025. Fiscal policy is expected to be less expansionary, with an estimated fiscal impulse of about 0.4 percent of GDP. Taken together, these measures aim to balance short-term growth with the need to support ongoing structural transitions.
Domestic demand is expected to play a larger role in driving China’s growth, although the pace of rebalancing toward consumption is likely to remain moderate. Fiscal stimulus continues to rely on infrastructure investment, while direct support to households is expanding only gradually. Reforms to strengthen the social safety net and complete the shift towards service provision based on place of permanent residence—rather than household registration—are expected to progress gradually.
Investment is expected to remain resilient to support industrial upgrading, technology diffusion, and the green transition. With respect to technological advancement, greater efforts will aim at large-scale deployment of digital and AI technologies across the economy to consolidate productivity gains. The green transition remains a priority, with emission intensity targets, efficiency standards, and public investment driving the change. These will be complemented by an expansion of the national carbon market and the introduction of emission caps over the medium term.
Financial stability policies in China remain focused on containing risks in the property sector, local government debt, and smaller financial institutions. Incremental fiscal reforms to strengthen public finance management and local fiscal capacity will complement the ongoing debt-swap program. The program replaces off-budget local government debt with on-budget bonds. Together, these measures are expected to modestly ease local fiscal stress. However, more decisive balance sheet restructuring and deeper fiscal reform are needed to tackle financial vulnerabilities and ensure adequate fiscal resources to finance rising spending needs, including due to population aging.
FIGURE I.39 EAP countries will need
Note: Overall and sectoral reform indices are continuous indicators taking a value in the [0–1] interval. A higher value indicates greater degree of liberalization (lower intensity of restrictions). Lines represent 3-year-moving-average fits. Trade reforms is a composite index capturing the degree of liberalization in tariffs and the current account. Domestic finances reform captures the degree of liberalization in credit and interest rate controls, banking entry and supervisions, privatization, and security markets. Product market reform captures the degree of liberalization in two representative sectors of electricity and telecommunication. All indicators reported in 2020, except for domestic finances reform index for Japan, Singapore, and United States (2014). EAP = East Asia and Pacific.
Recent structural reforms in other countries are likely to improve economic efficiency and support growth. For instance, the Philippines has opened key sectors to greater competition—including logistics, telecoms and renewable energy—and is seeking to build the capabilities of the labor force through the newly enacted Enterprise-Based Education and Training (EBET) framework. Viet Nam, too, has launched a wave of institutional reforms aimed at creating a more efficient state. In late 2024, the government began significant bureaucratic restructuring, reducing ministries and agencies, consolidating local governments (reducing provinces from 63 to 34 and removing district-level governments); streamlining public employees (reducing staff by 20 percent or at least
100,000 employees over 5 years); and reforms such as the new Land Law, State Budget Law, and streamlined business services to improve the investment climate. In both countries, improved economic performance will depend on the implementation of the reforms.
A longer view
A longer-run perspective on the sources of growth reveals structural challenges for the region. In EAP excluding China, capital accumulation has been the dominant driver of output growth throughout the past five decades, consistently contributing 2–4 percentage points in each period (figure I.40). The contribution of TFP—the efficiency with
Source: world Bank estimates, based on earlier work by Alesina et al. 2020.
FIGURE I.40 A longer view: Capital accumulation, not productivity improvements, has driven recent growth in the region outside China.
Source: APO.
which inputs are transformed into outputs—has been declining and remains modest. After contributing 1.3 percentage points in 2000–05, TFP’s contribution fell to just 0.1 percentage points in 2010–15 before recovering slightly to 0.4 percentage points in 2015–23. The contribution of hours worked has also diminished as populations age, falling from 1.4 percentage points in 1970–75 to 0.4 percentage points in 2015–23.
In China, TFP appears to have played a more significant role, contributing 1.6 percentage points to output growth in 2015–23, even as it has declined from an average of above 3 percentage points in 1980–2010. Capital accumulation related to information and communication technologies sector (ICT) has also contributed more in China (0.6 percentage points) than in the rest of the region (0.1 percentage points), reflecting China’s more advanced digital economy. However, China faces headwinds from a shrinking labor force, with employment now deducting 0.3 percentage points from output growth. As the returns to capital accumulation diminish and labor supply tightens, sustaining growth across the region will increasingly depend on productivity improvements that have remained elusive, particularly outside China.
One reason for the slowdown in productivity growth is that the pattern of sectoral structural change has
shifted in the past 2 decades. The share of high productivity manufacturing in GDP that had increased until early 2000s in all countries in the region has decreased since then except in Cambodia and Viet Nam (figure I.41). Nonetheless, the share is still higher than in most other EMDEs and advanced economies (AEs) in China, Malaysia and Thailand reflecting their comparative advantage in several manufacturing sectors. The share of relatively low productivity services in GDP has steadily increased in most economies and is especially high in the Philippines.
Another reason for the slowing productivity is the relative underperformance of frontier firms. The productivity growth of the national frontier firms in EAP economies has been falling further behind the global frontier in digital-intensive sectors in recent years (figure I.42). For example, in digital manufacturing sectors, between 2005 and 2015, the productivity of the global frontier increased by 76 percent, whereas the national frontier firms in Indonesia, Malaysia, the Philippines, and Viet Nam increased their productivity by only 31 percent on average. For less digital-intensive sectors, the gap between the national frontier firms and the global ones is less stark. The relative stagnation of the national frontier is also observed in developing countries beyond EAP, although to a lesser extent. Since new technologies typically arrive first at the
A. EAP excluding China
FIGURE I.41 In recent years, the share of manufacturing in GDP declined in EAP economies other than Cambodia and Viet Nam, and the share of services in GDP increased.
Source: wDI.
Note: Advanced Asia includes Japan, the Republic of Korea, and Singapore. Country groups exclude those with less than 1 million population. EAP = East Asia and Pacific; EMDE = emerging market and developing economies.
FIGURE I.42 Firms at the national frontier in EAP countries are falling behind the global frontier, especially in digital-intensive sectors.
A. Distance between national and global frontier, digital-intensive sectors
Index (First year = 0)
VNM—Manufacturing MYS—Manufacturing CHN—Manufacturing IDN—Manufacturing PHL—Manufacturing PHL—Services
B. Distance between national and global frontier, less digital-intensive sectors
(First year = 0)
Source: world Bank calculations using Statistical Office micro-data and Criscuolo 2023 for global frontier.
VNM Manufacturing MYS—Manufacturing CHN—Manufacturing IDN—Manufacturing PHL—Manufacturing PHL—Services
Note: National frontier is defined as the 90th percentile firm productivity for each country and industry. Digital intensity of sectors is defined according to Eurostat. EAP = East Asia and Pacific.
frontier, and then spillover to other firms, revitalizing the national frontier firms matters for the future growth of all firms.
I.3 Outlook and risks
Growth in developing EAP is projected to moderate to 4.2 percent in 2026, as the conflict in the Middle East raises commodity prices, trade barriers and economic policy uncertainty remain elevated,
and the boost from export front-loading ahead of higher tariffs fades. Higher energy prices are likely to increase input costs for many EAP economies and pass through to inflation, weakening purchasing power. Trade policy uncertainty is expected to persist, weighing on private investment and hiring decisions across the region. Selected electronics exports remain temporarily exempt from additional tariffs— benefiting Malaysia, the Philippines, Thailand, and Viet Nam—although the durability of these exemptions is uncertain. Garment exporters, particularly
Cambodia and Lao PDR, face sharper tariff shocks. China is increasingly redirecting exports toward non-US markets, but this shift may heighten competitive pressures in third markets.
China is projected to grow at 4.2 percent in 2026, down from 5.0 percent in 2025 due to cautious consumer spending, ongoing property sector adjustment, and slowing external demand. The negative impact of the conflict in the Middle East on the domestic economy is expected to be mitigated in the short term by ample oil reserves and policy support. Growth in the rest of the region is projected to moderate from 4.9 percent in 2025 to 4.1 percent in 2026. Viet Nam is expected to grow by 6.3 percent, supported by strong public and private investment, and sustained FDI inflows. Indonesia’s growth is projected to slow to 4.7 percent, as headwinds from higher oil prices and risk-off sentiment will be partly offset by commodity revenues and state-led investment initiatives. Reflecting its net energy exporter position, Malaysia’s growth is projected to slow to 4.4 percent, while aided by a strong labor market and household income support measures. Mongolia’s growth is expected to ease modestly but remain robust at 5.0 percent on the back of strong mining and infrastructure activity.
The Philippines stands out as one of the economies in the region most acutely exposed to oil price shocks. Rising fuel costs are straining the transport sector and driving up logistics and commuting expenses for businesses and households alike. Higher energy and fertilizer prices are likely to feed through to food costs, and lower household purchasing power. The government’s declaration of an energy emergency underscores the severity of the situation. Growth is projected to remain below potential at 3.7 percent. Thailand is projected to slow to 1.3 percent, as external shocks compound domestic structural constraints—elevated household debt, tight credit conditions, and a slow tourism recovery. Cambodia’s growth is expected to ease to 3.9 percent as declining remittances and higher imported energy costs dampen consumer demand. Lao PDR is projected to grow at 3.5 percent, as high fuel prices hit FX liquidity and consumption, and policy space remains constrained
by unsustainable public debt. Myanmar’s economy is expected to rebound by about 2.0 percent, but growth remains constrained by external headwinds and deep-rooted structural weaknesses, stemming from protracted conflict, power outages, labor shortages, and the 2025 earthquake. Timor-Leste, having ceased petroleum production in 2025, will rely on its Petroleum Fund, with one-off veteran pension payments sustaining non-oil GDP growth at 4.1 percent.
By 2027, regional growth is expected to increase slightly to 4.4 percent. While China’s growth is expected to stay at 4.3 percent under the weight of demographic aging, elevated debt, and diminishing returns to investment, growth in the rest of the region is projected to pick up to about 5.0 percent as oil prices stabilize, global policy uncertainty dissipates, and domestic and external demand strengthen. Indonesia is expected to edge up to 5.2 percent, supported by Danantara investment and monetary easing, while the Philippines is projected to recover to trend growth of about 5.6 percent as public investment execution normalizes. Viet Nam is expected to grow strongly at 7.6 percent and Cambodia to strengthen to 4.9 percent as manufacturing investment absorbs returning migrants. Mongolia remains robust at 5.5 percent. Thailand’s recovery is projected to stay subdued, constrained by high household debt and weak private investment. Lao PDR and Myanmar face more difficult trajectories—the former squeezed by debt service obligations, the latter rebounding only modestly from a low base amid ongoing conflict and structural weakness.
Across the Pacific Islands, growth is projected to remain positive but uneven. Papua New Guinea is expected to moderate to around 3.8 percent in 2026 and 2027 as resource-sector momentum stabilizes, while higher fuel and freight costs weigh on non-resource activity. Solomon Islands is projected to hold at an average of 3.1 percent in 2026 and 2027, supported by mining and remittances. Facing external headwinds, Samoa, Tonga, and Palau are expected to remain more resilient, backed by tourism, overseas labor income, and public investment, though higher fuel costs may temper momentum. Vanuatu, the Federated States
TABLE I.2 GDP growth
Source: world Bank.
Note: Percent growth of GDP at market prices. values for 2025 for the small island economies refer to GDP growth estimates. values for Timor-Leste represent non-oil GDP. For the following countries, values correspond to the fiscal year: Federal States of Micronesia, Myanmar, Palau, and Republic of the Marshall Islands (October 1–September 30); Nauru, Samoa, and Tonga (July 1–June 30).
of Micronesia, and the Marshall Islands face more constrained outlooks, reflecting limited diversification, high import dependence, and high exposure to climate and external shocks (box I.3).
Risks to the regional outlook remain tilted to the downside, reflecting a combination of external and domestic vulnerabilities. Four interrelated external risks could constrain growth below baseline projections.
• First, geopolitical tensions remain an important source of downside risk. Escalating conflicts in systemically important regions—Middle
BOX I.3 Pacific Island Countries (PIC11)a
Growth across the Pacific Island Countries (PIC11) stabilized at a little above 3 percent in 2025 following a turbulent start to the year. A stronger second half— supported by tourism and remittance led demand— helped normalize activity back toward pre-pandemic trends. Fiji, accounting for more than half of regional output, remained the principal driver of the aggregate, expanding by 3.2 percent on the back of strong longhaul arrivals and fiscal stimulus from the FY26 budget. Solomon Islands grew by 3.6 percent, supported by investment in mining, fisheries, and public infrastructure, although the structural decline in logging revenues continues to narrow the fiscal base (figure I.B3.1).
Tourism- and remittance-led economies recorded mixed but generally positive outcomes. Palau posted the strongest growth in the region (7.9 percent), driven by a rebound in arrivals from Asia and improved air connectivity. Samoa and Tonga benefited from strong remittances, which remain a stabilizing force despite cost-of-living pressures in host economies. Vanuatu’s recovery remained gradual (1.7 percent), constrained by lingering effects of natural disasters and the operational restructuring following Air Vanuatu’s collapse.
Among sovereign rent–led economies, growth averaged 2.6 percent in 2025, supported by fishing-license revenues and donor-financed investment. RMI accelerated to 2.6 percent following approval of the new Compact of Free Association, while FSM and Kiribati also expanded on the back of Compact inflows and large capital programs.
Fiscal positions weakened across 9 of the 11 PICs in 2025 as governments paused consolidation and adopted stimulus to counter early year global uncertainty. Public debt ratios continued to edge down modestly due to nominal GDP growth, but Kiribati, Tonga, Tuvalu, and Vanuatu remain at high risk of debt distress. Early 2026 geopolitical tensions have added fiscal pressures through higher fuel costs for utilities, potential support for aviation and shipping, and demand for temporary household protection.
Inflation moderated across most economies in 2025, with the regional median falling to about 3.4 percent (figure I.B3.2). Fiji experienced negative inflation late in the year as imported price pressures unwound. However, the escalation in the Middle East in early
A. GDP growth in Fiji, PIC-11, and PIC-11, excluding Fiji
Sources: Haver Analytics; International Monetary Fund Article Iv 2024, 2025; world Bank.
Note: All data in the report are presented on a calendar year basis for consistency and comparability. For countries with a fiscal year different from the calendar year, data on a calendar year basis are computed based on fiscal year estimates. Data corresponding to fiscal years are explicitly indicated as such. Recent developments reflect higher risk premia in energy markets and elevated freight/insurance costs; a severe disruption scenario—though not our baseline—would amplify these channels substantially. PICs = Pacific Island Countries; PIC-11 = Federated States of Micronesia, Fiji, Kiribati, Marshall Islands, Nauru, Palau, Samoa, Solomon Islands, Tonga, Tuvalu, and vanuatu; TR = tourism- and remittance-led economies; SR = sovereign rent–led economies.
FIGURE I.B3.1 GDP growth and fiscal balance in PICs
B. Fiscal balance
BOX I.3 Pacific Island Countries (PIC11) (continued)
FIGURE I.B3.2 Inflation in PICs
Sources: International Monetary Fund; world Bank.
Note: PICs = Pacific Island Countries; PIC-11 = Federated States of
2026 has lifted refined product prices and freight premia, raising near-term inflation risks, particularly for economies with limited tariff smoothing or vulnerable utilities.
Looking ahead, growth across the PIC 11 is projected to slow to 2.8 percent in 2026, below the 2025 outturn. Tourism arrivals, now about 5 percent above pre-pandemic levels, are expected to increase further, with Fiji continuing to account for roughly twothirds of all regional arrivals. Higher jet fuel costs may temper the pace of recovery but are not expected to derail it under the baseline. Remittances will remain an important stabilizer, especially for Samoa and Tonga, where overseas labor mobility participation remains high.
External positions are expected to come under renewed strain from higher fuel import costs and elevated freight and insurance premia. Inflation is projected to rise to 3.8 percent, with risks tilted upward due to global energy price volatility and localized
supply disruptions. Fiscal balances could deteriorate further if governments absorb higher operating costs in utilities or transport. Combined with weak domestic revenue mobilization and growing development and climate-related spending needs, fiscal space is expected to remain tight.
The balance of risks is firmly to the downside. Key risks include:
• Energy and shipping shocks: Further escalation involving Iran or disruptions to major shipping corridors could sharply raise refined product prices, freight costs, and insurance premia, with rapid pass through to domestic prices, utilities, and transport.
• External account pressures: Higher import bills could widen current account deficits significantly, especially for fuel-dependent and geographically dispersed economies with thin reserve buffers.
Fiji SLBTourism- and remittances-led PICs
Sovereign rentled PICs
Micronesia, Fiji, Kiribati, Marshall Islands, Nauru, Palau, Samoa, Solomon Islands, Tonga, Tuvalu, and vanuatu.
• Fiscal vulnerabilities: Higher operating costs for utilities, possible support to lifeline aviation/ shipping routes, and temporary social protection measures could widen deficits and intensify debt pressures.
• Climate shocks: PICs remain highly exposed to cyclones, flooding, and sea level rise, potentially interrupting tourism, damaging infrastructure, and diverting public spending.
• Political economy risks: Upcoming election cycles in the Federated States of Micronesia, Fiji, and Samoa (2026–27) could slow reform momentum and cloud policy predictability.
A stronger global recovery or continued resilience in remittances could offer some upside, but structural fragilities—including small market size, high transport costs, and limited fiscal buffers—constrain the scale of potential positive surprises.
East—could amplify commodity price volatility, threaten food security, disrupt critical shipping lanes and energy supply chains, and generate macro-financial spillovers across EAP. Heightened great-power tensions could further dampen investor confidence, fragment technology supply chains, and accelerate decoupling pressures that weigh disproportionately on the region’s trade-exposed economies.
• Second, deeper trade policy fragmentation— through rising tariffs, non-tariff barriers, and sustained policy uncertainty—could disrupt regional supply chains, weaken investment, and weigh on export-led growth.
• Third, while policy rates in major economies are expected to decline, equity market corrections or renewed bond market volatility could tighten financial conditions, trigger capital outflows, and raise borrowing costs for more vulnerable economies.
• Fourth, a slowdown in advanced economies or China would transmit quickly through trade, tourism, remittances, and financial channels, with EAP’s exports being increasingly driven by a narrow set of high-tech sectors heightening exposure to external demand shocks.
Domestic risks remain significant in several economies. In China, a deeper or more prolonged
property sector correction could further weaken investment and household consumption, while local government financial stress could limit fiscal support. High debt levels and financial sector fragilities—particularly in Cambodia, Lao PDR, and several Pacific Island Countries—constrain policy space and heighten vulnerability to external shocks. In Indonesia and Thailand, continued political and policy uncertainty, compounded by high household debt in Thailand, could weigh on consumption and investment. Climate-related shocks remain a pervasive risk across the region, particularly for agriculture- and tourism-dependent economies and Pacific Island Countries.
Upside risks include a faster-than-expected easing of global financial conditions, stronger tourism recoveries, higher commodity prices for net exporters, and decisive domestic reforms. Progress on reducing trade barriers, improving the business environment, and accelerating high-quality public investment could lift private investment and productivity, helping EAP economies better withstand external headwinds over the medium term.
Policy makers across the region face a challenging balancing act. Countries with limited fiscal space— including Cambodia, Lao PDR, Myanmar, and several Pacific Island economies—have less room to support economic activity if external shocks intensify, making it essential to rebuild buffer, prioritize high-impact spending, and strengthen
aBased on the Spring 2026 issue of the “Pacific Economic Update” (forthcoming).
BOX I.3 Pacific Island Countries (PIC11) (continued)
financial stability (box I.4). By contrast, economies with stronger balance sheets and larger buffers, such as China, Indonesia, Malaysia, and some Pacific economies with sovereign wealth funds or Compact-related transfers, retain greater scope to smooth shocks, although policy trade-offs remain acute as public support risks delaying needed structural adjustment.
Many economies retain meaningful buffers or offsetting channels to the oil shock. China’s exposure to oil imports is mitigated by diversification, reserves, and administrative controls, limiting macroeconomic spillovers. Indonesia and Malaysia benefit from commodity-export revenues that partially or fully offset higher fuel costs, while Viet Nam’s fiscal space and domestic refining capacity help contain near-term macro effects in the event of a short-lived shock.
Against this backdrop, monetary policy responses should remain calibrated: central banks with well-anchored inflation expectations and subdued underlying price pressures—including China and several inflation-targeting ASEAN economies— can afford to look through energy supply shocks without overreacting and focus on supporting domestic demand. However, in economies where inflation is already elevated, expectations are less firmly anchored, or exchange-rate pass-through is
strong—such as Lao PDR, Mongolia, Myanmar, and Papua New Guinea—a severe or prolonged commodity price shock could necessitate a shift toward a less accommodative stance to prevent second-round effects and protect macro-financial stability, even at the cost of near-term growth. Even for those economies with strong buffers and policy room, close monitoring is warranted. A severe or sustained commodity price shock that threatens to dislodge inflation expectations may warrant a shift toward a less accommodative stance.
On the fiscal side, if the government seeks to protect households (or firms) from the price shock by providing energy subsidies, the resulting higher deficits could also lead to increased borrowing and debt, which could result in higher interest rates that inhibit investment and growth. These risks are particularly acute in economies with already-elevated debt levels and limited fiscal space. Lao PDR faces debt sustainability concerns, while several Pacific Island countries are constrained by small revenue bases and dependence on external financing, leaving little room to absorb additional spending pressures without risking unsustainable fiscal positions. Given the difficult trade-off, better-targeted support—for both the poor and the vulnerable in the middle class—can help those most in need at a more reasonable fiscal cost.
BOX I.4 Financial Sector Vulnerabilities in EAP
Financial sectors across most large EAP economies remained broadly stable in 2025, with healthy asset quality, ample liquidity, and sufficient capital buffers to withstand potential adverse shocks (table I.B4). A reverse stress test conducted on 528 banks across six EAP economies using Fitch bank-level balance sheet data confirms this resilience: non-performing loan (NPL) ratios would need to rise by very large margins from current levels—about 14 percentage points for China and 18 percentage points for
TABLE I.B4 Financial vulnerabilities in EAP
Indonesia—before the weakest 20 percent of banks would breach minimum capital adequacy requirements. The consolidated distance to breakpoint has remained consistently high across most EAP economies through the pandemic and recovery period, making a systemic banking crisis highly unlikely based on available data.
Trade-related external developments have not led to financial stress across the region. Mitigating factors
Source: IMF, world Bank, Fitch, Haver Analytics.
BOX I.4
Financial Sector Vulnerabilities in EAP (
FIGURE I.B4.1
include (1) partial resolution of US trade disputes through negotiations; (2) strong policy and fiscal support in China; (3) a weaker dollar that supported capital inflows into emerging markets; and (4) the financial sector’s solid capital buffers that have helped banks in the EAP economies to absorb external headwinds.
Credit growth dynamics vary markedly across the region. Indonesia, the Philippines, and Viet Nam have seen faster credit expansion, while growth has been modest in China and Malaysia and lackluster in Thailand. Credit-to-GDP levels remain below historical trends in most economies, limiting concerns about excessive credit buildup.a Where credit has been slow, this likely reflects weak demand from corporates and households amid slowing growth rather than supply constraints—notably in China and Thailand. Booming technology-related investments across the region have largely been financed through FDI inflows in Southeast Asia and domestic equity markets in China, rather than bank credit.b
Indonesia experienced a period of acute equity market stress in early 2026. On January 27, Morgan Stanley Capital International (MSCI), the largest provider of equity indexes, announced it would freeze Indonesian
Source: BIS.
securities in its index pending a May 2026 reassessment, citing opaque ownership structures and extremely low free float levels as posing “fundamental investability issues.” The main equity index fell more than 10 percent in 2 days, triggering two trading halts, before stabilizing and recovering partially. The episode exposed structural weaknesses in Indonesia’s capital markets, including shallow market depth, limited transparency in shareholding structures and pricing, and high index concentration in a few large firms. Notably, Indonesia’s financial markets had weathered political protests and turmoil in mid-2025 without significant disruption, suggesting the January 2026 stress was more idiosyncratic than systemic in nature.
In China, private sector credit growth has remained subdued despite accommodative monetary policy, reflecting soft household borrowing and cautious corporate investment appetite. Government borrowing has continued to drive headline Total Social Financing growth. Equity markets, however, posted strong gains in 2025, led by domestic institutional investors amid favorable liquidity conditions, low asset valuations, and a tech sector rally.c Households, whose savings have traditionally been concentrated in housing and bank deposits, increased their equity market allocations during this period, as declining housing values and low deposit returns prompted portfolio reallocation.
FIGURE I.B4.2 Credit-to-GDP gap
BOX I.4
Political stress period:
Aug 25-Protests start
Aug 31-Intensification of protest
Sep 9-Change of minister of finance
Sources: IIF; Bank Indonesia; Investing.com. Note: JCI = Jakarta Stock Exchange.
Notable country-specific vulnerabilities persist across the region. Malaysia and Thailand carry elevated private debt levels, with high household debt in Thailand weighing on consumption and creating latent financial stability risks not yet fully reflected in loan loss data. Asset quality concerns remain in Cambodia, Lao PDR, and Myanmar, where regulatory forbearance has delayed full recognition of distressed assets. In Myanmar, systemwide NPL levels are elevated amid ongoing conflict and the aftermath of the 2025 earthquake. Papua New Guinea was added to the Financial Action Task Force (FATF) grey list in February 2026, which risks raising cross-border transaction costs— including remittances—and reducing international investor confidence.
On the policy front, several country-specific measures have been deployed. In China, targeted support has
reduced banks’ credit risk exposure to the real estate sector, and measures to address Local Government Financing Vehicle debt overhangs have helped contain financial sector risks. Thailand plans to transfer distressed assets to public asset management companies to manage rising NPLs, as part of a broader effort to tackle elevated household debt. Mongolia has announced plans to finalize adoption of Basel III supervisory frameworks, aligning with international good practices.
Looking ahead, financial sector policy in EAP should prioritize three areas. First, regulatory and supervisory frameworks should continue to be strengthened to address emerging vulnerabilities; where forbearance measures have been deployed, they should be treated as temporary and tightly targeted to avoid eroding regulatory standards. Second, financial institutions need
BOX I.4 Financial Sector Vulnerabilities in EAP (continued)
to enhance risk management practices; asset management companies—if well designed, with institutional independence, sound governance, and robust legal frameworks—can play a useful role in resolving
NPL pressures. Finally, strengthening regional financial cooperation would improve information sharing, address cross-border risks, and reinforce financial stability across the region.
aBank for International Settlement data. The credit-to-GDP gap aims at quantifying the notion of “excessive credit” in a simple way. It serves as an early warning indicator for potential banking crises or severe distress. The credit-to-GDP gap is defined as the difference between the credit-to-GDP ratio and its long-run trend. The trend is derived using a one-sided (that is, backward-looking) Hodrick-Prescott filter. bLarge-scale technology infrastructure investment is flowing into the region, with over US$37 billion committed to new data center construction across Southeast Asia, adding an estimated 8 GW of power capacity. Indonesia, Malaysia, and Thailand have each attracted multibillion-dollar commitments from global hyperscalers and cloud providers.
cDespite recent gains, the valuations of key offshore indices, including MSCI China and HSCEI Index, remain relatively low compared with both other major markets and China’s onshore equities.
TABLE IA.1 Adopting generative AI tools is associated with labor cost savings
Brynjolfsson et al. (2023)
Cui et al. (2025)
Dell’Acqua et al. (2023)
Jabarian and Henkel (2025)
Noy and Zhang (2023)
Peng et al. (2023)
Wiles et al. (2023)
Source: world Bank.
Customer service with a generative AI assistant
increase in task completion rate
Software development with GitHub Copilot 26% increase in task completion rate
Management consulting with GPT-4 (experimental setting)
increase in task completion rate; 25% increase in speed
Job interviews with a generative AI voice agent 17% increase in job starts; 18% increase in retention rate
Basic professional writing with ChatGPT-3.5 40% increase in speed; 18% increase in output quality
JavaScript programming with GitHub Copilot
Job applications with algorithmic resume writing assistance
Note: AI = artificial intelligence; GPT = generative pre-trained transformer.
increase in speed
increase in likelihood of hire
TABLE IA.2 Academic studies are inconclusive about the impact of AI on productivity
and Bunel (2024)
Baily et al. (2023)
Narrow task coverage, slow diffusion, limited
AI as GPT boosting innovation and creative destruction
Broad diffusion comparable to late-1990s IT boom Bergeaud (2024)
Reallocation toward frontier firms dominates automation Filippucci et al. (2024)
Penn Wharton Budget Model (2024/25) 0.1–0.2 (peak) 10–20 years 1.5% by 2035; 3% by 2055
Source: world Bank.
Firm-level adoption, capital deepening, sectoral reallocation
Task-based GPT framework, gradual diffusion, conservative adoption
Note: AI = artificial intelligence; GPT = generative pre-trained transformer; IT = information technology; pp = percentage point.
FIGURE IA.1 Retail sales trends
E. Retail sales in Viet Nam
Source: Haver Analytics.
FIGURE IA.2 Industrial production
Source: Haver Analytics.
PART II
Special Focus
Industrial Policy in the Digital Age
II. Special Focus: Industrial Policy in the Digital Age
II.1 Introduction
East Asia and Pacific (EAP) countries face a triple challenge. Their export-led, labor-intensive development model is increasingly threatened by rising protectionism in advanced economies and by automation. Moreover, as highlighted in the first part of this report, the contribution of total factor productivity to growth has markedly declined across most EAP countries in recent decades, with the productivity of leading firms lagging global leaders, especially in the most technologically advanced sectors. In this context, industrial policy is increasingly viewed by policy makers as a tool to counter the adverse effects of foreign protection, to revive productivity and generate more and better jobs.
The economic case for industrial policy is not new. The motivating “infant industry argument” originated in the late 18th century. In his 1791 Report on Manufactures, Alexander Hamilton stated that emerging US industries needed protection from British competition. Later, Friedrich List (1841) and John Stuart Mill (1848) argued that temporary trade protection (tariffs/subsidies) would allow new industries to achieve economies of scale.
The case for industrial policy has always been compelling in principle. The practice of industrial policy has usually been less principled. Accordingly, we propose an approach to industrial policy based on three pillars:
1. Foundational public goods: Remedying inadequate provision by the market of public goods needed for all economic activity, notably, foundational infrastructure and basic human capital—as well as institutions, including those that ensure macroeconomic stability.
2. Addressing policy failures: Reforming existing policies that impede desirable economic activity, such as barriers to competition in transport,
communication, and financial services and barriers to international trade.
3. Addressing market failures: Targeted interventions to address market failures that inhibit desirable economic activity in specific sectors.
In this special focus, we first briefly delve into the first two pillars, mostly based on previous research, and then devote the core of the material to the third pillar, drawing on original research. Across pillars, we pay particular attention to an area currently of interest to policy makers in the region: The AI value chain.
II.2 Foundational public goods: Basic human capital, infrastructure, and institutions
The first pillar of industrial policy addresses the failure of markets to provide adequate levels of public goods. This pillar includes horizontal policies aimed to encourage the provision of basic human capital, infrastructures and institutions, which are key to achieve the increase in output, employment and productivity needed in EAP developing economies.
Basic human capital
Human capital has been shown to be a central driver of productivity and economic growth. Differences in human capital account for about 60 percent of the global variation in GDP per capita (Jedwab et al. 2023). The new World Bank Human Capital Index (HCI) measures how countries build human capital throughout the life cycle. Through its education and health components, the index captures the amount of human capital that a child can expect to accumulate by the time they reach working age (say, at 25 years old). To do so, the HCI takes into account the survival of newborn children, how
much schooling and learning they will complete, and whether they will experience good health in their working lives. Taken together, these components reflect a country’s cumulative progress in building the foundations for a well-educated and healthy workforce. Figure II.1 reports the progress in the HCI between 2015 and 2025, together with the average of the emerging markets and developing economies (EMDEs).
The EAP region’s human capital performance is strong for its level of income, but uneven across countries and components. Figure II.2 shows the cross-country relationship between the HCI and income per capita (panel A) and the relationship between the education and health components (panel B). The HCI rises with income, and EAP economies generally match or slightly outperform other countries at similar levels of income per capita. Several countries overperform—most notably, Mongolia and Viet Nam—with a markedly high HCI relative to per capita income; China and Thailand also exceed expectations. At the other end, Cambodia, the Lao People’s Democratic Republic, and most Pacific Island countries (PICs) cluster beneath the global fit, showing persistent human capital gaps.
EAP’s human capital edge lies in education, while the region trails on health. Mongolia and Viet Nam’s overperformance on education contrasts with their
underperformance on health. Malaysia and Thailand show similar imbalances. Most other EAP countries underperform on both dimensions (bottom-left quadrant). Cambodia, Lao PDR, Myanmar, Papua New Guinea, and Timor-Leste are among the weakest, while Indonesia and the Philippines fare relatively worse in education than in health. China’s HCI stands out with both education and health outcomes that approach high-income benchmarks.
Notwithstanding the relative edge in education, absolute endowments remain weak in many countries. For example, Viet Nam’s stellar performance in school education contrasts with the relative weakness of its tertiary education. The contribution of education to human capital in EAP countries is also constrained by low quality of basic education that results in weak foundational skills. In 14 of the region’s 22 middle-income countries, more than half of 10-year-olds are unable to read and understand age-appropriate reading material—they experience learning poverty (Afkar et al. 2023). Even in countries like Malaysia and the Philippines, only 24 percent and 16 percent of 15-year-olds, respectively, leave high school with basic literacy and numeracy skills (OECD 2024).1 Moreover, while many EAP countries stepped up their efforts to expand tertiary education over the past two decades, the college-educated workforce shares remain below one-third, with an even lower share of graduates in STEM fields (World Bank 2025).
In health, EAP faces a two-dimensional challenge that prevents people from preserving their human capital while living longer and healthier lives (Debebe et al. 2026). While most countries in the region have achieved significant progress in maternal and child health and nutrition outcomes, some countries still struggle. In Cambodia, Lao PDR, Timor Leste, and most PICs, the levels of child and maternal mortality remain unacceptably high. All EAP countries face an increasing burden of noncommunicable diseases (NCDs), such as hypertension, diabetes, and cardiovascular disease, among the adult population. The likelihood of premature
1Available data on adult skills suggests that gaps in foundational skills are carried over to the workforce (OECD 2016; Bodewig et al. 2014; Miyamoto et al. 2024).
FIGURE II.2 Human capital and development in EAP and the world
Source: Based on world Bank 2025 and wDI data from 2025.
Note: The figure shows the education (years of schooling a child can expect to complete by age 18; quality of schooling captured by the Harmonized Learning Outcomes; and the share of 25–29-year-olds who complete tertiary education) and health (adult survival rate, age 15−60; the fraction of children under five who are not stunted) components of the HCI+. The HCI+ combines eleven outcomes on health, education, and on-the-job learning (omitted from the figure) and how each of these outcomes affect earnings. Improvements in the HCI+ can be directly interpreted as improvements in lifetime earnings of workers and long-run GDP. In panel (A) each component is weighted by their contribution toward a total potential score of 238. A score of 0 reflects conditions where human capital cannot develop: universal stunting, no schooling, and no employment prospects. See world Bank (2025) for methodological details of the estimation.
death (age 30 to 70) because of NCDs is more than 30 percent in some EAP countries. Countries like Mongolia and some Pacific Island Countries (like Fiji and Tonga) are more severely affected than others like China and Thailand. Poor quality of health care accounts for one-third of avoidable mortality in EAP, with low quality of primary care leading to poor management of NCD conditions and high rates of preventable hospitalization (Bales et al. 2022; Kruk et al. 2018).
A combination of policy reforms, foundational investments, and harnessing of new technologies is needed to improve the quality of basic education and primary health care. These reforms are examined in depth in Afkar et al. (2023) and Debebe et al. (2026). Without these efforts to ensure foundational human capital, EAP countries will struggle to build a workforce equipped with the technical, digital, and other job-specific skills needed in advanced manufacturing and services.
Expansion in the supply of skills can help enable a transition to higher value-added manufacturing and services and increase productivity. This has underpinned the successful economic transformations of today’s high-income EAP economies such as the Republic of Korea and Singapore. For instance, in China the massive expansion of
tertiary education since the early 2000s boosted the productivity, exports, and innovation of firms engaged in skill-intensive manufacturing (figure II.3).
Infrastructure
In addition to human capital, the provision of core infrastructure—including energy systems and physical and digital connectivity—is another public good that underpins economic development. If human capital determines the productive potential of workers, infrastructure shapes the environment in which that potential is used. By reducing transaction costs, facilitating market integration, and connecting firms and workers to larger markets, infrastructure raises productivity and supports structural transformation. A large body of empirical research shows that improvements in transport, electricity, and communications infrastructure can generate substantial gains in private investment, productivity, and longrun economic growth (Aschauer 1989; Donaldson & Hornbeck 2016; Faber 2014).
Energy infrastructure illustrates both the strengths and disparities within the EAP region. Figure II.4.A highlights stark regional differences in powergeneration capacity per capita, revealing how unevenly electricity supply potential is distributed
FIGURE II.3 The expansion of tertiary education in China boosted firm productivity and innovation. Impacts of an increase in the share of tertiary-educated workers, 1998–2002 and 2003–07 B. Firms’
A. Total factor productivity impacts by college graduates, field of study
change
Source: Based on Che and Zhang 2017.
Note:
A. All college graduates, science and engineering estimates are significant at 1 percent, while economics, management and law are at 5 percent. Confidence intervals are at 95 percent.
B. Estimates are significant at 1 percent.
globally. Overall, EAP’s total generation capacity lies modestly above the global mean, but this regional average masks substantial heterogeneity. China dominates the scale of installed capacity, reaching approximately 2 kW per capita—nearly double the levels observed in countries such as Malaysia and Viet Nam. Capacity levels fall substantially further in many lower-income economies in the region.
Furthermore, the composition of generation capacity also reveals distinctive patterns. EAP accounts for a large share of global coal-based generation while simultaneously contributing significantly to the global expansion of renewable energy, particularly solar and wind. At the same time, oil and gas generation and hydropower remain important components of the region’s energy mix.
A similar pattern emerges in electricity transmission and distribution networks. As shown in figure II.4B, most EAP countries fall within the middle terciles globally in terms of network density. China, Thailand, and Viet Nam occupy the higher end of the distribution, reflecting extensive grid expansion undertaken to support industrialization and rising urban demand. Cambodia, Indonesia,
Malaysia, and the Philippines fall in the middle range, while Lao PDR and Myanmar remain at the lower end, reflecting more limited network coverage and, in some cases, geographical constraints or fiscal and institutional capacity limitations.
Physical and digital connectivity are also areas where much of the EAP region continues to lag behind more advanced economies. For example, paved road density in most EAP countries remains significantly lower than in developed and upper-middle-income economies, particularly outside major metropolitan corridors (figure II.5A).2 Limited road connectivity raises logistics costs, constrains spatial industrial development, and reduces the ability of firms and workers to access larger markets. This is consistent with a broader literature showing that infrastructure accumulation supports growth not only by expanding productive capacity but also by improving the spatial allocationof economic activity and lowering the costs of exchange (Heblich et al. 2020).
2Measures of road density may mask the absolute stock and growth of road provision, especially in populous and geographically diverse countries; for example, China currently has the world’s second-largest stock of paved roads.
Similar gaps are visible in digital infrastructure. While mobile connectivity has expanded rapidly across the region, disparities remain in broadband quality and connection speeds both across and within EAP countries (figure II.5B). These gaps are also pronounced in capital-intensive investments such as data centers, where the density of facilities per million people remains relatively low in most EAP economies. Such infrastructure is increasingly critical for the development of digital services, cloud computing, and data-driven economic activity.
Closing these infrastructure gaps—across energy, transport, and digital systems—will be essential for sustaining productivity growth and enabling firms in EAP to move toward more technologically sophisticated manufacturing and services.
Institutions
Alongside human capital and infrastructure, institutional quality represents a third foundational public good that shapes long-term economic performance. If human capital equips workers, and infrastructure connects them to firms and markets, then institutions determine whether these complementary inputs are allocated and governed effectively. Strong institutions reduce uncertainty, support contract enforcement, improve policy credibility, and increase the effectiveness of public investment. A large empirical literature argues that differences in economic institutions are a fundamental cause of differences in long-run development outcomes (Acemoglu et al. 2001).
In EAP, the effectiveness of government—measured by the Worldwide Governance Indicators (WGI) Government Effectiveness Index—has improved markedly since 2000 (figure II.6). These gains reflect two decades of administrative modernization across many countries, including expanded public service delivery, stronger macro-fiscal management, and varying degrees of bureaucratic professionalization.
Despite this progress, EAP as a region still underperforms relative to most advanced economies. Institutional capacity remains uneven across
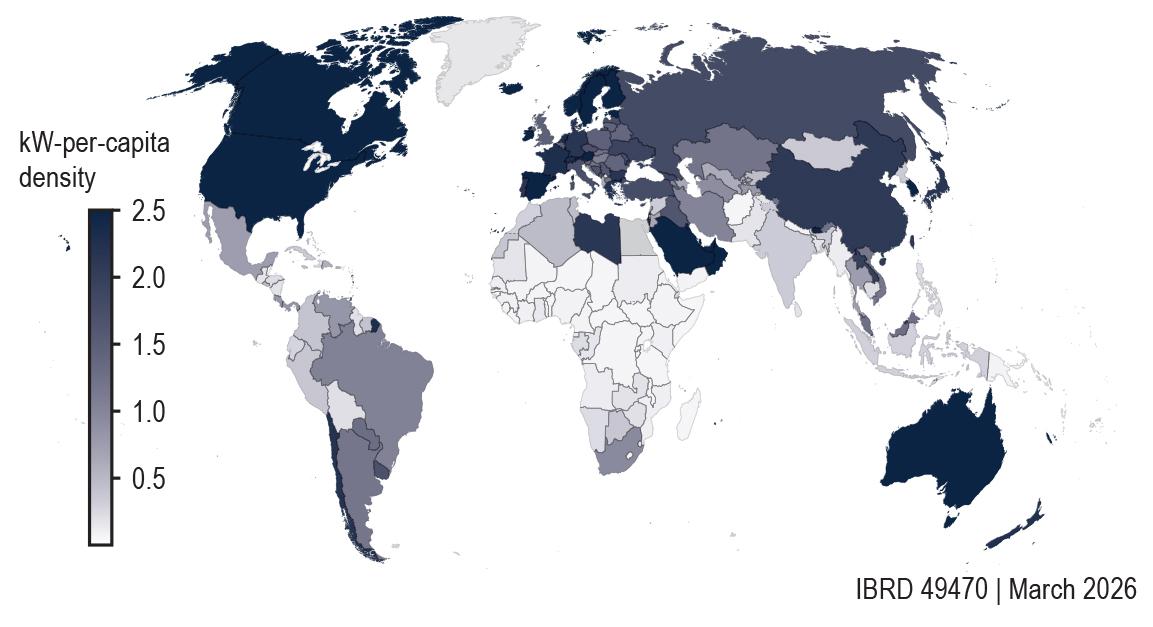
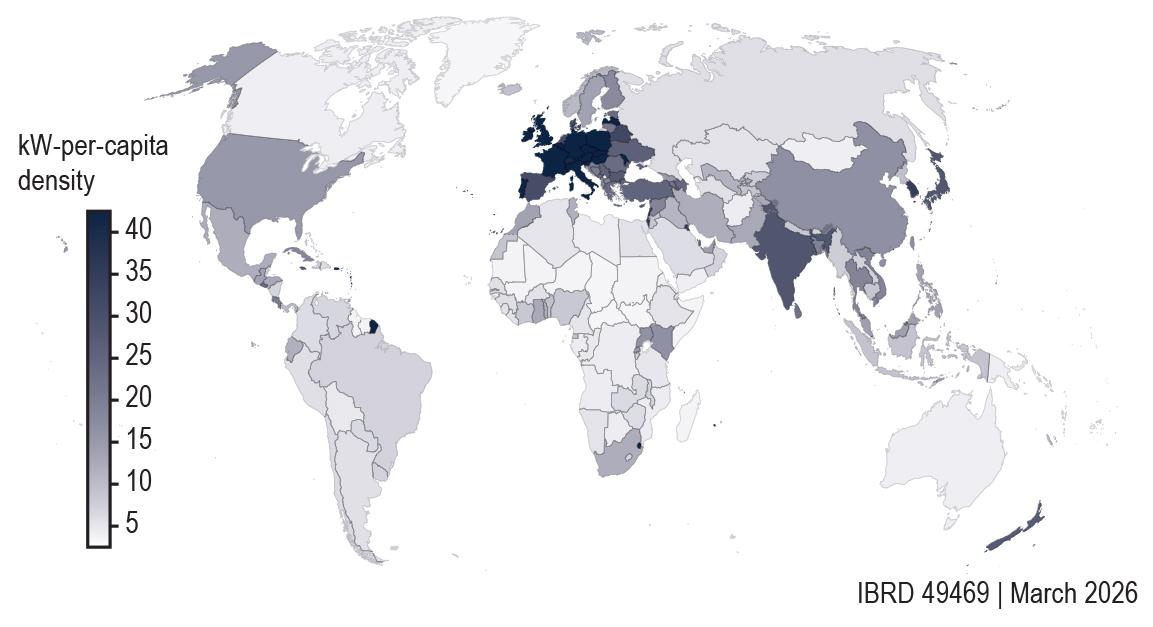
Note:
countries and, in some cases, across levels of government within countries. Weak administrative capability can limit the effectiveness of public investments, slow the implementation of reforms, and reduce the impact of industrial and innovation policies. In that sense, institutions do not merely complement industrial policy—they shape whether industrial policy can be implemented consistently and effectively in the first place. This broader point is consistent with the view that inclusive and capable institutions are central to sustained development and to the successful coordination of structural transformation.
Strengthening institutional capacity therefore remains central to the region’s development agenda. This includes improving the efficiency
FIGURE II.4A Power generation capacity per capita
Source: Straub et al. 2026.
Note: Map illustrates global distribution in power generation capacity in terms
= kilowatt.
FIGURE II.4B Transmission and distribution networks
Source: Straub et al. 2026.
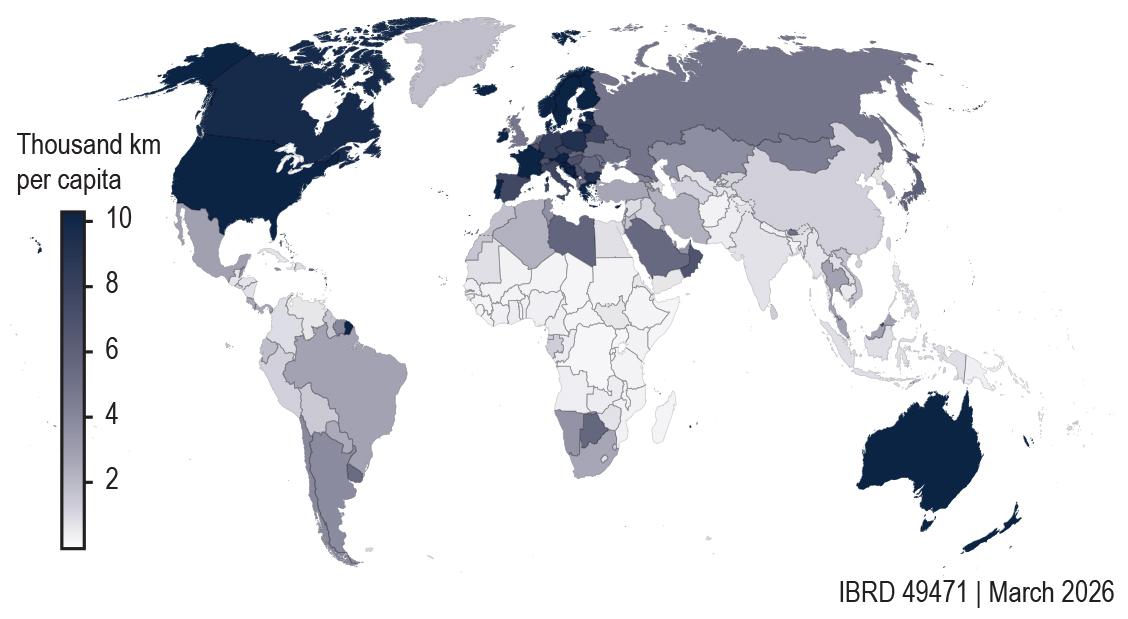
Source: Straub et al. 2026.
Note: Map illustrates global distribution in paved road density in thousand km per capita. km = kilometer.
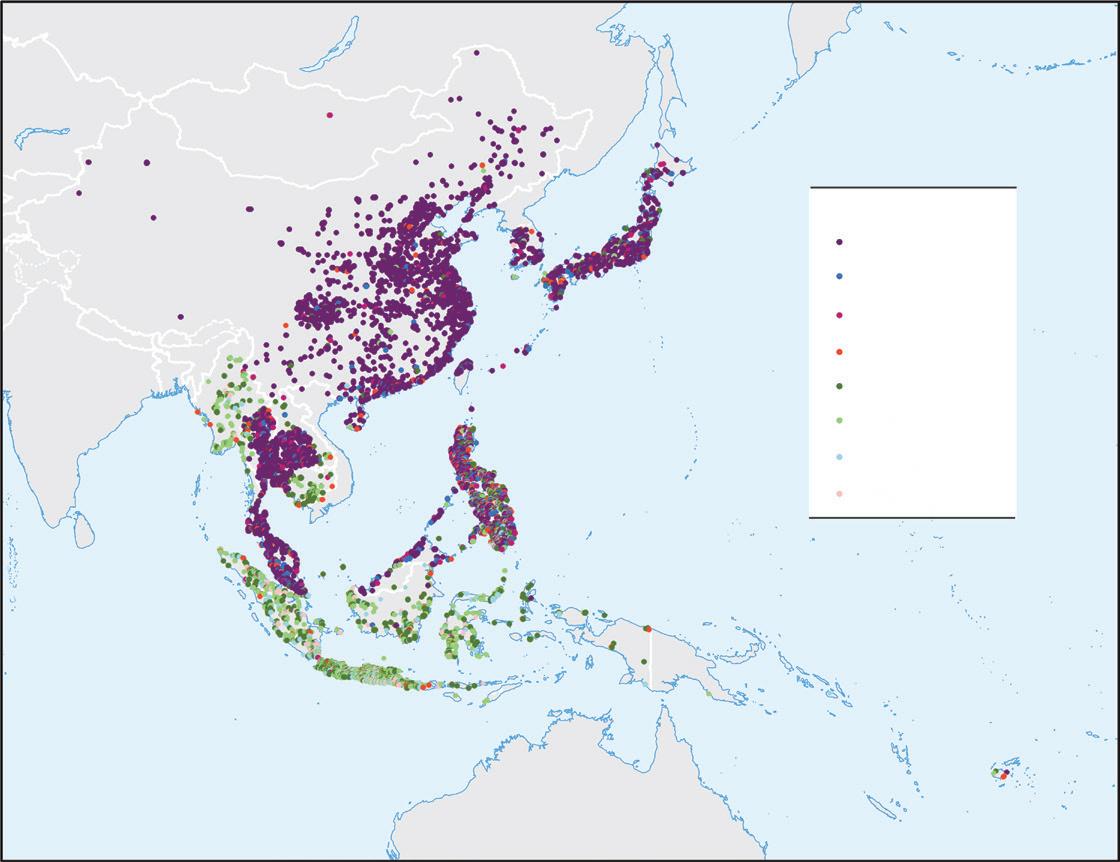
Source: world Bank 2024e based on Ookla fixed broadband speedtest data at 2023Q2.
Note: Mbps = megabits per second.
and reliability of public administration, strengthening procurement and public financial management systems, and enhancing coordination across national and subnational levels of government. Continued efforts toward administrative modernization will be critical for ensuring that investments in human capital and infrastructure translate into sustained productivity gains and inclusive economic growth.
II.3 Addressing policy failures
A second pillar of industrial policy involves addressing policy failures. “Do no harm, before seeking to do good” is the relevant principle here. Existing policies have sometimes led to suboptimal outcomes, including from an industrial development perspective. The reason could be that policies in principle sought to remedy market failures or to promote social welfare more generally but were not well designed or well implemented and, therefore, inefficient. Or it could be that policies were influenced by special interest groups to shift outcomes in their favor. We consider three key examples.
Restrictions in services
While the EAP countries have been open to trade and investment in goods, services—ranging from transport and telecommunications to finance and the professions—are relatively restricted in most EAP countries. A range of rules condition or restrict the entry and operations of foreign firms as well as their ability to deliver services across borders. Figure II.7 contrasts the tariffs on goods and an indicator of restrictions in services: the World Trade Organization-World Bank Service Trade Restrictions Index (STRI). The STRI is a measure from 0 to 100, where 100 indicates prohibitive restrictions and 0 no meaningful restrictions. As the figure shows, developing EAP countries all lie below the global median level of protection in goods and above the global median level of protection in services.
State-owned firms account for a large share of activity in some EAP countries in key sectors (such as banking), which can limit competition and misallocate resources (World Bank 2023c). The existence of larger state-owned enterprises (SOEs) can discourage the entry of new firms and increase market concentration in those same sectors. When capital and labor are trapped in less-productive SOEs, it is harder for start-ups to attract the resources needed to enter, and it is harder for productive incumbents to scale up and innovate (De Nicola et al. 2025).
The gains from services liberalization are large. For example, even the partial liberalization of services that
FIGURE II.5B High-speed broadband is unevenly available within and across EAP countries
FIGURE II.5A Global distribution of paved roads percapita
took place in Viet Nam in the period 2008 to 2016 generated a sizeable increase in productivity not only in the services sectors (2.9 percent yearly over the period 2008 to 2016) but also in the manufacturing sectors using services as intermediate inputs (3.1 percent yearly), as shown in World Bank (2024c), reproduced in figure II.8. Services are becoming increasingly important complements to manufacturing, as highlighted in Thailand’s Eastern Economic Corridor (box II.1). Thus, services reform may be a powerful form of industrial policy.
Non-tariff measures
Non-tariff measures (NTMs) are policy measures other than ordinary import tariffs that can potentially have an economic effect on international trade in goods, changing quantities traded, prices, or both (Nicita and Koloskova 2025). As figure II.9 shows, in most developing East Asia countries, the tariff equivalents of a specific type of non-tariff barriers (the so-called border NTMs) are larger than the tariff rates imposed.
Several studies have shown how NTMs have negative productivity effects on local firms (for instance, Gupta [2023] explores the case of Indonesia). These adverse effects can arise because firms are both shielded from the discipline of competition and deprived of adequate access to intermediate inputs. Moreover, recent research using the World Bank Indonesian NTM database underlines how the effects of NTMs are not adequately captured by their tariff equivalent. Because of their nature, NTMs affect not only the variable transport costs but also the fixed costs of exporting, making them particularly harmful (Ghose et al. 2025). Finally, as stressed by Kee and Taglioni (2025), NTMs tend to deepen international fragmentation even more than tariff measures.
Restrictions on data flows
Data flows today underpin both social and economic activity. Yet, growing concerns—privacy, national security, and cybersecurity—have driven a wave of rules that condition or restrict cross-border data movement and require data to be stored or processed domestically (OECD-WTO 2025). Amid the digital revolution, many EAP countries restrict cross-border data movement and require data to be
and 2024
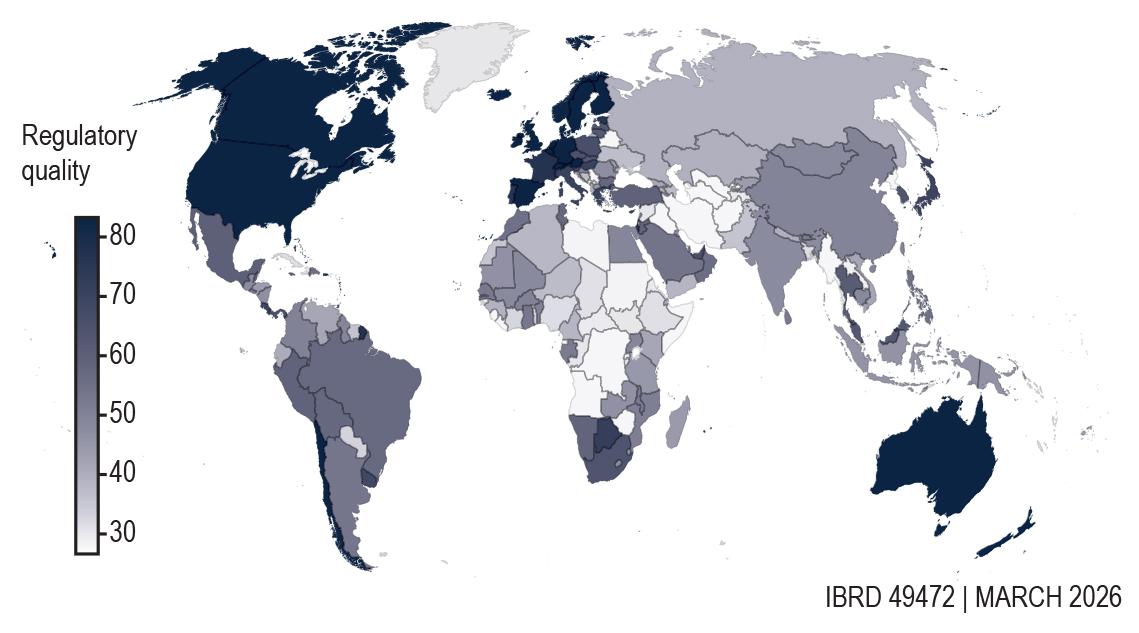
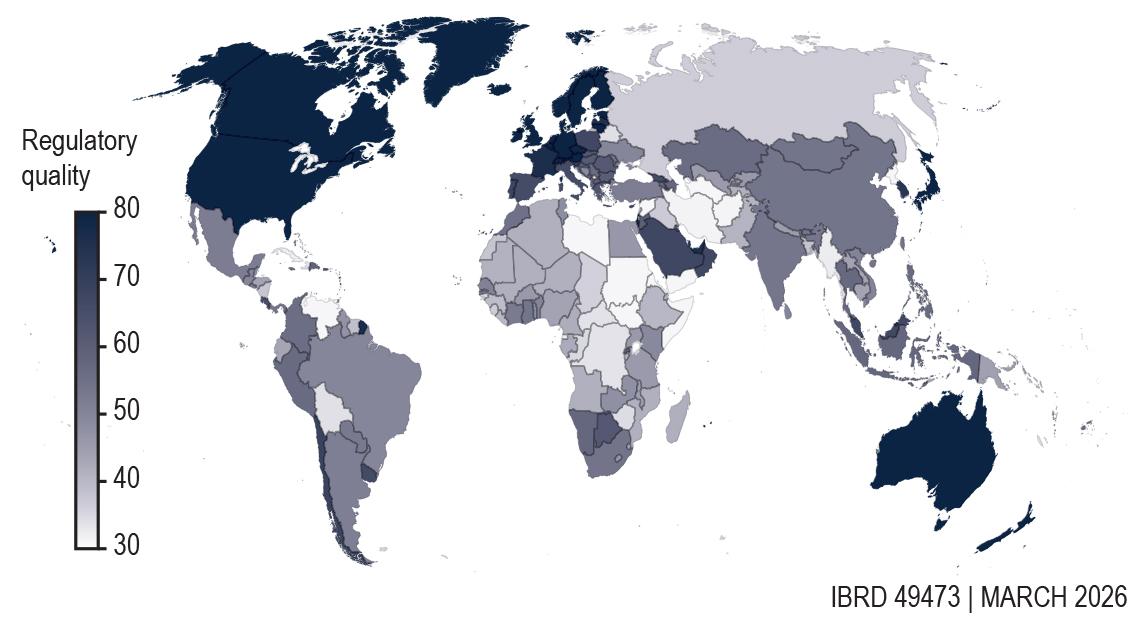
Source: wGI.
Note: Maps show the distribution of government effectiveness (one of the worldwide Governance Indicator dimensions), which measures the quality of public services, civil service competency, policy formulation and implementation, and government credibility. 0–100 scale.
II.7 In many developing countries, restrictions to services trade are higher than in advanced economies as well as higher than tariff barriers on goods.
Protection: Goods versus services
Tariffs on goods (Weighted average, 2022)
wITS; wB-wTO STRI database.
Scatter
FIGURE II.6 Government effectiveness, 2000
A. 2000
B. 2024
FIGURE
Developing EAP
STRI (2022) Advanced Other EMDE Sources:
FIGURE II.8 In Viet Nam, removing barriers to entry and competition in services increased labor productivity of services firms (+2.9 percent yearly) as well as manufacturing firms (+3.1 percent yearly).
A. Productivity effects of services liberalization on services firms (Direct effect)
Marginal effect (Percent)
AllSOEForeignPrivate (Small)
Source: world Bank 2024c.
Note: SOE = state-owned enterprise.
(Medium)
(Large)
B. Productivity effects of services liberalization on manufacturing firms (Downstream effect)
Marginal effect (Percent)
(Small)
(Medium)
FIGURE II.9 In many EAP developing countries, non-tariff measures are higher than in advanced economies as well as higher than tariff barriers on goods.
Border NTMs tariff equivalent, 2017 (Weighted average)
Protection in goods: Tariffs versus border NTMs
Developing EAP Other EMDE Advanced economies
(Large)
Tariff on goods, 2022 (Weighted average)
Source: Nicita and Koloskova 2025; wDI.
Note: Scatter plot of the estimated ad valorem tariff equivalent of border NTMs against the trade weighted average of tariff on goods. The border measures are categorized under the following codes of the international classification of non-tariff measures (UNCTAD, 2019). Border measures include many categories under different chapters of the classification. In detail, they include the codes A14, A140, A15, A150, A81, A810, A84, A840, A85, A850, A851, A852, A853, A859, A86, A860, A89, A890, B14, B140, B15, B150, B81, B810, B84, B840, B85, B850, B851, B852, B853, B859, B89, B890, C00, C000, C10, C100, C20, C200, C30, C300, C40, C400, C90, C900, E10, E100, E11, E110, E111, E112, E113, E119, E12, E120, E121, E122, E129, F40, F400, F60, F600, F61, F610, F62, F620, F63, F630, F64, F640, F65, F650, F67, F670, F80, and F800. EAP = East Asia and Pacific; EMDE = emerging market and developing economies. NTM = nontariff measure.
stored or processed domestically. The restrictions on cross-border transfers across several countries in EAP contrast with open transfer or conditional transfer models (which allow transfers but are subject to certain regulatory safeguards) present in the South Asia and the Latin America and the Caribbean regions or advanced economies (figure II.10).
While these restrictions can reflect legitimate noneconomic objectives, such as privacy and data protection or national security, the potential induced costs need also to be taken into account. Restrictions on the cross-border movement of data introduced in the European Union, Japan, and Korea slowed the productivity growth of firms in downstream sectors that use data intensively, such as retail, telecoms, and information services (Ferracane et al. 2020). These costs may be particularly acute for multinationals and trading firms, which operate across multiple jurisdictions and for whom data are an increasingly important part of their business models. A recent study estimates that the extreme scenario of data autarky, where countries fully restrict cross-border flows, could lead to a loss of global GDP of about 4.5 percent (OECD/WTO 2025).
While measuring the restrictiveness of data protection precisely is challenging, the OECD Digital Service Trade Restrictiveness Index provides a general picture. As figure II.11 shows, several EAP countries have in place relatively restrictive regimes compared to more advanced economies. Moreover, in some countries the index increased over the past 10-year period, indicating an increase in the restrictiveness of the regime and mirroring a trend from open to limited data transfer models.
A more granular complement to this high-level indicator is represented by the newly published World Bank digital trade regulatory readiness database, which collects detailed data on the regulations affecting digital trade, including those concerning cross-border data flows. Examples of restrictions to data flows applied in developing EAP countries include the requirement to keep financial data stored within the country in Malaysia and Thailand as well as the requirement to keep telecommunication data stored in the country in Viet Nam.
FIGURE II.10 Cross-border data flows are more restricted in several EAP countries than advanced economies.
world Development Report 2021a, updated for SEA-6 countries in June 2023.
Note: EAP = East Asia and Pacific.
FIGURE II.11 Restrictions on digital services trade are still high in several EAP countries compared to advanced economies.
OECD Digital Services Trade Restrictiveness Index, 2016 and 2025
2016 2025
Source: OECD.
Note:
II.4 Addressing market failures
In this section, we explore the recent and historical experience of EAP countries using targeted interventions in specific sectors. We structure the discussion around two main questions: (1) What is happening? (2) What are the impacts? We also focus on a particularly important technology segment: the artificial intelligence (AI) value chain.
Source:
BOX II.1 Thailand’s Eastern Economic Corridor: Upgrading an Established Export–Foreign Direct Investment Model
Thailand’s Eastern Economic Corridor (EEC) seeks to upgrade the export- and foreign direct investment (FDI)led manufacturing model that contributed to growth through the Eastern Seaboard since the 1980s. It represents a good example of the relevance of pillars 1 and 2. While the earlier model relied primarily on manufacturing agglomeration, the EEC’s strategy marks a structural shift toward more services-intensive and technology-enabled activities, raising new policy challenges.
what worked: Infrastructure and openness to trade and FDI
The Eastern Seaboard’s success was anchored in largescale public investment in ports, transport, energy, and industrial estates, combined with an open manufacturing trade and investment regime. This attracted substantial FDI—particularly into automotive and electronics—and integrated Thailand into regional value chains. That model, however, is running out of steam, and manufacturing’s average gross domestic product share has declined from a peak of 31 percent in 2010, reflecting slowing productivity growth, low domestic value added, and concentration in assembly-stage activities. Global megatrends—digitalization, green transition, and supply-chain fragmentation—are increasing the importance of knowledge-, logistics-, and technology-intensive services as complements to manufacturing.
what the EEC adds—and where tensions arise
The EEC, established in 2017 as a special development zone across Chachoengsao, Chonburi, and Rayong,
what is happening?
builds on existing manufacturing clusters while targeting 12 industries characterized by a potentially S-shaped development path. A large share of these targeted sectors are services based or services intensive, including aviation and logistics, digital services, medical and wellness services, education and human-resource development, and high-value tourism, alongside advanced manufacturing.
Investment signals are encouraging. Greenfield FDI approvals rose sharply in Thailand in 2024, reaching US$9.5 billion across more than 200 projects, roughly half of which concentrated in the EEC, with strong interest in electronics, electric vehicle–related supply chains, and digital activities. Green goods now account for about 10 percent of Thailand’s exports, suggesting there may be further scope for upgrading toward advanced and low-carbon production.
This shift, however, exposes also a structural inconsistency. Thailand remains among the more restrictive economies in services trade across many sectors, including professional services, transport, logistics, and certain digital and communications services.
Restricted services markets can weaken the productivity impact of manufacturing-led FDI by limiting access to efficient logistics, digital solutions, professional services, and foreign expertise. In the EEC, these constraints interact with skills shortages—especially for digital and green technologies—and infrastructure service vulnerabilities, notably water security, which has become a binding risk for industrial operations under climate stress.
In this section, we illustrate some features of the recent use of sectoral industrial policies (IPs) in the developing EAP countries.
Five features of the recent use of IPs
Any discussion about the use of IP must deal with the challenge of measurement. The global trade alert (GTA) database compiles announcements of new, potentially trade-distorting policy measures, including those affecting exports, imports, and production since 2009. While widely used, some caveats are necessary in interpreting the results. First, the database does not capture the stock of policy measures that existed before 2009. Second, the coverage might vary across developed and developing countries. A refinement of the
GTA has been proposed by Evenett et al. (2024): the New Industrial Policy Observatory (NIPO). The NIPO combines GTA data with LLM processing to identify measures that can be labeled as “industrial policies,” based on the intentions of the implementing governments. While also the NIPO presents some limitations, for the “subsidies” category, the NIPO also reports the announced planned expenditure. Aggregating across countries and years the number of policy initiatives announced and the announced planned expenditure, figure II.12 shows a strong positive correlation among the two, which lends some empirical plausibility to the use of count measures of IP.
We present five features of IP.
Feature 1: Industrial policy is on the rise, globally and in most EAP countries.
Figure II.13 reports the total number of new trade and IP announcements potentially trade distorting at the global level. The figure shows a significant increase in the use of these policies after 2019. Some of this increase also reflects the policies implemented in response to the COVID-19 shock.
Figure II.14 reports the same statistics for the largest developing EAP economies. The general trend is toward an increase in the new policies. Even in those countries where the new announcements decline after 2020, the annual average number of policies announced after 2019 vastly exceed the pre-2019 average.
Feature 2: Large countries use more IP measures.
Figure II.15 illustrates how the bulk of action in IPs happens in large countries. Collectively, the G-20 countries account for 52 percent of the total measures recorded in 2023. As the f igure shows, EAP countries like Indonesia, the Philippines, Malaysia, and Viet Nam report a count of announced measures slightly below the level expected given their market size, while China is one of the most active users of these policies.
FIGURE II.12 In the case of subsidies, the number of measures strongly correlates with the dollars spent, with an elasticity close to one.
Dollars spent versus number of
2023
Sources: NIPO Database; world Bank estimates.
Note: EAP = East Asia and Pacific.
FIGURE II.13 At the global level, the number of new trade and IP measures has increased significantly after 2020.
Number of new measures at the global level
Number of new trade and IP measures
Sources: GTA Database; world Bank estimates.
Note: IP = industrial policy.
Feature 3: Subsidies are the most prevalent IP tool used in the EAP countries.
Figure II.16 shows how subsidies (including tax benefits) represent the most frequently announced new measures in countries like China, the Philippines, and Thailand. The recent report Hooked on Subsidies— The Case for Reform (World Bank 2026c) examines in detail how countries are using subsidies. In Indonesia and Viet Nam, export and import measures account for a larger share of the initiatives. Export incentives seem to be prevalent only in Japan and Korea. A type of intervention not included in figure II.16 is exchange rates interventions, which might, however,
FIGURE II.14 The increase in measures is common across most EAP countries; the annual average number of policies announced after 2019 vastly exceeds the pre-2019 average.
Sources: Gta Database; World Bank estimates.
Note: EaP = East asia and Pacific.
FIGURE II.15 EAP countries, except China, exhibit less new trade and IP measures than predicted by their size.
of
(log)
Sources: Gta Database (data for 2023) and WDI.
Note: EaP = East asia and Pacific; EMDE = emerging market and developing economies.
be also regarded as an IP tool (Ottonello et al. 2025). Mattoo, Mishra, and Subramanian (2017) explore the impact of exchange rate movements on third countries’ exports, finding that in the period 2000–08, a 10% appreciation (depreciation) of the renminbi increased (decreased) a developing country’s exports at the product level on average by about 1.5 to 2 percent.
Feature 4: Countries differ in the relative use of direct subsidies and tax incentives.
While GTA and NIPO allow us to describe the prevalence of IPs mostly by counting measures, for
some countries more specific data sources allow us to describe the incidence of support to firms as a share of the size of the economy. Figure II.17 reports data from the Government Finance Statistics of the International Monetary Fund, which make it possible to distinguish for a few EAP countries between the share of direct transfers (like subsidies) and tax expenditure (policies inducing a reduction in tax burden) over GDP. While these instruments might appear to be isomorphic from an economic perspective, differences in implementation and ability to target specific firms might differ (for instance, a tax break on profits requires a firm to be profitable to be implemented). As figure II.17 shows, in Korea and (more recently) in Mongolia, the share of subsidies over GDP is significantly higher than the share of tax expenditures. For the Philippines, the reverse is true.
Feature 5: Countries differ in how they use firmspecific measures (targeting specific businesses rather than generic industries).
Industrial policy measures usage differs among countries across the extent to which a measure is targeting a specific firm. Figure II.18 reports for several EAP countries the share of announced measures which are firm specific. For the period 2019 to 2023, China, Japan, and Thailand exhibit a large share of measures that are firm specific.
A firm-level analysis for China
Rich data on Chinese firms and their government support allow a granular analysis of IP at the micro level. Unlike more readily available data on listed firms, the annual survey conducted by China’s State Taxation Administration (STA) provides a reliable source of information for firms of all sizes from 2008 to 2012 and for firms with at least 20 employees for 2008 to 2016 (Brandt et al. 2026). Data beyond 2016 have changes in the firm identifiers, which means further work is needed to match to earlier years and the analysis is currently not able to speak to more recent patterns of IP. In contrast to the commonly used National Bureau of Statistics’ annual survey of industrial firms, the STA data span almost all sectors of the economy, including agriculture, mining, manufacturing,
utilities, construction, and services.3 We focus on two measures of IP directly available in the data: government subsidies and (corporate income) tax incentives. We therefore do not capture interest rate or land subsidies or government equity injections. One caveat is that we do not have access to the survey sampling weights; however, Brandt et al. (2026) show the similar unweighted and sample weighted distributions for manufacturing firms above 5 million RMB, suggesting non-weighted estimates are likely close for this group, although there is no information on the effect of weighting for services or smaller manufacturing firms.
Preliminary evidence suggests Chinese industrial policy support is substantial at 2.2 to 2.4 percent of total value added in our sample. On average, we find direct subsidies and tax incentives comprise 1.0 percent and 1.2 percent of total value added, respectively, using data for all sizes of firms for 2008–12, and 1.2 and 1.2 percent of GDP, respectively, using data for medium and large firms for 2008–16. These are roughly half the magnitude of well-publicized estimates based on Chinese listed-firm data from Garcia-Macia et al. (2025), which is likely because listed firms are not representative of Chinese firms in general. GarciaMacia et al. (2025) find overall support of 4.4 percent of GDP, which encompasses 2.0 percent of direct subsidies and 1.5 percent of tax incentives, as well as 0.9 percent of interest and land subsidies not reflected in our data. However, our estimates of policy support in China are large compared to total state aid in the European Union of 0.8 percent of GDP in 2015 and 0.9 percent in 2024 (European Commission, State Aid Scoreboard), state aid that also includes credit subsidies that we do not capture for China.
Chinese support is heavily concentrated in a few firms: 1 percent of firms account for half of total subsidies and total tax incentives (figure II.19). In contrast, support is distributed much more evenly across provinces and sectors. Variation across sectors and provinces really reflects differences in the types of firms that operate there. For instance, railways and urban transport are the two-digit sectors with
3When using measures of labor productivity, we restrict analysis to sectors for which productivity is more easily measured: manufacturing and market services, excluding finance, real estate and petroleum manufacturing.
FIGURE II.16 In China, the Philippines, and Thailand, subsidies are the most prevalent form of IP measures; export incentives are prevalent in Japan and the Republic of Korea.
Share of different IP measures, 2009–25
Subsidy Import policy Export policy Trade defense Export incentive
Sources: NIPO Database; world Bank estimates.
Note: The most prevalent instruments by category. Subsidies include financial grants, production subsidies, state loans, loans guarantee interest rate subsidies and tax exemptions. Import policy includes tariffs, quotas, import ban, import licensing requirements. Export policies include export bans, export licensing requirements and export taxes. Export incentives include trade finance, financial assistance in foreign markets, tax-based export incentives. IP = industrial policy.
the largest subsidies (per unit revenue), but these sectors are heavily dominated by state-owned enterprises (SOEs). Combined, industries and provinces account for only 1 to 4 percent of the variation in subsidies and tax incentives, whereas 38 to 45 percent is due to differences across firms.
Subsidies and tax incentives are directed to very different types of firms (figure II.20). To allow direct comparison across variables of different units, all coefficients are fully standardized, so reflect the difference in tax incentives (as a share of their statutory tax bill) or direct subsidies (as a share of sales)—in standard deviation (SD) units—associated with a 1 SD change in each firm characteristic. Tax incentives are overwhelmingly a tool used for foreign firms. Being foreign-owned is associated with a 0.13 SD increase in tax incentives, in contrast, state-ownership strongly predicts direct subsidies (0.07 SD). However, the strongest predictor for both measures is past receipt of support: Prior recipients are associated with 0.26 SD higher tax incentives and 0.22 SD higher direct subsidies, conditional on all other characteristics. The latter suggests persistence of policy support and perhaps limited use of sunset clauses.
FIGURE II.17 The Republic of Korea uses more direct subsidies; the Philippines and Indonesia use more tax incentives.
Sources: IMF 2024, Government Finance Statistics; world Bank 2024d, BOOST; Redonda et al. 2025, Global Tax Expenditure Database.
Note: Tax incentives reflect “Tax expenses” in the Global Tax Expenditure Database expenditures, reflecting provisions that result in foregone tax revenue for the government.
FIGURE II.18 China, Thailand, and the Philippines display a high share of firmspecific instruments.
Share of firm-specific measures, 2019–23
what are the impacts?
In this section we discuss some evidence on the potential impacts of sectoral IP. We first present a cross-country analysis matching sectoral information on subsidies with firm-level data; we then look more closely at Chinese firm-level subsidies data, before reviewing some rigorous academic evidence for sectors and countries. Finally, we present some examples of IP in EAP.
Results from a cross-country analysis linking sectoral subsidies and firm level data
Mean firm-specific measures
Sources: GTA Database; world Bank estimates.
Note: The value for Cambodia is zero, hence no bar is displayed.
FIGURE II.19 Chinese subsidies are concentrated in relatively few firms.
Source:
The empirical analysis presented in this section relies on a newly assembled data set combining detailed information on government subsidy programs with firm-level balance sheet and production data for manufacturing firms worldwide. The data set is constructed by merging two main sources: (1) the Corporate Subsidy Inventory 2.0 (CSI) from the Global Trade Alert (GTA) database, and (2) firm-level data from Orbis (Bureau van Dijk). Details are presented in the annex.
Using the textual descriptions available in the CSI-GTA database, subsidy measures are classified into major mutually exclusive categories reflecting the instrument used. Instrument-based categories include (1) direct transfers (such as grants, equity injections, or state aids); (2) tax breaks and fiscal incentives; (3) loans and guarantees; and (4) export-promotion measures. This feature enables the analysis to distinguish between different types
of IP interventions rather than treating subsidies as a uniform policy instrument.
The empirical framework chosen for the analysis allows multiple subsidy attributes to be active simultaneously within a country-sector-year. This specification enables identification of the association between each subsidy type and the productivity, revenues, and input choices in targeted markets, conditional on country-sector characteristics, time effects, and firm-level unobservable factors. The analysis is run on two subsamples of observations, distinguishing G-20 countries and all the other economies. In effect, the analysis isolates whether and how certain policy designs affect firm performance in market environments at a different stage of economic development.
The main results of the analysis are presented graphically in figures II.21 and II.22. In both figures, results for G-20 countries and for developing countries are shown in the left and right panels, respectively.
Figure II.21 illustrates the effects of subsidies on total factor productivity (TFP). In G-20 countries, tax breaks and loans are associated with mostly nonsignificant effects following the implementation of the subsidy. By contrast, export-promotion initiatives and direct transfers exhibit positive effects. In developing economies, subsidies do not show
systematic productivity impacts, and there are no substantial differences across policy instruments. The effects of subsidies on revenues (not shown) closely mirror those observed for TFP in both G-20 and developing countries. These findings suggest
II.20 Foreign firms receive more tax incentives, whereas subsidies are directed towards state-owned firms; past recipients are much more likely to receive either measure.
Source: world Bank calculations based on Chinese State Taxation Administration data for firms of all sizes, 2008–12.
Note: Reflects pooled cross-section regressions of the outcomes: tax incentives (as a share of their statutory tax bill) or direct subsidies (as a share of sales), including zeroes for non-recipients. All firm characteristics are included in a single regression, which also controls for labor productivity, employment, a negative profit dummy and include year and 2-digit sector fixed effects. Reflects fully standardized regression coefficients to enable comparability across different units of the variables above, that is, they show the change in tax incentives or direct subsidies, in standard deviation units, associated with a one standard deviation increase in firm characteristics (foreign ownership, labor productivity, etc.). For comparability, all variables are standardized, including dummy variables. The negative bars reflect that increases in the firm characteristic (e.g., foreign ownership) is associated with lower direct subsidies. Std. dev. = standard deviation.
FIGURE II.21 Export promotion and direct transfers have positive productivity effects in the G-20 economies, but not in other emerging economies.
B. Effects on TFP, emerging economies
Note: The econometric specification used in the analysis is an augmented three-way fixed effects difference-in-differences model. The time-varying dependent variables, at the firm level, are alternatively: TFP (estimated with the wooldridge 2009 method). Subsidies are measured with dummy variables at the country-sector-year level, with sectors defined at a 3-digit level. The model controls for country-sector, sector-time and country-time fixed effects and for firm-level fixed effects. Standard errors are robust to heteroskedasticity and clustered at the firm level. The period of analysis is 2012 to 2019. TFP = total factor productivity.
FIGURE
Foreign-ownedState-ownedPast recipients
Standardized Coefficient (Std. dev. units)
Tax incentives Direct subsidy
A. Effects on TFP,
1 year after treatment2 years after treatment3 years after treatment A. Effects of loans on input choice, G-20
Note: The econometric specification used in the analysis is an augmented three-way fixed effects difference-in-differences model. The time-varying dependent variables, at the firm level, are logs of capital intensity (capital-to-employees ratio), logs of employment (number of employees). Subsidies are measured with dummy variables at the country-sector-year level, with sectors defined at a 3-digit level. The model controls for country-sector, sector-time and country-time fixed effects and for firm-level fixed effects. Standard errors are robust to heteroskedasticity and clustered at the firm level. The period of analysis is 2012 to 2019.
that a certain level of institutional development may be a precondition for effective deployment of IP.
These findings suggest that IP instruments targeting export performance and production capacity may enhance firm performance, potentially by facilitating learning processes and quality upgrading. However, these beneficial effects appear to be concentrated in advanced economies, where firms potentially operate in contexts with higher endowment of basic human capital, infrastructure, and institutions while being less exposed to policy failures.
Figure II.22 reports the association between subsidies and input allocation. In both G-20 and developing economies, loans are associated with higher capital intensity around the second and third years after the initial policy treatment. Consistently, in both groups of countries loans are associated with lower employment levels. By contrast, loans and guarantees may facilitate the adoption of capital-intensive technologies that reduce the demand for labor.
Overall, the results indicate that subsidy design matters and that there is meaningful heterogeneity across countries at different stages of economic development. In particular, the productivity effects of IP instruments targeting export performance and production capacity appear stronger in advanced economies and negligible in developing economies,
while input reallocation effects may be significant in both contexts. At least two caveats of this analysis should be stressed: The coverage of the Orbis data set for EAP countries is very heterogeneous, and the treatment variable is measured at only sectoral level. For these reasons, we present in the next section evidence from one country where we have access to firm-level subsidies data.
Results from Chinese firm-level subsidies data
Evidence from China suggests that the choice of IP instrument may influence firm performance. Analysis of data from China’s STA indicates that tax incentives are positively correlated with increases in labor productivity, employment, and exports, whereas direct subsidies are associated with declining productivity and exports (figure II.23). Specifically, a 10 percentage point increase in tax incentives (relative to the firm’s statutory tax bill) is associated with a 6 percent rise in labor productivity. In contrast, an equivalent increase in direct subsidies (relative to sales) is associated with a 3 percent decline. These results align with findings for listed Chinese firms, where direct subsidies have similarly been linked to lower productivity growth and lower R&D expenditure, but to a small and temporary employment increase (Branstetter et al. 2023). The inefficient firms who receive subsidies could be preserving jobs at the expense of productive investments. These estimates are correlations and may partly reflect differing trends between the
low-performing firms that tend to receive subsidies and the high performers that receive tax incentives. However, the divergence in outcomes persists even after controlling for differing trends for firms of different size and ownership type.
The contrasting impacts could reflect the distinct behavioral incentives created by each tool. In principle, production subsidies encourage investments in scale, whereas tax incentives encourage productive investments that increase profits. However,
II.23 More generous tax incentives are associated with productivity increases, whereas direct subsidies are correlated with falling
subsidies can often be allocated for a broad variety of motives, such as political connections or avoiding job losses. Limited information on how government support operates in China complicates this assessment. While 80 percent of Chinese listed firms subsidies are for “unknown” or “general business” functions, only 10 percent are explicitly linked to more productive uses like R&D or machinery upgrading (Branstetter et al. 2023). Evidence for listed firms finds that subsidies have a modest employment impact and that even those linked to R&D or industrial and equipment upgrading do not show any statistically significant evidence of positive effects on subsequent firm productivity growth (Branstetter et al. 2023). It also remains unclear whether the tax incentives observed were conditional on specific investments, a design feature shown to significantly enhance their effectiveness (Clark and Skrok 2019).
Source: world Bank calculations based on Chinese State Taxation Administration firm-level data, 2008−12.
Note: Labor productivity reflects real value added per worker, export intensity denotes exports as a share of sales. Chart depicts the estimated percentage change in firm outcomes for a 10 p.p. increase in tax incentives as a share of the firm’s statutory corporate tax bill (in blue) or direct subsidies as a share of firm sales (in red). Estimates obtained via two way fixed effects regressions including firm and year dummies. Similar estimates are found when restricting the data to only firms with positive profits, rather than all firms in the data.
Beyond the choice of instrument, the high concentration of Chinese subsidies in relatively few firms (noted in earlier figure II.20) may dampen aggregate productivity by reducing competition and slowing resource reallocation. When subsidies are narrowly targeted, they can entrench incumbents and stifle market dynamism. Conversely, earlier evidence from China suggests that dispersing production, tax, or interest rate subsidies across a broader range of firms can foster competition and encourage innovation (Aghion et al. 2015). Broader access to
FIGURE II.24 In the Republic of Korea, the industrial policies in the 1970’s increased output of affected industries by more than 100 percent, as well as employment and exports.
Treatment
continued)
FIGURE
FIGURE II.24 In the Republic of Korea, the industrial policies in the 1970’s increased output of affected industries by more than 100 percent, as well as employment and exports. (continued)
B. Output effects
Nontargeted industrie Average log output (Fitted values) 10 11 12
sTargeted (HCI) industries
C. Other variables 0.2 0.0 0.2 0.4
Export share of manufacturing (log)
Source: Lane 2025.
Note: HCI = Human Capital Index; RCA = revealed comparative advantage.
A.From figure I in Lane 2025.
B. From figure II in Lane 2025.
C Selected outcome variables from figure III in Lane 2025.
support, particularly tax or interest rate incentives, facilitates the reallocation of resources toward more productive firms, enhancing overall sector efficiency rather than protecting specific champions.
While the focus of the analysis here is on the effects of subsidies on productivity, another important dimension is the impact on innovation. Box II.3 explores this aspect for China.
BOX II.2 Subsidies and Innovation in China
Government R&D support became increasingly targeted toward state-owned enterprises (SOEs), which is correlated with a substantial increase in their patenting after the Global Financial Crisis. SOEs have a higher probability of receiving subsidies and receive larger subsidies than foreign-owned firms and privately owned firms. The gap increased after the 2009 to 2010 fiscal stimulus, especially within “strategic” sectors. This shift coincided with a sharp rise in SOE patenting over 2011–13. Each SOE applied for nearly twice as many patents as the average private manufacturing firm over the period 2011 to 2013, an increase of 150 percent compared to the pre–financial crisis period (figure II.B2.1). After 2010, SOEs dramatically increased patenting activities, with the largest expansion in utility model applications, especially among firms in the strategic sectors. The disparity may reflect other differences between SOEs and private firms, although a significant difference persists even conditional on firm size, age, export status, and sector.
But subsidies would be more efficient if they were directed to private sector firms. At the margin, privately owned firms convert subsidies and R&D expenditures into patents more efficiently than SOEs, implying lower “innovation productivity” of subsidized activity in SOEs (figure II.B2.2). In other words, private
sector firms are more efficient at turning innovation inputs into patent outputs. Similar evidence from Zhan and Zhu (2020) shows that privatizing Chinese SOEs increased their patenting with no change in their R&D expenditure (i.e., privatization increased their innovation efficiency). While increased innovation support for SOEs may have led to increased innovation, the support could have been more effective had it been directed towards these more efficient privately owned firms.
Furthermore, SOE-directed subsidies have slowed entry into innovation, reducing patent quality. Sectors where subsidies are more SOE-skewed tend to exhibit weaker innovation dynamism, measured as lower share of entrants (newly patenting firms) and with patents concentrated in fewer firms. Patents filed by entrants tend to exhibit higher quality than incumbents, so sectors with higher shares of incumbent patents or higher concentration tend to have lower quality patents (see figure B.2.3). Importantly, increasing the share of subsidies toward SOEs reduces patent quality of firms in that sector.
Overall, this evidence suggests that while subsidies may have been effective in increasing patent quantity, they have been less successful in increasing patent quality and could have been more efficiently directed.
II.B2.1 Chinese SOEs experienced a rise in patenting 2011–13, relative to pre-crisis years 2003–07.
FIGURE
BOX II.2 Subsidies and Innovation in China (continued)
FIGURE II.B2.2 Private firms are more efficient at turning subsidies or R&D expenses into patents.
Elasticity, percent
Source: Betts and Cao 2025.
Note: the bar is the estimated coefficient of each measurement on subsidy, conditional on firm size, firm age, firm’s export status, firm fixed effect, industry-year fixed effect, and location fixed effect. the whisker is the 95 percent confidence interval. r&D = research and development.
FIGURE II.B2.3 Sectors with higher SOE subsidies, patent concentration, and incumbent patenting have lower patent quality.
Share of patents by incumbents
Patent quality (Percent)
Source: World Bank calculations based on aSM-PatStat data for manufacturing firms.
Note: Shows the estimated coefficient on regressions of firm patent quality on sector-level (4 digit level) regressors (i) share of subsidies to SOEs (lagged one year), (ii) Herfindahl Herschman Index (HHI) of patents within the sector (lagged one year), and (iii) share of patents by incumbents (lagged one year). Patent quality is measured as log (1+ forward citations within five years). all specifications control for firm size, age, export status, human capital stock, sector fixed effect, year fixed effect and location fixed effects. regressions are weighted by the inverse of the number of patents filed by the firm in a given year (1/N_it), so that each firm-year contributes equally to the estimates. the whisker is the 95 percent CI, standard errors are clustered at firm and sector-year level. SOE = state-owned enterprise.
BOX II.3 Retaliatory Trade Costs of Industrial Subsidies (based
Overview. Governments worldwide increasingly deploy industrial policies to boost strategic sectors, but a critical hidden cost is often overlooked: Domestic subsidies directly expose firms to severe foreign trade retaliations. Utilizing firm-level subsidies and trade data from China linked to global anti-dumping (AD) and countervailing duty (CVD) investigation records, a recent paper shows that direct subsidies trigger retaliatory trade protection under World Trade Organization (WTO) rules. Unfortunately, the paper is not able distinguish the targeted activity (e.g., production, R&D, or investment subsidies).
Key findings
• Increased probability of duties: Exported products from more heavily subsidized firms are significantly more likely to receive affirmative AD/ CVD rulings. These rulings lead to the imposition of duties (table II.B3.1).
• Higher duties: When investigations lead to duties, larger subsidies consistently result in higher, more punitive duty rates (table II.B3.1).
• Loss of firm-specific exemptions: Heavily subsidized firms are much less likely to secure favorable firm-specific duties. These firm-specific duties average 81 percent, compared to the standard 145 percent productwide rate. A 1 percentage point increase in the subsidy rate reduces a firm’s likelihood of obtaining a firm-specific rate by 0.7 percentage points. This reduction translates to an overwhelming 47 percentage point increase in the expected duties
Firms facing a duty
Firms with a firm-specific duty
on Feng et al. 2026)
faced by firms that might otherwise be eligible for firm-specific treatment.
• Negative spillovers: Subsidies create adverse spillover effects. Even nonsubsidized firms face punitive AD/CVD measures if they export a product that is targeted due to heavily subsidized peers.
• Erosion of policy benefits: The retaliatory AD/ CVD duties induced by these subsidies wipe out roughly 22 percent (about a quarter) of the revenue growth that the subsidies would otherwise create for the firms (figure II.B3.1).
Policy implications
On the face of it, Chinese subsidies appear to increase firm revenue. However, their effectiveness is reduced by foreign retaliation that raises trade costs, and the higher trade costs faced by non-subsidized firms creates new inefficiencies. Failing to account for this hidden cost leads governments to overstate the net benefits of industrial policy. This oversight risks directing public funds toward sectors likely to face trade retaliation. It may also fuel deeper trade frictions and geoeconomic fragmentation. While retaliation reduces the effectiveness and efficiency of subsidies, they may still be desirable from a policy maker’s perspective if investment or market entry would not occur in the absence of support. Policy makers should, however, carefully weigh the intended benefits of subsidies against the potential extent of foreign trade retaliation they may trigger.
+0.36 p.p. in the duty rate
+2 to ~4 p.p. in the duty rate
Note: This table shows the impact of subsidies on the AD/CvD duties faced by Chinese firms. A 1 percentage point increase in the subsidy rate (the ratio of firm subsidy income to output) raises AD/CvD duties by 0.16 percentage points for an average firm in the Chinese economy. The effect is larger for firms targeted by foreign AD/CvD investigations. For those facing AD/CvD investigations, a 1 percentage point increase in the subsidy rate increases duties by 0.20 percentage points. For firms facing affirmative AD/CvD investigations, a 1 percentage point increase in the subsidy rate raises duties by 0.36 percentage points. For those subject to firm-specific examinations during AD/ CvD investigations, a 1 percentage point increase in the subsidy rate leads to between 2 and 4 percentage points increase in AD/CvD duties. AD = anti-dumping; CvD = countervailing duty; p.p. = percentage point.
TABLE II.B3.1 Impact of subsidies on Chinese firms’ expected AD/CVD duties
BOX II.3 Retaliatory Trade Costs of Industrial Subsidies (based on Feng et al. 2026) (continued)
FIGURE II.B3.1 Impact of Subsidies on Chinese Firms’ Revenue Growth with and without Foreign AD/CVD Duty Retaliation
Last, recent research shows that subsidized firms in China experience a greater exposure to foreign antidumping measures, resulting in a reduction of the positive effects of subsidies on sales. Box II.4 discusses this result, which highlights an important conceptual point: Different IP instruments interact with each other in determining the ultimate impact on firm level outcomes.
Focus on industry and region-specific support:
Effectiveness versus efficiency
IP interventions do not always work. Even when IP interventions are effective (meaning they are able to increase production or revenues), it is more difficult to establish efficiency, namely, to assess whether the effects of the interventions justify their costs.
Evidence for the potential effectiveness of IP comes from Korea, where in the 1970s, the government embarked in a series of IP actions aimed at fostering heavy manufacturing industries (Lane 2025). Figure II.24A illustrates the size of the interventions, which consisted of tax rate reductions and development lending. Panel B in the figure illustrates the effects on output, which exceeded
100 percent relative to the nontreated industries. Panel C shows further positive effects, in terms of labor productivity, employment, exports, acquisition of comparative advantage.
Choi and Levchenko (2025) also study the case of the HCI Drive in Korea. They present a model that allows them to explore efficiency as well. Their conclusion is that this episode of IP generated larger benefits than costs. If it had not been implemented, the authors conclude, Korea’s welfare would have been 3–4 percent lower. Moreover, the study finds that most of the total welfare impact is attributable to the longterm productivity benefits of learning-by-doing and that the policies were concentrated in those sectors where the welfare multipliers were higher (figure II.25).
A second example of effectiveness is reported in figure II.26, which shows the results of a study for England, where the place-based support was effective in increasing employment (or better, to reduce the extent of employment decline) (Criscuolo et al. 2019). However, the interventions were found to be effective only for firms with less than 50 employees,
and the study found no significant effects on productivity. Moreover, the paper estimates a cost of US$3,541 to US$24,662 (in 2010 prices) per job created.
FIGURE II.25 In the Republic of Korea, the share of subsidized credit was allocated towards sectors where the (model-computed) welfare multiplier of industrial policy was higher.
Finally, Barwick et al. (2025) present a study on the Chinese shipbuilding industry, where robust government support helped increase the global market share of Chinese shipyards from below 10 to almost 50 percent in the period 1998 to 2014 (figure II.27). Since this study estimates a structural model, it allows to run counterfactuals and, hence, study effectiveness as well as efficiency. The effectiveness of government interventions is apparent (figure II.28). Without subsidies, there would have
FIGURE II.27 State interventions in the China’s shipbuilding industry significantly increased China’s global market share.
China Japan Korea, Rep.
Source: Choi and Levchenko 2025. Note: Changes in welfare in the short run (blue bars), long run (red
(orange bars) from giving
a
in
of
and in
of the initial GDP (left axis), and the share of the aggregate credit received by each sector (dashed line, right axis).
FIGURE II.26 In the United Kingdom, industrial subsidies were found to increase employment, but the effects were only found in firms with less than 50 employees.
Source: Barwick et al. 2025.
Note: Market shares by country are computed from quarterly ship orders.
FIGURE II.28 Model simulations suggest subsidies led to substantial firm entry.
Number All subsidies No subsidies
Source: Criscuolo et al. 2019.
Note: Average changes relative to base year of 1997 in log employment in a geographical area (ward). The dashed line shows average employment in wards that had an increase in support. The solid line is average manufacturing employment in wards that had a decrease in support. Ninety-five percent confidence bands also shown. The vertical line in 2000 shows when the change in policy occurred.
Source: Barwick et al. 2025.
Note: Total number of firms in the case of all subsidies as observed in the data (solid line) and counterfactual number of firms with no subsidies (dashed line).
been half as many shipbuilding firms as observed in the Chinese market. However, computing the rate of returns of these subsidies reveals a different reality (figure II.29).
The change in profit per unit of subsidy varies, but it is always below 100 percent, which means that once the cost of the subsidy is subtracted, the intervention is inefficient. Moreover, the study allows them to highlight how in this specific episode, subsidy efficiency is found to be heterogeneous (1) across subsidy types (with investment subsidies being more efficient than production subsidies and entry subsidies), (2) across the business cycles (with countercyclical subsidies being more efficient than procyclical ones), and (3) across design (with targeted subsidies being more efficient than blanket subsidies to all firms).
While these studies were country specific, two recent articles propose investigations using models featuring many countries. The main message is quite sobering. Bartelme et al. (2025) find that even considering policies that are globally efficient, the average expected increase in GDP (equivalent to welfare in their model) is only about 1 percent on average globally and also for China
and Viet Nam. Lashkaripour and Lugovskyy (2023) point to the possibility of negative effects from unilateral IPs, which could, however, be reverted in the context of a global coordination via deep agreements.
Examples of recent IPs in the EAP region
To complement the data-based view presented above with more concrete examples, we present in this section some specific recent policy initiatives that allow us to assess how IP is currently being utilized for different purposes in the EAP countries.
“Resource downstreaming” in Indonesia
Indonesia is a global pioneer of using export bans to force industrialization, a strategy it calls Hilirisasi (Downstreaming). Box II.4 delves into the historical details of it.
Viet Nam: The “Semiconductor Development Strategy 2030”
In late 2024, Viet Nam’s Prime Minister signed Decision No. 1018, a landmark strategy to transition the country from an assembly hub to a global semiconductor power. Of particular interest is the “50,000 Engineers” Initiative: a human capital project to train 50,000 semiconductor engineers by 2030 to solve the regional talent shortage. This initiative is also a prime example of how sector-targeted skills development can be an important IP tool, as explored more in depth in box II.5, which reproduces key excerpts from McKenzie (2026).
Electric vehicle policies in Thailand
Thailand is actively pivoting its massive internal combustion engine (ICE) ecosystem toward electric vehicles (EVs). See box II.6 for details.
Mission-based industrial strategies: Malaysia New Industrial Master Plan (NIMP) 2030
Launched in late 2023 but seeing its first major “Mission-Based Projects“ in 2024–25, Malaysia is shifting away from broad sectoral support toward specific “missions”: (1) Advance Economic Complexity, (2) Tech Up for a Digitally Vibrant
FIGURE II.29 The costs of government interventions
greater than the benefits.
Nation, (3) Push for Net Zero, and (4) Safeguard Economic Security and Inclusivity. The NIMP 2030 has identified EVs and the digital economy, anchored on data centers, as twin engines of Malaysia’s next industrial phase, consistent with global industrial trends. Both also expose the
balancing act in Malaysia’s policy model between the ambition to attract foreign capital and to build domestic productive capability. Box II.7 delves into the policies related to the development of EVs, while the data centers are discussed in the Spotlight on the AI value chain.
BOX II.4 Promoting Higher Value-Added Mining in Indonesia
Indonesia has pursued a deliberate industrial policy of leveraging its natural resource endowments to develop higher value-added downstream industries in the mining sector. Indonesia introduced its first export restriction in 2014, with further restrictions continuing to be introduced, with the most recent measure taking effect in 2025.a Successive regulations have progressively extended the scope of domestic processing requirements, shifting the threshold for permissible exports further down the value chain and narrowing the conditions under which raw or semiprocessed commodities may be exported. This sequential tightening follows Indonesia’s “downstreaming” policy, which aims to capture a greater share of value addition from natural resource value chains domestically. Indonesia is also planning to extend the downstreaming initiative beyond the minerals sector to other commodity industries, including palm oil, coffee, cocoa, and fisheries.
The export ban covers four layers of the mineral value chain with progressively higher specificity. The initial export ban in 2014 was entirely focused on raw ores (aluminum, bauxite, cobalt, copper, gold, metal waste, nickel, silver, tin, and zirconium). Successive bans began to cover additional layers in the mineral value chain such as high-grade mineral concentrates; processed intermediates, and refined metals. The downstreaming policy has, for instance, transitioned Indonesia from exporting raw nickel ore to higher-value processed products such as ferronickel and nickel pig iron. Prior to 2014, Indonesia exported an average of approximately US$1.5 billion in raw nickel ore annually. Following the introduction of the export ban, raw ore exports declined to zero, while exports of processed ferronickel rose substantially, reaching US$15 billion in 2023. The policy has attracted FDI in the base metals industry, from an annual average of US$50 million to US$209.1 million, catalyzing the construction of largescale integrated industrial complexes in Morowali and Weda Bay. The policy did not lack challenges, however. In particular, the limited transfer of technology and employment creation. While the costs and benefits are not conclusive, issues such as environmental impact, safety issues, and ESG concerns show further potential negative impacts of this policy.
These export restrictions are generally inconsistent with World Trade Organization (WTO) commitments and obligations. This tension was confirmed by the WTO Panel ruling in the dispute brought against Indonesia’s nickel ore export ban, which found the export ban to be incompatible with Indonesia’s multilateral trade obligations.b In addition, the associated domestic processing requirements constitute actionable subsidies under the Subsidies and Countervailing Measures (SCM) agreement. Indonesia has filed an appeal on this ruling and given the WTO Appellate Body does not presently function, the dispute remains in abeyance. As a result, Indonesia has not yet been required to comply with the ruling.
Mining accounts for only about 7 percent of Indonesia’s GDP but about 15 percent of exports. Mining also accounts for 9 percent of total intermediate input use and less than 1 percent of gross fixed capital formation. Extractive industries tend to be relatively capital intensive, adding up to a higher share of capital use (8.2 percent) and at about 15 percent of the total; raw mining products add up to an important share of Indonesian exports (figure II.B4.1).
The interconnectedness of the mining sector with the rest of the Indonesian economy has, however, been limited. Output multipliers indicate that a US$1 increase in the output of the mining sector leads to a US$1.7 increase in total domestic output in Indonesia. This is in contrast with other comparable exporters, such as China, Brazil, and South Africa, that have mining output multipliers close to twice as high (figure II.B4.2). Among specific mining products there is variation in output multipliers, on the lower end being natural gas, bauxite, crude petroleum and iron ore and on the higher end, coal and lignite, nickel, silver, and gold. Compared to other sectors in the Indonesian economy, the potential of mining to generate value added in other sectors has lagged, with mining toward the lower end of the distribution together with agriculture, education services, financial services, real estate, and whole/retail trade (figure II. B4.3). In terms of existing linkages, the mining
BOX
II.4 Promoting Higher Value-Added Mining in Indonesia (continued)
FIGURE II.B4.1 The role of mining in Indonesia’s economy
Sources: BPS. 2016 Input-Output table; OECD Input-Output Tables.
FIGURE II.B4.3 Cross-sectoral output multipliers in Indonesia
Sources: BPS. 2016 Input-Output table; OECD Export Restrictions on Critical Raw Materials.
industry is relatively better connected with the processing industry, transportation and warehousing, and business services.
FIGURE II.B4.2 Output multipliers for mining of nonenergy products
Source: world Bank estimate.
FIGURE II.B4.4 Export restrictions in place by year
Source: GTA.
Indonesia is among the few countries using bans on exports of raw mining products with the objective of developing higher value-added mining activities downstream. Among comparable exporters of mining raw materials, about 35 percent of countries use no restrictions at all, close to half use less restrictive policies such as export taxes or quotas and nonautomatic
licensing—while Indonesia is among the remaining 28 percent of countries imposing export bans (figure II.B4.4). In terms of products, export restrictions in Indonesia are notably imposed on bauxite, tin (for both of which Indonesia accounts for more than a quarter of world exports) and nickel—where Indonesia’s share of world production adds up to nearly two-thirds of the total. This significant share in world exports and production puts Indonesia in the position of a price maker and, as such, policies affecting exports of these products will have implications not only domestically but also for the rest of the world economy.
Initial results show short-run gains in foreign investment and domestic value added, but the policy’s long-term effects are less clear. Data show that the ban led to rapid growth in Indonesia’s production and export of processed nickel products, alongside increased foreign direct investment in nickel extraction and processing. Guberman et al. (2024) document that this foreign investment originates mostly in China. Likewise, econometric analysis indicates that it increased domestic value added in exports from industries using iron and steel inputs between 2014 and 2020. Kee and Xie (2025) show that this increase occurred relative to a downward trend in the country’s domestic value added in exports. However, the ban also reduced average business size in downstream industries and encouraged entry by smaller businesses that likely benefited from artificially low nickel prices. Because small businesses are often less productive, modeling suggests the policy likely led to inefficient resource allocation and productivity losses—although no direct measures of productivity are yet available (Fliess et al. 2017). Examples from countries that have successfully developed their industrial raw materials sectors (e.g., Australia, Chile) show that reforms incentivizing the development of value-added-creating clusters around mining sectors, especially in services (engineering,
aMinistry of Trade Regulation No. 8.2025. bDS592 EU vs. Indonesia.
mapping, geological analysis, specialized equipment, and technologies for extraction and processing) and reforms that boost regulatory stability to attract investment, are more successful in achieving such policy objectives. Nevertheless, even with successful diversification into higher value-added mining industries, countries relying heavily on commodities to contribute to growth remain vulnerable to commodity price shocks, booms, and busts as well as the commodity cycle.
With the right combination of targeted policies, Indonesia could replace distortive export restrictions to promote the development of greener and higher value-added mining activities. Indonesia has untapped comparative advantages for exports of mining products, such as semifinished products of iron and nonalloy steel, copper mattes, and zinc powders (close to current production capabilities) but also untapped comparative advantages for exports of mining products such as springs of iron and steel, flat-rolled products of stainless steel, wires of stainless steel or articles of nickel slightly farther from current production capabilities. With domestic smelting capacity now well established, replacing the nickel export ban with a carefully calibrated export tax may present an opportunity to better balance revenue generation and value-addition objectives. An export tax would strengthen competitiveness in the upstream segments, enable more efficient resource allocation along the value chain, and allow producers to respond more dynamically to global price fluctuations. Revenue generated could be reinvested through transparent, performance-based subsidies directed toward priority downstream industries, including the battery supply chain. Complementary reforms across fiscal policy, trade facilitation, business regulatory environment, land management, and infrastructure would strengthen the enabling conditions for downstream industrial development.
BOX II.5 Sector-Targeted Skills Development as Industrial Policy (excerpts from McKenzie 2026)
Sector-targeted training programs are designed to train workers in specific areas required by targeted industries. Examples include training workers in the technical skills needed for manufacturing automobiles or computer chips, installing solar panels, working in vaccine development, etc. Governments around the world invest in sector-specific skills through their technical and vocational training (TVET) systems, and through their university systems. Typically, these investments have been justified on the basis of arguments that the public return to education can exceed the private return, which coupled with liquidity constraints, results in students otherwise underinvesting in human capital. While the evidence on the effectiveness of public vocational training systems is at best mixed (Carranza & McKenzie 2024), studies of the staggered expansion of higher education in China and Brazil have found that a growing pool of collegeeducated workers, particularly in science and engineering, increases innovation, productivity, and trade (Ma 2024; Cirera et al. 2025). Even when industrial policy (IP) is not the prime motive for such investments, the quality of human capital can shape IP and multinationals are more likely to conduct research and development in countries with better human capital (Fan 2025).
There are at least two additional market failures that motivate the use of sector-targeted skills as an explicit part of IP. The first is coordination failures (Rodrik 2022). A large firm may only be willing to make an investment in a new location if the local workforce has the skills it needs, but it may not be profitable for workers to invest in acquiring these skills if this investment does not take place, and local educational institutions may not offer training that meets these future needs. Second, even if the government succeeds in attracting new firms, they may underinvest in training workers because of the possibility that workers will leave and take these skills to other firms in the industry (e.g., Colombian [Caicedo et al. 2022] and Ghanaian [Brown et al. 2024] evidence). The government can then play a role in helping coordinate the different parties, and in subsidizing training that offers benefits beyond the individual firm.
Service-centric IPs
In addition to developing a domestic industry, sector-specific skill training can be an integral part of a service-centric IP that prepares workers for the global market through migration. This has worked best when the government has regulated quality, but enabled the private sector to increase the supply of training opportunities in areas with strong global demand. Recent studies of nurses in the Philippines (Abarcar & Theoharides 2024) and IT workers in India (Khanna & Morales 2021) have found that this lead to a “brain gain,” whereby the country increased the supply of these skilled emigrants, while also growing the number of skilled workers in these fields at home as not all those who were trained emigrated. Kenya has started working with vocational schools to tailor their courses to meet foreign labor demands (Ross & Martinez 2025) as part of a new goal to dramatically expand emigration job opportunities. Sector-specific training is also taking place as part of industrial strategies to help countries move out of carbon intensive activities such as coal. The EU’s Just Transition Funds have been supporting these efforts to re-skill workers in Slovakia’s Horna Nitra region and Romania’s Jiu Valley (European Commission 2021).
what to watch out for
There are several potential risks in employing sectortargeted skills training policies. The first is that the quality of training offered by TVET and universities in many low- and middle-income countries may not meet the standard needed for global firms, and what is taught may be slow to respond to emerging demands. A second risk is that the country takes a bet on training workers on very specific skills that have no domestic return if the country is unable to develop a new industry. A third is the standard concerns of political capture, additionality and crowd-out, in which government efforts just substitute for training that would have been carried out by firms themselves. The government needs the capacity to work closely with educational institutes and industry to help them jointly shape training content, but then may not wish to commit to very specific training until after a key firm enters. For example, Costa Rica initially
BOX II.5 Sector-Targeted Skills Development as Industrial Policy (excerpts from McKenzie 2026) (continued)
had high schools and colleges develop a higher technology curricula around electronics, but did not define precisely what schools should teach, waiting until Intel came to the country to develop training in more narrow specialties (Spar 1998).
A further lesson is that technical training in science and engineering is important but may not be sufficient if there is a lack of managerial talent. Recent work has documented the high cost of middle management as a constraint to the expansion of a modern sector in developing countries (Hjort et al. forthcoming). Historical evidence from US assistance to Italian factories (see figure II.B5.1) shows a strong complementarity between
providing technology and management training. Firms that received management training experienced 50 percent higher productivity after 15 years. However, firms that received both management training and advanced US machinery experienced a 62 percent productivity gain over the same period. Randomized trials that tested provision of consulting services found improvements in management, productivity, and employment in India (Bloom et al. 2013) and Colombia (Iacovone et al. 2022). Improving management is subject to similar concerns about the capabilities of domestic training organizations to meet global standards, but has the potential advantage of providing a key input holding back many industries in the country.
Notes: The US intervention year is normalized to zero, and the gray shaded area corresponds to the 3-year follow-up period. The dependent variable, log TFPR, is revenue total factor productivity, estimated using the Ackerberg, Caves, and Frazer 2006 method. whiskers reflect 95 percent confidence intervals. TFP = total factor productivity; TFPR = revenue-based total factor productivity.
FIGURE II.B5.1 US management training raised the productivity of Italian manufacturing firms.
Productivity (TFP)
Source: Giorcelli 2019.
BOX II.6 Industrial Policy in Thailand for Promoting the Automotive Sector Transition to EV
Global decarbonization, structural transition, and Thailand’s automotive base
Global demand for clean and low-carbon technologies is reshaping industrial production patterns, with the electrification of transport emerging as a central driver of structural transformation. As countries accelerate climate commitments and consumers shift toward electric vehicles (EVs), global automotive value chains are rapidly reconfiguring. Thailand’s existing strengths in the automotive sector therefore offer significant opportunities to build competitiveness in electric mobility as part of its broader advanced and green manufacturing strategy (figure II.B6.1).
Supply chain resilience and upgrading potential
The automotive and auto parts industry accounts for about 3 percent of GDP and 9 percent of manufacturing employment. While production has faced pressures amid the global shift away from internal combustion engine vehicles, Thailand’s established ecosystem, including assemblers and a dense supplier network, provides a strong base for repositioning toward EV manufacturing. EV-related value chains, under a broad definition,
FIGURE II.B6.1 Thailand outperforms comparators on broader EV value chain exports (including components used in both ICE vehicles or EVs).
already account for 4.3 percent of total exports, exceeding those of most ASEAN peers (World Bank 2026b). Firm-level analysis indicates that more than 80 percent of auto parts sales in Thailand could continue to be used in EVs, with 58 percent of sales unaffected by the transition and 19 percent requiring only limited modification (figure II.B6.2). This suggests considerable potential to preserve domestic employment while upgrading production capabilities.
Thailand’s Ev industrial policy framework (ZEv30@30 and Ev3.0 / Ev3.5)
Thailand’s EV transition is anchored in the national “30@30” target, which aims for zero-emission vehicles to account for 30 percent of domestic production and 50 percent of domestic sales by 2030. To operationalize this ambition, the government introduced phased incentive packages, EV3.0 (2022–24) and EV3.5 (2024–27), which combine consumer subsidies, excise tax reductions, tariff cuts, and binding local production commitments. Under EV3.0, purchase subsidies ranged from THB 70,000 to THB 150,000 per vehicle, depending on battery size, alongside excise tax reductions from 8 percent to 2 percent and temporary import duty reductions of up to 40 percent for qualifying models. Importers were required to offset
FIGURE II.B6.2 The impact of EV adoption on auto parts producers, by sales revenue values
Source: world Bank calculations.
Note: ICE = internal combustion engine.
Note: E&E = electronics and electrical manufacturing.
in Thailand for Promoting the Automotive Sector Transition to
imports with domestic production at ratios such as 1:1 (and higher ratios for delayed production). EV3.5 recalibrates support as the market matures, lowering subsidies over time (e.g., THB 50,000–100,000 in 2024, declining thereafter) while maintaining reduced excise taxes and tightening localization requirements to 1:2 and 1:3 import-to-production ratios by 2026–27. Additionally, to encourage exporters and prevent oversupply, there is a scheme to allow 1 exported EV to count as 1.5 units toward local production obligations (table II.B6.1).
Complementing these demand-side measures, the Board of Investment provides up to 8 years of corporate income tax holidays, exemptions on machinery imports, and facilitation of foreign expert work permits to attract EV assembly, battery, and component investments and deepen Thailand’s domestic supply chain.
Early achievements in adoption and local production
Over the past 3 years, Thailand’s EV policy has materially accelerated both market uptake and local production. EV adoption increased from about 1 percent of passenger car sales in 2022 to approximately 21 percent in 2025. Newly established EV assembly plants have begun operations, and locally produced battery electric vehicles (BEVs) account for roughly 11 percent of total passenger car production and about 43 percent of domestic BEV sales in 2025. However, progress remains uneven relative to national ambitions. EV sales remain well below the 50 percent target by 2030, and exports are still at an early stage, with approximately 3,500 BEVs shipped abroad, only 0.5 percent of total passenger car exports, indicating substantial room to strengthen Thailand’s position in global EV markets (figure II.B6.3).
Source:
FIGURE II.B6.3 BEV production and sales versus national targets
TABLE II.B6.1 EV subsidy and tax cut policies
BOX II.6 Industrial Policy in Thailand for Promoting the Automotive Sector Transition to EV (continued)
Policy directions to deepen the Ev transition
Going forward, industrial policy should gradually shift from broad, expensive purchase subsidies toward tools specifically designed to solve market failures. Subsidy schemes carry fiscal costs and should be gradually phased out as EV total cost of ownership approaches parity with internal combustion engine vehicles. Expanding charging infrastructure, instead, remains critical to solve coordination problem, sustain adoption momentum, and anchor private investment in the ecosystem (World Bank 2025d).
Deepening domestic value creation will require targeted support for local supply chains, particularly in higher-value EV components such as power electronics, battery systems, and embedded software. In
this regard, the Board of Investment has introduced a local content promotion measure to strengthen the EV supply chain by granting an additional 50 percent corporate income tax reduction for 2 years to manufacturers that meet prescribed domestic content thresholds (40 percent for BEVs and 45 percent for PHEVs). Applications must be submitted by the end of 2026, with Made-in-Thailand (MiT) certification required by 2027.
Complementary investments in STEM skills, digital engineering, and sustainable manufacturing capabilities will be essential to ensure that Thai firms upgrade technologically and move beyond assembly toward higher-value-added activities supported by technology transfer, local R&D, and innovation ecosystems.
BOX II.7 Electric Vehicles: Opportunity and Challenges of Malaysia
Malaysia’s strategic rationale for EVs rests on three overlapping motivations. First, to decarbonize transport in line with the Low Carbon Mobility Blueprint and commitments under the National Energy Transition Roadmap (NETR). Second, to leverage the established E&E manufacturing ecosystem to develop an EV supply chain with high domestic linkage potential, and third, to reposition national carmakers Proton and Perodua for relevance in a post–internal-combustion-engine period. Under the NETR, the government targets 15 percent EV penetration of total industry volume by 2030 and 80 percent by 2050 (Ministry of Economy 2023).
Progress has been modest against these targets. EVs accounted for approximately 2.9 percent of Malaysian vehicle sales by early 2025, reflecting genuine growth but still far below the trajectory required to meet 2030 goals (figure II.B7.1). The government has deployed a standard mix of fiscal instruments, such as exemptions from import duty and excise tax, on completely knocked-down (CKD) EV units through 2027, and
a RM100,000 price floor on completely built-up (CBU) imports designed to protect national carmakers’ market position while they develop affordable domestic models. This price floor explicitly prevented competitively priced Chinese models, which have a retail price range at the equivalent of RM18,000 to RM45,000 in other markets, from entering Malaysia, constituting deliberate import protection for national carmakers. However, from January 2026, the policy has now lapsed, and new brands entering via CBU now face a minimum price threshold of RM250,000, significantly tightening market access for lower-cost imports (New Straits Times 2026). Meanwhile, CKD (locally assembled) EVs remain exempt from excise duty and sales tax until end-2027, with several Chinese car makers such as BYD and Xpeng all committing to local CKD assembly operations in 2026. BYD is developing an assembly plant in Tanjung Malim 70 km from the capital Kuala Lumpur, where Proton’s assembly plant is also located, and is expected to be operational in the second half of 2026. This is in line with the original automotive industrialization
FIGURE II.B7.1 EVs sales reflect genuine growth but are still far below the trajectory required to meet 2030 goals.
strategy of using market access as leverage to secure local production commitments.
There are several hurdles that are currently facing EV production. Consumer adoption is constrained by inadequate charging infrastructure, while private investors are reluctant to build charging networks without a critical mass of EV users. Against a government target of 10,000 public charging points by 2025, only around 3,500 existed by October 2024 (Malaysian Investment Development Authority 2024a). While Perodua has committed to the production of affordable EVs of below RM100,000
Spotlight: Industrial policy along the AI value chain
The AI value chain is a sequence of interdependent activities that encompasses chip production, data centers to store and process data, AI models, and AI applications. At its foundation lies the supply of semiconductors: their design; fabrication; and assembly, testing, and packaging (ATP). The chips, particularly graphics processing units (GPUs), enable storage and processing of the vast data sets within cloud computing data centers that are required to train AI models. AI models, including LLMs such as GPT, DeepSeek, and Gemini, are the basis for downstream AI applications. AI applications are the products and services used by governments, firms, and individuals that have AI embedded within them, such as ChatGPT, DeepL translation, Microsoft Copilot, Tesla cars, and Waymo taxis.
Chips
Apart from China, developing EAP’s participation in the semiconductor value chain is concentrated in downstream activities rather than in highervalue-added segments like design or fabrication (figure II.31). The chip value chain includes the
by end-2025, the affordability gap versus Chinese competitors which have already achieved global cost leadership in mass-market EVs remains significant (ISEAS 2024). On the export side, Malaysia does not yet export EVs on a commercially meaningful scale. Proton’s EV ambitions remain nascent. The e.MAS 7, launched in December 2024, is planned for markets including Mauritius, Nepal, Singapore, and Trinidad and Tobago, but in modest volumes. The EV sector remains firmly domestically oriented for now, and it is too early to assess whether Malaysia’s CKD assembly commitments from Chinese OEMs will eventually generate an export platform.
Note: AI = artificial intelligence; GPT = generative pre-trained transformer; GPU = graphics processing unit.
major process steps: provision of inputs, design and fabrication, and ATP. High-value-added upstream segments, such as chip design, remain dominated by the United States, which holds 47 percent of the design market (table II.1). Given their complexity and enormous economies of scale, fabrication of semiconductors is heavily concentrated in a few firms located in a few countries, such as specialist foundries like TSMC in Taiwan, China, or integrated device manufacturers like Samsung in Korea. Fabrication of high-performance chips, such as those needed to train AI models, is particularly concentrated in advanced economies (OECD 2025a). Beyond China, developing EAP participates to a far more limited extent in the semiconductor value chain and predominantly in lowervalue-added downstream like ATP.
FIGURE II.30 AI value chain
Chips
Data and cloud Computing AI Models AI Applications AI Use
Semiconductors (e.g., GPUs)
Cloud data centers to process training data (e.g., AWS, Alibaba)
Large language model development (e.g., OpenAI GPT, DeepSeek, Google Gemini)
AI software development and customization (e.g., ChatGPT, Copilot, DeepL)
Use of AI applications
Source: Adapted from Gambacorta and Shreeti 2025.
BOX II.7 Electric Vehicles: Opportunity and Challenges of Malaysia (continued)
FIGURE II.31 Multiple stages of the semiconductor value chain.
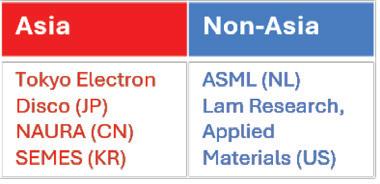
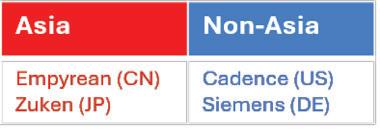
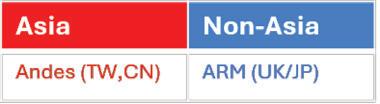
Source: Adapted from Bown and wang 2024.
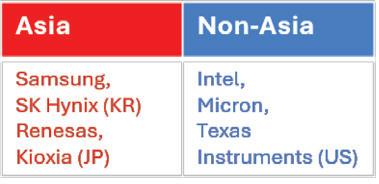
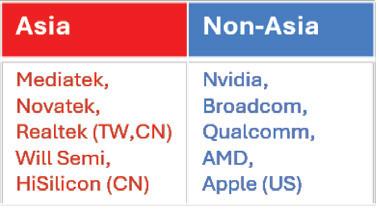
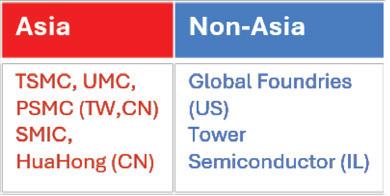
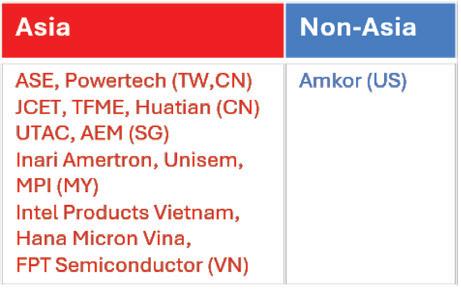
TABLE II.1 EAP participates mainly in downstream semiconductor value chain activities, such as fabrication and assembly, testing, and packaging.
Source: Khan, Mann, and Peterson 2021.
Semiconductors in Korea offer the region’s clearest example of what successful upgrading looks like. Beginning in labor-intensive assembly in the mid-1960s, Korea used a sustained combination of targeted incentives, public investment in human capital and R&D infrastructure, and strategic
industrial consolidation to become a global leader in fabrication and memory, now accounting for 22 percent of global fabrication output and 16 percent of total semiconductor value added. Yet Korea’s trajectory also underscores how demanding this path is—requiring decades of coordinated policy,
significant public risk taking, and continuous technological investment (box II.8).
Moving up the semiconductor value chain is challenging, even for countries with prior experience in semiconductors. For instance, despite holding an 8 percent share of the global semiconductor exports, most of Malaysia’s semiconductor exports serve the consumer-grade market rather than high-performance applications (box II.9). The Philippines
participates mainly in terms of ATP and has introduced a number of horizontal policy reforms with activity-based targeting (box II.10). However, the high capital intensity of semiconductor fabrication means any impact on jobs is likely limited. Analysis of the US CHIPS Act program to reshore advanced semiconductor production suggests the policy led to only 30K to 45K new jobs (both directly and indirectly), at a cost of about US$1.2 million to US$1.8 million per job (Erten et al. 2026).
BOX II.8 Semiconductors in the Republic of Korea: A Success Story of Industrial Upgrading
Semiconductors are a hallmark of the Republic of Korea’s economic rise, with exports growing 580fold since 1977 to reach US$173.4 billion in 2025. Today, Samsung and SK Hynix combined command roughly 20 percent of the global market, with revenue growth significantly outstripping the global average (figure II.B8.1). The rapid expansion of Korea’s semiconductor industry exemplifies a process of phased industrial upgrading, driven by the systematic localization of labor, capital, and technology. Central to this trajectory was the proactive role of government policy, which acted as a catalyst for each stage of indigenization. The progression of Korea and the role of government policy is summarized in figure II.B8.2 and explored in more detail in the following paragraphs.
1. the assembly phase: Domestic labor + foreign capital + foreign technology
The origins of Korea’s semiconductor industry date back to the mid-1960s. During this period, the global semiconductor industry entered a phase of accelerated growth. The United States, which held industrial hegemony at the time, faced mounting pressure from rapidly rising domestic wages. To maintain cost competitiveness, US firms began seeking offshore production locations for labor-intensive segments, ultimately moving assembly operations to Asia. Korea was selected as one of the optimal sites, offering lower wages combined with a highly educable workforce capable of
rapid skill acquisition. At the time, Korea’s educational attainment significantly outpaced its income level—a unique phenomenon driven by a deep-seated sociocultural commitment to learning. Recognizing that human capital was the sole engine for growth in a resource-poor nation, the government prioritized intensive public investment in education to accelerate the country’s industrial trajectory.
The influx of foreign capital began in 1965 with the establishment of Komy Electronics, which initiated transistor assembly in makeshift military tents in Seoul. This pioneering move was followed by the entry of Fairchild and Signetics in 1966. By 1967, global majors including Motorola, IBM, and Control Data had secured investment permits. This rapid industrial entry was institutionalized by the Foreign Capital Inducement Act of 1966, which provided comprehensive tax exemptions and legal guarantees, laying the critical foundation for Korea’s emergence as a key node in the global semiconductor value chain.
2. the capital-driven transition: Domestic labor + domestic capital + foreign technology
The second stage was marked by the massive mobilization of domestic capital through large-scale, high-risk investments by domestic firms. Although the industry still relied on licensed foreign technology, the shift
FIGURE II.B8.1 Expansion of Korean semiconductor exports and key industry players
A. Korean semiconductor exports
B. Market shares of Samsung and SK Hynix
BOX II.8 Semiconductors in the Republic of Korea: A Success Story of Industrial Upgrading (continued)
FIGURE II.B8.2 The Republic of Korea’s progression to the technology frontier accompanied sustained investment in the three pillars.
Assembly Phase (1960s)
Pillar 1: Foundational Public Goods
Pillar 2: Addressing Policy Failures
Pillar 3: Addressing Market Failures
Intensive public investment in education
Boosting FDI (Foreign Capital Inducement Act)
Capital-Transition (1970s~80s)

Establishment of KIET (now ETRI) backed by IBRD loan
Phased import liberalization of the 1980s
Electronics Industry Promotion Act (‘69): Provision of financial and infrastructure support
Tech Frontier (1990s)
Building the information superhighway
Capital-Realignment (Late 90s~Mid 00s)

Restoring macroeconomic stability after Crisis
Tech Expansion (2010s~Present)

Source: world Bank.
toward domestic capital ownership enabled the establishment of large-scale fabrication facilities (Fabs), marking the beginning of capital-intensive growth. The Korean government enacted the Electronics Industry Promotion Act of 1969, designating electronics as a strategic export sector and providing the legal framework for specialized financing and industrial infrastructure. This legislation significantly reduced investment uncertainties for domestic firms while lowering the cost of capital. By providing institutional stability, the act incentivized the large-scale private investment necessary to transition from labor-intensive assembly to capital-intensive manufacturing. Around the enactment of the 1969 act, domestic firms began to enter the industry. In 1968, Anam Industrial (predecessor to Amkor Technology) became the first Korean company to launch a domestic capital-based assembly business. This was followed by the establishment of GoldStar Semiconductors in 1970 (which later merged with what is now SK Hynix) and Korea Semiconductor in 1974 (the predecessor of Samsung Electronics’
-Government-led joint semiconductor R&D project
-Strategic coordination in semiconductor trade disputes
-‘Big Deal’ restructuring to form Hynix and minimize redundant investment
-Debt restructuring of Hynix and SK’s acquisition

Cultivating non-memory human capital

-Strong tax support under K-Chips Act
-Designating specialized industry complexes
-Providing special funds to internalize value chain
semiconductor division). Through technical partnerships with US firms, these companies assembled semiconductors for full export, integrating Korea deeper into the global supply chain.
The establishment of the Korea Institute of Electronics Technology (KIET, now the Electronics and Telecommunications Research Institute, or ETRI) in 1976, backed by a US$29 million IBRD loan, served as the primary catalyst for Korea’s semiconductor breakthrough. This funding enabled the procurement of advanced Very Large Scale Integration (VLSI) equipment and the training of a specialized workforce long before private firms could afford such risks. As Samsung and other domestic leaders entered the market in the 1980s, an influx of these state-trained researchers migrated to the private sector. The government’s provision of these essential public goods established a robust foundation that empowered Korean conglomerates to undertake bold, large-scale investments in the semiconductor sector. Samsung’s founder, Lee Byung-chull,
BOX II.8 Semiconductors in the Republic of Korea: A Success Story of Industrial Upgrading (continued)
made the historic “Tokyo Declaration” in 1983, committing to the high-stakes VLSI market. While Samsung achieved a major milestone with the development of 64K Dynamic Random-Access Memory (DRAM) in just 6 months—accelerated by a strategic technical partnership with Micron Technology—the government’s support also played a significant role in this achievement. The state facilitated the rapid construction of the Giheung fabrication plant by applying regulations flexibly, ensuring the timely provision of infrastructure, and providing large-scale policy loans from state-run banks to ease the immense financial burden of the facility investment.
3. The technological frontier: Domestic
labor + domestic capital + domestic technology
Following the 64K DRAM success, the government strengthened its role as a strategic R&D partner. Through a national R&D consortium led by ETRI, the state coordinated resources among major domestic firms—including Samsung Electronics, Hyundai Electronics (now SK Hynix), and GoldStar Semiconductors—to co-develop next-generation 4M and 16M DRAMs. This collaborative framework, which effectively distributed research costs and technical risks, was further amplified by the “counter-cyclical” investment strategies of Korean firms. By aggressively expanding production capacity and R&D during global market downturns when competitors retreated, Korea not only bridged the technological gap but also secured a dominant and unshakeable position in the international memory market by the early 1990s.
Korea’s leap to global leadership was driven by the landmark success in developing the world’s first 64M DRAM in 1992 and 256M DRAM in 1994. These breakthroughs allowed domestic firms to effectively transition from technology followers to global standard-setters, seizing market hegemony during the mid1990s. Following the development of the world’s first 64M DRAM in 1992, Korea encountered increasing trade frictions and heightened scrutiny from established
incumbents, manifesting in challenges such as frequent antidumping suits and intensified patent litigation aimed at curbing its rapid technological ascent. In response to these external pressures and evolving global trade norms, the Korean government shifted its policy focus from direct industrial funding to fostering a supportive ecosystem through indirect measures. This transition emphasized infrastructure development, specialized human capital training, and tax incentives as well as coordinated public-private efforts to navigate international trade litigations and diplomatic challenges.
4. Capital realignment: Restructuring and consolidation of domestic capital
While aggressive capital mobilization was instrumental in securing global technological leadership, it also exposed Korean firms to significant financial vulnerabilities within the highly volatile memory market. The 1997 Asian Financial Crisis acted as a critical inflection point, necessitating a fundamental restructuring to address systemic risks arising from redundant investments and high debt-to-equity ratios. Immediately following the 1997 Crisis, the state facilitated the “Big Deal” restructuring, which consolidated Hyundai Electronics and LG Semiconductor to form Hynix and minimize redundant investment. Subsequently, during the financial crisis faced by Hynix, a creditor-led restructuring process was implemented, including debt-equity swaps and operational reorganizations. This market-compatible approach laid the foundation for the eventual emergence of SK Hynix, contributing to the long-term resilience and stability of the semiconductor industrial ecosystem.
Following the stabilization of Hynix’s management by the late 2000s, the Korean government initiated a strategic reallocation of its policy resources. As Samsung and Hynix established dominant global positions in the memory sector, the state scaled back direct R&D funding for memory chips, under the view that the industry had achieved sufficient self-sufficiency. Consequently, policy efforts during this period were primarily realigned toward the relatively weaker, nonmemory semiconductor segment.
5. Technology diversification: Expansion and integration of domestic technology
While Korea has secured unparalleled leadership in memory manufacturing, the industry’s structural resilience remained constrained by a heavy reliance on external suppliers for core materials, components, and equipment. This vulnerability was acutely highlighted by Japan’s 2019 export controls, which served as a decisive catalyst for a fundamental reorientation of Korea’s industrial policy. In response, a concerted effort was launched to internalize the value chain, supported by the K-Chips Act’s aggressive tax credits and the Special Account for Materials, Components, and Equipment to ensure stable, long-term funding. Furthermore, the state is designating Semiconductor Specialized Strategic Industry Complexes to co-locate suppliers and manufacturers, creating high-density clusters that trigger collaborative synergies.
As semiconductors emerge as critical assets for national security in the artificial intelligence (AI) era, the Korean government has established a national control tower through the Semiconductor Special Act (January 2026). As the AI era drives a technological evolution where computing and storage are increasingly integrated, the government is prioritizing advancing high-performance nonmemory capabilities to complement and reinforce its long-standing memory dominance. This shift is rooted in the strategic necessity to overcome structural vulnerabilities and establish a self-sustaining supply chain that can withstand global geopolitical volatility. By fostering an integrated industrial ecosystem where suppliers and manufacturers thrive together, Korea aims to transcend its role as a memory specialist to become a comprehensive semiconductor powerhouse leading the AI-driven global economy.
BOX II.8 Semiconductors
BOX II.9 Industrial Policy and Structural Transformation in Malaysia
Overview
Malaysia’s industrial progress was driven by three broad key features: (1) outward-oriented, laborintensive growth anchored in FDI and free industrial zones (FIZs); (2) sustained investment in basic human capital to raise labor productivity, and (3) credible macroeconomic governance to maintain a stable business environment. These features were mutually reinforcing, where free trade zones and licensed manufacturing warehouses provided the industrial platform; an educated and relatively low-cost, English-speaking workforce lowered the cost of doing business for multinational firms; and macroeconomic stability, characterized by persistent current account surpluses, low inflation, and manageable public debt, attracted successive waves of foreign investment. Together, they drove GNI per capita growth of 6.9 percent annually between 1960 and 2017 and helped raise manufacturing’s share of GDP from under 9 percent in 1970 to a peak of about 31 percent in 2000 (figure II.B9.1).
In addition, the government has introduced various fiscal incentives including pioneer status, investment tax allowances, and R&D double deductions to attract strategically targeted sectors; non-tariff barriers and equity restrictions to shelter selected industries (e.g., automotive); and a growing network of intermediary institutions, science parks, and technology parastatals to build indigenous technological capability.
Yet while these instruments delivered impressive industrialization, there have also been challenges. They were insufficiently tied to performance outcomes; left domestic linkages shallow; and produced an economy that lagged its transitional and aspirational peers on productivity growth, innovation, and the share of high-skill employment (World Bank 2021b). Against these challenges, this box examines two illustrative cases: (1) the E&E sector, which highlights current structural constraints on Malaysia’s ability to climb the value chain, and (2) data centers, which reveal the tensions and risks in Malaysia’s next industrial chapter.
FIGURE II.B9.1 Manufacturing’s share of GDP rose from under 9 percent in 1970 to a peak of about 23 percent in 2023.
BOX II.9
Policy and Structural Transformation in Malaysia (continued)
The E&E sector: A “tired” golden goose
Electronics and electrical (E&E) manufacturing has been the backbone of Malaysia’s export economy for over five decades. Seeded in the export-processing zones of Penang and Johor in the early 1970s, the sector grew to dominate Malaysia’s trade share. Malaysian E&E manufacturers led by multinationals collectively contribute roughly 8 percent of global back-end semiconductor output and account for 38 percent of total Malaysian exports (World Bank 2021b). A notable success story in this regard is Penang, which despite representing only about 5 percent of Malaysia’s population accounts for approximately 5 percent of global semiconductor exports and contributes about 7 percent of national GDP, more than double the national GDP per capita average (InvestPenang, 2024). By 2022, semiconductor exports exceeded RM193 billion, representing approximately 56 percent of total E&E exports and 22 percent of all Malaysian exports, with Malaysia ranking among the top five global exporters of semiconductor devices, integrated circuits, and testing equipment (World Bank 2023b).
The sector has benefited from recent geopolitical tailwinds. US-China trade tensions have created significant trade diversion in Malaysia’s favor. For every percentage-point increase in US tariffs on Chinese semiconductor goods, Malaysia’s exports to the United States and to China and other ASEAN countries rose by 1.6, 1.8, and 2.5 percent, respectively (World Bank 2023b). The 2021–22 integrated circuit (IC) export boom recording 29 percent growth was further fueled by pandemic-era chip shortages and robust demand from Chinese, Singaporean, and US customers (World Bank 2023b).
Yet structural challenges remain: Malaysia has remained persistently unable to climb the semiconductor value chain. There has been little headway into front-end wafer fabrication, chip design, or advanced packaging—the segments where the greatest value is captured. Despite holding an 8 percent share of the global IC market, Malaysia contributes only 0.2
percent of advanced semiconductor patents globally, a share that has since declined further to about 0.07 percent and most IC exports serve the consumer-grade market rather than high-performance applications (World Bank 2023b).
The challenges of moving up the value chain could be traced to two structural bottlenecks. First, productivity growth has lagged transitional and aspirational peers, and the gap between Malaysia and high-income comparators appears to be widening, and TFP growth has been persistently weak (World Bank 2021b). Second, investment incentives, while effective at attracting volume foreign direct investment, have not been well calibrated to foster genuine technology transfer or domestic innovation. Over 70 percent of semiconductor-related patents filed in Malaysia had already been approved elsewhere, and more than 80 percent of domestic patent filings are foreign-owned (World Bank 2023b). Malaysia’s R&D intensity within the sector also remains low: The median R&Dto-sales ratio is significantly below that of China and Taiwan, China (figure II.B9.2). For Malaysia to move up the value chain, it has to transition from an incentive-based model that rewards investment volumes to one that places support on performance and innovation outcomes.
As part of the government’s effort to move the E&E sector up the value chain, it recently signed a 10-year agreement in March 2025 with UK chip designer Arm Holdings. The agreement, estimated to be about US$250 million (RM1.11 billion), would provide Malaysian firms with access to seven of Arm’s high-end processor blueprints on a royalty-paid-on-sale basis, alongside training programs targeting 10,000 integrated circuit design engineers and the establishment of Arm’s first ASEAN office in Kuala Lumpur.a The aim is to shift Malaysia’s semiconductor ecosystem from assembly and testing toward IP-driven innovation, with stated ambitions to foster 10 locally anchored chip companies each generating annual revenues of US$1.5–2 billion, contributing to a RM1.2 trillion semiconductor export target by 2030.
BOX II.9 Industrial Policy and Structural Transformation in Malaysia (continued)
FIGURE II.B9.2 Malaysia’s R&D-to-sales ratio is relatively low.
Share of Patents Applied by Residence—RHS (%) R&D / Sales—LHS (%)
Sources: World Bank calculations based on patent statistics from World Intellectual Property Organization and taiwan Intellectual Property Office; Compustat Global, Bursa Malaysia and Singapore Exchange for r&D and sales data.
Note: the bars show the share of granted patents applied by residents in each patent office. the dots compare the median r&D to sales ratio of E&E firms with reported r&D expenditure in China, Malaysia, Singapore, and taiwan, China, from 2018 to 2023. E&E = electronics and electrical; r&D = research and development.
Conclusion
Malaysia’s industrial policy record has been instrumental in building a diversified, export-oriented manufacturing economy within five decades. However, it still trails transitional peers like the Republic of Korea and Taiwan, China, in key dimensions of productivity and innovation. The case studies highlighted illuminate a consistent pattern: Fiscal and infrastructure incentives effectively attract investment, but its impact on generating the domestic technological capability and value-added depth needed to sustain high-income growth are still lagging. The E&E is a sector that remains globally significant in scale but is anchored to low-margin, backend assembly. In data centers, it manifests as a headline
investment boom that is straining physical infrastructure and generating fewer high-quality domestic linkages than the investment quantum might suggest. The New Industrial Master Plan (NIMP) 2030’s ambition to shift toward higher-value industries and more performanceconditional incentives points in the right direction. In addition, the ARM deal, moving from blanket protection toward conditional market access tied to local assembly commitments suggest that policy makers are beginning to shift from volume attraction toward more selective, capability-building conditionality. Success will depend on the political commitment to enforce those conditions and addressing sector-specific challenges.
ahttps://www.bernama.com/en/news.php?id=2460997; https://theedgemalaysia.com/node/747486.
BOX II.10 The Philippines’ Semiconductor Cluster: How It Emerged, Where It Sits in the Value Chain, and What Upgrading Would Take
Position in the value chain
The Philippines’ footprint is concentrated in assembly, testing, and packaging (ATP), with limited presence in front-end fabrication and design-related activities (see value chain in figure II.30). For example, Intel’s Philippines facility was established as an assembly and test plant for microprocessors.
How the cluster emerged
The sector’s establishment is closely linked to multinational investment that began in the 1970s and expanded further as export-processing arrangements scaled up in later decades. Early investment was led by US-based semiconductor firms (including Fairchild, Texas Instruments, and Intel) locating back-end operations. The policy environment that supported this entry combined investment incentives with export-processing “public goods” that reduce operating frictions for trade-intensive manufacturing.
A key institutional mechanism was the export zone framework, particularly Philippine Economic Zone Authority–administered economic zones, which provided a relatively predictable operating environment for export manufacturers. The relevant coordination functions were administrative rather than technological: streamlining and sequencing approvals, facilitating customs processing for imported inputs used in reexports, and providing a consistent interface between firms and government agencies. For back-end manufacturing that operates on tight delivery schedules and complex cross-border input sourcing, these institutional features can be material alongside statutory tax incentives.
Scale, geography, and ownership patterns
Semiconductors and electronics became a major pillar of the Philippine export basket. In 2024, electronic integrated circuits accounted for about US$19.4 billion in exports (roughly one-quarter of goods exports and about 15 percent of total exports). Employment is
spatially concentrated in export-oriented provinces and industrial corridors.
The ownership pattern is consistent with foreign direct investment–led production. Greenfield investment in semiconductors and electronics has varied over time, with major inflows originating from Japan, the Republic of Korea, and the United States, with volatility reflecting global semiconductor cycles.
Trade structure and domestic value added
The Philippines’ semiconductor and electronics exports embody a high share of foreign value added, reflecting reliance on imported intermediate inputs—such as wafers and specialized materials—that are processed using imported advanced equipment and subsequently re-exported. Foreign value-added accounts for roughly half of gross exports in computer and electronics manufacturing, significantly higher than both the manufacturing average and comparator countries (figure II.B10.1).
Consistent with this position in the value chain, domestic value capture is more limited than in locations specialized in chip design or wafer fabrication. Estimates suggest that semiconductor activities account for roughly 1.5 to 2 percent of total value added in the Philippine economy—below levels observed in regional peers such as Malaysia.
Industrial policy instruments today: CREATE, CREATE MORE, and Tatak Pinoy
Recent investment reforms represent a shift toward an activity-based framework, moving away from sector-specific carve-outs. Under CREATE, tax incentives—including income tax holidays and enhanced deductions for R&D and training—are now tied to activity tiers within the Strategic Investment Priorities Plan (SIPP). For semiconductors, the key point is that eligibility and duration are conditioned by
BOX II.10 The Philippines’ Semiconductor Cluster: How It Emerged, Where It Sits in the Value Chain, and What Upgrading Would Take (continued)
FIGURE II.B10.1 Foreign value-added share of gross exports
activities—not by a stand-alone semiconductor carveout. CREATE MORE builds on this by clarifying export VAT treatment and extending incentive periods for high-value projects.
Complementing these fiscal tools, the Tatak Pinoy roadmap provides a strategic layer aimed at industrial upgrading. Crucially, Tatak Pinoy addresses horizontal constraints, skills pipelines, shared testing infrastructure, and coordination across energy, logistics, and investment facilitation, which are vital for semiconductor upgrading and not tackled by investment incentives.
The energy constraint
The increase in the enhanced deductions for power expenses follows a request by industry to alleviate the burden of high energy costs. The implied magnitude scales with electricity intensity: For electricity shares of 5 to 10 percent of total costs, the uplift can be on the order of 1 to 2 percentage points under typical corporate tax rates. For firms competing on thin margins in footloose export manufacturing, this can be material.
At the same time, the competitiveness constraint in power remains structural. A tax-based offset can
improve after-tax margins in the short run, but it does not lower electricity prices, strengthen reliability, or change entry conditions in generation and retail supply. In that sense, it can shift part of the burden from firms to fiscal space, while leaving the underlying determinants of power costs in place and potentially reducing private-sector incentives to press for deeper procompetition reforms.
Yet, this kind of “band-aid” can weaken demand for the deeper reforms that would lower costs of generation, distribution, and transmission, and therefore lead to lower electricity prices. By compensating firms through the tax system, government reduces the visibility and perceived urgency of the underlying problem in a key network sector such as energy (private sector lobby disappears). Over time, the fiscal cost grows while the incentives for firms to push for competition reforms diminish.
A focused competition agenda in electricity remains relevant for tradables competitiveness, including for energy-sensitive export manufacturing. Priority reform directions include (1) expanding retail contestability so more customers can switch suppliers (deepening competitive pressure on generation and supply prices);
BOX II.10 The Philippines’ Semiconductor Cluster: How It Emerged, Where It Sits in the Value Chain, and What Upgrading Would Take (continued)
(2) strengthening regulatory independence and technical capacity so tariff-setting and enforcement are more predictable and credibly procompetition; and (3) reducing barriers to entry and expansion so the market can discipline costs over time.
what upgrading within ATP could look like
Given the current value-chain position, near-term upgrading is most plausibly framed as movement into higher-value back-end activities and adjacent services—for example:
• higher-complexity testing (including reliability and validation functions);
Data and cloud computing
Cloud computing data centers remain scarce in much of EAP, especially those with AI computing capability. The number of new data centers across the region has grown in recent years, with China accounting for the largest share and a few other countries, such as Indonesia and Malaysia, explaining almost all of the remaining increase (figure II.32). Despite this growth, data centers remain scarce across much of EAP, and even China lags behind advanced EAP economies. Comprehensive information on data centers with the GPU chips needed to train AI models specifically is difficult to obtain, but the available evidence points to an even larger divide than for data centers in general. Apart from China, most developing EAP economies lag significantly behind in AI capability (figure II.33).
Data centers can support productivity and development through the downstream economic activity they enable. Being highly capital intensive, they require large up-front investments in land, IT, and
• failure analysis and process engineering services supported by shared testing infrastructure;
• advanced packaging and more engineeringintensive modules where capabilities and supplier ecosystems permit; and
• deeper linkages to design and design-adjacent functions where the skills base can be scaled.
These upgrading routes depend less on tax parameters alone and more on constraints repeatedly cited by firms and analysts: energy cost and reliability, logistics frictions, engineering skills depth, and the availability of specialized suppliers and shared facilities.
electrical systems but also generate some employment in engineering, design, and construction during the build phase (McKinsey 2015). Data centers are crucial not only for processing of the vast data sets required to train AI models but also for processing user data generated by AI applications.
FIGURE II.32 Cloud computing data center expansion is concentrated in a few EAP countries.
Source: Straub et al., 2026.
FIGURE II.33 Cloud computing data centers remain scarce in much of EAP, especially those with AI computing capability.
Data centers
Sources: Data centers on the left-hand side from Straub et al. 2026; AI Data Centers (those with GPU chips) on the right-hand side from Epoch.AI.
Note: Data centers can support productivity and development through the downstream economic activity they enable. Being highly capital-intensive, they require large up-front investments in land, information technology, and electrical systems, but also generate some employment in engineering, design and construction during the build phase (McKinsey 2015). Data centers are crucial not only for processing of the vast datasets required to train AI models, but also for processing user data generated by AI applications. Locating data centers closer to users improves the speed with which data can be shared and processed, which is critical for time-sensitive sectors like fintech and for real-time digital services (AwS 2024). AI = artificial intelligence; GPU = graphics processing unit.
Locating data centers closer to users improves the speed with which data can be shared and processed, which is critical for time-sensitive sectors like fintech and for real-time digital services (AWS 2024).
While financial and energy incentives often dominate the policy toolkit for attracting data center investment, infrastructure quality and administrative efficiency can be binding constraints. Data centers are large, capital-intensive investments for which time to market is a critical determinant of returns: Construction itself can typically be completed in under 2 years, but obtaining the grid connections and permits needed to begin construction can take considerably longer, creating bottlenecks that can deter investment before it starts (Epoch AI 2025; US Chamber of Commerce 2016). These delays reflect both insufficient investment in power generation, transmission, fiber optic infrastructure, and land availability and the challenges of coordinating across multiple government agencies with overlapping responsibilities. Malaysia’s Green Lane Pathway illustrates what is possible when these coordination failures are addressed. By establishing a One-Stop-Centre and fast-tracking grid connections, Malaysia reduced the time from application to data center operation from 36–48 months to just 12 months (box II.11). Malaysia’s data center boom is partly due to the Singapore moratorium on new data centers (introduced due to environmental and energy consumption concerns), and reliable power remains a constraint for new data centers in other EAP countries, such as Viet Nam, as does the lack of access to adequate financing (particularly in a context of elevated global uncertainty).
BOX II.11 New Frontiers: Data Centers in Malaysia
The New Industrial Master Plan (NIMP) 2030 has identified the digital economy, anchored on data centers, as a key engine of Malaysia’s next industrial phase.
Malaysia’s data center boom represents one of the most dramatic investment stories in the region. Between 2021 and 2024, the country attracted approximately RM184.7 billion in data center-related investment commitments, with US$23.3 billion from major cloud service providers (hyperscalers) in the first 10 months of 2024 alone (Malaysian Investment Development Authority [MIDA] 2025). Google, Amazon, Microsoft, and ByteDance all have established or committed to major facilities, with the southern state of Johor benefiting from Singapore’s temporary moratorium on new data center construction (2019–22), capturing roughly 60 percent of national capacity. The investment surge reflects a combination of structural locational advantages and deliberate policy incentives, with the former being the more important driver. Malaysia’s larger land area relative to Singapore offers lower-cost industrial land with flexible freehold and leasehold options; connectivity to 25 international submarine cables enables efficient regional reach; and construction costs are competitive relative to other Asia-Pacific markets (Malaysian Investment Development Authority 2024b). Southeast Asia’s data center capacity is projected to grow by over 300 percent between early 2024 and 2028. Given Singapore’s land and power constraints, Malaysia is seen as the natural alternative (Mordor Intelligence 2024). On the policy side, the Malaysia Digital Status framework and the Digital Ecosystem Acceleration Scheme (DESAC), administered by MIDA, provide investment tax allowances of up to 100 percent on qualifying capital expenditure offsettable against statutory income for up to 10 years. Critically, a Green Lane Pathway was introduced to shorten electricity connection timelines from 36 to 48 months to 12 months. The Johor-Singapore Special Economic Zone, launched in 2024, adds further layers of preferential tax treatment and cross-border process streamlining. Without the structural locational
advantages, however, incentives alone would not have produced investment at this scale (Fourteau 2025).
However, the pace of expansion is straining physical infrastructure, which raises questions about sustainability, and quality of investment. On electricity, the 38 data center projects holding Electricity Supply Agreements as of December 2024 carry a combined contracted maximum demand of 5.9 GW (Tenaga Nasional Berhad 2025). Projections suggest data center electricity demand could reach 12.9 GW by 2030, roughly 60 percent of Peninsular Malaysia’s current peak load. On water, data center facilities in Johor, Negeri Sembilan, and Selangor collectively require an estimated 808 million liters per day against current supply infrastructure capable of 142 million liters. As of early 2025, only 17 of Johor’s data centers had received water supply approval from the regulator (Earth Journalism Network 2025). Following these concerns, the government has begun to recalibrate. From July 2025, Malaysia introduced data center–specific power tariffs where facilities exceeding 100 MW are classified under an ultra-high voltage category, adding an estimated US$15 million to US$20 million per year in energy costs per facility (Data Center Dynamics 2025). The Ministry of Investment, Trade and Industry has also introduced sustainability guidelines requiring energy, water, and carbon efficiency standards as prerequisites for DESAC incentives, with a Sustainable Data Centre Framework certification regime expected by late 2025. The gap between committed investment and available infrastructure capacity suggests that there will be a period of constraint-driven slowdown in approvals before the sector can likely resume unconstrained growth.
A related concern is the limited extent of domestic economic spillovers relative to the scale of investment. Data centers create relatively few direct jobs per ringgit invested—the 40,000 jobs attributed to the entire boom are modest against investment quantum (Rest of World 2024). Estimates show that approximately RM4.6 million investment was required per job created. As a comparison, the E&E sector and the
BOX II.11
New Frontiers: Data Centers in Malaysia (continued)
automotive industry’s investment per job is approximately below RM1 million, underscoring the limited employment spillover relative to the scale of capital committed. Beyond jobs, the main economic value of data centers lies in the digital services they enable, such as cloud computing, e-commerce, and fintech, rather than in building local industries or transferring skills to Malaysian firms. The productivity gains from cloud adoption depend on whether domestic enterprises, institutions, and government agencies can leverage the infrastructure effectively—whether Malaysia is doing enough to capture downstream value through local cloud adoption, digital economy development, and domestic supply chain linkages.
Conclusion
Malaysia’s industrial policy record has been instrumental in building a diversified, export-oriented manufacturing economy within five decades. However, it still trails transitional peers like the Republic of Korea and Taiwan, China, in key dimensions of productivity and innovation. In data centers, it manifests as a headline investment boom that is straining physical infrastructure and generating fewer high-quality domestic linkages than the investment quantum might suggest. The NIMP 2030’s ambition to shift toward higher-value industries and more performance-conditional incentives points in the right direction.
create high barriers to entry for most countries. Estimates suggest that research and development is the biggest cost of developing frontier LLMs (e.g., GPT4 or Gemini), reflecting 29–49 percent of total costs (Epoch AI 2024). For EAP economies outside China, the limited coverage of regional languages in AI models provides an additional motivation to develop sovereign AI capabilities, although the costs of doing so can be substantial (box II.12).
AI models
The development of LLMs is highly concentrated in China and the United States (figure II.34). The United States accounts for the largest share of frontier models, with China a distant second; other economies, including those in EAP, have developed very few models of global significance. This concentration reflects the enormous resource requirements for LLM development, including advanced chips; large-scale computing infrastructure; vast training data sets; and highly specialized researchers, which
The rise of Chinese open-source AI can offer significant spillover benefits to other developing economies. While the development of open source reflects China’s long-term pivot toward technological self-reliance, a priority formalized in the 14th Five-Year Plan (2021–25), this has generated positive international spillovers. Globally, downloads of Chinese open-source models surpassed those of US models by 2025, with usage particularly concentrated in other developing economies (figure II.35). The diffusion has been driven by two factors: technical suitability and efficiency. First, while US models like Meta’s Llama are optimized primarily for English and European languages, Chinese models such as Qwen are often trained on local languages, such as Javanese, Khmer, and Malay. Second, recent releases like DeepSeek introduced substantial software efficiency improvements that make them faster and more cost-effective to deploy (Epoch AI 2024).
FIGURE II.34 AI models (LLMs) are
FIGURE II.35 Chinese open-source AI models are widely used in other developing countries.
AI applications
Developing products or services that use AI (“AI applications”) is similarly concentrated in advanced economies (figure II.36). In previous information and communication technology waves, most productivity gains are based on how technology is used rather than building the underlying hardware. Since AI is a general-purpose technology, the range of potential applications is huge. Furthermore, the barriers to entry in AI applications (such as data and skills), although high, are much lower than in developing AI models. Although contributions to AI projects on GitHub show that development of AI software is advancing rapidly, this activity is highly concentrated in advanced economies, such as Korea and the United States. In contrast, AI software in developing EAP economies remains at low levels of activity. Unfortunately, GitHub data are not available for China. Another proxy of AI application development, venture capital investments in AI startups, suggests that over the period 2021 to 2025, Chinese AI application investments per capita were about 20 times larger than other developing EAP economies, but a third of the level of Korea and a tenth of the United States per capita (OECD.AI 2026).
Policies in EAP countries are mostly focused on earlier stages of the AI value chain rather than AI applications. China and Korea have introduced
Note:
policies to subsidize the costs of data processing or accessing AI models. In China, the subsidy levels vary by province; for instance, Shanghai covers up to 50 percent of cloud computing costs and 60 percent for startups, whereas Beijing allows deductions of up to 40 percent (South China Morning Post 2024). In 2019, Korea launched a similar voucher scheme for small and medium enterprises that subsidized both the data purchase costs and computing costs (World Bank 2024c). Several countries have policies related to open government data, which has the potential to spur AI application development, although implementation has typically been limited. While 60 percent of EAP countries have an open data portal, there are maintenance challenges, with 24 percent of open data portals experiencing a decrease in functionality since 2022 (World Bank 2025e).
Access to government data is a form of industrial policy that can spur development of downstream AI applications. Public data can help private industry better manage their operations and develop new products and services (World Bank 2021a). For instance, Chinese AI firms awarded government procurement contracts that included access
FIGURE II.36 Development of AI software is mostly in advanced economies.
Source: OECD.AI 2026, using data from GitHub.
Reflects the number of AI software projects (specifically AI-related GitHub “repositories”) as a fractional count based on the share of contributions (specifically “commits”) by country and over time. Github data not available for China. AI = artificial intelligence.
BOX II.12 Should EAP countries develop their own AI models? And if so, how?
Several EAP countries are already investing in developing their own “sovereign AI” models, with Indonesia’s Sahabat-AI and Thailand’s ThaiLLM being prominent examples. The motivations include the more limited coverage of regional languages in global AI models and concerns about digital independence and developing an AI ecosystem. Model developers prioritize languages with more and higher quality online data, which is a challenge for many of the region’s languages. For instance, English accounts for 45 percent of websites and 56 percent of open-source AI training data sets, despite being spoken by only 19 percent of the global population (World Bank 2025c). For many EAP languages, online data are particularly scarce, as shown in figure II.B12.1. Furthermore, reliance on foreign models can raise concerns about control over sensitive data and exposure to service disruptions.
The economic case for developing domestic AI capabilities can be appealing. First, even recent global AI models typically perform poorly in minority regional languages. For instance, ChatGPT 4 correctly translated Indonesian idioms to English only about half the time (Leong et al. 2023). Language specialization can outperform global models locally. Second,
“winner-takes-most” dynamics mean that those who manage to produce a high-quality AI model can rapidly achieve market share. Third, a successful local AI model could spur further downstream AI applications and use.
However, the costs of developing frontier large language models (LLMs) from scratch are prohibitive for most EAP economies. Training a competitive LLM requires massive investments in high-end chips, energy, research and development, and specialized skills as well as access to large, high-quality training data sets—resources that are scarce across much of the region. For instance, high-income countries currently host 97 percent of the world’s high-performance computing capacity required to develop frontier models (World Bank 2025c).
Fortunately, developing a sovereign AI model does not require building a frontier LLM from scratch. Opensource foundation models can be fine-tuned for local languages and contexts at a fraction of the cost of training a new model. Models such as China’s DeepSeek and Meta’s Llama, which make their underlying model weights publicly accessible, allow developers to adapt and build on them without high licensing costs.
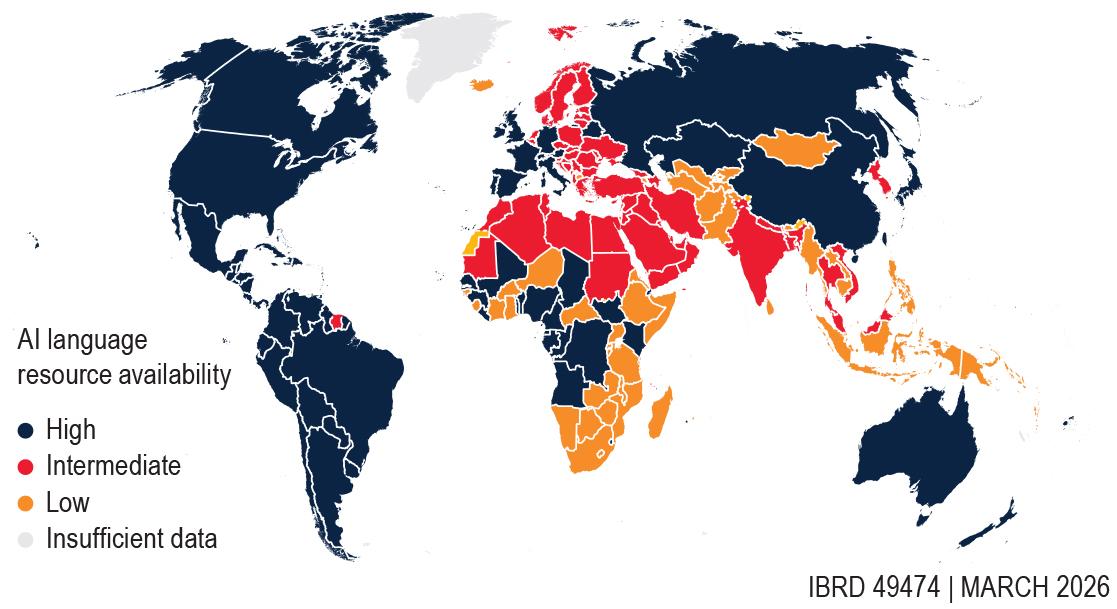
Source: Misra et al. 2025. Note: AI language resource availability is determined using Fineweb2 multilingual AI training data, comprising 5 billion documents in more than 1,000 languages, which was built from 96 snapshots of the internet from 2013 to 2024. AI = artificial intelligence; EAP = East Asia and Pacific.
FIGURE II.B12.1 Some EAP languages are poorly covered in online data that are used to train AI models.
BOX II.12 Should EAP countries develop their own AI models? And if so, how? (continued)
Open-source models are fast converging to the frontier, and the performance of the open-source Chinese model DeepSeek is within 2 percent of the best proprietary (US) model (Stanford AI Index 2025).
For specific-use cases, the performance of small language models (SLMs) is converging to their larger LLM cousins and have much lower requirements for chips, energy, R&D, and training data. Frontier LLMs contain hundreds of billions of parameters that need to be trained on huge data sets housed in hyperscale data centers. SLMs, containing a few million or billion parameters, can run on personal computers and even function offline. SLM models are becoming more efficient, with estimates suggesting that the best current SLMs have similar performance to LLMs from only 1 year ago (Epoch AI 2026). SLMs are not general-purpose systems, but can work well for specific, well-defined tasks, such as providing agronomic advice in local dialects, supporting health workers with patient triage, or delivering personalized education content (World Bank 2025c). As with technology
to large-scale data sets (such as video or image archives) increased their commercial software development by roughly 20 percent in the 3 years following the contract award (figure II.37). Since data are nonrival—its use by one firm does not deplete it for others—opening administrative data can generate large economic multipliers. For instance, Denmark’s open access data set of addresses generated direct economic benefits of €62 million between 2005 and 2009, far exceeding the €2 million cost of provision (World Bank 2021a).
Upstream restrictions can inadvertently spur downstream innovation to circumvent them. Stricter privacy regulations like the EU’s GDPR have been shown to incentivize “data-saving” innovation, pushing firms to develop algorithms that achieve comparable performance with smaller, more privacy-preserving data sets (Frey et al. 2024). Export controls on advanced semiconductors
adaptation in general, one challenge is often in identifying practical use cases.
But even developing successful open-source or small models requires a sufficient volume of high-quality local data. A recent World Bank (2025c) report identifies three hurdles: quantity (local data sets are often too small), quality (local data sets are often incomplete or fragmented), and diversity (data that do not reflect local context). For example, in figure II.B12.1 Indonesia is classified as having low local-language data availability online, despite 200 million internet users as of 2025 (World Development Indicators). Indonesians spend, on average, 6 hours per day online, but more than half of that time is communicating or using social media, which generates private and informal language data that are not well suited to AI model training (World Bank 2021c). This is further complicated by the fact that in Indonesia more than 700 languages and dialects are spoken, further diluting potential training data. In contrast, digitized books or technical material are much better suited to AI model training.
FIGURE II.37 Public procurement contracts with access to government data led to Chinese firms developing new commercial software.
Half-years since contract award
Source: Beraja et al. 2023. Note:
have incentivized Chinese firms to develop more efficient AI models, such as DeepSeek’s Mixtureof-Experts architecture, to overcome hardware constraints. Chinese restrictions on rare earth exports in 2010 led to a surge of downstream innovation to reduce rare earth usage in products such as magnets or motors (figure II.38).
FIGURE II.38 Chinese restrictions on rare earth exports from 2010–15 led to increased innovation in downstream sectors that relied on them.
AI use
Measuring AI use across countries is challenging because there are many different AI applications, which are used with differing intensities and with varying availability across countries. For instance, while as of January 2026 ChatGPT is the most widely used AI chatbot globally, whereas access is restricted in China. Figure II.39 reflects the share of a country’s working-age population using AI tools for at least 90 minutes per month. Unfortunately, we do not have information on whether these AI tools are used productively for work or for leisure. The metric is based on Microsoft data that tracks visits to AI sites, including ChatGPT, Claude, DeepSeek, Microsoft Copilot, and Xiaowei (Microsoft 2026). Microsoft Windows operating system is the dominant market provider in China and most countries globally, and the data are adjusted for desktop and mobile usage patterns, supporting the comparability of this measure across EAP.
Source: alfaro et al. 2025.
II.39 AI use is uneven across EAP.
Source: Microsoft 2026.
Note: aI users as a proportion of a country’s working-age population (ages 15–64), where aI use reflects the number of users spending at least 90 minutes per month visiting 19 aI sites. Derived from anonymized Microsoft telemetry data from users with Windows (PC/tablet) desktops, and is adjusted for device penetration and mobile usage patterns (Misra et al. 2026; Microsoft 2025. aI = artificial intelligence; EaP = East asia and Pacific.
Despite the rapid global expansion of AI tools, AI use remains uneven across EAP (figure II.39). While most of developed East Asia reports well over 20 percent of workers using AI for more than 90 minutes per month, AI use is much lower across much of developing EAP. Some emerging economies in the region are using AI relatively intensively, with about one-fifth of workers in Malaysia and Viet Nam doing so, exceeding average use in China and Japan. However, use in Cambodia, Lao PDR, and Pacific Island countries remains below 10 percent of workers. Alternative data that track website traffic to GenAI websites similarly shows Malaysia, the Philippines, and Viet Nam as the most intensive users per capita in developing EAP and with a similar intensity to Japan (Liu et al. 2025). Unfortunately, because of the use of VPNs, this alternative traffic data does not reliably capture AI diffusion in China.
II.5 What needs to be done
To conclude, we bring together our main findings and cast them in our three-pillars framework.
FIGURE
Pillar 1: Basic human capital, infrastructure, and institutions
Investment in human capital, infrastructure, and effective institutions generates benefits for all firms and sectors. Viet Nam’s transformation from an agrarian, centrally planned economy to Asia’s most trade-intensive economy was driven primarily by these economywide reforms, not by sector picking (box II.13). The same is true for the development trajectories of many EAP countries: from China to the Philippines, from Malaysia to Thailand. Other developing EAP countries are still falling behind their most dynamic peers. The benefits-to-costs ratio for investments in infrastructure and human capital are found to be high for many EAP countries (figure II.40).
Pillar 2: Address policy failures by liberating services, eliminating nontariff barriers, and providing the right business environment, including for the digital economy
FIGURE II.40 The benefits of further investments in energy and transport exceed their costs in almost all EAP countries.
Source: Straub et al. 2026.
Note: Benefit cost ratio, termed infrastructure efficiency ratio in the report, denotes the social rates of return to investment divided by the country-specific borrowing costs and country-sector-specific depreciation. An efficiency ratio above 1 indicates additional investments are warranted, as it passes a basic benefit cost threshold. EAP = East Asia and Pacific.
In many EAP countries, including China, Indonesia, Malaysia, and Thailand, the pervasive use of restrictions in services, the persistence of non-tariff barriers, and burdensome licensing limit competition and slow development. Figure II.41 reports the recently computed scores for regulatory frameworks from the Business Ready (B-Ready) publication by the World Bank. For the countries for which scores are available, some EAP countries perform on par or even better than expected by their development level; however, there are several examples of underperformance, especially in the Pacific. The benefits of opening up to trade and investment in goods have been amply demonstrated in the region; the benefits of even partial liberalization of services are evident in countries like China and Viet Nam. In some countries, de jure reforms (such as the 2023 amendment to the PSA in the Philippines) need to be implemented to produce tangible benefits. SOEs account for a large share of activity in some EAP countries in key sectors (such as banking), which can limit competition and misallocate resources (World Bank 2023c). This, in turn, could potentially result in the underprovision of finance, including for companies operating in the AI supply chain. Spurring productivity growth and avoiding the middle-income trap requires action across these pillars to give firms the right incentives (by strengthening competition) and the capabilities (through better skills and infrastructure) to invest in innovation (De Nicola et al. 2025).
FIGURE II.41 The regulatory frameworks Business-Ready scores are well below the levels expected at their level of development for many small EAP countries, especially in the Pacific.
B-Ready regulatory framework score
Per-capita GDP, 2024 (log) G-20 EAP Other EMDE
Source: world Bank calculations based on Business-Ready database, available https://www.worldbank. org/en/businessready, and wDI.
Note: B-Ready = business ready. EAP = East Asia and Pacific; EMDE = emerging market and developing economies.
Pillar 3: Targeted interventions can complement—but not substitute for— the enabling framework created by pillars 1 and 2
While it is difficult to establish the efficiency of industrial policy, strengthening the first two foundational pillars not only is efficient but might also improve the effectiveness of targeted support. For example, aspects of industrial policy in China and Viet Nam, such as tax exemptions for investors, were implemented in a strong institutional and infrastructural context, alongside significant liberalization on the altar of World Trade Organization (WTO) accession. In contrast, industrial policy in Indonesia, in the form of export restrictions, is being implemented when complementary public goods are not well developed and barriers to trade in goods and services persist, which limits access to key complementary inputs. Countries in the region have made very uneven progress toward addressing these pillars and developing domestic capabilities, as summarized in annex figure II.A1. In general, allocating support to firms operating in more competitive sectors has been shown to spur greater increases in productivity (Aghion et al. 2015). In addition, the effectiveness of new export promotion policies in Korea depended crucially on the quality of public institutions as reflected in the ability of the bureaucrats (figure II.42).
II.42 Export promotion policies are more effective when implemented by more able bureaucrats.
Proactive sector-specific industrial policy is more likely to be effective where fundamentals are sound and major policy failures have been addressed. However, achieving such conditions nationwide is unlikely in the near term, so countries can use special economic zones (SEZs) to prioritize reforms. SEZs are demarcated areas within a country where business rules are generally more liberal than elsewhere. They typically offer investors better infrastructure; a streamlined regulatory and administrative regime (including improved customs); and a fiscal regime with reduced corporate income tax, value added tax, and other taxes and labor contributions, sometimes complemented by training or other subsidies (World Bank 2020). Although evidence on their impact is mixed, several EAP countries have clear success stories where SEZs are well-governed, engage the private sector, and form strong linkages with the rest of the domestic economy (World Bank 2024f). Recent SEZs have also moved beyond the traditional focus on manufacturing, as illustrated by the Johor–Singapore SEZ, which combines cross-border trade and migration facilitation, streamlined regulations, digital infrastructure, and fiscal incentives to attract investment in AI and data centers, as well as high-tech manufacturing.
The AI value chain also illustrates how the three pillars of industrial policy should work in tandem. Foundational horizontal policies are critical: Without investments in high-speed digital infrastructure, energy, and a skilled workforce, participation will remain limited. Second, removing distortions is essential to reducing the cost of key inputs, such as opening access to public data and cross-border data. Finally, targeted interventions need to be carefully considered and seen as complements rather than substitutes for the first two pillars. While several countries are introducing financial and energy incentives to attract data centers, infrastructure quality and administrative efficiency can remain binding constraints.
How to do industrial policy
While this special focus provides a policy framework, it does not examine how to do industrial
FIGURE
Source: Barteska and Lee 2025.
policy from a practical standpoint. Moorty and Varela (2025) provide a practical framework for policymakers to consider. Industrial Policy for Development: Approaches in the 21st Century (Fernandes and Reed 2026) show that implementation requires careful instrument design. Targeting specific sectors or firms may be justified when they catalyze transformative investments (as Samsung did in Viet Nam or Arm Holdings in Malaysia), but they also carry risks of fiscal cost, rent-seeking, and potentially excessive concentration; they must therefore be transparently implemented, include
sunset clauses, transparent reporting, and strict performance benchmarks. Policy makers should prioritize instruments that closely target market failures, ensuring that support fosters competition and local spillovers rather than entrenching incumbents. Moreover, country contexts, such as government capacity, fiscal space, and market size also shape which instruments are more feasible. Policy makers interested in drawing concrete policy insights into the practical implementation of industrial policies will find Fernandes and Reed (2026) an essential reference.
BOX II.13 Industrial Policy in Viet Nam: What Worked and Why. Viet Nam’s Industrial policy mix and scale
Since launching Đổi Mới (economic renovation) in 1986, Viet Nam has deployed a broad and evolving set of industrial policy instruments. These can be grouped into five main categories:
1. Foreign direct investment (FDI) promotion through tax holidays, preferential corporate income tax rates, and import duty exemptions; Viet Nam’s FDI net inflows reached 4.2 percent of GDP in 2024—far exceeding the levels recorded by Thailand (1.5 percent), India (1.6 percent), Indonesia (1.6 percent), and China (0.8 percent). Over the period 2015 to 2023, Viet Nam averaged 4.8 percent of GDP in FDI inflows (OECD 2025b). FDI has been the dominant channel through which Viet Nam’s industrial policy operates: Foreign-invested enterprises produced 73 percent of the country’s exports in 2023 and accounted for 15 percent of total investment over the past decade. Trade openness—the sum of imports and exports—rose from 19 percent of GDP in 1988 to 184 percent in 2022, making Viet Nam the most trade-dependent economy in Asia after Singapore.
2. Industrial parks and economic zonesa offering streamlined administration and infrastructure, with currently 478 established parks hosting 23,000 enterprises and 4.16 million workers (8 percent of the total labor force). The country’s zone network is significantly more extensive relative to GDP than those of Indonesia (approximately 115 industrial estates) or Thailand (74 industrial estates under IEAT), although it remains far smaller than China’s vast system of over 2,500 development zones.
3. Trade liberalization, including WTO accession (2007) and 17 active free trade agreements covering over 60 partner countries and nearly 90 percent of world GDP.
4. Directed credit and land subsidies, particularly for projects in priority sectors or lagging regions.
5. Firm- or project-specific incentives—most prominently with Samsung, Viet Nam’s largest foreign investor (accounting for about 14 percent of the country’s total exports in 2024).
A note on measurement: Lack of transparency makes total quantification of industrial policy instruments difficult. Viet Nam does not publish a comprehensive tax expenditure statement, and the OECD’s 2025 Economic Survey notes that reducing corporate and personal income tax expenditures alone could raise revenues by roughly 1 percent of GDP—implying that existing investment incentives forgo at least that amount annually. For comparison, in section II.4 we estimated that China’s combined industrial policy cost—including cash subsidies and tax benefits— reaches approximately 2 to 2.2 percent of value added for the years 2008–16. No equivalent bottom-up estimate exists for Viet Nam.
1. What worked—and why
Viet Nam’s industrial policy operated on two levels simultaneously, and disentangling their effects is central to understanding what drove results.
Broad enabling policies
The most growth-enhancing policies were broadly applicable and nondiscriminatory. First, trade liberalization dramatically reduced barriers: Applied tariffs on manufactured goods fell from 16.6 percent to 1.1 percent following free trade agreement implementation (OECD 2025b). WTO accession in 2007 coincided with a surge in FDI and a structural shift in exports from agriculture and textiles toward electronics and machinery, which now account for nearly half of export value. This was an economywide reform, not a sector-specific intervention.
Second, macroeconomic stability provided a credible foundation. After a period of double-digit inflation in the early 2010s, Viet Nam brought inflation down to an average of 3 to 4 percent, maintained public debt well below the 60 percent of GDP ceiling, and maintained a managed-floating exchange rate system.
BOX II.13 Industrial Policy in Viet Nam: What Worked and Why. (continued)
Macroeconomic stability has been a critical component to ensure stable FDI inflows and the development of the country’s industrial production.
Third, the industrial parks program offered broadly accessible infrastructure. These parks were not targeted at a single sector, hosting garment producers alongside electronics assemblers alongside food processors. The parks lowered transaction costs for diverse industries by providing reliable utilities, streamlined administrative procedures, and proximity to transport links (Nguyen et al. 2017; Zeng 2016). The development of industrial parks supported Viet Nam’s integration into global value chains in apparel and electronics and increased economic activity in surrounding areas, although the evidence also suggests that a smaller number of better-resourced zones might have been more effective (McCaig et al. 2025; Tafese et al. 2025).
2. Firm-specific concessions: The Samsung case
At the same time, Viet Nam engaged in targeted, firm-specific negotiations—most visibly with Samsung. Since establishing its first factory in Bắc Ninh province in 2008, Samsung has grown to become Viet Nam’s largest single source of FDI (US$23.2 billion in cumulative registered capital by end-2024) and its largest exporter, accounting for roughly 14 percent of total exports in 2024. Samsung’s investments in Viet Nam include six major production facilities employing about 87,000 workers, plus a substantial footprint in vocational training, digital literacy, and supplier development (Sheldon and Kwon 2023).
The government provided Samsung with favorable terms in many forms: tax holidays, preferential land
access, and—critically—influence over the sectoral composition of the industrial parks where it invested. Unlike in China, where densely clustered electronics parks generated severe skill shortages and labor poaching, Samsung in Viet Nam was able to shape parks toward sectoral diversity, reducing labor market competition and enabling large-scale workforce training (Sheldon and Kwon 2023).
Firm-specific deals did not operate in a vacuum and succeeded when they were embedded within a sound enabling policy framework. Samsung’s success in Viet Nam depended on the same broad enabling conditions: trade openness that allowed dutyfree import of components and re-export of finished goods; macroeconomic stability that gave confidence for multibillion-dollar, long-horizon investments; a young, low-cost workforce; and the industrial parks infrastructure.
Firm-specific incentives carry real costs. Domestic value-added in electronics exports remains low: Foreign firms import most components and capture the bulk of the margin, while local supplier linkages are still nascent. Samsung produces 40 percent of its mobile phones in Viet Nam, but only 28 of its 198 major Tier-1 suppliers are based in the country despite significant efforts to increase domestic participation (the number of Vietnamese vendors in Samsung’s wider ecosystem has reached 306). Export concentration in a single firm creates macroeconomic vulnerability. The fiscal cost of investment incentives is opaque, but the OECD estimates foregone revenue of at least 1 percent of GDP. Skills gaps persist despite private-sector VET initiatives, and government spending on education fell from 4.9 percent of GDP in 2008 to 2.9 percent in 2021 (OECD 2025b).
aStandard Industrial Parks (Khu Công Nghiệp [KCN]) are the most common type, with 421 parks nationwide providing streamlined administrative procedures and standard incentives. The remaining 57 parks are located within Economic Zones (Khu Kinh Tế [KKT])—larger multi-function zones combining industrial, commercial, residential, and port/border trade functions, with more generous incentives than standard KCN.
Annex
Cross-countryAnalysis
The subsidy information is drawn from the CSIGTA database, which provides a global inventory of subsidy initiatives implemented since 2008 across a large set of jurisdictions. The database covers 31,116 subsidy programs across 148 customs territories. Subsidy measures are defined as public interventions involving a commitment of government resources that confer an advantage to firms, potentially in a selective manner. Measures are included only if they are economically meaningful, typically requiring a minimum intervention threshold (generally above US$10 million, with exceptions for programs targeting small and medium enterprises). The database excludes welfare transfers to individuals, transfers to other levels of government, subnational/regional interventions, and firm-specific rescue measures. Each recorded subsidy is supported by official documentation and cross-validated using multiple credible sources. For each subsidy program, the CSI-GTA provides information on the implementing authority, implementation and removal dates, a textual description of the measure, and
the list of economic sectors affected. Subsidies are classified at the sector level using the Central Product Classification (CPC) 2.1, and the analysis focuses on manufacturing industries defined at the 3-digit level.
Firm-level information is obtained from Orbis, which provides harmonized financial accounts and firm characteristics for a large international sample of companies. For the manufacturing sector, Orbis contains more than 1.7 million firmyear observations over the period considered. The database provides balance sheet variables and firm demographics, including sector of activity, country of location, total revenues, number of employees, capital assets, and intermediate inputs. These data are used both to measure input choices and to estimate productivity outcomes. Firm performance is primarily captured through total factor productivity, computed by estimating withinsector production functions using standard econometric methods that control for simultaneity and unobserved productivity shocks. The productivity measure is revenue based, implying that it may reflect both physical efficiency and demand-side conditions.


FIGURE IIA.1 Uneven progress toward developing domestic capability
The CSI-GTA subsidy measures are merged with Orbis firm-level observations at the countrysector-year level. This requires concordance procedures to harmonize sector classifications across the two sources, mapping CPC 2.1 codes (used in CSI-GTA) to ISIC Rev.4 and then to NACE Rev.2.1 (used in Orbis). The final matched data set covers the period 2012 to 2019, selected to avoid distortions related to the global financial crisis and the exceptional policy environment during the COVID-19 pandemic. The final data set includes 88 countries, 111 manufacturing sectors (3-digit), and 20,060 country-sector-year cells, for a total of 1,170,672 firm-level observations after excluding firms with less than 10 employees and countries with less than 50 firmlevel observations.
Subsidy exposure is defined at the country-sectoryear level based on whether at least one subsidy measure is active in a given year. In the final data set, approximately 46.9 percent of country-sectoryear observations are treated by an active subsidy measure, corresponding to about 64.7 percent of firm-level observations. Importantly, the data set captures both the extensive margin of subsidy activity (whether a subsidy is present) and heterogeneity in policy design.
References
Abarcar, P., & Theoharides, C. (2024). Medical worker migration and origin-country human capital: Evidence from U.S. visa policy. Review of Economics and Statistics, 106 (1): 20–35.
Acemoglu, D. (2024). The simple macroeconomics of AI. Economic Policy, 40 (121): 13–58. https:// doi.org/10.1093/epolic/eiae042.
Acemoglu, D., Johnson, S., & Robinson, J. A. (2001). The colonial origins of comparative development: An empirical investigation. American Economic Review, 91 (5): 1369–1401.
Afkar, R., Beteille, T., Breeding, M., Linden, T., Pfutze, T., Sondergaard, L., & Yarrow, N. (2023). Fixing the foundation: Teachers and basic education
in East Asia and Pacific. World Bank. https://doi. org/10.1596/978-1-4648-1919-3.
Aghion, P., & Bunel, S. (2024). AI and growth: Where do we stand? Manuscript, EmergingTech Economic Research Network, Federal Reserve Bank of San Francisco.
Aghion, P., Cai, J., Dewatripont, M., Du, L., Harrison, A., & Legros, P. (2015). Industrial policy and competition. American Economic Journal: Macroeconomics, 7 (4): 1–32. https://doi. org/10.1257/mac.20120103.
Alesina, A. F., Furceri, D., Ostry, J. D., Papageorgiou, C., & Quinn, D. P. (2020). Structural reforms and elections: Evidence from a world-wide new dataset (NBER Working Paper No. 26720). National Bureau of Economic Research.
Alfaro, L., Fadinger, H., Schymik, J., & Virananda, G. (2025). Trade and industrial policy in supply chains: Directed technological change in rare earths (NBER Working Paper No. 33877). National Bureau of Economic Research.
Arnon, A. (2025). The projected impact of generative AI on future productivity growth (PWBM Brief). Penn Wharton Budget Model, University of Pennsylvania.
Aschauer, D. A. (1989). Is public expenditure productive? Journal of Monetary Economics, 23 (2): 177–200.
Amazon Web Services. (2024). AWS global infrastructure. Amazon Web Services. https://aws.amazon.com/about-aws/global-infrastructure/.
Baily, M. N., Brynjolfsson, E., & Korinek, A. (2023). Machines of mind: The case for an AI-powered productivity boom. Brookings Institution.
Bales, S., Đào, L. H., Nguyễn, T. T. D., & Trần, T. H. (2022). Potentially preventable hospitalizations in Vietnam: Analysis Using Health Insurance Claims Data (English). Health, Nutrition, and Population (HNP) Discussion Paper Washington, D.C. : World Bank Group. http://documents.worldbank. org/curated/en/099447403132330753.
Bank for International Settlements. (2025). Housing wealth effects in China (BIS Working Papers No. 1319). https://www.bis.org/publ/work1319.pdf.
Bartelme, D., Costinot, A., Donaldson, D., & Rodríguez-Clare, A. (2025). The textbook case for industrial policy: Theory meets data. Journal of Political Economy, 133 (5): 1527–1573.
Barteska, P., & Lee, J. E. (2025). Personnel is policy (implementation): Bureaucrats and the Korean export miracle. CEP Discussion Paper No. 2099. London: Centre for Economic Performance, London School of Economics. https://cep.lse.ac.uk/pubs/download/ dp2099.pdf.
Barwick, P. J., Kalouptsidi, M., & Zahur, N. B. (2024). Industrial policy: Lessons from shipbuilding. Journal of Economic Perspectives, 38 (4): 55–80.
Barwick, P. J., Kalouptsidi, M., & Zahur, N. B. (2025). Industrial policy implementation: Empirical evidence from China’s shipbuilding industry. Review of Economic Studies, 92 (6): 3611–3648.
Beraja, M., Yang, D. Y., & Yuchtman, N. (2023). Data-intensive innovation and the state: Evidence from AI firms in China. Review of Economic Studies, 90 (4): 1701–1723. https://doi.org/10.1093/restud/ rdac056.
Bergeaud, A. (2024). The past, present and future of European productivity [Paper presentation]. ECB Forum on Central Banking, Sintra, Portugal.
Bernama. (2025, August 26). Malaysia-ARM collaboration expected to deliver return on investment within 10 years. https://www.bernama.com/en/ news.php?id=2460997.
Betts, C. M., & Cao, Y. (2025). How does state ownership affect firm innovation? Evidence from Chinese manufacturing firms. The World Bank Economic Review, 39 (1): lhaf024. https://doi. org/10.1093/wber/lhaf024.
Bick, A., Blandin, A., & Deming, D. J. (2024). The rapid adoption of generative AI (NBER Working
Paper No. 32966). National Bureau of Economic Research. https://doi.org/10.3386/w32966.
Bloom, N., Eifert, B., Mahajan, A., McKenzie, D., & Roberts, J. (2013). Does management matter? Evidence from India. Quarterly Journal of Economics, 128 (1): 1–51.
Bodewig, C., & Badiani-Magnusson, R. (2014). Skilling up Vietnam: Preparing the workforce for a modern market economy. World Bank.
Bown, C. P., & Wang, D. (2024). Semiconductors and modern industrial policy. Journal of Economic Perspectives, 38 (4): 81–110.
Brandt, L., Van Biesebroeck, J., Wang, L., & Zhang, Y. (2026). Where has all the dynamism gone? Productivity growth in China’s manufacturing sector, 1998–2013. Journal of Development Economics, 181: 103720. https://doi.org/10.1016/j. jdeveco.2026.103720.
Branstetter, L. G., Li, G., & Ren, M. (2023). Picking winners? Government subsidies and firm productivity in China. Journal of Comparative Economics, 51 (4): 1186–1199.
Brown, C., Hardy, M., Mbiti, I. M., McCasland, J., & Salcher, I. (2024). Can financial incentives to firms improve apprenticeship training? Experimental evidence from Ghana. American Economic Review: Insights, 6 (1): 120–136.
Brynjolfsson, E., Li, D., & Raymond, L. R. (2023). Generative AI at work (NBER Working Paper No. 31161). National Bureau of Economic Research.
Caicedo, S., Espinosa, M., & Seibold, A. (2022). Unwilling to train? Firm responses to the Colombian apprenticeship regulation. Econometrica, 90 (2): 507–550.
Caldara, D., Iacoviello, M., Molligo, P., Prestipino, A., & Raffo, A. (2020). The economic effects of trade policy uncertainty. Journal of Monetary Economics, 109, 38–59.
Carranza, E., & McKenzie, D. (2024). Job training and job search assistance policies in developing countries. Journal of Economic Perspectives 38 (1): 221–44. https://doi.org/10.1257/jep.38.1.221.
Che, Y., & Zhang, L. (2017). Human capital, technology adoption and firm performance: Impacts of China’s higher education expansion in the late 1990s. The Economic Journal, 128 (614): 2282–2320. https://doi.org/10.1111/ecoj.12524.
Choi, J., & Levchenko, A. A. (2025). The longterm effects of industrial policy. Journal of Monetary Economics, 152, 103779.
Cirera, X., Cruz, M., & Martins-Neto, A. (2025). Higher education expansion and firm organization (Policy Research Working Paper No. 11216). World Bank.
Criscuolo, C. 2023. “Productivity Growth and Structural Change in the Era of Global Shocks.” PowerPoint, KDI–Brookings Joint Seminar: Productivity in a Time of Change, April 11. https://www.brookings.edu/wp-content/uploads/ 2023/04/2.1-KDI-Brookings-Jointt-Seminarrevised-ppt_Chiara-Criscuolo.pdf.
Criscuolo, C., Martin, R., Overman, H. G., & Van Reenen, J. (2019). Some causal effects of an industrial policy. American Economic Review, 109 (1): 48–85.
Cui, Z., Demirer, M., Jaffe, S., Musolff, L., Peng, S., & Salz, T. (2025). The effects of generative AI on high-skilled work: Evidence from three field experiments with software developers (August 20, 2025). Available at SSRN: https://ssrn.com/ abstract=4945566 or http://dx.doi.org/10.2139/ ssrn.4945566.
Cushman & Wakefield. (2025). Asia Pacific data centre H2 2025 update. Cushman & Wakefield.
Data Center Dynamics. (2025). Malaysia imposes power tariffs for data centers. https://www.datacenterdynamics.com/en/news/malaysia-imposespower-tariffs-for-data-centers/.
Debebe, Z., de Walque, D., Kim, Y. E., Le, S. M., Mattoo, A., Mohpal, A., Mutasa, R., Nagpal, S., Nguyen, S.-N., Pradhan, E., Sowers, E., & Tandon, A. (2026). A healthy future: Primary health care and the chronic disease epidemic in East Asia and Pacific. World Bank. https://doi.org/10.1596/978-1-4648-2284-1.
Dell’Acqua, F., McFowland, E., III, Mollick, E. R., Lifshitz-Assaf, H., Kellogg, K., Rajendran, S., Krayer, L., Candelon, F., & Lakhani, K. R. (2023). Navigating the jagged technological frontier: Field experimental evidence of the effects of AI on knowledge worker productivity and quality (Working Paper No. 24-013). Harvard Business School.
De Nicola, F., Mattoo, A., & Timmis, J. (2025). Firm foundations of growth: Productivity and technology in East Asia and Pacific. World Bank. https:// doi.org/10.1596/978-1-4648-2200-1.
Donaldson, D., & Hornbeck, R. (2016). Railroads and American economic growth: A “market access” approach. Quarterly Journal of Economics, 131 (2): 799–858.
Earth Journalism Network. (2025, November 10). Inside Malaysia’s data center boom. https://earth journalism.net/stories/inside-malaysias-data-center-boom.
Epoch AI. (2024). How much does it cost to train frontier AI models? https://epoch.ai/blog/ how-much-does-it-cost-to-train-frontier-ai-models.
Epoch AI. (2025). Build times for gigawatt-scale data centers can be 2 years or less. https://epoch.ai/ data-insights/data-centers-buildout-speeds/.
Erten, B., Stiglitz, J. E., & Verhoogen, E. (2026). Employment impacts of the CHIPS Act. NBER Working Paper No. 34625, National Bureau of Economic Research.
European Commission. (2024). State Aid Scoreboard 2024. https://competition-policy.ec.europa.eu/stateaid/scoreboard_en Evenett, S., Jakubik, A., Martín, F., & Ruta, M. (2024). The return of industrial policy in data. The World Economy, 47 (7): 2762–2788.
Faber, B. (2014). Trade integration, market size, and industrialization: Evidence from China’s national trunk highway system. Review of Economic Studies, 81 (3): 1046–1070.
Fan, J. (2025). Talent, geography, and offshore R&D. Review of Economic Studies, 92 (2): 1022–1060.
Feng, Y., H. Li, S. Wang, and M. Zhu. 2026. Industrial policy and retaliatory protection under the WTO: Lessons from China. CITP Working Paper 030. Centre for Inclusive Trade Policy.
Fernandes, A. M., and T. Reed. (2026). Industrial Policy for Development: Approaches in the 21st Century. Policy Research Reports. Washington, DC: World Bank. https://doi. org/10.1596/978-1-4648-2276-6.
Ferracane, M. F., Kren, J., & van der Marel, E. (2020). Do data policy restrictions impact the productivity performance of firms and industries? Review of International Economics, 28 (3): 676–722.
Filippucci, F., Gal, P., & Schief, M. (2024). Miracle or myth? Assessing the macroeconomic productivity gains from artificial intelligence (OECD Artificial Intelligence Paper No. 29). OECD Publishing.
Finger, J. M., & Kreinin, M. E. (1979). A measure of “export similarity” and its possible uses. Economic Journal, 89 (356): 905–912.
Fliess, B., E. Idsardi, and R. Rossouw. 2017. “Export controls and competitiveness in African mining and minerals processing industries.” OECD Working Papers.
Fourteau, T. (2025). What is propelling Malaysia’s data centre boom? White & Case. https:// www.whitecase.com/insight-our-thinking/ what-propelling-malaysias-data-centre-boom.
Frey, C. B., Presidente, G., & Andres, P. (2024). Data-biased innovation: Directed technological change and the future of artificial intelligence (Working Paper Series on Technological and Economic Change). Oxford Martin School, University of Oxford.
Fukuzawa, D., Islamaj, E., Le, D. T., Liu, H., & Mattoo, A. (2026). Trade policy uncertainty and labor informality in developing economies: Evidence from Viet Nam (Forthcoming).
Gambacorta, L., & Shreeti, V. (2025). The AI supply chain (BIS Paper No. 154). Bank for International Settlements.
Garcia-Macia, D., Kothari, S., & Tao, Y. (2025). Industrial policy in China: Quantification and impact on misallocation (IMF Working Paper No. 2025/155). International Monetary Fund.
Ghose, D., Khan, S. Y., & Montfaucon, A. F. (2025). Unpacking non-tariff measures: Beyond the tip of the iceberg (Working paper).
Giorcelli, M. (2019). The long-term effects of management and technology transfers. American Economic Review, 109 (1): 121–152.
Guberman, D., Schreiber, S., & Perry, A. (2024). Export restrictions on minerals and metals: Indonesia’s export ban of nickel. U.S. International Trade Commission.
Gupta, K. (2023). The heterogeneous impact of tariffs and NTMs on total factor productivity for Indonesian firms. Bulletin of Indonesian Economic Studies, 59 (2): 269–300.
Ha, J., Islamaj, E., Liu, H., & Mattoo, A. (2026). Economic effects of heightened global uncertainty: Evidence from East Asia and the Pacific region (Policy Research Working Paper). World Bank.
Heblich, S., Redding, S. J., & Sturm, D. M. (2020). The making of the modern metropolis: Evidence from London. Quarterly Journal of Economics, 135 (4): 2059–2133.
Hjort, J., Malmberg, H., & Schoellman, T. (Forthcoming). The missing middle managers: Labor costs, firm structure, and development. American Economic Review: Insights.
Iacovone, L., Maloney, W., & McKenzie, D. (2022). Improving management with individual and
group-based consulting: Results from a randomized experiment in Colombia. Review of Economic Studies, 89 (1): 346–371.
International Monetary Fund. (2024). Government Finance Statistics [Database]. https://data.imf.org/ en/datasets/IMF.STA:QGFS.
International Monetary Fund. (2025). Reforms to reduce China’s high household savings. IMF.
InvestPenang. (2024). Penang Investment Report 2023. InvestPenang.
ISEAS. (2024). A study of the emerging electric vehicle (EV) supply chain in Malaysia (ISEAS Perspective No. 2024/33). ISEAS–Yusof Ishak Institute.
Jabarian, B., & Henkel, L. (2025). Voice AI in firms: A natural field experiment on automated job interviews (Working Paper). Available at SSRN: https:// ssrn.com/abstract=5395709 or http://dx.doi.org/ 10.2139/ssrn.5395709.
Jedwab, R., Romer, P., Islam, A. M., & Samaniego, R. (2023). Human capital accumulation at work: Estimates for the world and implications for development. American Economic Journal: Macroeconomics, 15 (3): 191–223.
Kee, H. L., & Taglioni, D. (2025). It’s not (just) the tariffs: Rethinking non-tariff measures in a fragmented global economy (Policy Research Working Paper No. 11236). World Bank.
Kee, H. L., & Xie, E. (2025). Nickel, steel and cars: Export ban and domestic value added in Indonesia (Policy Research Working Paper No. 11249). World Bank.
Khan, S. M., Mann, A., & Peterson, D. (2021). The semiconductor supply chain: Assessing national competitiveness. Center for Security and Emerging Technology (CSET): Georgetown University. https://doi.org/10.51593/20190016.
Khanna, G., & Morales, N. (2021). The IT boom and other unintended consequences of chasing the American dream (Working paper).
Kruk, M. E., Gage, A. D., Arsenault, C., Jordan, K., Leslie, H. H., Roder-DeWan, S., Adeyi, O., Barker, P., Daelmans, B., Doubova, S. V., English, M., García-Elorrio, E., Guanais, F., Gureje, O., Hirschhorn, L. R., Jiang, L., Kelley, E., Lemango, E. T., Liljestrand, J., .. Pate, M. (2018). High-quality health systems in the Sustainable Development Goals era: Time for a revolution. Lancet Global Health, 6 (11): e1196–e1252. https://doi. org/10.1016/S2214-109X (18)30386-3.
Lane, N. (2025). Manufacturing revolutions: Industrial policy and industrialization in South Korea. The Quarterly Journal of Economics, 140 (3): 1683–1741.
Lashkaripour, A., & Lugovskyy, V. (2023). Profits, scale economies, and the gains from trade and industrial policy. American Economic Review, 113 (10): 2759–2808.
Lebrand, M., Vasishtha, G., & Yilmazkuday, H. (2024). Energy price shocks and current account balances: Evidence from emerging market and developing economies. Energy Economics, 129, 107201.
Leong, W. Q., Ngui, J. G., Susanto, Y., Rengarajan, H., Sarveswaran, K., & Tjhi, W. C. (2023). BHASA: A holistic Southeast Asian linguistic and cultural evaluation suite for large language models. arXiv preprint arXiv:2309.06085. https://arxiv.org/ abs/2309.06085.
Liu, Y., & Wang, H. (2025). Who on earth is using generative AI? (Policy Research Working Paper No. 11231). World Bank.
Ma, X. (2024). College expansion, trade, and innovation: Evidence from China. International Economic Review, 65 (1): 315–351.
Malaysian Investment Development Authority (MIDA). (2024a). Powering the future: Accelerating Malaysia’s EV charging revolution for sustainable mobility.
Malaysian Investment Development Authority (MIDA). (2024b). Digital inclusion: Bridging the connectivity divide in Malaysia.
Malaysian Investment Development Authority (MIDA). (2025). MIDA powers up Malaysia’s digital future at Data Centre Nexus 2025.
Mattoo, A., Mishra, P., & Subramanian, A. (2017). Beggar-thy-neighbor effects of exchange rates: A study of the renminbi. American Economic Journal: Economic Policy, 9 (4): 344–366.
McCaig, B., McMillan, M. S., Ngoma, M. M., & Pham, A. (2025). Industrial zones and structural transformation (Working Paper).
McKenzie, D. (2026). Sector-targeted skills development as industrial policy. World Bank.
McKinsey & Company. (2015). Sharpening data center due diligence. McKinsey Digital. https:// www.mckinsey.com/capabilities/mckinsey-digital/ our-insights/sharpening-data-center-due-diligence.
Microsoft. (2026). Global AI adoption in 2025: A widening digital divide (Microsoft AI Diffusion Report, 2025 H2). https://www.microsoft.com/ en-us/research/wp-content/uploads/2026/01/ Microsoft-AI-Diffusion-Report-2025-H2.pdf.
Ministry of Economy, Malaysia. (2023). National Energy Transition Roadmap (NETR). Putrajaya.
Misra, A., Zamir, S. W., Hamidouche, W., BeckerReshef, I., & Lavista Ferres, J. (2025). AI diffusion in low resource language countries. arXiv preprint arXiv:2511.02752. https://arxiv.org/ abs/2511.02752.
Miyamoto, K., Lathapipat, D., & Wongphet, O. (2024). Fostering foundational skills in Thailand: From a skills crisis to a learning society . World Bank.
Mordor Intelligence. (2024). Warehouse automation market—Industry size and growth. Mordor Intelligence. https://www.mordorintelligence.com/ industry-reports/warehouse-automation-market.
Moorty, L., & Varela, G. (2025). Beyond neutrality: Notes on strategic industrial policy and implications for World Bank engagement. World Bank.
New Straits Times. (2026). Stricter EV rules for 2026: Floor price for new brands raised to RM250,000. https://www.nst.com.my/business/ economy/2026/01/1348904/stricter-ev-rules2026-floor-price-new-brands-raised-rm250000.
Nguyen, T. Z., Nguyen, A. T., & Do, P. T. T. (2017). The Role of Investment Attraction in Vietnamese Industrial Parks and Economic Zones in the Process of International Economic Integration. Journal of Asian Finance, Economics and Business, 4 (3): 27–34.
Nicita, A., & Koloskova, K. (2025). Non-tariff measures at the border, a GTAP level analysis (UNCTAD Working Paper No. 9). United Nations Trade and Development.
Noy, S., & Zhang, W. (2023). Experimental evidence on the productivity effects of generative artificial intelligence. Science, 381 (6654): 187–192.
OECD. (2016). Skills matter: Further results from the survey of adult skills. OECD Publishing. https:// doi.org/10.1787/9789264258051-en.
OECD. (2024). PISA 2022 results . OECD Publishing.
OECD. (2025a). The chip landscape: Geographical distribution of wafer fabrication capacity (Science, Technology and Industry Policy Paper). OECD Publishing.
OECD. (2025b). OECD Economic Surveys: Viet Nam 2025. OECD Publishing.
OECD/WTO. (2025). Economic implications of data regulation: Balancing openness and trust OECD Publishing. https://doi.org/10.1787/aa2 85504-en.
OECD.AI. (2026). AI Knowledge on Demand (AIKOD) database. https://oecd.ai/en/aikod.
Ottonello, P., Perez, D. J., & Witheridge, W. (2025). The exchange rate as an industrial policy (Working Paper). University of Maryland & New York University.
Peng, S., Kalliamvakou, E., Cihon, P., & Demirer, M. (2023). The impact of AI on developer productivity: Evidence from GitHub Copilot. arXiv preprint arXiv:2302.06590. https://arxiv.org/abs/ 2302.06590.
Quid. (2025). AI investment data. In Maslej, N. et al., “The AI Index 2025 Annual Report.” Institute for Human-Centered AI, Stanford University.
Redonda, A., von Haldenwang, C., & Aliu, F. (2025). Global tax expenditures database. Tax Expenditures Lab. https://doi.org/10.5281/zenodo. 13332268.
Rest of World. (2024). Malaysia’s data center boom is creating few jobs and raising environmental concerns. https://restofworld.org/2024/malaysia-datacenter-jobs-environment/.
Rodrik, D. (2022). An industrial policy for good jobs Hamilton Project, Brookings Institution.
Ross, A., & Martinez, M. (2025). In search of economic boost, some African countries send workers abroad. Reuters.
Sheldon, P., & Kwon, S.-H. (2023). Samsung in Vietnam: FDI, business–government relations, industrial parks, and skills shortages. The Economic and Labour Relations Review, 34 (1): 66–85. https:// doi.org/10.1017/elr.2022.3.
Slok, T. (2026). Quantifying the productivity gains from AI. The Daily Spark, Apollo Academy. https://www.apolloacademy.com/quantifyingthe-productivity-gains-from-ai/.
South China Morning Post. (2024, December 27). Chinese cities offer subsidies to boost access to the computing power needed for AI. https://www.scmp. com/economy/china-economy/article/3292478/ chinese-cities-offer-subsidies-boost-access-computing-power-needed-ai.
Spar, D. (1998). Attracting high technology investment: Intel’s Costa Rican plant (FIAS Occasional Paper No. 11). World Bank.
Stanford University Human-Centered Artificial Intelligence (HAI). (2025). Artificial intelligence index report 2025. https://hai.stanford.edu/ ai-index/2025-ai-index-report.
Straub, Stephane, He He, Yue Li, Xinxin Lyu, Jevgenijs Steinbuks, Estefanía Vergara Cobos, Chris Dann, Manuel Garcia Santana, and Harris Selod. 2026. Infrastructure Foundations: From Current Assets to Future Growth. Sustainable Infrastructure Series. Washington, DC: World Bank. https://doi. org/10.1596/978-1-4648-1112-9.
Tafese, T., Lay, J., & Tran, V. (2025). Industrial parks and structural transformation: Evidence from Viet Nam (Working Paper).
Tenaga Nasional Berhad. (2025). Annual General Meeting Presentation 2025, Appendix B. https:// www.tnb.com.my/assets/energy_watch/AGM_ Presentation_2025_Appendix_B.pdf.
The Edge Malaysia. (2025, March 17). The state of the nation: Shot in the arm for producing Malaysianmade semiconductor chip. https://theedgemalaysia. com/node/747486.
U.S. Chamber of Commerce. (2016). Data centers: Jobs and opportunities in communities nationwide. U.S. Chamber Technology Engagement Center (C_TEC). https://www.uschamber.com/ technology/ us-chamber-report-data-centersaverage-325-million-economic-impact.
Wiles, E., Munyikwa, Z. T., & Horton, J. J. (2023). Algorithmic writing assistance on jobseekers’ resumes increases hires (NBER Working Paper No. 30886). National Bureau of Economic Research.
Wooldridge, J. M. (2009). On estimating firm-level production functions using proxy variables to control for unobservables. Economics Letters, 104 (3): 112–114.
World Bank (2020). World Development Report 2020: Trading for Development in the Age of Global Value Chains. Washington, DC: World Bank. http://hdl.handle.net/10986/32437.
World Bank. (2021a). World Development Report 2021: Data for better lives. World Bank. https://doi. org/10.1596/978-1-4648-1600-0.
World Bank. (2021b). Aiming high: Navigating the next stage of Malaysia’s development (Country Economic Memorandum). World Bank.
World Bank. (2023a). Reviving growth: East Asia and Pacific economic update, April 2023. World Bank.
World Bank. (2023b). Malaysia economic monitor: Bending bamboo shoots—Strengthening foundational skills. World Bank. https://documents.worldbank. org/curated/en/099041724092521963.
World Bank. (2023c). The business of the state. World Bank. https://doi.org/10.1596/978-1-4648-1998-8.
World Bank. (2024a). Philippines economic update, December 2024. World Bank.
World Bank. (2024b). Jobs and technology: East Asia and Pacific economic update, October 2024. World Bank.
World Bank. (2024c). Data vouchers: Korea case study for revitalizing the data ecosystem. World Bank Group Korea Office Innovation and Technology Series Washington, D.C. : World Bank Group. http://documents.worldbank.org/curated/ en/099624206122421867 .
World Bank. (2024d). BOOST: Public expenditure database [Database]. https://www.worldbank.org/ en/programs/boost-portal.
World Bank. (2024e). Services unbound: Digital technologies and policy reform in East Asia and Pacific. World Bank.
World Bank (2024f). Malaysia Economic Monitor : Farming the Future: Harvesting Malaysia’s Agricultural Resilience through Digital Technologies). World Bank Group. http://documents.worldbank. org/curated/en/099100924041013169.
World Bank. (2025a). Jobs: East Asia and Pacific economic update, October 2025. World Bank.
World Bank. (2025b). A longer view: East Asia and Pacific economic update, April 2025. World Bank.
World Bank. (2025c). Digital progress and trends report 2025: Strengthening AI foundations. World Bank. https://doi.org/10.1596/978-1-4648-2264-3.
World Bank. (2025d). Thailand country climate and development report (CCDR). World Bank.
World Bank. (2025e). GovTech maturity index 2025: Tracking public sector digital transformation worldwide. World Bank.
World Bank. (2026a). Global economic prospects, January 2026. World Bank.
World Bank. (2026b). Thailand economic monitor: Advanced green manufacturing for growth. World Bank.
World Bank. (2026c). Hooked on subsidies: The case for reform (English). Washington, DC: World Bank Group. http://documents.worldbank.org/curated/ en/099032626103039700.
World Food Programme. (2026, March 24). Projected increase in acute food insecurity due to the Middle East conflict. https://www.wfp.org/publications/projected-increase-acute-food-insecurity-due-middle-east-conflict.
World Trade Organization. (2025). World trade report 2025: Making trade and AI work together to the benefit of all. WTO.
Zeng, D. Z. (2016). Special economic zones: Lessons from the global experience (PEDL Synthesis Paper No. 1).
Zhan, J., & Zhu, J. (2020). The effects of state ownership on innovation: Evidence from the state-owned enterprises reform in China. Applied Economics, 53 (1): 145–163.