
Accelerating Investment Challenges and Policies


Edited

by Amat Adarov Edited Amat Adarov
Geopolitical tensions, shrinking aid, and strained public budgets are squeezing investment just as emerging market and developing economies (EMDEs) face soaring financing needs. This timely volume offers a clear and compelling analysis of shifting investment patterns—how they have evolved, why these shifts matter, and how to reverse the decline. It is essential reading for policy makers and practitioners working to foster sustainable growth in EMDEs.
Beata Javorcik
Chief Economist, European Bank for Reconstruction and Development, and Professor of Economics, University of Oxford
Investment is the cornerstone of economic growth and sustainable development. This volume provides the most comprehensive and rigorous assessment of investment dynamics in emerging and developing economies to date. Drawing on cutting-edge research and rich case studies, the volume explores the drivers of public, private, and foreign investment; highlights the transformative power of investment accelerations; and distills practical policy lessons. At a time when emerging and developing economies face a massive investment shortfall and financing needs are mounting, this book offers both a diagnosis of the challenges and a road map for reigniting momentum. It is an essential resource for policy makers, scholars, and practitioners committed to unlocking investment as an engine of inclusive and sustainable development.
Ugo Panizza
Pictet Chair in Finance and Development, Geneva Graduate Institute, and Vice President, Centre for Economic Policy Research
The geopolitical context, alongside increasing debt-sustainability concerns, is making it difficult for EMDEs to sustain the pace of investment they need to secure a sustainable and prosperous future for their citizens. This book makes a compelling case for accelerating investment and for exploiting the complementarity of investment by the public and private sectors. It shows that effective project design and implementation, as well as a conducive business environment, remain critical factors of success. It is essential reading for policy makers.
Debora Revoltella Chief Economist and Director European Investment Bank
This is a significant and timely contribution that emphasizes a major global issue—the urgent need for increased investment to boost global development, climate transition, and job opportunities. The detailed analysis is rich in data, insights, and diagnoses of key problems, as well as in the policy responses that should be implemented in many countries over the coming years. The focused
examination of EMDEs, and the interactions among public, private, and foreign direct investment, adds valuable insights that address important gaps in the literature on the drivers of economic growth in EMDEs. This book is essential reading for policy makers and researchers.
Warwick J. McKibbin
Distinguished Professor, Australian National University, and Nonresident Senior Fellow, Peterson Institute for International Economics
This book unpacks decades of investment growth and drivers in emerging market economies, drawing on rich data and rigorous analysis. It presents compelling evidence that stronger investment depends on comprehensive domestic reforms to improve institutional quality, enhance human capital, and build absorptive capacity. The lessons matter now more than ever, as emerging market economies must mobilize significantly more private and public capital to engineer digital and green transitions, remain competitive, and continue their pursuit of shared prosperity. For policy makers and researchers alike, this book is both a valuable resource and a timely call to action.
Cynyoung Park Executive Director
The SEACEN Centre
What makes this book on investment in the developing world stand apart is the richness of its empirical analysis supported by a database that is impressive in its depth and breadth. The analysis offers a wealth of actionable insights. The book’s policy recommendations are particularly valuable at a time when investment needs are high and urgent but confront strong headwinds.
Zia Qureshi Senior Fellow, Global Economy and Development Brookings Institution
For emerging markets, increasing investment is imperative for fostering growth and addressing global challenges such as climate change. This book convincingly demonstrates the significance of investment accelerations in enhancing economic performance. Additionally, it proposes a set of realistic policy instruments that countries can employ to expedite the pace of investment. The comprehensive analysis makes it a must-read resource for policy makers and academics.
Antonio Fatás Professor of Economics INSEAD
This book is a timely and essential contribution to the global development literature and policy debate. Drawing on state-of-the-art empirical methods, it offers comprehensive analysis and a robust, evidence-based menu of policy options to reignite public and private investment. It is an indispensable resource for policy makers, researchers, and practitioners committed to advancing sustainable growth and shared prosperity.
Ali Bayar President ECOMOD
Navigating the complexities of global trade tensions and economic fragmentation is a significant challenge for many developing nations. To overcome this and foster development, a renewed focus on investment is crucial. This book provides comprehensive data, insightful analysis, and practical policy recommendations for EMDEs. As a professor of economics in the Republic of Korea, a country that has successfully transitioned from an EMDE to a developed economy, I can attest to the importance of strategic investment policies. This book is an essential read for policy makers and researchers seeking to chart a course toward sustainable growth.
Sunghyun Henry Kim Dean of the College of Economics and Professor of Economics Sungkyunkwan University
No country has sustained growth without investment. Today, investment— which has been the engine of growth in developing countries for the past halfcentury—is slowing, making future growth elusive. This book not only documents the slowdown in investment but also provides a blueprint for policies to reverse the trend and accelerate growth. These policies are not just good interventions—they are urgent.
Shantayanan Devarajan Professor of Practice of International Development
Georgetown University
Accelerating Investment

Scan to go to this publication online.
Accelerating Investment Challenges and Policies
Edited by Amat Adarov

© 2025 International Bank for Reconstruction and Development / The World Bank 1818 H Street NW, Washington, DC 20433
Telephone: 202-473-1000; Internet: www.worldbank.org
This work is a product of the staff of The World Bank with external contributions. The findings, interpretations, and conclusions expressed in this work do not necessarily reflect the views of The World Bank, its Board of Executive Directors, or the governments they represent.
The World Bank does not guarantee the accuracy, completeness, or currency of the data included in this work and does not assume responsibility for any errors, omissions, or discrepancies in the information, or liability with respect to the use of or failure to use the information, methods, processes, or conclusions set forth. The boundaries, colors, denominations, links/footnotes, and other information shown in this work do not imply any judgment on the part of The World Bank concerning the legal status of any territory or the endorsement or acceptance of such boundaries. The citation of works authored by others does not mean The World Bank endorses the views expressed by those authors or the content of their works.
Nothing herein shall constitute or be construed or considered to be a limitation upon or waiver of the privileges and immunities of The World Bank, all of which are specifically reserved.
Rights and Permissions

This work is available under the Creative Commons Attribution 3.0 IGO license (CC BY 3.0 IGO) http://creativecommons.org/licenses/by/3.0/igo. Under the Creative Commons Attribution license, you are free to copy, distribute, transmit, and adapt this work, including for commercial purposes, under the following conditions:
Attribution—Please cite the work as follows: Adarov, Amat, ed. 2025. Accelerating Investment: Challenges and Policies. Washington, DC: World Bank. doi:10.1596/978-1-4648-2304-6. License: Creative Commons Attribution CC BY 3.0 IGO
Translations—If you create a translation of this work, please add the following disclaimer along with the attribution: This translation was not created by The World Bank and should not be considered an official World Bank translation. The World Bank shall not be liable for any content or error in this translation.
Adaptations—If you create an adaptation of this work, please add the following disclaimer along with the attribution: This is an adaptation of an original work by The World Bank. Views and opinions expressed in the adaptation are the sole responsibility of the author or authors of the adaptation and are not endorsed by The World Bank.
Third-party content—The World Bank does not necessarily own each component of the content contained within the work. The World Bank therefore does not warrant that the use of any third-partyowned individual component or part contained in the work will not infringe on the rights of those third parties. The risk of claims resulting from such infringement rests solely with you. If you wish to reuse a component of the work, it is your responsibility to determine whether permission is needed for that reuse and to obtain permission from the copyright owner. Examples of components can include, but are not limited to, tables, figures, or images.
All queries on rights and licenses should be addressed to World Bank Publications, The World Bank Group, 1818 H Street NW, Washington, DC 20433, USA; e-mail: pubrights@worldbank.org.
ISBN (paper): 978-1-4648-2304-6
ISBN (electronic): 978-1-4648-2305-3
DOI: 10.1596/978-1-4648-2304-6
Cover image: © Maria Stavreva/Getty Images. Used with the permission of Getty Images. Further permission required for reuse.
Cover design: Adriana Maximiliano, World Bank Group.
Library of Congress Control Number: 2026906175.
The cutoff date for the data used in the report was August 18, 2025.
Summary of Contents
Foreword ...........................................................................................................xix
the Authors ............................................................................................
Investment in Emerging and Developing Economies.............................
Amat Adarov, M. Ayhan Kose, and Dana Vorisek
Chapter 1 Investment Trends, Structure, and Drivers in EMDEs .......................
Amat Adarov and Kersten Stamm
Chapter 2 The Magic of Investment Accelerations ...............................................
Jakob de Haan, Kersten Stamm, and Shu Yu
Chapter 3 Public Investment as a Catalyst of Economic Growth........................
Amat Adarov, Benedict Clements, João Tovar Jalles, Jeetendra Khadan, Nikita Perevalov, and Naotaka Sugawara
Chapter 4 Reinvigorating Private Investment: Policy Options............................
Tommy Chrimes, Mathilde Lebrand, and Joseph Mawejje
Chapter 5 Foreign Direct Investment in Retreat: Policies to Turn the Tide.......
Amat Adarov and Hayley Pallan
2.6
2.7
2.8
2.9
2.10
2.11
2.12
2.13
B2.1.1
B2.1.2
B2.1.3
B2.1.4
B2.1.5
3.1
3.2
3.3
B3.1.1
B3.2.1
4.1
4.5
4.6
4.8
B4.1.1
4.9
5.1
5.2
5.3
5.4
5.5
B5.2.1
5.6
5.7
2B.1
2B.2
2C.1
2D.1
2D.2
2D.3
2D.4
Foreword
Developing economies today face an investment shortfall of historic proportions. Meeting even the most modest development goals will require a huge investment push—on the order of 5 percent of global gross domestic product (GDP) per year. For low-income countries, the financing gap is about 8 percent of GDP annually. It’s a prohibitive price tag that runs into trillions of dollars over the next decade.
Yet, even as development needs have ballooned, investment flows have ebbed. Since the global financial crisis of 2008–09, investment growth in emerging market and developing economies (EMDEs) has slowed to about half the pace in the 2000s. The growth of private investment, in particular, halved from double-digit rates in the 2000s to less than 7 percent in the 2010s. Foreign direct investment (FDI) inflows— a critical source of capital, technology, and managerial know-how—weakened and became concentrated in a handful of economies.
This tension—between burgeoning needs and dwindling resources—defines the challenge at the center of this book. Without a renewed wave of capital formation, EMDEs will not be able to engineer lasting growth, create sufficient jobs, and meet even modest development objectives.
But the book also shows that an investment miracle is possible. Over the last seven decades, 115 investment accelerations—episodes of sustained, rapid investment growth—have taken place across 59 EMDEs. They raised investment growth from an average of 3 percent to more than 10 percent annually. They doubled per capita GDP growth and quadrupled productivity growth. Export growth surged, FDI inflows multiplied, and poverty declined rapidly. In other words, these accelerations transformed economies.
Since the turn of the century, however, such investment accelerations have become rarer. In the 2000s, nearly half of all EMDEs experienced an acceleration; by the 2010s, less than one in four did. The drop reflects less conducive global conditions— slower trade, volatile commodity prices, and greater financial fragmentation—as well as waning momentum on domestic policy reforms.
Why does investment matter so much? First, it is the foundation of long-term growth. In EMDEs, investment has accounted for more than half of potential growth since 2000. Second, it is the engine of job creation. Investment spurs labor reallocation toward more productive sectors, boosting both employment and job quality. During accelerations, employment growth rises steadily, particularly in manufacturing and services.
Third, investment is necessary for meeting the most basic development needs. Almost 740 million people still lack access to electricity, one-quarter of the world lacks safe drinking water, and digital infrastructure in many EMDEs remains rudimentary. Bridging these gaps requires sustained investments in infrastructure, climate, energy, education, health, and technology.
In short, the case for higher investment is overwhelming. But the obstacles are equally formidable. Domestically, many EMDEs grapple with weak fiscal space, feeble government institutions, shallow financial systems, and high policy uncertainty. During the last two decades, public investment has been sapped by high debt levels and spending cuts in the aftermath of financial and other crises. Private investment has been deterred by policy uncertainty, weak contract enforcement, limited access to finance, and infrastructure bottlenecks. Across the world, the retreat of trade and financial integration, the proliferation of restrictions on investment flows, and heightened geopolitical tensions have raised risks and reduced opportunities. Fragmentation is closing off the channels—trade, technology transfer, and cross-border capital—that supported past investment accelerations.
The central lesson of this book is that—even when global economic times are tough—the right national policy mix can spark an investment miracle. Successful investment accelerations are rarely the result of isolated reforms; they result from comprehensive packages that stabilize the macroeconomy, expand openness, and strengthen institutions. Evidence presented in this study underscores the power of such packages.
Major structural reforms in EMDEs—trade and financial integration, and product market reforms—individually boost private investment by about 1 to 2 percent cumulatively over three years. When implemented together, the effects of reforms multiply. A combination of reforms that strengthen trade and financial linkages and improve the functioning of product markets increases the probability of a private investment acceleration by more than 10 percentage points.
Similarly, the growth payoff to public investment is about 50 percent higher in countries with ample fiscal space and high investment efficiency. FDI delivers nearly three times the growth boost in countries with strong institutions, better human capital, and greater trade linkages. These complementarities highlight a critical finding: coordinated reforms can precipitate a rising tide of national economic benefits.
The policy priorities for EMDEs follow from these findings. They must improve their investment climate—by reinstituting macroeconomic stability, reigniting structural reforms, and restoring fiscal space. They must raise the efficiency of public investment—through better project selection, execution, and evaluation. They must implement structural reforms that reduce policy uncertainty, integrate markets with the global economy, and deepen access to finance. But domestic policy alone will not be sufficient for a small economy, which is what most EMDEs are. Globally, a renewed commitment to a predictable, rules-based system of trade and investment is essential. So, too, is scaled-up international financial support, particularly for low-income countries, through concessional finance and guarantees, complemented with policy advice and technical assistance.
The stakes could not be higher. Without an investment revival, emerging economies risk an extended era of stagnation, slower convergence with advanced countries, and missed development goals. With it, they can accelerate growth, create jobs, reduce poverty, and build resilience to financial, economic, and climate shocks.
Policy makers around the world have the tools to spark new investment miracles. They have done it before; they can do it again. By drawing on the lessons of past accelerations, implementing comprehensive reform packages, and mobilizing both domestic and global resources, EMDEs can meet the enormous challenges of our time. This volume, the World Bank’s most comprehensive assessment of investment in developing economies, amasses the evidence and insights necessary to guide that effort.
Indermit Gill Senior Vice President and Chief Economist
The World Bank Group
Acknowledgments
This book is a product of the Prospects Group in the World Bank Group’s Development Economics Vice Presidency. The project was managed by Amat Adarov under the general guidance of M. Ayhan Kose, whose unwavering support and strategic direction significantly enhanced the quality of the study. Dana Vorisek played a central role in shaping the report by providing extensive feedback and ensuring a rigorous review process through her coordination of the final stages of preparation. We are deeply grateful to Indermit Gill, World Bank Chief Economist and Senior Vice President for Development Economics, for encouragement and insightful suggestions throughout the preparation of this book.
We are extremely privileged to have worked with superb colleagues who made major contributions to this study. The chapters of this book are the product of dedicated efforts by our team of co-authors: Tommy Chrimes, Benedict Clements, Jakob de Haan, João Tovar Jalles, Jeetendra Khadan, M. Ayhan Kose, Mathilde Lebrand, Joseph Mawejje, Hayley Pallan, Nikita Perevalov, Kersten Stamm, Naotaka Sugawara, Dana Vorisek, and Shu Yu. We are also thankful for excellent contributions from Marie Albert, Menzie Chinn, Jongrim Ha, Hiro Ito, Reina Kawai, Philip Kenworthy, Dohan Kim, Emiliano Luttini, Valerie Mercer-Blackman, Ugo Panizza, Peter Pedroni, Guillermo Verduzco-Bustos, Collette Wheeler, and Takefumi Yamazaki.
The book benefited from valuable reviews by many colleagues: Carlos Arteta, Mirco Balatti, Agustin Bénétrix, Timothy Callen, Jakob de Haan, Persephone Economou, Antonio Fatás, Bram Gootjes, Graham Hacche, Santiago Herrera, Samuel Hill, Ethan Ilzetzki, Joseph Joyce, Dohan Kim, Timothy Lane, Emiliano Luttini, Kate McKinnon, Valerie Mercer-Blackman, James Morsink, Alen Mulabdic, Moritz Nebe, Franziska Ohnsorge, Edoardo Palombo, Peter Pedroni, James Rowe, Lawrence Schembri, Maria Vagliasindi, Guillermo Verduzco-Bustos, Hamza Zahid, and Francesco Zanetti. We also received extensive feedback at numerous research conferences and internal seminars, and during the World Bank Group-wide review process of Global Economic Prospects reports that featured analytical work developed as part of this book.
We are deeply grateful to Sergiu Dinu, Rafaela Martinho Henriques, and Juan Felipe Serrano Ariza for skillfully undertaking a large share of the research assistance responsibilities related to this book. We are also thankful to Guillermo Caballero, Mattia Coppo, Jiayue Fan, Shiqing Hua, Yi Ji, Franco Diaz Laura, Maria Hazel Macadangdang, Muneeb Ahmad Naseem, Vasiliki Papagianni, Lorëz Qehaja, Shijie Shi, Kaltrina Temaj, Urja Singh Thapa, and Juncheng Zhou for excellent research support. Victor Steenbergen and Astrit Sulstarova graciously shared some of the data used in the study.
We are indebted to talented colleagues who worked on the production and dissemination of the book. Adriana Maximiliano handled design and production.
Graeme Littler provided editorial support, with contributions from Adriana Maximiliano, and produced the online products, with assistance from the Open Knowledge Repository. Joe Rebello managed communications and media outreach with a team that included Kristen Milhollin, Mariana Lozzi Teixeira, and Leslie Yun.
The Prospects Group gratefully acknowledges financial support from the Policy and Human Resources Development Fund provided by the Government of Japan.
About the Authors
Amat Adarov, Senior Economist, World Bank
Tommy Chrimes, Senior Economist, World Bank
Benedict Clements, Professor, Universidad de las Américas
Jakob de Haan, Professor of Political Economy, University of Groningen
João Tovar Jalles, Senior Associate Professor of Economics, University of Lisbon
Jeetendra Khadan, Senior Economist, World Bank
M.Ayhan Kose, Deputy Chief Economist and Director, World Bank
Mathilde Lebrand, Senior Economist, World Bank
Joseph Mawejje, Economist, World Bank
Hayley Pallan, Economist, World Bank
Nikita Perevalov, Senior Economist, World Bank
Kersten Stamm, Economist, World Bank
Naotaka Sugawara, Senior Economist, World Bank
Dana Vorisek, Lead Economist, World Bank
Shu Yu, Senior Economist, World Bank
Abbreviations
2SLS
AI
CAPI
CPI
CPIA
EAP
ECA
EMDEs
ETS
EU
FCS
FDI
FE
G20
GDP
GEP
GMM
GVC
HICs
ICRG
ICT
IFS
IMF
IPAs
IQ
LAC
LICs
LMICs
M&A
MDBs
MNA
MNEs
OECD
PIMI
PIQ
PPI
two-stage least squares model
artificial intelligence
cyclically adjusted public investment
consumer price index
Country Policy and Institutional Assessment
East Asia and Pacific
Europe and Central Asia
emerging market and developing economies
emissions trading scheme
European Union
fragile and conflict-affected situations
foreign direct investment
fixed effects model
Group of Twenty
gross domestic product
Global Economic Prospects
generalized method of moments
global value chain
high-income countries
International Country Risk Guide
information and communication technology
International Financial Statistics
International Monetary Fund
investment promotion agencies
institutional quality
Latin America and the Caribbean
low-income countries
lower-middle-income countries
mergers and acquisitions
multilateral development banks
Middle East and North Africa
multinational enterprises
Organisation for Economic Co-operation and Development
Public Investment Management Index
public investment quality
private participation in infrastructure
PPP
PVAR
PWT
R&D
SAR
SEZs
SSA
SVAR
TFP
UMICs
VAR
WDI
public-private partnership
panel vector autoregression
Penn World Table
research and development
South Asia
special economic zones
Sub-Saharan Africa
structural vector autoregression
total factor productivity
upper-middle-income countries
vector autoregression
World Development Indicators
… the effectiveness of innovation in increasing output would be paced by the rate of gross investment. A policy to increase investment would thus lead not only to higher capital intensity, which might not matter much, but also to a faster transfer of new technology into actual production, which would.
Robert M. Solow (1987)
1987 Nobel Laureate in Economics

OVERVIEW
Investment in Emerging and Developing Economies

The world faces a pressing challenge to meet key development objectives amid slowing growth and rising macroeconomic and geopolitical risks. With the number of job seekers rising rapidly, infrastructure shortfalls remaining large, and climate costs mounting, the case for a significant investment push has never been stronger. Yet the capacity to respond in many emerging market and developing economies (EMDEs) has eroded. Since the global financial crisis, investment growth has slowed to about half its pace in the 2000s, with both public and private investment weakening. Foreign direct investment (FDI) inflows—a critical source of capital, technology, and managerial know-how—have also fallen sharply and become increasingly concentrated, leaving low-income countries (LICs) with only a marginal share. The risks of further retrenchment are significant, as trade tensions, policy uncertainty, and elevated debt levels continue to weigh on investment. Reigniting momentum will require ambitious domestic reforms to strengthen institutions, rebuild macro-fiscal stability, and deepen trade and investment integration—the foundations of a supportive business climate. At the same time, international cooperation is indispensable. A renewed commitment to a predictable system of cross-border trade and investment flows, combined with scaled-up financial support and sustained technical assistance, is essential to help EMDEs—especially LICs and economies in fragile and conflict-affected situations (FCS)—bridge financing gaps and implement the domestic reforms needed to restore investment as an engine of growth, jobs, and development.
Introduction
Policy makers around the world are searching for ways to boost growth and create jobs—and investment lies at the heart of that effort. A higher investment growth rate is consistently linked to faster productivity and output growth, as more capital per worker fuels innovation and efficiency. History shows that countries experiencing rapid investment growth often enjoy powerful output growth spurts, accompanied by job creation and broad macroeconomic gains. In fact, investment accelerations—episodes of rapid, sustained investment growth—have repeatedly served as turning points, setting economies on stronger and more durable growth paths.
This book offers the most comprehensive analysis of investment in EMDEs to date. It fills critical gaps in the literature by systematically documenting investment trends, analyzing periods of acceleration and slowdown, distinguishing between public and private investment, exploring the role of FDI, and distilling key policy lessons. EMDEs—economies facing both a prolonged slowdown in investment growth and
Note: This chapter was prepared by Amat Adarov, M. Ayhan Kose, and Dana Vorisek.
urgent development needs that require substantial capital formation—are placed at the center of the analysis.
Why investment matters
Investment, or gross fixed capital formation, serves at least three critical macroeconomic and development functions.1 It is the foundation of long-term growth, a critical driver for overcoming development challenges, and a powerful engine of job creation.
Foundation of long-term economic growth
Investment is akin to a barometer conveying how much of an economy’s output is dedicated to the creation and maintenance of productive capacity, rather than immediate consumption. In EMDEs, investment has contributed about one-third of growth since the start of the 21st century, and more than half of potential output growth (figures O.1.A and O.1.B). Sustained increases in capital stock allow firms to expand production, adopt new technologies, and create conditions for higher productivity. Without renewed investment momentum, EMDEs will struggle to converge toward advanced-economy income levels—a process that stalled in the early 2010s. Excluding China, per capita incomes in EMDEs are stuck at about 9 percent of the level in advanced economies, and LICs have long been at about 1 percent (figure O.1.C).
An essential ingredient for development progress
The world faces urgent needs for climate-resilient infrastructure, reliable electricity and water systems, and improved health and education facilities. One-quarter of people in the world lack access to safely managed drinking water and more than two-fifths do not have safely managed sanitation facilities; about 740 million people lack access to electricity (IEA 2024; WHO and UNICEF 2023). These figures are considerably worse in LICs (figure O.1.D). Connectivity gaps remain wide as well: logistics performance and transportation infrastructure in EMDEs lag far behind those in advanced economies (figure O.1.E). Closing these gaps will require trillions of dollars in additional annual investment. Recent estimates suggest that meeting the Sustainable Development Goals and climate commitments in low- and middle-income countries will require an additional $1.5 trillion to $2.7 trillion annually through 2030, rising to as much as $4 trillion when accounting for the growing costs of climate change. For LICs, the shortfall amounts to about 8 percent of gross domestic product (GDP) per year—an enormous gap that cannot be bridged without significantly higher investment (figure O.1.F).
A powerful engine of job creation
Investment does not just expand output; it also reshapes labor markets. During periods of investment acceleration, employment rates rise and workers shift from lowproductivity agriculture into more productive manufacturing and services. Evidence
1 Unless otherwise stated, investment is defined as real gross fixed
FIGURE O.1 The importance of investment
In EMDEs, investment has contributed about one-third of growth since the start of the 21st century, and more than half of potential output growth. Investment is instrumental for boosting productivity, creating new jobs, and reducing poverty. However, a substantial backlog of unmet infrastructure needs has slowed income convergence in EMDEs. Investment gaps are especially large in LICs.
A. Contributions to GDP growth in EMDEs
B. Contributions to potential output growth
Sources: Penn World Table (Feenstra, Inklaar, and Timmer 2015); WDI (database); World Bank (2022); World Bank.
Note: AEs = advanced economies; EMDEs = emerging market and developing economies; LICs = low-income countries; RHS = righthand side; TFP = total factor productivity.
A. Aggregates are calculated using real U.S. dollar GDP weights at average 2010-19 prices and market exchange rates.
B. Growth in potential output is based on production function estimates. Sample includes 53 EMDEs.
C. Lines show the evolution of per capita income of EMDEs, EMDEs excluding China, and LICs as share of per capita income of advanced economies. Last observation is 2025.
D. Bars show 2013-23 averages of the percent of the population with access to electricity, access to minimally adequate drinking water, access to basic sanitation facilities, and 2013-23 averages of the number of hospital beds available per 1,000 people. Sample includes 34 advanced economies and up to 104 EMDEs, of which 19 are LICs.
E. Bars show 2013-23 averages. The indexes range from 1 to 5 (5 = highest). Quality of transportation infrastructure reflects perceptions of the quality of trade- and transportation-related infrastructure. Logistics performance index reflects perceptions of the overall quality of logistics. Sample includes 34 advanced economies and 100 EMDEs, of which 19 are LICs. F. Estimates of the
needs during 2022-30 to
by 70 percent by 2050. Depending on
urban adaptations, industry, and landscape.
availability, estimates include investment needs on transportation, energy,
D. Access to infrastructure
C. Per capita income convergence in EMDEs
FIGURE O.2 Employment growth around investment accelerations
Investment accelerations—periods of annual per capita investment growth averaging at least 4 percent for six or more years—have coincided with significant increases in the employment rate and a sectoral shift in employment from agriculture to the more productive manufacturing and services sectors.
Source: World Bank.
Note: At the 10 percent level, differences between before and during investment accelerations are statistically significant unless otherwise specified. EMDEs = emerging market and developing economies.
A. Bars show median annual change in the employment rate during the six years preceding investment accelerations and during investment accelerations. Markers indicate the median annual change in the employment rate during non-acceleration years.
B. Bars show median annual employment growth during the six years preceding investment accelerations and during investment accelerations. The difference in growth rates of employment in the services sector before and during the acceleration is not significant.
from nearly 200 investment accelerations between 1950 and 2022 shows that the employment rate typically rises during these episodes by about 0.2 percentage point per year in EMDEs—compared with stagnation or decline in other years (figure O.2.A). Employment growth is particularly strong in the manufacturing and services sectors during investment accelerations (figure O.2.B). These dynamics underscore why job creation depends critically on sustained investment growth. Stronger investment generates not only more jobs but also better jobs, enabling faster poverty reduction and broader improvements in living standards.
The link between investment and jobs works through several channels. At the firm level, investment in productivity-enhancing activities is associated with higher job creation (Akcigit and Kerr 2018; Farole, Ferro, and Gutierrez 2017). Firms that gain access to financial markets, especially young firms, invest more and create jobs (Didier et al. 2021). Public and private investment generate indirect employment effects when they remove growth constraints, such as through investments in information and communication technologies (ICT), transportation infrastructure, or electricity generation and distribution (Christiaensen and Martin 2018; Mensah 2024; Vagliasindi and Gorgulu 2025). Furthermore, public investment in worker retraining and human capital accumulation has positive long-term effects on employment (Card, Kluve, and Weber 2018).
Transmission channels
The mechanisms through which investment supports growth and development are well understood but often underestimated in practice. At the most direct level, investment in
B. Employment growth around investment accelerations, by sector
A. Change in the employment rate around investment accelerations
machinery, equipment, and technology allows workers to produce more per hour, raising productivity and incomes. Investment in infrastructure lowers production costs and improves connectivity, enabling firms to expand and integrate into regional and global value chains. Public investment, when well-designed and efficient, also crowds in private investment by reducing bottlenecks and raising the returns to private capital.
Equally important, investment plays a central role in the process of structural transformation. Investment facilitates the reallocation of labor into manufacturing and services, raising overall productivity and boosting growth. It also promotes agricultural productivity by financing new technologies. The quality of investment also matters: investment in health, education, and digital infrastructure builds human capital and intangible assets that underpin long-term prosperity. In this way, investment operates not only as a driver of growth today but also as a foundation for inclusive and sustainable development tomorrow.
Investment needs and the scale of the challenge
As noted, the need for higher investment is particularly acute in EMDEs. ese economies must simultaneously sustain growth, reduce poverty, and address mounting climate challenges. Yet their investment levels remain far below what is required. e infrastructure shortfalls alone are staggering: universal access to electricity, clean water, and sanitation remains out of reach for significant portions of the population. Meanwhile, the digital economy—an increasingly critical driver of competitiveness—requires rapid expansion of broadband networks, data infrastructure, and intangible capital.
Bridging these gaps will require unprecedented mobilization of both public and private resources. Even under optimistic assumptions, however, domestic public investment can cover only about one-third of the needed increase. e rest must come from private capital—both domestic and foreign—and from greater support by the international community through concessional finance, guarantees, and technical assistance. Without a dramatic scaling-up, EMDEs risk falling further behind in meeting development and climate objectives.
Key contributions
is book seeks to provide policy makers, researchers, and practitioners with the most comprehensive analysis to date of investment in EMDEs. By systematically documenting trends and cycles, distinguishing between public, private, and foreign investment, and identifying the policies that can spark investment accelerations, it provides both diagnosis and prescriptions. e stakes are high. Without a revival of investment growth, EMDEs risk prolonged stagnation, slower income convergence, and missed development goals (Cull et al. 2024; Gill 2024; Kose and Ohnsorge 2024). With the right policies, however, investment can be the engine of growth, jobs, and poverty reduction— unlocking the path to resilient and sustainable development.
The book makes five distinct contributions to the related literature and to policy debates:
• Comprehensive analysis of investment trends, drivers, and impacts. A central contribution of the book is a systematic and granular analysis of investment trends and drivers in EMDEs. Whereas much previous research has treated investment in aggregate, this book disaggregates investment by type (public investment, private investment, and FDI), by asset (tangible and intangible), and by sector, providing a detailed account of investment patterns in these economies. The empirical analysis in all chapters pushes the frontier by applying state-of-the-art methodologies to disentangle drivers of investment and FDI, and the macroeconomic effects of boosting investment. In addition, chapters 1 and 5 explore how investment evolves during adverse events, including recessions and financial crises.
• Dedicated focus on EMDEs. The book focuses exclusively on EMDEs. Most crosscountry studies of investment have either concentrated on advanced economies or examined certain EMDEs or subsets of countries (IMF 2014, 2015; OECD 2025; World Bank 2017). This study provides the first broad perspective on investment in EMDEs, covering multiple decades and up to 125 countries. The book also carefully examines heterogeneity among EMDEs, highlighting the unique challenges and policy needs of commodity exporters, commodity importers, LICs, economies in FCS, and regional subgroups. This analysis offers a nuanced understanding of why investment trajectories differ and how policy prescriptions must be tailored.
• Investment accelerations and growth. The book presents novel evidence on the dynamics of investment accelerations and the role of public investment and FDI. Chapter 2 introduces an innovative event-study methodology to identify episodes of investment accelerations, providing detailed evidence of the macroeconomic and distributional dynamics that accompany them. Chapter 4 extends this framework to private investment accelerations, which are particularly important given the critical role private capital needs to play to meet investment needs in EMDEs. The study also provides a detailed assessment of public investment. Using a new identification strategy, chapter 3 quantifies the growth effects of public investment across a large sample of EMDEs.
• Synergies among different types of investment. The book emphasizes synergies among public, private, and foreign direct investment. Rather than treating them in isolation, the book shows how they interact and reinforce one another. For example, it documents that the slowdown in aggregate investment growth since the global financial crisis reflects waning public and private investment growth, driven by weak macroeconomic conditions, institutional weaknesses, and elevated risks. During episodes of investment accelerations, however, public investment, private investment, and FDI often rise together, suggesting that stronger macroeconomic and structural conditions can trigger virtuous cycles.
The book also shows how one type of investment spills over to others. Chapter 3 finds that public investment not only supports growth directly but also builds infrastructure that encourages private capital. Economic growth then boosts domestic investment and attracts foreign inflows, reinforcing the cycle. FDI provides vital
external financing, especially through greenfield projects; however, as chapter 5 shows, the benefits of FDI depend on absorptive capacity—macroeconomic stability, institutions, and openness—often strengthened by public investment in infrastructure and human capital.
• Policy priorities. The final contribution of the study is the articulation of overarching policy lessons. Drawing on cross-country empirical evidence, case studies, and new analyses, the book distills a menu of policy priorities for EMDEs. These priorities include critical interventions at both the national and global levels. In different ways, all chapters find that reforms are most effective when implemented as packages rather than in isolation. Reform packages yield higher payoffs because of strong synergies across different types of investment and reinforcing channels of impact. Domestic policies—such as improving business climates, strengthening governance and fiscal policy frameworks, and investing in human capital—are most effective when combined with global actions to foster openness, resilience, and stable capital flows. In sum, the book underscores that effective investment strategies must be comprehensive, coordinated, and mutually reinforcing to ensure that scarce resources for investment generate the largest possible benefits.
Evolution of investment since 2000
The study provides a detailed account of the evolution of investment in EMDEs, focusing on the period since 2000. It highlights several defining trends: a broad and lasting slowdown in investment growth, a sharp weakening in FDI inflows, a decline in the number of investment accelerations, and a stalling of investment convergence. Overall, the past decade and a half have seen EMDEs transition from an era of rapid capital accumulation to one of prolonged moderation in investment activity, threatening long-term growth and development prospects.
A broad-based, lasting slowdown in investment growth
Investment growth in EMDEs has undergone a marked and enduring deceleration since the global financial crisis. During 2000-09, investment in EMDEs expanded at an average annual pace of about 10 percent. This momentum reflected favorable external conditions, rising global trade integration, and strong domestic reforms in many countries. However, this period of strong growth did not last. Between 2010 and 2024, investment growth in EMDEs averaged only about 5 percent per year, barely half the pace of the 2000s (figure O.3.A).
The slowdown was evident across both private and public investment. Average annual private investment growth dropped from 12 percent in 2000-09 to 7 percent in 201023, while public investment growth fell from 10 percent to 5 percent over this period (figures O.3.B and O.3.C). The slowdown in the 2010s and early 2020s, relative to the 2000s, occurred in all six EMDE regions. Both commodity exporters and importers saw the decline, indicating that global and structural factors have played a large role.
FIGURE O.3 Investment trends in EMDEs
Investment growth in EMDEs has slowed sharply, dropping from about 10 percent in 2000-09 to about 5 percent in 2010-24. Public and private investment growth have slowed by a similar magnitude. FDI inflows to EMDEs—a vital source of private capital and technology spillovers—have declined to about 2 percent of GDP in 2022-23, less than half their peak level in 2008. The frequency of investment accelerations—sustained periods of rapid investment growth—has fallen.
Sources: Investment and Capital Stock Dataset (IMF 2021a); WDI (database); World Bank.
Note: EMDEs = emerging market and developing economies; FDI = foreign direct investment.
A. Investment growth averages are calculated using investment in constant U.S. dollars as weights. Sample includes up to 103 economies, including 68 EMDEs.
B.C. Average annual investment growth, calculated with countries’ investment in constant international dollars as weights. Sample includes 162 economies, of which 125 are EMDEs.
D. Annual medians and interquartile ranges of FDI-to-GDP ratios. Balanced sample of 134 EMDEs.
E. Bars and diamonds show the share of economies starting an investment acceleration during the indicated decade. Sample includes 192 investment accelerations in 93 economies, including 34 advanced economies and 59 EMDEs.
F. Bars show the share of countries starting a private investment acceleration in each decade. Sample includes 68 EMDEs, spanning 85 private investment accelerations between 1960 and 2019. Identification of episodes follows the method described in chapter 2.
B. Private investment growth
A. Investment growth
A sharp weakening of FDI
The slowdown in domestic investment has been compounded by a parallel weakening in FDI inflows to EMDEs. During the boom years of 2000-08, net FDI inflows to EMDEs expanded fivefold, rising from just over $160 billion in 2000 to nearly $800 billion in 2008. As a share of GDP, FDI inflows to a typical EMDE climbed from about 2 percent at the beginning of the 2000s to a peak of almost 5 percent in 2008. This surge lifted EMDEs’ share of global FDI from one-tenth to one-third, underscoring their growing importance as investment destinations. Since the global financial crisis, however, FDI inflows have steadily eroded. By 2022-23, the FDI-to-GDP ratio in EMDEs had fallen to just over 2 percent, more than halving from its 2008 peak (figure O.3.D). The retreat was widespread, with about three-fifths of EMDEs receiving smaller capital inflows as a share of GDP in 2012-23 compared with 2000-11.
Moreover, the distribution of FDI has been highly concentrated. Over two-thirds of FDI inflows to EMDEs in the past decade went to only 10 countries. China alone absorbed about one-third of inflows between 2012 and 2023, while Brazil and India accounted for another one-sixth. By contrast, LICs attracted only 2 percent of all inflows to EMDEs—less than 1 percent of the global total—highlighting the uneven access to foreign capital.
Regional patterns reveal a similar concentration. East Asia and Pacific (EAP) received more than two-fifths of EMDE inflows during 2012-23, followed by one-quarter to Latin America and the Caribbean (LAC) and one-sixth to Europe and Central Asia (ECA). Sub-Saharan Africa (SSA) and the Middle East and North Africa (MNA) remained marginal recipients.
A decline in investment accelerations
A third critical feature of the evolution of investment in EMDEs is the marked decline in the incidence of investment accelerations. These periods of sustained and lasting investment growth have historically played a pivotal role in driving development progress and structural transformation.
Between 1950 and 2022, 115 investment acceleration episodes occurred in 59 EMDEs. On average, EMDEs experienced 1.7 investment acceleration episodes per economy, whereas LICs experienced an average of 1.9—in both cases, fewer than the 2.2 average in advanced economies. Most accelerations lasted 6-10 years, long enough to reshape economies and lift long-term growth trajectories. In EMDEs, the frequency of investment accelerations rose during the latter part of the 20th century and the first decade of the 21st century, supported by rapid globalization, rising commodity prices, and strong reform momentum (figure O.3.E). The 2000s, in particular, were a golden era for EMDEs: nearly half of these economies (48 percent) experienced investment accelerations during the decade.
This trend has since reversed. Between 2010 and 2022, only 23 percent of EMDEs began an investment acceleration. The retreat in investment accelerations in EMDEs
reflects weaker external demand, lower commodity prices, fading trade integration, and rising domestic constraints such as limited fiscal space and slower reform momentum.
Similar results emerge from a parallel study of private investment accelerations. Between 1960 and 2019, 85 private investment accelerations occurred in 52 EMDEs. EMDEs experienced an average of 1.3 private investment accelerations over this period, fewer than the average of 2.0 in advanced economies. During the 1990s and 2000s, the incidence of private investment accelerations increased, peaking in 2000-09, when 35 percent of EMDEs experienced a private investment acceleration. In 2010-19, however, the figure dropped to just 18 percent (figure O.3.F). Given that private investment accounts for roughly 75 percent of total investment in EMDEs, on average, this decline poses a serious challenge for delivering strong growth, robust job creation, and meeting broader development objectives.
For both total investment and private investment accelerations, there were notable regional differences. By both measures, EAP, LAC, and South Asia (SAR) recorded the highest average number of accelerations per economy during the full sample period. MNA and SSA experienced the fewest investment accelerations, and SSA and ECA experienced the fewest private investment accelerations.
A stalling of investment convergence
EMDEs made steady progress on investment convergence during the 2000s, raising their investment per worker as a share of investment per worker in advanced economies from 7 percent in 2000 to 15 percent in 2009 (figure O.4.A).2 Excluding China, the pace of convergence was more measured, with the ratio rising from 8 percent in 2000 to 12 percent in 2009. More worryingly, however, progress nearly stalled during the following decade, reflecting a combination of decelerating investment growth in EMDEs and comparatively faster population growth relative to that in advanced economies. By 2019, investment per worker in EMDEs excluding China had risen to only 14 percent of the level in advanced economies; after a dip during the COVID-19 pandemic, it reverted to 14 percent in 2024.
Among EMDE regions, EAP, ECA, and MNA are closest to the level of investment per worker in advanced economies, while SAR and SSA are the furthest behind (figure O.4.B). Remarkably strong investment growth in China contributed significantly to lifting investment per worker in EAP from an average of 3 percent of that in advanced economies in 1980-89 to 26 percent in 2010-24. MNA experienced especially rapid investment growth in the 2000s, driven by public investment, and raised its investment per worker to 34 percent in 2010-24—the highest among EMDE regions. In LAC, however, an increase in the 2000s was not enough to offset a subsequent decrease, leaving investment per worker relative to that in advanced economies at 19 percent in 2010-24, almost 10 percentage points lower than in 1980-89. Despite progress over
2 Accumulating more capital per worker is an important factor for boosting productivity and innovation, thereby helping EMDEs to reach high-income status (Gill and Kharas 2007, 2015; World Bank 2024).
FIGURE O.4 Investment convergence
EMDEs made steady progress on investment convergence during the 2000s, raising their investment per worker as a share of investment per worker in advanced economies from 7 percent in 2000 to 15 percent 2009. Excluding China, the pace of convergence was more measured, with the ratio rising from 8 percent to 12 percent over the same period. However, progress nearly stalled during the following decade. Among EMDE regions, EAP, ECA, and MNA are the closest to the level of investment per worker in advanced economies, while SAR and SSA are the farthest behind.
A. Investment per worker in EMDEs relative to advanced-economy levels
B. Investment per worker in EMDEs relative to advanced-economy levels, by region
Sources: Haver Analytics; Penn World Table (Feenstra, Inklaar, and Timmer 2015); WDI (database); World Bank.
Note: Sample includes up to 68 EMDEs and 35 advanced economies. EMDEs by region include 8 in EAP, 11 in ECA, 19 in LAC, 9 in MNA, 3 in SAR, and 18 in SSA. EAP = East Asia and Pacific; ECA = Europe and Central Asia; EMDEs = emerging market and developing economies; LAC = Latin America and the Caribbean; LICs = low-income countries; MNA = Middle East and North Africa; SAR = South Asia; SSA = Sub-Saharan Africa.
time in SAR and SSA, these two regions continue to underperform other regions by a wide margin, with investment per worker still less than 10 percent of the level in advanced economies in 2010-24.
Composition of investment over time
The slowdown in investment growth in EMDEs has been accompanied by gradual but important structural changes in its composition. These shifts are evident across four main dimensions: the balance between public and private investment, the rising role of services, the growing importance of intangibles and high-technology investment, and the continued dominance of greenfield FDI in EMDEs.
These differences highlight how uneven the structural transition has been across EMDEs. Some EMDEs are making strides in diversifying investment toward services, intangibles, and technology, but others remain dependent on public capital and resource -based greenfield projects. Bridging this gap will require mobilizing larger volumes of private investment, strengthening institutions, and accelerating reforms to support innovation and integration into global value chains.
Persistent reliance on public investment
Although most investment in both EMDEs and advanced economies is private, EMDEs remain significantly more dependent on the public sector. In 2010-23, private investment accounted for about 75 percent of total investment in EMDEs, on average,
compared with 82 percent in advanced economies (figure O.5.A). In LICs, the private share of investment was even lower during this period—about 63 percent—although it rose by about 6 percentage points compared with the 1990-99 average. On average, in 2010-23, public investment amounted to about 6 percent of GDP in EMDEs, in contrast to 4 percent in advanced economies.
Regional differences are pronounced. Public investment is particularly high in SSA and SAR, where fiscal resources often finance critical infrastructure, while private investment dominates in regions with more developed financial systems, such as EAP and LAC. Despite its importance, average annual public investment growth in EMDEs halved between the 2000s and 2010s—from 10 to 5 percent—marking its slowest pace since the 1990s. Crises have exacerbated this trend, with public investment in EMDEs typically contracting by about 4 percent in recessions.
The rising role of services
The global shift toward services has been mirrored in EMDEs’ investment and FDI patterns. Services now account for more than two-thirds of global GDP and most new job creation. In EMDEs, the transformation is particularly visible in FDI: the share of FDI inflows going to the services sector rose from 45 percent in 2000-04 to almost 65 percent in 2019-23, while the manufacturing share fell from about 45 percent to less than 30 percent (figure O.5.B). During 2019-23, over 60 percent of FDI inflows to EMDEs were directed to services, nearly 20 percentage points higher than in 2000-04.
Regionally, the dominance of services is most pronounced in EAP, which received more than two-fifths of all EMDE FDI inflows during 2012-23. LAC also attracted a rising share of services-oriented FDI, particularly in finance and telecommunications. By contrast, resource-dependent regions such as SSA and MNA continue to rely more heavily on investment in extractives, leaving them more exposed to commodity price cycles.
Slow growth of intangible and high-technology investment
Intangible investment—research and development (R&D), software, and human capital—has expanded in both EMDEs and advanced economies, but at very different speeds. In 2010-19, intangibles accounted for less than one-tenth of total investment in EMDEs, compared with nearly one-fifth in advanced economies (figure O.5.C). The gap widened further during the 2010s, as advanced economies accelerated their shift toward knowledge-based growth. In manufacturing, less than one-third of EMDE investment in 2010-22 went into medium- or high-technology industries, compared with more than one-half of investment in advanced economies.
Regional differences in investment in intangibles and high-technology are stark. EAP, led by China, has made much greater strides in intangible and high-tech investment, whereas SAR and SSA remain heavily reliant on tangible, low-technology capital. Without stronger reforms to foster innovation, improve human capital, and strengthen digital infrastructure, many EMDEs risk falling further behind.
FIGURE O.5 Structure of investment
Despite the increasing share of private investment, EMDEs, especially LICs, still tend to rely relatively more on public investment than advanced economies. The share of total FDI inflows to EMDEs directed to the services sector has increased to about 60 percent in 2019-23. The share of intangible investment in EMDEs has increased more slowly than in advanced economies. EMDEs tend to have a larger share of investment in low-technology sectors. Greenfield investment has accounted for over nine-tenths of FDI inflows to EMDEs since 2000.
A. Share of private investment in total investment
FDI inflows, by sector
Sources: EU KLEMS; Haver Analytics; Investment and Capital Stock Dataset (IMF 2021a); LA KLEMS; United Nations Conference on Trade and Development; WDI (database); World Bank.
Note: EMDEs = emerging market and developing economies; FDI = foreign direct investment; LICs = low-income countries; M&A = mergers and acquisitions.
A. Group median share of private investment in total investment. Sample includes 162 economies, of which 125 are EMDEs.
B. Sample includes up to 97 EMDEs.
C. Bars show sample averages over the respective periods. Sample includes 25 advanced economies and 13 EMDEs.
D. Bars show group medians. Sample includes 36 advanced economies and 125 EMDEs.
Continued dominance of greenfield FDI
FDI inflows to EMDEs remain overwhelmingly greenfield projects—over nine-tenths of total inflows, equivalent to about 2.6 percent of GDP in the median EMDE during 2012-23 (figure O.5.D). By contrast, mergers and acquisitions (M&A) accounted for only 0.1 percent of GDP, reflecting the smaller size of domestic firms and the shallower capital markets in most EMDEs. Greenfield projects directly add to fixed capital and typically generate stronger growth effects.
Regional patterns diverge significantly: in LAC, where large companies and deeper markets exist, M&A activity is somewhat more significant than in other EMDE regions,
B.
D. FDI inflows, by mode
C. Intangible investment
although still far below advanced-economy levels. In contrast, in SSA and LICs, greenfield projects dominate almost entirely, often concentrated in natural resources and infrastructure. Advanced economies present a very different picture: M&A flows are much larger, supported by deeper financial systems and stronger legal frameworks.
Investment drivers and prospects
Multiple factors lie behind the extended slowdown in investment growth across EMDEs since the early 2010s, including global shocks, more binding fiscal constraints, structural weaknesses, and waning global integration. The likely continuation of several near-term headwinds and long-term structural challenges suggests that investment growth in EMDEs will continue to be weak.
Macroeconomic shocks and commodity price volatility
As chapter 1 shows, in EMDEs, on average, investment contracts by about 5 percent in the year of a recession and begins expanding again only three years later (figure O.6.A). During recessions, investor sentiment falls and fiscal resources are eroded, hindering both private and public investment (figure O.6.B). The detrimental effect on investment through sentiment and fiscal channels may be especially large for riskier projects that take years to break even—among them, the infrastructure projects that are crucial for long-run growth and development. In turn, weaker investment further chokes off economic activity, potentially resulting in a self-reinforcing downward spiral.
The two global recessions of the past generation—in 2009, during the global financial crisis, and in 2020, during the COVID-19 pandemic—delivered especially sharp blows. Investment in EMDEs contracted by a similar magnitude in both recessions—about 7 percent in 2009 and 9 percent in 2020—yet the recovery in investment following the pandemic has been far weaker and more protracted (figure O.6.C). Historically, financial crises of various types also tend to be associated with profound declines in investment (figure O.6.D).
For commodity-reliant EMDEs, commodity price developments are an important factor behind decisions by the private and public sectors to undertake investment projects. When prices decline unexpectedly, government revenues typically fall sharply, often forcing retrenchment in public investment programs. Relative to the final decades of the 20th century, commodity price volatility has been consistently higher during 2000-25, reflecting cyclical economic conditions as well as structural shifts such as weather-related disruptions, the energy transition, and rising economic fragmentation (figure O.7.A). During the 2020s, commodity prices have exhibited record levels of volatility, potentially signaling a new era in commodity markets given that the structural drivers of recent volatility are likely to remain (World Bank 2025a). For many commodity-dependent EMDEs, these shocks create repeated cycles of stop-go public investment that undermine long-term development strategies.
FIGURE O.6 Investment around recessions and financial crises
Recessions and financial crises—including debt, currency, and systemic banking crises—have deep and lasting adverse effects on investment growth. In EMDEs, on average, investment contracts by about 5 percent in the year of a recession and begins expanding again only three years later. During recessions, investor sentiment falls and fiscal resources are eroded, hindering both private and public investment. The recovery in investment following the COVID-19 pandemic was far weaker and more protracted relative to the recession associated with the global financial crisis of 2008-09.
Investment in EMDEs around recessions
B. Private and public investment growth in EMDEs around recessions
C. Investment in EMDEs after the 2009 and 2020 recessions
D. Investment in EMDEs around debt, banking, and currency crises
Sources: Haver Analytics; Investment and Capital Stock Dataset (IMF 2021a); WDI (database); World Bank.
Note: EMDEs = emerging market and developing economies.
A. Solid lines show mean investment growth; dashed lines indicate 90 percent confidence bands. Gray area indicates recession years. Sample includes 159 EMDEs over 1970-2019.
B. Solid lines show mean investment growth. Gray area indicates recession years. Sample includes 117 EMDEs over 1970-2019.
C. Lines show Investment-weighted average (at 2010-19 average exchange rates and prices), indexed to 100 in the year before the global recession. Gray area indicates recession years. Sample includes 70 EMDEs.
D. Solid lines indicate mean investment growth. Gray area indicates years when financial crises occurred. Sample includes 159 EMDEs over 1970-2019.
Fiscal conditions
Fiscal weakness has become a major drag on investment, especially public investment. During the global financial crisis and the COVID-19 pandemic, government expenditures to support vulnerable workers and firms were prioritized, resulting in cutbacks and delays in public investment. Historically, public investment has contracted by about 4 percent during recessions in EMDEs, on average, and continued to fall for up to two years after the start of a recession (figure O.6.B).
A.
In addition to cutbacks to public investment during recessions, the last two global recessions left a legacy of substantial public debt accumulation in EMDEs, while other factors contributed to rising debt during the years between the two recessions (Kose et al. 2019; World Bank 2025b). Government debt in EMDEs rose by 5 percentage points of GDP in 2009 alone, and by 10 percentage points in 2020. In the first half of the 2020s, total debt levels in EMDEs averaged almost 45 percentage points of GDP higher than in 2010-19 (figure O.7.B). Rapid debt accumulation, together with rising borrowing costs in recent years, has driven up debt-service costs, reducing the fiscal space available for public investment in areas critical for long-run development. Between 2020 and 2024, long-term interest rates in EMDEs rose from about 5.5 percent to 7.5 percent, raising the cost of capital and debt servicing at precisely the moment when more public investment was needed. With fiscal resources already stretched, governments in EMDEs, and especially LICs, face stark trade-offs between near-term stabilization and longer-term development spending.
High debt levels and rising borrowing costs also put EMDEs at greater risk of debt crises, which are associated with sharp retrenchments in investment. Debt and banking crises in EMDEs have typically been followed by contractions in investment of up to 510 percent, with effects persisting beyond the immediate crisis year (figure O.6.D). In many countries, rising debt-service obligations now consume over one-quarter of government revenues, crowding out the fiscal room needed for productive capital formation to support health, education, and infrastructure.
Domestic business conditions
Beyond shocks and fiscal weakness, domestic business conditions are a critical determinant of investment. Despite progress in previous decades, on average, EMDEs achieved no improvement in their investment climate in 2012-24 compared with 2000-11; and investment conditions, particularly in LICs, remain substantially weaker than in advanced economies (figure O.7.C).
The lack of improvement in the perceived investment climate may be linked to the stalling of reform momentum. After peaking in the 1990s, the number of structural reforms (related to trade, financing, and product markets) implemented per year fell in the 2000s and then more than halved again in the first half of the 2010s. The uncertainty and high level of risk associated with a poor business environment deter domestic private investment and cross-border investment. Insufficient access to finance, high levels of crime and political instability, and tax policy or administration are the most commonly identified biggest obstacles by firms in EMDEs (figure O.7.D). In LICs, infrastructure-related constraints are among the top three obstacles.
Global integration
Diminished global integration has curtailed a critical external impetus for investment in EMDEs. Historically, trade and investment have moved together. Stronger trade integration created markets, fostered technology diffusion, and supported FDI flows, all of which boosted investment. But this virtuous cycle has weakened. Annual growth in
FIGURE O.7 Headwinds to investment
In the 2020s, global commodity prices exhibited record levels of volatility, adversely affecting investment in commodity exporters. Rapid debt accumulation has driven up debt-service costs and reduced fiscal space. EMDEs substantially lag advanced economies in terms of institutional quality and achieved no improvement in their investment climate in 2012-24 compared to 2000-11. Insufficient access to finance, high levels of crime and political instability, and tax policy or administration are the most significant obstacles facing firms in EMDEs. Escalating policy uncertainty and weakening international trade weigh on domestic and foreign investment.
Sources: Baker, Bloom, and Davis (2016); Kose et al. (2022); PRS Group, International Country Risk Guide (ICRG); World Bank.
Note: EMDEs = emerging market and developing economies; LICs = low-income countries.
A. Mean standard deviation of monthly price changes decades, using data spanning January 1970 to September 2025.
B. Debt includes public and private debt. Averages calculated using nominal GDP in U.S. dollars as weights. Sample includes 153 EMDEs.
C. ICRG’s investment profile index. Sample includes 36 advanced economies and 102 EMDEs, of which 18 are LICs.
D. Bars show country group averages, using the latest available data per country. Sample includes up to 128 EMDEs, of which 23 are LICs.
E. Bars show 10-year averages. Trade in goods and services is measured as the average of export and import volumes. Trade growth for 2025 is a forecast.
F. Period averages of the monthly Baker, Bloom, and Davis (2016) economic policy uncertainty index. Last observation is March 2025.
B. Debt in EMDEs
A. Commodity price volatility
D. Biggest obstacles for firms in EMDEs
C. Investment climate
international trade—a critical engine of economic growth—was far weaker in the first half of the 2020s than during either of the two previous decades (figure O.7.E).
Institutional integration has also faltered. The number of new trade agreements fell from an average of 11 per year in the 2000s to just 6 in the 2020s. Similarly, the number of new international investment agreements has more than halved. At the same time, FDI screening mechanisms have proliferated, rising from 17 countries in 2014 to 41 by 2023. Combined with heightened geopolitical risks and escalating policy uncertainty, these trends have raised the costs and risks associated with cross-border investment (figure O.7.F).
For EMDEs, the consequence has been a less supportive external environment. Their share of global investment opportunities has stagnated, and the trade-investment nexus that fueled earlier surges has weakened. In regions such as EAP and ECA, where global value chain participation had been a powerful engine of capital formation, fragmentation is now a structural headwind.
Technological advancement
In the medium to long term, a key determinant of investment growth is likely to be the pace and depth of advances in technology, particularly artificial intelligence (AI). AIrelated investment could provide a significant boost to global capital formation by spurring demand for data infrastructure, software, and related services.3 Available data for EMDEs suggest that the increase in intangible investment associated with a largescale adoption of advanced technology is still in the early stages. Intangibles accounted for about 9 percent of total investment among EMDEs in ECA and LAC in 2010-19, representing an increase of less than 1 percentage point relative to 2000-09.
Investment disappointments
Investment growth in EMDEs has been subject to numerous headwinds during the past decade and a half. Looking ahead, it appears likely that several of those headwinds will continue to hold back prospects for investment growth. Furthermore, historical experience warns against overoptimism about investment prospects. For 2010 and 2022, surveys of private sector forecasters overestimated investment growth in EMDEs by an average of 1.4 percentage points per year, based on 10-year-ahead forecasts (figure O.8.A). Forecast errors were particularly large for ECA and LAC, where average overestimates were more than twice those for EAP and SAR (figure O.8.B). These persistent overestimations suggest that baseline projections for investment in EMDEs may again prove too high.
3 Global capital expenditures surged in early 2025, led by the United States, where tariff-related front-loading and booming technology investment drove strong ICT spending. EMDEs excluding China also recorded a solid, although more modest, increase in capital expenditures, which includes longer-term investments in equipment, software, and capitalized R&D. This transitory boom is expected to cool by late 2025 as front-loaded spending fades and headwinds from weak profits, high interest rates, and uncertainty weigh on investment, keeping capital expenditures closely aligned with subdued global growth prospects.
FIGURE O.8 Investment forecast errors
Investment growth in EMDEs has been subject to numerous headwinds during the past decade and a half. Historical experience warns against overoptimism about investment prospects. For 2010 and 2022, surveys of private sector forecasters overestimated investment growth in EMDEs by an average of 1.4 percentage points per year. Forecast errors were particularly large for ECA and LAC, where average overestimates were more than twice those for EAP and SAR.
A. Investment forecast errors
B. Investment forecast errors, by EMDE region
Number ofyears ahead
Sources: Consensus Economics; World Bank.
ofyears ahead
Note: “Forecast error” is the difference between actual and forecast investment growth; a negative error indicates overoptimism. Lines show GDP-weighted averages (at 2010-19 exchange rates and prices). EAP = East Asia and Pacific; ECA = Europe and Central Asia; EMDEs = emerging market and developing economies; LAC = Latin America and the Caribbean; SAR = South Asia.
A. Data for 13 EMDEs and 21 advanced economies.
B. Data are for 13 EMDEs: 3 in EAP (Indonesia, Malaysia, Thailand), 3 in ECA (Hungary, Poland, Romania), 6 in LAC (Argentina, Brazil, Chile, Colombia, Mexico, Peru), and 1 in SAR (India).
Policy priorities
The investment slowdown across EMDEs is both a domestic and a global policy challenge. Domestically, weaker institutions, policy uncertainty, shallow financial systems, and constrained fiscal space weigh on investment. Globally, fragmentation of trade and investment regimes, rising uncertainty, and increased screening and restrictions dampen cross-border investment flows. Reversing these trends requires comprehensive policy packages—at home and internationally—that strengthen macroeconomic stability, improve the investment climate, and promote cross-border trade and finance flows. Reforms are most effective when bundled and sequenced, and when domestic efforts are reinforced by a rules-based global system and international financial and technical support.
Domestic policies
Reigniting investment in EMDEs requires a coherent domestic agenda that lowers policy uncertainty, strengthens institutions, restores macrofiscal credibility, and reconnects firms to global markets. The evidence throughout this book is clear: countries that combine improvements in the investment climate with credible macroeconomic frameworks and deeper trade and investment integration are far likelier to spark—and sustain—investment upswings. Packages of reforms tend to work best, because they reduce multiple frictions at once, crowd in private capital, and raise the growth payoff of both domestic investment and FDI.
Improve the investment climate
High-quality institutions and a predictable, rules-based business environment are foundational for investment. Across the chapters, a clear message emerges: institutional quality amplifies both the likelihood of investment upswings and their growth payoffs, for domestic investment and FDI. Chapter 1 establishes that total investment and private investment growth both accelerate around improvements in the investment climate in EMDEs. Chapter 2 shows that comprehensive policy packages that improve a country’s primary fiscal balance and expand openness to trade and financial flows raise the probability of igniting an investment acceleration by about 9 percentage points (figure O.9.A). The same package of reforms raises the probability of a private investment acceleration even more—by almost 11 percentage points, as shown in chapter 4.
For private investment (chapter 4), the constraints reported by firms—uncertain regulations and taxes, weak contract enforcement, limited access to finance, and infrastructure gaps—are classic symptoms of institutional weaknesses. Structural reforms that target such constraints can help reverse course. On average, major structural reforms targeting trade, financing (external and domestic), and product markets boost private investment by a cumulative 2.2 percent over three years (figure O.9.B).
Furthermore, chapter 4 finds that the effects of reforms are larger when they are implemented together. When reforms to promote greater trade openness are implemented strictly in the absence of other reforms within three years, the cumulative effect on private investment is negative for the entire horizon from two to five years after reform implementation (figure O.9.C). However, the effect is positive at every time horizon through five years when a trade reform is implemented alongside a complementary structural reform. Case studies on Colombia, India, the Republic of Korea, and Türkiye suggest that, when regulatory predictability improves and market access expands, private investment responds quickly and durably.
Chapter 3 studies the role of the public investment efficiency, itself shaped by the domestic institutional environment, in boosting the growth effects of public investment. The estimates suggest a greater effect on GDP in response to public investment shocks in EMDEs with the highest efficiency, culminating in an increase in output of about 1.6 percent after five years—a half-percentage point higher than the effect of public investment in EMDEs with the lowest efficiency (figure O.9.D).
Similar results appear in chapter 5, which finds that an investor-friendly business environment in the recipient economy is critical for attracting FDI. The results show that an improvement in the investment climate or institutional quality from the median to the highest quartile of the global sample is associated with a large increase in FDI inflows, by about one-fifth (figure O.9.E)
Empirical analysis in chapter 5 indicates that a 10 percent increase in FDI inflows is associated with a 0.3 percent increase in real GDP after three years in EMDEs, on average. However, the growth impact rises to about 0.8 percent in countries with stronger institutions, lower informality, better human capital, and greater trade openness
FIGURE O.9 Institutions, reform complementarity, and investment
Major structural reforms raise the probability of investment accelerations by about 9 percentage points and boost private investment by 2.2 percent over three years. Public investment effects on GDP are much greater in countries with higher investment efficiency, reaching 1.6 percent after five years. Institutional quality is crucial for attracting FDI and maximizing its growth effects. A 10 percent increase in FDI inflows can raise output by 0.8 percent after three years in countries with stronger institutions, lower informality, better human capital, and greater trade openness.
A. Change in the probability of an investment acceleration following reforms in EMDEs
B. Impact of major structural reforms on private investment in EMDEs
Impact of trade reform on private investment in EMDEs
Effect of a 1 percent of GDP increase in public investment on output in EMDEs
E. Effect of an improvement in institutions on FDI inflows in EMDEs
F. Impact of FDI inflows on output in EMDEs
Sources: PRS Group, International Country Risk Guide (ICRG); WDI (database); World Bank.
Note: EMDEs = emerging market and developing economies; FDI = foreign direct investment.
A. Bars show the increase in the probability of an investment acceleration following a 1-standard-deviation improvement in economic policy. Right bar shows the combined impact of increasing all three policy variables by 1 standard deviation.
B. Line shows the cumulative increase in private investment, in percent, following a reform. Shaded area shows 90 percent confidence bands. The reform indicator is the average sum of the domestic and external financing, trade, and product market reform indicators.
C. Lines show the accumulated percent change in private investment following a major structural reform. “Complementary reforms” are structural reforms implemented within three years of trade reforms.
D. Bars show the peak increases over a five-year horizon of the output level relative to the year before the shock, in percent. High and low investment efficiency samples correspond to the top and bottom quartiles of a public infrastructure efficiency index (IMF 2021b).
E. Bars show marginal effects on FDI inflows of an increase from the sample median to the top quartile of ICRG law and order and investment profile indexes, based on gravity model estimates.
F. Estimated average
on
lines show the effect for the top
of countries with better structural characteristics. Dashed lines show 90 percent confidence bands.
D.
C.
(figure O.9.F). These complementarities also appear during investment accelerations. In EMDEs, median investment growth rises from 3.2 to 10.4 percent, output growth from 4.2 to 5.9 percent, and total factor productivity (TFP) growth from 0.8 to 1.7 percent. During these periods, poverty falls faster and inequality eases. In other words, the investment climate (rule of law, contract enforcement, anticorruption, and regulatory quality) and complementary capabilities (education, skills, and digital readiness) are not peripheral. They are the core enablers that convert domestic investment and FDI inflows into sustained productivity and income gains.
The book emphasizes a series of policy interventions to improve the domestic investment climate. EMDEs would benefit from overhauling critical aspects of public investment management, such as procurement, execution, and evaluation. They should bolster judicial capacity and contract enforcement; simplify firm entry, taxation, and compliance; modernize insolvency and secured-transactions frameworks to unlock credit; protect intellectual property to spur intangible investment; and ensure stable, transparent regulatory processes.
Safeguard macroeconomic stability and rebuild fiscal space
Investment is highly sensitive to macroeconomic risk. Chapter 1 documents sharp, persistent investment contractions around recessions and financial crises. Chapter 2 links accelerations to improved macrofiscal settings. Chapter 3 shows that, for public investment to catalyze growth, fiscal space and government efficiency are critical. On average, increasing public investment by 1 percent of GDP raises output by 1.1 percent after five years. However, in countries with ample fiscal space or high public investment efficiency, the impact rises to about 1.6 percent; in low-efficiency and high-debt contexts, effects are small and statistically insignificant. Public investment also crowds in private investment. A 1 percent of GDP increase in public investment is associated with up to a 2.2 percent rise in private investment after five years, alongside medium-term gains in labor productivity (1.9 percent) and TFP (0.8 percent).
Given that fiscal space has become more constrained in many EMDEs as the stock of debt and borrowing costs have risen, rebuilding buffers is a prerequisite for credible public investment pushes. That calls for medium-term fiscal frameworks anchored in sustainability; durable increases in domestic revenue via improved tax administration and base broadening; expenditure reviews to reallocate from low-value current spending to growth-enhancing investment; and better debt management to reduce rollover and interest-rate risk. Monetary policy credibility—establishing independent central banks and anchoring inflation expectations—reduces macro uncertainty and the cost of capital, supporting both domestic investment and external financing. Well-designed fiscal rules and stabilization funds with strong institutional frameworks are particularly important for commodity exporters, helping mitigate the volatility and procyclicality issues associated with exposure to global commodity market fluctuations (Fatas, Gootjes, and Mawejje 2025; Gill et al. 2014).
Policy interventions to safeguard macroeconomic stability and rebuild fiscal space have multiple dimensions. EMDEs need to adopt medium-term fiscal and debt anchors, strengthen revenue mobilization and public financial management, enhance public investment efficiency through transparent project pipelines and rigorous cost-benefit analysis, protect maintenance budgets to preserve capital, and maintain credible, antiinflation monetary frameworks.
Promote trade and investment integration
Integration—through trade openness, participation in value chains, and investment agreements—has powerful effects on both domestic investment and FDI.4 Chapter 5 finds that investment treaties increase bilateral FDI by more than two-fifths on average. Yet the global environment has become less supportive. Trade growth slowed to its weakest pace since 2000, the number of new trade agreements and new investment agreements more than halved relative to the 2000s, and FDI screening mechanisms have proliferated. Against this backdrop, domestic reforms that reduce behind-the-border barriers take on added importance. Priorities include simplifying customs and logistics, digitalizing border and standards procedures, aligning regulations with international norms, reforming regulation of services that underpin value-chain participation (finance, ICT, logistics), and strengthening competition policy to prevent market foreclosure.
For FDI specifically, EMDEs should complement openness with enabling conditions. Priorities include raising human capital and firm capabilities to capture positive spillovers, deepening financial systems to mobilize domestic co-investment, and targeting greenfield projects that address infrastructure bottlenecks, the energy transition, and digital connectivity—areas with strong crowd-in effects and high social returns.
Policy priorities to promote trade and investment integration require EMDEs to focus on several key interventions. These interventions include reducing trade and investment restrictions, accelerating regulatory reforms to promote services and connectivity, undertaking deep cross-border trade and investment agreements, and building last-mile capabilities (standards, certification, and logistics) to translate openness into actual firm-level participation.
Global policies
Although domestic reforms are the first line of defense against slowing investment, the global environment plays an equally decisive role. Over the past decade, EMDEs have faced rising headwinds from a retreat in trade and financial integration, greater policy uncertainty, and more frequent geopolitical tensions. These shifts have weakened FDI inflows, curtailed access to affordable capital, and reduced opportunities for technology transfer and productivity growth.
4 For details on these issues, refer to Adarov and Stehrer (2021) and Qiang, Liu, and Steenbergen (2021).
To reverse these trends, the international community needs to redouble efforts to preserve a predictable, rules-based system for cross-border trade and investment, mobilize large-scale financial resources to close widening investment gaps (especially in LICs), and provide the technical support needed to strengthen implementation capacity. Only through stronger multilateral cooperation can many EMDEs unlock the scale of investment required to deliver better development outcomes.
Preserve and strengthen a rules-based international system
EMDE investment prospects depend on predictable cross-border rules. The retreat in global integration—fewer new trade and investment agreements, greater policy uncertainty, rising FDI screening and restrictions, and geopolitical tensions—has reduced FDI flows and raised risk premiums. A renewed commitment to multilateral rules for trade and investment would reduce uncertainty and revive the channels through which capital, technology, and know-how flow. Given the strong co-movement between FDI and trade (correlation reaches as much as 0.8 in EMDEs), revitalizing rules brings dual benefits.
In the context of FDI, international cooperation should prioritize three areas. First, policy makers need to update World Trade Organization-consistent disciplines for digital trade and services, where FDI is increasingly concentrated. Second, they should promote transparency and proportionality in FDI screening to minimize chilling effects. Third, they should encourage modern bilateral and plurilateral investment frameworks that protect investors while preserving host country regulatory space for legitimate public objectives (climate, competition, labor, and consumer protection).
Expand global financial support for EMDEs, especially for LICs
Investment needs are vast, with particularly acute infrastructure and human capital gaps in LICs. Public investment can cover about one-third of aggregate needs even under ambitious domestic reforms; the rest must come from private capital and scaled-up international finance. Multilateral development banks, bilateral agencies, climate funds, and innovative blended-finance platforms have a critical role in de-risking high-impact projects, catalyzing private co-investment, and lowering the cost of capital for green and resilient infrastructure.
Support should be better targeted to country contexts. These include concessional windows for LICs and economies in FCS; guarantees and first-loss tranches for commercially viable but risk-perceived projects; and programmatic lending that links disbursement to reforms in public investment management, corporate governance, and competition policy—areas that raise the productivity of capital.
Provide technical support and policy advice to build capacity
Implementation capacity is a binding constraint in many EMDEs, especially LICs and economies in FCS (chapter 5). Multilateral institutions can magnify the impact of domestic reforms through sustained technical assistance in public investment management (project selection, appraisal, procurement, and contract management), tax admin-
istration, debt management, and regulatory modernization. Just as important, advisory support should help countries design credible reform sequences and build data systems to monitor progress. Where human capital and administrative capabilities are limited, long-term, embedded support—paired with peer-learning platforms—can accelerate institutional convergence and raise the returns to both domestic and foreign investment.
Interactions and complementarities: The importance of reform packages and sequencing
A striking lesson from the evidence presented in the book is that reforms are not additive; they are multiplicative. Chapters 2 and 4 show that, when countries simultaneously improve macro-fiscal settings and external openness, the probability of an investment acceleration rises substantially, by approximately 10 percentage points. Chapter 3 demonstrates that the same amount of public investment can generate output gains in EMDEs that are almost 50 percent higher, on average, when fiscal space is ample and investment efficiency is high than when those conditions are not present. Chapter 4 documents that structural reforms—product markets, external finance, and trade— deliver larger, more durable private investment gains when implemented as a package. Chapter 5 finds that the same amount of FDI inflows boosts output nearly three times as much when institutional quality, human capital, and openness are relatively high, as when those factors are relatively low.
These complementarities imply three operational principles:
• Sequence for credibility and impact. First, stabilize the macro-fiscal framework and anchor inflation expectations. In parallel, strengthen institutional “plumbing” (procurement, judiciary, and tax administration) to boost reform credibility. Then, enhance product, trade, and capital-account regulatory conditions to unlock private investment and FDI. Early “quick wins” in logistics and customs, one-stop shops, and clearing arrears can crowd in private activity while deeper reforms take hold.
• Bundle reforms to unlock crowd in. Pair public investment scale-up with measures that expand fiscal space and raise efficiency (transparent pipelines and rigorous appraisal). Doing so ensures that it mobilizes private capital (public-private partnerships, where appropriate) and lifts productivity (digital, health, education, and renewable energy). Combine trade and investment openness with domestic capability building (skills, standards, and finance) to enable faster integration of firms into cross-border value chains.
• Leverage global support to sustain domestic momentum. Concessional finance and guarantees can bridge near-term fiscal and risk constraints, making reform benefits visible sooner. Technical assistance raises the probability that reforms move from law to implementation, especially in capacity-constrained settings. A rules-based international system reduces the variance of payoffs and risks facing investors and policy makers alike.
Reaccelerating investment in EMDEs will not happen through a single lever. The domestic policy agenda must proceed on several fronts: improving the investment climate, securing macroeconomic stability and fiscal space, and rebuilding trade and investment integration must proceed together. The global agenda must reinforce those national efforts by reinvigorating a rules-based system, scaling financial support (especially for LICs), and providing deep, sustained technical assistance. When these measures are packaged and appropriately sequenced, their effects compound. Public investment crowds in the private sector; FDI delivers technology and managerial spillovers; productivity rises; and countries are more likely to experience the investment accelerations that historically coincide with stronger job creation and improved development outcomes.
Synopsis
The book includes five chapters, each providing a distinct angle on investment. Each chapter reviews trends in EMDEs—disaggregated by regions and other relevant groupings—presents empirical analyses that address multiple policy-relevant questions, and concludes with a summary of key policy priorities. Chapter 1 focuses on investment trends and drivers in EMDEs. Chapter 2 investigates the incidence and outcomes of periods of sustained investment accelerations. Chapter 3 examines the role of public investment in fostering economic growth and crowding in private investment, and it reviews policies that facilitate public investment and its macroeconomic effects. Chapter 4 assesses the key obstacles to private investment and the structural reforms needed to overcome them. Chapter 5 turns to the trends, drivers, and implications of FDI.
Chapter 1. Investment Trends, Structure, and Drivers in EMDEs
In chapter 1, Adarov and Stamm set the stage for the remainder of the book by examining how investment growth and the structure of investment in EMDEs have changed over the past several decades, using multiple measures. They explore the drivers of investment with the goal of informing the policy debates about how to accelerate investment. The chapter addresses three questions:
• How have global investment and its composition evolved over the past decades?
• What are the differences in investment patterns among EMDEs?
• What are the main drivers of investment?
Contributions. Chapter 1 makes a number of contributions. First, it provides a comprehensive assessment of investment trends with a focus on EMDEs, discussing heterogeneity across regions and types of economies. Previous studies have mostly reviewed investment trends in a global context (IMF 2014, 2015; OECD 2025; World Bank 2017). Second, the analysis provides a breakdown of the structure of investment in EMDEs, including public and private investment, sectoral patterns, and the composition by tangible and intangible capital assets. ird, the chapter analyzes the dynamics of investment around adverse events, with a particular focus on recessions and financial
crises. Fourth, the analysis takes a comparative perspective on the capital intensity of developing economies and examines long-run convergence patterns. Finally, the chapter identifies the drivers of investment in EMDEs, distinguishing between public and private investment, building on a literature that largely investigates the determinants of total investment.5
Findings. Chapter 1 offers the following main findings:
Investment growth in EMDEs slowed considerably after the global financial crisis. Average annual investment growth declined from nearly 10 percent in 2000-09 to about 5 percent in 2010-24 (figure O.10.A). The deceleration of investment growth in EMDEs occurred in all regions and was especially strong in commodity-exporting countries (figure O.10.B). Both public and private investment growth in EMDEs weakened during this period, to approximately half of the 2000-09 average (figures O.10.C and O.10.D).
The slowdown in investment growth in EMDEs has been accompanied by a gradual structural transition in the composition of investment—namely, a shift toward intangibles—while the ratio of private and public investment as a share of total investment has remained stable. Private investment was equivalent to 75 percent of total investment in EMDEs in 201023, on average, almost unchanged from the average in 2000-09. EMDEs with available data also show a small shift toward intangibles, such as R&D, software, and intellectual property, although this transition has been occurring far more slowly than in advanced economies. The intangible portion of total capital investment amounted to less than one-tenth in EMDEs in 2010-19, in contrast to almost one-fifth in advanced economies.
After registering strong gains during the 2000s, convergence of investment per worker in EMDEs excluding China toward the level in advanced economies has stalled since the early 2010s. Investment per worker in EMDEs excluding China stands at about 14 percent of the level in advanced economies (figure O.10.E). In LICs, the ratio is only 3 percent. Lack of progress in investment per worker is one of the factors hindering catch-up in per capita incomes with the level of advanced economies. In two EMDE regions, LAC and SSA, investment per worker was even lower, on average, during 2010-24 than in 198089. Even in the regions where investment per worker is highest and has risen substantially over decades—EAP, ECA, and MNA—it still lags the level of advanced economies, by far.
Recessions and financial crises are associated with deep, prolonged investment contractions in EMDEs. In EMDEs, on average, investment contracts by about 5 percent in the year of a recession and begins expanding again only three years after the onset of the recession. Currency, sovereign debt, and banking crises are also associated with a strong negative impact on investment, although investment tends to recover faster after these crises compared with recessions. The global recession triggered by the COVID-19 pandemic
5 For example, refer to Garcia-Escribano and Han (2015); Lim (2014); Qureshi, Diaz-Sanchez, and Varoudakis (2015); Shapiro, Blanchard, and Lovell (1986); and Stamm and Vorisek (2023).
FIGURE O.10 Investment trends and drivers
Investment growth in EMDEs has experienced a major slowdown since the 2009 global recession, declining from about 10 percent in 2000-09 to about 5 percent in 2010-24. The decline was broadbased, affecting all regions. Both public and private investment growth weakened significantly. The convergence of investment per worker has stalled. Among the key drivers of investment growth in EMDEs are output growth, financial development, trade openness, fiscal sustainability, and investment risk.
A. Investment growth
B. Investment growth, by EMDE region
Sources: Haver Analytics; Investment and Capital Stock Dataset (IMF 2021a); WDI (database); World Bank.
Note: AEs = advanced economies; EAP = East Asia and Pacific; ECA = Europe and Central Asia; EMDEs = emerging market and developing economies; LAC = Latin America and the Caribbean; LICs = low-income countries; MNA = Middle East and North Africa; SAR = South Asia; SSA = Sub-Saharan Africa.
A. Shaded areas depict global recession years, following Kose, Sugawara, and Terrones (2020).
B.C. Average annual investment growth, calculated using countries’ investment in constant international dollars as weights. Sample includes 162 economies, of which 125 are EMDEs.
D. Bars show weighted averages with countries’ real annual investment in constant U.S. dollars as weights.
E. Lines show investment per worker in EMDEs and EMDEs excluding China relative to advanced economy ratios.
F. Estimated impact of explanatory variables (excluding GDP growth) on investment growth in up to 50 EMDEs. Bars show the contribution of each explanatory variable to predicted investment growth based on regression results in annex table 1A.1. Chart shows only explanatory variables with a statistically significant coefficient at the 10 percent level or better.
D. Public investment growth
C. Private investment growth
had a stronger effect on investment in EMDEs than the global recession during the 2008-09 global financial crisis. Excluding China, which was more resilient, investment declined by about 9 percent in EMDEs in 2020, compared to 7 percent in 2009. The investment recovery in EMDEs following the 2020 recession was also weaker than the recovery following the 2009 recession.
Investment growth in EMDEs, especially private investment growth, is strongly correlated with output growth dynamics, as well as with financial, trade, and institutional conditions. Specifically, private investment growth is found to be facilitated by credit growth, greater openness to trade and capital flows, and conducive fiscal conditions, whereas public investment is supported by trade openness and hindered by uncertainty (figure O.10.F). However, these factors have provided diminishing support for investment growth since the global financial crisis. A second empirical exercise finds that both total and private investment growth in EMDEs accelerate around institutional reform spurts, and that the acceleration in private investment is sustained for longer in such instances.
Chapter 2. The Magic of Investment Accelerations
In chapter 2, de Haan, Stamm, and Yu investigate investment accelerations in EMDEs. Investment accelerations are associated with a multitude of beneficial economic effects, including faster output growth, creation of new jobs, and productivity improvements. The chapter documents the incidence of investment accelerations in EMDEs and presents insights about the policies and conditions that trigger such accelerations. It focuses on three questions:
• What are the main features of investment accelerations?
• What are the key macroeconomic and development outcomes associated with investment accelerations?
• What policy interventions are most likely to spark investment accelerations?
Contributions. Building on the literature identifying accelerations in real GDP per capita, chapter 2 provides a novel focus on investment accelerations, extending research on output growth accelerations (Hausmann, Pritchett, and Rodrik 2005; Jong-A-Pin and de Haan 2011) and aggregate investment accelerations (Hoyos, Libman, and Razmi 2021; Libman, Montecino, and Razmi 2019). The event-study approach employed here tracks the occurrence of investment accelerations in a large set of EMDEs over seven decades, from 1950 to 2022. The chapter presents a comprehensive analysis of the evolution of key macroeconomic and financial variables during investment accelerations, including capital accumulation, TFP growth, and employment growth. It also studies how some key macroeconomic and financial indicators—such as fiscal balances, trade, exchange rates, and credit—evolve around investment accelerations; and it analyzes the association between investment accelerations and development outcomes, such as changes in poverty and inequality. Finally, the chapter uses empirical exercises and case
studies of 10 EMDEs to analyze the linkages between institutional environments, policies, and investment accelerations.
Findings. Chapter 2 provides the following key findings:
Investment accelerations have occurred in many EMDEs, but they have become less common. The chapter identifies 115 investment accelerations in 59 EMDEs during 1950-2022. On average, the probability that an EMDE experienced an investment acceleration in any decade is 40 percent (figure O.11.A). During 2000-09, about half of EMDEs experienced an investment acceleration. By 2010-22, the share dropped to one-quarter. In parallel, the external environment became less supportive and the domestic reform momentum of the early 2000s diminished. For an advanced economy, the probability of an investment acceleration occurring was unchanged between 2000-09 and 2010-22.
Faster investment growth is often driven by both the public and private sectors. The median annual growth of investment is 10.4 percent in EMDEs during investment accelerations, slightly more than three times the growth rate of 3.2 percent in other years (figure O.11.B). During many episodes, public and private investment both accelerate. The extent of the increase in public and private investment growth around investment accelerations has been similar across EMDE regions.
Investment accelerations often coincide with periods of transformative growth. During investment accelerations, output growth in EMDEs reaches 5.9 percent per year, 1.9 percentage points higher than in other years (figure O.11.C). This rapid growth rate translates into a GDP expansion by almost two-fifths over six years, almost one-and-ahalf times the median expansion during a comparable period outside investment accelerations. Investment accelerations boost capital accumulation, increase employment growth, and strengthen productivity growth. A typical investment acceleration in EMDEs is associated with an increase of almost 1.3 percentage points in TFP growth, compared with slightly above zero in other years. Because investment accelerations support faster shifts of resources from less productive sectors to more productive sectors, they also tend to coincide with faster employment and output growth in the manufacturing and services sectors. Investment accelerations are also frequently accompanied by improved fiscal balances and higher export growth and FDI inflows, and they are more likely in the presence of good institutions (figures O.11.D and O.11.E). Further, investment accelerations tend to coincide with better development outcomes, including faster poverty reduction (figure O.11.F).
Policy interventions help to ignite investment accelerations. Policies that improve macroeconomic stability—such as fiscal consolidations and inflation targeting—and structural reforms, including measures that ease cross-border trade and financial flows, have been instrumental in sparking investment accelerations. Although individual policy interventions have played a role, country-specific comprehensive packages of policies fostering macroeconomic stability and addressing structural issues tend to be more potent in driving investment accelerations. When a country’s primary fiscal balance and openness to trade and financial flows substantially improve, the probability of igniting an invest-
FIGURE O.11 Investment accelerations
The frequency of investment accelerations—sustained periods of rapid investment growth—has fallen. The share of EMDEs starting an acceleration fell sharply in 2010-22 compared with the 2000s. Investment accelerations are associated with significantly higher output and productivity growth, among other beneficial macroeconomic outcomes, as well as better development outcomes.
A. Investment accelerations, by decade
B. Investment growth around accelerations
C. GDP and productivity growth around investment accelerations
D. Trade and FDI around investment accelerations
F. Poverty rate around investment accelerations in EMDEs
Sources: Haver Analytics; International Financial Statistics; Penn World Table (Feenstra, Inklaar, and Timmer 2015); PRS Group, International Country Risk Guide (ICRG); WDI (database); World Bank.
Note: EMDEs = emerging market and developing economies; FDI = foreign direct investment; RHS = right-hand side; TFP = total factor productivity.
A. Bars and diamonds show the share of countries starting an investment acceleration during the corresponding decade. The red line shows the long-run average share of countries starting an investment acceleration over the past seven decades.
B. Bars show medians during accelerations. Markers show medians in all nonacceleration years. “Before” refers to the six years before an acceleration. “During” refers to the full duration of accelerations. Sample includes the 34 advanced economies and 59 EMDEs that experienced an acceleration between 1950 and 2022.
C.D. Bars show medians during accelerations. Markers show medians in all nonacceleration years.
E. Bars show the predicted probability of an investment acceleration at different levels of the lagged ICRG law and order index.
Whiskers indicate 90
F. Bars show the median annual change in the poverty
ment acceleration increases by 9 percentage points. Case studies of 13 investment accelerations in 10 economies, such as Morocco in the late 1990s and 2000s and Türkiye in the early 2000s, illustrate the potential efficacy of comprehensive policy packages. High-quality institutions, such as a well-functioning and impartial legal system, are critical for the success of policy interventions in starting investment accelerations. The likelihood of investment accelerations and the ultimate impact of policy reforms have been greater in countries with better institutions.
Chapter 3. Public Investment as a Catalyst of Economic Growth
In chapter 3, Adarov, Clements, Jalles, Khadan, Perevalov, and Sugawara focus exclusively on public investment. Public investment can be a powerful policy lever to help ignite growth, including by helping to catalyze private investment. Like total investment, however, public investment growth in EMDEs has slowed. The chapter identifies structural conditions that are conducive to greater effectiveness of public investment. Based on these results and an assessment of macroeconomic challenges faced by EMDEs, it develops a set of policy priorities to facilitate public investment and maximize its positive effects. To delve into these issues, the chapter addresses the following questions:
• How has public investment evolved in EMDEs?
• What is the impact of public investment on output and private investment?
• What policies can EMDEs adopt to bolster public investment and harness the benefits from it?
Contributions. First, chapter 3 provides a thorough assessment of public investment trends in EMDEs, including in different regions and types of economies. Second, it estimates the effects of public investment on output—known as the public investment multiplier—using a new approach to identify public investment shocks. Empirical analysis also identifies the macroeconomic conditions and structural characteristics that boost the effects of public investment on private investment, productivity, and potential output. This analysis extends empirical evidence in the literature, largely focused on advanced economies, to a comprehensive analysis focusing on EMDEs.6 Additional analysis estimates the capacity of EMDEs to ramp up government spending on investment given the fiscal constraints. Third, the chapter provides a high-level summary of policies to boost public investment in EMDEs and to maximize its positive macroeconomic effects.
Findings. Chapter 3 provides the following key findings:
Public investment growth in EMDEs has slowed sharply, halving from an average of 10
6 For empirical evidence, refer to Auerbach and Gorodnichenko (2013); Eden and Kraay (2014); Furceri and Li (2017); Ilzetzki, Mendoza, and Végh (2013); Izquierdo et al. (2019); Jong-A-Pin and de Haan (2008); Leduc and Wilson (2012); and Romp and de Haan (2007).
percent per year over 2000-09 to about 5 percent over 2010-23. Although public investment growth has slowed in both EMDEs and advanced economies compared to the pace of the 2000s, public-investment-to-GDP ratios are still larger in EMDEs. Public investment comprised about 6 percent of GDP in EMDEs during 2010-23, compared with 4 percent in the median advanced economy (figure O.12.A). LICs and commodityexporting EMDEs tend to have higher investment-to-GDP ratios than other EMDEs.
Public investment provides the strongest boost to output when it occurs in countries with ample fiscal space and high government efficiency. Effective public investment can stimulate economic growth in EMDEs. On average, in EMDEs, scaling up public investment by the equivalent of 1 percent of GDP leads to an increase in output of 1.1 percent after five years (figure O.12.B). However, the effectiveness of public investment to raise output hinges on government efficiency and fiscal space. In countries with higher public investment efficiency or low fiscal sustainability risk, an increase in public investment equivalent to 1 percent of GDP increases output by up to 1.6 percent over five years, about half a percentage point higher than in other EMDEs (figure O.12.C). In countries with low public investment efficiency and high public debt, the output effects of public investment are positive but not statistically significant.
Public investment can help mobilize private investment, enhance productivity, and generate potential output gains. Public investment can have significant crowding-in effects on private investment. In EMDEs, an increase in public investment equivalent to 1 percent of GDP is associated with an increase in private investment by up to 2.2 percent after five years, on average, and an increase in labor productivity and TFP over the medium term by 1.9 percent and 0.8 percent, respectively (figure O.12.D). An increase in public investment by 1 percent of GDP raises potential output by up to 1.1 percent over the same horizon. These results offer empirical support for the arguments in favor of the long-run, supply-side transmission channels of public investment.
Even with significant fiscal efforts, the public sector can provide only a limited share of the investment needed in EMDEs. Model simulations suggest that public investment can cover about one-third of the aggregate investment gap in EMDEs (figure O.12.E). In some regions, including SAR and SSA, that share is even less. However, even a relatively modest increase in public investment would require significant domestic revenue mobilization efforts complemented by reallocation of fiscal resources toward investment spending and debt financing. This makes private capital mobilization critical to bridge the investment gaps.
Policy interventions to boost public investment and reap its benefits depend on country circumstances; broadly, however, EMDEs should prioritize a “three Es” package. First, they must expand their fiscal space, whether through reforms to improve tax collection efficiency, enhance fiscal frameworks, or curtail unproductive spending. Limited fiscal space impedes the ability of a government to scale up public investment. Second, EMDEs need to improve lagging public investment efficiency (figure O.12.F). Reducing corruption, improving governance, and expanding the capacity of fiscal administration are critical and can be complemented by initiatives to prioritize public investment in
FIGURE O.12 Public investment
EMDEs remain more reliant on public investment than advanced economies. The positive impact of public investment on output is stronger in economies with ample fiscal space and efficient public investment. EMDEs could feasibly fill one-third of their investment gaps through domestic revenue mobilization, spending reallocation, and borrowing. Policy reforms to improve structural and fiscal conditions are needed to maximize the macroeconomic benefits of public investment.
A. Public investment as a share of GDP, 2010-23
B. Impact of a 1 percent of GDP increase in public investment on output
Impact of a 1 percent of GDP increase in public investment on output, by initial conditions
Impact of a 1 percent of GDP increase in public investment on macroeconomic variables
Sources: Haver Analytics; Investment and Capital Stock Dataset (IMF 2021a); Kose et al. (2022); Oxford Economics; World Bank.
Note: commod. = commodity; EAP = East Asia and Pacific; ECA = Europe and Central Asia; EMDEs = emerging market and developing economies; LAC = Latin America and the Caribbean; LICs = low-income countries; MNA = Middle East and North Africa; SAR = South Asia; SSA = Sub-Saharan Africa.
A. Bars show medians and whiskers show interquartile ranges. Sample includes up to 37 advanced economies and 125 EMDEs.
B. Line shows the change in real GDP relative to the year before the shock; t = 0 is the year of the shock. Shaded area shows 90 percent confidence bands, based on standard errors clustered at the country level.
C.D. Bars show change in the indicated variables relative to the year before the shock, at the 5-year horizon.
C. *** indicates statistical significance at the 1 percent level. Large and small fiscal space estimates are based on local projections results. “High-efficiency” and “low-efficiency” are the top and bottom quartiles of the public infrastructure efficiency index (IMF 2021b).
D. Whiskers indicate 90 percent confidence intervals.
E. Bars show 10-year averages of GDP-weighted EMDE and regional averages. Markers show investment gaps based on Rozenberg and Fay (2019).
F. Bars show group medians. Sample includes 27
and 93 EMDEs, of which 15 are LICs.
D.
C.
projects with the greatest potential to spark long-term productivity gains, such as in health care, education, digital networks, and renewable energy infrastructure. Third, public investment in EMDEs can be enhanced through global support. Coordinated financial support and effective technical assistance are imperative for accelerating structural reforms, reducing vast infrastructure gaps, and addressing climate change.
Chapter 4. Reinvigorating Private Investment: Policy Options
In chapter 4, Chrimes, Lebrand, and Mawejje focus on policy priorities to facilitate private investment in EMDEs. A massive private investment push is critical for achieving development goals and generating jobs, yet investment has slowed in recent years. Reversing this trend and reinvigorating investment are key challenges for policy makers. This chapter considers policies that could incentivize stronger growth of private investment in EMDEs—especially relevant against the current backdrop of increasing use of protectionist trade and industrial policies. It addresses the following questions:
• What are the constraints on private investment growth in EMDEs?
• How can structural reforms catalyze private investment growth?
• What other policies should be considered to boost private investment growth sustainably?
Contributions. First, chapter 4 documents trends in investment growth since 2000 and reviews the constraints on private investment, informed by recent evidence and the broader literature. Second, the chapter provides empirical analysis of the magnitude of different structural reforms affecting private investment in EMDEs. This analysis contributes to the literature on the drivers of investment by focusing specifically on private investment (IMF 2015; Kose et al. 2017; Lim 2014). Third, it extends the analysis on investment accelerations in EMDEs in chapter 2, focusing here on only private investment in EMDEs, extending the literature on output growth accelerations (Hausmann, Pritchett, and Rodrik 2005; Jong-A-Pin and de Haan 2011) and on aggregate investment accelerations (Hoyos, Libman, and Razmi 2021; Libman, Montecino, and Razmi 2019). Finally, the chapter provides an overview of policy options to support private investment growth, recognizing the complexity of the challenges and considering approaches that have succeeded in specific contexts.
Findings. The chapter offers the following main findings:
Firm surveys identify a range of constraints to private investment. Insufficient infrastructure, poor-quality tax administration and other institutional conditions, and limited access to finance are prominent constraints for firms in EMDEs (figure O.13.A). A much larger share of firms report these constraints in EMDEs than in advanced economies. At the same time, investors perceive EMDEs, and especially LICs, as far riskier than advanced economies (figure O.13.B).
FIGURE O.13 Private investment
Firms report myriad obstacles to doing business in EMDEs, including unreliable infrastructure, crime and instability, and limited access to finance. Risks are higher in EMDEs, and especially in LICs, than in advanced economies. Structural reforms can have a positive impact on private investment, and packages of policy reforms increase the likelihood of a private investment acceleration.
Sources: Chinn and Ito (2008); Haver Analytics; International Monetary Fund, Structural Reform Database; Investment and Capital Stock Dataset (IMF 2021a); Kose et al. (2022); Penn World Table (Feenstra, Inklaar, and Timmer 2015); PRS Group, International Country Risk Guide; WDI (database); World Bank Enterprise Surveys.
Note: AEs = advanced economies; EMDEs = emerging market and developing economies; excl. = excluding; LICs = low-income countries.
A. Average shares of firms identifying specific aspects as their biggest obstacle for doing business, using the latest year available for each country. Based on up to 128 EMDEs, of which 23 are LICs.
B. The index aggregates financial, economic, and political risks and ranks between 0 and 100. Sample includes 34 AEs and 73 EMDEs, of which 14 are LICs.
C. Figure shows the share of economies starting an investment acceleration during the indicated decade.
D. Line shows the accumulated percent change in private investment following a major structural reform. Shaded area shows 90 percent confidence intervals. The reform indicator is the average of the
trade, and product market reform indicators.
E. Lines show the
are liberalizing reforms implemented within three years of trade reforms.
F. Bars show the increase in the
Complementary
B. Country risk
A. Biggest obstacles for firms in EMDEs
D. Impact of major structural reforms on private investment
C. Private
Private investment accelerations—periods of sustained, rapid private investment growth— have become less frequent since 2010, but they can be sparked by policy interventions. During 2010-19, about 20 percent of EMDEs experienced an investment acceleration, compared with 35 percent in 2000-09 (figure O.13.C). Policy interventions that improve macroeconomic stability, combined with structural reforms, improvements in institutional quality, and other reforms in the business environment can help catalyze private investment accelerations. Packages of reforms increase the likelihood of a private investment acceleration. Sustainably raising private investment growth is a complex and multifaceted task. However, there are success stories, such as in Colombia, India, Korea, and Türkiye.
Structural reforms support private investment growth over the medium term and are more effective when implemented in packages. In EMDEs, major structural reforms related to international trade, external finance, the domestic financial sector, and product markets generate a cumulative increase in private investment of about 2.2 percent after three years (figure O.13.D). The impacts of these reforms are generally larger in EMDEs than in advanced economies. Individually, major reforms related to trade, external financing, and product markets all have notably positive average impacts over a three- to five-year horizon. The impacts of reforms tend to be larger when implemented in combination with other reforms (figure O.13.E). Similarly, the combined impact of improving the primary deficit, undertaking trade reform, and liberalizing the capital account at the same time, is larger than the sum of the impacts of the individual reforms, increasing the probability of starting an acceleration by almost 11 percentage points (figure O.13.F).
The complexity of the challenges means that policy makers must carefully assess countryspecific circumstances when considering what to prioritize in pursuit of sustainable increases in private investment growth. Governments that have the largest needs are also often the ones least able to meet them. Weak technical and administrative capacity in some EMDEs, particularly LICs and economies in FCS, can hinder the effective implementation of desired policies. However, strengthening implementation capacity takes time and effort and, in many cases, may require greater international support.
Chapter 5. Foreign Direct Investment in Retreat: Policies to Turn the Tide
In chapter 5, Adarov and Pallan turn to FDI. A form of external financing, FDI is an important source of capital to fill investment needs in EMDEs, especially in countries with scarce domestic capital. FDI fosters technology spillovers and efficiency gains, and can help create jobs.7 FDI also supports long-term growth and development. Thus, it is concerning that FDI inflows to EMDEs as a share of GDP have weakened since the global financial crisis, amid slower trade, heightened policy uncertainty, and persistent geopolitical tensions. The chapter addresses four questions:
7 For labor market benefits from FDI inflows, refer to Chari, Henry, and Sasson (2012) and Javorcik (2015); for FDI as a source of technology spillovers, refer to Harding and Javorcik (2011, 2013) and World Bank (2024).
• How have global FDI flows evolved, particularly FDI flows to EMDEs?
• What are the macroeconomic implications of FDI for EMDEs?
• What are the main factors driving FDI?
• What policies can help EMDEs attract FDI and maximize its benefits?
Contributions. Chapter 5 makes several contributions to the literature. First, it examines global FDI trends—particularly FDI flows to EMDEs, to which the literature has devoted limited attention. It also analyzes the evolution of FDI during major adverse events, complementing similar event-study analysis in chapter 1. Second, the chapter provides empirical analysis of the key factors driving FDI, including the implications of international integration and fragmentation. Previous research has analyzed many of these factors separately.8 is chapter integrates these factors into a consistent empirical framework using consolidated bilateral FDI data for a large sample of countries over a period spanning several decades. ird, the chapter explores the macroeconomic effects of FDI on EMDEs, identifying the conditions under which the benefits of FDI are greatest, thus contributing to the literature on the impacts of FDI (Alfaro et al. 2004; Borensztein, De Gregorio, and Lee 1998; Henry 2003; Javorcik 2004; Jude and Levieuge 2017). Finally, the chapter provides a detailed set of policy interventions that governments in EMDEs can pursue to attract FDI, maximize its benefits, advance crossborder cooperation, and reduce the potential costs of global economic fragmentation.
Findings. Chapter 5 presents the following key findings:
FDI inflows to EMDEs have weakened steadily as a share of their GDP since the global financial crisis. During the boom years of the 2000s, FDI inflows to EMDEs grew fivefold in nominal terms, to nearly 5 percent of their GDP in the typical economy at the peak in 2008. In recent years, FDI as a share of GDP has settled at about 2 percent (figure O.14.A). In nominal terms, EMDEs received $435 billion in FDI in 2023, the lowest level since 2005. The trend has been broad-based across economies: about 60 percent of all EMDEs and four out of six EMDE regions had lower FDI-to-GDP ratios in 2012-23 than in 2000-11.
The sectoral composition of FDI inflows to EMDEs has shifted toward services over the past two decades, while FDI to EMDEs has become somewhat more concentrated in the largest economies. Nearly 65 percent of FDI inflows to EMDEs went to the services sector in 2019-23, up from 45 percent in the early 2000s. The share of manufacturing-related FDI to EMDEs, meanwhile, fell to less than 30 percent in 2019-23, down from about 45 percent in the early 2000s. The three largest EMDEs—China, Brazil, and India— jointly received almost half of total FDI inflows to EMDEs, on average, during 2012-23,
8 Refer to, for example, Aiyar, Malacrino, and Presbitero (2024); Benassy-Quere, Coupet, and Mayer (2007); Henry and Lorentzen (2003); Kim, Kim, and Choi (2018); Lee, Hayakawa, and Park (2023); Mensah and Traore (2024); and Noorbakhsh, Paloni, and Youssef (2001).
about 10 percentage points more than in 2000-11. China alone received nearly onethird of inflows, while Brazil and India received 10 percent and 6 percent, respectively.
FDI spurs growth in EMDEs, but conducive macroeconomic and structural conditions are critical for attracting FDI and amplifying the positive effects. In EMDEs, on average, a 10 percent increase in FDI inflows is estimated to boost real GDP by a peak of 0.3 percent after three years (figure O.14.B). However, the effect is much stronger—0.8 percent after three years—in economies with greater trade openness, stronger institutions, better human capital development, and lower informality.
Macroeconomic, trade, and domestic institutional conditions matter for the ability of EMDEs to attract FDI (figure O.14.C). Global recessions are associated with a large decline in FDI flows to EMDEs (figure O.14.D). Economies with higher trade integration receive more FDI inflows—an extra 0.6 percent for each percentage point increase in the trade-to-GDP ratio and an extra 0.3 percent for each percentage point increase in value-added trade as a share of exports, a measure of participation in global value chains (figure O.14.E). The presence of an investment treaty tends to raise FDI flows between signatory states by more than 40 percent.
Current conditions are not conducive to generating robust FDI flows to EMDEs. Global economic policy uncertainty and geopolitical risk have soared to the highest level since the turn of the century. The formation of investment and trade agreements has slowed sharply. Between 2010 and 2024, just 380 new investment treaties came into force, less than half of the approximately 870 treaties between 2000 and 2009 (figure O.14.F). Following a trend toward less restrictiveness in the 2010s, FDI restrictions and tradedistorting policy measures have proliferated in the 2020s. At the same time, progress on improving the quality of institutions conducive to the investment climate in these economies has stalled.
EMDEs should follow a three-pronged strategy to attract FDI, amplify the benefits of FDI, and advance global cooperation to support FDI flows Although specific policies depend on country circumstances, broad priorities for all EMDEs include reforms that foster a favorable investment climate, macroeconomic stability, strong institutions, human capital development, financial deepening, and the reduction of economic informality. The right policies can steer foreign investment to projects that address pressing sustainable development issues and mobilize additional domestic capital. At the same time, reducing barriers to international trade and investment—still high in many EMDEs—including by negotiating and implementing investment treaties, is important to attract FDI directly and through enhanced trade and value chain integration. These policies are now more important as EMDEs face rising global economic fragmentation and elevated uncertainty.
Future research directions
This book makes important inroads into the study of investment in EMDEs. It highlights major trends across total, private, and public investment, as well as FDI, and
FIGURE O.14 Foreign direct investment
FDI inflows to EMDEs have fallen to about 2 percent of GDP in the last several years, on average— less than half the level at the peak in 2008. FDI inflows are positively correlated with growth and trade. The output effects of FDI are much larger in economies with conducive structural conditions. Global recessions are associated with a large decline in FDI inflows in EMDEs.
A. FDI inflows to EMDEs
C. Correlates of FDI inflows to EMDEs
B. Impact of FDI on output in EMDEs
E. Impact of a 1-percentage-point increase in trade integration on FDI inflows
Growth in FDI inflows to EMDEs around global recessions
F. Number of investment agreements
Sources: Fernández-Villaverde, Mineyama, and Song (2024); United Nations Conference on Trade and Development; WDI (database); World Bank.
Note: EMDEs = emerging market and developing economies; FDI = foreign direct investment; GVC = global value chain.
A. Lines show median and interquartile range. Balanced sample of 134 EMDEs. Last observation is 2023.
B. Lines show estimated average effects on output of a 10 percent increase in FDI inflows. Blue line shows the effect for all EMDEs; red line shows the effect for the top quartile of countries with better structural characteristics. Dashed lines show 90 percent confidence bands. Sample includes 74 EMDEs.
C. Bars show correlation coefficients between annual average FDI-to-GDP ratio and the following variables: real GDP growth, trade as a share of GDP, import tariff rate, and the fragmentation index from Fernández-Villaverde, Mineyama, and Song (2024). All correlations are statistically significant at the 1 percent level.
D. Event studies show estimates of annual FDI growth regressed on dummy variables for the years of global recessions, as well as the three-year windows around adverse events. Dashed lines and whiskers show 90 percent confidence intervals. Global recession years are 1975, 1982, 1991, 2009, and 2020, following Kose, Sugawara, and Terrones (2020).
E. Bars show marginal effects on FDI inflows of a 1-percentage-point increase in trade openness (sum of exports and imports as a percent of GDP) and GVC participation (value-added trade as a percent of exports).
F. Data include new international investment agreements in force as of April 2025.
D.
identifies the factors that support or inhibit different forms of capital formation. Drawing on original empirical analysis, literature reviews, and country case studies, the book also outlines the policies most conducive to accelerating investment growth. At the same time, the findings point to several areas for further monitoring and research—ranging from data availability and measurement to country-specific, evidence-based assessments of policy interventions.
Investment gaps for sustainable development
While it is clear that closing the financing shortfall for development goals and climateresilient infrastructure will require massive investment, the precise scale of needs remains uncertain. Estimates differ widely, with limited data coverage and heterogeneous assumptions (G20-IEG 2023; IPCC 2022; Rozenberg and Fay 2019; Vorisek and Yu 2020). A more robust and transparent framework is needed to systematically monitor investment gaps across countries on a comparable basis. This monitoring is particularly important because changing macroeconomic and fiscal conditions can quickly render earlier estimates outdated.
Frequency and quality of investment and FDI data
The analysis in this book was hindered by the limited availability and granularity of investment data, especially in EMDEs. Many countries lack high-frequency series for gross fixed capital formation, even though investment reacts rapidly to shifts in market sentiment. Timely data distinguishing between public and private investment—or mixed forms such as public-private partnerships—are scarce, and the most comprehensive global data set, the International Monetary Fund’s Investment and Capital Stock Dataset, is infrequently updated. Likewise, the compilation of FDI data is challenging— in particular, data identifying ultimate sources and addressing distortions in FDI statistics caused by special purpose entities, round-tripping, and phantom FDI (Damgaard, Elkjaer, and Johannesen 2024). Incorporating real-time indicators and improving statistical frameworks would greatly strengthen early-warning systems.
Availability of intangible investment data
Investment is increasingly shifting toward intangibles—R&D, software, data, and intellectual property—but measurement frameworks lag behind. In EMDEs, intangible investment remains poorly captured, even though it accounts for a growing share of total investment where data exist (notably in ECA and LAC). Improving statistical standards for capitalizing software and R&D, and for valuing data as an asset, is essential. Ongoing efforts to revise national accounting frameworks to include standards for capitalizing software, R&D, and other intangible assets, are a welcome step in enabling deeper analysis of intangibles. IMF (2025) provides a discussion of recent improvements in the Balance of Payments Manual and System of National Accounts. Better measurement would prevent understatement or overstatement of real investment and enable empirical work on the macroeconomic effects of intangibles—an especially promising research frontier (Adarov et al. 2022; Corrado, Hulten, and Sichel 2005; Haskel and Westlake 2018).
Sectoral and subnational investment
Data limitations also impede analysis of sectoral patterns of investment, including the rising role of services in EMDEs. Disaggregated analysis across agriculture, manufacturing, and services could shed light on the optimal allocation of investment for growth, productivity, and job creation. Likewise, national aggregates often obscure “investment deserts”—subnational areas that lag in infrastructure and connectivity. Spatially disaggregated analysis, although still infeasible for most EMDEs, could help identify bottlenecks and reveal opportunities to reduce regional inequality.
Links between public and private, foreign and domestic investment
Evidence in this book suggests that public investment can “crowd in” private investment, but the magnitude depends on the type of project and investment composition (Devarajan, Swaroop, and Zou 1996; Foster et al. 2023). For example, transportation infrastructure and digital networks are more likely to mobilize complementary private capital than recreational infrastructure. Similarly, while FDI is correlated with GDP growth, its effects vary widely across countries. Recent empirical literature has focused on the effects of cross-border capital flows (Aiyar, Malacrino, and Presbitero 2024; Aiyar and Ohnsorge 2024; Fernández-Villaverde, Mineyama, and Song 2024). Future work could deepen analysis of the transmission channels—technology transfer, skills upgrading, value-chain integration, and investor motives—that explain this heterogeneity. Understanding how FDI interacts with domestic tangible and intangible investment, and across different sectors, is another underexplored area.
Evidence-based policy interventions
Translating insights into effective policy remains a priority. Multilateral institutions such as the World Bank are working to mobilize private capital in EMDEs, but success depends on a steady pipeline of bankable projects, effective risk-mitigation instruments, and stronger institutional capacity. Evaluating reforms requires granular evidence: firmlevel, sectoral, or spatial analysis with clear treatment and control groups to identify causal effects. More micro-based evidence would reduce the risk of “aggregation bias” that often arises in cross-country studies and would help policy makers tailor reforms to their own circumstances, ensuring investment becomes a more reliable engine of growth and inclusive prosperity.
References
Adarov, A., D. Klenert, R. Marschinski, and R. Stehrer. 2022. “Productivity Drivers: Empirical Evidence on the Role of Digital and Intangible Capital, FDI and Integration.” Applied Economics 54 (48): 5515-31.
Adarov, A., and R. Stehrer. 2021. “Implications of Foreign Direct Investment, Capital Formation and Its Structure for Global Value Chains.” World Economy 44 (11): 324699.
Aiyar, S., D. Malacrino, and A. Presbitero. 2024. “Investing in Friends: The Role of Geopolitical Alignment in FDI Flows.” European Journal of Political Economy 83 (June): 102508.
Aiyar, S., and F. Ohnsorge. 2024. “Geoeconomic Fragmentation and ‘Connector’ Countries.” CEPR Discussion Paper 19352, Centre for Economic Policy Research, London.
Akcigit, U., and W. R. Kerr. 2018. “Growth through Heterogeneous Innovations.” Journal of Political Economy 126 (5): 1374-443.
Alfaro, L., A. Chanda, S. Kalemli-Ozcan, and S. Sayek. 2004. “FDI and Economic Growth: The Role of Local Financial Markets.” Journal of International Economics 64 (1): 89-112.
Auerbach, A. J., and Y. Gorodnichenko. 2013. “Fiscal Multipliers in Recession and Expansion.” In Fiscal Policy after the Financial Crisis, edited by A. Alesina and F. Giavazzi, 63-102. Chicago: University of Chicago Press.
Baker, S. R., N. Bloom, and S. J. Davis. 2016. “Measuring Economic Policy Uncertainty.” Quarterly Journal of Economics 131 (4): 1593-636.
Benassy-Quere, A., M. Coupet, and T. Mayer. 2007. “Institutional Determinants of Foreign Direct Investment.” World Economy 30 (5): 764-82.
Borensztein, E., J. De Gregorio, and J.-W. Lee. 1998. “How Does Foreign Direct Investment Affect Economic Growth?” Journal of International Economics 45 (1): 115-35.
Card, D., J. Kluve, and A. Weber. 2018. “What Works? A Meta Analysis of Recent Active Labor Market Program Evaluations.” Journal of the European Economic Association 16 (3): 894-931.
Chari, A., P. B. Henry, and D. Sasson. 2012. “Capital Market Integration and Wages.” American Economic Journal: Macroeconomics 4 (2): 102-32.
Chinn, M., and H. Ito. 2008. “A New Measure of Financial Openness.” Journal of Comparative Policy Analysis 10 (3): 309-22.
Christiaensen, L., and W. Martin. 2018. “Agriculture, Structural Transformation and Poverty Reduction: Eight New Insights.” World Development 109 (September): 413-16.
Corrado, C., J. Hulten, and D. Sichel. 2005. “Measuring Capital and Technology.” In Measuring Capital in the New Economy. Studies in Income and Wealth, 65, edited by C. Corrado, J. Haltiwanger, and D. Sichel, 11-14. Chicago: University of Chicago Press.
Cull, R., I. Gill, A. Pedraza, C. Ruiz-Ortega, and F. Zeni. 2024. “Mobilizing Private Capital for the Sustainable Development Goals.” Policy Research Working Paper 10838, World Bank, Washington, DC.
Damgaard, J., T. Elkjaer, and N. Johannesen. 2024. “What Is Real and What Is Not in the Global FDI Network?” Journal of International Money and Finance 140 (February): 102971.
Devarajan, S., V. Swaroop, and H. Zou. 1996. “The Composition of Public Expenditure and Economic Growth.” Journal of Monetary Economic 37 (2): 313-44.
Didier, T., R. Levine, R. Llovet Montanes, and S. L. Schmukler. 2021. “Capital Market Financing and Firm Growth.” Journal of International Money and Finance 118 (April): 102459.
EUKLEMS (database). Bontadini. F., C. Corrado., J. Haskel., M. Iommi., C. JonaLasinio. “EUKLEMS & INTANProd: Industry Productivity Accounts with Intangibles.” https://euklems-intanprod-llee.luiss.it.
Eden, M., and A. Kraay. 2014. “‘Crowding In’ and the Returns to Government Investment in Low-Income Countries.” Policy Research Working Paper 6781, World Bank, Washington, DC.
Farole, T., E. Ferro, and M. V. Gutierrez. 2017. “Job Creation in the Private Sector: An Exploratory Assessment of Patterns and Determinants at the Macro, Sector, and Firm Levels.” Jobs Working Paper 22807, World Bank, Washington, DC.
Fatas A., B. Gootjes, and J. Mawejje. 2025. “Dynamic Effects of Fiscal Rules: Do Initial Conditions Matter?” Policy Research Working Paper 11066, World Bank, Washington, DC.
Feenstra, R. C., R. Inklaar and M. P. Timmer. 2015. “The Next Generation of the Penn World Table.” American Economic Review 105 (10): 3150-82.
Fernández-Villaverde, J., T. Mineyama, and D. Song. 2024. “Are We Fragmented Yet? Measuring Geopolitical Fragmentation and Its Causal Effects.” NBER Working Paper 32638, National Bureau of Economic Research, Cambridge, MA.
Foster, V., N. Gorgulu, D. Jain, S. Straub, and M. Vagliasindi. 2023. “The Impact of Infrastructure on Development Outcomes: A Meta-Analysis.” Policy Research Working Paper 10350, The World Bank, Washington, DC.
Furceri, D., and B. Li. 2017. “The Macroeconomic (and Distributional) Effects of Public Investment in Developing Economies.” IMF Working Paper 17/217, International Monetary Fund, Washington, DC.
G20-IEG (Group of Twenty; Independent Expert Group). 2023. The Triple Agenda: A Roadmap for Better, Bolder, and Bigger MDBs. Report of the Independent Expert Group.
Garcia-Escribano, M., and F. Han. 2015. “Credit Expansion in Emerging Markets: Propeller of Growth?” IMF Working Paper 15/212, International Monetary Fund, Washington, DC.
Gill, I. S. 2024. “The World Needs a New Investment Boom. It’s Still Within Reach Even as Global Growth Slows.” Barron’s (blog), April 4, 2024. https:// www.barrons.com/articles/investment-boom-global-growth-economy-9b605af3.
Gill, I. S., I. Izvorski, W. van Eeghen, and D. De Rosa. 2014. Diversified Development: Making the Most of Natural Resources in Eurasia. Washington, DC: World Bank.
Gill, I. S., and H. Kharas. 2007. An East Asian Renaissance: Ideas for Economic Growth. Washington, DC: World Bank.
Gill, I. S., and H. Kharas. 2015. “The Middle-Income Trap Turns Ten.” Policy Research Working Paper 7403, World Bank, Washington, DC.
Harding, T., and B. Javorcik. 2011. “Roll out the Red Carpet and They Will Come: Investment Promotion and FDI Inflows.” Economic Journal 121 (557): 1445-76.
Harding, T., and B. Javorcik. 2013. “Investment Promotion and FDI Inflows: Quality Matters.” CESifo Economic Studies 59 (2): 337-59.
Haskel, J., and S. Westlake. 2018. Capitalism without Capital: The Rise of the Intangible Economy. Princeton and Oxford: Princeton University Press.
Hausmann, R., L. Pritchett, and D. Rodrik. 2005. “Growth Accelerations.” Journal of Economic Growth 10 (4): 303-29.
Henry, P. B. 2003. “Capital-Account Liberalization, the Cost of Capital, and Economic Growth.” American Economic Review 93 (2): 91-6.
Henry, P. B., and P. L. Lorentzen. 2003. “Domestic Capital Market Reform and Access to Global Finance: Making Markets Work.” NBER Working Paper 10064, National Bureau of Economic Research, Cambridge, MA.
Hoyos, M., E. Libman, and A. Razmi. 2021. “The Structural Outcomes of Investment Surges.” Structural Change and Economic Dynamics 58 (September): 245-55.
IEA (International Energy Agency). 2024. “Electricity Access Continues to Improve in 2024—After First Global Setback in Decades.” Commentary, International Energy Agency, Paris. https://www.iea.org/commentaries/electricity-access-continues-toimprove-in-2024-after-first-global-setback-in-decades.
Ilzetzki, E., E. G. Mendoza, and C. A. Végh. 2013. “How Big (Small?) Are Fiscal Multipliers?” Journal of Monetary Economics 60 (2): 239-54.
IMF (International Monetary Fund). 2014. “Is It Time for an Infrastructure Push? The Macroeconomic Effects of Public Investment.” In World Economic Outlook, October, Chapter 3. Washington, DC: IMF.
IMF (International Monetary Fund). 2015. “Private Investment: What’s the Holdup?” In World Economic Outlook. April, Chapter 4. Washington, DC: IMF.
IMF (International Monetary Fund). 2021a. “Investment and Capital Stock Dataset.” Macroeconomic and Financial Data, IMF, Washington, DC.
IMF (International Monetary Fund). 2021b. Fiscal Monitor, April 2021: A Fair Shot Washington, DC: IMF.
IMF (International Monetary Fund). 2025. “Release of New Standards for Macroeconomic Statistics (BPM7).” Policy Paper 2025/023, IMF, Washington, DC.
IPCC (Intergovernmental Panel on Climate Change). 2022. Climate Change 2022: Mitigation of Climate Change. IPCC Sixth Assessment Report. Cambridge, UK, and New York: Cambridge University Press.
Izquierdo, A., R. E. Lama, J. Medina, J. P. Puig, D. Riera-Crichton, C. Vegh, and G. Vuletin. 2019. “Is the Public Investment Multiplier Higher in Developing Countries? An Empirical Investigation.” NBER Working Paper 26478, National Bureau of Economic Research, Cambridge, MA.
Javorcik, B. 2004. “Does Foreign Direct Investment Increase the Productivity of Domestic Firms? In Search of Spillovers through Backward Linkages.” American Economic Review 94 (3): 605-27.
Javorcik, B. 2015. “Does FDI Bring Good Jobs to Host Countries?” World Bank Research Observer 30 (1): 74-94.
Jong-A-Pin, R., and J. de Haan, 2008. “Time-Varying Impact of Public Capital on Output: New Evidence Based on VARs for OECD Countries.” EIB Paper 3/2008, European Investment Bank, Luxembourg.
Jong-A-Pin, R., and J. de Haan. 2011. “Political Regime Change, Economic Liberalization and Growth Accelerations.” Public Choice 146 (1): 93-115.
Jude, C., and G. Levieuge. 2017. “Growth Effect of Foreign Direct Investment in Developing Economies: The Role of Institutional Quality.” World Economy 40 (4): 715-42.
Kim, S., S. Kim, and Y. Choi. 2018. “International Capital Mobility: Regional Versus Global Perspective.” Review of World Economics 154 (1): 157-76.
Kose, A. M., S. Kurlat, F. Ohnsorge, and N. Sugawara. 2022. “A Cross-Country Database of Fiscal Space.” Journal of International Money and Finance 128: 102682.
Kose, M. A., P. Nagle, F. Ohnsorge, and N. Sugawara. 2019. Global Waves of Debt: Causes and Consequences. Washington, DC: World Bank.
Kose, M. A., and F. Ohnsorge, eds. 2024. Falling Long-Term Growth Prospects: Trends, Expectations, and Policies. Washington, DC: World Bank.
Kose, M. A., F. Ohnsorge, L. S. Ye, and E. Islamaj. 2017. “Weakness in Investment Growth: Causes, Implications and Policies.” Policy Research Working Paper 7990, World Bank, Washington, DC.
Kose, M. A., N. Sugawara, and M. Terrones. 2020. “Global Recessions.” Policy Research Working Paper 9172, World Bank, Washington, DC.
LAKLEMS (database). Latin America and the Caribbean (LAKLEMS) database. http:// laklems.net.
Leduc, S., and D. Wilson. 2012. “Roads to Prosperity or Bridges to Nowhere? Theory and Evidence on the Impact of Public Infrastructure Investment.” NBER Working Paper 18042, National Bureau of Economic Research, Cambridge, MA.
Lee, H., K. Hayakawa, and C. Park. 2023. “The Effect of COVID-19 on Foreign Direct Investment.” Global Economic Review 52 (1): 1-17.
Libman, E., J. A. Montecino, and A. Razmi. 2019. “Sustained Investment Surges.” Oxford Economic Papers 71 (4): 1071-95.
Lim, J. L. 2014. “Institutional and Structural Determinants of Investment Worldwide.” Journal of Macroeconomics 41 (September): 160-77.
Mensah, J. T. 2024. “Jobs! Electricity Shortages and Unemployment in Africa.” Journal of Development Economics (167): 103231.
Mensah, J. T., and N. Traore. 2024. “Infrastructure Quality and FDI Inflows: Evidence from the Arrival of High-Speed Internet in Africa.” World Bank Economic Review (38) 1: 1-23.
Noorbakhsh, F., A. Paloni, and A. Youssef. 2001. “Human Capital and FDI Inflows to Developing Countries: New Empirical Evidence.” World Development 29 (9): 1593-610.
OECD (Organisation for Economic Co-operation and Development). 2025. OECD Economic Outlook, Volume 2025 Issue 1: Tackling Uncertainty, Reviving Growth. Paris: OECD Publishing.
Qiang, C. Z., Y. Liu, and V. Steenbergen. 2021. An Investment Perspective on Global Value Chains. Washington, DC: World Bank.
Qureshi, Z., J. L. Diaz-Sanchez, and A. Varoudakis. 2015. “The Post-Crisis Growth Slowdown in Emerging Economies and the Role of Structural Reforms.” Global Journal of Emerging Market Economies 7 (2): 179-200.
Romp, W. E., and J. de Haan. 2007. “Public Capital and Economic Growth: A Critical Survey.” Perspektiven der Wirtschaftspolitik 8 (S1): 6-52.
Rozenberg, J., and M. Fay, eds. 2019. Beyond the Gap: How Countries Can Afford the Infrastructure They Need while Protecting the Planet. Washington, DC: World Bank.
Shapiro, M. D., O. J. Blanchard, and M. C. Lovell. 1986. “Investment, Output, and the Cost of Capital.” Brookings Papers on Economic Activity 1986 (1): 111-64.
Solow, R. M. 1987. “Growth Theory and After.” Lecture to the Memory of Alfred Nobel, December 8. https://www.nobelprize.org/prizes/economic-sciences/1987/solow/ lecture.
Stamm, K., and D. Vorisek. 2023. “The Global Investment Slowdown: Challenges and Policies.” In Falling Long-Term Growth Prospects: Trends, Expectations, and Policies, edited by M. A. Kose and F. Ohnsorge, 153-210. Washington, DC: World Bank.
Vagliasindi, M., and N. Gorgulu. 2025. “Disentangling the Key Economic Channels through Which Infrastructure Affects Jobs.” Policy Research Working Paper 11096, World Bank, Washington, DC.
Vorisek, D., and S. Yu. 2020. “Understanding the Cost of Achieving the Sustainable Development Goals.” Policy Research Working Paper 9146, World Bank, Washington, DC.
WDI (database). World Development Indicators. World Bank. https:// databank.worldbank.org/source/world-development-indicators.
WHO (World Health Organization) and UNICEF (United Nations Children’s Fund). 2023. Progress on Household Drinking Water, Sanitation and Hygiene 2000-2022: Special Focus on Gender. Geneva: WHO and UNICEF.
World Bank. 2017. Global Economic Prospects. January. Washington, DC: World Bank.
World Bank. 2022. Climate and Development: An Agenda for Action—Emerging Insights from World Bank Group 2021-22 Country Climate and Development Reports. Washington, DC: World Bank.
World Bank. 2024. World Development Report 2024: The Middle-Income Trap. Washington, DC: World Bank.
World Bank. 2025a. Commodity Markets Outlook. April. Washington, DC: World Bank.
World Bank. 2025b. Global Economic Prospects. January. Washington, DC: World Bank.
… forward-looking policies generally involve investment in human, social, or physical capital.
Ben S. Bernanke (2017) 2022 Nobel Laureate in Economics, Distinguished Fellow, Brookings Institution, and Former Chairman of the Board of Governors, U.S. Federal Reserve

CHAPTER 1 Investment Trends, Structure, and Drivers in EMDEs

Average annual investment growth in emerging market and developing economies (EMDEs) fell from nearly 10 percent in 2000-09 to about 5 percent in 2010-24. The slowdown is evident in both public and private investment growth and has been accompanied by a gradual structural shift in the composition of investment toward private investment and intangible assets. The convergence of investment per worker in EMDEs excluding China toward the level in advanced economies has stalled since the early 2010s, hindering catch-up in per capita income levels. Recessions and financial crises are associated with substantial, prolonged investment contractions. On average, in EMDEs, investment declines by about 5 percent in the year of a recession and does not begin to recover until three years after its onset. Empirical analysis finds that investment growth in EMDEs, especially private investment growth, is strongly correlated with output growth and with financial, trade, and institutional conditions. However, these factors have provided diminishing support to investment growth since the global financial crisis of 2008-09. Investment growth in EMDEs accelerates significantly following institutional reform spurts.
Introduction
The world faces significant development challenges related to infrastructure, climate change, jobs, poverty, and other critical areas. The COVID-19 pandemic temporarily halted decades of progress in reducing poverty. An estimated 30 million more people were below the $3-per-day extreme poverty threshold in 2020 than in 2018 (World Bank 2025). Despite steady progress in electrification, as of 2024, almost 740 million people worldwide still lack access to electricity (IEA et al. 2025). One-quarter of the world’s population lacked access to safely managed drinking water as of 2022, and more than two-fifths did not have access to safely managed sanitation (WHO and UNICEF 2023).
The cost of achieving the targeted progress toward development goals is significant. Reaching the Sustainable Development Goals related to infrastructure in low- and middle-income countries is estimated to require additional investment of $1.5 trillion to $2.7 trillion per year during 2015-30 (Rozenberg and Fay 2019). Meeting climate commitments under the Paris Agreement—including reductions in greenhouse gas emissions—and advancing the clean energy transition are expected to cost an additional several trillion U.S. dollars per year in infrastructure and adaptation investment (Black et al. 2022; IEA 2021; IPCC 2022). The needs are especially large in low-income countries (LICs). Thus, building resilience to climate change and putting LICs on track to lower
Note: This chapter was prepared by Amat Adarov and Kersten Stamm, with contributions by Menzie Chinn and Hiro Ito.
greenhouse gas emissions by 70 percent from current levels by 2050 are estimated to require additional investment equivalent to about 8 percent of their gross domestic product (GDP) per year (World Bank 2022a).
In addressing these challenges, investment is a vital part of the solution.1 Investment in productive capital and infrastructure is essential for boosting labor productivity and income, and for fostering sustainable improvements in living standards (Cerra, Lama, and Loayza 2021; Kose and Ohnsorge 2024).
In light of these developments, this chapter provides a comprehensive discussion of investment in EMDEs, with the goal of informing policy debates about the key factors underpinning investment weakness. The chapter addresses the following main questions:
• How have global investment and its composition evolved over the past decades?
• What are the differences in investment patterns among EMDEs?
• What are the main drivers of investment?
Contributions. The chapter makes several contributions to the literature. First, it provides a comprehensive assessment of investment trends, with a focus on EMDEs, discussing heterogeneity across EMDE country groups and regions. Second, the chapter provides a breakdown of the structure of investment in EMDEs, including public and private investment, sectoral patterns, and the composition of tangible and intangible capital assets. Third, the chapter analyzes the dynamics of investment around adverse events, with a particular focus on recessions and financial crises. Fourth, the chapter takes a comparative perspective on the capital intensity of developing economies and examines long-run convergence patterns. Finally, the chapter identifies the drivers of investment in EMDEs, distinguishing between public and private investment, and builds on a literature that largely investigates the determinants of total investment.
Findings. The chapter presents the following main findings:
Investment growth in EMDEs slowed considerably after the global financial crisis of 200809. Average annual investment growth declined from nearly 10 percent in 2000-09 to about 5 percent in 2010-24. The deceleration of investment growth in EMDEs occurred in all regions and was especially strong in commodity-exporting countries. Both public and private investment growth in EMDEs weakened in 2010-23, falling to about half of the 2000-09 average.
The slowdown in investment growth in EMDEs has been accompanied by a gradual structural transition in the composition of investment—namely, a shift toward intangible capital— while the shares of public and private investment in total investment have remained stable. Private investment was equivalent to about 75 percent of total investment in EMDEs in
1 Throughout the chapter, investment—both private and public—is defined as real gross fixed capital formation.
2010-23, on average, and remained almost unchanged from the average in 2000-09. EMDEs with available data also show a gradual shift toward intangibles, such as research and development, software, and intellectual property, although this transition is occurring far more slowly than in advanced economies. The share of intangible capital in total investment was less than one-tenth in EMDEs in 2010-19, compared with almost onefifth in advanced economies.
The convergence of investment per worker in EMDEs excluding China toward the level in advanced economies has stalled since the early 2010s. Excluding China, investment per worker in EMDEs is about 14 percent of the level in advanced economies, hindering catch-up in per capita income levels. In two EMDE regions, Latin America and the Caribbean (LAC) and Sub-Saharan Africa (SSA), average investment per worker was lower in 2010-24 than in 1980-89. Even in the regions where investment per worker is highest—East Asia and Pacific (EAP), Europe and Central Asia (ECA), and the Middle East and North Africa (MNA)—it still remains well below the level of advanced economies.
Recessions and financial crises are associated with substantial, prolonged investment contractions in EMDEs. In EMDEs, investment contracts by about 5 percent, on average, in the year of a recession and begins expanding again only three years after the onset of the recession. Currency, sovereign debt, and banking crises are also associated with a strong negative impact on investment, although investment growth tends to recover faster than after recessions. The global recession triggered by the COVID-19 pandemic had a stronger effect on investment in EMDEs than the recession during the 2008-09 global financial crisis. Excluding China, which was more resilient, investment in EMDEs declined by about 9 percent in 2020, compared with 7 percent in 2009. The investment recovery in EMDEs following the 2020 recession was also weaker than the recovery following the 2009 recession.
Empirical analysis finds that investment growth in EMDEs, especially private investment growth, is strongly correlated with output growth dynamics, as well as with financial, trade, and institutional conditions. Specifically, private investment growth is facilitated by credit growth, greater openness to trade and capital flows, and conducive fiscal conditions, whereas public investment is supported by trade openness and hindered by economic uncertainty. However, these factors have provided diminishing support for investment growth since the global financial crisis. A second empirical exercise, using data for 19902024, finds that both total and private investment growth in EMDEs tend to accelerate after institutional reform spurts. The acceleration in private investment is sustained for a longer period in such instances.
Trends in investment in EMDEs
Investment growth in EMDEs underwent a prolonged slowdown between the global financial crisis and the COVID-19 pandemic, following a period of robust growth in the 2000s (figure 1.1.A). The 2020 global recession triggered a severe investment contraction in EMDEs, with nearly three-quarters of economies experiencing a decline.
Investment growth from a historical perspective
Investment growth in EMDEs, though subject to notable year-to-year fluctuations, has shown distinct patterns over the past several decades. The 1990s began with a global recession in 1991, triggered by the Gulf War and financial sector weakness in advanced economies, and ended with a global downturn in 1998 (Kose, Sugawara, and Terrones 2020). Investment growth in EMDEs excluding China averaged 2.5 percent per year in the 1990s. The 1990s were also the decade when China’s economy began to take off. Investment in all EMDEs, including China, expanded at an average annual rate of 5.5 percent (figure 1.1.B).
By the 2000s, China’s economy was booming and output growth in many EMDEs was robust. Investment growth in EMDEs expanded rapidly, averaging 9.5 percent per year from 2000 to 2009. The pace was still impressively robust in EMDEs excluding China, at 6.8 percent. By contrast, in advanced economies, investment growth was weak in the 2000s, even before the global financial crisis of 2007-09 (figure 1.1.B). The crisis dealt a strong blow, causing an investment contraction for two consecutive years. Investment growth in advanced economies averaged only 0.8 percent over this decade.
After the global financial crisis, EMDEs experienced a prolonged, broad-based slowdown. Investment growth in EMDEs declined from a historical high of 13 percent in 2007 to 3.6 percent in 2019. Annual investment growth in EMDEs averaged just 6.1 percent in 2010-19, and 4.1 percent in EMDEs excluding China. In the five years leading up to 2020, EMDEs experienced one of the lowest average investment growth rates of any five-year period without an investment contraction in recent decades. In contrast, investment growth in advanced economies was more stable, at about 2.9 percent, in the 2010s. During the 2020 recession, investment contracted sharply, followed by a slow recovery—even slower than after the global financial crisis.
The investment growth slowdown during the 2010s occurred in a large share of EMDEs and in all EMDE regions (figure 1.1.C). The slowdown was especially pronounced in LAC and MNA. Average annual investment growth in both regions fell below 2 percent in that decade, much lower than in other EMDE regions or advanced economies. This decrease was driven in part by falling commodity prices. In most regions, except for South Asia (SAR) and SSA, investment growth was slower in the 2010s than in the 1990s.
For EMDEs, the slowdown in investment growth during the 2010s was accompanied by greater synchronization of investment. The 1990s, in particular, was marked by highly volatile investment growth. In the 1990s and 2000s, the gap in investment growth rates between the bottom and top quartile averaged 6.1 percentage points. From the 2010s through 2024, the difference between the top and bottom quartile fell to 3.6 percentage points. For advanced economies, by contrast, the gap between the top and bottom quartiles remained fairly stable, narrowing from 3.5 percentage points in the 1990s to 2 percentage points in 2010-24.
FIGURE 1.1 Investment growth in EMDEs
EMDEs experienced a broad-based slowdown in investment growth in the years between the 200709 global financial crisis and the COVID-19 pandemic. The pandemic-induced investment contraction in EMDEs excluding China in 2020 was historically large, and sharper than in advanced economies. The investment growth slowdown in EMDEs during the 2010s followed a decade of unprecedented investment growth, evident in all six EMDE regions and country groups, including LICs. Over the last three decades, commodity importers experienced higher investment growth than commodity exporters.
Sources: Haver Analytics; WDI (database); World Bank.
Note: Investment growth is calculated with countries’ real annual investment (at 2010-19 average exchange rates and prices) as weights. Sample includes 68 EMDEs and 35 advanced economies. EMDEs by region include EAP (8), ECA (11), LAC (19), MNA (9), SAR (3), and SSA (18). EMDEs by country group include commodity exporters (44), commodity importers (25), FCS (7), and LICs (7).
AEs = advanced economies; EAP = East Asia and Pacific; ECA = Europe and Central Asia; EMDEs = emerging market and developing economies; FCS = fragile and conflict-affected situations; LAC = Latin America and the Caribbean; LICs = low-income countries; MNA = Middle East and North Africa; SAR = South Asia; SSA = Sub-Saharan Africa.
A. Shaded areas depict global recession years, following Kose, Sugawara, and Terrones (2020). Last observation is 2024.
B.-D. Bars shows the investment-weighted average growth rate by group and decade.
Investment patterns across EMDEs
The broad pattern of rapid investment growth in the 2000s, followed by a slowdown in the 2010s and early 2020s, occurred in both commodity-importing and commodityexporting EMDEs (figure 1.1.D). In commodity-importing EMDEs, investment growth fell from about 12 percent in 2010 to an average of 4.5 percent in 2022-24. It is also evident that commodity-importing EMDEs experienced more robust investment growth than commodity exporters during the more than three decades since the 1990s, averaging 8.4 percent between 1990 and 2024, outperforming commodity exporters by 4.7
B. Investment growth, by decade
A. Investment growth
D. Investment growth, by EMDE group C. Investment
by EMDE region
percentage points and all EMDEs by 1.7 percentage points. Investment growth in commodity importers has been largely supported by robust investment growth in China and India.
Commodity-exporting EMDEs experienced a more severe slowdown in investment growth during the 2010s and subsequent years. In addition to the effects of the global financial crisis and COVID-19, they have faced periodic adverse commodity price shocks (World Bank 2022b). Overall, investment growth in commodity-exporting EMDEs averaged 3 percent per year over 2010-24, lower than in commodity-importing EMDEs.
LICs also experienced decelerating investment growth in the 2010s. Although investment growth remained relatively robust, the average slowed from 8.2 percent per year in the 2000s to 6 percent during 2010-24 (figure 1.1.D). Economies in fragile and conflict -affected situations (FCS) also faced a slowdown. After averaging 7 percent per year in the 2000s, investment growth dropped to 4.5 percent per year over 2010-24.
Among EMDE regions, EAP has consistently recorded the highest annual investment growth rate. In the 1990s and 2000s, this performance was mainly driven by investment growth in China (figure 1.1.C). As China began shifting toward a growth model more reliant on consumption and less on investment and exports, investment growth in EAP slowed from an average of 12.4 percent in the 2000s to 6.3 percent between 2010 and 2024. After EAP, SAR is the region with the second-strongest investment growth performance since 1990. SAR averaged over 6 percent investment growth in every decade, peaking at 10 percent in the 2000s.
ECA has had a more mixed investment growth performance, due to the restructuring of transition economies in the 1990s (World Bank 2005). In the following two decades— the 2000s and the 2010s—ECA recorded much better growth, although investment growth slowed from 8 percent in the 2000s to 4 percent in the 2010s.
Compared with EAP, ECA, and SAR, the other three EMDE regions (LAC, MNA, and SSA) have experienced a very uneven investment growth performance. After peaking in the 2000s, investment growth collapsed in the 2010s, averaging about 2 percent between 2010 and 2024 in both regions. In LAC, even in the 2000s, the average investment growth rate did not exceed 4 percent. Similarly, in SSA, the average investment growth rate from 1990 to 2024 was 4.5 percent, the second-lowest long-run average growth rate after LAC. Investment growth slowed by almost half, from 7.2 percent in the 2000s to 3.7 percent in 2010-24.
Impact of the COVID-19 pandemic on investment
The global recession associated with the COVID-19 pandemic triggered an investment contraction in EMDEs. Investment in EMDEs dropped by 1.8 percent on an investment-weighted basis in 2020, which contrasts with EMDEs’ experience during the global recession in 2009, when they avoided an investment contraction. A deeper
contraction in EMDEs during the pandemic was avoided primarily because of China, where a large fiscal stimulus of about 6.5 percent of GDP allowed investment to expand by nearly 2 percent in 2020 (IMF 2021). In EMDEs excluding China, investment contracted sharply, by about 9 percent in 2020, exceeding the 6.8 percent decline in 2009. Investment growth declined in about 75 percent of EMDEs in 2020, the largest share of EMDEs with negative annual investment growth since at least 1990 (figure 1.2.A). The LAC and MNA regions experienced the largest contractions, by 11.9 percent and 15.5 percent, respectively, while the decline in ECA was the smallest, at 1.2 percent (figure 1.2.B). The 2021 rebound was strongest in SAR and LAC, where investment growth reached 19.4 percent and 16 percent, respectively.
Following the deepest contraction in EMDE investment of the past three decades during the 2020 global recession, investment levels in EMDEs are not expected to recover by 2026 to the level suggested by the prepandemic trend from 2010 to 2019, in part because of the slower recovery in China (figure 1.2.C). This slow recovery stands in contrast to the investment growth performance following the global financial crisis. After the global financial crisis, EMDEs had already surpassed the precrisis investment trend by 2010 (figure 1.2.D). Historically, recessions and financial crisis have been associated with prolonged investment contractions (box 1.1).
The weak investment growth reflects uncertainties about the path of the global economy and may deteriorate further (Guénette, Kose, and Sugawara 2022). At the same time, corporate debt is at the highest level in decades in EMDEs and could further constrain investment growth in the next few years (Caballero and Simsek 2020; Stiglitz 2020). In China, the largest contributor to EMDE investment in the past four decades, investment growth has slowed significantly in the first half of the 2020s. Private investment is expected to remain weak as export demand has fallen and tighter financial conditions among real estate developers have led to a contraction of real estate investment (IMF 2023).
Structure of investment in EMDEs
The composition of investment—across public and private sectors, across production sectors, and across tangible and intangible capital—varies widely from country to country. Structural shifts in the composition of investment have important implications for productivity, job creation, and economic growth in EMDEs.
Public and private investment
Private investment is typically much larger than public investment in both advanced economies and EMDEs. In 2010-23, median private investment amounted to about 17 percent of GDP in EMDEs, while public investment was equivalent to about 6 percent (figures 1.3.A and 1.3.B).2 The respective median ratios in advanced economies during
2 Private and public investment data are from the International Monetary Fund’s Investment and Capital Stock Dataset, complemented by data from Haver Analytics and the World Bank’s World Development Indicators. Details on data collection and compilation are reported in IMF (2021).
FIGURE 1.2 Investment during the 2020 global recession
During the global recession in 2020, investment growth contracted in the largest share of economies since the 1980s. The contraction was deepest in LAC, SAR, SSA, and EAP excluding China. While many regions saw a strong recovery in investment growth in 2021, the rebound was more subdued in EAP and SSA.
C. Investment in EMDEs compared to pre-COVID-19 trend
D. Investment in EMDEs after the 2009 and 2020 recessions
Sources: Haver Analytics; WDI (database); World Bank.
Note: EAP = East Asia and Pacific; ECA = Europe and Central Asia; EMDEs = emerging market and developing economies; LAC = Latin America and the Caribbean; MNA = Middle East and North Africa; SAR = South Asia; SSA = Sub-Saharan Africa.
A. Sample includes 68 EMDEs.
B. Bars show investment-weighted averages, with countries’ real annual investment (at 2010-19 average exchange rates and prices) as weights. Sample includes 68 EMDEs.
C. Investment levels are estimates for 2024 and forecasts for 2025 and 2026. Trendline is calculated using linear regression on investment levels in 2010-19. Gray shading indicates forecasts. Sample includes 70 EMDEs.
D. Investment is indexed to 100 in the year before the global recession; 0 indicates the year of the global recession (2009 or 2020). Sample includes up to 70 EMDEs.
the same years were about 18 percent and 4 percent. Over time, the composition of investment in EMDEs has remained relatively stable. Private investment was equivalent to about 75 percent of total investment in EMDEs in 2010-23, on average, almost unchanged from the average in 2000-09. However, public investment still tends to play a greater role in EMDEs, reaching about 6 percent of GDP, as opposed to 4 percent of GDP in advanced economies. Public investment as a share of GDP tends to be similar across different groups of EMDEs, including LICs and commodity-exporting countries, while the private-investment-to-GDP ratio is notably lower in LICs relative to higherincome EMDEs.
B. Investment growth, by EMDE region
A. Share of EMDEs with an investment contraction
FIGURE 1.3 Dynamics of public and private investment
Although the private-investment-to-GDP ratio in EMDEs is similar to that in advanced economies, the public-investment-to-GDP ratio tends to be higher. During 2010-23, private investment amounted, on average, to about 17 percent of GDP in EMDEs, while the public investment share of GDP was about 6 percent. Both public and private investment growth in EMDEs weakened substantially in 2010-23 relative to 2000-09, by about half. The decline in investment growth—both public and private—was especially prominent in commodity-exporting EMDEs.
A. Private investment as a share of GDP, 2010-23
B. Public investment as a share of GDP, 2010-23
Sources: Haver Analytics; Investment and Capital Stock Dataset (IMF 2021); WDI (database); World Bank.
Note: Country composition of groups is fixed over time. AEs = advanced economies; Com. exp. = commodity-exporting EMDEs; Com. imp. = commodity-importing EMDEs; EMDEs = emerging market and developing economies; LICs = low-income countries.
A.B. Median public and private investment ratios for 2010-23. Whiskers show interquartile ranges.
C.D. Average annual investment growth, calculated with countries’ investment in constant international dollars as weights. Sample includes 162 economies, of which 125 are EMDEs.
E.F. Median annual investment growth by EMDE group. Sample includes 22 LICs, 77 commodity-exporting
importing EMDEs.
and
F. Public investment growth, by EMDE group
E. Private investment growth, by EMDE group
BOX 1.1 Investment dynamics around adverse events in EMDEs
Recessions are associated with substantial, prolonged investment contractions in emerging market and developing economies (EMDEs). Both public and private investment tend to decline following recessions. In EMDEs, a recession is associated with an investment contraction of about 5 percent, on average, in the year of the recession and a reversion to investment growth only three years after the onset of recession. Currency, sovereign debt, and banking crises are also associated with a strong negative impact on investment. Compared to recessions, however, investment tends to recover faster after financial crises.
Introduction
Investment—both public and private—tends to weaken substantially during major adverse macroeconomic events, such as recessions and financial crises. In particular, the deterioration of macroeconomic conditions negatively affects investor sentiment, especially for risky investment projects, and recessions can necessitate the diversion of fiscal resources away from long-term investment projects in favor of macroeconomic stabilization. Disruption of financial markets often leads to lower funding availability and higher borrowing costs for private investors.
This box examines the dynamics of investment around adverse events by addressing the following questions:
• How does investment growth evolve around recessions and financial crises?
• Are there differences in the patterns of public and private investment growth around adverse events?
The box examines the trajectory of total investment growth, and public and private investment growth, during three-year windows before and after adverse events. The analysis includes four types of events: recessions, defined as years with negative real per capita gross domestic product (GDP) growth; currency crises; sovereign debt crises; and systemic banking crises.a
The analysis is based on a sample of 159 EMDEs over the period 1961-2021 (the data for public and private investment are available up to 2019). The data for total investment and real per capita GDP are from the World Bank’s World Development Indicators database. Public and private investment data are from
Note: This box was prepared by Amat Adarov, Menzie Chinn, Hiro Ito, and Kersten Stamm. a. Investment patterns around natural disasters were also analyzed. The results of these exercises did not reveal statistically significant relationships. The lack of statistical significance may be the result of two opposing forces. Although a disaster has a negative impact on investment by destroying infrastructure, the affected economy may also boost investment to support reconstruction and recovery (Beyer, Narayanan, and Thakur 2022).
BOX 1.1 Investment dynamics around adverse events in EMDEs (continued)
FIGURE B1.1.1 Dynamics of total investment growth around recessions and crises
Investment in EMDEs, on average, experiences a notable slowdown during global and national recessions. In contrast to recessions, financial crises do not have a hysteresis effect. Recoveries—generally taking a V-shape—bring investment growth back to precrisis levels within two years of a financial shock.
A. Recessions
B. Banking crises
C. Debt crises
D. Currency crises
Sources: Haver Analytics; Laeven and Valencia (2020); WDI (database); World Bank.
Note: Sample includes up to 159 EMDEs over the period 1970-2019. Gray areas indicate the event year. Solid lines indicate mean investment growth; dashed lines indicate 90 percent confidence bands. EMDEs = emerging market and developing economies.
the International Monetary Fund’s Investment and Capital Stock Dataset (IMF 2021). The dating of currency crises, debt crises, and systemic banking crises is from the Systemic Banking Crises Database II (Laeven and Valencia 2020).
Results
The event studies reveal a profound contraction of investment in EMDEs during recessions and financial crises (figure B1.1.1). This result is consistent with the empirical literature, which underscores the critical role of economic growth and stable macroeconomic conditions as drivers of investment—and is also reported in the regression analysis of investment drivers in the chapter. That said, a more granular assessment of investment patterns, differentiating between private and
BOX 1.1 Investment dynamics around adverse events in EMDEs (continued
)
public investment, shows that the effects vary depending on the type of financial crisis (figures B1.1.2 and B1.1.3).
Recessions
Investment in EMDEs declines significantly during recessions (figure B1.1.1.A).
As the empirical analysis in the chapter shows, economic growth is the key driver of investment. Investment tends to be the component of GDP most sensitive to business cycle conditions and contracts sharply during economic downturns. The event study analysis shows that annual investment, which grew at about 7 percent in the prerecession years, contracts by more than 5 percent during recession years and, on average, begins expanding again after three years. Even then, the expansion tends to be weak, reaching only about 2 percent.
Both public and private investment tend to decline significantly during recessions and continue to shrink for up to two years after the start of a recession. Private investment declines as firms face reduced demand, heightened uncertainty, and tighter financial market constraints. Public investment also tends to weaken as governments face reduced fiscal revenues, leading to budget cuts and the reallocation of spending toward immediate social needs and countercyclical stimulus. The analysis suggests that the impact tends to be entrenched, with both public and private investment expanding only at subdued rates after recessions (figures B1.1.2.A and B1.1.3.A). The effect on public investment tends to be far deeper. In recessions, public investment contracts by about 4 percent—a 9percentage-point drop in the growth rate relative to periods of economic stability.
Financial crises
Currency, sovereign debt, and banking crises are also associated with a strong negative impact on investment. Compared to the dynamics following recessions, however, investment tends to recover faster after financial crises. The investment growth trajectory generally follows a V-shaped pattern around financial crises, and precrisis growth levels are reached two years after a financial shock (figures B1.1.1.B-D).
That said, there are also notable differences in the patterns depending on the type of crisis. Systemic banking crises tend to have the deepest adverse effect in the second year after the initial shock, with both public and private investment contracting by about 3 percent and 2 percent, respectively (figures B1.1.2.B and B1.1.3.B). Banking crises are accompanied by liquidity shortages, higher borrowing costs and rationing, weakened balance sheets, and uncertainty about financial conditions, adversely affecting both public and private investment.
BOX 1.1 Investment dynamics around adverse events in EMDEs (
continued)
FIGURE B1.1.2 Dynamics of private investment growth around recessions and crises
The decline in investment growth around recessions can be largely attributed to private investment. Private investment growth also slows significantly around banking and currency crises, and contracts during debt crises.
A. Recessions
B. Banking crises
C. Debt crises
D. Currency crises
Sources: Investment and Capital Stock Dataset (IMF 2021); Laeven and Valencia (2020); World Bank. Note: Sample includes 117 emerging market and developing economies over the period 1970-2019. Gray areas indicate the event year. Solid lines indicate mean private investment growth; dashed lines indicate 90 percent confidence bands.
Investment also drops sharply during sovereign debt crises (figure B1.1.1.C). Moreover, a deceleration in investment growth is observed in the run-up to a debt crisis: investment growth falls to near-zero levels two years before the crisis and remains negative, on average, over the following three years. Both public and private investment tend to weaken as debt distress induces fiscal consolidation and related capital spending cuts, sovereign risk and borrowing costs rise, and adverse spillovers to the financial sector reduce credit supply and worsen investor sentiment (figures B1.1.2.C and B1.1.3.C).
Currency crises are also associated with a decline in investment (figure B1.1.1.D), especially in public investment, which drops by about 6 percent, while private investment growth decelerates (figures B1.1.2.D and B1.1.3.D). Currency crises
BOX 1.1 Investment dynamics around adverse events in EMDEs (continued
)
FIGURE B1.1.3 Dynamics of public investment growth around recessions and crises
Public investment growth declines significantly during recessions and continues to shrink for up to two years after the start of a recession. Whereas banking and debt crises are associated with a decline in public investment growth, currency crises tend to have much deeper adverse effects.
A. Recessions
Sources: Investment and Capital Stock Dataset (IMF 2021); Laeven and Valencia (2020); World Bank. Note: Sample includes 117 emerging market and developing economies over the period 1970-2019. Gray areas indicate the event year. Solid lines indicate mean public investment growth; dashed lines indicate 90 percent confidence bands.
raise the cost of imports—including capital goods—making investment more expensive and fueling inflation and exchange rate volatility, which undermines investment. Besides eroding fiscal revenues and fiscal space, currency crises may lead to rising debt-servicing costs on external debt, crowding out public investment.
Conclusion
Investment in EMDEs is highly vulnerable to economic downturns and financial turmoil. Particularly sharp and lasting contractions are observed during recessions. Both public and private investment tend to decline in response to adverse shocks, but public investment often experiences deeper and more
B. Banking crises
D. Currency crises
Debt crises
BOX 1.1 Investment dynamics around adverse events in EMDEs
(continued)
prolonged contractions. Although investment tends to recover more quickly after financial crises than after recessions, the pace of recovery differs across types of crises. On average, banking and sovereign debt crises exert more persistent negative effects. The findings underscore the importance of stable macroeconomic conditions and sound policy frameworks that focus on effective fiscal management and the resilience of financial systems—both of which are critical for sustaining investment growth.
Both public and private investment growth in EMDEs slowed significantly in 2010-23 relative to 2000-09, by about one-half (figures 1.3.C and 1.3.D). Average annual private investment growth in EMDEs dropped from 12 percent to 7 percent, and average annual public investment growth declined from 10 percent to 5 percent. The softening of public and private investment growth was especially prominent in commodityexporting EMDEs (figures 1.3.C and 1.3.D). This reflected the mid-2010s collapse in oil and other commodity prices and ongoing commodity market volatility, following a period of rapid investment growth during the commodity price boom in the 2000s (Stocker et al. 2018).
Across regions, the private-investment-to-GDP ratio varies considerably, from 15 percent in MNA to a high of 22 percent in SAR, on average, over the period 2010-23 (figure 1.4.A). The public-investment-to-GDP ratio is quite similar, however, averaging about 6 percent during this period (figure 1.4.B). All regions except EAP and LAC experienced slowing private investment growth in 2010-23 compared to 2000-09 (figure 1.4.C). While public investment growth declined in all regions in 2010-23 relative to 2000-09, it slowed especially sharply in LAC and MNA to less than 3 percent per year (figure 1.4.D). In LAC, slowing public investment growth reflects fiscal challenges, fallout from the global financial crisis, and falling commodity prices. In the MNA region, the sharp slowdown in investment growth can be attributed to economic crises, commodity price shocks, and conflict.
Composition of investment by sectors
Relative to advanced economies, a substantially lower share of manufacturing investment in EMDEs goes to medium-high and high-technology sectors, such as chemicals, machinery and transportation equipment, and computing and communications equipment.3 In the sample of economies with available sectoral investment data, the share of
3 The classification of manufacturing subsectors into low-technology, medium-technology, and medium-high and high-technology categories is based on the value of sectoral research and development expenditure relative to value added, following UNIDO (2024). Similar analysis for the primary and services sectors is not feasible because of limited data availability for EMDEs.
FIGURE 1.4 Public and private investment, by EMDE region
In all EMDE regions, the private-investment-to-GDP ratio was higher in 2010-23 than in 2000-09, with the ratio varying considerably across regions. The public-investment-to-GDP ratio has been more stable, at about 6 percent of GDP in all regions. Private investment growth was slower in 2010-23 than in 2000-09 in four of six EMDE regions, while private investment growth was more sluggish in all regions.
medium-high and high-technology sectors in total manufacturing investment in 201022 was less than one-third in EMDEs, compared to about one-half in advanced economies (figure 1.5.A). About one-half of manufacturing investment in EMDEs during the same period was in low-technology sectors.
The allocation of investment across manufacturing sectors is highly heterogeneous (figures 1.5.B-D). On average, the largest share of investment—in both advanced economies and EMDEs—is associated with the food and beverages sector. It constitutes almost one-fifth of total manufacturing sector investment in advanced economies, and even more—about one-quarter—in EMDEs. The next largest share of investment in both advanced economies and EMDEs is in the chemicals sector—about one-tenth of total manufacturing investment. In contrast to advanced economies, a significant share of investment in EMDEs is also associated with petroleum, metals, and nonmetallic mineral sectors.
B. Public investment as a share of GDP, by region
A. Private investment as a share of GDP, by region
D.
FIGURE 1.5 Investment in manufacturing
Advanced economies tend to have a higher share of investment in medium-high and hightechnology sectors than EMDEs. The average share of medium-high and high-technology sector investment is about 30 percent in EMDEs and 40 percent in advanced economies. On average, a large share of investment is in the food and beverages sector, followed by the chemicals sector, in both advanced economies and EMDEs.
A. Manufacturing investment, by technology intensity, 2010-22
B. Investment in low-tech manufacturing, by sector, 2010-22
Food and beverages
Tobacco products
Textiles
Wearing apparel
Leather products/footwear
Wood and paper products
Coke and petroleum
Metal products
Other manufacturing
0510152025
C. Investment in medium-tech manufacturing, by sector, 2010-22
D. Investment in medium-high-tech and high-tech manufacturing, by sector, 2010-22
Sources: United Nations Industrial Development Organization INDSTAT; World Bank.
Note: Sample includes up to 54 EMDEs and 34 advanced economies. Simple averages. Technological intensity classification of manufacturing sectors is based on research and development expenditure relative to value added, following UNIDO (2024). EMDEs = emerging market and developing economies; ICT = information and communications technology.
Composition of investment by tangible and intangible capital asset types
Aggregate capital stock can be broken down into two broad capital asset types. Tangible capital includes, for example, structures, transportation equipment, and machinery and equipment; intangible capital comprises research and development, software and databases, and other intellectual property.4 Investment in intangibles is important because it can boost economic growth by improving productivity and operational efficiency, driving innovation, and facilitating market access (Adarov et al. 2022; Corrado, Hulten, and Sichel 2005, 2009; Haskel and Westlake 2018).
4 For additional details on the classification and compilation, refer to Adarov and Stehrer (2019). For a discussion of the economic properties of intangibles, refer to Corrado, Hulten, and Sichel (2005, 2009) and Haskel and Westlake (2018).
FIGURE 1.6 Investment, by capital asset type
Most investment in advanced economies and EMDEs is in nonresidential structures, machinery and equipment, and dwellings. Advanced economies direct a far higher share of investment toward intangible capital assets (research and development, computer software, and other intellectual property) than EMDEs, but intangible investment as a share of total investment in EMDEs rose slightly during the 2010s
A. Investment, by capital asset type, 2010-19
Other buildings/structures
Other
Transportation
Research
Software
Telecomm.
Sources: EUKLEMS; LAKLEMS; World Bank.
B. Average share of intangible investment
Note: Other IPP assets = other intellectual property product assets; Telecomm. = telecommunications. Bars show averages over the respective periods by country group. Sample includes 25 advanced economies and 13 EMDEs. EMDEs = emerging market and developing economies.
A. Categories highlighted with orange boxes represent intangible capital assets.
In advanced economies, residential and nonresidential structures are the largest components of investment, together accounting for about half of total investment in 2000-19, on average (figure 1.6.A). Assessment of investment by capital asset type is challenging for EMDEs because of data limitations, but available data for EMDEs in ECA and LAC indicate that most investment in these economies is also in structures.5
Advanced economies tend to have a greater share of investment in intangible capital— about one-fifth of total investment in the 2010s compared with less than one-tenth in EMDEs with available data. In recent years, intensifying digitalization has contributed to a shift in the composition of investment toward intangibles. This change in composition has been more pronounced in advanced economies than in EMDEs (figure 1.6.B).
Investment convergence in EMDEs
Investment growth is essential for EMDEs to catch up with per capita income levels in advanced economies. The “unconditional convergence” hypothesis posits that economies with low per capita incomes should grow faster than advanced economies and catch up to their per capita income levels as productivity increases. Although some EMDEs, notably China, have achieved rapid economic growth and per capita income gains over the past four decades, many of the poorest EMDEs have experienced little or no catchup (Cust, Collier, and Rivera-Ballesteros 2023). Some countries have even regressed relative to advanced economies, a trend worsened by the 2020 global recession (World Bank 2024).
5 These data come from the EUKLEMS and LAKLEMS databases.
Labor productivity, reflecting both the available capital stock per worker and the rate of investment growth, accounts for the majority of the difference in per capita incomes across economies (Kindberg-Hanlon and Okou 2020; Kose and Ohnsorge 2024; Mankiw, Romer, and Weil 1992). EMDEs that converged toward per capita income levels in advanced economies since the 1980s have had, on average, higher investment growth per worker and higher investment-to-GDP ratios than economies that diverged in every decade (figure 1.7.A; box 1.2).6
Per capita income growth also depends on factors such as institutional quality, human capital development, and demographic conditions. In terms of working-age population and employment growth, the trend in EMDEs has been quite different from that in advanced economies (Kose and Ohnsorge 2024). In EMDEs, employment increased from an average of 1.2 billion workers in the 1980s to almost 2.2 billion in the 2010s— an increase of more than 60 percent; in advanced economies, employment grew by only about 30 percent during the same period, to 500 million workers in the 2010s.7
Investment convergence in EMDE regions
EMDEs made steady progress in raising investment per worker during the 2000s, to 15 percent of the level in advanced economies in 2009, an 8-percentage-point increase during the decade. Convergence continued in the following decade, but at a slower pace, with a rise of 4 percentage points from 2010 to 2019, to 21 percent of the level in advanced economies. Excluding China, however, convergence of investment per worker in EMDEs stalled during the 2010s and 2020s, reflecting a combination of decelerating investment growth in EMDEs and comparatively faster population growth than in advanced economies (figure 1.7.B).
Among the EMDE regions, EAP, ECA, and MNA are closest to the level of investment per worker in advanced economies, whereas SAR and SSA are farthest behind (figure 1.7.C). Remarkably strong investment growth in China contributed significantly to lifting investment per worker in EAP from an average of 4 percent of that in advanced economies in 1980-89 to close to 30 percent in 2010-24. The picture is quite different in EAP excluding China, where investment per worker is lower—11 percent of the level in advanced economies in 2010-24, up from about 9 percent in the 1980s.
ECA has made considerable progress in increasing investment per worker as the region became more open to trade and financial flows and much more integrated with advanced economies in Europe. Investment per worker in the region rose from 7 percent of the level in advanced economies in the 1980s to 27 percent in 2010-24. In MNA, an already relatively high level of investment per worker in the 1980s has risen further, to about 33 percent of that in advanced economies, in part reflecting public investment programs supported by export revenues in commodity-exporting EMDEs (World Bank
6 Although convergence and investment-to-GDP ratios are correlated, once other factors are taken into account—such as the quality of institutions—the differences in investment-to-GDP ratios between converging and nonconverging EMDEs become less important (refer to, for example, Kindberg-Hanlon and Okou 2020).
7 Calculated using data on employment from Penn World Table 10.01 (Feenstra, Inklaar, and Timmer 2015).
FIGURE 1.7 Investment convergence patterns
Since the 1980s, economies that converged toward income levels in advanced economies had, on average, higher investment growth per worker than economies that diverged in each decade. The gap between investment per worker in advanced economies and EMDEs remains large. Investment per worker in EMDEs excluding China has stalled at about 14 percent of the advanced-economy level since 2010, following a steady period of catch-up during the 2000s. In LAC and SSA, investment and capital stock per worker relative to advanced economies were lower in 2010-24 than in 1980-89.
A. Investment growth per worker, by convergence experience
B. Investment per worker in EMDEs relative to advanced-economy levels
C. Investment per worker in EMDEs relative to advanced-economy levels, by region
D. Capital stock per worker in EMDEs relative to advanced-economy levels, by region
Sources: Haver Analytics; Penn World Table 10.01 (Feenstra, Inklaar, and Timmer 2015); WDI (database); World Bank.
Note: Sample includes up to 68 EMDEs and 35 advanced economies. EMDEs by region include 8 in EAP, 11 in ECA, 19 in LAC, 9 in MNA, 3 in SAR, and 18 in SSA. EAP = East Asia and Pacific; ECA = Europe and Central Asia; EMDEs = emerging market and developing economies; LAC = Latin America and the Caribbean; LICs = low-income countries; MNA = Middle East and North Africa; SAR = South Asia; SSA = Sub-Saharan Africa.
A. Bars show median investment growth by decade for EMDEs that converged on advanced-economy GDP levels between 1980 and 2022 and countries that diverged over that time frame.
B. Lines show investment per worker in EMDEs, EMDEs excluding China, and LICs relative to advanced-economy ratios.
C.D. Bars show investment per worker and capital stock per worker by EMDE region relative to advanced-economy ratios. Capital stocks are derived from Penn World Table 10.01 and extended to 2024 using investment growth from Global Economic Prospects, Haver Analytics, and World Development Indicators.
2013). Investment per worker in SAR, where the regional economy is dominated by India, remains low—an average of 8 percent of the advanced-economy level since 2010—but has almost quadrupled since the 1980s.
LAC and SSA have not converged toward advanced-economy levels of investment per worker. In SSA, investment per worker relative to advanced economies fell from 7 percent in 1980-89 to 6 percent in 2010-24, because of both sluggish investment
growth in the 1990s and 2010s and rapid population growth. In LAC, a long period of very sluggish investment growth has contributed to a decline in investment per worker from 28 percent of the advanced-economy level in 1980-89 to 20 percent in 2010-24.
The stock of capital per worker shows similar cross-regional patterns to investment per worker. Most EMDE regions have been catching up to advanced economies, with the largest percentage-point increase since the 1980s in EAP and ECA (figure 1.7.D). In all EMDE regions, however, a large gap remains with capital stock per worker in advanced economies, and the size of the gap has increased in LAC and SSA.
Despite strong investment growth during successive decades, LICs have seen a stagnant capital-to-worker ratio from the 1980s to the 2000s and could increase capital per worker only in the 2010s, to 3 percent of the ratio in advanced economies (figure 1.7.B). Much of the productive capital in LICs is in the form of livestock and farm assets (Corral et al. 2020).
Given the importance of investment and capital per worker for worker productivity, higher wages, and living standards, the four-decade trend in investment per worker relative to advanced economies is mirrored in the number of extreme poor living in these regions. While EAP has virtually eliminated extreme poverty since 1990 and the number of extreme poor has plummeted in SAR, the incidence of extreme poverty has stabilized at about 45 percent in SSA in recent years.
Drivers of investment in EMDEs
Numerous macroeconomic developments—including growth, fiscal, financial, and trade developments—likely contribute to investment growth trends. In the decade following the global financial crisis, slowing investment growth was accompanied by slower output growth, a major commodity price collapse, lower and more volatile capital inflows to EMDEs, weakening trade integration, and a substantial buildup of public and private debt (Dlugosch et al. 2025; Kose and Ohnsorge 2020). Periods of government debt buildups have been shown to dampen investment in subsequent years as financial conditions tighten and governments’ fiscal space contracts (Kose et al. 2021). EMDEs with higher public debt growth have experienced lower private investment growth in the last three decades (figures 1.8.A and 1.8.B). Following a decline in the 2000s, debt-toGDP ratios in EMDEs rose substantially in the 2010s and remain elevated in the 2020s (figure 1.8.C)
Economic and policy uncertainty is another commonly assessed determinant of private investment growth, because investors require returns that compensate for investment risk. In many EMDEs, uncertainty inherent in underdeveloped financial markets and regulatory environments limits access to funding for small and medium firms (World Bank 2015). Overall, the level of uncertainty is higher in EMDEs than in advanced economies (Ahir, Bloom, and Furceri 2022). While uncertainty plays a negative role for investment and output growth, the size of the impact depends on the context. Uncer-
FIGURE 1.8 Correlates of investment growth in EMDEs
Some of the most important macroeconomic correlates of total and private investment growth, beyond output growth, are government debt, the level of uncertainty, net capital flows, trade flows, and credit growth. In years when these factors are more favorable, investment growth tends to be higher. These correlates became less supportive of investment growth in the 2010s and 2020s.
A. Differences in total investment growth in EMDEs, by country characteristics
B. Differences in private investment growth for EMDEs, by country characteristics
Sources: Davis (2016); Haver Analytics; Investment and Capital Stock Dataset (IMF 2021); Kose et al. (2022); WDI (database); World Bank.
Note: EMDEs = emerging market and developing economies; LICs = low-income countries.
A.B. Bars show the difference between median total (A) and private (B) investment growth in the top and bottom thirds of the distribution, based on high and low outcomes of investment growth correlates, respectively. A positive value indicates that investment growth is higher when the underlying factor’s outcome is high. “High” and “low” refer to annual change in government real credit growth, the level of uncertainty, government debt-to-GDP ratios, the change in capital flows-to-GDP ratio, and the change in trade openness, in the top and bottom thirds of the distribution, respectively. Differences in medians of subsamples are statistically significant at the 5 percent level or better. Group medians for 69 EMDEs during 1993-2019.
C. Line shows the median debt-to-GDP ratio in up to 152 EMDEs. Dashed lines show the interquartile range.
D. Index shows the GDP-weighted average of the geopolitical risk index of 21 countries. Last observation is March 2025.
E. Bars show five-year averages of growth in global trade in goods and services. Trade is measured as the sum of export and import volumes. Data for 2024 are estimated.
F. Bars show averages by country group. Balanced sample includes 13 advanced economies and 104 EMDEs, of which 20 are LICs.
D. Global economic policy uncertainty index
C. Debt-to-GDP ratios in EMDEs
F. Private credit as a share of GDP
E. Trade growth
tainty has a larger impact in countries with a culturally lower tolerance for uncertainty or in countries where uncertainty amplifies existing constraints, such as limited access to credit (Carriere-Swallow and Cespedes 2013; Hofstede 2001; Inklaar and Yang 2012). Between 1980 and 2019, EMDEs with high uncertainty had lower private investment growth than countries with low uncertainty (figure 1.8.B). Global economic policy uncertainty has risen sharply in the 2020s (figure 1.8.D).
International trade and capital inflows are primary channels through which countries obtain funding for productive investment in new technologies. Along with maturing value chains and emerging trade tensions, trade growth has slowed since the early 2010s (Kose and Ohnsorge 2024). Furthermore, almost two-thirds of EMDEs are commodity exporters and experienced sharp declines in commodity prices after their early 2011 peaks (World Bank 2023). Studies show that higher trade openness is positively related to faster capital accumulation (Alvarez 2017; Sposi, Yi, and Zhang 2021). For example, Wacziarg and Welch (2008) find that, between 1950 and 1998, countries that lowered barriers to trade experienced investment growth that was 1.5 percentage points faster after trade liberalization, on average. Consistent with this finding, private investment growth has been higher in countries that are more open to trade (figure 1.8.B). However, international trade growth has been falling since the global financial crisis (figure 1.8.E).
Capital flows to EMDEs have risen over the past 40 years, but growth has slowed since the global financial crisis, partly because of weak activity in advanced economies. At the same time, there has been a shift away from foreign direct investment (FDI) to non-FDI flows as investors search for investments yielding higher returns than the low interest rates in advanced economies during the 2010s. This change in the composition of flows includes a shift from bank to nonbank flows as institutional investors increasingly participate in EMDE financial markets (Cole et al. 2020; McQuade and Schmitz 2016). Although the literature finds mixed results for the relationship between FDI and output and investment, EMDEs with faster growth of capital inflows as a share of GDP have experienced higher private investment growth (figure 1.8.B).
Credit is vital for funding investment. Over the past four decades, EMDEs with strong real private sector credit growth (from domestic and foreign financial institutions) have had higher private investment growth than those with weak credit growth (figure 1.8.B). Over the last 10 years, however, the link between credit growth and investment has weakened. Although about 40 percent of credit booms were accompanied or followed by investment surges in the three decades before 2010, virtually none of the credit booms in EMDEs recently have had accompanying investment booms (Kose and Ohnsorge 2024). Furthermore, access to private sector credit is highly uneven across EMDEs and lowest in LICs. Compared to advanced economies, credit to the private sector as a share of GDP is lower in EMDEs, especially for loans with long maturities (United Nations 2022). Private credit as a share of GDP in EMDEs rose steadily in the 2000s but remained flat in the 2010s and early 2020s (figure 1.8.F).
Evidence from empirical analysis
To formally assess the main drivers of investment in EMDEs, panel regressions are estimated using a system generalized method of moments framework with data for 52 EMDEs from 1991 to 2022 (annex 1A). This analysis builds on the existing empirical literature on the drivers of investment growth by estimating the impact of macroeconomic, fiscal, and monetary variables on total, private, and public investment growth, following Nabar and Joyce (2009) and Stamm and Vorisek (2023).
The results show that real output growth, real credit growth to the private sector, trade openness, improved sovereign credit ratings, and investment climate reform spurts are statistically significant and positively correlated with real investment growth in EMDEs (table 1A.1). Growing ratios of government debt to GDP, also statistically significant, are associated with lower investment growth. These results align with the drivers of investment growth identified in the literature. The large, positive coefficient on output growth affirms that output growth is the strongest correlate of investment growth for EMDEs and that investment growth moves with the business cycle more than proportionately, a phenomenon known as the accelerator effect (Shapiro, Blanchard, and Lovell 1986).8
Most drivers of total investment are also significant for private investment, and their coefficients are larger. The exceptions are sovereign credit ratings that are no longer significant, and capital flows as a share of GDP show a significant and positive link with private investment growth (table 1A.1). For public investment, the positive correlation with output growth is weaker than for total or private investment. In addition, public investment is more strongly positively correlated than total investment with changes in sovereign credit ratings, and more negatively correlated than total investment with uncertainty. Moreover, the sign of the coefficient on trade openness turns negative in the results for public investment. Public investment is not significantly correlated with any of the other covariates.
Using the regression results, a decomposition of the contribution of significant explanatory variables to predicted total, private, and public investment growth in EMDEs is produced for each year from 2001 to 2019. During the 2000s and the 2010s, the most important correlate of investment growth was output growth, although the size of the contribution was lower in the 2010s, consistent with the slowdown in growth in EMDEs following the global financial crisis (figures 1.9.A-C). Among the covariates other than output growth, credit growth is estimated to have supported total investment growth in EMDEs for every year during the two decades covered by the analysis (figure 1.9.D). After the global financial crisis, rising debt-to-GDP ratios and increasing trade openness are estimated to have hindered investment growth in most years.
The decomposition of the results for public and private investment growth shows important differences in the year-by-year contributions of covariates aside from output
8 Empirical studies of the drivers of investment growth include Garcia-Escribano and Han (2015); IMF (2015); Libman, Montecino, and Razmi (2019); Lim (2014); and Stamm and Vorisek (2023).
FIGURE 1.9 Main drivers of investment growth in EMDEs
Investment growth in EMDEs—whether total, private, or public—is closely correlated with output growth. For private investment growth, other important correlates include credit growth, net capital inflows, changes in trade openness, and changes in the ratio of government debt to GDP. The investment slowdown in the 2010s reflects lower or negative contributions of all these components to private investment growth. For public investment growth, only sovereign credit ratings, the level of economic uncertainty, and trade openness are significant determinants beyond output growth.
Drivers of public investment growth in EMDEs
E. Drivers of private investment growth in excess of GDP growth in EMDEs
Drivers of total investment growth in excess of GDP growth in EMDEs
Source: World Bank.
Note: Details on the measurement and sources of the explanatory variables are provided in annex 1A. EMDEs = emerging market and developing economies.
A.-F. Panels A, B, and C show the contribution of each explanatory variable to predicted total, private, and public investment growth (defined, for each variable, as the coefficient shown in the regression results in columns 1, 2, and 3 of annex table 1A.1 multiplied by the actual value of the variable) for up to 50 EMDEs during 2000-19. For each type of investment growth, panels show only explanatory variables with a statistically significant coefficient (at the 10 percent level or better). Panels D, E, and F highlight smaller but still significant contributions to investment growth after accounting for output growth.
B. Drivers of private investment growth in EMDEs
A. Drivers of total investment growth in EMDEs
D.
C.
F. Drivers of public investment growth in excess of GDP growth in EMDEs
growth. Private investment in EMDEs was continually bolstered by credit growth from 2000 to 2019 (figure 1.9.E). During the decade before the global financial crisis, increasing trade openness and falling debt-to-GDP levels also supported private investment growth; afterward they became a drag on investment growth in most years. Public investment in EMDEs, by contrast, was continually held back by uncertainty in all years from 2000 and 2019 (figure 1.9.F). In the years before the global financial crisis, improvements in sovereign ratings supported public investment growth, while increasing trade openness was a drag. After the global financial crisis, rising trade openness helped boost public investment growth in most years.
A second empirical exercise highlights the importance of institutional reforms. In a sample of up to 60 EMDEs covering 1990-2024 for total investment growth and 19902019 for private investment growth, reform spurts and setbacks are defined as large changes in the International Country Risk Guide investment climate index (annex 1B). This exercise examines investment growth before and after reform events using a fixedeffects regression. Total investment growth responds positively to a reform spurt before returning to trend growth (figure 1.10.A). The response to negative reform setbacks, although less significant, is generally correlated with lower total investment growth (figure 1.10.B). By contrast, private investment growth shows a more sustained positive response to reform spurts, while also decreasing around reform setbacks (figures 1.10.C and 1.10.D).
Conclusion
Global investment growth has decelerated significantly since the 2000s because of the global financial crisis and the COVID-19 pandemic. In recent years, elevated trade tensions, heightened policy uncertainty, and macroeconomic and geopolitical risks have further weighed on investor sentiment and are expected to continue doing so in the near term. At the same time, there is an urgent need for a major investment push to achieve key development goals, such as creating jobs, eradicating extreme poverty, boosting shared prosperity, and addressing climate change.
In light of these challenges, scaling up public and private investment has become a key priority for advanced economies and EMDEs alike. Doing so is particularly difficult, however, for EMDEs, which have emerged from multiple crises with persistent macroeconomic challenges and limited fiscal space, compounding deeper structural challenges. This chapter documents the extent of the investment slowdown in EMDEs, exploring regional and country-group differences, and the key drivers of the weakness and structural shifts in investment. Building on the analysis in this chapter, specific policy options focusing on public investment and private investment are discussed in chapters 3 and 4.
FIGURE 1.10 Investment growth around reform spurts and setbacks in EMDEs
In EMDEs, both total and private investment growth rise around reform spurts before returning to trend growth. The rise in private investment is sustained for longer. Reform setbacks are associated with reduced total and private investment growth.
A. Total investment growth around reform spurts
B. Total investment growth around reform setbacks
Percentage-point deviation
C. Private investment growth around reform spurts
D. Private investment growth around reform setbacks
Source: World Bank.
Note: This figure shows the increase in investment growth around a reform spurt or setback event (t = 0) relative to countries and years not experiencing a reform spurt or setback. The dashed line shows the 95 percent confidence interval. Sample includes 60 EMDEs from 1990 to 2024. Refer to annex 1B for details. CI = confidence interval; EMDEs = emerging market and developing economies.
BOX 1.2 The evolution of investment-to-GDP ratios in EMDEs
Investment in productive assets is necessary to build capital stock, boost growth, and replace depreciating capital. In emerging market and developing economies (EMDEs) excluding China, however, investment as a share of gross domestic product (GDP) has hovered at around 20 percent over the three decades before the global financial crisis. Investment-to-GDP ratios were higher in EMDEs that converged to advancedeconomy per capita incomes over the past few decades. Countries can increase their investment-to-GDP ratios through reforms that boost output growth, facilitate crossborder trade and investment flows, and enhance the quality of institutions.
Introduction
EMDEs have large investment needs to fill infrastructure gaps, reduce greenhouse gas emissions, and bolster resilience to climate change (Gaspar et al. 2019; World Bank 2022b). Achieving long-term development and climate goals hinges on raising investment growth, yet it is also necessary to increase investment as a share of GDP and to ensure that investment is directed to productive assets (OECD 2025; World Bank 2024).a This box addresses two questions:
• How has the investment-to-GDP ratio evolved over time?
• What are the drivers of the investment-to-GDP ratio?
Trends in investment-to-GDP ratios
Since 1980, the investment-to-GDP ratio for EMDEs excluding China hovered around 20 percent of GDP until the global financial crisis, slightly below the advanced-economy average of 22 percent (figure B1.2.1.A). Among EMDEs that converged to advanced-economy per capita income levels between 1980 and 2024, the median investment-to-GDP ratio was about 3 percentage points higher than in EMDEs that did not converge (figure B1.2.1.B). Few EMDEs had substantially higher shares of investment in GDP. For example, only about 1 in 10 EMDEs has maintained an investment-to-GDP ratio above 30 percent since 2000. Among them, China stands out with a ratio of over 40 percent during the same period.
The investment-to-GDP ratio was even higher for advanced economies than for EMDEs excluding China from 1998 until 2007. In contrast, because of the high share of investment relative to GDP in China, EMDEs including China experienced a sharp increase in the investment-to-GDP ratio in the 2000s, before leveling off at 32 percent of GDP after 2013. Because of the high ratio in China,
Note: This box was prepared by Amat Adarov, Menzie Chinn, Hiro Ito, and Kersten Stamm. a. The investment-to-GDP ratio expresses how much of output is used to build and maintain the capital stock.
BOX 1.2 The evolution of investment-to-GDP ratios in EMDEs (
FIGURE B1.2.1 Investment-to-GDP ratios
Over the three decades before the global financial crisis, the investment-to-GDP ratio in EMDEs excluding China averaged about 20 percent of GDP—below the advanced economy average of 22 percent—but picked up slightly in the 2010s while the ratio in advanced economies declined. EMDEs whose per capita incomes converged toward advanced economy levels since 1980 had higher investment-to-GDP ratios than EMDEs that did not converge. In the ECA, SAR, and SSA regions, and in commodityimporting EMDEs, the investment-to-GDP ratio has increased since the 1980s; the ratio has been stable in LAC and in EAP excluding China and has fallen in the MNA region.
A. Investment-to-GDP ratios
B. Investment-to-GDP ratios and convergence of per capita incomes
C. Investment-to-GDP ratios, by EMDE region
D. Investment-to-GDP ratios, by EMDE group
Sources: Haver Analytics; WDI (database); World Bank.
Note: Sample includes 68 EMDEs and 35 advanced economies. EAP = East Asia and Pacific; ECA = Europe and Central Asia; EMDEs = emerging market and developing economies; FCS = fragile and conflict-affected situations; LAC = Latin America and the Caribbean; LICs = low-income countries; MNA = Middle East and North Africa; SAR = South Asia; SSA = Sub-Saharan Africa.
A. The lines show the investment-to-GDP ratio as a percent of GDP (the sum of investment divided by sum of GDP) in the indicated groups of economies.
B. “Converging” and “diverging” EMDEs are those with a higher or lower per capita income, respectively, expressed as a percent of per capita income in advanced economies in 2022 compared to 1980. Bars show medians, and whiskers depict the top- and bottom-quartile thresholds.
C.D. Bars and diamonds show the investment-to-GDP ratio as a percent of GDP (the sum of investment divided by sum of GDP) for each respective group of economies.
BOX 1.2 The evolution of investment-to-GDP ratios in EMDEs
(continued)
East Asia and Pacific (EAP) is the EMDE region with the highest investment-toGDP ratio. Of the six regions, Sub-Saharan Africa (SSA) has the lowest ratio, at 19 percent in the 2010s, lower than the region’s ratio in the 1980s (22 percent of GDP) (figure B1.2.1.C). Since 1980, the investment-to-GDP ratio rose in four of the six regions (East Asia and Pacific, Europe and Central Asia, South Asia, and Sub-Saharan Africa), remained constant in Latin America and the Caribbean (LAC), and fell in the Middle East and North Africa (MNA). Excluding China, EAP also did not see any meaningful change in the investment-to-GDP ratio.
The growth in the investment-to-GDP ratio since the 1980s was driven by commodity importers. For this group of EMDEs, the investment-to-GDP ratio increased by 14 percentage points, from 23 percent of GDP in the 1980s to 37 percent in the 2010s. Excluding China, the ratio still increased by 7 percentage points. Similarly, the ratio increased in low-income countries (LICs) by 16 percentage points. For commodity exporters, the ratio remained flat at about 22 percent (figure B1.2.1.D).
Drivers of the investment-to-GDP ratio
The urgent need to raise investment to meet development and climate goals raises the question of what factors drive the level of investment relative to GDP in EMDEs. The literature suggests that key determinants of investment are domestic GDP growth and growth in advanced economies (Attanasio, Picci, and Scorcu 2000). For investment-to-GDP ratios, cross-country analyses have identified trade and capital inflow growth as important drivers (Bosworth and Collins 1999; Mody and Murshid 2005). The analysis here expands on the earlier literature by using a large sample of EMDEs over a long period: up to 86 EMDEs from 1972 to 2019. Given the variability of investment at the annual frequency, two exercises are conducted: a two-stage least squares regression using five-year averages and system generalized method of moments (GMM) regressions using annual data. For robustness, the five-year regressions and annual regressions are rerun using fixed effects (table B1.2.1).
In the first exercise, because there are likely important country-specific characteristics not captured by observable factors, drivers of investment-to-GDP ratios are estimated using a two-stage least squares model. The analysis examines a sample of 86 EMDEs, using a restricted set of determinants, motivated by the empirical literature on investment shares and investment flows:
yit = α + X ' it β + ε it , (B1.2.1)
where yit is investment as a share of GDP. The data cover the period 1972 through 2019. The data are transformed into five-year panels to focus on
BOX 1.2 The evolution of investment-to-GDP ratios in EMDEs (continued)
medium-term rather than business cycle frequency determinants. In the second exercise, a dynamic model (that is, including a lagged dependent variable) is estimated through the Arellano-Bond GMM instrumental variables approach, using annual data.b
The results of the first exercise show that, in the medium term—at the five-year averaged horizon—output growth, trade openness, and financial development are highly significant and economically meaningful (table B1.2.1). A 1-percentagepoint increase in GDP growth is associated with a rise in the investment-to-GDP ratio of almost 0.5 percent. Similarly, a 1-percentage-point increase in foreign direct investment (FDI) inflows as a share of GDP raises the investment-to-GDP ratio by more than 1.5 percentage points. A growing, young population also contributes to higher investment-to-GDP ratios. The results of the second exercise show that, after accounting for the previous year’s investment level, output growth and uncertainty are key determinants of short-term movements in the investment-to-GDP ratio. Although the coefficient on uncertainty is not large, it is important to note that FDI inflows to EMDEs depend strongly on global—and, to a lesser extent, host country—uncertainty, working through the capital flows channel (Jardet, Jude, and Chinn 2023).
Conclusion
e implications of the empirical results are twofold. First, investment is highly correlated with economic growth. Boosting growth also boosts investment growth. Second, the results indicate that turning around this slowdown and boosting investment will require commitment to improving institutions and to implement fiscal, monetary, and structural reforms; stabilize the macroeconomy; and lower restrictions to international trade and capital flows (Kose and Ohnsorge 2024).
b. The investment-to-GDP ratio, terms of trade, the youth dependency rate, the government budget balance, and FDI as a share of GDP are from the World Development Indicators, International Financial Statistics, and World Economic Outlook databases; the indicator for institutional quality is the first principal component of the International Country Risk Guide Bureaucratic Quality, Law and Order, and Corruption indexes; relative per capita income is calculated using Penn World Table data; trade openness is based on Estefania-Flores et al. (2022); the financial openness index is from Chinn and Ito (2006); the World Uncertainty Index is from Jardet, Jude, and Chinn (2023); and financial development is proxied by private credit to GDP from the World Bank’s Financial Structure database.
BOX 1.2 The evolution of investment-to-GDP ratios in EMDEs
(continued)
TABLE B1.2.1 Correlates of investment-to-GDP ratios
Institutionalquality
0.008* 0.000 0.004* (0.004) (0.004) (0.003) (0.002) Financialopenness 0.004 0.008* 0.003 0.009*** (0.004) (0.004) (0.003) (0.002)
Terms-of-tradevolatility
0.057 0.023 -0.003 (0.075) (0.039) (0.027) (0.020)
GDPgrowth 1.493** 0.458*** 0.215*** 0.243*** (0.633) (0.115) (0.062) (0.034) -0.001 -0.001 -0.001 -0.002* (0.002) (0.002) (0.001) (0.001)
Measureoftradepolicy openness
Tradeopenness 0.034*** 0.012
0.033*** (0.011) (0.018) (0.014) (0.009)
WorldUncertaintyIndex -0.088 -0.042 -0.047**
(0.187) (0.087) (0.137) (0.029)
(0.024) (0.018)
Source: World Bank.
Note: In the 2SLS model, real output growth is instrumented with changes in the unemployment rate and regional dummies. In the system GMM estimation, youth dependency ratio, institutional quality, the Chinn-Ito index, terms-oftrade volatility, trade policy openness, trade openness, the uncertainty index, FDI inflows, and the dummy for oil exporters are included as exogenous instruments. All regressions include time fixed effects (five-year period or year). ***, **, and * denote statistical significance at the 1, 5, and 10 percent levels, respectively. 2SLS = two-stage least squares model; FDI = foreign direct investment; FE = fixed effects model; System GMM = system generalized method of moments model.
ANNEX 1A Determinants of investment growth in EMDEs: Empirical framework
Investment decisions are based on the expected marginal return of capital and the riskadjusted cost of financing the investment. While public investment decisions may also involve other considerations, private investment accounts for the majority of investment in EMDEs, about three-quarters of total gross fixed capital formation.
Therefore, investment is modeled as the level of investment, I, chosen such that the marginal product of capital (MPK ) equals the cost of capital, which is the sum of the risk-adjusted real interest rate r and the rate of depreciation of capital δ, absent binding constraints:
Consequently, I also depends on the determinants of the marginal product of capital— especially total factor productivity (TFP) and the existing stock of capital, K. Because investment decisions pertain to expected future returns to capital, the cost of capital also includes a risk premium, π:
A higher cost of capital—whether due to higher risk premiums or higher risk-free real interest rates—reduces investment, whereas higher productivity, lower depreciation, or a lower capital stock raises it.
To proxy these factors, the regression includes real output growth, terms-of-trade growth, real credit growth, changes in capital flows as a percent of GDP, and a dummy for investment reform spurts. Because exports are included in GDP, output growth captures trade growth beyond the impact through terms of trade.
Data sources
Real investment growth is calculated from real gross fixed capital formation, taken primarily from Haver Analytics and, where data are not available, from the World Bank’s World Development Indicators (WDI) or Global Economic Prospects (GEP). Private and public investment are from the Investment and Capital Stock Dataset of the International Monetary Fund (IMF). Public and private investment growth are derived by applying that data set’s public and private investment shares to the real investment values from GEP, Haver Analytics, and the WDI before calculating growth rates.
Data for the covariates of investment growth are derived from a variety of sources. Real output growth is taken from GEP. Real credit growth to the private sector is from the Bank for International Settlements, supplemented with data from the IMF’s International Financial Statistics (IFS). Trade growth is from WDI. Capital flows are calculated as the sum of FDI, portfolio flows, and changes in external bank liabilities
from IFS. Missing data for the three capital flow variables are imputed by taking the average of adjacent years. This imputation is limited to at most two consecutive missing observations per economy. Investment climate reform spurts are calculated using the investment profile index from the PRS Group’s International Country Risk Guide. Reform spurts are defined as a two-year increase in the index exceeding two times the country-specific standard deviation. The uncertainty index is the World Uncertainty Index from Ahir, Bloom, and Furceri (2022). Data on sovereign credit ratings and debtto-GDP ratios are from Kose et al. (2022). Sovereign credit ratings are converted into a numerical score from 1 (worst) to 21 (best) and averaged across three rating agencies. The data set includes a panel of 52 EMDEs covering 1991-2022 for total investment and 51 EMDEs covering 1991-2021 for private and public investment.
Methodology
The analysis estimates the correlates of investment growth in EMDEs in a system generalized method of moments (GMM) framework, using the third to sixth lag to instrument the differenced equation and second lag for the level equation. These GMM instruments are applied to output growth, real credit growth, growth in capital flows, and terms-of-trade growth. The econometric framework is similar to that of Nabar and
TABLE 1A.1 Drivers of investment growth in EMDEs
Changeincreditrating(indexpoints)
Source: World Bank.
Note: Results from a system generalized method of moments (GMM) regression, using lags 3 to 6 for difference equation. All independent variables except for economic uncertainty and investment climate reform spurts are GMM-type instruments. Sample of 52 EMDEs from 1991 to 2022 for total investment, and from 1991 to 2019 for public and private investment. t statistics in parentheses. ***, **, and * denote statistical significance at the 1, 5, and 10 percent levels, respectively. EMDEs = emerging market and developing economies.
Joyce (2009). However, this chapter focuses on investment growth—a critical component of overall output growth and ultimately the source of rising living standards. In contrast, changes in the investment-to-GDP ratio capture only shifts in investment growth relative to output growth. The use of investment growth is in line with recent studies on advanced economies and individual EMDEs.9 The results are presented in table 1A.1. The terms-of-trade, real credit growth, and capital-flow variables exclude the top and bottom 1 percent of observations in the entire sample to address outliers. Standard errors are clustered at the country level.
ANNEX 1B Investment growth and reforms
A panel regression examines the evolution of total and private investment growth around reform spurts and setbacks, shown in figure 1.10. Reform spurts and setbacks are defined as a deviation of the investment profile index by two times the countryspecific standard deviation of the index. An increase represents a reform spurt, and a decrease a reform setback. Data on institutional quality are taken from the investment profile index contained in the International Country Risk Guide published by the PRS Group. The sample includes 60 EMDEs over 1990-2024 for total investment and 59 EMDEs over 1990-2019 for private investment. There are 37 reform spurt and 8 reform setback events for total investment, and 37 reform spurts and 6 reform setbacks for private investment.
In the regression table (annex table 1B.1), t denotes the end year of a two-year reform spurt window, and s the end year of a two-year reform setback. The coefficients are dummy variables from three years before the event to two years after the event, that is, [t - 3, t + 2] or [s - 3, s + 2 ]. Coefficients show the difference in percentage points between investment growth in economies around the event and economies that did not experience a reform event. The regressions include economy and year fixed effects. Column 1 shows the results for the regression using total investment growth as dependent variable, and column 2 the results for private investment growth.
9 Banerjee, Kearns, and Lombardi (2015); Barkbu et al. (2015); Bussiere, Ferrara, and Milovich (2016); and Kothari, Lewellen, and Warner (2015) cover advanced economies. Anand and Tulin (2014) cover India.
TABLE 1B.1 Investment growth around reform spurts and setbacks
Source: World Bank.
Note: The regression includes time and country-fixed effects. t indicates the period of the significant reform spurt, and s the period of the significant reform setback. Robust standard errors are in parentheses. The sample includes 60 EMDEs over 1990-2024 for total investment and 59 EMDEs over 1990-2019 for private investment. ***, **, and * denote statistical significance at the 1, 5, and 10 percent levels, respectively. EMDEs = emerging market and developing economies.
References
Adarov, A., D. Klenert, R. Marschinski, and R. Stehrer. 2022. “Productivity Drivers: Empirical Evidence on the Role of Digital and Intangible Capital, FDI and Integration.” Applied Economics 54 (48): 5515-31.
Adarov A., and R. Stehrer. 2019. “Tangible and Intangible Assets in the Growth Performance of the EU, Japan and the US.” Research Report 442, Vienna Institute for International Economic Studies, Vienna.
Ahir, H., N. Bloom, and D. Furceri. 2022. “The World Uncertainty Index.” NBER Working Paper 29763, National Bureau of Economic Research, Cambridge, MA.
Alvarez, F. 2017. “Capital Accumulation and International Trade.” Journal of Monetary Economics 91 (C): 1-18.
Anand, R., and V. Tulin. 2014. “Disentangling India’s Investment Slowdown.” IMF Working Paper 14/47, International Monetary Fund, Washington, DC.
Attanasio O. P., L. Picci and A. E. Scorcu. 2000. “Saving, Growth, and Investment: A Macroeconomic Analysis Using a Panel of Countries.” The Review of Economics and Statistics 82 (2): 182-211.
Banerjee, R., J. Kearns, and M. Lombardi. 2015. “(Why) Is Investment Weak?” BIS Quarterly Review (March): 67-82.
Barkbu, B., S. P. Berkmen, P. Lukyantsau, S. Saksonovs, and H. Schoelermann. 2015. “Investment in the Euro Area: Why Has It Been Weak?” IMF Working Paper 15/32, International Monetary Fund, Washington, DC.
Bernanke, B. S. 2017. “When Growth Is Not Enough.” Remarks delivered at the European Central Bank Forum on Central Banking, Sintra, Portugal, June 26-28.
Beyer, R. C. M., A. Narayanan, and G. M. Thakur. 2022. “Natural Disasters and Economic Dynamics: Evidence from the Kerala Floods.” Policy Research Working Paper 10084, World Bank, Washington, DC.
Black, S., J. Chateau, F. Jaumotte, I. W. H. Parry, G. Schwerhoff, S. D. Thube, and K. Zhunussova. 2022. “Getting on Track to Net Zero: Accelerating a Global Just Transition in This Decade.” Staff Climate Note 2022/010, International Monetary Fund, Washington, DC.
Bosworth, B. P., S. M. Collins, and C. M. Reinhart. 1999. “Capital Flows to Developing Economies: Implications for Saving and Investment.” Brookings Papers on Economic Activity 1999 (1): 143-80.
Bussiere, M., L. Ferrara, and J. Milovich. 2016. “Explaining the Recent Slump in Investment: The Role of Expected Demand and Uncertainty.” IMF Research Bulletin 17 (1): 1-3.
Caballero, R. J., and A. Simsek. 2020. “Asset Prices and Aggregate Demand in a ‘Covid19’ Shock: A Model of Endogenous Risk Intolerance and LSAPs.” NBER Working Paper 27044, National Bureau of Economic Research, Cambridge, MA.
Carriere-Swallow, Y., and L. F. Cespedes. 2013. “The Impact of Uncertainty Shocks in Emerging Economies.” Journal of International Economics 90 (2): 316-25.
Cerra, V., R. Lama, and N. Loayza. 2021. “Links Between Growth, Inequality, and Poverty.” Policy Research Working Paper 9603, World Bank, Washington, DC.
Chinn, M. D., and H. Ito. 2006. “What Matters for Financial Development? Capital Controls, Institutions, and Interactions.” Journal of Development Economics 81 (1): 16392.
Cole, S., M. Melecky, F. Moelders, and T. Reed. 2020. “Long-Run Returns to Impact Investing in Emerging Markets and Developing Economies.” NBER Working Paper 27870, National Bureau of Economic Research, Cambridge, MA.
Corrado, C., J. Hulten, and D. Sichel. 2005. “Measuring Capital and Technology.” In Measuring Capital in the New Economy, edited by C. Corrado, J. Haltiwanger, and D. Sichel, 11-14. Chicago: University of Chicago Press.
Corrado, C., C. Hulten, and D. Sichel. 2009. “Intangible Capital and US Economic Growth.” The Review of Income and Wealth 55 (3): 661-85.
Corral, P., A. Irwin, N. Krishnan, D. G. Mahler, and T. Vishwanath. 2020. Fragility and Conflict: On the Front Lines of the Fight against Poverty. Washington, DC: World Bank.
Cust, J., P. Collier, and A. Rivera-Ballesteros. 2023. “Are the Poorest Catching Up?” Policy Research Working Paper 10622, World Bank, Washington, DC.
Dlugosch, D., B. Westmore, M. Glanville, J. Hooley, and F. Ozturk. 2025. “Understanding the Weakness in Business Investment: A Cross-Country Analysis.” OECD Economics Department Working Paper 1836, OECD Publishing, Paris.
Estefania-Flores, J., D. Furceri, S. A. Hannan, J. D. Ostry, and A. K. Rose. 2022. “A Measurement of Aggregate Trade Restrictions and their Economic Effects.” IMF Working Paper 22/1, International Monetary Fund, Washington, DC.
EUKLEMS (database). Bontadini. F., C. Corrado., J. Haskel., M. Iommi., C. JonaLasinio. “EUKLEMS & INTANProd: Industry Productivity Accounts with Intangibles.” https://euklems-intanprod-llee.luiss.it.
Feenstra, R. C., R. Inklaar, and M. P. Timmer. 2015. “The Next Generation of the Penn World Table.” American Economic Review 105 (10): 3150-82.
Garcia-Escribano, M., and F. Han. 2015. “Credit Expansion in Emerging Markets: Propellor of Growth?” IMF Working Paper 15/212, International Monetary Fund, Washington, DC.
Gaspar, V., D. Amaglobali, M. Garcia-Escribano, D. Prady, and M. Soto. 2019. “Fiscal Policy and Development: Human, Social, and Physical Investment for the SDGs.” Staff Discussion Note 2019/003, International Monetary Fund, Washington, DC.
Guénette, J. D., M. A. Kose, and N. Sugawara. 2022. “Is a Global Recession Imminent?” Equitable Growth, Finance, and Institutions Policy Note 4, World Bank, Washington, DC.
Haskel, J., and S. Westlake. 2018. Capitalism Without Capital. The Rise of the Intangible Economy. Princeton and Oxford: Princeton University Press.
Hofstede, G. H. 2001. Culture’s Consequences: Comparing Values, Behaviors, Institutions, and Organizations across Nations. Thousand Oaks, CA: Sage.
IEA (International Energy Agency). 2021. Net Zero by 2050 A Roadmap for the Global Energy Sector. Paris: IEA.
IEA (International Energy Agency), IRENA (International Renewable Energy Agency), UNSD (United Nations Statistics Division), World Bank, and WHO (World Health Organization). 2025. Tracking SDG 7: The Energy Progress Report 2025. Washington, DC: World Bank.
IMF (International Monetary Fund). 2015. “Private Investment: What’s the Holdup?” In World Economic Outlook Adjusting to Lower Commodity Prices. October. Washington, DC: IMF.
IMF (International Monetary Fund). 2021. “Investment and Capital Stock Dataset.” Macroeconomic and Financial Data. IMF, Washington, DC. https://data.imf.org/? sk=1ce8a55f-cfa7-4bc0-bce2-256ee65ac0e4.
IMF (International Monetary Fund). 2023. “People’s Republic of China: Staff Report for the 2022 Article IV Consultation.” Staff Country Reports 2023/67, IMF, Washington, DC.
Inklaar, R., and J. Yang. 2012. “The Impact of Financial Crises and Tolerance for Uncertainty.” Journal of Development Economics 97 (2): 466-80.
IPCC (Intergovernmental Panel on Climate Change). 2022. Climate Change 2022: Mitigation of Climate Change. IPCC Sixth Assessment Report. Cambridge, U.K., and New York: Cambridge University Press.
Jardet, C., C. Jude, and M. Chinn. 2023. “Foreign Direct Investment under Uncertainty: Evidence from a Large Panel of Countries.” Review of International Economics 31 (3): 854-85.
Kindberg-Hanlon, G., and C. Okou. 2020. “Productivity Convergence: Is Anyone Catching Up?” Policy Research Working Paper 9278, World Bank, Washington, DC.
Kose, M. A., S. Kurlat, F. Ohnsorge, and N. Sugawara. 2022. “A Cross-Country Database of Fiscal Space.” Journal of International Money and Finance 128 (November): 102682.
Kose, M. A., P. Nagle, F. Ohnsorge, and N. Sugawara. 2021. Global Waves of Debt: Causes and Consequences. Washington, DC: World Bank.
Kose, M. A., and F. Ohnsorge, eds. 2020. A Decade after the Global Recession: Lessons and Challenges for Emerging and Developing Economies. Washington, DC: World Bank.
Kose, M. A., and F. Ohnsorge, eds. 2024. Falling Long-Term Growth Prospects: Trends, Expectations, and Policies. Washington, DC: World Bank.
Kose, M. A., N. Sugawara, and M. E. Terrones. 2020. “Global Recessions.” Policy Research Working Paper 9172, World Bank, Washington, DC.
Kothari, S. P., J. Lewellen, and J. B. Warner. 2015. “The Behavior of Aggregate Corporate Investment.” MIT Sloan Research Paper 5112-14, Massachusetts Institute of Technology, Cambridge, MA.
LAKLEMS (database). Latin America and the Caribbean (LAKLEMS) database. http:// laklems.net.
Laeven, L., and F. Valencia. 2020. “Systemic Banking Crises Database II.” IMF Economic Review 68(2): 307-61.
Libman, E., J. A. Montecino, and A. Razmi. 2019. “Sustained Investment Surges.” Oxford Economic Papers 71 (4): 1071-95.
Lim, J. L. 2014. “Institutional and Structural Determinants of Investment Worldwide.” Journal of Macroeconomics 41 (September): 160-77.
Mankiw, G., D. Romer, and D. N. Weil. 1992. “A Contribution to the Empirics of Economic Growth.” Quarterly Journal of Economics 107 (2): 407-37.
McQuade, P., and M. Schmitz. 2016. “The Great Moderation in International Capital Flows: A Global Phenomenon?” ECB Working Paper 1952, European Central Bank, Frankfurt.
Mody, A. and A.P. Murshid. 2005. “Growing Up with Capital Flows.” Journal of International Economics 65 (1): 249-66.
Nabar, N., and J. Joyce. 2009. “Sudden Stops, Banking Crises, and Investment Collapses.” Journal of Development Economics 90 (2): 163-89.
OECD (Organisation for Economic Co-operation and Development). 2025. “OECD Economic Outlook, Volume 2025 Issue 1: Tackling Uncertainty, Reviving Growth, No. 117.” OECD Publishing, Paris.
Rozenberg, J., and M. Fay, eds. 2019. Beyond the Gap: How Countries Can Afford the Infrastructure They Need while Protecting the Planet. Washington, DC: World Bank.
Shapiro, M. D., O. J. Blanchard, and M. C. Lovell. 1986. “Investment, Output, and the Cost of Capital.” Brookings Papers on Economic Activity 1986 (1): 111-64.
Sposi, M., K.-M. Yi, and J. Zhang. 2021. “Trade Integration, Global Value Chains and Capital Accumulation.” IMF Economic Review 69 (3): 505-39.
Stamm, K., and D. Vorisek. 2023. “The Global Investment Slowdown: Challenges and Policies.” Policy Research Working Paper 10364, World Bank, Washington DC.
Stiglitz, J. E. 2020. “The Pandemic Economic Crisis, Precautionary Behavior, and Mobility Constraints: An Application of the Dynamic Disequilibrium Model with Randomness.” NBER Working Paper 27992, National Bureau of Economic Research, Cambridge, MA.
Stocker, M., J. Baffes, M. Some, D. Vorisek, and C. Wheeler. 2018. “The 2014-16 Oil Price Collapse in Retrospect: Sources and Implications.” Policy Research Working Paper 8419, World Bank, Washington, DC.
UNIDO (United Nations Industrial Development Organization). 2024. International Yearbook of Industrial Statistics 2024. Vienna: UNIDO.
UNIDO (United Nations Industrial Development Organization) INDSTAT. 2025. INDSTAT: Industrial Statistics Database (ISIC Rev. 3). Vienna: UNIDO. https:// stat.unido.org/indstat.
United Nations. 2022. The Sustainable Development Goals Report 2022. New York, NY: United Nations.
Wacziarg, R., and K. H. Welch. 2008. “Trade Liberalization and Growth: New Evidence.” World Bank Economic Review 22 (2): 187-231.
WDI (database). World Development Indicators. World Bank. https://databank. worldbank.org/source/world-development-indicators.
WHO (World Health Organization) and UNICEF (United Nations Children’s Fund). 2023. Progress on Household Drinking Water, Sanitation and Hygiene 2000-2022: Special Focus on Gender. Geneva: WHO and UNICEF.
World Bank. 2005. Economic Growth in the 1990s: Learning from a Decade of Reform Washington, DC: World Bank.
World Bank. 2013. Investing in Turbulent Times. Middle East and North Africa Economic Development and Prospects series October. Washington, DC: World Bank. World Bank. 2015. “From Billions to Trillions: Transforming Development Finance.” Development Committee Paper, World Bank, Washington, DC.
World Bank. 2022a. Climate and Development: An Agenda for Action—Emerging Insights from World Bank Group 2021-22 Country Climate and Development Reports Washington, DC: World Bank.
World Bank. 2022b. Global Economic Prospects. January. Washington, DC: World Bank.
World Bank. 2023. Global Economic Prospects. January. Washington, DC: World Bank. World Bank. 2024. Global Economic Prospects. January. Washington, DC: World Bank. World Bank. 2025. “Update to the Poverty and Inequality Platform (PIP): What’s New.” Global Poverty Monitoring Technical Note 47. Washington, DC: World Bank.
Never mind the lofty ambitions. To meet even the most modest development and climate goals will require a staggering amount of additional investment—trillions of dollars per year. The price tag will be steepest in developing economies, where the need to speed up growth, reduce extreme poverty, and cut greenhouse gas emissions is greatest.
Indermit Gill (2024) Senior Vice President and Chief Economist, World Bank Group

CHAPTER 2
The Magic of Investment Accelerations

Investment fuels economic growth, helps create jobs and reduce poverty, and is indispensable in addressing climate change and achieving other key development goals in emerging market and developing economies (EMDEs). Investment accelerations—sustained periods of rapid investment growth—can boost development. During these episodes over the past seven decades, investment growth in EMDEs was typically higher than 10 percent per year, more than three times the growth rate in other years. Investment accelerations often coincide with transformative growth and improved macroeconomic conditions. Output growth typically increases by about 2 percentage points and productivity growth rises by 1.3 percentage points per year during investment accelerations in EMDEs. In most of these episodes, inflation falls, fiscal and external balances improve, employment grows, and the national poverty rate declines. Policy has a large bearing on the likelihood of an investment acceleration. Most episodes of investment acceleration follow or are accompanied by policy shifts intended to improve macroeconomic stability, structural reforms, or both. These policy actions are particularly conducive to sparking investment accelerations when combined with well-functioning institutions. A benign external environment is also found to play a role in catalyzing investment accelerations.
Introduction
Over the past two decades, capital accumulation is estimated to have accounted for more than half of potential output growth in EMDEs, highlighting the critical role of investment in driving economic growth (figure 2.1.A).1 Yet investment growth in these economies has undergone a prolonged, broad-based slowdown since the global financial crisis of 2008-09 (chapter 1). During the 2020 global recession triggered by the COVID-19 pandemic, investment contracted far more deeply than during the 2009 global recession, and the recovery of investment in EMDEs after the pandemic has been much weaker than over a comparable number of years following the 2009 global recession (chapter 1).
Prolonged, weak investment growth in EMDEs exacerbates the challenges associated with sizeable unmet investment needs in many of these economies. Substantial investment is required to fill infrastructure gaps, enable adaptation to climate change, facilitate
Note: This chapter was prepared by Jakob de Haan, Kersten Stamm, and Shu Yu, with contributions from Marie Albert, Jongrim Ha, Reina Kawai, Philip Kenworthy, Jeetendra Khadan, Dohan Kim, Emiliano Luttini, Joseph Mawejje, Valerie Mercer-Blackman, Guillermo Verduzco-Bustos, and Collette Wheeler. The analysis builds on de Haan, Stamm, and Yu (2025).
1 Throughout the chapter, investment is defined as real gross fixed capital formation, including private and public investment.
FIGURE 2.1 Investment, long-term growth, and development
Capital accumulation is a key driver of potential output growth. Yet EMDEs have large unmet investment gaps. They especially need a resilient and low-carbon pathway of growth.
A. Contributions to average annual potential output growth
B. Climate adaptation financing gap in developing countries
Sources: Kose and Ohnsorge (2024); UNEP (2023); World Bank.
Note: “Investment” refers to gross fixed capital formation. EMDEs = emerging market and developing economies.
A. Potential growth estimates are derived by applying a standard growth accounting framework to decompose output growth into estimated contributions of the growth in factor inputs and the growth of total factor productivity. Advanced economy and EMDE averages are calculated using GDP weights at average 2010-19 prices and market exchange rates. Sample includes 30 advanced economies and 53 EMDEs. Refer to Kose and Ohnsorge (2024) for estimation details.
B. Comparison of adaptation financing needs, modeled costs, and actual international public adaptation finance flows (red) in developing countries. Values for needs and flows are for this decade through 2030, whereas international public finance flows are for 2021. Domestic and private finance flows are excluded.
the energy transition away from fossil fuels, accelerate poverty reduction, and advance shared prosperity (figure 2.1.B; chapter 1).2
Although there is extensive discussion about the urgent need to raise investment growth, there is limited research on investment accelerations—defined as periods of sustained, relatively rapid investment growth. A fuller understanding of these accelerations could provide useful lessons for achieving long-term growth and development goals in EMDEs.
This chapter addresses the following questions:
• What are the main features of investment accelerations?
• What are the key macroeconomic and development outcomes associated with investment accelerations?
• What policy interventions are most likely to spark investment accelerations?
Contributions. The chapter makes several contributions to the literature. Building on research identifying accelerations in real gross domestic product (GDP) per capita, the chapter provides a novel focus on investment accelerations. Previous literature typically examined the drivers of investment growth in the context of standard cross-country
2 A review of the recent literature on investment needs is provided in Stamm and Vorisek (2023).
growth regressions.3 The event-study approach employed here demonstrates a strong link between investment accelerations on one hand and initial conditions and policy interventions on the other.4
The chapter presents a comprehensive analysis of the evolution of key macroeconomic and financial variables during investment accelerations. This analysis explores the macroeconomic correlates of investment accelerations, such as capital accumulation, total factor productivity (TFP) growth, and employment growth, which contribute to output growth. It also studies how some key macroeconomic and financial indicators— such as fiscal balances, trade, exchange rates, and credit—evolve around these episodes. It also analyzes the association between investment accelerations and key development outcomes, such as changes in poverty and inequality.
The chapter uses empirical analyses and country case studies to examine the linkages between policies and investment accelerations. The empirical models assess the roles of initial conditions and policy interventions in triggering an investment acceleration. They also consider the interplay between policies and institutional environments in accelerating investment. The case studies focus on the experiences of selected countries to present more detailed accounts of the roles of policies, initial conditions, and the external environment in specific investment accelerations.
Findings. The chapter presents five principal findings. ..
First, investment accelerations have occurred in many EMDEs but have become less common. is chapter identifies 192 investment accelerations in 93 economies (34 advanced economies and 59 EMDEs) during 1950-2022. On average, the probability that an EMDE experiences an investment acceleration in any decade is 40 percent. During 2000-09, about half of EMDEs experienced an investment acceleration. By 2010-22, the share dropped to one-quarter. In parallel, the external environment became less supportive and the domestic reform momentum of the early 2000s diminished (Kose and Ohnsorge 2019; Stamm and Vorisek 2023). For advanced economies, the probability of an investment acceleration occurring was unchanged between 2000-09 and 2010-22.
Second, faster investment growth is often driven by both the public and private sectors. The median annual growth of investment is 10.4 percent in EMDEs during investment accelerations, slightly more than three times the growth rate of 3.2 percent in other years. During many episodes, public and private investment both accelerate. The extent
3 Macroeconomic studies of cross-country investment include Anand and Tulin (2014); Caselli, Pagano, and Schivardi (2003); and Qureshi, Diaz-Sanchez, and Varoudakis (2015). Kose et al. (2017) and World Bank (2019, 2023a) also examine investment trends and correlates in a large sample of EMDEs.
4 Hausmann, Pritchett, and Rodrik (2005) and Jong-A-Pin and de Haan (2011) identify output accelerations and show that they are related to trade, investment, and positive regime changes. Jones and Olken (2008) document that most countries experience output accelerations and slowdowns. Berg, Ostry, and Zettelmeyer (2012) find that adverse external shocks and macroeconomic volatility reduce the duration of output accelerations, and that strong institutions are positively correlated with longer-lasting accelerations.
of the increase in public and private investment growth around investment accelerations was similar across EMDE regions.
Third, investment accelerations often coincide with periods of transformative growth. During investment accelerations, output growth in EMDEs reaches 5.9 percent per year, 1.9 percentage points higher than in other years. This rapid growth rate translates into a GDP expansion of almost two-fifths over six years, almost one-and-a-half times the median expansion during a comparable period outside investment accelerations. Investment accelerations boost capital accumulation, increase employment growth, and strengthen productivity growth. Specifically, an investment acceleration in EMDEs is typically associated with an increase of almost 1.3 percentage points in annual TFP growth, from slightly above zero in other years. Because investment accelerations support faster shifts of resources from less productive sectors to more productive sectors, they tend to coincide with faster employment and output growth in the manufacturing and services sectors.
Fourth, investment accelerations are associated with better macroeconomic and development outcomes. Investment accelerations are frequently accompanied by improved fiscal balances, faster credit expansion, and larger net capital inflows. In addition, they often coincide with better development outcomes, including faster poverty reduction, lower inequality, and improved access to infrastructure, such as the internet.
Fifth, policies help ignite investment accelerations. The empirical analysis and country case studies yield several key observations about the role of policies in investment accelerations. Policy interventions that improve macroeconomic stability—such as fiscal consolidations and inflation targeting—and structural reforms, including measures that ease cross-border trade and financial flows, have been instrumental in sparking investment accelerations. Although individual policy interventions have played a role, countryspecific comprehensive packages of policies fostering macroeconomic stability and addressing structural issues tend to be more potent in driving investment accelerations. When a country’s primary fiscal balance and openness to trade and financial flows improve substantially, the probability of igniting an investment acceleration increases by 9 percentage points. Country cases, such as the Republic of Korea in the late 1990s and Türkiye in the early 2000s, illustrate the potential efficacy of comprehensive policy packages. High-quality institutions, such as a well-functioning and impartial legal system, are critical for the success of policy interventions in starting investment accelerations. The likelihood of investment accelerations and the ultimate impact of policy reforms have been greater in countries with stronger institutions.
Identification and features of investment accelerations
An event study is used to identify investment accelerations. The approach, presented in detail in annex 2A, follows previous studies on accelerations of output and capital stock, and is adjusted to ensure that the identified episodes are characterized by sustained
increases in per capita investment growth to a relatively rapid rate.5 The identification methodology imposes several main criteria, based on the data and the literature:
• Sustained. Each episode must be sustained for at least six years. The duration of episodes is selected to exclude purely cyclical rebounds in investment growth (Barro and Sara-i-Martin 1992; Christiano and Fitzgerald 2003). Based on the length of six years and the sample’s end year of 2022, the latest year an acceleration can start is 2017.
• Rapid. The average annual growth rate of investment in the acceleration (of at least six years) must be at least 4 percent. Only one-third of the countries in the sample had a median annual per capita investment growth rate exceeding 4 percent between 1950 and 2022. Given the volatile nature of investment growth, a 4 percent threshold was selected because it is sufficiently high, and surpassing an average growth rate of 4 percent is unlikely to be driven by one year of very high growth.
• Higher growth rate. To ensure that the episode is an acceleration, the average per capita growth rate of investment must be at least 2 percentage points higher than the average of the previous six years. In addition, to ensure that the episode is not merely a cyclical recovery, the capital stock at the end of the period must exceed its pre-episode peak.
An acceleration is considered to end when per capita investment growth turns negative or when the inclusion of the current year reduces the average annual per capita investment growth rate since the start of the acceleration to below 4 percent. Investment accelerations can end for a variety of reasons: diminishing returns to capital stock that naturally reduce the average investment growth rate, domestic shocks driven by the accumulation of macroeconomic and financial imbalances, or external shocks such as a regional or global financial crisis. In general, accelerations have rarely been followed by crises or major recessions: four-fifths of those in the sample were not followed by a currency, debt, or banking crisis in the four years after the acceleration.
The rest of the chapter focuses on growth rates of investment, output, and other macroeconomic variables in the three stages around an investment acceleration— namely, before, during, and after, with during capturing the full duration of acceleration years. To report comparable statistics across these three stages, the analysis focuses mainly on the medians of changes in variables in each stage.
Using a sample of 104 economies, the method identifies 192 investment accelerations in 93 economies (34 advanced economies and 59 EMDEs) during the period 1950-2022. For a typical country, the probability of an investment acceleration in any given decade
5 Hausmann, Pritchett, and Rodrik (2005), Jong-A-Pin and de Haan (2011), and Libman, Montecino, and Razmi (2019) employ similar methods to identify output and capital stock accelerations (refer to annex 2A). Alternative rules (involving the duration of episodes and other thresholds used in the baseline event study) do not change the headline results (refer to annex 2C for an extensive list of sensitivity exercises).
is 44 percent, slightly higher than the probability in EMDEs (40 percent). Among the countries that experienced at least one investment acceleration, fewer than one-third had three or more. In countries with multiple accelerations, the average time between two episodes was about 10 years, with a few exceptions.
Eleven of the economies in the sample experienced no acceleration. These economies had periods of rapid investment growth, but no true accelerations. In some countries, investment was so volatile that no significant increase in investment growth lasted as long as six years (Guatemala and Iceland). In other countries, periods of rapid investment growth followed declines in the capital stock, were relatively short-lived, and were insufficient to raise the capital stock to its preacceleration peaks (Côte d’Ivoire, Ghana, Niger, South Africa).
Distribution of accelerations over time and across countries
Globally, 42 percent of countries had an investment acceleration in the 2000-09 (figure 2.2.A). In the following decade, only about a quarter of the world’s economies had one. This decline was fully accounted for by EMDEs, because the share of advanced economies with accelerations was virtually unchanged (figure 2.2.B). The wave of investment accelerations in these economies during the early 2000s was partially supported by benign global conditions, strong cross-border trade and financial flows, and structural reforms that improved many countries’ policy frameworks (Kose and Ohnsorge 2019). Since the 2008-09 global financial crisis, the combination of an increasingly difficult external environment and a loss of domestic reform momentum has weighed on investment growth in EMDEs (Stamm and Vorisek 2023).
On average, an EMDE experienced about 1.7 investment accelerations between 1950 and 2022, compared with about 2.2 such episodes, on average, for an advanced economy (figure 2.2.C). Low-income countries (LICs) typically experienced fewer investment accelerations than high-income countries, but numbers were similar to those typically seen in EMDEs (figure 2.2.D). Across EMDE regions, the highest number of investment accelerations per country (nearly 2.4) occurred in East Asia and Pacific (EAP), which registered much higher investment growth than other regions over the past seven decades (figure 2.2.E). Reflecting the high volatility of their investment, commodity exporters, economies facing fragile and conflict-affected situations (FCS), and small states experienced fewer investment accelerations than other EMDE groups (figure 2.2.F).
Amplitude and duration of accelerations
In EMDEs, the median annual growth rate of investment was typically 10.4 percent in an investment acceleration during 1950-2022, just over three times the median growth rate of 3.2 percent in other nonacceleration years (figure 2.3.A). The rate of investment growth typically exceeded 5 percent in the first year of an acceleration episode and peaked at 13 percent in the following year (figure 2.3.B). In one-fourth of the episodes, annual investment growth reached a peak of at least 21 percent. EMDEs typically
FIGURE 2.2 Frequency of investment accelerations
For EMDEs, the share of investment accelerations peaked in the 2000s and fell by about half in the 2010s. More investment accelerations per country have been observed in East Asia and Pacific, on average, than in other EMDE regions. Investment accelerations have occurred less frequently in commodity exporters, fragile and conflict-affected situations, and small states—groups of countries where output growth performance is relatively volatile.
A. Share of countries with investment accelerations, by decade
Percent of countries
Average (1950-2022)
E. Number of investment accelerations, by EMDE
B. Share of countries with investment accelerations, by decade and country group
Average Total (RHS)
Sources: Haver Analytics; Penn World Table (Feenstra, Inklaar, and Timmer 2015); WDI (database); World Bank.
Note: Sample includes 192 investment accelerations in 93 economies, including 34 advanced economies and 59 EMDEs. EAP = East Asia and Pacific; ECA = Europe and Central Asia; EMDEs = emerging market and developing economies; FCS = fragile and conflictaffected situations; HICs = high-income countries; LAC = Latin America and the Caribbean; LICs = low-income countries; LMICs = lower-middle-income countries; UMICs = upper-middle-income countries; MNA = Middle East and North Africa; SAR = South Asia; SSA = Sub-Saharan Africa.
A.B. Bars and diamonds show the share of countries starting an investment acceleration during the corresponding decade. The red line in A shows the long-run average share of countries starting an investment acceleration over the past seven decades. The number of accelerations in the 1950s is constrained to episodes starting in 1956 or later by the filter criteria.
C.-F. Bars show the average number of investment
country over the period 1950-2022; diamonds show the total number of episodes between 1950 and 2022.
E.F. The sample contains EMDEs
FIGURE 2.3 Investment growth during accelerations
During an investment acceleration, the annual investment growth rate has typically reached 9 percent, significantly higher than the pace of the preceding and following years, by 7 and 8 percentage points, respectively.
A. Investment growth around investment accelerations, world
B. Investment growth accelerations, world
Sources: Haver Analytics; Penn World Table (Feenstra, Inklaar, and Timmer 2015); WDI (database); World Bank. Note: The sample includes 192 investment acceleration episodes in 93 economies, including 34 advanced economies and 59 EMDEs. EAP = East Asia and Pacific; ECA = Europe and Central Asia; EMDEs = emerging market and developing economies; FCS = fragile and conflict-affected situations; LAC = Latin America and the Caribbean; MNA = Middle East and North Africa; SAR = South Asia; SSA = Sub-Saharan Africa.
A.C.E.F. Bars show median annual investment growth during the six years before, the entire duration of, and the six years after an investment acceleration. At the 10 percent level, differences between before, during, and after periods are statistically significant unless otherwise specified.
A.C. Red tick mark indicates the median investment growth rate during nonacceleration years in the sample.
B.
D. Duration of investment accelerations
C.
F.
experienced a greater increase in investment growth than advanced economies. Reflecting higher volatility of investment, EMDEs also typically saw a larger decline in investment growth over the subsequent six years than did advanced economies (figure 2.3.C). Most accelerations lasted six to seven years, with a median duration of seven years. Onefifth of accelerations lasted longer than 10 years (figure 2.3.D). The basic pattern of investment growth over the three stages of acceleration episodes shows only minor differences across EMDEs in different regions and country groups (figures 2.3.E and 2.3.F).
During investment accelerations, median private and public investment growth typically rose sharply at the beginning of the acceleration. The increase in public investment growth was sustained evenly during the median acceleration (figure 2.4.A). Similar to total investment growth, however, private investment growth peaked in the second year of the acceleration (figure 2.4.B). Both private and public investment growth improved significantly from the preceding six years—by about 7 percentage points per year globally—and somewhat more in EMDEs than in advanced economies (figures 2.4.C and 2.4.D). Of the 192 accelerations, just over half featured higher private than public investment growth (figure 2.4.E). Across the six regions, Latin America and the Caribbean (LAC) and Sub-Saharan Africa (SSA) had the lowest shares of accelerations with higher private than public investment growth—37 percent in LAC and almost 32 percent in SSA. The subsequent decline in growth was slightly more pronounced in private than public investment—by about 1 to 2 percentage points a year—perhaps because of the supportive role that fiscal policy tends to play in periods of weaker private investment growth. The decline in private investment after accelerations was also more pronounced in EMDEs than in advanced economies. The behavior of public and private investment growth around investment accelerations did not differ much across EMDE regions (figure 2.4.F).
Correlates of investment accelerations
Investment accelerations are associated with faster output growth because they help boost capital accumulation and the growth in productivity and employment, and because they tend to be accompanied by significant shifts of resources from less productive to more productive uses. Investment accelerations tend to coincide with improvements in some key macroeconomic and financial variables. In addition, they are associated with stronger progress toward some of the key development goals, such as reductions in poverty and inequality and increased access to infrastructure.
Output growth and its underlying channels
Output growth has tended to surge during investment accelerations (figure 2.5.A). In EMDEs, output growth reached 5.9 percent per year during investment accelerations over the period 1950-2022—1.9 percentage points more than in other years (figure 2.5.B). This rapid growth rate translates into an expansion of almost 40 percent in GDP over a six-year period, more than one-and-a-half times the expansion in a comparable six-year period outside acceleration years (figure 2.5.C). In advanced economies, output
FIGURE 2.4 Public versus private investment during investment
accelerations
Both public and private investment growth have increased during investment accelerations. Although the rise and subsequent decline in growth has been similar in magnitude in regard to both private and public investment in EMDEs, the rise and decline in private investment has been more notable than that in public investment in advanced economies.
A. Public investment growth around investment accelerations, world
B. Private investment growth around investment accelerations, world
investment growth
investment
D. Private investment growth around investment accelerations
Sources: Haver Analytics; Investment and Capital Stock Dataset (IMF 2021); Penn World Table (Feenstra, Inklaar, and Timmer 2015); WDI (database); World Bank.
Note: Sample includes 192 investment acceleration episodes in 93 economies, including 34 advanced economies and 59 EMDEs. EAP = East Asia and Pacific; ECA = Europe and Central Asia; EMDEs = emerging market and developing economies; LAC = Latin America and the Caribbean; MNA = Middle East and North Africa; SAR = South Asia; SSA = Sub-Saharan Africa.
A.B. t = 0 refers to the start year of an investment acceleration episode. The blue line shows the median; the red dashed lines show the 25th and 75th percentile of investment growth (public in A, private in B) in each year around an investment acceleration.
C.D.F. Bars show median annual investment growth during the six years before, the entire duration of, and the six years after an investment acceleration. At the 10 percent level, differences between before, during, and after periods are statistically significant unless otherwise specified.
C.D.
in the
C.
FIGURE 2.5 Growth of output during investment accelerations
Output growth has risen notably during investment accelerations. In EMDEs, annual output growth has typically reached 5.9 percent during an investment acceleration—about 2 percentage points higher than that in other years. Cumulatively, GDP has typically expanded by two-fifths during an investment acceleration. The increase in output growth during these episodes has varied across EMDE regions.
A. Output growth during investment accelerations, world
B. Output growth around investment accelerations
Sources: Penn World Table (Feenstra, Inklaar, and Timmer 2015); WDI (database); World Bank.
Note: Sample includes 192 investment acceleration episodes in 93 economies, including 34 advanced economies and 59 EMDEs. EAP = East Asia and Pacific; ECA = Europe and Central Asia; EMDEs = emerging market and developing economies; FCS = fragile and conflict-affected situations; LAC = Latin America and the Caribbean; LICs = low-income countries; MNA = Middle East and North Africa; SAR = South Asia; SSA = Sub-Saharan Africa.
A. t = 0 refers to the start of an investment growth acceleration. The blue line shows the median; the red dashed lines show the 25th and 75th percentile of output growth in each year around an investment acceleration.
B.E.F. Bars show median annual GDP growth during the six years before, the entire duration of, and the six years after an investment acceleration. The red tick marks in B indicate the median GDP growth rate during nonacceleration years in the sample. At the 10 percent level, differences between before, during, and after periods are statistically significant unless otherwise specified.
C.D.
growth also increases during acceleration years, but less so than in EMDEs. Over a sixyear period, GDP grew by almost 30 percent (figure 2.5.D). In LICs, output growth was higher during accelerations than before and after them, but not to a statistically significant extent, partly because of the highly volatile nature of output growth in these economies and the small sample of LICs (figure 2.5.E). Similarly, FCS display very volatile growth in periods before accelerations, with higher growth during and after accelerations. For small states, GDP growth rose particularly rapidly during accelerations, from 2.5 percent before an investment acceleration to more than 7.4 percent during one. After accelerations, output growth fell back to 4.7 percent. For small states, these changes in output growth are statistically significant. The boost to output growth also varies by EMDE region. The largest increase in output growth is observed in the South Asia (SAR) and SSA regions (figure 2.5.F).
Capital accumulation
Investment accelerations are associated with stronger output growth directly through their links with faster capital accumulation (Kose and Ohnsorge 2024; Loayza and Pennings 2022). Capital accumulation alone accounted for 45 percent of output growth during investment accelerations globally over 1950-2022 (figure 2.6.A). The share of output growth explained by capital accumulation is markedly higher in EMDEs— almost half—than in advanced economies, where it accounts for one-third during these episodes (figure 2.6.B). This contribution remains sizable after accelerations, contributing to 77 percent of growth in EMDEs, compared with 48 percent before the acceleration. Globally, the annual growth rate of the capital stock typically increased by almost 50 percent from its preceding level during an investment acceleration, reaching 5.2 percent, and kept growing at a faster rate after an acceleration compared with before (figure 2.6.C). For EMDEs, the pickup in capital stock growth during investment accelerations was significantly larger, and from lower initial levels, than for advanced economies. Growing at 6.2 percent a year, the capital stock in EMDEs expanded by nearly 44 percent over the first six years of an investment acceleration, almost 45 percent more than the expansion over a similar period outside an acceleration. The increase in capital stock growth rates during an acceleration varies by EMDE region, income group, and the type of economy. For example, the largest increases in capital stock growth during an acceleration, when compared to the previous six years, are observed in the EAP region (3 percentage points) and SSA region (3.5 percentage points) (figure 2.6.D).
The increase is even larger in LICs. During an acceleration, capital stock growth in LICs jumped by about 4 percentage points, albeit from a relatively low baseline (figure 2.6.E).
The highest increase in capital stock growth occurs in small states, with an increase of over 4 percentage points (figure 2.6.F).
Productivity growth
Investment accelerations are also often accompanied by increased TFP growth (figure 2.7.A). During 1950-2022, TFP typically grew by 1.7 percent a year in EMDEs during accelerations, significantly faster than in other years (figure 2.7.B). Although TFP growth tends to return close to its preceding rate after accelerations in advanced econo-
FIGURE 2.6 Contributions to GDP growth during investment accelerations
Capital accumulation made a major contribution to output growth in 1950-2022, especially in EMDEs. During an investment acceleration in EMDEs, annual growth of capital almost doubled from its preceding rate. Both TFP growth and employment growth contributed more to output growth during investment accelerations than during other periods.
A. Decomposition of GDP growth during accelerations, world
B. Decomposition of GDP growth during accelerations, by country group
Sources: Haver Analytics; Penn World Table (Feenstra, Inklaar, and Timmer 2015); WDI (database); World Bank.
Note: Sample includes 192 investment acceleration episodes in 93 economies, including 34 advanced economies and 59 EMDEs.
EAP = East Asia and Pacific; ECA = Europe and Central Asia; EMDEs = emerging market and developing economies; FCS = fragile and conflict-affected situations; HICs = high-income countries; LAC = Latin America and the Caribbean; LICs = low-income countries; LMICs = lower-middle-income countries; MNA = Middle East and North Africa; SAR = South Asia; SSA = Sub-Saharan Africa; TFP = total factor productivity; UMICs = upper-middle-income countries.
A.B. Bars show the median contribution of TFP growth, capital accumulation, and labor to output growth. Capital accumulation and labor are weighted by the labor share.
C.-F. Bars show median annual capital stock growth during the six years before, the entire duration of, and the six years after an investment acceleration. The red tick marks in C indicate the median capital stock growth rate during nonacceleration years in the sample. At the 10 percent level, differences between these periods are statistically significant unless otherwise specified.
D. For all regions except EAP and LAC, the difference in capital
between during and after the acceleration is not statistically significant.
E. For LMICs, the difference in capital
F. For small states, the
and
D. Capital stock growth around investment accelerations, by EMDE region
C. Capital stock growth around investment accelerations
FIGURE 2.7 Total factor productivity growth, employment growth, and sectoral shifts around investment accelerations
Investment accelerations have often been accompanied by improvements in productivity growth, stronger employment growth, and greater reallocation across sectors.
B. TFP growth around investment accelerations, by country group
Sources: Dieppe (2021); Haver Analytics; Penn World Table (Feenstra, Inklaar, and Timmer 2015); WDI (database); World Bank; World Economic Outlook Database.
Note: Sample includes up to 192 investment acceleration episodes in 93 economies, including 34 advanced economies and 59 EMDEs. EMDEs = emerging market and developing economies; TFP = total factor productivity.
A. t = 0 refers to the start year of an investment acceleration episode. The blue line shows the median; red dashed lines show the interquartile range of TFP growth in each year around an acceleration.
B.-F. At the 10 percent level, differences between before, during, and after periods are statistically significant unless otherwise specified.
B.-D. Bars show median annual growth (median annual change in the employment rate in D) during the six years before, the entire duration of, and the six years after an investment acceleration. Red tick marks indicate the median annual growth (annual change in the employment rate in D) during nonacceleration years.
C. Difference between before and during for advanced economies is not statistically significant.
E.F. Bars show median annual sector output (in E; employment in F) growth during the six years before, the duration of, and the six years after an investment acceleration. In E, the difference in output growth between the before and during periods for the agriculture sector is not statistically significant. In F, the difference in growth rates in the agriculture sector during and after the acceleration is not statistically significant, as is the difference in the growth rate of
in the
before and during the acceleration.
A. TFP growth around investment accelerations
D. Change in employment rate around investment accelerations, by country group
C. Change in labor productivity growth around investment accelerations
F. Employment growth, by sector, around investment accelerations
mies, it dropped below its preacceleration pace in EMDEs. Along with TFP growth, labor productivity growth, one of the main drivers of per capita income growth, also significantly increases during these episodes (figure 2.7.C).
Employment growth
Investment accelerations were often accompanied by significant increases in employment growth (figure 2.7.D). Globally, the employment rate expanded by 0.3 percentage point per year during accelerations, compared with slight contractions in the six years before and after them. Although still significant, the pickup in employment growth during investment accelerations in EMDEs was smaller than in advanced economies, but EMDEs avoided a decrease in the employment rate after accelerations and advanced economies did not.
Sectoral shifts
Investment accelerations are also associated with higher productivity growth through intersectoral resource shifts (Dieppe 2021; Hoyos, Libman, and Razmi 2021). During an investment acceleration, the composition of employment typically moved significantly away from the agriculture sector toward manufacturing and services, and output growth in manufacturing and services rose sharply (figure 2.7.E). The pace of sectoral shifts has tended to gain momentum during accelerations, because the growth rates of employment in the manufacturing and services sectors tend to be significantly higher than in other years (figure 2.7.F). The reallocation of workers from less productive sectors to more productive sectors is a substantial source of productivity growth— particularly in recent decades in EMDEs, such as China. For example, estimates suggest that such reallocations accounted for about two-thirds of productivity growth in LICs in the decades leading up to the global financial crisis (Dieppe 2021).
Other macroeconomic and financial correlates
During investment accelerations, both public and private consumption growth improved significantly, by about 1 and 1.6 percentage points a year globally, respectively (figure 2.8.A). In EMDEs, the increase in the growth of public consumption (including all government current expenditures) during accelerations was comparable to that in private consumption; in advanced economies, public consumption increased much less. Both public and private consumption growth tended to fall back to pre-acceleration rates.
Fiscal balances have tended to improve during investment accelerations (figure 2.8.B). Globally, the primary balance (which excludes net interest on government debt) shifted from a small deficit in the preceding six years to a small surplus during accelerations. In EMDEs, the primary balance remained unchanged, and the overall fiscal deficit narrowed by about 1 percentage point of GDP. During accelerations, the government debtto-GDP ratio fell by 9 percentage points both in EMDEs and globally, largely reflecting, in EMDEs, both faster GDP growth and improvements in primary balances. However, as output growth moderated after investment accelerations, improvements in fiscal and primary balances have tended to erode.
FIGURE 2.8 Macroeconomic indicators around investment accelerations
Investment accelerations in EMDEs have been accompanied by improvements in key macroeconomic variables: both private and public consumption growth have picked up; fiscal deficits and government debt, relative to GDP, have declined; the growth of credit has increased; and inflation has declined. While the growth of both imports and exports has picked up during such accelerations, the rise in imports growth has been relatively larger in EMDEs, partly reflecting their greater reliance on imports for capital goods.
Sources: Ha, Kose, and Ohnsorge (2021); Haver Analytics; International Monetary Fund, International Financial Statistics; Penn World Table (Feenstra, Inklaar, and Timmer 2015); WDI (database); World Bank; World Economic Outlook Database.
Note: Sample includes up to 192 investment acceleration episodes in 93 economies, including 34 advanced economies and 59 EMDEs, between 1950 and 2022. EMDEs = emerging market and developing economies; FDI = foreign direct investment; REER = real effective exchange rate.
A.-F. Bars show the median values for the six years before, the entire duration of, and six years following investment accelerations. At the 10 percent level, differences between before, during, and after periods are statistically significant unless otherwise specified.
B. For EMDEs, differences between before and during in primary and fiscal deficits are not statistically significant.
C. For world and EMDE current accounts, differences between before and during, and during and after are not statistically significant.
D. For EMDE capital inflows, differences between during and after are not statistically significant.
E. For
F. For world
and
B. Fiscal indicators
A. Public and private consumption growth
Trade growth has tended to increase significantly during investment accelerations, partly reflecting shifts of resources to the tradable manufacturing sector and increased growth in imports of capital goods (figure 2.8.C; Irwin 2021; Lee 1995). Both import and export growth increased markedly during accelerations, with import growth roughly tripling the rate before accelerations. The surges in import and export growth were slightly larger in EMDEs than in advanced economies; the larger increase in import growth in EMDEs may partly reflect EMDEs’ greater reliance on imports for capital goods. As a result of the growth of imports relative to exports, current account deficits tended to widen somewhat in EMDEs and globally during and after accelerations.
Capital inflows increased notably during investment accelerations (figure 2.8.D). In EMDEs, capital inflows rose by about 2 percentage points of GDP during accelerations, relative to their preceding levels, partly because of increases in foreign direct investment (FDI) inflows relative to GDP. Increases in capital inflows appear to have supported some investment accelerations in EMDEs—such as those in Türkiye in the 2000s and Poland in the 1990s (refer to box 2.1). Increases in capital inflows were often sustained after the accelerations.
Both domestic credit and gross domestic saving grew significantly faster during investment accelerations. In EMDEs, credit growth increased by about 4.5 percentage points a year during accelerations, and the real interest rate fell by more than half (figure 2.8.E). Growth of saving increased by 3 percentage points a year. The increases in both credit growth and saving growth were larger in EMDEs than in advanced economies. Whereas saving growth tended to moderate after investment accelerations in EMDEs, credit growth tended to remain elevated. Accelerations that were supported by credit growth lasted longer and saw significantly higher output growth than accelerations that were not accompanied by credit growth.
Falling inflation rates have often preceded or accompanied investment accelerations (for example, Korea in the late 1990s; refer to box 2.1). Globally, annual inflation fell during 1950-2022, from about 7 percent before to about 4 percent during accelerations; in EMDEs, it dropped from 8 percent to 6 percent (figure 2.8.F). These low inflation rates were typically sustained after investment accelerations (particularly after the 1980s).
Real effective exchange rates have not changed materially during investment accelerations but have risen slightly (and statistically significantly) afterward, with domestic currencies thus appreciating in real effective terms (figure 2.8.F). There is evidence that, at least in EMDEs, a competitive exchange rate can facilitate capital accumulation both through households’ saving and investment behaviors and by expanding the tradable sector, which supports investment growth.6 Some countries, such as Germany, Japan,
6 Rodrik (2008) argues that currency undervaluation helps the rapid development of the tradable sector, which is more reliant on investment in EMDEs. Bleaney and Greenaway (2001) suggest that there are two reasons why currency overvaluation can hurt investment in SSA: (1) overvaluation reduces the returns to investment in the tradables sector, and (2) the accompanying current account deficit may cause a tightening of import licensing procedures, which further reduces the returns to investment. There are also drawbacks, such as increases in income inequality and lack of product diversification, associated with currency undervaluation (Bergin 2022; Ribeiro, McCombie, and Lima 2020).
and Korea, have at times relied largely on exports to achieve faster growth. These countries eventually had to allow their currencies to appreciate after the period of rapid growth (Rodrik 2008).
Development outcomes
During investment accelerations, more progress has often been made in reducing both poverty and inequality (figures 2.9.A and 2.9.B). Typically, the share of the population in extreme poverty barely changed in the six years before an investment acceleration in 1950-2022, but it declined significantly—0.2 percentage point per year—during the acceleration. Similarly, the Gini coefficient, which measures income inequality, tended to fall significantly during an investment acceleration after rising slightly in the years preceding it. Measured at national poverty lines, the fall in poverty was even more pronounced with a 0.5-percentage-point improvement in the national poverty headcount ratio per year.
Access to infrastructure improved during investment accelerations. For example, the share of the population with access to basic sanitation increased by 0.4 percentage point globally during investment accelerations, while the incidence of stunting among children aged 5 or younger fell by 0.6 percentage point (figure 2.9.C). Since the 1990s, access to the internet has also tended to rise significantly during investment accelerations: 2.4 percent of the population per year gained access to the internet during a typical acceleration, two times the increase during the prior period (figure 2.9.D).
These gains in development outcomes were underpinned by the rapid increase in per capita output growth during investment accelerations, which led to faster income convergence toward advanced-economy income levels (figures 2.9.E and 2.9.F). Specifically, the median per capita output growth in EMDEs was 0.6 percentage point higher than in advanced economies (4.3 percent compared with 3.7 percent). In contrast, EMDEs registered weaker per capita output growth than advanced economies in other years (1.8 percent versus 2.1 percent per year).
Drivers of investment accelerations
A rich body of empirical research has shown that investment growth in a country is affected by both global (or regional) conditions and the country’s initial conditions, economic policies, and institutional settings.7 However, the literature has not considered the roles of these factors in sparking investment accelerations. This section presents the
7 Kose et al. (2017) show how the slowdown in investment growth in EMDEs following the global financial crisis was driven by spillovers from slowing growth in advanced economies, heavier debt burdens, and falling commodity prices. Libman, Montecino, and Razmi (2019) show how capital stock accumulation is positively correlated with higher human capital endowments, exchange rate undervaluation, low capital-output ratios, and net capital outflows. Manzano and Saboin (2022) find that higher institutional quality is correlated with capital stock accelerations. Stamm and Vorisek (2023) document the contribution of the COVID-19 pandemic to the slowdown in investment growth and show how the weak investment recovery coincides with subdued growth in output, trade, productivity, and credit, and high debt levels.
FIGURE 2.9 Development outcomes during investment accelerations
Investment accelerations have typically been accompanied by faster poverty reduction, larger improvements in income equality and human development indicators, and greater enhancements in access to infrastructure than at other times.
A. Change in extreme poverty headcount
B. Change in Gini coefficient
Change in Gini index, 0-100
BeforeDuringAfterBeforeDuringAfter Extreme poverty headcount National poverty headcount
C. Change in incidence of stunting
D. Change in access to infrastructure
F. Cumulative change in output per capita around
Sources: Penn World Table (Feenstra, Inklaar, and TImmer 2015); SDGs Global Dashboard; WDI (database); World Bank. Note: EMDEs = emerging market and developing economies.
A.-D. Bars are medians of the annual changes in the corresponding indicators during the six years before, entire duration of, and six years after investment accelerations. Sample includes up to 192 investment acceleration episodes in 93 economies, including 34 advanced economies and 59 EMDEs, between 1950 and 2022. At the 10 percent level, differences between before, during, and after periods are statistically significant unless otherwise specified.
A. The difference in national poverty change between before and during is not significant for the world but is statistically significant for EMDEs.
B. The Gini coefficient is a measure of income inequality. The smaller the coefficient, the more income is equally distributed.
D. Data availability limited to 1998 and later. Differences for basic sanitation indicator not statistically significant.
E. Bars show median per capita growth of output in the six years before, entire duration of, and six years following an acceleration. Red tick marks indicate medians for nonacceleration years.
F. Cumulative change is based on the median growth rates shown in E and calculated for a six-year period.
FIGURE 2.10 Initial conditions and the start of investment accelerations
Economies with better institutional quality and a more competitive exchange rate are more likely to experience an investment acceleration. Additionally, benign global economic conditions have also tended to increase the likelihood of accelerations. Conversely, the probability of initiating an investment acceleration tends to be lower with higher levels of per capita GDP.
A. Probability an acceleration will start, by institutional quality
B. Probability an acceleration will start, by exchange rate undervaluation
C. Probability an acceleration will start, by global GDP growth
D. Probability an acceleration will start, by per capita GDP
Sources: Haver Analytics; Penn World Table (Feenstra Inklaar, and Timmer 2015); PRS Group, International Country Risk Guide; WDI (database); World Bank.
Note: Figure is based on the regression results of table 2B.1, column (6). Refer to annex 2B for a description of the data and sources.
A. The bars show the predicted probability of an investment acceleration at different levels of the lagged International Country Risk Guide Law and Order index. Yellow whiskers refer to the 90 percent confidence interval. The percentile thresholds of the index are 3, 4, and 5.
B. The bars show the predicted probability of an investment acceleration at different levels of the lagged exchange rate undervaluation index. Yellow whiskers refer to the 90 percent confidence interval. The percentile thresholds of the log index are -0.32, -0.01, and 0.25.
C. The bars show the predicted probability of an investment acceleration at different levels of lagged global GDP growth. Yellow whiskers refer to the 90 percent confidence interval. The percentile thresholds are 2.1 percent, 2.8 percent, and 3.5 percent.
D. The bars show the predicted probability of an investment acceleration at different levels of lagged per capita GDP levels (in logs). Yellow whiskers refer to the 90 percent confidence interval. The percentile thresholds are 8.3 , 9.2, and 10.1.
results of a series of empirical exercises and compares them with insights from the country case studies (box 2.1) on how these factors help trigger investment accelerations.
Initial conditions
Initial conditions have influenced the onset of investment accelerations. For example, economies with higher institutional quality have been more likely to experience an investment acceleration: specifically, moving from the bottom quartile to the top quartile in institutional quality increases the probability of starting an investment acceleration by 5.6 percentage points (figure 2.10.A). Similarly, a more undervalued
currency is associated with a significantly higher likelihood of an investment acceleration, whereas overvalued currencies have often been a sign of macroeconomic and financial imbalances (figure 2.10.B). In EMDEs, a competitive exchange rate can facilitate capital accumulation either by boosting higher-income households’ propensity to save and invest or by supporting the tradables sector (Gluzmann, Sturzenegger, and Levy-Yeyati 2012, 2013; Guzman, Ocampo, and Stiglitz 2018). In both cases, maintaining a competitive currency may help initiate and sustain investment accelerations.
Benign global economic conditions, proxied by strong global output growth, also substantially increase the likelihood of an acceleration (figure 2.10.C). In the sample period of this study, raising global GDP growth from the bottom to the top quartile— from 2.1 percent to 3.5 percent—increased the probability of starting an investment acceleration by 4.7 percentage points, on average. Several of the country case studies (box 2.1) illustrate how commitment to comprehensive reforms enables countries to seize on supportive external factors, such as high commodity prices or international assistance. The probability of an investment acceleration also increased significantly in countries with lower per capita income (figure 2.10.D). For instance, the likelihood of an acceleration was about one-fourth higher in countries in the bottom quartile of income per capita compared with those in the top quartile.
Macroeconomic policies and structural reforms
Investment accelerations have often been preceded or accompanied by policy measures to improve macroeconomic stability or to reduce restrictions on cross-border trade or financial flows. An improved primary fiscal balance or reduced capital flow restrictions tended to precede or accompany about a third of investment accelerations during 19562017. Trade restrictions were relaxed by policy measures before 70 percent of accelerations in this period. The adoption or tightening of an inflation target was followed or accompanied by 10 percent of accelerations (figures 2.11.A and 2.11.B).8
A combination of more stringent fiscal policies, the adoption of an inflation target, and structural reforms to promote trade and financial openness can raise the likelihood of an investment acceleration by more than might be inferred from the effects of each of these individual policy improvements in isolation (figures 2.11.C and 2.11.D). Using the sample of accelerations, it is estimated that improving the primary balance and trade and financial openness indexes by 1 standard deviation would lead to a marked increase of 9 percentage points in the probability of starting an investment acceleration. If these reforms were also accompanied by the adoption of an inflation-targeting regime, the probability would rise by an additional 33 percentage points.9 These results underline
8 Inflation targeting has become a policy tool in recent decades, with New Zealand being the first economy adopting it in 1990 in the sample. It is typically implemented as a one-time policy measure.
9 Specifically, a 1-standard-deviation increase in all of the following three policy measures (excluding the adoption of inflation-targeting) results in 9-percentage-point increase in the probability of starting an acceleration: a 1-standard-deviation increase involves a 35 percent increase in the capital openness index (ranges from 0 to 1 with a higher value indicating more capital openness), an 8 percent increase in the trade openness index (ranges from 0 to 1 with a higher value indicating more trade openness), and a 2.3-percentage-point increase in the primary balance. For details, refer to annex 2B.
FIGURE 2.11 Policy improvements and the start of investment accelerations
Improvements in the primary fiscal balance, the adoption or reduction of inflation targets, and structural reforms that increase openness to international trade or financial flows have been conducive to investment accelerations. The scale of the effects of improvements in the fiscal balance and trade liberalization have depended on the institutional environment.
A. Share of investment accelerations preceded by fiscal or monetary policy improvements
B. Share of investment accelerations preceded by structural policy improvements
C. Average marginal effect of an improvement in fiscal or monetary policy F. Average marginal effect of a reduction in trade restrictions, by institutional quality E. Average marginal effect of an improvement in primary balance, by institutional quality
D. Average marginal effect of an improvement in international trade or capital flow restrictions
Sources: Alesina et al. (2020); Chinn and Ito (2008); International Monetary Fund, International Financial Statistics; PRS Group, International Country Risk Guide; WDI (database); World Bank; World Economic Outlook Database.
Note: Refer to annex 2B for a description of the data and sources. EMDEs = emerging market and developing economies.
A.B. Bars show the share of investment accelerations that were preceded by or coincided with an improvement in the policy variables of at least 2 percent (trade restrictions index or capital account openness index) or 2 percentage points of GDP (primary balance) or an adoption or tightening of an inflation target all within the preceding five years. For the trade restrictions index, primary balance to GDP ratio, and capital account openness index, an improvement is an increase in the variable. Data on inflation targeting are available from 1990.
C.D. Panels are based on regression results shown in table 2B.2. Bars show the average marginal effect of improvements in economic policies. Yellow whiskers refer to the 90 percent confidence interval.
E.F. Panels are based on regression results shown in table 2B.2. Bars show the average marginal effect of improvements in economic policies at different quartiles of the institutional quality index (based on International Country Risk Guide’s Law and Order index). Yellow whiskers refer to the 90 percent confidence interval. The quartile thresholds for institutional quality are 3,
the case for a comprehensive package of stabilization and reform policies to spark an investment acceleration.
The country cases also highlight the role of policies aimed at stabilizing the macroeconomy and implementing structural reforms, particularly as part of a comprehensive package, in initiating accelerations (box 2.1). In general, the country cases show that investment accelerations were preceded by at least one of two types of policy intervention: those aimed at improving macroeconomic stability (such as Türkiye in the early 2000s) and those intended to address structural shortcomings (such as ending public sector monopolies in India in the 1990s). Often, comprehensive packages containing both types of policy intervention (such as in Korea in the late 1990s and Morocco in the 1990s and 2000s) either accompanied or preceded strong growth accelerations. Demonstrated commitment to such reforms enables countries to seize favorable external conditions and turn them into investment accelerations.
Institutional quality
The effect of economic policies on the likelihood of accelerations depends on institutional quality. There was a greater likelihood that improved fiscal policies and trade reforms were associated with investment accelerations in countries with better institutions than in those with weaker institutions. Specifically, in countries with institutional quality in the top quartile of the sample, improvements in the primary fiscal balance or reductions in trade restrictions significantly increased the likelihood of starting an acceleration, whereas such policies had no statistically significant impact in countries where the quality of institutions was in the bottom quartile of the sample (figures 2.11.E. and 2.11.F).
Robustness
A broad array of robustness exercises was conducted, including using different thresholds to identify investment accelerations; adding additional control variables to check whether the results were driven by global economic conditions or financial cycles; and using aggregate investment growth, rather than per capita investment growth (refer to annexes 2C and 2D). These changes did not alter the headline results.
Policies to start investment accelerations
To promote investment accelerations, EMDEs need to implement a comprehensive package of policies, tailored to their specific circumstances. This package typically includes fiscal and monetary interventions, structural policies, and efforts to improve institutional quality. Yet many of the underlying conditions that spark investment accelerations have worsened over the past decade. For example, institutional quality has declined in EMDEs and advanced economies (figure 2.12.A). Following a decade of robust output growth in the 2000s, primary balances moved from surpluses in the 2000s
FIGURE 2.12 Enabling factors for investment accelerations
Policy and institutional conditions that have helped trigger investment accelerations have been more prevalent in advanced economies than in EMDEs. Over the past few decades, EMDEs have made some progress in removing trade restrictions but less progress in enhancing institutional quality and reducing fiscal imbalances. The number of restrictive trade policy measures in EMDEs has increased significantly over the past eight years.
Sources: Alesina et al. (2020); Chinn and Ito (2008); Global Trade Alerts; International Monetary Fund, International Financial Statistics; PRS Group, International Country Risk Guide; WDI (database); World Bank; World Economic Outlook Database.
Note: Refer to annex 2B for a description of the data and sources. Bars show simple averages by country classification. EMDEs = emerging market and developing economies; FDI = foreign direct investment.
A. Institutional quality is proxied with the International Country Risk Guide Law and Order index, which ranges from 0 (lowest) to 6 (highest).
C. Average FDI-to-GDP ratio of a median country. Balanced sample of 35 advanced economies, 135 EMDEs, and 4 unclassified economies.
D. “Trade” refers to volume of goods and nonfactor services and is defined as an average of exports and imports. Aggregate is calculated using trade weights at average 2010-19 prices and market exchange rates. Data for 2023 are estimates, and data for 2024 are forecasts.
E. Latest available data for trade restrictions are from 2014, and those for capital account restrictions are from 2019.
F. Panel shows the number of implemented trade policy interventions since November 2008. Restricting (Liberalizing) measures are interventions that discriminate against (benefit) foreign commercial interests. Adjusted data as of November 26, 2023.
B. Fiscal policy
A. Institutional quality
D. EMDE trade growth
C. FDI inflows, by decade F. Trade
to deficits in the 2010s as global growth slowed (figure 2.12.B). This slowdown in global growth was also accompanied by lower FDI inflows and slower trade growth (figures 2.12.C and 2.12.D). At the same time, the pace of reforms to lower trade and capital account restrictions stalled in the 2010s (figure 2.12.E). Policy makers have also increasingly turned to restrictive trade policy interventions since the recession induced by COVID-19 (figure 2.12.F). Reversing these trends is a key challenge for policy makers.
Fiscal and monetary policies
Both the empirical analysis and country cases highlight the important role that fiscal policy can play in sparking investment accelerations. Expenditure and revenue measures, and fiscal rules, can help improve fiscal positions.
Revenue measures that can improve fiscal balances include reforming tax administrations, enlarging tax bases, and increasing tax rates. In many EMDEs, particularly those in SAR and SSA, revenue-to-GDP ratios are much lower than in advanced economies (World Bank 2015). Eliminating tax exemptions and strengthening the administration of tax collection could improve fiscal positions by increasing revenues. Tax policies can also be used to improve incentives, particularly for investment in the private sector (Djankov et al. 2010). For example, the elimination of fossil fuel subsidies, together with the introduction of carbon taxes, can incentivize investment into energy-efficient technologies (World Bank 2023b).
Expenditure measures that can improve fiscal balances include eliminating distortive agriculture and fossil fuel subsidies, which account for sizable shares of government expenditure in many EMDEs. EMDEs can also enhance the efficiency and predictability of their expenditures. By eliminating wasteful spending and prioritizing public investment in assets such as productive infrastructure and human capital—through education and health care spending—they can improve fiscal positions and contribute to both investment accelerations and improved output growth. Efficient public investment in infrastructure can also crowd in private investment by stimulating economic development (Ansar et al. 2016; World Bank 2023b).
Fiscal rules, over the past three decades, have reduced the volatility of fiscal policy in EMDEs and allowed governments to respond to adverse events countercyclically by conserving fiscal space (Marioli, Fatas, and Vasishtha 2023). Fiscal rules that ensure current expenditures are fully financed by revenues over the cycle can provide appropriate protection for public investment. By implementing fiscal rules and utilizing stabilization funds, commodity-exporting EMDEs can improve budget positions while reducing the procyclicality of fiscal policies (World Bank 2022a).
If excessive, government borrowing to fund deficits can put pressure on credit markets, tighten financial conditions, and crowd out private investment (Huang, Pagano, and Panizza 2020; World Bank 2023c). Conversely, improving fiscal positions can, under certain circumstances, boost (crowd in) private investment (Essl et al. 2019). This is
particularly true for EMDEs that are in or near debt distress, because measures to improve their fiscal positions, when feasible, can yield benefits. In many EMDEs, fiscal policy in the near term needs to be calibrated to regain the ability to take appropriate expansionary measures when needed—creating so-called fiscal space, which was eroded during the pandemic.
Monetary policy reforms, such as the establishment or reinforcement of central bank independence or the adoption of an inflation-targeting regime, may also be important to securing a stable macroeconomic environment that supports investment growth. Low and stable inflation in the medium term is a key requirement for macroeconomic stability and healthy investment growth.
Structural policies
A broad range of structural policies can promote investment accelerations. In the past, economies that lowered barriers to trade, integrated into global value chains, and implemented reforms that facilitated international financial flows, were able to spark accelerations.
Trade policies
Reducing restrictions on cross-border trade can play an important role in sparking investment accelerations. Such measures have significantly increased the likelihood of starting an investment acceleration and have often preceded accelerations, such as in India, Morocco, and Türkiye (box 2.1). In recent decades, tariffs have been lowered substantially in many EMDEs, but costly and widespread nontariff barriers remain.
Easing these de facto restrictions, which include unwieldy customs procedures, poor trade-related infrastructure, and uncompetitive domestic logistics sectors, can significantly improve trade flows and support investment growth (Breton, Farrantino, and Maliszewska 2022; Kose and Ohnsorge 2024; World Bank 2021). A comprehensive reform package could lower trade costs by more than one-half among the EMDEs that perform worst in shipping and logistics—which account for the bulk of trade costs. Digital technology can facilitate many of these reforms, for example, by enabling the electronic processing of documents ahead of time, linking logistics services at borders, and helping lower barriers to entry for small and medium enterprises.
The nontariff costs involved in border crossings can be reduced by lessening wait times created by lengthy administrative procedures and unclear or extensive documentation requirements. The World Trade Organization Agreement on Trade Facilitation, for example, provides a framework to simplify border procedures. Harmonizing inspection requirements and labeling standards between countries can also lower firms’ costs and smooth border crossings (World Bank 2021). Regarding logistics, improving physical infrastructure, like ports, airports, and roads, can reduce travel time and variability.
Membership in trade agreements—for example, the African Continental Free Trade Area agreement—can help solidify trade facilitation reforms and lower tariffs. Further,
trade treaties can boost economies of scale and lower costs by standardizing regulatory requirements across multiple jurisdictions. Trade agreements also promote regional and global value chain participation by codifying intellectual property rights, competition, and investment protocols. These agreements can significantly benefit small countries and countries that are geographically isolated from trade hubs (Echandi, Maliszewska, and Steenbergen 2022; Moïsé and Le Bris 2013; World Bank 2020a).
Financial sector policies
Improvements in access to external finance have tended to raise the probability of starting an investment acceleration. Actions to enhance access to external finance include the loosening of regulations on capital flows (Alesina et al. 2020). Because restrictions on outflows also tend to discourage inflows, the easing of restrictions on both capital inflows and outflows generally needs to be considered (Chinn and Ito 2008; Lee 1997). Nevertheless, the easing of capital flow restrictions may need to be accompanied by measures to mitigate risks arising from instability in capital inflows and outflows, which could destabilize the domestic economy. Such measures include safeguards to prevent capital inflow surges from generating boom-and-bust cycles, as experienced by Malaysia in the 1990s (box 2.1). A well-regulated domestic financial sector is essential. Also important are measures to reduce country risk, including sound macroeconomic policies (Fratzscher 2012; Koepke 2019).
Policies that help develop domestic capital markets can also support investment accelerations. Capital market development can improve access to credit and financing in local currency, especially long-term financing. Policies to promote capital market development include improving contract enforcement to reduce collateral requirements, mitigating country-specific risks or market failures through partial credit guarantees to intermediaries, and developing digital infrastructure to allow small firms and financial institutions to participate in financial markets at low cost (United Nations 2022; World Bank 2022b).
The establishment of local currency equity and debt markets can help attract institutional investors to EMDEs with less developed financial intermediation infrastructure. For instance, pension funds and private equity firms, which tend to have higher risk tolerance, may provide financing in situations where traditional banks are unwilling to do so (United Nations 2022). Multilateral development banks play a critical role in supporting these markets by providing liquidity through innovative products, including catastrophe bonds, blue and green bonds, the provisioning of loans in local currencies in the most illiquid markets, and offering guarantees against political and other noncommercial risks (World Bank 2015, 2022b).
In many EMDEs, improving digital and technological infrastructure is critical. This enhancement is essential to lower the costs of access to finance and running a business, and to enable rural residents to access broadband networks. Facilitating investment in digital infrastructure requires aligning regulations with international standards, encouraging competition among providers to lower prices and improve services, and educating
the workforce in relevant skills (OECD and IDB 2016). Increasing access to the internet has been shown to boost FDI, increase the incomes of rural households, and lower poverty rates (Bahia et al. 2020; Mensah and Traore 2022).
Institutional quality
In EMDEs with better institutions, particularly those emphasizing improvements in law and order and property rights protection, the likelihood of initiating an investment acceleration is higher. Additionally, in such environments, policies have been more effective in leading to investment accelerations. The potential for institutional improvements in EMDEs is indicated by the fact that the quality of institutions is much lower than in advanced economies (figure 2.12).
Policy makers can improve institutions by, for example, defining property rights more clearly and protecting them more effectively, increasing the independence of the judiciary and strengthening the rule of law, and improving the enforcement of contracts. In many EMDEs, reforms are also needed to improve and unify regulatory and institutional structures, which are often fragmented; to help ease excessive constraints on private investors and businesses; and to ensure the effective enforcement of necessary regulations.
To enhance the quality of public infrastructure investment, countries can establish public investment management systems, robust project appraisal systems, and effective procurement and monitoring frameworks to mitigate the problems of asymmetric information and moral hazard (Gardner and Henry 2023; Kim, Fallov, and Groom 2020). Public-private partnerships are commonly utilized for delivering public investment and services, while limiting fiscal risks, provided that a robust framework of contract preparation, procurement, and management is in place (Dappe et al. 2023; Dappe, Melecky, and Turkgulu 2022; Engel, Fischer, and Galetovic 2020). These reforms tend to be especially important in LICs, where regulatory frameworks are often inadequate (World Bank 2020b). Countries with better governance of public investment projects tend to register larger improvements in macroeconomic and fiscal outcomes (Schwartz et al. 2020).
Interventions at the micro level
In addition to macrolevel policy interventions, microlevel interventions also play a pivotal role in supporting investment, especially in the private sector. For instance, training and mentorship programs targeted at entrepreneurs can enhance their capabilities in scaling up their businesses, adopting new technologies, and conducting longterm, profitable investment (Donald et al. 2022; Karlan, Knight, and Udry 2012; McKenzie and Woodruff 2014). Providing financial education to the general public can improve financial literacy, which is positively correlated with planning for savings and wealth accumulation (Hastings, Madrian, and Skimmyhorn 2013; Kaiser and Menkhoff 2017).
FIGURE 2.13 Policy packages and potential growth
In the past several decades, comprehensive policy packages that have improved macroeconomic stability and promoted cross-border trade and financial flows have significantly increased the likelihood of initiating an investment acceleration. Based partly on this evidence, a scenario in which EMDEs that experienced an acceleration between 2000 and 2022 start another in 2023 and all EMDEs replicate their best reform efforts in a decade suggests that the slowdown in potential growth projected in the baseline for 2022-30 would not occur.
A. Potential growth
B. Impact of investment accelerations on potential growth
Sources: Kose and Ohnsorge (2024); World Bank.
Note: EMDEs = emerging market and developing economies.
A. Blue bars show the potential output growth rates based on production function approach. GDP-weighted averages for a sample of 53 EMDEs.
B. The scenario assumes that, in 40 EMDEs (excluding China) that experienced an investment acceleration between 2000 and 2022, investment growth will increase to 10.4 percent per year from 2023-28 before returning to 0.4 percent per year in 2029-30. The 40 EMDEs were chosen because they have the highest expected average investment growth for 2021-25 and are included in the Kose and Ohnsorge (2024) sample. The increase in investment growth to 10.4 percent and subsequent fall to 0.4 percent match the median investment growth during and after investment accelerations in EMDEs between 1950 and 2022.
Design of policy packages
Policies to accelerate investment need to take account of country-specific conditions, be formulated in a well-designed package, and be carefully sequenced. The empirical analysis and country case studies demonstrate the importance of combining policies that enhance macroeconomic stability with policies that address structural barriers facing private sector development and institutional weaknesses. Country experiences, such as those in Korea in the late 1990s and Türkiye in the early 2000s, support the view that a comprehensive package of policies can be potent in triggering an investment acceleration.
When designing a policy package, countries should carefully plan the sequencing of measures. For example, fiscal measures may need to take precedence in countries with significant fiscal challenges. The implementation of institutional policies, including measures to improve the business climate and regulatory structures, may need to be advanced, particularly in countries that have difficulty mobilizing private investment. Policies to strengthen the regulation of the financial system and reform exchange rate arrangements may need to be implemented before the liberalization of capital flows. Such careful sequencing helps countries gird against potential disruptions that could otherwise imperil reform efforts, and lays the groundwork to take advantage of any favorable turn in the external environment.
In the absence of additional policy reforms, potential output growth in EMDEs is projected to decline from an annual average of 4.9 percent in 2011-21 to 4.0 percent a year in 2022-30 (figure 2.13; Kose and Ohnsorge 2024). Nevertheless, if the EMDEs that registered an investment acceleration since 2000 were able to spark another such episode between 2022 and 2030, their annual potential output growth would be 0.3 percentage point higher than projected in the baseline.10 Furthermore, in a scenario where all EMDEs replicated their best 10-year performance in labor force participation reforms, as well as health and education improvements, potential growth for 2022-30 could increase by 0.5 percentage point per year, reaching 4.6 percent. This increase would almost eliminate the decline projected in the baseline (figure 2.13).
Conclusion
Raising investment growth is a critical objective for EMDEs. They have significant investment needs to enable them to deliver sustainable and inclusive output growth, cope with climate change, and make progress toward broader development goals. Nevertheless, EMDEs face many obstacles in seeking to accelerate investment: the nearterm investment growth outlook is weak, long-term growth prospects have deteriorated, fiscal resources are limited, and external borrowing costs are elevated.
This chapter has presented the first study of investment accelerations using a large sample of countries over an extended period. Investment accelerations are often associated with much-improved macroeconomic and development outcomes. The median annual growth rate of investment jumped to 10.4 percent during these episodes, three times the median in other years. Investment accelerations also coincided with substantial increases in output growth, accompanied by faster capital accumulation and growth of TFP and employment, relative to nonacceleration years. In addition, poverty and inequality declined during these episodes.
These results collectively suggest a strong association between investment accelerations and improved macroeconomic and development outcomes. Importantly, however, these results do not imply a one-way causal link. Indeed, there can be self-reinforcing dynamics between investment accelerations and other beneficial developments during these episodes. That said, the regular coincidence of investment accelerations and transformative phases of macroeconomic and development progress underscores the critical importance of periods of rapid and sustained investment growth.
National policies have played an important role in sparking investment accelerations. For example, both fiscal consolidation measures and structural reforms to liberalize international trade and financial flows have facilitated investment accelerations. However, although individual policy measures can help ignite accelerations, comprehensive packages of measures have tended to be more effective. In addition, an enabling institu-
10 Out of 67 EMDEs in the sample used for this exercise, 41 have experienced an investment acceleration since 2000.
tional environment has tended to significantly amplify the impact of policies on investment growth and increase the likelihood of accelerations. A country that is bolstering its institutions, fostering macroeconomic stability, and demonstrating commitment to structural reforms is particularly well placed to turn supportive external conditions into a transformative investment acceleration.
To boost private capital mobilization, multilateral development banks (MDBs) can offer various financial instruments and support (G20 Independent Expert Group 2023). These measures include providing credit enhancement and disaster risk management instruments, enhancing liquidity in local currency debt and equity markets in EMDEs with less-developed financial markets, and promoting innovative investment products such as blue and green bonds. In situations where market failures prevent investors from insuring risks, MDBs can also offer loan guarantees. Additionally, MDBs can provide technical assistance by advising governments on creating the regulatory and institutional framework for well-functioning markets. This assistance extends to supporting the formulation of prudent fiscal policies, providing guidance on achieving the energy transition, and facilitating adaptation to climate change.
BOX 2.1 Sparking investment accelerations: Lessons from country case studies
Investment accelerations have often been preceded by at least one of two types of policy intervention: measures to improve macroeconomic stability and reforms to address structural problems. Although each type of policy measure has helped trigger investment accelerations, comprehensive packages of policies that combine both types appear to have sparked faster investment and output growth than might have been expected from the individual effects of each type of measure. A benign external environment has also played a crucial role in catalyzing investment accelerations in most cases.
Introduction
The empirical analysis in this chapter documents the common features of investment accelerations—periods in which there are sustained increases in investment growth to a relatively rapid pace—and the policies that have been associated with them. It also highlights some substantial differences across investment accelerations. This box presents a brief account of notable investment accelerations in selected countries. It aims to answer the following questions:
• What types of policy changes have triggered investment accelerations?
• How have the macroeconomic implications of investment accelerations differed depending on the underlying policy drivers?
The box focuses on 13 investment accelerations in 10 countries (refer to tables B2.1.1, B2.1.2, and B2.1.3 at the end of this box): Chile (1986-93), Colombia (2001-07), India (1994-99), Malaysia (1988-97), Morocco (1996-2009), Poland (1992-2000 and 2003-08), the Republic of Korea (1985-96 and 1999-2007), Türkiye (2003-08), Uganda (1993-2012), and Uruguay (1991-98 and 2004-14).a
Chile (1986-93)
Chile experienced an investment acceleration between 1986 and 1993, which resulted in annual average investment growth of 12.3 percent—8.4 percentage points higher than in other years (figure B2.1.1). Output growth doubled during this episode, exceeding 7.6 percent per year, supported by both productivity and employment growth. Broad improvements in macroeconomic indicators
Note: This box was prepared by Marie Albert, Jongrim Ha, Reina Kawai, Philip Kenworthy, Jeetendra Khadan, Dohan Kim, Emiliano Luttini, Joseph Mawejje, Valerie Mercer-Blackman, Kersten Stamm, Guillermo Verduzco-Bustos, Collette Wheeler, and Shu Yu.
a. The 13 investment accelerations covered here are not all of the accelerations these 10 countries have experienced since 1980. The accelerations were chosen because they are representative of the fiscal, monetary, or structural reform efforts that often precede accelerations. The other accelerations in these countries were Chile (2002-08), India (1985-90 and 2004-12), Malaysia (2006-18), Poland (1983-88 and 2017-22), the Republic of Korea (2013-18), and Türkiye (2010-17). Tables B2.1.1, B2.1.2, and B2.1.3 present an overview of the accelerations and accompanying policies for each country.
BOX 2.1 Sparking investment accelerations: Lessons from country case studies (continued)
FIGURE B2.1.1 Investment accelerations in Chile and Colombia
Chile experienced an investment acceleration between 1986 and 1993. Output growth doubled during this episode, exceeding 7.6 percent per year, supported by both productivity and employment growth. Colombia experienced an investment acceleration between 2001 and 2007. During the acceleration, private investment grew more than six times faster than during nonacceleration years, and public investment growth increased from 4.2 to 6.1 percent. Both employment and total factor productivity grew strongly.
A. Output and investment growth in Chile
Sources: Bank for International Settlements; Ha, Kose, and Ohnsorge (2021); Haver Analytics; International Monetary Fund, International Financial Statistics; Investment and Capital Stock Dataset (IMF 2021); Penn World Table (Feenstra, Inklaar, and Timmer 2015); WDI (database); World Bank; World Economic Outlook Database.
Note: The sample period is 1980-2022. Acceleration years cover the full duration of the episode. Nonacceleration years exclude acceleration years that were not included in this box; TFP = total factor productivity.
A.D. Bars show simple averages of growth in output, investment, and TFP and percentage-point change in employment rate.
B.E. Bars show simple averages of the change in consumer price index in percent, primary balance as a percent of GDP, government debt as a percent of GDP, current account balance as a percent
and
B. Macroeconomic conditions in Chile
D. Output and investment growth in Colombia
C. Net capital inflows and
BOX 2.1 Sparking investment accelerations: Lessons from country case studies (continued)
accompanied this acceleration. These improvements included movement of the primary balance from deficit to surplus, a significant decline in inflation (from almost 20 percent in the first year of the acceleration to 12.7 percent in 1993), and a substantial improvement in the current account from -6 percent of gross domestic product (GDP) in 1986 to -0.25 percent of GDP at its peak in 1991. Trade openness (the sum of exports plus imports relative to GDP) increased from about 50 percent of GDP to 63 percent of GDP at its peak in 1989, and the proportion of exports from sectors other than mining increased by about 5 percentage points. Chile became an upper-middle-income country in 1993.
Several policy interventions preceded or coincided with the acceleration. After the 1982 debt crisis, during which output contracted by 15 percent, macroeconomic stability was an essential enabler (Corbo, Hernández, and Parro 2005; De Gregorio 2005). After the debt crisis, Chile took steps to reduce government borrowing, resulting in several consecutive years of fiscal surplus. The public debt-to-GDP ratio declined to roughly 50 percent by 1993, from 120 percent in 1986. The adoption of an inflation-targeting regime in 1991 also helped to bring inflation under control.
Structural reforms—trade liberalization, pension system reform, and banking sector reforms—were essential to sparking the investment acceleration (Corbo, Hernández, and Parro 2005; Gallego and Loayza 2002). The 1981 pension reform from a pay-as-you-go system toward a capitalization scheme deepened domestic financial markets by creating an additional source of credit for the private sector (Edwards 1998). Reforms that bolstered the ability of banks to provide credit and establish bankruptcy proceedings with well-defined property rights were critical in improving resource allocation (Bergoeing et al. 2002).
Colombia (2001-07)
Colombia experienced an investment acceleration between 2001 and 2007. Annual investment growth reached 12.7 percent during the acceleration, exceeding the level of nonacceleration years by 10.3 percentage points (figure B2.1.1). Output growth averaged 4.5 percent during the investment acceleration compared with 3.3 percent outside of that period. During the acceleration, private investment grew over six times faster than during nonacceleration years, at 13.8 percent, while public investment growth increased from 4.2 percent to 6.1 percent. Inflation declined to single digits in the year before the acceleration for the first time in more than two decades. The overall fiscal deficit was less than 1 percent of GDP by 2004, and the primary balance reached a surplus. Government debt fell from 48 percent of GDP at its peak in 2002 to 33 percent of GDP in 2007.
BOX 2.1 Sparking investment accelerations: Lessons from country case studies (continued)
The 2001 acceleration came after a difficult decade and was preceded by a series of reforms that significantly improved macroeconomic stability. First, a floating exchange rate regime was introduced in 1999, which helped reduce the impact of shocks on international reserve buffers. Second, in 2000, inflation targeting was adopted, accompanied by several legal measures to improve central bank independence and transparency (IMF 2006a). Third, on the fiscal front, government finances were improved by the introduction of tax reforms in the early 2000s, spending restraint, a pension reform, and a series of reforms to public spending management (Clavijo 2009; IMF 2006b). Rising oil prices increased fiscal revenues during this period. Colombia’s external position was also boosted by strong export growth in industrial goods. Domestic financial markets were deepened through the privatization and liquidation of public banks and improved supervision (IMF 2005, 2006b). Significant improvements in administrative procedures also supported the business environment.
India (1994-99)
India experienced an investment acceleration from 1994 to 1999 (figure B2.1.2). During this acceleration, driven mostly by the private sector, average annual investment growth reached 10 percent per year, about 5.9 percentage points higher than in other years. The government debt-to-GDP ratio was about 6 percentage points lower during this episode than in nonacceleration years, while the primary fiscal deficit and current account deficit widened slightly. Net capital inflows to GDP increased slightly during the acceleration, while credit growth rose to over 7 percent, compared with 4.8 percent in nonacceleration years. . At the same time, total factor productivity growth almost doubled, from 1.9 percent in nonacceleration years to 3.8 percent.
The 1994 investment acceleration was rooted in reforms, starting in 1991, that addressed major economic distortions (Ahluwalia 2002). First, tariff and nontariff barriers on imports were lifted, making it easier to import capital goods. Second, capital account restrictions were loosened to allow greater capital inflows. Third, state control of the banking and insurance sectors was reduced to facilitate greater competition and efficiency, leading to increased domestically supplied credit to the private sector. Finally, most public sector monopolies were ended. Sectors reserved to public firms shrank from 18 important industries (including iron and steel, electricity, and telecommunications) to three (atomic energy, rail transportation, and national defense-related aircraft and warships). A further reform was the transition to a market-determined exchange rate in 1993. These reforms promoted international investment and trade, and strengthened the private sector generally (Ahmad et al. 2018; Gupta et al. 2018).
BOX 2.1 Sparking investment accelerations: Lessons from country case studies (continued)
FIGURE B2.1.2 Investment accelerations in India and the Republic of Korea
India had an investment acceleration from 1994 to 1999. During this episode, driven mostly by the private sector, average annual investment growth reached 10 percent, and the government debt-to-GDP ratio declined materially. The Republic of Korea experienced two investment accelerations—in 1985-96 and in 1999-2007. While capital accumulation played a large role in Korea’s growth miracle, the two episodes were also associated with faster growth of employment and productivity.
A. Output and investment growth in India
Sources: Bank for International Settlements; Ha, Kose, and Ohnsorge (2021); Haver Analytics; International Monetary Fund, International Financial Statistics; Investment and Capital Stock Dataset (IMF 2021); Penn World Table (Feenstra, Inklaar, and Timmer 2015); WDI (database); World Bank; World Economic Outlook Database.
Note: The sample period is 1980-2022. Acceleration years cover the full duration of the episode. Nonacceleration years exclude acceleration years that were not included in this box. TFP = total factor productivity.
A.D. Bars show simple averages of growth in output, investment, and TFP and percentage-point change in employment rate.
B.E. Bars show simple averages of the change in consumer price index in percent, primary balance as a percent of GDP, government debt as a percent of GDP, current account balance as a
and
in percent.
C.F.
B. Macroeconomic conditions in India
D. Output and investment growth in Korea
C. Net capital inflows
in India
BOX 2.1 Sparking investment accelerations: Lessons from country case studies (continued)
Republic of Korea (1985-96 and 1999-2007)
Korea has experienced two investment accelerations since the 1980s—one in 1985-96 and the other in 1999-2007. Investment growth surged during both accelerations, reaching 9.2 percent a year (figure B2.1.2). Output growth picked up by 4 percentage points per year during the accelerations, relative to other years. Whereas capital accumulation had played a large role in Korea’s growth miracle since the 1960s, the two episodes were also associated with much faster growth of employment and productivity, as well as improvements in human capital (Kim and Lau 1994).
Furthermore, enhanced price stability, strengthened fiscal positions, and improved current account balances accompanied both. On average across the two accelerations, inflation fell to 4.3 percent; government debt declined by 15 percentage points of GDP; the primary balance was in surplus by 2.4 percent of GDP; and the current account balance was in a slight surplus of 0.9 percent of GDP. A notable 8.3-percentage-point increase in annual private investment growth underpinned both acceleration episodes. Korea attained high-income status in 1995, fell back in 1998 because of the 1997 Asian financial crisis, and then regained high-income status in 2001.
The 1985 acceleration was preceded by a comprehensive set of macroeconomic stabilization policies. First, to curb inflation partly fueled by the government-led growth strategy of the late 1970s, fiscal policy was tightened under a balanced budget principle, which ended the subordination of monetary policy to government financing (Cho and Kang 2013; Koh 2007). Second, the number of price controls was reduced, and the Monopoly Regulation and Fair Trade Act was established to ensure market competition (Nam 1988). Third, restrictions on imports were loosened, which helped relieve pressure on inflation by promoting domestic competition (Dornbusch and Park 1987; Koh 2010).
Against a backdrop of broader measures to bolster macroeconomic stability, the acceleration that began in 1999 benefited from structural reforms to address financial and corporate sector problems that contributed to the 1997 crisis. These reforms included comprehensive steps to liberalize capital markets and foreign investment (Lee 2013; Vashakmadze et al. 2023). Extensive restructuring of corporations and financial institutions also strengthened financial soundness, governance, and profitability. Notably, reforms geared toward Chaebol groups (family-controlled large conglomerates) required their affiliated firms to exit nonviable businesses, which improved loan availability for smaller firms (Krueger and Yoo 2002). In addition, a floating exchange rate system was adopted in late 1997, and an inflation targeting regime with enhanced central bank independence was established in 1998.
BOX 2.1 Sparking investment accelerations: Lessons from country case studies (continued)
Malaysia (1988-97)
Malaysia experienced an investment acceleration from 1988 to 1997. Annual investment growth averaged 17.9 percent during this period, exceeding the level in other years by 20.9 percentage points (figure B2.1.3). Private investment growth increased more than did public investment growth. Both credit growth and capital inflows played major roles in triggering this episode. During the acceleration, output growth averaged 9.2 percent, enabling Malaysia to attain upper-middle-income status in 1992.
The 1988 acceleration was triggered by policy changes that reduced restrictions on cross-border capital flows (so-called capital account liberalization), which translated into a sharp increase in capital inflows and improved access to domestic credit, as well as structural reforms in the Fifth Malaysia Plan. Net capital inflows increased from -2 percent of GDP (that is, a net outflow) in 1988 to 16 percent at the peak in 1993, and the financial sector undertook an expanding array of activities that increased credit flow especially through bank lending (Ghani and Suri 1999). With improved access to credit and foreign capital, exports of manufactured goods rose (Naguib and Smucker 2009). A currency devaluation and tax reform improved the business climate, while public revenue shortfalls were prevented through the elimination of tax loopholes (Somogyi 1991). However, the episode was not accompanied by policy changes to control financial excesses associated with the rapid opening of the capital account, a major factor in the financial crisis of 1997.
Morocco (1996-2009)
Morocco underwent a significant economic transformation during the investment acceleration between 1996 and 2009 (figure B2.1.3). Annual investment growth rose from 2.3 percent in nonacceleration years to 7.5 percent during acceleration years, with output growth improving from 3.2 percent to 5 percent (despite a brief recession in 1997, when investment growth did not contract). The period coincided with improvements in the fiscal position, the external balance, and productivity growth, as well as with higher credit growth. Both inflation and government debt (as a share of GDP) declined during the period.
The acceleration followed and was accompanied by a range of fiscal and monetary reforms to foster macroeconomic stability (Harrigan and El-Siad 2010; IMF 2001, 2004). Fiscal revenue capacity was strengthened, including through the privatization of the telecommunications sector, tax reforms in the 1980s, and the strategic allocation of privatization revenues in 2001 (IMF 2001, 2004). During this period, improved fiscal capacity, exemplified by a large reduction in the external debt-to-reserves ratio, lowered marginal borrowing costs, allowing the government to finance much-needed social development initiatives.
BOX 2.1 Sparking investment accelerations: Lessons from country case studies (continued)
FIGURE B2.1.3 Investment accelerations in Malaysia and Morocco
Malaysia experienced an investment acceleration from 1988 to 1997. In that episode, private investment growth increased more than did public investment growth. Both credit growth and capital inflows played major roles in triggering this episode. Morocco underwent a significant economic transformation during an investment acceleration between 1996 and 2009. This period coincided with improvements in the fiscal position, the external balance, and productivity growth, as well as with higher credit growth. Both inflation and government debt (as a share of GDP) declined.
A. Output and investment growth in Malaysia
B. Macroeconomic conditions in Malaysia
Sources: Bank for International Settlements; Ha, Kose, and Ohnsorge (2021); Haver Analytics; International Monetary Fund, International Financial Statistics; Investment and Capital Stock Dataset (IMF 2021); Penn World Table (Feenstra, Inklaar, and Timmer 2015); WDI (database); World Bank; World Economic Outlook Database.
Note: The sample period is 1980-2022. Acceleration years cover the full duration of the episode. Nonacceleration years exclude acceleration years not included in this box. TFP = total factor productivity.
A.D. Bars show simple averages of growth in output, investment, and TFP and percentage-point change in employment rate.
B.E. Bars show simple averages of the change in consumer price index in percent, primary balance (percent of GDP), government debt (percent of GDP), current account balance (percent of GDP), and real credit growth in percent C.F. Bars show simple averages of growth in private investment and public investment in percent, and the
inflow-to-GDP
in percent of GDP.
D. Output and investment growth in Morocco
C. Net capital inflows and public and private investment growth in Malaysia
F. Net capital inflows and public and private investment growth in Morocco
E. Macroeconomic conditions in Morocco
BOX 2.1 Sparking investment accelerations: Lessons from country case studies (continued)
Trade integration was strengthened by the Association Accord with the European Union (EU) in 1996 and a free trade agreement with the United States in 2004. Morocco’s trade openness surged by 31 percentage points of GDP during the acceleration. Financial reforms and price liberalization created a more conducive business and trade environment (Moreira 2019). Strategic policies supporting vital and internationally competitive sectors such as agriculture and renewable energy helped improve production (Paus 2012). Other significant reforms included improvements in governance and competitiveness, measures to streamline public investment processes, and incentives to increase tourism revenues. This broad suite of growth-friendly reforms helped increase the net capital-inflows-to-GDP ratio to 2 percent of GDP during the acceleration, from -2 percent before the episode (Achy 2011; World Bank 2001).
Poland (1992-2000 and 2003-08)
Poland experienced two investment accelerations, in 1992-2000 and 2003-08 (figure B2.1.4). During these accelerations, there were sharp increases in both investment growth (which averaged 10.4 percent per year) and output growth (which averaged 5 percent per year). In contrast, in nonacceleration years since 1980, investment fell 3 percent per year and output declined 0.7 percent per year. Both private and public investment growth rose sharply in these episodes, with the 2003 episode driven by a more pronounced increase in public investment. The two accelerations were also accompanied by an improvement in the fiscal position and an uptick in net capital inflows. Inflation declined notably during the 1992 acceleration.
The 1992 acceleration in Poland was preceded by reforms to stabilize the economy and structural policy shifts that helped transition from a centrally planned economy toward a market-oriented one. Before the 1992 acceleration, the collapse of the Soviet Union caused output and investment to plummet and inflation to skyrocket in Poland. To curb inflation, a stabilization program was employed to tighten monetary policy, restrict credit flow, and enhance central bank independence. The exchange rate system transitioned from a fixed regime in 1990 to a crawling peg in 1991, and then progressively to a fully floating regime in 2000.
Fiscal sustainability improved because of a comprehensive set of interventions: cuts in subsidies and spending by public enterprises; the introduction of personal, corporate, value added, and excise taxes; the implementation of a more targeted system of social transfers; and sizable debt relief granted by the Paris Club (Berg and Blanchard 1994; World Bank 2022c). Poland also undertook structural policy changes—liberalizing international trade to become a key exporter to
BOX 2.1 Sparking investment accelerations: Lessons from country case studies (continued)
FIGURE B2.1.4 Investment accelerations in Poland and Türkiye
Poland had two investment accelerations—in 1992-2000 and 2003-08. Both private and public investment growth rose sharply in these episodes, with the 2003 episode driven by a more pronounced increase in public investment. The two episodes were also accompanied by improved fiscal positions and higher net capital inflows.
Türkiye’s investment acceleration occurred in 2003-08. Both private and public investment growth surged by similar amounts, while credit growth and net capital inflows more than tripled.
A. Output and investment growth in Poland
PercentPercent
B. Macroeconomic conditions in Poland
Output and investment growth in
Sources: Bank for International Settlements; Ha, Kose, and Ohnsorge (2021); Haver Analytics; International Monetary Fund, International Financial Statistics; Investment and Capital Stock Dataset (IMF 2021); Penn World Table (Feenstra, Inklaar, and Timmer 2015); WDI (database); World Bank; World Economic Outlook Database.
Note: The sample period is 1980-2022. Acceleration years cover the full duration of the episode. Nonacceleration years exclude acceleration years that were not included in this box. TFP = total factor productivity.
A.D. Bars show simple averages of growth in output, investment, and TFP and percentage-point change in employment rate.
B.E. Bars show simple averages of the change in consumer price index in percent, primary balance as a percent of GDP, government debt as a percent of GDP, current account
percent.
C.F. Bars show simple averages of
and
and
and
D.
Türkiye
BOX
2.1
Sparking investment accelerations: Lessons from country case studies (continued)
Western Europe, encouraging capital inflows (especially foreign direct investment), privatizing state-owned enterprises, recapitalizing the financial system, and lowering entry barriers for new firms (Georgiev, Nagy-Mohacsi, and Plekhanov 2017). Private sector development was also supported by capital market deepening, reinforced by the creation of regulatory bodies, the Stock Exchange, and an increasing role of foreign banks (de Haas and van Lelyveld 2006).
The 2003 acceleration was triggered by reforms tied to Poland’s EU accession process, which granted the country access to the single European market and additional EU structural funds (IMF 2003, 2008; World Bank 2022a). To become an EU member, Poland maintained prudent fiscal policy and transitioned to an inflation-targeting regime in 1998. Lower corporate income taxes and research and development tax allowances were introduced to promote investment (Murgasova 2005).
Attaining full EU membership accelerated Poland’s structural changes and integration with the global economy. The EU accession process led to improvements in institutional quality as Poland aligned policies and regulations to European standards, privatized the telecommunications and energy sectors, strengthened banking regulation, and improved access to public infrastructure (Bruszt and Campos 2016). Labor market policies became more flexible. Capital inflows surged as Poland integrated further into the supply chains of Western Europe (Georgiev, Nagy-Mohacsi, and Plekhanov 2017).
Türkiye (2003-08)
Türkiye experienced an investment acceleration in 2003-08. Average investment growth rose to 14.3 percent per year during the acceleration, compared with 4.6 percent in other years (figure B2.1.4). Output growth reached more than 6 percent per year during this episode, up from 3.7 percent per year in other years. During this period, the primary balance improved, and inflation was brought under control—falling from 65 percent in the six years before the acceleration to about 11 percent during the acceleration. Both private and public investment growth surged by similar amounts, while credit growth and net capital inflows more than tripled. Rapid output growth allowed Türkiye to attain upper-middleincome status in 2004.
Policy reforms implemented in the early 2000s, accompanied by a benign external environment, laid the foundation for the 2003 acceleration. Before the acceleration, a series of macroeconomic stabilization policies were implemented in response to the 2000-01 economic crisis. Fiscal discipline was established with a primary surplus target of 6.5 percent of gross national product, and the central
BOX 2.1 Sparking investment accelerations: Lessons from country case studies (continued)
bank became an independent institution (IMF 2007). The result was a virtuous cycle of disinflation, lower interest rates, and higher economic growth (Macovei 2009). These macroeconomic policies were complemented by structural reforms in several areas, including enterprise restructuring and privatization, improvements to the business climate, trade liberalization, labor market liberalization, and comprehensive reform of the banking sector. Consequently, both access to credit and foreign direct investment inflows improved (World Bank 2008).
Uganda (1993-2012)
Uganda, a low-income country, had a long period of investment acceleration between 1993 and 2012 (figure B2.1.5). Annual average investment growth, estimated at 10.9 percent during the acceleration period, was 5 percentage points higher than in nonacceleration years. Output growth was similarly elevated during the acceleration, but to a lesser extent—averaging 7.4 percent in acceleration years, compared with 4.2 percent otherwise. The episode was accompanied by a significant drop in inflation, an improved primary balance, a sizable reduction in the debt-service-to-exports ratio, and a notable increase in credit growth. Both private and public investment grew robustly during the acceleration. The proportion of the population in poverty fell from 68 percent in 1993 to 35 percent in 2013 (World Bank 2016).
The 1993 acceleration was supported by a wide range of policies (World Bank 2007). Before the acceleration, Uganda committed to fiscal measures, encompassing public enterprise and civil service reforms, which helped stabilize the macroeconomy (Kuteesa et al. 2010; Mawejje and Odhiambo 2021). Public enterprise reforms, especially the privatization of key government-owned enterprises and the introduction of private sector participation in public utilities, sought to reduce the role of the government (Reinikka and Collier 2001; World Bank 2004). In addition, a comprehensive debt strategy formulated in 1991 strengthened debt management (Kitabire 2010). Monetary policy reforms focused on attaining a flexible exchange rate and price stability (Henstridge and Kasekende 2001).
Various structural reforms were implemented in the early 1990s to improve efficiency in the banking sector, liberalize the capital account, reduce trade barriers, and eliminate tax, legal, and other regulatory burdens on firms (Kuteesa et al. 2010; World Bank 2004). Debt relief initiatives and development assistance programs championed by the international community also played a significant role in supporting the acceleration. For example, Uganda was the first country to qualify for the Heavily Indebted Poor Countries debt relief initiative in 1998 and benefited from the Multilateral Debt Relief Initiative in 2006 (Andrews et al. 1999; Kitabire 2010). Uganda’s participation in these initiatives reduced the
BOX 2.1 Sparking investment accelerations: Lessons from country case studies (continued)
FIGURE B2.1.5 Investment accelerations in Uganda and Uruguay
Uganda’s investment acceleration lasted from 1993 to 2012. The episode was accompanied by a significant reduction in inflation, and an improved primary fiscal balance, and a notable increase in credit growth. Private investment also grew. Uruguay experienced two investment accelerations: in 1991-98 and 2004-14. Private investment grew much faster than public investment during the two episodes. Both accelerations were accompanied by more favorable macroeconomic conditions, including lower government debt, subdued inflation, and higher credit growth.
A. Output and investment growth in Uganda
B. Macroeconomic conditions in Uganda
D. Output and investment growth in
Sources: Bank for International Settlements; Ha, Kose, and Ohnsorge (2021); Haver Analytics; International Monetary Fund, International Financial Statistics; Investment and Capital Stock Dataset (IMF 2021); Penn World Table (Feenstra, Inklaar, and Timmer 2015); WDI (database); World Bank; World Economic Outlook Database. Note: The sample period is 1980-2022. Acceleration years cover the full duration of the episode. Nonacceleration years exclude acceleration years that were not included in this box; CPI = consumer price index; TFP = total factor productivity.
A.D. Bars show simple averages of growth in output, investment, and TFP and percentage-point change in employment rate.
B.E. Bars show simple averages of the change in CPI in percent, primary balance as a percent of GDP, government debt as a percent of
BOX 2.1 Sparking investment accelerations: Lessons from country case studies (continued)
debt-service-to-exports ratio by more than half, creating fiscal space that allowed additional resources to be channeled into investment (Kitabire 2010; MuwangaZake and Ndhaye 2001).
Uruguay (1991-98 and 2004-14)
Uruguay experienced two investment accelerations: 1991-98 and 2004-14. Average annual investment growth reached 10.3 percent, exceeding the level in nonacceleration years by 14.7 percentage points (figure B2.1.5). Output growth rose to 5 percent per year during the acceleration episodes (from near zero in nonacceleration years) as both employment and productivity growth surged. In both episodes, private investment grew much faster than public investment. Each acceleration was accompanied by improved macroeconomic conditions, including lower government debt, subdued inflation, larger primary surpluses, and higher credit growth compared with nonacceleration years. Uruguay attained high-income status in 2012.
Following a period of stagnation between 1983 and 1990, policies to stabilize the economy and promote trade laid the foundation for the 1991 acceleration (Marandino and Oddone 2018). Fiscal policy measures included reducing external debt by 5 percentage points of GDP and restructuring short-term debt through the 1991 Brady Plan, as well as broader fiscal consolidation (Rial and Vicente 2003). Following high inflation in the 1980s, these fiscal adjustments fed into a price stabilization plan, which also included a preannounced crawling exchange rate peg (Peluffo 2013). The country’s first Central Bank Act was approved in 1995 to strengthen monetary policy and establish limits on central bank financing of the public sector. The 1991 acceleration was also associated with further trade liberalization, marked by the signing of the Treaty of Asunción that formed the Southern Common Market.
The 2004 acceleration coincided with a series of macroeconomic and structural policy reforms. After a major banking crisis in 2002 and several external shocks between 1999 and 2001, the government adopted a range of measures to improve macroeconomic stability and debt sustainability (de la Plaza and Sirtaine 2005; Marandino and Oddone 2018). Fiscal consolidation and better debt management were combined with monetary policy measures, including greater exchange rate flexibility, adoption of an inflation target, and enhanced central bank independence. Banking regulations were introduced in 2008 to mitigate risks associated with currency mismatches between banking sector assets and liabilities (Marandino and Oddone 2018).
This acceleration episode was also supported by structural reforms that improved the investment climate. These reforms included strengthening the national
BOX 2.1 Sparking investment accelerations: Lessons from country case studies (continued)
investment office and improving physical infrastructure and the business environment (IMF 2008, 2010). The 2004 acceleration was accompanied by elevated agricultural commodity prices, favorable global financial conditions, and stronger regional trade linkages. Late in the 2000s acceleration, Uruguay regained an investment grade sovereign rating (Che 2021).
Conclusion
These country studies show how initial conditions, together with comprehensive efforts to improve fiscal, monetary, and structural policies, can spark investment accelerations (tables B2.1.1, B2.1.2, and B2.1.3). The policy packages documented earlier allowed the 10 countries to seize favorable external conditions and turn them into accelerations. The case studies also demonstrate how such accelerations can be the source of sizable economic and development achievements.
The comprehensive policy packages overlapped considerably, even though the subsequent accelerations differed in some important dimensions (such as the split between private and public investment growth, or levels of credit growth). First, at about the start of each acceleration, improvements in the credibility and independence of monetary policy helped achieve lower and more stable inflation (for example, Korea in 1998). Second, all accelerations were preceded by fiscal consolidation, either through stricter expenditure controls, the elimination of subsidies, tax reforms, or privatization of state-owned enterprises (for example, Colombia, India, or Uganda). Third, all accelerations were accompanied by structural reforms that encompassed trade and capital account liberalization efforts, the strengthening and deepening of financial markets and their regulation, and improvements to business climates, including policies to promote greater competition (for example, India and Poland in 1992, and Türkiye).
Investment accelerations were crucial for economic and human development. Output growth was substantially higher during these 13 accelerations than in nonacceleration years. For many countries, productivity and employment growth were positive, on average, only during accelerations. Several countries either became high-income countries during the acceleration (for example, Korea in 2001, Poland in 2009, and Uruguay in 2012), or saw sizable gains in the fight against extreme poverty (Colombia, India, Morocco, and Uganda).
In some cases, the international community played a critical role in addressing long-standing debt problems, such that investment accelerations could take hold. For example, well-calibrated debt relief preceded or accompanied accelerations in Uganda and Uruguay.
BOX 2.1 Sparking investment accelerations: Lessons from country case studies
TABLE B2.1.1
Uganda 1993-2012 10.9 (10.3) 5.9 (2.1) 11.4
Source : World Bank. Note : All numbers are average growth rates in percent with median growth rates in parentheses for the respective ac celeration years, or all nonacceleration years in a countr y since 1980. “During” refers to statistics for the acceleration years between 1980 and 2022. “Outside” refers to statist ics for all nonacceleration years over the same period. Fo r details about the acceleration episodes, refer to box 2.1.
BOX 2.1 Sparking investment accelerations: Lessons from country case studies (continued)
TABLE B2.1.2 Economic indicators during and outside investment a ccelerations
Uruguay 2004-14 2.8 (8.6) -2.9 (-0.4) 2.6 (2.3) -1.2 (-0.7) 1.0 (0.8) -0.1 (-0.4) 8.3 (7.8) 4.5 (5.6) 65 Net capital inflows (percent of GDP)
Türkiye 2003-08 23.2 (21.7) 6.0 (6.3) 1.0 (1.5) -0.7 (0.7) 0.0 (0.1)
Source : World Bank.
Note : All numbers except last column are average growth rat es in percent with median growth rates in parentheses fo r the respective acceleration years, or all nonaccelerati on years in a country since 1980. “During” refers to statistics for the acceleration years between 1980 and 2022. “Outside” refers statistics for all nonacceleration years over the same period.
Empty cells reflect missing data. For details about the a cceleration episodes, refer to box 2.1. TFP = total f actor productivity.
BOX 2.1 Sparking investment accelerations: Lessons from country case studies
TABLE B2.1.3 Policy changes and reforms during investment accelerations
Chile 1986-93 Fiscal consolidation
Centralbank independence (1989); adoptionof inflationtarget (1990) Trade liberalization; financialsector deepening; bankingreforms
Risingcopper pricesinthe late1980s
Colombia2001-07
Fiscal consolidation; structuraltax reforms; reformsto SOEand public investment management
India 1994-99 Fiscal consolidation; structuraltax reforms
Increased exchangerate flexibility; adoptionof inflationtarget (1999); enhanced centralbank independence
Increased exchangerate flexibility
Enhancedtrade linkages;financial sectordeepening
Risingoil prices;strong globalgrowth and supportive global financial conditions
Endedmost publicsector monopolies; capitalaccount andtrade liberalization; reducedstate controlofbanking andinsurance
Solidglobal growth
Malaysia 1988-97 Structuraltax reforms(focus onrevenue collection)
Morocco 1996-2009 Fiscal consolidation; structuraltax reforms
Currency devaluation Financialsector deepening(better accesstocredit)
Reformsto balancefixed exchangerate Trade liberalization (trade agreementswith theEUand UnitedStates); reductioninprice controlsand subsidies; financialsector deepening(better accesstocredit)
Strongglobal growthand supportive global financial conditions
BOX 2.1 Sparking investment accelerations: Lessons from country case studies (continued)
TABLE B2.1.3 Policy changes and reforms during investment accelerations (continued)
Country Acceleration
Poland 1992-2000
Poland 2003-08
Reductionof inefficient subsidies,SOE management reforms; structuraltax andentitlement reforms
Increased exchangerate flexibility; monetary tightening (curbing excesscredit growth); adoptionof inflation targeting (1998)
Privatizationof SOEs;trade liberalization (joinedGATT andsigned multipletrade agreements); capitalaccount liberalization; bankingreforms and recapitalization; competition reforms
ParisClub debt forgiveness
Korea, Rep. 1985-96
Targetedtax reductionsto promote investment
Increased exchangerate flexibility
Financialsector deepening; alignmentof manypolicies andregulations totheEU
Accessionto theEUin 2004;strong globalgrowth and supportive global financial conditions
Korea, Rep. 1999-2007
Fiscal consolidation andrules (balanced budget principle); institutional fiscal improvements (establishinga budgetcouncil)
Fiscal consolidation (especially lowerspending growth)
Endofcentral bankfinancing ofgovernment
Trade liberalization (reducedimport restrictions); reductioninprice controls; competition reforms (Monopoly Regulationand FairTradeAct)
Enhanced centralbank independence; increased exchangerate flexibility; adoptionof inflation targeting (1998)
Liberalizationof capitalmarkets (reducedFDI restrictions); corporate governance reforms; restructuringof financial corporations
Strongglobal growthand supportive global financial conditions
BOX 2.1 Sparking investment accelerations: Lessons from country case studies
TABLE B2.1.3 Policy changes and reforms during investment accelerations (continued)
Country
Türkiye 2003-08
Uganda 1993-2012
Fiscal consolidation andrules (primary surplus target)
Centralbank independence (2001)
Privatizationsand corporate restructuring; businessclimate improvements; tradeliberalization; labormarket liberalization; bankingreform
Strongglobal growthand supportive globalfinancial conditions
Uruguay1991-98
Privatizations andreforms ofSOEs; institutional fiscal improvements (establishing UgandaTax authority)
Increased exchangerate flexibility
Bankingreform; tradeliberalization; businessclimate improvements
HIPCand Multilateral DebtRelief; Development assistance
Uruguay2004-14
Fiscal consolidation Increased exchangerate flexibility; limittocentral bankfinancing ofgovernment
Institutional fiscal improvements (improved public balancesheet management)
Increased exchangerate flexibility; enhanced centralbank independence; adoptionof inflation targeting (2005)
Tradeliberalization (MERCOSUR regionaltrade agreement)
Reduced externaldebt throughBrady plan
Bankingreform; businessclimate improvements
Elevated agricultural commodity prices; moreregional trade integration; supportive globalfinancial conditions
Source: World Bank.
Note: For details about the acceleration episodes, refer to box 2.1. EU = European Union; FDI = foreign direct investment; GATT = General Agreement on Tariffs and Trade; HIPC = Heavily Indebted Poor Countries; MERCOSUR = Southern Common Market; SOE = state-owned enterprise.
ANNEX 2A Identification of investment accelerations
Investment accelerations are defined as episodes of rapid, sustained acceleration in investment per capita. Investment growth is analyzed on a per capita basis because it accounts for the significance of population growth, which typically averaged more than 2 percent in EMDEs between 1950 and 2022, and because it has a stronger link than aggregate investment growth with GDP per capita growth, which is the focus of longterm growth analyses (Libman, Montecino, and Razmi 2019).
As suggested by Barro and Sala-i-Martin (1992) and Christiano and Fitzgerald (2003), economic indicators assessed more than five calendar years apart are less influenced by business cycle fluctuations than those at higher frequencies. According to Hausmann, Pritchett, and Rodrik (2005), output growth accelerations require heightened output growth to last at least eight years.
This chapter aims to identify investment per capita growth accelerations with the potential for transformative development implications. Specifically, three criteria are used to identify investment accelerations, drawing on data obtained from the sources identified in annex 2B:
• The average growth rate of investment per capita over six years must be at least 4 percent a year.
• The average annual growth rate of investment per capita over six years must be at least 2 percentage points higher than in the previous six years.
• The level of capital stock per capita at the end of the period must exceed its preepisode peak.
The first two criteria are designed to identify rapid acceleration in investment per capita growth. The first criterion requires that growth be rapid, setting a threshold of at least 4 percent per capita growth per year. This rate corresponds to the long-run median growth rate of investment for the top one-third of countries in the sample.11 The second criterion confirms that investment accelerates. It does so by requiring a minimum increase of 2 percentage points, which is the median difference in growth between two neighboring six-year periods for the top one-third of countries in the sample. Finally, the requirement that capital stock per capita at the end of an acceleration exceed its preepisode peak ensures that the episodes identified are true accelerations and not merely periods of recoveries.
Four additional requirements are introduced to avoid overidentifying investment accelerations and to ensure accurate identification of episodes and starting years. These requirements are designed to tailor the filtering approach to the volatile nature of investment growth. First, to exclude episodes driven by short-term surges, investment growth must be positive in at least five out of the six years of an acceleration period. Second, the investment per capita growth rate at the beginning of the six-year period
11 In the sensitivity analyses, alternative thresholds are used, which do not change the main results (refer to annex 2C).
TABLE 2A.1 Investment accelerations: Distribution over country groups
Source: World Bank.
Note: “Number of economies” refers to economies for which data are available. All nonadvanced economies have been classified in regions and EMDE groups as used by the World Bank in fiscal year 2024. EAP = East Asia and Pacific; ECA = Europe and Central Asia; EMDEs = emerging market and developing economies; FCS = fragile and conflict-affected situations; LAC = Latin America and the Caribbean; LICs = low-income countries; MNA = Middle East and North Africa; SAR = South Asia; SSA = Sub-Saharan Africa.
should not be negative. Third, per capita investment has to accelerate and be higher in the second year of an episode than in the first year. Finally, if more than one year qualifies as the start of the investment acceleration episode, the first year that meets the criteria is identified as the starting year (Jong-A-Pin and De Haan 2008). The unconditional probability of experiencing an investment acceleration in a decade is calculated by dividing the number of identified investment accelerations by the total number of country-years in the sample (later converted to decades) during which an acceleration could occur.
Applying the full set of criteria to data from 1950 to 2022 identifies 192 episodes of investment acceleration in 104 economies. Table 2A.1 shows the distribution of these episodes by region and other groupings. The full list of investment acceleration episodes in EMDEs is presented in table 2A.2.
Comparison with other identification approaches
The identification approach adopted here aligns with existing studies on output and capital stock growth accelerations, but differs in two key dimensions: the duration of heightened growth required and the criteria for identifying accelerations. First, most existing studies on accelerations adopt an eight-year framework without adapting to the volatile nature of investment growth (for instance, Libman, Montecino and Razmi, 2019; Manzano and Saboin 2022). Second, the values for various criteria detailed earlier are drawn from sample statistics, whereas other approaches used ad hoc values (for instance, Hausmann, Pritchett and Rodrik 2005; Jong-A-Pin and de Haan 2011). In
addition, Libman, Montecino, and Razmi (2019) study capital stock growth accelerations. Their approach differs slightly from the one used here in how they identify the correct starting years (that is, using a break test on smoothed capital stock growth series) and in its focus on capital stock per capita growth. The use of capital stock growth makes their set of accelerations less closely linked to output performance.
TABLE 2A.2 List of investment accelerations in EMDEs
Economy
Starting year(s) of investment accelerations
Albania 1999
Algeria 1973,1999
Argentina 1967
Armenia 1997
Bahrain 2012
Economy
Starting year(s) of investment accelerations
Malaysia 1967,1978,1988,2006
Mali 1971,1984,1992,2002,2014
Mauritius 1972,1983
Mexico 1991,2003
Mongolia 1976,2005
Belarus 1999 Morocco 1996
Belize 1986
Benin 1966
Bolivia 2005
Botswana 1996
Brazil 1968,2005
Bulgaria 1994
BurkinaFaso 1968,2002,2017
Mozambique 2007
Namibia 2005
Nepal 2014
Nicaragua 1961,2010
Nigeria 1969
NorthMacedonia2006
Oman 2002
Cambodia 2011 Panama 1965,1990,2005
Chile 1977,1986,2002
China 1977,1991
Paraguay 1971,2005,2016
Peru 1961,1969,1992,2002
Colombia 2001 Philippines 1973,2012
CostaRica 1973,1983,2004
DominicanRepublic1970,2005,2014
Ecuador 2007
ElSalvador 1970,1984,1991,2017
EquatorialGuinea 1994
Honduras 2003
Hungary 1993,2013
India 1985,1994,2004
Indonesia 1987,2003
Iran,IslamicRep. 1963,1999
Poland 1983,1992,2003,2017
Romania 1969,1999,2014
Rwanda 1970,2002
SaudiArabia 2003
SriLanka 1974,1990,2002
Tanzania 2002
Thailand 1958,1976,1987,2001
Togo 1974
Türkiye 1969,2003,2010
Uganda 1993
Jamaica 1966 Uruguay 1974,1991,2004
Kenya 2007 VietNam 2002,2013
Kuwait 1990,2001,2012
Source: World Bank.
Note: EMDEs = emerging market and developing economies.
ANNEX 2B Correlates and probability of investment accelerations
The annex documents data, methodology details, and additional estimation results for the analysis of investment accelerations.
Data
Data for investment, GDP, capital stock, and population for 1950-2019 are sourced from the Penn World Table (PWT) 10.01, which covers many more countries than do alternative databases. To update PWT, investment growth data for 2020-22 are sourced from Haver Analytics, World Bank Development Indicators, and Global Economic Prospects. To compute per capita series of GDP and investment after 2019, population data are taken from the United Nations population prospects database. The final sample of economies includes 35 advanced economies and 69 EMDEs (table 2A.1). These economies represent about 97 percent of global GDP since the mid-2000s (World Bank 2023a).
Data on the explanatory variables are taken from a variety of sources. Institutional quality is proxied by the “law and order” subcomponent of the PRS Group’s International Country Risk Guide (ICRG). The undervaluation index is constructed following Rodrik (2008) using data from PWT. Global GDP growth is computed using GDP weights at average 2010-19 prices and market exchange rates. Primary balance as a share of GDP is taken from the International Monetary Fund’s World Economic Outlook. Inflation data are taken from Ha, Kose, and Ohnsorge (2021). Trade restrictions and inflation-targeting indexes are taken from the International Monetary Fund's Structural Reform Database (Alesina et al. 2020) and AREAER database. The capital account restrictions index is taken from Chinn and Ito (2008). Additional covariates for the robustness checks include natural resource rents as a share of GDP from the World Development Indicators; global recession years defined by Kose, Sugawara, and Terrones (2020); and global financial cycle factor from Miranda-Agrippino and Rey (2020).
Methodology
Pr (Yi,t = 1| Xi,t ) = ɸ (β Xi,t ), (2B.1)
where Pr denotes the probability that a sustained investment acceleration takes place in country i in year t (Yi,t), conditional on a set of variables (Xi,t), and ɸ denotes the cumulative distribution function. Because of uncertainty around the precise starting date of an acceleration, the approach of Hausmann, Pritchett, and Rodrik (2005) and Libman, Montecino, and Razmi (2019) is followed: the dependent variable takes the value 1 in the year immediately before and the year immediately after the beginning of the episode, and 0 otherwise. In addition, the years an episode cannot take place (that is, year two through the end of an episode, as well as the first and last five years of the sample) are excluded. Because of data limitations, the regressions cover the period 19852017. Furthermore, to prevent a small number of countries from having a large influence on the results, estimates are unweighted.
The analysis focuses on the effect of institutional quality (IQ) and economic policy reforms (EPR) on the likelihood that an investment acceleration occurs. In the model, the level of institutional quality, the economic policy reform indicator, and their interaction are included.
The model is
where CV represents the control variables that capture the country’s development status and domestic and external controls, such as global GDP growth. Institutional quality is measured by the law and order subindex from ICRG. Economic policy reforms are calculated as the annual change in the trade restriction index and the Chinn-Ito capital openness index (in percent), the primary balance (in percentage points of GDP), or a dummy variable indicating whether a country has adopted an inflation target or tightened an inflation target since the preceding year.
Results
Table 2B.1 shows the results for the impact of institutional quality and control variables on the probability of an investment acceleration starting in the following year. Column (1) shows the main institutional quality variable, and controls for country-specific conditions that capture the development status (GDP per capita), level of capital (capital -to-output ratio), and the undervaluation index following Rodrik (2008). Columns (2) through (6) add controls for global economic conditions (global GDP growth), economic stability (inflation rate), and the level of fiscal and external policies. Based on these results and the limits that the level of fiscal and external policy place on the sample size, column (2) is the preferred baseline specification for the analysis of policy impacts on the probability of an investment acceleration.
Table 2B.2 presents the impact of policy changes on the probability of an investment acceleration using the set of controls in column (2) of table 2B.1. To simplify the interpretation of the results, the institutional quality variable and the policy change variables are demeaned. The results mirror those in table 2B.1, showing that higher institutional quality, together with the four policy changes presented in table 2B.2, increases the likelihood of an investment acceleration. Furthermore, the impact of a policy is dependent on the level of institutional quality. For two policy changes, the interaction term between the lagged institutional quality variable and the policy change is significant. Column (5) includes all four policy reforms concurrently but does not include an interaction term with institutional quality.
Sensitivity analysis shows that alternative thresholds for the pace or duration of investment acceleration do not materially affect the main results presented here (refer to annex 2D for details).
TABLE 2B.1 Institutional quality and initial conditions as drivers of the likelihood of investment accelerations
Laggedinstitutionalquality
Laggedcapital-to-outputratio
Source: World Bank.
Note: This table shows the estimated coefficients for the change in log-odds. Investment per capita growth accelerations are identified as described in annex 2A. Robust standard errors in parentheses. ***, **, and * indicate significance at the 1, 5, and 10 percent levels, respectively.
TABLE 2B.2 Institutional quality and policies as drivers of the likelihood of investment accelerations
Dependent variable: Investment per capita growth acceleration
Laggedundervaluationindex
InteractionoflaggedIQandchangein capitalaccountopenness(percent) 0.001 (0.88) Adoptionorloweringofinflationtarget (dummy)
InteractionoflaggedIQandadoption orloweringofinflationtarget(dummy)
InteractionoflaggedIQandchangein primarybalance(percentofGDP) 0.027***
Changeintraderestrictionindex (percent)
InteractionoflaggedIQandchangein traderestrictionindex(percent) 0.014*** (2.88)
Source: World Bank.
Note: This table shows the estimated coefficients for the change in log-odds. Investment per capita growth accelerations are identified as described in annex 2A. IQ = institutional quality. Robust standard errors in parentheses. ***, **, and * indicate significance at the 1, 5, and 10 percent levels, respectively.
ANNEX 2C Identification of investment accelerations using different filtering algorithms
Table 2C.1 shows the robustness of the identification approach when alternative parameter values for the minimum average investment growth rate and minimum length of investment acceleration are applied. Overall, setting lower thresholds for growth rates during accelerations or using shorter durations results in a larger number of identified episodes. Despite variations in the number of episodes identified under different parameter combinations, including those based on aggregate rather than per capita investment growth, the findings show sustained and heightened investment and output growth, which supports the use of the baseline approach.
TABLE 2C.1 Investment accelerations using different filtering algorithms
Source: World Bank.
Note: This table displays the number of investment acceleration episodes identified using different thresholds for the algorithm as well as investment growth measured in aggregate rather than per capita terms. In column (1), “years” refers to the minimum duration of the acceleration, and the percent growth rate refers to the minimum average growth rate of (per capita) investment growth. The baseline as described in annex 2A uses a minimum 4 percent average growth and minimum duration of six years as parameters. Column (2) shows the number of identified accelerations. Columns (3) and (4) show the mean investment per capita growth rate during the six years before and during an acceleration. For the algorithm that does not use per capita investment growth in the second row, columns (3) and (4) show mean investment growth not in per capita terms. Column (5) shows the p-value from a two-sided test comparing investment growth rates before and during an acceleration. Columns (6), (7), and (8) show the per capita output growth rates before and during an investment acceleration along with the p-value of the two-sided test assessing if the means are equal. Column (9) shows the number of countries without identified investment accelerations for the given combination of parameters.
ANNEX 2D Robustness of the main results on correlates and probability of investment accelerations
The empirical results presented in annex 2B are robust to the use of alternative sets of episodes identified using different algorithm thresholds and duration parameters, as well as controlling for additional variables. Table 2D.1 reruns the main regression shown in table 2B.2 using investment accelerations identified under an alternative minimum duration requirement, while holding constant the minimum required growth rate of 4 percent. Table 2D.2 shows that the results are also robust to alternative minimum average investment growth thresholds. In table 2D.3, the following additional control variables are included in the baseline regression: lagged per capita investment growth, the global recession year dummies defined in Kose, Sugawara, and Terrones (2020), the global financial cycle factor provided by Miranda-Agrippino and Rey (2020), and natural resource rents as a share of GDP (taken from the World Development Indicators). Table 2D.4 repeats the baseline regression using investment accelerations identified with the baseline parameters applied to aggregate investment growth (that is, not in per capita terms). Across all robustness tests, the baseline results presented in table 2B.2 do not change meaningfully.
TABLE 2D.1 Investment accelerations using different duration parameters
Source: World Bank.
Note: This table shows the estimated coefficients for the change in log-odds. The institutional quality variable and policy change variables have been demeaned for easier interpretation of the interaction term. All regressions use the baseline control variables in column (2) of table 2B.1. The two models presented here use the baseline parameter of 4 percent minimum investment per capita growth but a duration of five years (model 1), seven years (model 2) compared with six years in the baseline. Refer to annex 2C on alternative algorithm specifications. IQ = institutional quality. Robust standard errors are in parentheses. ***, **, and * indicate significance at the 1, 5, and 10 percent levels, respectively.
TABLE 2D.2 Investment accelerations using different duration and growth parameters
Model1:Minimumduration6years,averagegrowthrate3percent
LaggedIQ
Model2:Minimumduration6years,averagegrowthrate5percent
Source: World Bank.
Note: This table shows the estimated coefficients for the change in log-odds. The institutional quality variable and policy change variables have been demeaned for easier interpretation of the interaction term. All regressions use the baseline control variables in column (2) of table 2B.1. The two models presented here use varying minimum average growth and a minimum duration of six years to identify investment accelerations, around the baseline parameters of 4 percent and 6 years. Model 1 requires a minimum duration of 6 years and a minimum growth rate of 3 percent. Model 2 requires a minimum duration of 6 years and a growth rate of 5 percent. Refer to annex 2.3 for alternative algorithm specifications. Refer to annex 2C on alternative algorithm specifications. IQ = institutional quality. Robust standard errors are in parentheses. ***, **, and * indicate significance at the 1, 5, and 10 percent levels, respectively.
TABLE 2D.3 Baseline regressions with additional controls
Model1:Addlaggedinvestmentgrowthtothebaselinemodel
Model2:Addglobalrecessiondummytothebaselinemodel
Model3:Addglobalfinancialcyclefactortothebaselinemodel
Naturalresourcerents(shareof GDP)
Source: World Bank.
Note: This table shows the estimated coefficients for the change in log-odds. The institutional quality variable and policy change variables have been demeaned for easier interpretation of the interaction term. All regressions use the baseline control variables in column (2) of table 2B.1. The four models presented here use additional control variables in the baseline regression. Model 1 controls for lagged per capita investment growth. Model 2 controls for global recession years. Model 3 controls for global financial cycles. Model 4 controls for natural resource rents as a share of GDP. Refer to annex 2B for variable sources and definitions. IQ = institutional quality. Robust standard errors are in parentheses. ***, **, and * indicate significance at the 1, 5, and 10 percent levels, respectively.
TABLE 2D.4 Baseline regressions based on investment growth (not in per capita terms)
Source: World Bank.
Note: This table shows the estimated coefficients for the change in log-odds. The institutional quality variable and policy change variables have been demeaned for easier interpretation of the interaction term. All regressions use the baseline control variables in column (2) of table 2B.1. The dependent variable is a dummy for the start years of investment accelerations identified using the baseline parameters applied to investment growth not in per capita terms. Refer to annex 2C for algorithm parameters. IQ = institutional quality. Robust standard errors are in parentheses. ***, **, and * indicate significance at the 1, 5, and 10 percent levels, respectively.
References
Achy, L. 2011. “The ADCR 2011: Poverty in the Arab World Successes and Limits of Morocco’s Experience.” Arab Development Challenges Report Background Paper 2011/9, United Nations Development Programme, New York.
Ahluwalia, M. 2002. “Economic Reforms in India Since 1991: Has Gradualism Worked.” Journal of Economic Perspectives 16 (3): 67-88.
Ahmad, J., F. Blum, P. Gupta, and D. Jain. 2018. “India’s Growth Story.” Policy Research Working Paper 8599, World Bank, Washington, DC.
Alesina, A., D. Furceri, J. Ostry, C. Papageorgiou, and D. Quinn. 2020. “Structural Reforms and Elections: Evidence from a World-Wide New Dataset.” NBER Working Paper 26720, National Bureau of Economic Research, Cambridge, MA.
Anand, R., and V. Tulin. 2014. “Disentangling India’s Investment Slowdown.” IMF Working Paper 14/47, International Monetary Fund, Washington, DC.
Andrews, D., A. R. Boote, S. S. Rizavi, and S. Singh. 1999. “Debt Relief for LowIncome Countries: The Enhanced HIPC Initiative.” Pamphlet 51, International Monetary Fund, Washington, DC.
Ansar, A., B. Flyvbjerg, A. Budzier, and D. Lunn. 2016. “Does Infrastructure Investment Lead to Economic Growth or Economic Fragility? Evidence from China.” Oxford Review of Economic Policy 32 (3): 360-90.
Bahia, K., P. Castells, G. Cruz, T. Masaki, X. Pedros, T. Pfutze, C. Rodriguez-Castelan, and H. Winkler. 2020. “The Welfare Effects of Mobile Broadband. Evidence from Nigeria.” Policy Research Working Paper 9230, World Bank, Washington, DC.
Barro, R., and X. Sara-i-Martin. 1992. “Convergence.” Journal of Political Economy 100 (2): 223-51.
Berg, A., and O. J. Blanchard. 1994. “Stabilization and Transition: Poland, 1990-91.” In The Transition in Eastern Europe, edited by O. J. Blanchard, K. A. Froot, and J. D. Sachs, 51-92. Chicago: University of Chicago Press.
Berg, A., J. Ostry, and J. Zettelmeyer. 2012. “What Makes Growth Sustained?” Journal of Development Economics 98 (2): 149-66.
Bergin, P. 2022. “Currency Undervaluation and Comparative Advantage.” European Economic Review 150 (C): 104316.
Bergoeing, R., P. Kehoe, T. Kehoe, and R. Soto. 2002. “A Decade Lost and Found: Mexico and Chile in the 1980s.” Review of Economic Dynamics 5 (1): 166-205.
Bleaney, M., and D. Greenaway. 2001. “The Impact of Terms of Trade and Real Exchange Rate Volatility on Investment and Growth in Sub-Saharan Africa.” Journal of Development Economics 65 (2): 491-500.
Breton, P., M. J. Ferrantino, and M. Maliszewska. 2022. Reshaping Global Value Chains in Light of COVID-19: Implications for Trade and Poverty Reduction in Developing Countries. Washington, DC: World Bank.
Bruszt, L., and N. Campos. 2016. “Deep Economic Integration and State Capacity: The Case of the Eastern Enlargement of the European Union.” ADP Working Paper, Asian Development Bank, Manila.
Caselli, F., P. Pagano, and F. Schivardi. 2003. “Uncertainty and the Slowdown in Capital Accumulation in Europe.” Applied Economics 35 (1): 79-89.
Che, N. 2021. “Dissecting Economic Growth in Uruguay.” IMF Working Paper 21/002, International Monetary Fund, Washington, DC.
Chinn, M., and H. Ito. 2008. “A New Measure of Financial Openness.” Journal of Comparative Policy Analysis 10 (3): 309-22.
Cho, D., and Y. Kang. 2013. 2012 Modularization of Korea’s Development Experience: Korea’s Stabilization Policies in the 1980s. Seoul, Korea: Ministry of Strategy and Finance.
Christiano L., and T. Fitzgerald. 2003. “The Band Pass Filter.” International Economic Review 44 (2): 435-65.
Clavijo, S. 2009. “Social Security Reforms in Colombia: Striking Demographic and Fiscal Balances.” IMF Working Paper 09/058, International Monetary Fund, Washington DC.
Corbo V., L. Hernández, and F. Parro. 2005. “Institutions, Economic Policies and Growth: Lessons from the Chilean Experience.” Working Paper 317, Central Bank of Chile, Santiago.
Dappe, M. H., V. Foster, A. Musacchio, T. Ter-Minassian, and B. Turkgulu. 2023. Off the Books: Understanding and Mitigating the Fiscal Risks of Infrastructure. Sustainable Infrastructure Series. Washington, DC: World Bank.
Dappe, M. H., M. Melecky, and B. Turkgulu. 2022. “Fiscal Risks from Early Termination of Public-Private Partnerships in Infrastructure.” Policy Research Working Paper 9972, World Bank, Washington, DC.
De Gregorio, J. 2005. “Crecimiento Económico en Chile: Evidencia, Fuentes y Perspectivas.” Estudios Públicos 98 (March) 19-86.
De Haan, J., K. Stamm, and S. Yu. 2025. “Drivers of Investment Accelerations.” Structural Change and Economic Dynamics 73 (June): 196-210.
De Haas, R., and I. Van Lelyveld. 2006. “Foreign Banks and Credit Stability in Central and Eastern Europe: A Panel Data Analysis.” Journal of Banking & Finance 30 (7): 1927-52.
De la Plaza, L., and S. Sirtaine. 2005. “An Analysis of the 2002 Uruguayan Banking Crisis.” Policy Research Working Paper 3780, World Bank, Washington, DC.
Dieppe, A., ed. 2021. Global Productivity: Trends, Drivers, and Policies. Washington, DC: World Bank.
Djankov, S., T. Ganser, C. McLiesh, R. Ramalho, and A. Shleifer. 2010. “The Effect of Corporate Taxes on Investment and Entrepreneurship.” American Economic Journal: Macroeconomics 2 (3): 31-64.
Donald, A., M. Goldstein, L. Rouanet, and L. Rouanet. “2022. Two Heads Are Better Than One: Agricultural Production and Investment in Côte d’Ivoire.” Policy Research Working Paper 10047, World Bank, Washington, DC.
Dornbusch, R., and Y. Park. 1987. “Korean Growth Policy.” Brookings Papers on Economic Activity 2 (1987): 389-454.
Echandi, R., M. Maliszewska, and V. Steenbergen. 2022. Making the Most of the African Continental Free Trade Area. Washington, DC: World Bank.
Edwards, S. 1998. “The Chilean Pension Reform: A Pioneering Program.” In Privatizing Social Security, edited by M. Feldstein, 33-62. Chicago: University of Chicago Press.
Engel, E., R. Fischer, and A. Galetovic. 2020. “When and How to Use Public-Private Partnerships in Infrastructure: Lessons from the International Experience.” NBER Working Paper 26766, National Bureau of Economic Research, Cambridge, MA.
Essl, S., S. K. Celik, P. Kirby, and A. Proite. 2019. “Debt in Low-Income Countries.” Policy Research Working Paper 8794, World Bank, Washington, DC.
Feenstra, R. C., R. Inklaar and M. P. Timmer. 2015. “The Next Generation of the Penn World Table.” American Economic Review 105 (10): 3150-82.
Fratzscher, M. 2012. “Capital Flows, Push Versus Pull Factors and the Global Financial Crises.” Journal of International Economics 88 (2): 341-56.
G20 Independent Expert Group. 2023. The Triple Agenda: A Roadmap for Better, Bolder, and Bigger MDBs. Report of the Independent Expert Group.
Gallego F., and N. Loayza. 2002. “La Época Dorada del Crecimiento en Chile: Un Problema Financiero.” Revista de Economía Chilena 5 (1): 37-63.
Gardner, C., and P. B. Henry. 2023. “The Global Infrastructure Gap: Potential, Perils, and a Framework for Distinction.” Journal of Economic Literature 61 (4): 1318-58.
Georgiev, Y., P. Nagy-Mohacsi, and A. Plekhanov. 2017. “Structural Reform and Productivity Growth in Emerging Europe and Central Asia.” ADB Economics Working Paper 532, Asian Development Bank, Manila.
Ghani, E., and V. Suri. 1999. “Productivity Growth, Capital Accumulation, and the Banking Sector.” Policy Research Working Paper 2252, World Bank, Washington, DC.
Gill, I. 2024. “The World Needs a New Investment Boom. It’s Still Within Reach Even as Global Growth Slows.” Barron’s (blog), April 4, 2024. https://barrons.com/articles/ investment-boom-global-growth-economy-9b605af3.
Gluzmann, P. A., F. Sturzenegger, and E. Levy-Yeyati. 2012. “Exchange Rate Undervaluation and Economic Growth: Díaz Alejandro (1965) Revisited.” Economics Letters 117 (3): 666-72.
Gluzmann, P. A., F. Sturzenegger, and E. Levy-Yeyati. 2013. “Fear of Appreciation.” Journal of Development Economics 101 (March): 233-47.
Gupta, P., F. Blum, D. Jain, S. John, S. Seth, and A. Singhi. 2018. India Development Update: India’s Growth Story. Washington, DC: World Bank.
Guzman, M., J. Ocampo, and J. Stiglitz. 2018. “Real Exchange Rate Policies for Economic Development.” World Development 110 (October): 51-62.
Ha, J., M. A. Kose, and F. Ohnsorge. 2021. “One-Stop Source: A Global Database of Inflation.” Policy Research Working Paper 9737, World Bank, Washington DC.
Harrigan, J. R., and H. El-Said. 2010. “The Economic Impact of IMF and World Bank Programs in the Middle East and North Africa: A Case Study of Jordan, Egypt, Morocco and Tunisia, 1983-2004.” Review of Middle East Economics and Finance 6 (2): 1-25.
Hastings, J., B. Madrian, and W. Skimmyhorn. 2013. “Financial Literacy, Financial Education, and Economic Outcomes.” Annual Review of Economies 5 (August): 347-73.
Hausmann, R., L. Pritchett, and D. Rodrik. 2005. “Growth Accelerations.” Journal of Economic Growth, 10 (4): 303-29.
Henstridge, M., and L. Kasekende. 2001. “Exchange Reforms, Stabilization, and Fiscal Management.” In Uganda’s Recovery: The Role of Farms, Firms and Government, edited by R. Reinikka and P. Collier. Washington, DC: World Bank.
Hoyos, M., E. Libman, and A. Razmi. 2021. “The Structural Outcomes of Investment Surges.” Structural Change and Economic Dynamics 58 (September): 245-55.
Huang, Y., M. Pagano, and U. Panizza. 2020. “Local Crowding-Out in China.” The Journal of Finance 75 (6): 2855-98.
IMF (International Monetary Fund). 2001. “Morocco: Article IV.” IMF, Washington DC.
IMF (International Monetary Fund). 2003. “Republic of Poland: Staff Report for the 2003 Article IV Consultation.” IMF Country Report 2003/187, IMF, Washington, DC.
IMF (International Monetary Fund). 2004. “Morocco: Staff Report for the 2004 Article IV Consultation.” IMF Country Report 2004/162, IMF, Washington, DC.
IMF (International Monetary Fund). 2005. “Colombia: Staff Report for the 2005 Article IV Consultation.” IMF, Washington, DC.
IMF (International Monetary Fund) 2006a. “Colombia: Selected Issues.” IMF Country Report 06/401, IMF, Washington, DC.
IMF (International Monetary Fund). 2006b. “Colombia: Letter of Intent, Memorandum of Economic and Financial Policies, and Technical Memorandum of Understanding for Stand-By Arrangement.” IMF, Washington, DC.
IMF (International Monetary Fund). 2007. “Türkiye: Article IV.” IMF, Washington, DC.
IMF (International Monetary Fund). 2008. “Uruguay: 2008 Article IV ConsultationStaff Report; Staff Statement; Public Information Notice on the Executive Board Discussion; and Statement by the Executive Director for Uruguay.” IMF, Washington, DC.
IMF (International Monetary Fund). 2010. “Uruguay: 2010 Article IV ConsultationStaff Report; Public Information Notice; and Statement by the Executive Director for Uruguay.” IMF, Washington, DC.
IMF (International Monetary Fund). 2021. “Investment and Capital Stock Dataset.” Macroeconomic and Financial Data. IMF, Washington, DC. https://data.imf.org/? sk=1ce8a55f-cfa7-4bc0-bce2-256ee65ac0e4.
Irwin, D. 2021. “From Hermit Kingdom to Miracle on the Han: Policy Decisions That Transformed South Korea into an Export Powerhouse.” Working Paper 21-14, Peterson Institute for International Economics, Washington, DC.
Jones, B. F., and B. A. Olken. 2008. “The Anatomy of Start-Stop Growth.” Review of Economic and Statistics 90 (3): 582-87.
Jong-A-Pin, R., and J. de Haan. 2008. “Growth Accelerations and Regime Changes: A Correction.” Econ Journal Watch 5 (1): 51-58.
Jong-A-Pin, R., and J. de Haan. 2011. “Political Regime Change, Economic Liberalization and Growth Accelerations.” Public Choice 146 (1): 93-115.
Kaiser, T., and L. Menkhoff. 2017. “Does Financial Education Impact Financial Literacy and Financial Behavior, and If So, When?” World Bank Economic Review 31 (3): 611-30.
Karlan, D., R. Knight, and C. Udry. 2012. “Hoping to Win, Expected to Lose: Theory and Lessons on Micro Enterprise Development.” World Bank Research Observer 27 (2): 263-95.
Kim, J., and L. Lau. 1994. “The Sources of Economic Growth of the East Asian Newly Industrialized Countries.” Journal of the Japanese and International Economies 8 (3): 235-71.
Kim, J.-H., J. A. Fallov, and S. Groom. 2020. Public Investment Management Reference Guide. Washington, DC: World Bank.
Kitabire, D. 2010. “Debt Management and Debt Relief.” In Uganda's Economic Reforms: Insider Accounts, edited by F. Kuteesa, E. Tumusiime-Mutebile, A. Whitworth, and T. Williamson, 264-76. Oxford, U.K.: Oxford University Press.
Koepke, R. 2019. “What Drives Capital Flows to Emerging Markets? A Survey of the Empirical Literature.” Journal of Economic Surveys 33 (April): 516-40.
Koh, Y. 2007. “Reforming the Fiscal Management System in Korea.” In Fiscal Policy and Management in East Asia,Volume 16, edited by T. Ito and A. K. Roses, 289-335. Chicago: University of Chicago Press.
Koh, Y. 2010. “The Growth of Korean Economy and the Role of Government.” In The Korean Economy: Six Decades of Growth and Development, edited by I. Sakong and Y. Koh, Chapter 2. Sejong-si, Korea: Korea Development Institute.
Kose, M. A., and F. Ohnsorge, eds. 2019. A Decade After the Global Recession: Lessons and Challengers for Emerging and Developing Economics. Washington DC: World Bank.
Kose, M. A., and F. Ohnsorge, eds. 2024. Falling Long-Term Growth Prospects: Trends, Expectations, and Policies. Washington, DC: World Bank.
Kose, M. A., F. Ohnsorge, L. Ye, and E. Islamaj. 2017, “Weakness in Investment Growth: Causes, Implications and Policy Responses.” Policy Research Working Paper 7990, World Bank, Washington, DC.
Kose, A., N. Sugawara, and M. E. Terrones. 2020. “Global Recessions.” Policy Research Working Paper 9172, World Bank, Washington, DC.
Krueger, A., and J. Yoo. 2002.“Chaebol Capitalism and the Currency-Financial Crisis in Korea.” In Preventing Currency Crises in Emerging Markets, edited by S. Edwards and J. Frankel, Chapter 13. Chicago: University of Chicago Press.
Kuteesa, F., E. Tumusiime-Mutebile, A. Whitworth, and T. Williamson. 2010. Uganda's Economic Reforms: Insider Accounts. Oxford, U.K.: Oxford University Press.
Lee, J. 1995. “Government Interventions and Productivity Growth in Korean Manufacturing Industries.” NBER Working Paper 5060, National Bureau of Economic Research, Cambridge, MA.
Lee, J. 2013. “Foreign Capital in Economic Development: Korean Experiences and Policies.” In Modularization of Korea’s Development Experience. KDI School of Public Policy and Management. Seoul, Korea: Ministry of Strategy and Finance.
Lee, J.-Y. 1997. Sterilizing Capital Inflows. Washington, DC: International Monetary Fund.
Libman, E., J. A. Montecino, and A. Razmi. 2019. “Sustained Investment Surges.” Oxford Economic Papers 71 (4): 1071-95.
Loayza, N., and S. Pennings. 2022. The Long-Term Growth Model: Fundamentals, Extensions, and Applications. Washington, DC: World Bank.
Macovei, M. 2009. “Growth and Economic Crises in Türkiye: Leaving Behind a Turbulent Past?” European Commission Economic Papers 386, European Commission, Brussels.
Manzano, O., and J. L. Saboin. 2022. “Investment Booms and Institutions: Implications for the Andean Region.” IDB Technical Note 2479, Inter-American Development Bank, Washington, DC.
Marandino, J., and G. Oddone. 2018. “The Monetary and Fiscal History of Uruguay: 1960-2017.” Working Paper 2018-60, Becker Friedman Institute for Economics, University of Chicago.
Marioli, F., A. Fatas, and G. Vasishtha. 2023. “Fiscal Policy Volatility and Growth in Emerging Markets and Developing Economies.” Policy Research Working Paper 10409, World Bank, Washington, DC.
Mawejje, J., and N. M. Odhiambo. 2021. “Uganda’s Fiscal Policy Reforms: What Have We Learned?” Public Budgeting & Finance 41 (2): 89-107.
McKenzie, D., and C. Woodruff. 2014. “What Are We Learning from Business Training and Entrepreneurship Evaluations around the Developing World?” World Bank Research Observer 29 (1): 48-82.
Mensah, J., and N. Traore. 2022. “Infrastructure Quality and FDI inflows. Evidence from the Arrival of High-Speed Internet in Africa.” Policy Research Working Paper 9946, World Bank, Washington, DC.
Miranda-Agrippino, and S., H. Rey. 2020. “U.S. Monetary Policy and the Global Financial Cycle.” Review of Economic Studies 87 (6): 2754-76.
Moïsé, E., and F. Le Bris. 2013. “Trade Costs—What Have We Learned? A Synthesis Report.” OECD Trade Policy Papers 150, Organisation for Economic Co-operation and Development, Paris.
Moreira, E. P. 2019. “Morocco’s Growth and Employment Prospects: Public Policies to Avoid the Middle-Income Trap.” Policy Research Working Paper 8769, World Bank, Washington, DC.
Murgasova, Z. 2005. “Post-Transition Investment Behavior in Poland: A Sectoral Panel Analysis.” IMF Working Paper 2005/184, International Monetary Fund, Washington, DC.
Muwanga-Zake, E. S. K., and S. Ndhaye. 2001. “The HIPC Debt Relief Initiative Uganda’s Experience.” Discussion Paper 2001/94, UNU/WIDER, Helsinki.
Naguib, R., and J. Smucker. 2009. “When Economic Growth Rhymes with Social Development: The Malaysia Experience.” Journal of Business Ethics 89 (November): 99113.
Nam, S. 1988. “Alternative Growth and Adjustment Strategies of Newly Industrializing Countries in Southeast Asia.” In Beyond Adjustment: The Asian Experience, edited by P. Streeten, Chapter 2. Washington DC: International Monetary Fund.
OECD (Organisation for Economic Co-operation and Development) and IDB (InterAmerican Development Bank). 2016. Broadband Policies for Latin America and the Caribbean: A Digital Economy Toolkit. Paris: Organisation for Economic Co-operation and Development.
Paus, E. 2012. “Confronting the Middle-Income Trap: Insights from Small Latecomers.” Studies in Comparative International Development 47 (April): 115-38.
Peluffo, A. 2013. “Assessing Labor Market Impacts of Trade Opening in Uruguay.” SpringerPlus 2 (1): 1-19.
PRS Group (Political Risk Services) database. “The International Country Risk Guide (ICRG).” Accessed on November 10, 2023. https://prsgroup.com/explore-our-products/ icrg.
Qureshi, Z., J. L. Diaz-Sanchez, and A. Varoudakis. 2015. “The Post-Crisis Growth Slowdown in Emerging Economies and the Role of Structural Reforms.” Global Journal of Emerging Market Economies 7 (2): 179-200.
Reinikka, R., and P. Collier. 2001. Uganda's Recovery: The Role of Farms, Firms and Government. Washington, DC: World Bank.
Rial, I., and L. Vicente. 2003. “Sostenibilidad y Vulnerabilidad de la Deuda Pública Uruguaya: 1988-2015.” Revista de Economía, Segunda Época 10 (2): 143-220.
Ribeiro, R., J. McCombie, and G. Lima. 2020. “Does Real Exchange Rate Undervaluation Really Promote Economic Growth?” Structural Change and Economic Dynamics 52 (C): 408-17.
Rodrik, D. 2008. “The Real Exchange Rate and Economic Growth.” Social and Economic Studies 56 (2): 365-412.
Schwartz, G., M. Fouad, T. Hansen, and G. Verdier, eds. 2020. Well Spent: How Strong Infrastructure Governance Can End Waste in Public Investment. Washington, DC: International Monetary Fund.
Somogyi, J. 1991. “Malaysia’s Successful Reform Experience.” Finance and Development 28 (001).
Stamm, K., and D. Vorisek. 2023. “The Global Investment Slowdown: Challenges and Policies.” In Falling Long-Term Growth Prospects: Trends, Expectations, and Policies, edited by M. A. Kose and F. Ohnsorge, 153-210. Washington, DC: World Bank.
UNEP (United Nations Environment Programme). 2023. Adaptation Gap Report 2023 New York: United Nations Environment Programme.
United Nations, Inter-agency Task Force on Financing for Development. 2022. Financing for Sustainable Development Report 2022. New York: United Nations.
Vashakmadze, T., J. Ha, D. Fukuzawa, J. Zhou, W. Choi, S. Chung, and J. Pyun. 2023. “Leveraging Global Integration and International Trade.” In Innovative Korea: Leveraging Innovation and Technology for Development, edited by H. Soh, Y. Koh, and A. Aridi, Chapter 4. Washington, DC: World Bank.
WDI (database). World Development Indicators. World Bank. Accessed on Nov. 10 2023. https://databank.worldbank.org/source/world-development-indicators.
World Bank. 2001. “Kingdom of Morocco: Poverty Update, Volume 1. Main Report.” World Bank, Washington, DC.
World Bank. 2004. World Development Report 2005: A Better Investment Climate for Everyone. Washington, DC: World Bank.
World Bank. 2007. “Uganda, Moving Beyond Recovery: Investment and Behavior Change for Growth.” Country Economic Memorandum, World Bank, Washington, DC.
World Bank. 2008. “Turkey Country Economic Memorandum.” World Bank, Washington, DC.
World Bank. 2015. “From Billions to Trillions: Transforming Development Finance.” Development Committee Paper, World Bank, Washington, DC.
World Bank. 2016. “Farms, Cities and Good Fortune: Assessing Poverty Reduction in Uganda from 2006 to 2016.” Uganda Poverty Assessment Report, World Bank, Washington, DC.
World Bank. 2019. Global Economic Prospects: Heightened Tensions, Subdued Investment. June. Washington, DC: World Bank.
World Bank. 2020a. The African Continental Free Trade Area: Economic and Distributional Effects. Washington, DC: World Bank.
World Bank. 2020b. “Benchmarking Infrastructure Development 2020: Assessing Regulatory Quality to Prepare, Procure, and Manage PPPs and Traditional Public Investment in Infrastructure Projects.” World Bank, Washington, DC.
World Bank. 2021. Global Economic Prospects. January. Washington, DC: World Bank.
World Bank. 2022a. Global Economic Prospects. January. Washington, DC: World Bank.
World Bank. 2022b. “Update on World Bank Group Efforts to Facilitate Private Capital Investments.” World Bank, Washington, DC.
World Bank. 2022c. Poland Public Finance Review. World Bank, Washington, DC.
World Bank. 2023a. Global Economic Prospects. January. Washington, DC: World Bank.
World Bank. 2023b. South Asia Development Update: Toward Faster, Cleaner Growth. Washington, DC: World Bank.
World Bank. 2023c. South Asia Development Update: Expanding Opportunities: Toward Inclusive Growth. Washington, DC: World Bank.
World Economic Outlook Database. Accessed on October 11, 2023. https://imf.org/en/ Publications/WEO/weo-database/2023/October.
Zattler, J. 2023. “The Annual Meetings: Time to Walk the Talk on Private Sector Mobilisation for Climate.” Center for Global Development (blog), October 10, 2023. https://cgdev.org/blog/annual-meetings-time-walk-talk-private-sector-mobilisationclimate.
No country has sustained rapid growth without also keeping up impressive rates of public investment—in infrastructure, education, and health. Far from crowding out private investment, this spending crowds it in. It paves the way for new industries to emerge and raises the return to any private venture that benefits from healthy, educated workers, passable roads, and reliable electricity.
Commission on Growth and Development (2008) World Bank Group
CHAPTER 3
Public Investment as a Catalyst of Economic Growth
A significant boost to investment is essential if emerging market and developing economies (EMDEs) are to achieve key policy goals—delivering stronger growth, creating more jobs, and addressing the challenges posed by development needs and climate change. In EMDEs, however, investment growth has experienced a sustained slowdown since the global financial crisis. Public investment averages about one-quarter of total investment in EMDEs—a modest share. Yet it can be a powerful policy lever to ignite growth, including by helping to catalyze private investment. In EMDEs with ample fiscal space and a record of efficient government spending, scaling up public investment by 1 percent of gross domestic product (GDP) can increase output by 1.6 percent over five years. Public investment also crowds in private investment and boosts productivity, promoting long-run economic growth in these economies. Public investment in EMDEs, however, has experienced a historic slowdown in the past decade. To boost public investment and maximize its positive effects, EMDEs should undertake wide-ranging policy reforms to improve public investment efficiency—by, among other things, strengthening governance and fiscal administration—and create fiscal space through revenue and expenditure measures. The global community can play an important role in facilitating these reforms—particularly in lower-income developing countries— through financial support and technical assistance.
Introduction
The investment gaps to achieve the key development goals and address climate issues are significant. EMDEs need to invest an estimated $2.4 trillion per year (World Bank 2024a). By some estimates, to meet climate change objectives and other development goals, low-income countries (LICs) require annual investment of 8 percent of GDP through 2030 (figure 3.1.A; World Bank 2023a). LICs have especially large infrastructure gaps related to the provision of basic public services such as electricity, transportation, clean water, basic sanitation, and health, while the quality of existing EMDE infrastructure in some sectors (transportation, for example) is much lower than that in advanced economies (figures 3.1.B and 3.1.C).
Compounding the challenge, since the global financial crisis, investment has been in a broad-based and prolonged slump, as economic growth slowed and the external macroeconomic environment deteriorated. In EMDEs, average total investment growth decelerated from about 10 percent per year in the 2000s to 5 percent in the 2010s—the slowest
Note: This chapter was prepared by Amat Adarov, Benedict Clements, João Tovar Jalles, Jeetendra Khadan, Nikita Perevalov, and Naotaka Sugawara, with contributions from Joseph Mawejje, Valerie Mercer-Blackman, Ugo Panizza, and Takefumi Yamazaki. Some of the analytical work in the chapter is based on Adarov, Clements, and Jalles (2024) and Adarov and Panizza (2024).
average pace in the past three decades (chapter 1; figure 3.1.D). Investment growth accelerations, which are associated with multiple macroeconomic benefits, also became less common in the past decade (chapter 2). The global pandemic recession, escalating geopolitical tensions, policy uncertainty, trade tensions and fragmentation, and sharp increases in inflation and interest rates further jeopardized investment prospects in EMDEs. To address their substantial development needs and boost growth, EMDEs will need both public and private investment.
Public investment has the potential to ignite growth, crowd in private investment, and support economic development.1 Public investment in connectivity infrastructure (roads, bridges, telecommunications networks), public schools and health care facilities, electricity generation and transmission, and other infrastructure can enhance firm productivity, promote capital and labor flows, enable trade, and foster human capital development. In other words, beyond its short-term demand effects, public investment can have positive supply-side impacts, raising the productive capacity of the economy and private sector competitiveness, supporting economic growth in the long term.
Public investment can play an important role in the economy for multiple reasons. Infrastructure investment offers a helpful lens for articulating this role. First, infrastructure projects often involve substantial up-front costs and maintenance expenditures without necessarily generating a commercially viable revenue stream. Second, infrastructure sectors with especially large sunk costs and economies of scale may also exhibit natural monopoly properties: that is, there are often only a few efficient market participants given high barriers to entry. Some of these projects in advanced economies can be undertaken by the private sector with appropriate regulation. However, in EMDEs, the private sector often lacks access to finance and the technical capabilities to develop critical infrastructure effectively. Third, some capital services may also have the characteristics of public goods, meaning they are nonexcludable and nonrival: they can be used by many simultaneously without the ability to exclude nonpayers. This feature may complicate their provision by the private sector. In addition, governments are generally seen as more creditworthy than private companies, given their power to tax, their ownership of large-scale assets that can serve as collateral for borrowing, and their greater capacity to pool the necessary resources to execute large-scale infrastructure investment projects.2
A combination of these factors means that the private sector in EMDEs may not always be best placed to deliver some types of public infrastructure effectively and ensure
1 “Public investment” in this chapter refers to general government gross fixed capital formation, in constant U.S. dollars. Public investment includes the total net value of general government acquisitions of fixed assets during a given period and changes in the valuation of nonproduced nonfinancial assets, such as land improvements. The main source of public investment data is the International Monetary Fund’s Investment and Capital Stock Dataset (IMF 2021a). For years after 2019, these data are complemented by data from Haver Analytics and the World Bank’s World Development Indicators database.
2 For the role of public investment in the provision of infrastructure, refer to Aschauer (1989a, 1989b), Mazzucato and Semieniuk (2017), Ramey (2021), Schwartz et al. (2020), Warner (2014); for constraints faced by private investment in EMDEs, refer to IMF (2021b), Kose and Ohnsorge (2024), World Bank (2023a, 2024a); for the borrowing capacity of governments, refer to Martinez et al. (2023).
FIGURE 3.1 Infrastructure investment needs and investment growth
The scale of global investment needed to meet the key development goals and achieve commitments made under the Paris Agreement is enormous. To meet climate change objectives and other development goals, LICs require annual investment of 8 percent of GDP through 2030. Compounding the challenge, in EMDEs, average investment growth decelerated from about 10 percent per year in the 2000s to 5 percent in the 2010s.
A. Investment needs for a resilient and low-carbon pathway, 2022-30
B. Access to infrastructure
Sources: Haver Analytics; Penn World Table 10.01 (Feenstra, Inklaar, and Timmer 2015); WDI (database); World Bank (2022a).
Note: AEs = advanced economies; EMDEs = emerging market and developing economies; LICs = low-income countries; RHS = righthand side.
A. Estimates of the annual investment needs to build resilience to climate change and put countries on track to reduce emissions by 70 percent by 2050. Depending on data availability, estimates include investment needs on transportation, energy, water, urban adaptations, industry, and landscape.
B. 2013-23 averages of the percent of the population with access to electricity, minimally adequate drinking water, and basic sanitation facilities; 2013-23 averages of the number of hospital beds available per 1,000 people. Sample includes 34 advanced economies and up to 104 EMDEs, of which 19 are LICs.
C. 2013-23 averages. The indexes range from 1 to 5 (5 = highest). Quality of transportation infrastructure reflects perceptions of the quality of trade- and transportation-related infrastructure. Logistics performance index reflects perceptions of the overall quality of logistics. Sample includes 34 advanced economies and 100 EMDEs, of which 19 are LICs.
D. Investment growth averages are calculated using investment in constant U.S. dollars as weights. Sample includes up to 103 economies, of which 68 are EMDEs.
equitable or universal access by the population without some form of government intervention. This is especially so in the case of public health care, water provision, electricity transmission, public transportation, and recreation spaces (parks, for example). Provision of such infrastructure can also help lower poverty and inequality, build resilience against climate change and natural disasters, and promote inclusive economic development (Schwartz et al. 2020). These benefits may strengthen the case for public investment, extending it far beyond pure economic growth effects. However, the benefits can be difficult to quantify precisely, and alternative approaches (such as
regulation), as well as different forms of public-private sector interaction related to investment, may help address specific market failures in certain circumstances.
That said, investment, whether public or private, can lead to undesired outcomes if mismanaged. Specifically, public infrastructure investment can have negative fiscal implications: the construction and upkeep of public infrastructure can involve massive costs, which could lead to large fiscal deficits and debt-related risks. Public sector inefficiencies can also undermine projects, especially in countries with weak governance and limited capacity for fiscal administration. In the worst case, public investment could yield infrastructure that is both unproductive and costly to maintain, resulting in negative net macroeconomic effects over an extended period. Furthermore, public investment could crowd out private investment in some circumstances, especially when the public sector is inefficient or when scaling up is sizable and fast-paced. These challenges are particularly relevant for EMDEs, many of which have weak institutions, public sector inefficiencies, and limited fiscal resources.3
Against this backdrop, the chapter addresses the following questions:
• How has public investment evolved in EMDEs?
• What is the impact of public investment on output and private investment?
• What policies can EMDEs adopt to bolster public investment and harness the benefits from it?
Contributions. The chapter contributes to the literature in several ways.
First, the chapter provides a thorough assessment of public investment trends in EMDEs, including in EMDE country groups and regions. Second, it examines the macroeconomic effects of public investment by estimating its impact on output— known as the public investment multiplier—using a new approach to identify public investment shocks. The chapter also analyzes the macroeconomic conditions and structural characteristics that help boost the effects of public investment on private investment, productivity, and potential output. Third, in light of the insights from the empirical analysis, the chapter presents a high-level summary of policies in EMDEs to boost public investment and to maximize its positive macroeconomic effects. It considers the current capacity of EMDEs to engage in government spending without undermining fiscal sustainability as well as structural challenges critical for ensuring investment efficiency and opportunities for greater international support. Specifically, it estimates what governments in EMDEs can feasibly achieve given their fiscal constraints.
3 For the fiscal impact of public investment, refer to Afonso and Alves (2023) and Berg et al. (2012). For public sector inefficiencies in the context of investment, refer to Chakraborty and Dabla-Norris (2011) and Dabla-Norris et al. (2012). For unproductive public infrastructure, refer to Pritchett (2000). For the role of public investment in crowding out private investment, refer to Aschauer (1989a) and Cavallo and Daude (2011).
Findings. The chapter offers the following key findings:
Public investment growth in EMDEs has slowed sharply, halving from an average of 10 percent per year over 2000-09 to about 5 percent over 2010-23. Although public investment growth has slowed in both EMDEs and advanced economies compared to the pace of the 2000s, public-investment-to-GDP ratios are still larger in EMDEs. Public investment represented about 6 percent of GDP in EMDEs during 2010-23, compared with an average of 4 percent in advanced economies.
Public investment has the strongest impact on output when it occurs in countries with ample fiscal space and high government efficiency. Effective public investment can stimulate economic growth in EMDEs. Scaling up public investment in EMDEs by the equivalent of 1 percent of GDP leads to an increase in output of 1.1 percent after five years, on average. However, the effectiveness of public investment hinges on government efficiency and fiscal space.4 In countries with high public investment efficiency or low concerns about fiscal sustainability, an increase in public investment equivalent to 1 percent of GDP raises output by 1.6 percent after five years, half a percentage point higher than the average effect in EMDEs.5
Public investment can help mobilize private investment, enhance productivity, and generate potential output gains. Public investment can have significant crowding-in effects on private investment: an increase in public investment equivalent to 1 percent of GDP is associated with an increase in private investment by up to 2.2 percent after five years, on average. An increase in public investment by 1 percent of GDP raises labor productivity by up to 1.9 percent and potential output by up to 1.1 percent over the same horizon.
Even with significant fiscal effort, the public sector can provide only a limited share of the investment needed in EMDEs. Model simulations suggest that public investment can cover about one-third of the aggregate investment gap in EMDEs. However, even these relatively modest increases in public investment would require significant domestic revenue mobilization efforts complemented by reallocation of fiscal resources toward investment spending and debt financing. This limitation makes private capital mobilization critical to bridging the investment gaps.
Policies to reap full benefits from public investment depend on country circumstances; broadly, however, EMDEs should prioritize a “three Es” package: expansion of fiscal space, efficiency of public investment, and enhanced global support. First, they must expand their
4 Fiscal space can be affected by government debt sustainability, balance sheet composition, external and private sector debt, and market perception of sovereign risk (Kose et al. 2022). The chapter’s empirical analysis uses the public-debt-to-GDP ratio as a proxy for fiscal space, though the amount of fiscal space for a given debt-to-GDP ratio may vary depending on country circumstances.
5 Here, high and low levels of public investment efficiency correspond to the top and bottom quartiles of the public infrastructure efficiency index used in the estimation of public investment multipliers. Public investment efficiency is defined as the fraction of public investment that translates into effective public capital stock (Pritchett 2000). Efficiency depends on the strength of institutions, the quality of the design and implementation of public investment projects, and the effectiveness of procurement systems, among other factors (Kim, Fallov, and Groom 2020). The chapter uses several public investment efficiency measures.
fiscal space, whether through reforms to improve tax collection efficiency, enhance fiscal frameworks, or curtail unproductive spending. Limited fiscal space impedes the ability of a government to scale up public investment. The effect of public investment on output in EMDEs with large fiscal space is 1 percentage point higher than in countries with small fiscal space, on average. Second, EMDEs need to improve public investment efficiency. Reducing corruption, improving governance, and expanding the capacity of fiscal administration are critical, and can be complemented by initiatives to prioritize public investment projects with the greatest potential to spark long-term productivity gains, such as those focusing on health, education, digital networks, and renewable energy infrastructure. Third, public investment in EMDEs can be enhanced through global support. Coordinated financial support and effective technical assistance are imperative for accelerating reforms, reducing vast infrastructure gaps, and addressing climate change, especially in countries with limited fiscal space and deep structural challenges.
Evolution of public investment
Public investment growth has evolved notably over the past three decades. In the 1990s, public investment in EMDEs grew at a rapid pace of about 8 percent per year to a large extent because of robust growth in China (figure 3.2.A). This was followed by exceptionally high public investment growth of about 10 percent per year in the 2000s, a decade characterized by macroeconomic stability, rapid economic integration and poverty reduction, and elevated commodity prices. The latter also resulted in accelerated public investment growth in commodity-exporting EMDEs (figure 3.2.B).
During the global financial crisis, public investment growth plunged, contracting in advanced economies and decelerating significantly in EMDEs, and thereafter remained subdued relative to the rates of the 2000s. Average annual public investment growth in EMDEs was 5 percent in 2010-23, half of the rate in 2000-09. This slowdown was associated with multiple factors: weaker economic growth in EMDEs in the aftermath of the global financial crisis, slowing trade and capital flows, heightened economic uncertainty, geopolitical tensions, tight financial conditions, increased debt levels eroding fiscal space and requiring consolidation, and highly volatile commodity prices. In the early 2020s, governments prioritized expenditures to contain the COVID-19 pandemic and provide support to vulnerable population groups and firms, resulting in cutbacks and delays in public investment spending. The decline in public investment growth was also accompanied by a broad-based slowdown in private investment growth in EMDEs, which decelerated from 12 percent per year in the 2000-09 to 7 percent in 2010-23 (chapter 1).
Public investment growth in commodity-exporting EMDEs—which was much higher than that in other EMDEs through the 2000s—slumped as global commodity prices declined, adversely affecting these countries’ public finances (figure 3.2.B). Over this period, public investment in LICs grew, on average, much faster than in other EMDEs.
FIGURE 3.2 Public investment patterns in EMDEs
Average annual public investment growth in EMDEs halved, dropping from 10 percent in 2000-09 to 5 percent in 2010-23—the slowest pace in the past three decades. The slowdown was broad-based across EMDE regions and country groups. In EMDEs, public investment tends to play a greater role than in advanced economies: it accounted for about 6 percent of GDP on average in EMDEs in the past decade, compared with about 4 percent of GDP in advanced economies.
Public investment growth, by EMDE region
Sources: Haver Analytics; Investment and Capital Stock Dataset (IMF 2021a); WDI (database); World Bank.
Note: Com. exporters = commodity-exporting EMDEs; Com. importers = commodity-importing EMDEs; EAP = East Asia and Pacific; ECA = Europe and Central Asia; EMDEs = emerging market and developing economies; LAC = Latin America and the Caribbean; LICs = low-income countries; MNA = Middle East and North Africa; SAR = South Asia; SSA = Sub-Saharan Africa.
A. Public investment growth averages are calculated using public investment in constant international dollars as weights. Sample includes up to 162 economies, of which 125 are EMDEs.
B.C. Median annual public investment growth by EMDE group or region. Sample includes up to 125 EMDEs, of which 22 are LICs, 77 are commodity-exporting EMDEs, and 48 are commodity-importing EMDEs. Sample includes 12 EAP, 19 ECA, 28 LAC, 15 MNA, 8 SAR, and 44 SSA countries.
D. Bars show medians and whiskers show interquartile ranges for 2010-23 by group. Sample includes up to 37 advanced economies and 125 EMDEs.
The weakening of public investment growth during 2010-23 compared to 2000-09 occurred in all EMDE regions. The slowdown was especially notable in Europe and Central Asia (ECA), Latin America and the Caribbean (LAC), and the Middle East and North Africa (MNA), where fiscal challenges were compounded by the sustained decline in commodity prices, leading to revenue losses and adjustments in government spending in commodity-exporting countries (figure 3.2.C).
Although public investment growth has slowed in both EMDEs and advanced economies compared to the pace of the 2000s, public-investment-to-GDP ratios are still higher in EMDEs. Median public investment was about 6 percent of GDP in EMDEs
B. Public investment growth, by EMDE group
A. Public investment growth
D. Public investment as a share of GDP
C.
in 2010-23, versus about 4 percent in advanced economies (figure 3.2.D). EMDEs tend to rely on the public sector to deliver necessary infrastructure to a larger extent than advanced economies do. The private sector often lacks the capacity or willingness to invest in large infrastructure projects in EMDEs, partly because of greater uncertainty and perceived risks. Moreover, domestic and international creditors often see EMDE governments as more creditworthy than local private investors, given their power to tax, their ownership of significant assets that can serve as collateral, and their capacity to pool the resources needed to execute large-scale projects (Martinez et al. 2023). Although public investment ratios are similar across EMDE country groups, commodity-exporting EMDEs and LICs have slightly higher public investment ratios than other EMDEs.
Growth effects of public investment:Transmission channels
The literature documents that public investment has a positive impact on growth in the medium term, but the range of estimated public investment multipliers varies widely.6 Because of data constraints and methodological challenges, estimates of public investment multipliers for EMDEs are especially limited. The literature finds that the economic effects of public investment are influenced by factors such as government investment efficiency, fiscal space, trade openness, exchange-rate regime, informality, financial development, the phase of the business cycle, and macroeconomic uncertainty.
The heterogeneity of the output impacts of public investment reflects the effectiveness of the transmission channels through which public investment operates:
• Short-term aggregate demand effects. Public investment can support economic activity by boosting aggregate demand in the short term. This positive impact, however, is at least partly offset by the associated fiscal effects on the real economy, because public investment in principle is funded through taxation, debt issuance, or reallocation of government expenditure. In addition, the multiplier effect is weakened by purchases of investment goods abroad and depends on the import intensity of investment (the “leakage effect”). Rapid scaling up of public investment, depending on its funding source and efficiency, may fuel fiscal imbalances and thereby undermine growth prospects (Bom and Ligthart 2014; Romp and de Haan 2005).
• Long-term aggregate supply effects. Public investment can directly increase the productive capacity of an economy by fostering enhanced productivity of private fixed capital and labor through the provision of public infrastructure. For instance, new roads and bridges can increase the overall competitiveness of an economy by enabling connectivity or reducing its costs (Aschauer 1989b; Romp and de Haan 2005; Straub 2011).
• Crowding in or crowding out of private investment. Public investment can crowd in private investment directly by requiring the use of private capital in the implementa-
6 World Bank (2024b) provides a comprehensive review of the link between public investment and growth.
tion of an investment project, for instance, via public-private partnerships. Public investment can also enable infrastructure that raises returns on private capital—for instance, roads and communications infrastructure—thereby encouraging private sector investment (Aschauer 1989a; Eden and Kraay 2014). Public investment helps reduce uncertainty and risks associated with large private investment projects, especially infrastructure projects requiring massive up-front costs and long payback periods (IMF 2021b). However, public investment may also crowd out private investment, especially when fiscal space is limited and additional fiscal stimulus raises sovereign risk and borrowing costs for the private sector (Abiad, Furceri, and Topalova 2016; Erenburg and Wohar 1995; Huidrom et al. 2020). The net effect on the private sector depends on the balance between these opposing factors, which, in turn, is influenced by fiscal space and the quality of public investment.
• Efficiency and quality of public investment. Scaling up public investment may not necessarily result in an equivalent increase in the value of productive public capital (Pritchett 2000). Some resources are lost during the investment process because of weak governance, corruption, coordination issues, and poor design and implementation of investment projects. There may also be diminishing returns on additional public investment, though this result depends on a country’s circumstances and the merits of specific projects. In the worst case, poor investment yields infrastructure that is unproductive yet requires a continuous stream of fiscal resources to maintain, thereby hindering long-term growth (Chakraborty and Dabla-Norris 2011; DablaNorris et al. 2012).7
• Public capital maintenance costs. More generally, depreciating public capital stocks require additional short- and long-run maintenance. The associated costs may lead to additional fiscal strains that undermine long-term positive growth effects. Meanwhile, inadequate or untimely maintenance of public capital could lead to even larger social and economic costs associated with infrastructure failures (Schwartz et al. 2020).8 The strength of this channel is intertwined with the efficiency channel, because low-quality public investment is more likely to yield infrastructure that is prone to larger or more frequent upkeep costs.
• Sustainability of growth. Public investment can also play an important role in delivering public goods or services that may not be privately profitable, such as public health care and education, water and energy transmission, and national security. This type of public investment can be instrumental for facilitating sustainable and inclusive growth through its positive effects on human capital develop-
7 As a related matter, there are challenges associated with the measurement and valuation of public investment at a disaggregated level—specifically, identifying infrastructure-related spending and the composition of public investment by capital asset types (refer also to Asian Development Bank 2017 and Fay et al. 2019). These challenges hinder the assessment of the macroeconomic effects by individual categories of public investment and types of infrastructure—likely to be heterogeneous (refer to Foster et al. 2023 for a meta-analysis).
8 Governments may also have stronger incentives to spend on new investment projects rather than on maintenance because the former is more visible and attractive from an electoral perspective (de Haan and Klomp 2013).
ment, social inclusion, and the environment (Foster et al. 2023; Mazzucato and Semieniuk 2017; Turnovsky 2015; Zachmann et al. 2012).
Macroeconomic effects of public investment in EMDEs
The major challenge in estimating the macroeconomic effects of public investment is the bi-directional causality between public spending and economic growth (Canning and Pedroni 2008). Several approaches—including the use of structural vector autoregressions with recursive identification of public spending shocks, use of official lending or military spending as instruments for public spending, and use of forecast errors in public spending as a proxy for fiscal shocks—have been used in the literature to address the causality challenge. However, the methods devised to date have certain caveats that limit their application to the large sample of EMDEs. This chapter uses a new approach to identify changes in public investment that are not affected by macroeconomic conditions (that is, public investment shocks) and to estimate the effect of these shocks on output (that is, public investment multipliers) and other macroeconomic variables.
• Identification of public investment shocks. Public investment shocks are identified as episodes of large changes in cyclically adjusted public investment (annex 3A; Adarov, Clements, and Jalles 2024). This framework removes the component of public investment associated with transitory macroeconomic dynamics (the business cycle) and focuses only on episodes of large discretionary public investment. This approach is easy to replicate and can be applied to a broad sample of countries. It enables an analysis of heterogeneity across countries and the effects of public investment conditional on country characteristics and macroeconomic conditions.
• Estimation of public investment multipliers. The responses of output to identified public investment shocks are estimated using the local projections method (Jordà 2005). The results are reported in the form of impulse response functions showing the effects on real GDP (cumulative change in percent relative to the year preceding the public investment shock) of public investment shocks equivalent to 1 percent of GDP. These effects are shown over a five-year horizon following a shock. A similar approach is used to estimate the impact of public investment on potential output, productivity, and other macroeconomic variables. Annex 3A provides further details on the estimation methodology and robustness checks.
Impact of public investment on growth
The baseline results show that public investment shocks lead to positive output responses that remain highly statistically significant over a horizon of five years (figure 3.3.A). An increase in public investment equivalent to 1 percent of GDP is associated with a gradual increase in output, from 0.4 percent after one year to a cumulative 1.1 percent after five years.9 The output effects of public investment tend to be smaller in the short
9 The responses are cumulative changes, in percent, relative to the year before the public investment shock. The results are confirmed using robustness checks (annex 3A provides details).
run but increase over the long term as supply-side effects on productivity and productive capacity fully manifest themselves, consistent with the literature (Leduc and Wilson 2012; Ramey 2021). In the short run, offsetting fiscal effects, leakage through imports, possible transitory crowding out of private investment, private sector capacity constraints, and the time needed to adjust consumption and production may dampen the effects of public investment.10 The estimated effects are broadly in line with public investment multipliers reported in existing empirical studies on EMDEs.11
The analysis suggests that potential output also increases steadily in response to public investment. In a sample of EMDEs with available data, a 1 percent of GDP rise in public investment leads to an increase in potential output peaking at about 1.1 percent over five years (figure 3.3.B).12 This effect is associated with a concurrent boost in productivity—by up to 0.8 percent for total factor productivity and 1.9 percent for labor productivity over the medium term (figure 3.3.C). The impact of public investment surges on output does not lead to a corresponding increase in inflation. These findings support the hypothesis that public investment can increase output through both shortterm aggregate demand and longer-run aggregate supply channels, thereby boosting potential output (Ramey 2021).
Impact of public investment on private investment
An important effect of public investment occurs via the crowding-in effect on private investment. An increase in public investment equivalent to 1 percent of GDP induces an increase in private investment by up to 2.2 percent at the horizon of five years (figure 3.3.D). The estimates also suggest a possible crowding-out effect on impact; however, the effect is small, not statistically significant from zero, and is reversed within a year.
The crowding-in effect on private investment is in line with the estimates reported in the literature (Eden and Kraay 2014; Furceri and Li 2017). In this regard, the results provide empirical support for policies to mitigate private investment slowdown through a scaling up of public investment. This effect could operate through several transmission channels. An increase in public capital can raise the return on private capital by facilitating connectivity (for instance, roads and bridges), thereby facilitating private sector investment (Aschauer 1989a; Eden and Kraay 2014). Public investment reduces uncertainty and risks associated with private investment in large infrastructure projects and may also directly crowd in private investment via public-private partnerships (IMF 2021b).
10 Similar results are reported, for instance, in Abiad, Furceri, and Topalova (2016); Furceri and Li (2017); and Ilzetzki, Mendoza, and Végh (2013).
11 Public investment multiplier estimates reported in the literature vary widely for EMDEs and tend to be larger in advanced economies than in EMDEs. Gechert and Rannenberg (2018) and Vagliasindi and Gorgulu (2021) in a meta-analysis show an average value of public investment multiplier across studies of about 1.5—slightly larger than the value estimated in the chapter for EMDEs. Public investment multipliers are larger than public consumption multipliers; the latter are not statistically significant from zero.
12 The sample size for the exercises with potential output and productivity is smaller because of data availability and is not directly comparable to the baseline results, which use the full EMDE sample.
FIGURE 3.3 Macroeconomic effects of public investment in EMDEs
An increase in public investment equivalent to 1 percent of GDP in EMDEs is associated with a gradual increase in output, reaching a cumulative 1.1 percent after five years. Potential output also increases by 1.1 percent over this horizon. This effect is associated with a boost in productivity— especially labor productivity, which increases by 1.9 percent over five years. An increase in public investment by 1 percent of GDP leads to an increase in private investment by up to 2.2 percent over the horizon of five years, on average. Public investment multipliers tend to be larger in recessions.
A. Effect of a 1 percent of GDP increase in public investment on output
B. Effect of a 1 percent of GDP increase in public investment on potential output
C. Medium-term effect of a 1 percent of GDP increase in public investment on productivity and inflation
D. Effect of a 1 percent of GDP increase in public investment on private investment
E. Effect of a 1 percent of GDP increase in public investment on output during recessions
F. Effect of a 1 percent of GDP increase in public investment on output during expansions
Source: World Bank.
Note: Panels show cumulative response to a shock in year t relative to year t = -1; t = 0 is the year of the shock. Shaded areas indicate 90 percent confidence bands, based on standard errors clustered at the country level. Sample includes up to 129 EMDEs. EMDEs = emerging market and developing economies; TFP = total factor productivity. C. Bars indicate point estimates, whiskers indicate 90 percent confidence intervals. E.F. Recessions and
The role of the business cycle
Public investment multipliers, on average, are greater in magnitude during recessions than during expansions. A 1 percent of GDP increase in public investment yields an increase in output by 1.1 percent after five years in expansions. An equivalent public investment shock in recessions leads to an increase in output by up to 1.6 percent over the same period. However, the estimates during recessions are characterized by notable heterogeneity across countries, resulting in wider confidence bands (figures 3.3.E and 3.3.F). These results are consistent with the empirical literature reporting larger government spending multipliers in recessions.13
The position of an economy in the business cycle may affect the size of the multiplier for several reasons. In expansions, public spending stimulus may be less effective because, if the economy is operating close to full capacity, an additional increase in public spending is less likely to crowd in private sector resources.14 In contrast, economic slack during recessions enables government investment to mobilize unused private sector capacity (Batini et al. 2014). Public spending during recessions may also help mitigate unemployment and improve market confidence, and is less likely to be accompanied by rising inflation and interest rates (Auerbach and Gorodnichenko 2012; Ghassibe and Zanetti 2022).
In practice, however, EMDEs often have limited fiscal resources for public investment projects during recessions and crises. In fact, public investment tends to contract during economic distress (chapter 1). “Shovel-ready” investment projects may help revive economic activity and crowd in private investment during downturns as long as they are well-planned and executed, and do not undermine fiscal sustainability; such projects and conditions, however, may not always be present.
Implications of fiscal space
EMDEs with large fiscal space, as measured by public-debt-to-GDP ratios, experience much stronger positive impacts of public investment: output increases by 1.6 percent five years after a public investment shock equivalent to 1 percent of GDP. Conversely, public investment in countries with high and rising debt (implying limited fiscal space) appears to be ineffective: the estimated public investment multipliers are lower and not statistically significant (figures 3.4.A and 3.4.B).15 Although changes in public-debt-to-
13 Larger public investment multipliers in recessions are reported in Auerbach and Gorodnichenko (2012, 2013); Caggiano et al. (2015); Furceri and Li (2017); Honda, Miyamoto, and Taniguchi (2020); and RieraCrichton, Vegh, and Vuletin (2015). Such estimates may also not be fully robust, with significant heterogeneity across countries (Ramey 2019).
14 That said, during expansions public investment also has a positive effect on output in EMDEs. This result is consistent with the view that EMDEs often have underutilized capacity because of infrastructure gaps, limited access to finance constraining the ability of the private sector to expand production capacity, and unused available labor resources, which can be engaged in expansions through public investment.
15 These results are in line with the literature, which argues that, in countries with high debt, public spending multipliers are insignificant or even negative (Huidrom et al. 2020; Ilzetzki, Mendoza, and Végh 2013).
GDP ratios only partly reflect fiscal space dynamics, these results nevertheless imply that the effect of public investment on output in countries with large fiscal space is up to 1 percentage point higher than in countries with limited fiscal space, on average.16
Fiscal space influences the output effects of public investment through two channels. The first is associated with the effects on the private sector, as additional public spending in countries with weak fiscal positions may lower the disposable income of liquidityconstrained households and increase tax burdens for the private sector in the future (which may also be anticipated). The second channel relates to the interest rate effect, as scaling up government expenditures in countries with high levels of debt may lead to higher international interest rate spreads, on account of higher sovereign risk and inflation, thereby increasing borrowing costs for the private sector (Blanchard 1990; Huidrom et al. 2020; Sutherland 1997).
Infrastructure investment projects, given their large up-front costs and long time horizons, are often financed by borrowing rather than from current government revenues. Larger fiscal space implies that the sovereign has greater capacity to service its borrowing and is therefore more creditworthy, allowing it to finance such investment at a lower interest rate.
Public investment efficiency
The efficiency of public investment plays a crucial role in driving its growth effects. The estimates suggest a greater effect on GDP in response to public investment shocks in EMDEs with the highest efficiency, culminating in an increase in output of about 1.6 percent after five years—half a percentage point higher than the effect of public investment in EMDEs with the lowest efficiency (figures 3.4.C and 3.4.D).17 In countries with the lowest efficiency, the effects of public investment are smaller and not statistically significant (albeit still positive).
These results are consistent with empirical studies using other samples and methods, and provide support for the argument that low public investment efficiency is problematic.18 Poor design, evaluation, and implementation of investment projects, including
16 The high-debt and low-debt states are defined using a smooth transition function that reflects the historical dynamics of public debt to GDP on a country-by-country basis. For the median EMDE, a low-debt state over the sample period corresponds to about 30 percent of GDP and a high-debt state corresponds to about 80 percent of GDP for the sample of EMDEs that experienced a public investment shock.
17 The analysis uses the IMF (2021b) public infrastructure efficiency index—a cross-sectional index available for 120 countries (including 93 EMDEs), produced using data envelopment analysis. The index ranges from 0 to 100, with higher values indicating better efficiency (the distribution is shown in figure 3.7.A). The model was also estimated using the Devadas and Pennings (2018) infrastructure efficiency index and the Dabla-Norris et al. (2012) public investment management efficiency index, available for 69 EMDEs in the sample. Estimations using alternative measures also suggest statistically insignificant and smaller output effects of public investment in economies with low efficiency (table 3A.3 in annex 3A).
18 For example, refer to Cavallo and Daude (2011), Furceri and Li (2017), IMF (2014), Izquierdo et al. (2019), Leduc and Wilson (2012), and Leeper et al. (2010).
FIGURE 3.4 Effects of public investment on output in EMDEs conditional on country characteristics
EMDEs with larger fiscal space and higher investment efficiency experience stronger positive impacts of public investment. In these countries, output increases by up to 1.6 percent over five years following an increase of public investment equivalent to 1 percent of GDP. Conversely, the effects are lower and not statistically significant in countries with limited fiscal space and low investment efficiency. Public investment multipliers in capital-scarce economies tend to be larger.
A. Effect of a 1 percent of GDP increase in public investment on output in EMDEs with large fiscal space
Baseline Percent
-1012345
C. Effect of a 1 percent of GDP increase in public investment on output in EMDEs with high investment efficiency
B. Effect of a 1 percent of GDP increase in public investment on output in EMDEs with limited fiscal space
Baseline Percent Year
-1012345
D. Effect of a 1 percent of GDP increase in public investment on output in EMDEs with low investment efficiency
E. Effect of a 1 percent of GDP increase in public investment on output in EMDEs with small public capital stock
F. Effect of a 1 percent of GDP increase in public investment on output in EMDEs with large public capital stock
Source: World Bank.
Note: Panels show cumulative response to a shock in year t relative to year t = -1, in percent; t = 0 is the year of the shock. Shaded areas indicate 90 percent confidence bands, based on standard errors clustered at the country level. Dashed lines indicate the baseline unconditional responses. Sample includes up to 129 EMDEs. EMDEs = emerging market and developing economies.
A.B.E.F. Large fiscal space and small fiscal space responses are based on local projections with a smooth transition function that uses public-debt-to-GDP ratio as the conditioning variable to capture the lowest and highest debt-to-GDP ratios, respectively, for a given country in years with public investment shocks. Small public capital stock and large public capital stock responses are based on a smooth transition function that uses lowest and highest capital stock ratios for a given country in years with public investment shocks. C.D. High-efficiency and low-efficiency indicates the top and bottom quartiles of the IMF (2021b) public infrastructure efficiency index.
issues with corruption and governance, can deplete valuable fiscal resources without necessarily increasing the quantity or quality of public infrastructure that supports growth (Dabla-Norris et al. 2012; IMF 2014; Pritchett 2000). Therefore, well-designed public investment management processes are essential to ensure the effectiveness of public investment.
Implications of public capital stock scarcity
In line with the literature, the impact of public investment on output also varies with the initial level of public capital stock (figures 3.4.E and 3.4.F). The magnitude and statistical significance of public investment multiplier tend to decrease with the level of public capital stock relative to GDP, consistent with expectations of diminishing marginal returns to capital. Similar results are also found in empirical studies using other samples and methods (for instance, Izquierdo et al. 2019). Specifically, a 1 percent of GDP increase in public investment is associated with a 1.7 percent increase in GDP after five years in capital-scarce countries. This effect contrasts with 0.9 percent (not statistically significant in the medium term) when the public-capital-stock-to-GDP ratio is high.
Output effects of public investment by EMDE groups
In higher-income EMDEs, positive public investment shocks lead to strong and persistent impacts on output. In LICs, however, the effects on output are characterized by a wide dispersion, which translates into much lower statistical significance of public investment multipliers. This effect may be the result of lower efficiency of public investment in these countries and a small sample size. That said, the average effect tends to be larger in LICs than in higher-income EMDEs, reaching up to 1.7 percent over the horizon of five years after a public investment shock equivalent to 1 percent of GDP (figures 3.5.A and 3.5.B). Public investment effects are slightly smaller in commodityexporting EMDEs than in other EMDEs (figures 3.5.C and 3.5.D).
Policies to boost public investment and its macroeconomic benefits
The need for additional public investment has grown in the last two decades, accentuated by objectives to deliver the key development goals, address climate change, and recover from multiple shocks. Public investment has the potential to mobilize private investment and to spur economic growth. However, the analysis suggests that its beneficial effects are muted when fiscal space is constrained and when government spending is inefficient. This result has important policy implications for EMDEs, many of which suffer from elevated debt levels, deep structural challenges, and weak institutions. Furthermore, many EMDEs, especially LICs, have limited financial and technical capacity to advance needed reforms; significant and timely support from the international community will be necessary.
FIGURE 3.5 Effects of public investment on output, by EMDE group
In higher-income EMDEs, public investment shocks lead to strong and persistent impacts on output. In LICs, however, the effects on output are characterized by a wide dispersion, which translates into much lower statistical significance of public investment multipliers. That said, the average effect tends to be larger in LICs than in higher-income EMDEs, reaching 1.7 percent five years after a public investment shock. Public investment effects are slightly smaller in commodity-exporting EMDEs than in other EMDEs.
A. Effect of a 1 percent of GDP increase in public investment on output in EMDEs excluding LICs
B. Effect of a 1 percent of GDP increase in public investment on output in LICs
C. Effect of a 1 percent of GDP increase in public investment on output in commodity-importing EMDEs
D. Effect of a 1 percent of GDP increase in public investment on output in commodity-exporting EMDEs
Source: World Bank.
Note: Panels show cumulative responses of output, in percent, in year t relative to year t = -1; t = 0 is the year of the shock. Shaded areas indicate 90 percent confidence bands, based on standard errors clustered at the country level. Sample includes 129 EMDEs, of which 23 are LICs, 48 are commodity exporters, and 81 are commodity importers. EMDEs = emerging market and developing economies; LICs = low-income countries.
Although policies to promote public investment and boost its effectiveness should be tailored to individual country circumstances, three overarching priorities are relevant for all EMDEs—the package of “three Es”: expansion of fiscal space, efficiency of public investment, and enhanced global support.
Expansion of fiscal space
Fiscal space—the room in a government’s budget that allows it to engage in expenditures without jeopardizing the sustainability of its financial position or the stability of the economy—is a critical concept when considering public investment (Kose et al. 2022). Options to boost fiscal space are arguably more limited in EMDEs than in advanced
economies. On the revenue side, the tax collection and administration capacity in EMDEs is generally more constrained than in advanced economies. On the expenditure side, a high share of the budget allocated to interest payments on accumulated debt implies that fewer budget resources are available for social and economic needs, including investment in infrastructure. Policy interventions that can help expand fiscal space include domestic revenue mobilization, optimal allocation of public expenditure, and reforms to strengthen debt management and fiscal frameworks.
Domestic revenue mobilization
Many EMDEs suffer from weaknesses in mobilizing fiscal revenues, which are critical for securing fiscal space and delivering priority spending. Tax collection and administration capacity in EMDEs is generally more limited than in advanced economies. EMDEs, especially LICs, tend to lag advanced economies in the size of government tax revenues relative to GDP (figure 3.6.A). These issues also reflect, in part, the difficulty in establishing monitoring and compliance processes for broad direct income taxation (Besley and Persson 2014).
Options for greater revenue mobilization in the short term may be limited in EMDEs. Deep structural factors may influence tax collection capacity, including the resources available to tax, and the level of economic informality (Bird, Martinez-Vazquez, and Torgler 2008; Waseem 2018). Increasing tax rates as part of a comprehensive fiscal reform may not always be politically or administratively feasible in the near term. However, efforts to broaden the tax base without raising statutory rates can go a long way in closing loopholes and simplifying tax collection. Inefficient tax expenditures—tax breaks, deductions, credits, and other exemptions granted to certain favored sectors or groups of taxpayers—constitute a significant challenge in some EMDEs. Eliminating these expenditures, or at a minimum transparently including their cost in the budget, can lead to more effective use of limited fiscal resources. In the long term, higher revenue mobilization, together with reallocation of spending and increased borrowing, can feasibly close one-third of investment gaps in EMDEs (box 3.1).
Better tax administration can help tap underutilized sources of revenue (World Bank 2023b). Progress in tax administration could be aided, for example, by improving the management of the taxpayer registry, tax dispute resolution, transparency, and accountability functions. The simplicity of the tax structure itself can aid its administration. For example, a uniform sales tax on businesses may foster compliance and reduce opportunities to exploit loopholes. Trade taxes at the border, such as value added taxes, can take advantage of automated customs management systems for international trade and transportation operations (UNCTAD 2022).19
19 In particular, the UNCTAD Automated System for Customs Data (ASYCUDA), an integrated customs management system for international trade and transportation operations—that is increasingly adopted by countries globally—helps improve fiscal governance and the efficiency of revenue administration.
BOX 3.1 Estimating the effects of a public investment push
Emerging market and developing economies (EMDEs) need to scale up investment dramatically to meet key development goals. Governments play a crucial role in these efforts, particularly in infrastructure investments in energy, water and sanitation, and transportation. Yet limited fiscal space constrains the amount of public resources EMDEs can dedicate to development-related investment. This box assesses the feasible contribution that governments in EMDEs can make to closing development investment gaps, considering fiscal constraints. Simulations using a global macroeconomic model show that even ambitious efforts along three dimensions— domestic revenue mobilization, reallocation of funds from noninvestment spending, and deficit financing (borrowing)—can close only one-third of the aggregate investment gap in EMDEs.
Introduction
In many EMDEs, limited fiscal space constrains public spending needed for investment in infrastructure and other areas vital for development, even as these economies face large investment gaps. There are three main options for financing additional public investment: domestic revenue mobilization, reallocation of funds from noninvestment spending, and borrowing.
Strengthening domestic revenue collection is a crucial priority for EMDEs, given relatively low levels of tax effort (that is, the amount of tax they could potentially collect given economic and structural circumstances) compared to advanced economies. In the 2010s, before the COVID-19 pandemic, EMDEs made some progress in increasing underutilized tax instruments, resulting in an increase in the share of income taxes in overall revenue (Benitez et al. 2023).
Public investment can also be funded by carefully planned government spending restraint, which resolves inefficiencies in the public sector (Pessino, Izquierdo, and Vuletin 2018). Relative to the scale of the funding required to meet the development goals in EMDEs, identifying efficiencies of this magnitude is challenging, likely requiring reduction in noninvestment public spending to free resources for public investment. However, government spending in EMDEs is constrained by already low outlays in socially important and growth-enhancing categories such as health and education, which should be protected. In addition, government spending is dominated by the wage bill in many EMDEs; although reducing it could be feasible, doing so would require the implementation of significant structural reforms (Gupta, Verhoeven, and Tiongson 2004; Kousar et al. 2023).
Finally, public borrowing can fund public investment programs. Yet EMDEs must also navigate already elevated average debt levels and an elevated risk of debt
Note: This box was prepared by Nikita Perevalov and Takefumi Yamazaki.
BOX 3.1 Estimating the effects of a public investment push (continued)
distress. In recent years, a number of EMDEs have already breached their statutory maximum debt ratios (Davoodi et al. 2022).
Against this backdrop, the box addresses the following questions:
• How much fiscal space could EMDEs gain to finance crucial developmentrelated investment?
• Given additional fiscal resources, what share of investment gaps needed to reach the Sustainable Development Goals could be addressed by public investment?
Methodology and main results
Using macroeconomic model simulations, this box quantifies the feasible amount of public development-related investment spending in EMDEs that could be funded over the next 10 years from three sources: domestic revenue mobilization, reallocation of spending, and deficit borrowing. It also estimates the gross domestic product (GDP) implications of that additional investment spending. The estimations are produced using Oxford Economics’ Global Economic Model, a global semi-structural macroeconomic projection model that generates endogenous responses of inflation, monetary policy, and other macroeconomic variables (Oxford Economics 2023). e simulations presented in this box are developed by first calibrating country-specific amounts of additional financing for 97 EMDEs from each of the three sources described earlier. ese amounts are assumed to allow a commensurate increase in country-level public investment in EMDEs. e simulations start in 2025 and take into account country-specific fiscal constraints.
The simulations show that, in aggregate, EMDEs could finance one-third of their investment gap, or 2.3 percentage points of an estimated 6.8 percent of GDP investment gap. Out of this total, domestic revenue mobilization raises public investment by about 0.9 percentage point, reallocation of funds from noninvestment spending could account for a further 0.7 percentage point, and borrowing could add another 0.8 percentage point (figure B3.1.1.A).
Funding public investment: Domestic revenue mobilization
Simulations of the capacity for domestic revenue mobilization to fund public investment assume a gradual increase in income tax as the primary funding source, with the size of feasible revenue increases calibrated on the basis of the individual circumstances of each country. The scope of revenue increases is assumed to be limited in economies where revenues are already high relative to other EMDEs. Taking into account individual country constraints, increased
BOX 3.1 Estimating the effects of a public investment push (continued)
FIGURE B3.1.1 Development needs, public investment, and GDP impacts
EMDEs face large investment gaps. Using simulations that take into account countryspecific circumstances, EMDEs could feasibly fill about one-third of their investment gaps through a combination of domestic revenue mobilization, spending reallocation, and borrowing. The impact on GDP of such an increase in public investment over the medium and long term varies significantly depending on the funding source.
A. Development-related investment gaps and feasible additional public investment, by EMDE region
B. Impact on GDP from public investment spending, by spending source
Sources: Oxford Economics; Rozenberg and Fay (2019); World Bank.
Note: EAP = East Asia Pacific; ECA = Europe and Central Asia; EMDEs = emerging market and developing economies; LAC = Latin America and the Caribbean; MNA = Middle East and North Africa; SAR = South Asia; SSA = SubSaharan Africa.
A. Bars show 10-year simple averages of GDP-weighted annual EMDE and regional averages. Markers indicate investment gaps under the preferred scenario in Rozenberg and Fay (2019).
B. GDP-weighted aggregate of 97 EMDEs. The 1-year impact shows the impact during the first year of the simulation, beginning in 2025, and the 5-year and 10-year results show the impact after 5 and 10 years, respectively.
domestic revenue mobilization could increase investment funding by close to 1 percent of GDP, on average, over the next ten years (figure B3.1.1.A). At the regional level, EMDEs in Europe and Central Asia are likely to be able to raise the least additional revenues, of only 0.4 percent of GDP through domestic revenue mobilization; EMDEs in East Asia and Pacific, the Middle East and North Africa, South Asia, and Sub-Saharan Africa could raise about 1 percent of GDP.
An increase in public investment spending would induce changes in macroeconomic aggregates, such as GDP and inflation. However, the size of the fiscal multipliers depends crucially on whether public investment is a net addition to aggregate demand—as is the case when it is debt-financed—or offset by weaker public or private spending in areas other than investment. In the simulation, with public investment financed through gradually higher income tax revenues, which reduce disposable income and crowd out private consumption, the impact of higher investment spending on GDP is essentially zero in the first year. After 10
BOX 3.1 Estimating the effects of a public investment push (continued)
years, however, when the buildup of public capital begins to dominate, the impact of a 0.9 percent of GDP increase in domestic revenue mobilization rises to 0.5 percent of GDP (figure B3.1.1.B). Meanwhile, the median consumer price index in EMDEs declines by 0.1 percentage point after five years, reflecting crowding out of consumption. The diverging impacts on inflation and growth imply little effect on monetary policy rates.
In the long run, irrespective of the funding source, increased public investment would lead to higher public capital, expanded productive capacity, and higher output. However, these impacts hinge on the way public capital affects economywide supply and the extent to which public investment crowds in or out private capital and influences productivity. It is possible that efficiently investing in the right type of public capital and judiciously choosing financing sources could lead to crowding in of private investment, significantly increasing long-term impacts.
Funding public investment: Reallocation of government spending
To maximize funding for public investment, governments could reallocate some spending from noninvestment categories, provided sufficient room exists to reallocate inefficient spending while protecting critical expenditures on education and health care. In simulations of the capacity of government spending reallocation to fund public investment, it is assumed that, in EMDEs where government spending is low relative to peers, the scope for spending cuts is limited. The results show that spending reallocation could fund a public investment boost of about 0.7 percent of GDP, given country-specific constraints.
Investment spending of roughly 0.7 percentage point financed by corresponding cuts to noninvestment spending is estimated to have limited impact on GDP in the first year; however, as yearly government investment accumulates, GDP in EMDEs expands by 0.3 percent in five years, and 0.8 percent in 10 years. The consumer price index increases by about 0.2 percent in 10 years, as the impact of higher investment demand is offset by general spending cuts. In addition, the inflationary impact is moderated by higher productive capacity.
Funding public investment: Deficit financing
The final set of simulations considers the feasibility of deficit financing as the source of funds, taking into account country-specific circumstances including the presence of fiscal rules and historical patterns of borrowing. In aggregate, EMDEs could fund public investment equivalent to approximately 0.8 percent of GDP through increased borrowing, out of the overall investment gap of approximately 6.8 percent of GDP. In the short and medium term, the impact of borrowing on macroeconomic aggregates is more pronounced than for revenue mobilization or
BOX 3.1 Estimating the effects of a public investment push (continued)
spending reallocation, because there is no immediate offset through other components of aggregate demand, in contrast to tax increases or noninvestment spending cuts. During the 10-year period when debt-financed public investment occurs, aggregate GDP is approximately 0.6 percent higher, and the consumer price index is 0.4 percent higher by the end of 10 years. Although the inflationary impact in this simulation is higher compared to other sources of funds, inflationary pressures are partly mitigated by higher productive capacity.
Conclusion
Large investment gaps in EMDEs highlight the importance of fiscal space. Elevated debt, weak revenue collection, and constrained noninvestment spending are likely to reduce the amount of additional investment that governments can finance. This box shows that public investment can fill only one-third of investment gaps. However, even this progress in increasing public investment would require substantial, multipronged reforms targeting revenue collection, spending restraint and reallocation, and careful use of additional borrowing. This analysis provides additional empirical support to the literature showing that public capital is far from sufficient to address the vast investment gaps faced by EMDEs (Bhattacharya et al. 2022; Cull et al. 2024; World Bank 2023d). That said, these simulation results are illustrative, and more work is needed to have a better understating of the public sector’s ability to finance investment needs.
Implementation of new technologies to process tax payments and monitor tax compliance can aid revenue mobilization. For instance, wider adoption of mobile payment systems can help simplify tax payment processes in EMDEs, thereby increasing efficiency in tax revenue collection, particularly for direct taxes (Dom et al. 2022). The implementation of mobile money platforms has helped reduce property tax evasion in Tanzania and has been used to facilitate filing tax returns and increase nontax revenue collection in Kenya and the Philippines (Arewa and Davenport 2022).
Reallocation of public spending
Although debt-servicing payments and other nondiscretionary spending items reduce fiscal room for public investment, EMDEs generally also have some scope to increase public sector spending efficiency. For example, reducing distortive subsidies can achieve greater allocative efficiency of public spending. Governments often choose to subsidize certain domestic industries to bolster their competitiveness, for national security reasons or to promote development in specific regions.
FIGURE 3.6 Fiscal space in EMDEs
EMDEs, especially LICs, tend to lag advanced economies in government tax revenues relative to GDP. Government debt in EMDEs escalated significantly in 2020-23 to 65 percent of GDP—over 20 percentage points higher than the average over the previous two decades. EMDEs with higher interest payments tend to have lower public-investment-to-GDP ratios. Borrowing costs have risen sharply since 2020, as inflation and interest rates have increased globally.
Sources: International Monetary Fund; Kose et al. (2022); World Bank.
Note: EMDEs = emerging market and developing economies; LICs = low-income countries; RHS = right-hand side.
A. Aggregates are computed as weighted averages using nominal GDP in U.S. dollars as weights. Sample includes up to 41 advanced economies and 154 EMDEs.
B. Aggregates are computed as weighted averages using nominal GDP in U.S. dollars as weights. Sample includes up to 153 EMDEs, of which 23 are LICs.
C. Relationship between public investment and net interest payments, computed as differences between primary balances and fiscal balances (in percent of GDP). The correlation coefficient is -0.34, statistically significant at the 1-percent level, based on data for 130 EMDEs.
D. “Interest payment” refers to net interest payments, and “interest rate” refers to long-term interest rates. Sample includes up to 149 EMDEs for interest payments and 82 EMDEs for interest rates.
However, artificially propping up certain sectors through subsidies distorts market dynamics, diverts resources to less efficient firms and industries, creates unfair advantages, and discourages competition, which ultimately impedes structural adjustments within the economy (World Bank 2023c). Globally, though estimates vary, subsidies for fossil fuels, agriculture, and fisheries are large, amounting to US$1.25 trillion per year, or more than 1 percent of global GDP, according to a recent assessment (Damania et al. 2023). Such subsidies—popular in many EMDEs—can considerably reduce fiscal space, in addition to often being poorly targeted and distortionary. Such reforms can be implemented through gradual increases in regulated gasoline and diesel prices, liberaliz-
B. Government debt in EMDEs
A. Fiscal revenues
D. Interest payments and rates in EMDEs
C. Public investment and net interest payments in EMDEs in the 2010s
EMDEsEMDEs excl. ChinaLICs
ing fuel markets, reforming the excise tax on fuel, and introducing a carbon tax (Parry, Black, and Vernon 2021). Removing subsidies can be politically contentious. Nevertheless, some countries have been able to undertake fuel subsidy reforms. For example, Mexico was able to remove fuel subsidies and turn fuel taxes into a net fiscal revenue source (Arlinghaus and van Dender 2017).
Improvements in debt management and fiscal frameworks
Debt financing via bond issuance and loans from domestic and international lenders allows governments to mobilize more resources for large-scale infrastructure projects, while spreading the costs of investment over time. However, incurring more public debt may be difficult: many countries have come up against borrowing limits. Government debt in EMDEs escalated significantly over 2020-24 to 65 percent of GDP—more than 20 percentage points higher than the average over the previous two decades (figure 3.6.B).
In times of elevated interest rates, higher debt levels are associated with larger debtservicing costs, limiting budgetary resources for public investment. When these costs are high, the first reaction in liquidity-constrained EMDEs is often to cancel or postpone public investment projects. EMDEs with higher net interest payments tend to have lower public-investment-to-GDP ratios (figure 3.6.C). Borrowing costs have risen sharply since 2020, as inflation and interest rates increased globally, raising debtservicing obligations for many EMDEs (figure 3.6.D).
Credible, stable, and predictable fiscal frameworks can help increase fiscal space by generating the capacity for governments to take on more debt without undermining sustainability. Improved public debt management, the implementation of medium-term expenditure frameworks, the introduction of effective fiscal rules, and the establishment or strengthening of institutions for building fiscal buffers (such as stabilization funds) can all reinforce fiscal discipline.
Implementing best practices in debt management regarding liquidity, maturity, currency, and coupon payment arrangements can reinforce EMDEs’ capacity to borrow. Good public management makes government financing less vulnerable to short-term changes in market sentiment, exchange rate and interest rate fluctuations, and other shocks (Kose etal.2021).Accurate and transparent monitoring of government balance sheets and contingent liabilities is also important for effective debt management.
The adoption of multiyear planning frameworks helps strengthen the credibility and transparency of the budgetary process and establishes a formal connection between budgets and broad macroeconomic and fiscal policy objectives. This can help contain budgetary inertia, overspending, and near-term bias in budgeting, which is particularly important for the planning of public infrastructure projects that require medium-term financing commitments and large up-front costs.
Fiscal rules can help reduce the influence of political actors by setting transparent numerical limits. Successful implementation of effective fiscal rules allows governments
to establish credibility with their creditors, which can improve borrowing capacity and avoid the risks of sudden spending cuts during crises. Flexible fiscal rules that exclude public investment from the regulatory constraints on fiscal aggregates may help prevent abrupt investment cuts during fiscal adjustment periods (Guerguil, Mandon, and Tapsoba 2017; Rajaram et al. 2014; Schwartz et al. 2020). However, there may be tradeoffs between flexibility and clarity. Fiscal rules have been implemented successfully in many EMDEs; examples include Chile and Indonesia. Well-designed fiscal rules and stabilization funds with strong institutional frameworks are especially important for commodity exporters, because they help mitigate the volatility and procyclicality that can result from exposure to commodity price volatility (Gill et al. 2014; World Bank 2024a). Some EMDEs have been able to significantly expand fiscal space in recent years amid an environment of low global growth. For example, Jamaica successfully reduced its debt burden by introducing transparent fiscal rules and implementing its mediumterm fiscal framework (Arslanalp, Eichengreen, and Blair Henry 2024).
Improvements in public investment efficiency
Public investment efficiency is critical for realizing the macroeconomic benefits of public investment. In technical terms, public investment efficiency is defined as the ratio between the actual increment of public capital and the amount spent (Pritchett 2000). The extent to which each dollar spent on public investment translates into a dollar of productive public capital depends on many factors, including the quality of institutions, the effectiveness of fiscal planning and execution, the quality of project evaluation, and the speed of implementation of public investment projects (Dabla-Norris et al. 2012; Schwartz et al. 2020). In the worst case, low-quality public investment processes may result in “white elephant” infrastructure projects that are very costly to build and maintain, but bring only limited economic returns.
EMDEs, especially LICs, generally lag advanced economies in terms of public investment efficiency (figures 3.7.A and 3.7.B). Institutional weaknesses such as government corruption, regulatory bottlenecks, and inefficient procurement systems are closely linked to low efficiency of public investment (Rajaram et al. 2014). Over recent decades, EMDEs have, on average, made little progress in improving the quality of institutions that are critical for overall public investment efficiency, including control of corruption and regulatory quality (figures 3.7.C and 3.7.D). According to some estimates, in EMDEs, over a third of public investment may be lost because of inefficiency (Schwartz et al. 2020).
Public investment management is critical for the successful implementation of large-scale public investment projects with long development cycles and high risks, such as sustainable infrastructure projects. Robust risk management processes, along with transparent and well-monitored procurement frameworks, are particularly important for crowding in private investment for infrastructure projects (Davoodi and Tanzi 1998; Kim, Fallov, and Groom 2020). Besides structural reforms to enhance the quality of institutions, effective public investment management frameworks are also important to improve
FIGURE 3.7 Public investment efficiency
EMDEs, especially LICs, generally lag advanced economies in terms of public investment efficiency. Over recent decades, EMDEs have, on average, made little progress in improving the quality of institutions that are critical for overall public investment efficiency, including control of corruption and the strength of regulatory quality.
C. Control of corruption
Law and order
Sources: Dabla-Norris et al. (2012); IMF (2021b); PRS Group, International Country Risk Guide; World Bank.
Note: EMDEs = emerging market and developing economies; LICs = low-income countries.
A. Bars show group medians of the IMF (2021b) public infrastructure efficiency index. The index is based on data envelopment analysis (refer to table 3A.2 in annex 3A). Sample includes 27 advanced economies and 93 EMDEs, of which 15 are LICs.
B. Group medians of the Dabla-Norris et al. (2012) public investment management index. Sample includes 69 EMDEs, of which 16 are LICs.
C.D. Bars show group medians of institutional quality index values. The indexes are International Country Risk Guide's Control of Corruption and Law and Order. Sample includes 29 advanced economies and 93 EMDEs, of which 17 are LICs.
public investment efficiency, including at the project level.20 Moreover, a lack of human resources to design and manage projects often results in slow budget execution rates, which are intrinsically related to low efficiency.
Public investment efficiency also has direct implications for fiscal space. In particular, scaling up public investment when public investment efficiency is low may increase sovereign risk and undermine debt sustainability in the medium term (Adarov and Panizza 2024; box 3.2). Conversely, when public investment efficiency is high, increas-
20 Public investment management frameworks developed by the IMF and the World Bank provide a taxonomy of essential policy elements for an effective public investment management process (IMF 2018; Kim, Fallov, and Groom 2020; Rajaram et al. 2014).
B. Public investment management index
A. Public infrastructure efficiency
ing public investment can lower sovereign risk and does not lead to debt sustainability issues, implying that public investment can “fund itself.”
Public investment project management frameworks
Improvements in public investment project management frameworks can enhance the efficiency of public investment and avoid cost overruns, which are common in large projects. For instance, in a study of 258 transportation projects, Flyvbjerg, Skamris Holm, and Buhl (2004) showed that costs were initially underestimated in 9 out of 10 cases.
International organizations have developed a range of frameworks to strengthen public investment management. For instance, the World Bank’s public investment management framework helps countries assess the strengths and weaknesses of their public investment practices through eight features: guidance, appraisal, independent review, selection, implementation, adjustment, operation, and evaluation (Rajaram et al. 2014). Similarly, the IMF’s Public Investment Management Assessment framework allows for a diagnostic assessment of the efficiency of government procedures to provide infrastructure assets and to identify shortcomings and reform priorities (IMF 2018). This framework also sets out a detailed list of key practices comprising planning, allocation, and implementation of projects, along with cross-cutting enabling factors.
Effective public investment planning requires consolidated public investment programs aligned with long-run strategic economic priorities. A transparent, open, and wellmonitored procurement process can help control costs. Effective implementation of public investment projects requires full and timely financing, monitoring, and operational management processes. Risk management systems are also important and should include contingency planning for economic, design, technological, environmental, and other risk factors (Kim, Fallov, and Groom 2020). Digital innovations can improve spending efficiency, transparency, accountability, and public finance management more broadly (Amaglobeli et al. 2023; Gupta et al. 2017). The benefits of digitization in public investment management are already evident in many EMDEs. For example, in Honduras and Thailand, the use of digital technology has improved transparency and accountability in public infrastructure investments (World Bank 2020).
Proper maintenance, and careful monitoring and evaluation are essential to improve the efficiency of public investment projects. Governments should include sufficient funds in medium-term budgets to ensure that public assets are appropriately operated and maintained. Doing so lengthens the life of these assets and improves the quality of the services provided. Transparent systematic monitoring of projects and evaluation of project implementation can improve the assessment of the benefits and costs of public investment. For example, they can help identify social and economic benefits derived from the project and the reasons for cost overruns, which is particularly important for countries with less experience implementing large-scale investment projects, and when the projects are financed through external borrowing (World Bank 2021).
Public-private partnerships
Public-private partnerships (PPPs) can be important in enabling governments to gain greater efficiency by leveraging private sector resources. Besides directly crowding in private capital, PPPs can also help governments share project risks and delegate project operations to the private sector, which may be more efficient from a commercial standpoint. For example, private sector investment in infrastructure, or private participation in infrastructure (PPI), may lead to better spending efficiency if innovations at the design and construction stages reduce maintenance and operation costs. Moreover, charging fees for use of services can help depoliticize public service delivery and thus improve public perception. For example, paying tolls for the use of a road that is clearly well-maintained may be perceived as more transparent than paying the equivalent tax.
PPI increased throughout the 1990s and 2000s in EMDEs, with more than 300 projects ongoing every year and an annual investment value of almost 2 percent of GDP, on average. However, PPI declined significantly in the past decade. The number of PPI projects dropped by almost two-thirds. PPI engagement is especially low in LICs, with just a handful of projects operating across these countries in any given year (chapter 4).
Despite substantial efforts in many EMDEs to set up appropriate institutional structures to attract PPI, the evidence on the savings from PPI has been mixed (Fabre and Straub 2023). In some cases, the costs of PPP agreements exceed the benefits they produce, because they often come with either explicit or implicit guarantees, funded by the government. These guarantees can lead to future public liabilities, which can be especially problematic when they are not explicitly accounted for in the public budget (Herrera et al. 2023). Moreover, by letting private investors take on projects, the public sector can sometimes forgo the benefits associated with the stream of operational revenues (Engel, Fischer, and Galetovic 2013, 2014; Fabre and Straub 2023).
The complexity and long-term nature of projects involving the private sector often lead to demands for renegotiation, which can significantly raise costs over the life of the project. Governments are often less able to renegotiate favorable contracts, reflecting the limited choice of private sector partners in EMDEs willing and able to develop bankable projects. For example, a series of renegotiations of transportation PPIs in some EMDEs led to taxpayers essentially bailing out firms for a significant share of highway construction costs (Moore, Straub, and Dethier 2014).
Even if intentions and agreements on both sides align, getting the contract terms right to account for all risks can be daunting for the private sector partner. Infrastructure investments can involve sizeable sunk costs, making managing risk and uncertainty one of the most important factors in attracting private financing. Elevated global uncertainty over the last decade has undermined the appetite of the private sector to invest in infrastructure. Many types of risks could hamper the flow of investment financing and implementation, including project-specific risks and regulatory risks (Bonaglia et al. 2015). Whereas the private sector seeks a return on investment, governments find
themselves caught between cost recovery and affordability. Therefore, if the affordability of the service is a priority, governments would need to subsidize the gap to ensure it is attractive to private investors, which may imply trade-offs regarding coverage, making the project less advantageous from a development perspective (Fay, Martimort, and Straub 2019).
Nonetheless, private sector participation can come in different forms. With new technologies that create network externalities, many services that used to be traditionally funded or provided through public investment can now be provided by the private sector (such as information and communication technology, digital, finance, and sections of the energy supply chain). These are areas in which public intervention in the form of appropriately designed regulation can correct various market failures such as the ones mentioned earlier, with the risks and rewards borne by the private sector. In this way, public involvement can ensure that outcomes align with social welfare criteria, even when investment is undertaken by private entities.
More generally, policy interventions to promote macroeconomic stability, strengthen banking sector regulation and supervision, improve the legal and contractual environment to protect the rights of creditors and borrowers, and enhance project de-risking can all help bolster private sector participation in development. Besides PPPs, certain types of public infrastructure can be acquired by institutional investors, which could generate additional financing for governments and facilitate more efficient operation and maintenance.
Given that EMDEs often have relatively weak domestic private sectors, attracting foreign financing, particularly greenfield investment, can increase competition in domestic markets and raise efficiency (chapter 5). Besides providing private capital, foreign investors can help improve efficiency through technology spillovers and competitive business management practices, and can facilitate integration into global production networks. However, positive spillovers from foreign direct investment to the domestic economy tend to depend on the quality of the regulatory environment, skills endowment, and absorptive capacity (Farole and Winkler 2014). Domestic investor partners are also important because they contribute local know-how, so policy makers could encourage programs that link domestic firms with foreign firms.
Enhancement of global support
Many EMDEs, especially LICs, have deep structural challenges and limited fiscal space. Without external support, they may not be able to embark on significant public investment. Considering their large investment needs in an environment of sustained growth slowdowns and mounting challenges (including the need to address climate change and deliver the Sustainable Development Goals), EMDEs have an urgent need for enhanced support from the global community to accelerate structural policy interventions and improve their investment prospects (Chrimes et al. 2024; G20-IEG 2024).
The international community, including multilateral organizations, can play a critical steering role in facilitating globally coordinated policies to mobilize resources toward
BOX 3.2 Implications of public investment quality for sovereign risk and debt sustainability
Public investment quality is an important factor driving the macroeconomic effects of public investment. Public investment quality tends to be lower in low-income and commodity-exporting emerging market and developing economies (EMDEs). Scaling up public investment in countries with low investment quality can increase sovereign risk and undermine debt sustainability. By contrast, increasing public investment in countries with high investment quality can reduce sovereign risk and does not lead to debt sustainability issues.
Introduction
One dollar spent on public investment may not necessarily yield one dollar of productive public capital (Pritchett 2000). The “quality” of public investment is an important driver of the link between the accumulation of public capital and economic growth (Gupta et al. 2014). Public investment may lead to inefficient public infrastructure, and, at the extreme, to “white elephant” projects that do not have a positive effect on future growth. Moreover, low quality of public investment may distort private sector investment and increase fiscal stress. An increase in high-quality public investment can improve fiscal fundamentals (and thus reduce sovereign risk) even if it leads to a temporary increase in the government deficit and debt. By contrast, scaling up low-quality public investment can have a negative effect on sovereign risk and debt sustainability.
Ensuring public investment quality is particularly important for EMDEs, which face significant infrastructure gaps and constrained fiscal space. Corruption and weak governance leading to inefficient investment project management, political consideration in project appraisal, budget management and procurement challenges, and other related factors that add to project costs and result in delays are among the major known impediments for effective public investment (Rajaram et al. 2014).
This box introduces a new index of public investment quality and examines its implications for sovereign risk and debt sustainability in EMDEs. In contrast to the existing literature, the index is based on impartial evaluations of a large number of investment projects conducted by experts in a consistent appraisal framework, and it can be easily replicated and updated The index is estimated for 120 EMDEs over the period 2010-21. This coverage allows an analysis of the relationship between public investment quality and sovereign risk for a large sample of EMDEs and heterogeneity across countries; by contrast, the limited literature to date has focused on advanced economies (Afonso, Jalles, and Venancio 2022).
Note: This box was prepared by Amat Adarov and Ugo Panizza, based on Adarov and Panizza (2024).
BOX 3.2 Implications of public investment quality for sovereign risk and debt sustainability (continued)
This box presents several findings. First, public investment quality varies widely across EMDEs, with lower public investment quality in commodity-exporting and low-income countries (LICs). Second, scaling up public investment reduces sovereign risk in countries with high investment quality and amplifies sovereign risk in countries with low investment quality. Third, increasing public investment leads to higher debt ratios in low investment quality countries and to lower debt ratios in high investment quality countries. These results corroborate the idea that public investment can “fund itself,” but only when it is efficient.
These findings are particularly important for EMDEs that face high sovereign spreads and intermittent access to the international capital market. The results suggest that policies aimed at improving the public investment environment could be particularly beneficial for LICs and commodity-exporting EMDEs, which tend to lag in terms of public investment quality.
Public investment quality index and its properties
The public investment quality (PIQ) index is estimated using publicly available data on investment project evaluations by the World Bank’s Independent Evaluation Group, compiled in the Project Performance Ratings Database. The index is constructed based on these project outcome ratings, controlling for project-specific and sector-specific factors, as well as the effects of the business cycle, economic development level, and World Bank’s project monitoring efforts. Annex 3B and the background study, Adarov and Panizza (2024), provide further details on the data and the empirical framework used to construct the index and estimate the impact of public investment quality on sovereign risk and debt sustainability.
The estimated PIQ index spans 120 countries over the period 2010-21. The index shows that public investment quality varies considerably across EMDEs and is strongly correlated with the quality of institutions. In particular, LICs and commodity-exporting EMDEs tend to lag significantly behind other EMDEs in terms of public investment quality (figure B3.2.1.A).
Implications of public investment quality for sovereign risk
Estimation results show that higher levels of public investment are associated with lower sovereign risk in countries with high investment quality. Conversely, scaling up public investment in countries with low investment quality leads to higher sovereign risk. In particular, a 1-standard-deviation increase in public investment as a share of gross domestic product (GDP) is associated with a downgrade of about three notches in the sovereign risk rating for countries with the lowest value of the PIQ index, and with an upgrade by almost four notches for countries with
BOX 3.2 Implications of public investment quality for sovereign risk and debt sustainability (continued)
FIGURE B3.2.1 Public investment quality and its implications for sovereign risk and debt sustainability
Public investment tends to be lower in low-income and commodity-exporting EMDEs. Scaling up public investment in countries with low investment quality can increase sovereign risk and undermine debt sustainability. By contrast, increasing public investment in countries with high investment quality can reduce sovereign risk and does not lead to debt sustainability issues.
A. PIQ, by EMDE country group
EMDEs excl. LICs LICsCommodity exporters Commodity importers
C. Impact of public investment on public debt: high-PIQ sample
B. Predictive margins for sovereign rating
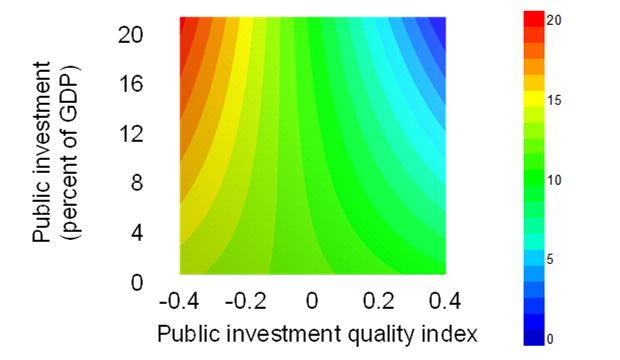
D. Impact of public investment on public debt: low-PIQ sample
Source: Adarov and Panizza (2024).
Note: EMDEs = emerging market and developing economies; LICs = low-income countries; PIQ = public investment quality index.
A. Simple averages. Sample includes 118 EMDEs: 24 LICs, 73 commodity exporters, and 45 commodity importers. Higher values indicate better public investment quality. PIQ index ranges from -0.6 to +0.5.
B. Predictive margins for sovereign rating at varying levels of PIQ and public investment as a share of GDP. The color scale shows model-predicted sovereign risk levels ranging from blue (1= lowest risk) to red (21 = highest risk).
C.D. Impulse-response functions from local projections estimates for high-PIQ and low-PIQ samples, showing cumulative responses to a public investment shock at t = 1 over a 10-year horizon. Impulse variable: change in public investment-to-GDP by 1 percentage point. Response variable: change in public debt as percent of GDP at horizons up to 10 years following the shock. The shaded area indicates 90-percent confidence bands.
the highest value of the PIQ index. A heatmap summarizes the relationship between predicted sovereign risk and all possible combinations of public investment and PIQ (figure B3.2.1.B). For countries with high public investment quality (for example, values of PIQ close to 0.4), sovereign risk decreases as public investment increases. By contrast, scaling up public investment in countries with low investment quality (for instance, those with
BOX 3.2 Implications of public investment quality for sovereign risk and debt sustainability (continued)
PIQ close to -0.4) leads to an increase in sovereign risk. At the extreme, scaling up public investment with very low public investment quality may lead to neardefault state as public investment levels reach 20 percent of GDP or more. For low levels of public investment and for PIQ levels around the sample mean, the sensitivity of sovereign risk to changes in either of these variables is minimal.
Implications for public debt sustainability
In countries with high investment quality, scaling up public investment does not lead to greater debt-to-GDP ratios in the medium run, which may suggest that in this case public investment tends to “fund itself” (figures B3.2.1.C and B3.2.1.D). This effect may arise from lower sovereign risk and borrowing costs, and from the positive impact on economic growth via both demand and supply channels, as the public spending multiplier is greater in countries with higher spending efficiency (Abiad, Furceri, and Topalova 2016; Adarov, Clements, and Jalles 2024; Furceri and Li 2017). By contrast, in countries with low investment quality, higher levels of public investment are associated with higher debt ratios, with the effect becoming more statistically significant over time, especially after seven years. Besides the adverse effects of low-quality public investment on borrowing costs described earlier, this result may reflect the continuously rising fiscal burden of maintaining less productive infrastructure that such investment is likely to yield.
Conclusion
The analysis suggests that LICs and commodity-exporting EMDEs tend to have much lower public investment quality in comparison with other EMDEs. Scaling up public investment leads to lower sovereign risk in countries with high investment quality and increases sovereign risk in countries with low investment quality. In countries with high investment quality, public investment can pay for itself: debt-to-GDP ratios do not increase over time. The opposite is true for countries with low investment quality, where scaling up public investment leads to an increase in public debt burden in subsequent years. The results have important policy implications for EMDEs, many of which face debt sustainability issues. The analysis shows that fiscal space can be enhanced by improving public investment quality through the implementation of good public investment management practices.
urgent public investment in EMDEs and ensure their effective use. Of particular importance is financial support to fund priority public investment projects that have the greatest potential to mobilize private investment, facilitate equitable access to critical public infrastructure, address climate change mitigation and adaptation needs, support the green transition, and boost long-run productivity through human capital development.
International organizations have also developed a range of frameworks to help strengthen public investment management. In addition to the World Bank’s public investment management framework (Rajaram et al. 2024) and the IMF’s Public Investment Management Assessment framework (IMF 2018), other initiatives have been developed: the IMF-World Bank Public-Private Partnership Fiscal Risk Assessment Model, which assesses the fiscal costs and risks of PPPs, and the framework for better infrastructure governance by the Organisation for Economic Co-operation and Development (OECD 2017). Policy advice and capacity development across the public investment management process could increase efficiency and improve borrowing capacity.
For countries with limited fiscal space and restrained access to financial markets, including highly vulnerable small states and countries facing fragility and conflict, official development assistance in the form of grants or concessional lending may be the only feasible source of continued funding. International organizations could help unlock financing for the riskier phase of greenfield investment projects (Arezki and Sy 2016). They can also provide essential expertise in project preparation to EMDEs, helping to address the often-cited problem of insufficient capacity to prepare a pipeline of bankable projects (Arezki et al. 2017).
Besides stepping up financial aid to countries in need, the international community should also actively push ahead with debt restructuring and relief processes to adapt to the changing sovereign debt landscape given the increasing number of creditors and the growing complexity of debt instruments (World Bank 2024a).
Conclusion
Significant investment is necessary for EMDEs to address structural challenges, including tackling climate change and making progress toward achieving the Sustainable Development Goals. Redoubled policy efforts are required to mobilize both public and private resources. Empirical analysis in this chapter suggests that raising public investment can help trigger a virtuous cycle of development via positive supply-side and demand-side effects: crowding in private investment, enhancing productivity, and boosting economic growth.
However, the effectiveness of public investment hinges on whether it is efficient and whether adequate fiscal space exists. If a government has room to spend without jeopardizing its fiscal sustainability, and public investment projects are selected and implemented well, EMDEs can raise output by up to 1.6 percent in the medium term for every 1 percent of GDP increase in public investment. The estimates in this chapter consider the
direct effect of public investment on output, private investment, and other macroeconomic variables. However, public investment can also provide other benefits that are difficult to quantify—for example, ensuring equitable access to essential public goods and services, as well as improving quality of life.
Proactive support from the global community could help jump-start virtuous development cycles in EMDEs, particularly those that are fiscally constrained and have weak public spending efficiency. High debt levels in EMDEs in the wake of the COVID-19 pandemic compound the challenges for these countries in advancing reforms and boosting productive investment, strengthening the case for timely and substantive support from the global community (World Bank 2022b).
Although reforms need to be tailored to specific country circumstances and aligned with their long-term development strategies, three overarching policy priorities are critical for EMDEs—the package of “three Es”: expansion of fiscal space, efficiency of public investment, and enhancement of global support.
Given limited capacity for revenue mobilization and reallocation of public resources toward public investment, policy makers in EMDEs need to undertake reforms to improve tax collection efficiency, strengthen fiscal frameworks, and prioritize public spending with an eye on productive public investment projects.
EMDEs should enhance the efficiency of public investment—maximize the quality and quantity of productive public capital that each dollar of public investment yields. Doing so requires reforms to tackle corruption and poor governance, and to improve public investment project management frameworks. Project selection should focus on advancing investments that have the greatest potential to mobilize private investment, spark productivity gains, and facilitate the green transition—in particular, health, education, digital networks, and renewable energy infrastructure projects.
Many EMDEs with limited fiscal space and deep structural issues, especially LICs, may not be able to finance large-scale public investment projects or implement the wide range of necessary reforms to improve the efficiency of public investment without additional help. With investment gaps particularly large in such countries, enhanced financial support and technical assistance from the global community are essential. The findings of this chapter underscore the importance of reforms to strengthen public investment management frameworks and improve institutions. Financial support may therefore be most effective if it helps improve the fiscal sustainability of the recipient country and the efficiency of its public investment.
Increasing investment in EMDEs is a crucial component of delivering strong, sustainable growth in these countries. Despite large investment gaps, however, investment growth has been weakening. Public investment has an important role to play, both in its own right and in catalyzing private sector investment. Creating the conditions for effective and efficient public investment should therefore be a priority for both domestic policy makers and the international community.
ANNEX 3A Estimation of public investment multipliers:
Empirical
framework
To gauge the extent to which public spending shocks—including public investment— affect economic growth, it is first necessary to identify changes in public spending that are independent of prevailing macroeconomic conditions.21 To date, the main methods used are structural vector autoregression (SVAR) estimations with recursive identification, frameworks relying on instrumental variables, the narrative approach, and identification based on forecast errors.
• SVAR with recursive identification of public spending shocks. This relatively common approach employs recursive identification schemes and other parameter restrictions to pin down unexpected public spending shocks. Specifically, the Cholesky decomposition exploits an assumption that government spending does not respond to macroeconomic shocks in the same period (Blanchard and Perotti 2002). A drawback of this framework is that it works best with high-frequency data, yet public spending data at more than annual frequency are often not available, especially for EMDEs.
• Official lending as an instrument for exogenous public spending. This approach, pioneered by Kraay (2012, 2014) uses data on official creditor loan disbursements to identify public spending shocks in the recipient country, based on the lag between loan approval and subsequent disbursements to isolate a component insulated from contemporaneous macroeconomic developments. However, this framework is applicable only to countries that are recipients of official development assistance, and it requires the calculation of “predicted” disbursements for each loan.
• Military spending as an instrument for exogenous public spending. Building on the “natural experiment” framework by Barro (1981), the narrative approach— developed in Ramey (2011a, 2011b), Ramey and Shapiro (1998), and Ramey and Zubairy (2018)—uses fluctuations in governments’ military expenditures, assumed to be driven by external geopolitical factors rather than domestic macroeconomic conditions—to isolate exogenous changes in public spending. This approach, however, is challenging to implement for EMDEs, where military spending is typically less prone to fluctuation. More broadly, a pitfall of this method is that the resulting growth responses may be largely attributable to the military spending subcomponent rather than to more general fiscal stimulus
• Forecast errors in public spending as a proxy for fiscal shocks. Auerbach and Gorodnichenko (2012, 2013) use differences between actual public spending and the level predicted by professional forecasters to identify unanticipated public spending
21 Failure to identify changes in public spending that are independent of prevailing macroeconomic conditions would obfuscate the “pure” effect of public spending on output, given the bidirectional relationship between economic activity and fiscal policy. For instance, a change in economic growth can affect government spending through fiscal policy responses or the operation of automatic stabilizers. The objective of public spending shock identification methods is therefore to isolate a component of government spending that is exogenous with respect to the economic conditions.
shocks.22 The methodology has the advantage of overcoming the issue of fiscal foresight, whereby anticipated fiscal policy changes may be incorporated into current economic decisions (Forni and Gambetti 2010; Leeper, Richter, and Walker 2012; Leeper, Walker, and Yang 2010, 2013). However, this approach relies on the availability of high-quality public spending forecasts. Additional drawbacks relate to the nature of fiscal projections: first, they may not be fully orthogonal to past macroeconomic trends; second, they rely on subjective, heterogeneous assumptions about future macroeconomic developments.
A new approach based on cyclically adjusted public investment
This chapter applies a new approach to identify public spending shocks (both public investment and public consumption shocks), as introduced in Adarov, Clements, and Jalles (2024). The methodology builds on Alesina and Ardagna (2010) and related studies, which assess the macroeconomic effects of changes in cyclically adjusted fiscal variables. Conceptually, the approach is consistent with the literature arguing that a large and visible scaling up of public investment tends to reflect exogenous decisions by public authorities (Deleidi, Iafrate, and Levrero 2020; Warner 2014). The identification framework for public investment shocks involves four steps, using data for 129 EMDEs spanning the period 1980-2019:
• For each country, output elasticities of public investment are estimated by regressing the logarithm of real public investment on the logarithm of real GDP.
• Measures of potential output (GDPpot) are obtained using a Hodrick-Prescott filter. Alternative filters, including the Baxter-King, Christiano-Fitzgerald, and the Hamilton (2018) filters, are used as a robustness check.
• Cyclically adjusted real public investment (CAPI) is then computed as follows:
(3A.1) where PI is real public investment and εPI is the output elasticity of public investment, as computed earlier.
• For each country i, measures of public investment shocks (PIS) are constructed as a variable that takes the value of one when a country’s first difference of CAPI exceeds its country-specific mean by 1 standard deviation:
(3A.2)
Focusing on country-level public investment adjustments greater than 1 standard deviation is in the spirit of Alesina and Ardagna (2010), who argue that focusing on large fiscal adjustments helps identify changes in fiscal variables that are induced by discretionary policy rather than influenced by the business cycle. Some examples of episodes
22 This approach has been used by Abiad, Furceri, and Topalova (2016); Furceri and Li (2017); Honda, Miyamoto, and Taniguchi (2020); and Miyamoto et al. (2020) to estimate public spending multipliers.
identified using this approach include the rapid scaling up of public investment in Poland in 2005-06 and 2018, in Brazil in 2007, and in Morocco in 2008. In Poland, the episode was associated with significant EU fund inflows and reforms as part of its EU integration (chapter 2; IMF 2023). In Brazil, the episode followed the launch of the Growth Acceleration Program—a major infrastructure program that included investment projects and policies to boost growth, launched in 2007. In Morocco, the episode involved major public investment in infrastructure projects launched in 2008 and subsequent years, such as the Green Morocco Plan to bolster the agricultural sector and the expansion of the Tanger Med port.
The cyclically adjusted approach to the identification of public investment shocks offers several advantages. Given its focus only on large episodes of public investment increases, the results are more robust to imperfections in measuring the effect of the business cycle on fiscal variables, because small changes in cyclically adjusted public spending are excluded from the estimation. The proposed framework eschews certain limitations of existing identification methods that rely on data that are not publicly available (for instance, methods based on government spending forecast errors) or yield estimates for a limited set of countries (for instance, frameworks relying on narrative shock identification or quarterly-frequency data). As such, identification of disaggregated public spending shocks—public investment and public consumption—can be undertaken for a broad sample of countries with available annual data. The large sample, in turn, facilitates the estimation of multipliers conditional on country characteristics.
In contrast to one-size-fits-all approaches, this framework accounts for heterogeneity across countries by considering the magnitude of public spending shocks within country-specific historical contexts. This is an important feature in the analysis of EMDEs, many of which exhibit fiscal procyclicality, such as that related to commodity production or prices, or public spending volatility driven by the budgetary process.23 The approach can be expanded to allow for time-varying or state-dependent thresholds.
A few caveats of the approach should be noted. First, issues related to endogeneity and fiscal foresight may persist, despite the focus on large cyclically adjusted public spending innovations to mitigate business cycle effects. Second, the methodology relies on the measure of potential output, which is generally estimated with a certain degree of imprecision. Third, the measure of a public investment shock is a binary variable and does not yield a direct estimate of a multiplier in regression. Rather, the output effects need to be interpreted in the context of the average change in public investment for the effective sample subject to the shock, with rescaling to obtain the public investment multiplier values.
Estimation framework for unconditional public investment multipliers
Responses of real GDP to public investment shocks are estimated using the local projections method proposed by Jordà (2005). The method lends itself to the analysis in this
23 Related discussions are provided in de Haan and Klomp (2013) and Wiese, Jong-A-Pin, and de Haan (2018).
chapter, given that fiscal shocks are already orthogonalized and do not need further identification, as would be required for vector autoregression (VAR) models. There are distinct advantages to this approach, which has been endorsed by Auerbach and Gorodnichenko (2012) and Romer and Romer (2010) as a flexible alternative to VAR models.24
First, it does not impose dynamic restrictions and obviates the need to estimate the equations for dependent variables other than the variable of interest, thereby economizing on the number of estimated parameters. Second, it is well suited to estimating nonlinear effects of public investment conditional on country-characteristics (statedependent multipliers). Third, it is relatively simple to deal with correlation in error terms—a likely complication in cross-country analysis. Against this background, the following baseline specification is estimated:25
where k = 0,...,5 is the forecast horizon in years; log (yi,t+k) - log (yi,t-1) represents the cumulative change in real GDP (in percentage terms) over the forecast horizon; αi and τt are country and time fixed effects that account for time-invariant country heterogeneity and global factors (such as the world business cycle or oil price movements); and Xi,t is a set of control variables, including—as in Abiad, Furceri, and Topalova (2016) and Furceri and Li (2017)—two lags of the shocks and two lags of real GDP growth. To control for outliers, data points above the 99th percentile and below the 1st percentile are dropped before estimating the model.
The coefficient βk denotes the response of output in each period k to a public investment shock at t, shocki,t. Specifically, it measures the average cumulative real GDP change in period t + k relative to period t - 1 (in percent), in response to the public investment shock for the effective sample—the sample of countries used in the estimation. To ease interpretation, the estimated coefficients are scaled by the average change in public investment as a percent of GDP for the effective sample that experienced the public investment shock, so that the impulse responses can be interpreted as the change in output (in percent) in response to a 1 percent of GDP increase in public investment.26 The model is estimated for the largest possible number of countries for robustness. For some exercises, however, the sample size is much smaller (for instance, for potential output, productivity estimations, subgroups of EMDEs); thus, the results are not directly comparable and should be interpreted with caution.
24 Plagborg-Møller and Wolf (2021) review the trade-offs between VARs and local projections.
25 The specification is based on the local projections model widely used in empirical literature on public spending multipliers—for instance, in Abiad, Furceri, and Topalova (2016); Furceri and Li (2017); Honda, Miyamoto, and Taniguchi (2020); and Miyamoto et al. (2020). A similar approach was also used in other empirical studies examining the impact of policy shocks (for instance, in de Haan and Wiese 2022).
26 It is a standard approach in the empirical literature on spending multipliers to use an ex post conversion using the average public-spending-to-GDP ratio. However, Ramey and Zubairy (2018) argue that this approach may introduce bias if the public-spending-to-GDP ratio varies significantly over the sample period.
Descriptive statistics summarizing average changes in output and public investment during public investment shock episodes are reported in table 3A.1. Impulse response functions are obtained by plotting the estimated multipliers for k = 0,...,5, with 90 percent confidence bands computed using robust standard errors clustered at the country level.
TABLE 3A.1 Summary statistics for public investment shocks
Source: World Bank.
Estimation framework for state-dependent public investment multipliers
To examine heterogeneity across country groups (for instance, categorized by income levels, commodity exporter status, or degree of public investment efficiency) and discrete macroeconomic states (negative and positive economic growth periods), the model is estimated separately for each subsample. State-dependent multipliers, conditional on the values of continuous time-varying variables, are estimated using a local projections framework with a smooth transition function:27
Note: Sample includes 129 emerging market and developing economies, using data for 1980-2019. , , , exp(z) (),0 1exp(z) it it it withFz γ γ γ => +−
(3A.4)
in which zi,t is the value of a conditioning variable, normalized to have zero mean and unit variance.28 The coefficients βk and βk capture the output impact of public invest-
28 The weights assigned to each regime vary between 0 and 1 according to the weighting function so that they can be interpreted as the probability of being in a given economic state. Following the literature that uses a similar approach (Abiad, Furceri, and Topalova 2016; Furceri and Li 2017), the parameter is set to 1.5, but the results do not change materially when other values are used. L H
27 The same approach was used to estimate state-dependent public spending multipliers in Abiad, Furceri, and Topalova 2016; Furceri and Li (2017); Honda, Miyamoto, and Taniguchi (2020); and Miyamoto et al. (2020).
TABLE 3A.2 Definitions of data used and sources
Variable Definition
Realpublic investment
Realprivate investment
RealGDP
PotentialGDP
Inflation
Laborproductivity
Totalfactor productivity
Publicdebt
Publicinfrastructure efficiencyindex
Publicinfrastructure efficiencyindex
Publicinvestment managementindex
Publiccapitalstock
Source: World Bank.
Generalgovernmentinvestment(grossfixedcapital formation)inbillionsofnationalcurrencydeflatedusing theGDPdeflator
Privateinvestment(grossfixedcapitalformation),in billionsofnationalcurrencydeflatedusingtheGDP deflator
Grossdomesticproduct,inbillionsofnationalcurrency deflatedusingtheGDPdeflator
Measureofrealpotentialoutputgrowthestimated usingtheproductionfunctionapproach
Growthrateofconsumerpriceindex,inpercent
RealGDPdividedbyaverageannualhoursworkedby personsengaged
Totalfactorproductivityinconstantnationalprices (2017=1)
Generalgovernmentdebt,percentofGDP
Indexconstructedusingdataenvelopmentanalysis usingthevolumeandqualityofinfrastructureasoutput variables,andpubliccapitalstockandpercapitaGDP asinputvariables
Indexconstructedasaweightedaverageofthequality ofelectricity,water,androadinfrastructure
Indexbasedoncountryperformancescoresinpublic investmentprojectappraisal,selection, implementation,andevaluation
Generalgovernmentcapitalstock,percentofGDP
Note: IMF = International Monetary Fund.
Source
InvestmentandCapital
StockDataset(IMF2021a)
InvestmentandCapital StockDataset(IMF2021a)
IMF,WorldEconomic Outlookdatabase
Potentialgrowthdatabase (KilicCeliketal.2023)
IMF,WorldEconomic Outlookdatabase
PennWorldTable10.01 (Feenstra,Inklaar,and Timmer2015)
PennWorldTable10.01 (Feenstra,Inklaar,and Timmer2015)
WorldBank,FiscalSpace Database(Koseetal.2022)
IMF(2021b)
DevadasandPennings (2018)
Dabla-Norrisetal.(2012)
InvestmentandCapital StockDataset(IMF2021a)
ment shocks over the horizon k for the state characterized by low values of a conditioning variable F (zi,t) ≈ 1 when z goes to minus infinity) and the state characterized by high values of a conditioning variable (1 F (zi,t) ≈ 1 when z goes to plus infinity).
This approach is equivalent to the smooth transition autoregressive model developed by Granger and Teräsvirta (1993). The advantages of this methodology are twofold. First, it permits a direct test of whether the effect of public investment varies across high and low levels of a given conditioning variable. Second, it allows the effect of public investment shocks to change smoothly across the levels of a conditioning variable by considering a continuum of states to estimate the impulse response functions, thus making the responses more stable and precise. To compute multipliers conditional on public capital scarcity and fiscal space, equation 3A.4 is estimated using the following conditioning variables for F(zit): (1) gross government debt as a share of GDP, as a proxy for fiscal
space; and (2) public capital stock as a share of GDP, to examine the implications of capital scarcity. Definitions of all variables are provided in table 3A.2.
Robustness exercises
Several robustness checks were carried out, including testing alternatives for public investment shock identification, sensitivity checks to the choice of statistical filters, and robustness checks to the sample period and model specification (selected results are reported in table 3A.3). All results corroborate the findings from the baseline model.
Given that the identification of public investment shocks may be sensitive to the choice of the statistical filters or the cut-off level used to isolate large changes in public investment, alternative threshold levels and filters were explored, including the Baxter-King, Christiano-Fitzgerald, and Hamilton filters. The results are not statistically different from the baseline. The focus on large changes only in cyclically adjusted public investment also mitigates imprecision in the estimation of potential output. Using higher threshold levels to identify public investment shocks comes at the cost of a smaller number of shock episodes, resulting in less precise estimates.
A possible bias from estimating the baseline model using country fixed effects stems from the fact that the error term may have a nonzero expected value because of the interaction between fixed effects and country-specific developments (Teulings and Zubanov 2014). Estimates excluding country fixed effects are similar to the baseline.
The baseline model was estimated with additional variables to control for inflation and trade openness. The results indicate no major differences relative to the baseline. As an additional check, the model was estimated after dropping the lagged dependent variable. Results are also robust when using the generalized method of moments estimator. As an alternative, the identified public investment shocks were also used as an instrument for changes in public investment as a share of GDP, in two-stage least squares estimation, yielding very similar results.
To examine whether the effects of public investment may have changed in the aftermath of the global financial crisis, the multipliers were also estimated for the pre-2007 period, with the findings confirming the baseline results. As a sensitivity check, the estimations were also carried out using the same common sample of countries across all empirical exercises; however, this exercise results in less reliable estimates because of a much smaller sample, with larger error bands.
TABLE 3A.3 Selected additional results and robustness checks
Additionalcontrolvariables:twolagsofinflationandtrade-to-GDPratio
Alternative fiscal space specification
Largeincreaseindebt-to-GDPratio(upperquartile=valuesabove3.7)
Largedecreaseindebt-to-GDPratio(lowerquartile=valuesbelow-3.2)
Alternative public investment efficiency measures
Lowefficiency:Dabla-Norrisetal.(2012)PIMIbelowthesamplemean
Highefficiency:Dabla-Norrisetal.(2012)PIMIabovethesamplemean
Lowefficiency:BottomquartileofDevadasandPennings(2018)Infrastructure Efficiencyindex
Highefficiency:TopquartileofDevadasandPennings(2018)Infrastructure Efficiencyindex
Lowefficiency:BottomquartileofCPIAPublicSectorManagementandInstitutions index 0.3 0.6
Highefficiency:TopquartileofCPIAPublicSectorManagementandInstitutions index
Source: World Bank.
Note: The table shows responses of real GDP (cumulative change in year t relative to year t = -1, in percent) to a public investment shock equivalent to 1 percent of GDP; t = 0 is the year of the shock. 2SLS = two-stage least squares; CPIA = Country Policy and Institutional Assessment (World Bank); GMM = generalized method of moments; IV = instrumental variables; PIMI = public investment management index. ***, **, and * indicate statistical significance at the 1, 5, and 10 percent levels, respectively.
ANNEX 3B Estimation of public investment quality effects: Empirical framework
This annex provides a brief review of the methodology for the estimation of the public investment quality (PIQ) index and its implications for sovereign risk and debt sustainability. Additional details are available in the background study, Adarov and Panizza (2024).
Estimation of the PIQ index
The PIQ index is estimated using publicly available data on investment project evaluations (projects in the Investment Project Financing category) from the Independent Evaluation Group World Bank Project Performance Ratings Database. The database reports the results of World Bank project assessments using a harmonized methodology ranging on a scale between 1 and 6 from “highly unsatisfactory” to “highly satisfactory.” The resulting data set includes 4,671 projects covering 146 countries over the period 2000-21. To remove variance attributed to factors that are project-specific, sectorspecific, related to business cycles and the level of economic development, or induced by the World Bank’s intervention, the following model is estimated:
(3B.1)
where PSi,s,c,t is the numeric project outcome score (ranging from 1 to 6) for project i in sector s , country c , and year t; Xi,s,c,t is a matrix of project-specific characteristics; yc,t is real per capita GDP; gc,t is real GDP growth in country c and year t; µs and τt are sector and year fixed effects; and εi,s,c,t is the error term. The matrix of project-specific characteristics includes project length, project volume, quality at entry, quality of supervision, and agreement type. Project length measures the actual duration of the project and ranges between 1 and 20 years, with an average value of 7.6 years. Project volume is a categorical variable measuring the total cost of each project.
Quality at entry is a numeric six-point indicator ranging from “1 = highly unsatisfactory” to “6 = highly satisfactory” reflecting the extent to which the World Bank staff identified the likelihood that the operation would achieve the planned development outcomes and was consistent with the World Bank’s fiduciary role. Quality of supervision is a six-point score that reflects the extent to which World Bank staff proactively identified and resolved threats to the achievement of development outcomes and to the Bank’s fiduciary role. Quality at entry and quality of supervision thus jointly convey the evaluated quality of project implementation and monitoring by the World Bank Group. Agreement type reflects the type of agreement associated with the project. The sector fixed effects control for 12 sectors defined using data from the World Bank’s Operations Portal and allocated according to the dominant sector of each operation.
The PIQ index is constructed as country averages of the residuals from the estimated equation 3B.1 (the background study, Adarov and Panizza 2024, refers to this index as PIQ-F; the study also estimates the time-varying version of the index PIQ-D).
Methodology to estimate the effects of public investment quality on sovereign risk and debt dynamics
To test the hypothesis that higher levels of public investment tend to increase sovereign risk in countries with low investment quality and reduce sovereign risk in countries with high investment quality, the following model is estimated:
where SRc,t is sovereign risk in country c and year t; PINVc,t is public investment over GDP in country c and year t; PIQc,t is the PIQ index for country c in year t; Xc,t-1 is a matrix of country-year control variables (all lagged to attenuate simultaneity); τt are year fixed effects, and ρc are either region or country fixed effects. Sovereign risk is measured using sovereign ratings. To this end, the ratings of three main agencies—Standard & Poor’s, Moody’s, and Fitch—are converted to a numerical scale from 1 to 21, with 1 corresponding to the highest rating and 21 to the lowest rating. A greater value of the index is thus associated with a worse rating. The data on public investment are from the IMF Investment and Capital Stock Dataset (IMF 2021a).
To test whether public investment quality affects the relationship between public investment and the public debt trajectory, the following local projections model is estimated:
where [Dc,t+k - Dc,t-1] is the difference in the public-debt-to-GDP ratio (in percentage points) between year t + k and year t - 1 (k = 0-10) for country c; DPINVc,t is the change in public investment as a percentage of GDP in country c and year t, Xc,t is a matrix of country-year control variables (real GDP growth, inflation, sovereign rating, the primary balance as a percentage of GDP, and the change in the ratio of general government final consumption to GDP); τt are year fixed effects, and ρc are country fixed effects.
Equation 3B.3 is estimated by splitting the full sample into high- and low-PIQ country groups using 1 standard deviation above the sample mean as a threshold (PIQ values greater than 0.2 and smaller than -0.2, respectively). This threshold is also consistent with the levels of PIQ beyond which nonlinear impacts on sovereign risk are amplified.
As a robustness check, the model was also estimated by instrumenting public investment in the local projections model with the shocks identified in an ancillary VAR model using the identification approach first suggested by Blanchard and Perotti (2002), as well as using growth forecast errors to mitigate anticipation effects. Additional robustness exercises and sensitivity checks are reported in the background study.
References
Abiad, A., D. Furceri, and P. Topalova. 2016. “The Macroeconomic Effects of Public Investment: Evidence from Advanced Economies.” Journal of Macroeconomics 50: 22440.
Adarov, A., B. Clements, and J. T. Jalles. 2024. “Revisiting Public Investment Multipliers: Nonlinear Effects of the Business Cycle, Fiscal Space, Efficiency, and Capital Stock.” Policy Research Working Paper 10954, World Bank, Washington, DC.
Adarov, A., and U. Panizza. 2024. “Public Investment Quality and Its Implications for Sovereign Risk and Debt Sustainability.” Policy Research Working Paper 10877, World Bank, Washington, DC.
Afonso, A., and J. Alves. 2023. “Does Government Spending Efficiency Improve Fiscal Sustainability?” European Journal of Political Economy, 102403.
Afonso, A., J. Jalles, and A. Venancio. 2022. “Do Financial Markets Reward Government Spending Efficiency?” Journal of International Financial Markets, Institutions and Money (77) 101505.
Alesina, A., and S. Ardagna, 2010. “Large Changes in Fiscal Policy: Taxes versus Spending.” In Tax Policy and the Economy, edited by J. Brown: University of Chicago Press.
Amaglobeli, D., R. A. de Mooij, A. Mengistu, M. Moszoro, M. Nose, S. Nunhuck, S. Pattanayak et al. 2023. “Transforming Public Finance through GovTech.” IMF Staff Discussion Note, SDN/ 2023/04, International Monetary Fund, Washington, DC.
Arewa, M., and S. Davenport. 2022. “The Tax and Technology Challenge.” In Innovations in Tax Compliance: Building Trust, Navigating Politics, and Tailoring Reform, edited by R. Dom, A. Custers, S. Davenport, and W. Prichard, 171-204. Washington, DC: World Bank.
Arezki, R., P. Bolton, S. Peters, F. Samama, and J. Stiglitz. 2017. “From Global Savings Glut to Financing Infrastructure.” Economic Policy 32 (90): 221-61.
Arezki, R., and A. Sy. 2016. “Financing Africa’s Infrastructure Deficit: From Development Banking to Long-Term Investing.” Journal of African Economies 25 (suppl_2): ii59-ii73.
Arlinghaus, J., and K. van Dender. 2017. “The Environmental Tax and Subsidy Reform in Mexico.” OECD Taxation Working Paper 31, OECD Publishing, Paris.
Arslanalp, A., B. Eichengreen, and P. Blair Henry. 2024. “Sustained Debt Reduction: The Jamaica Exception.” Paper presented to the Spring 2024 edition of the Brookings Papers on Economic Activity, Washington DC.
Aschauer, D. 1989a. “Does Public Capital Crowd Out Private Capital?” Journal of Monetary Economics 24 (2): 171-88.
Aschauer, D. 1989b. “Is Public Expenditure Productive?” Journal of Monetary Economics 23 (2): 177-200.
Asian Development Bank. 2017. Meeting Asia’s Infrastructure Needs. Manila: Asian Development Bank.
Auerbach, A. J., and Y. Gorodnichenko. 2012. “Measuring the Output Responses to Fiscal Policy.” American Economic Journal: Economic Policy 4 (2): 1-27.
Auerbach, A. J., and Y. Gorodnichenko. 2013. “Fiscal Multipliers in Recession and Expansion.” In Fiscal Policy after the Financial Crisis, edited by A. Alesina and F. Giavazzi, 63-102. Chicago: University of Chicago Press.
Barro, R. J. 1981. “Output Effects of Government Purchases.” Journal of Political Economy 89 (December): 1086-121.
Batini, N., L. Eyraud, A. Weber, and L. Forni. 2014. “Fiscal Multipliers: Size, Determinants, and Use in Macroeconomic Projections.” IMF Technical Notes and Manuals 2014/004, International Monetary Fund, Washington, DC.
Benitez, J. C., M. Mansour, M. Pecho, and C. Vellutini. 2023. “Building Tax Capacity in Developing Countries.” IMF Staff Discussion Note 2023/006, International Monetary Fund, Washington, DC.
Berg, A., R. A. Portillo, E. F. Buffie, C. A. Pattillo, and L. Zanna. 2012. “Public Investment, Growth, and Debt Sustainability: Putting Together the Pieces Together.” IMF Working Papers 2012/144, International Monetary Fund, Washington, DC.
Besley, T., and T. Persson. 2014. “Why Do Developing Countries Tax So Little?” Journal of Economic Perspectives 28 (4): 99-120.
Bhattacharya, A., M. Dooley, H. Kharas, C. Taylor, and N. Stern. 2022. Financing a Big Investment Push in Emerging Markets and Developing Economies for Sustainable, Resilient, and Inclusive Recovery and Growth. London: Grantham Research Institute on Climate Change and the Environment, London School of Economics and Political Science.
Bird, R. M., J. Martinez-Vazquez, and B. Torgler. 2008. “Tax Effort in Developing Countries and High Income Countries: The Impact of Corruption, Voice and Accountability.” Economic Analysis and Policy 38 (1): 55-71.
Blanchard, O. J., and R. Perotti. 2002. “An Empirical Characterization of the Dynamic Effects of Changes in Government Spending and Taxes on Output.” Quarterly Journal of Economics 117 (4): 1329-68.
Blanchard, O. J. 1990. “Comment: Can Severe Fiscal Contractions be Expansionary? Tales of Two Small European Countries.” NBER Macroeconomics Annual 1990 (5): 111-16.
Bom, P., and J. Ligthart. 2014. “Public Infrastructure Investment, Output Dynamics, and Balanced Budget Fiscal Rules.” Journal of Economic Dynamics and Control 40 (March): 334-54.
Bonaglia, F., R. Della Croce, M. Moseley, and F. R. Nunez. 2015. “Risk and Return Characteristics of Infrastructure Investment in Low-Income Countries.” Fourth Meeting of the G20 Development Working Group, September 14-16, 2015, Antalya, Türkiye.
Caggiano, G., E. Castelnuovo, V. Colombo, and G. Nodari. 2015. “Estimating Fiscal Multipliers: News from a Nonlinear World.” Economics Journal 125 (584): 746-76.
Canning, D., and P. Pedroni. 2008. “Infrastructure, Long-Run Economic Growth and Causality Tests for Cointegrated Panels.” The Manchester School 76 (5): 504-27.
Cavallo, E., and C. Daude. 2011. “Public Investment in Developing Countries: A Blessing or a Curse?” Journal of Comparative Economics 39 (1): 65-81.
Chakraborty, S., and E. Dabla-Norris. 2011. “The Quality of Public Investment.” B.E. Journal of Macroeconomics 11 (1): 1-29.
Chrimes, T., B. Gootjes, M. A. Kose, and C. Wheeler. 2024. The Great Reversal: Prospects, Risks, and Policies in International Development Association (IDA) Countries. Washington, DC: World Bank.
Commission on Growth and Development. 2008. The Growth Report: Strategies for Sustained Growth and Inclusive Development. Washington, DC: World Bank.
Cull, R., I. Gill, A. Pedraza, C. Ruiz-Ortega, and F. Zeni. 2024. “Mobilizing Private Capital for the Sustainable Development Goals.” Policy Research Working Paper 10838, World Bank, Washington, DC.
Dabla-Norris, E., J. Brumby, A. Kyobe, Z. Mills, and C. Papageorgiou. 2012. “Investing in Public Investment: An Index of Public Investment Efficiency.” Journal of Economic Growth 17 (March): 235-66.
Damania, R., E. Balseca, C. de Fontaubert, J. Gill, K. Kim, J. Rentschler, J. Russ, and E. Zaveri. 2023. Detox Development: Repurposing Environmentally Harmful Subsidies. World Bank, Washington, DC.
Davoodi, H., P. Elger, A. Fotiou, D. Garcia-Macia, A. Lagerborg, R. Lam, and S. Pillai. 2022. “Fiscal Rules Dataset: 1985-2021.” International Monetary Fund, Washington, DC.
Davoodi, H., and V. Tanzi. 1998. Roads to Nowhere: How Corruption in Public Investment Hurts Growth. Economic Issues Series, number 12. Washington, DC: International Monetary Fund.
De Haan, J., and J. Klomp. 2013. “Conditional Political Budget Cycles: A Review of Recent Evidence.” Public Choice 157: 387-410.
De Haan, J., and R. Wiese. 2022. “The Impact of Product and Labour Market Reform on Growth: Evidence for OECD Countries Based on Local Projections.” Journal of Applied Econometrics 37 (4): 746-70.
Deleidi, M., F. Iafrate, and E. S. Levrero. 2020. “Public Investment Fiscal Multipliers: An Empirical Assessment for European Countries.” Structural Change and Economic Dynamics 52: 354-65.
Devadas, S., and S. Pennings. 2018. “Assessing the Effect of Public Capital on Growth: An Extension of the World Bank Long-Term Growth Model.” Policy Research Working Paper 8604, World Bank, Washington, DC.
Dom, R., A. Custers, S. Davenport, and W. Prichard. 2022. Innovations in Tax Compliance: Building Trust, Navigating Politics, and Tailoring Reform. Washington, DC: World Bank.
Eden, M., and A. Kraay. 2014. “‘Crowding In’ and the Returns to Government Investment in Low-Income Countries.” Policy Research Working Paper 6781, World Bank, Washington, DC.
Engel, E., R. Fischer, and A. Galetovic. 2013. “The Basic Public Finance of PublicPrivate Partnerships.” Journal of the European Economic Association 11 (1): 83-111.
Engel, E., R. Fischer, and A. Galetovic. 2014. The Economics of Public-Private Partnerships: A Basic Guide. Cambridge University Press.
Erenburg, S. J., and M. E. Wohar. 1995. “Public and Private Investment: Are There Causal Linkages?” Journal of Macroeconomics 17 (1): 1-30.
Fabre, A., and S. Straub. 2023. “The Impact of Public Private Partnerships (PPPs) in Infrastructure, Health and Education.” Journal of Economic Literature 61 (2): 655-715.
Farole, T., and D. Winkler, eds. 2014. Making Foreign Direct Investment Work for SubSaharan Africa: Local Spillovers and Competitiveness in Global Value Chains. Directions in Development. Washington, DC: World Bank.
Fay, M., H. Lee, M. Mastruzzi, S. Han, and M. Cho. 2019. “Hitting the Trillion Mark—A Look at How Much Countries Are Spending on Infrastructure.” Policy Research Working Paper 8730, World Bank, Washington, DC.
Fay, M., D. Martimort, and S. Straub. 2019. “Funding and Financing Infrastructure: The Joint-Use of Public and Private Finance.” Journal of Development Economics 150 (May): 102629.
Feenstra, R. C., R. Inklaar, and M. P. Timmer. 2015. “The Next Generation of the Penn World Table.” American Economic Review 105 (10): 3150-82.
Foster, V., N. Gorgulu, D. Jain, S. Straub, and M. Vagliasindi. 2023. “The Impact of Infrastructure on Development Outcomes: A Meta-Analysis.” Policy Research Working Paper 10350, World Bank, Washington, DC.
Furceri, D., and B. Li. 2017. “The Macroeconomic (and Distributional) Effects of Public Investment in Developing Economies.” IMF Working Paper 17/217, Washington, DC.
Flyvbjerg, B., M. K. Skamris Holm, and S. L. Buhl. 2004. “What Causes Cost Overrun in Transport Infrastructure Projects?” Transport Reviews 24 (1): 3-18.
Forni, M., and L. Gambetti. 2010. “Fiscal Foresight and the Effects of Government Spending.” CEPR Discussion Paper 049, Centre for Economic Policy Research, London.
Foster, V., N. Gorgulu, D. Jain, S. Straub, and M. Vagliasindi. 2023. “The Impact of Infrastructure on Development Outcomes: A Meta-Analysis.” Policy Research Working Paper 10350, World Bank, Washington, DC.
Furceri, D., and B. Li. 2017. “The Macroeconomic (and Distributional) Effects of Public Investment in Developing Economies.” IMF Working Paper 17/217, International Monetary Fund, Washington, DC.
G20-IEG (Group of Twenty; Independent Expert Group). 2024. Implementing MDB Reforms: A Stocktake. Report of the Independent Expert Group.
Gechert, S., and A. Rannenberg. 2018. “Which Fiscal Multipliers Are RegimeDependent? A Meta-Regression Analysis.” Journal of Economic Surveys 32: 1160-82.
Ghassibe, M., and F. Zanetti. 2022. “State Dependence of Fiscal Multipliers: the Source of Fluctuations Matters.” Journal of Monetary Economics 132: 1-23.
Gill, I. S., I. Izvorski, W. van Eeghen, and D. De Rosa. 2014. Diversified Development: Making the Most of Natural Resources in Eurasia. Washington, DC: World Bank.
Granger, C. W. J., and T. Terasvirta. 1993. Modeling Nonlinear Economic Relationships New York: Oxford University Press.
Guerguil, M., P. Mandon, and R. Tapsoba. 2017. “Flexible Fiscal Rules and Countercyclical Fiscal Policy.” Journal of Macroeconomics 52 (June): 189-220.
Gupta, S., A. Kangur, C. Papageorgiou, and A. Wane. 2014. “Efficiency-Adjusted Public Capital and Growth.” World Development 57 (May): 164-78.
Gupta, S., M. Keen, A. Shah, and G. Verdier eds. 2017. Digital Revolutions in Public Finance. Washington, DC: International Monetary Fund.
Gupta, S., M. Verhoeven, and R. E. Tiongson. 2004. “The Effectiveness of Government Spending on Education and Health Care in Developing and Transition Economies.” In Helping Countries Develop: The Role of Fiscal Policy, edited by S. Gupta, B. Clements, and G. Inchauste. Washington, DC: International Monetary Fund.
Hamilton, J. D. 2018. “Why You Should Never Use the Hodrick-Prescott Filter.” Review of Economics and Statistics 100 (5): 831-43.
Herrera, M., V. Foster, A. Musacchio, T. Ter-Minassian, and B. Turkgulu. 2023. Off the Books: Understanding and Mitigating the Fiscal Risks of Infrastructure. Washington, DC: World Bank.
Honda, J., H. Miyamoto, and M. Taniguchi. 2020. “Exploring the Output Effect of Fiscal Policy Shocks in Low Income Countries.” IMF Working Papers 2020/012, International Monetary Fund, Washington, DC.
Huidrom, R., M. A. Kose, J. Lim, and F. Ohnsorge. 2020. “Why Do Fiscal Multipliers Depend on Fiscal Positions?” Journal of Monetary Economics 114 (1): 109-25.
Ilzetzki, E., E. G. Mendoza, and C. A. Végh. 2013 “How Big (Small?) Are Fiscal Multipliers?” Journal of Monetary Economics, 60 (2): 239-54.
IMF (International Monetary Fund). 2014. World Economic Outlook, October 2014: Legacies, Clouds, Uncertainties. Washington, DC: IMF.
IMF (International Monetary Fund). 2018. “Public Investment Management Assessment Review and Update.” May. Washington, DC: IMF.
IMF (International Monetary Fund). 2021a. “Investment and Capital Stock Dataset.” Macroeconomic and Financial Data, IMF, Washington, DC. https://data.imf.org/? sk=1ce8a55f-cfa7-4bc0-bce2-256ee65ac0e4.
IMF (International Monetary Fund). 2021b. Fiscal Monitor, April 2021: A Fair Shot Washington, DC: IMF.
IMF (International Monetary Fund). 2023. “Poland. Technical Assistance Report— Public Investment Management Assessment.” IMF Country Report No. 22/321. Washington, DC: IMF.
Izquierdo, A., R. E. Lama, J. Medina, J. P. Puig, D. Riera-Crichton, C. Vegh, and G. Vuletin. 2019. “Is the Public Investment Multiplier Higher in Developing Countries? An Empirical Investigation.” NBER Working Papers 26478, National Bureau of Economic Research, Cambridge, MA.
Jordà, O. 2005. “Estimation and Inference of Impulse Responses by Local Projections.” American Economic Review 95: 161-82.
Kilic Celik, S., M. A. Kose, F. Ohnsorge, and F. U. Ruch. 2023. “Potential Growth: A Global Database.” Policy Research Working Paper 10354, World Bank, Washington, DC.
Kim, J. H., J. A. Fallov, and S. Groom. 2020. Public Investment Management Reference Guide. Washington, DC: World Bank.
Kose, A. M., S. Kurlat, F. Ohnsorge, and N. Sugawara. 2022. “A Cross-Country Database of Fiscal Space.” Journal of International Money and Finance 128: 102682.
Kose, A. M., P. Nagle, F. Ohnsorge, and N. Sugawara. 2021. Global Waves of Debt: Causes and Consequences. Washington, DC: World Bank.
Kose, A. M., and F. Ohnsorge, eds. 2024. Falling Long-Term Growth Prospects: Trends, Expectations, and Policies. Washington, DC: World Bank.
Kousar, S., F. Ahmed, M. Afzal, and J. Segovia. 2023. “Is Government Spending in the Education and Health Sector Necessary for Human Capital Development?” Humanities and Social Sciences Communications 6 (62).
Kraay, A. 2012. “How Large Is the Government Spending Multiplier? Evidence from World Bank Lending.” Quarterly Journal of Economics 127 (2): 829-87.
Kraay, A. 2014. “Government Spending Multipliers in Developing Countries: Evidence from Lending by Official Creditors.” American Economic Journal: Macroeconomics 6 (4): 170-208.
Leduc, S., and D. Wilson. 2012. “Roads to Prosperity or Bridges to Nowhere? Theory and Evidence on the Impact of Public Infrastructure Investment.” NBER Working Papers 18042, National Bureau of Economic Research, Cambridge, MA.
Leeper, E. M., A. W. Richter, and T. Walker. 2012. “Quantitative Effects of Fiscal Foresight.” American Economic Journal: Economic Policy 4 (2): 115-44.
Leeper, E. M., T. Walker, and S. Yang. 2010. “Government Investment and Fiscal Stimulus.” Journal of Monetary Economics 57 (8): 1000-12.
Leeper, E. M., T. Walker, and S. Yang. 2013. “Fiscal Foresight and Information Flows.” Econometrica 81 (3): 1115-45.
Martinez, L., F. Roch, F. Roldán, and J. Zettelmeyer. 2023. “Sovereign Debt.” In Research Handbook of Financial Markets, edited by R. S. Gürkaynak and J. H. Wright. 378-405. Northampton, MA: Edward Elgar Publishing.
Mazzucato, M., and G. Semieniuk. 2017. “Public Financing of Innovation: New Questions.” Oxford Review of Economic Policy 33 (1): 24-48.
Miyamoto, H., A. Baum, N. Gueorguiev, J. Honda, and S. Walkeret al. 2020. “Growth Impact of Public Investment and the Role of Infrastructure Governance.” In Well Spent, edited by G. Schwartz, M. Fouad, T. S. Hansen, and G. Verdier, Chapter 2. Washington, DC: International Monetary Fund.
Moore A., S. Straub, and J. Dethier. 2014. “Regulation, Renegotiation and Capital Structure: Theory and Evidence from Latin American Transport Concessions.” Journal of Regulatory Economics 45 (2): 209-32.
OECD (Organisation for Economic Co-operation and Development). 2017. Getting Infrastructure Right: A Framework for Better Governance. Paris: OECD Publishing. Oxford Economics. 2023. “Global Economic Model.” July. Oxford Economics, Oxford, U.K.
Parry, I., S. Black, and N. Vernon. 2021. “Still Not Getting Energy Prices Right: A Global and Country Update of Fossil Fuel Subsidies.” IMF Working Paper No. 21/236, International Monetary Fund, Washington, DC.
Pessino, C., A. Izquierdo, and G. Vuletin. 2018. “Better Spending for Better Lives: How Latin America and the Caribbean Can Do More with Less.” Inter-American Development Bank, Washington, DC.
Plagborg-Møller, M., and C. K. Wolf. 2021. “Local Projections and VARs Estimate the Same Impulse Responses.” Econometrica 89: 955-80.
Pritchett, L. 2000. “The Tyranny of Concepts: CUDIE (Cumulated, Depreciated, Investment Effort) Is Not Capital.” Journal of Economic Growth 5 (4): 361-84.
Rajaram, A., K. Kaiser, T. M. Le, J. H. Kim, and J. Frank, eds. 2014. The Power of Public Investment Management: Transforming Resources into Assets for Growth. Washington, DC: World Bank.
Ramey, V. A. 2011a. “Can Government Purchases Stimulate the Economy?” Journal of Economic Literature 49 (3): 673-85.
Ramey, V. A. 2011b. “Identifying Government Spending Shocks: It’s All in the Timing.” Quarterly Journal of Economics 126 (1): 51-102.
Ramey, V. A. 2019. “Ten Years after the Financial Crisis: What Have We Learned from the Renaissance in Fiscal Research?” Journal of Economic Perspectives 33 (2): 89-114.
Ramey, V. A. 2021. “The Macroeconomic Consequences of Infrastructure Investment.” In Economic Analysis and Infrastructure Investment, edited by E. L. Glaeser and J. M. Poterba, 219-76, Chicago: University of Chicago Press.
Ramey, V. A., and M. D. Shapiro. 1998. “Costly Capital Reallocation and the Effects of Government Spending.” Carnegie-Rochester Conference Series on Public Policy 48 (1): 145-94.
Ramey, V. A., and S. Zubairy. 2018. “Government Spending Multipliers in Good Times and in Bad: Evidence from US Historical Data.” Journal of Political Economy 126 (2): 850-901.
Riera-Crichton, D., C. A. Vegh, and G. Vuletin. 2015. “Procyclical and Countercyclical Fiscal Multipliers: Evidence from OECD Countries.” Journal of International Money and Finance 52(C): 15-31.
Romer, C. D., and D. H. Romer. 2010. “The Macroeconomic Effects of Tax Changes: Estimates Based on a New Measure of Fiscal Shocks.” American Economic Review 100 (3): 763-801.
Romp, W. E., and J. de Haan. 2005. “Public Capital and Economic Growth: A Critical Survey.” EIB Papers 10 (1): 41-70.
Rozenberg, J., and M. Fay, eds. 2019. Beyond the Gap: How Countries Can Afford the Infrastructure They Need while Protecting the Planet. Washington, DC: World Bank.
Schwartz, G., M. Fouad, T. Hansen, and G. Verdier, eds. 2020. Well Spent: How Strong Infrastructure Governance Can End Waste in Public Investment. Washington, DC: International Monetary Fund.
Straub, S. 2011. “Infrastructure and Development: A Critical Appraisal of the Macrolevel Literature” Journal of Development Studies 47(5): 683-708.
Sutherland, A. 1997. “Fiscal Crises and Aggregate Demand: Can High Public Debt Reverse the Effects of Fiscal Policy?” Journal of Public Economics 65 (2): 147-62.
Teulings, C. N., and N. Zubanov. 2014. “Is Economic Recovery a Myth? Robust Estimation of Impulse Responses.” Journal of Applied Econometrics 29 (3): 497-514.
Turnovsky, S. 2015. “Economic Growth and Inequality: The Role of Public Investment.” Journal of Economic Dynamics and Control 61 (December): 204-21.
UNCTAD (United Nations Conference on Trade and Development). 2022. ASYCUDA Compendium 2022: Digital Connectivity. Geneva: UNCTAD.
Vagliasindi, M., and N. Gorgulu. 2021. “What Have We Learned about the Effectiveness of Infrastructure Investment as a Fiscal Stimulus? A Literature Review.” Policy Research Working Paper 9796, World Bank, Washington, DC.
Warner, A. 2014. “Public Investment as an Engine of Growth.” IMF Working Paper 14/148, International Monetary Fund, Washington, DC.
Waseem, M. 2018. “Taxes, Informality and Income Shifting: Evidence from a Recent Pakistani Tax Reform.” Journal of Public Economics 157 (January): 41-77.
WDI (database). World Development Indicators. World Bank. https:// databank.worldbank.org/source/world-development-indicators.
Wiese, R., R. Jong-A-Pin, and J. de Haan. 2018. “Can Successful Fiscal Adjustments Only Be Achieved by Spending Cuts?” European Journal of Political Economy 54 (C): 145-66.
World Bank. 2020. Enhancing Government Effectiveness and Transparency: The Fight against Corruption. Washington, DC: World Bank.
World Bank. 2021. “World Bank Support for Public Financial and Debt Management in IDA-Eligible Countries.” Independent Evaluation Group, World Bank, Washington, DC.
World Bank. 2022a. Climate and Development: An Agenda for Action—Emerging Insights from World Bank Group 2021-22 Country Climate and Development Reports. Washington, DC: World Bank.
World Bank. 2022b. Global Economic Prospects. January. Washington, DC: World Bank.
World Bank. 2023a. Global Economic Prospects. January. Washington, DC: World Bank.
World Bank. 2023b. World Bank Support for Domestic Revenue Mobilization: An Independent Evaluation. Independent Evaluation Group. Washington, DC: World Bank.
World Bank. 2023c. Unfair Advantage: Distortive Subsidies and Their Effects on Global Trade. Washington, DC: World Bank.
World Bank. 2023d. The Big Push for Transformation through Climate and Development–Recommendations of the High-Level Advisory Group on Sustainable and Inclusive Recovery and Growth. Washington, DC: World Bank.
World Bank. 2024a. Global Economic Prospects. January. Washington, DC: World Bank.
World Bank. 2024b. Global Economic Prospects. June. Washington, DC: World Bank.
World Economic Outlook Database. https://data.imf.org/en/datasets/IMF.RES:WEO.
Zachmann, G., E. Calthrop, A.-D. Riess, and A. Kolev. 2012. Investment and Growth in the Time of Climate Change. Brussels: Bruegel.
In reality, private investment flows only where the right conditions exist and where there’s a clear probability of return. And for that, two things are essential: a strong infrastructure foundation and a predictable regulatory environment. Without these, private capital stays on the sidelines.
Ajay Banga (2025) President, World Bank Group
CHAPTER 4
Reinvigorating Private Investment: Policy Options
Private investment has a critical role to play in delivering better development outcomes and generating jobs in emerging market and developing economies (EMDEs). Yet private investment growth has slowed in recent years, to a little more than half of the 2000-09 average in 2010-23, and the share of EMDEs experiencing a period of private investment acceleration dropped from about one-third in 2000-09 to one-fifth in 2010-19. Achieving the necessary increase in private investment will hinge on ensuring adequate risk-adjusted returns for firms, easing binding constraints in the business environment, unlocking financing constraints, and addressing market failures. Major structural reforms in EMDEs are estimated to generate a cumulative increase in private investment of about 2.2 percent in the three years following reforms. Reform complementarities are critical: coherent packages outperform isolated steps; stronger institutions amplify gains; and credible, predictable policies—implemented early in political cycles and backed by capable bureaucracies—raise the probability and durability of accelerations. The international community can take action to reduce geopolitical risks; maintain a transparent, predictable rules-based international system conducive to trade and investment; and promote cross-border integration. Country circumstances matter: there is no one-size-fits-all recipe for delivering the substantial increase in private investment that is needed in EMDEs.
Introduction
Investment plays a critical role in driving economic growth, reducing poverty, creating jobs, and achieving development goals, including for EMDEs.1 Before the COVID-19 pandemic, investment was estimated to have contributed nearly one-third of gross domestic product (GDP) in EMDEs (World Bank 2019). Investment growth has always been important, but it is needed perhaps more urgently than ever. The overlapping shocks to the global economy in recent years—pandemic, conflict, and inflation—and the scale of systemic challenges facing policy makers mean that a sustained, substantial increase in investment growth, especially in the poorest and most vulnerable countries, is critical for making progress toward established development and climate objectives.
Yet, despite large and rising investment needs, there has been a broad-based slowdown in investment growth in EMDEs since 2010 (World Bank 2024a). Reversing this trend and reinvigorating investment is a key challenge for macroeconomic policy makers. Public investment has important roles to play in supporting an equitable and lasting
Note: This chapter was prepared by Tommy Chrimes, Mathilde Lebrand, and Joseph Mawejje, with contributions from Kersten Stamm.
1 Throughout this chapter, unless otherwise indicated, “investment” refers to gross fixed capital formation rather than to inventory investment or investment in financial assets.
recovery from recent shocks and bolstering long-term growth—among other things, by helping to meet infrastructure- and climate-related needs and bolstering the provision of public services (chapter 1; World Bank 2024b). However, the private sector has always been a vital driver of investment, and constrained fiscal space, which inhibits government spending in the current global environment, means that reinvigorating private investment is even more important.
This chapter considers policies that could incentivize stronger growth of private investment in EMDEs—including investment aimed at closing important development- and climate-related gaps. It addresses the following questions:
• What are the constraints on private investment growth in EMDEs?
• How can structural reforms catalyze private investment growth?
• What other policies should be considered to boost private investment growth sustainably?
Contributions. This chapter makes several contributions to the literature. First, it documents trends in private investment growth since 2000 and reviews the constraints to private investment, informed by recent evidence and the broader literature. Second, the chapter provides empirical analysis of the impact of different types of structural reforms on private investment in EMDEs. Third, it extends the analysis of investment accelerations—periods of sustained, rapid investment growth—in EMDEs, as discussed in chapter 2, focusing here on private investment. It explores the features of such private investment accelerations and the policies associated with them. Finally, the chapter provides an overview of the broad policy options to support private investment growth, recognizing the complexity of the challenges and taking into account approaches that have succeeded in the past.
Findings. The chapter presents the following main findings:
Surveys of firms identify a range of constraints to private investment. Insufficient infrastructure, poor quality of tax administration and other institutional conditions, and limited access to finance are prominent constraints for firms in EMDEs. A much larger share of firms report these constraints in EMDEs than in advanced economies.
Private investment accelerations—periods of sustained, rapid private investment growth— have become less frequent since 2010, but they can be sparked by policy interventions. During 2010-19, about 20 percent of EMDEs experienced an investment acceleration, compared to 35 percent in 2000-09. Policy interventions that improve macroeconomic stability, combined with structural reforms, improvements in institutional quality, and other reforms in the business environment, can help catalyze private investment accelerations. Packages of reforms increase the likelihood of a private investment acceleration. Sustainably raising private investment growth is a complex and multifaceted task. However, there are success stories, such as in Colombia, India, the Republic of Korea, and Türkiye.
Structural reforms can support private investment growth over the medium term and are more effective when implemented in packages. In EMDEs, major structural reforms related to international trade, external finance, the domestic financial sector, and product markets generate a cumulative increase in private investment of about 2.2 percent in the three years following the reform. The impacts of structural reforms are generally larger in EMDEs than in advanced economies. Individually, major reforms targeting trade, external financing, and product markets all have notably positive average impacts over a three- to five-year horizon. The impacts of reforms tend to be larger when implemented in combination with other reforms.
The complexity of the challenges means that policy makers must carefully assess countryspecific circumstances in considering what to prioritize in pursuit of sustainable increases in private investment growth. Governments that have the largest needs are also often the ones least able to meet them. Weak technical and administrative capacity in some EMDEs, particularly low-income countries (LICs) and economies in fragile and conflict-affected situations (FCS), can hinder the effective implementation of desired policies. However, strengthening implementation capacity takes time and effort, and in many cases may require greater international support
Private investment trends and gaps in EMDEs
Multiple shocks, including the COVID-19 pandemic, the Russian Federation’s invasion of Ukraine, conflict in the Middle East, and other sources of heightened geopolitical risks, have hindered private investment growth in recent years (World Bank 2024a). Private investment growth in EMDEs averaged 6.7 percent per year in 2010-23, a little more than half of the pace in 2000-09 (figure 4.1.A). Excluding China, private investment growth in EMDEs has been even weaker, at 5.3 percent per year in 2010-23. The slowdown has been widespread across EMDEs. It is evident in both commodityexporting and commodity-importing EMDEs, and in every EMDE region (figures 4.1.B and 4.1.C).
Weaker global economic growth and narrower fiscal space may have contributed to slower investment growth (World Bank 2024a). The onset of the pandemic in 2020 and the subsequent overlapping shocks have put further strain on output growth and investment growth. The outlook is muted, with investment growth expected to remain relatively weak in the medium term (World Bank 2024b).
In the medium and long term, sluggish private investment growth will make it challenging for EMDEs to fill large investment gaps. Annual investment needed in EMDEs, excluding China, to meet the Sustainable Development Goals and established climate objectives is estimated at $3.7 trillion in 2025, rising to $5.9 trillion by 2030, against actual investment of $2.4 trillion in 2019 (figure 4.1.D; Bhattacharya et al. 2022). In some sectors, the scale of the challenge is more acute: estimates suggest that a sevenfold increase in annual clean energy investment will be needed in EMDEs, excluding China, by the early 2030s, just to meet rising energy needs in ways that align with commitments under the Paris Agreement (IEA and IFC 2023).
FIGURE 4.1 Private investment trends in EMDEs and total investment needs to meet climate and development goals
Private investment growth in EMDEs has been starkly lower since 2010. Slower private investment growth has been broad-based across regions and is observed across both commodity exporters and commodity importers. The slowdown in private investment growth contrasts with the large and rising investment needs required to meet established climate and development objectives.
D. Annual investment needs to reach climate and development goals in EMDEs excluding China
Sources: Bhattacharya et al. (2022). Haver Analytics; Investment and Capital Stock Dataset (IMF 2021); WDI (database); World Bank.
Note: EAP = East Asia and Pacific; ECA = Europe and Central Asia; EMDEs = emerging market and developing economies; LAC = Latin America and the Caribbean; MNA = Middle East and North Africa; SAR = South Asia; SSA = Sub-Saharan Africa.
A. Average annual investment growth, calculated with countries’ investment in constant international dollars as weights. Sample includes 162 economies, of which 125 are EMDEs.
B. Median investment growth by region. Sample includes 12 EAP, 18 ECA, 28 LAC, 15 MNA, 8 SAR, and 44 SSA countries.
C. Median annual investment growth by EMDE group. Sample includes 77 commodity-exporting EMDEs and 48 commodity-importing EMDEs.
D. Estimated annual investment requirements for EMDEs (excluding China) cover four priority areas critical to development and climate goals: (1) human capital (health and education); (2) sustainable infrastructure and the acceleration of energy transitions; (3) adaptation and resilience; and (4) restoration of natural capital through sustainable agriculture, food and land-use practices, and biodiversity. These estimates are based on total investment needs defined in Bhattacharya et al. (2022).
Unless investment gaps can be addressed effectively, established goals will likely fall further out of reach, with significant economic and human consequences that will have negative spillovers far beyond the world’s poorest countries. Moreover, each additional year in which an investment shortfall persists will likely increase the ultimate cost of necessary action, and will also increase the risk that dangerous tipping points will be passed, setting the world down a damaging path.
B. Private investment growth, by EMDE group
A. Private investment growth
C. Private investment growth, by EMDE region
Although public investment can play an important role, it cannot match the scale of increasing investment needs: the numbers are simply too large, even before considering recent pressures on fiscal positions and the challenges EMDEs have faced in expanding revenues (chapter 3). Limited fiscal space constrains public investment in EMDEs, including spending on infrastructure, human capital development, and climate change mitigation and adaptation (World Bank 2019). At the same time, the external financing landscape has deteriorated for most EMDEs—amid declining overseas development assistance and the increased cost of private financing (Eyraud et al. 2021; World Bank 2023a). For multiple reasons, therefore, the private sector will likely have to play an increasingly important role in EMDE investment, delivering a larger share of a growing total, including to address major international policy challenges, such as facilitation of the green transition.
Against a backdrop of decelerating global growth and constrained fiscal space, an enormous increase in private investment is needed to support an equitable and lasting recovery from recent shocks and to address large, urgent, and growing infrastructure, development, and climate-financing needs (Bhattacharya et al. 2022; Fouad et al. 2021). The challenge for policy makers in EMDEs is to design and implement policies that will engineer this increase effectively and sustainably, taking into account resource and capacity constraints.
Attracting private investment has long been an objective for governments. This is not surprising, given the link between investment and output growth (Kose and Ohnsorge 2024). In turn, investment can support, among other things, per capita incomes, fiscal revenues, and poverty reduction. Fundamentally, investment by the private sector hinges on favorable risk-adjusted returns relative to financing costs (IEA and IFC 2023). This is true for fixed capital formation by a firm but also applies to other investment concepts, such as inventory-building or financial investment. When factoring in a premium for risks, returns must be at least as high as alternatives for the prospective investor.
These observations imply that a key question for policy makers seeking to boost private investment is how they can deploy policies to enhance returns, clarify or reduce risks and uncertainty, or reduce financing costs without excessive adverse distortions. A second, related concern for policy makers is binding investment constraints and specific market failures that place limits on investment, and whether policy can help relieve these. For example, an investment project might have a high risk-adjusted return but be stymied by a lack of access to finance. Policy makers must consider these issues in the context of their own limited resources, capacities, and other potentially competing but sometimes complementary objectives.
Private climate finance
Much recent commentary on private investment focuses on climate change, reflecting the urgent need for mitigation and adaptation finance. This study treats climate change as a major policy challenge but notes that mobilizing private investment for it follows the same principles as other investment—especially for projects with large up-front costs and delayed payoffs. Climate-related investment still requires competitive risk-adjusted
returns. Climate change represents a market failure: emitters do not bear the full cost of emissions, and, without policy action, returns to private climate protection remain limited. Because climate is a public good, externalities must be internalized, and early action is far less costly than delayed measures (Stern 2007).
A key feature of climate investment is that returns are often in the form of avoided costs, which do not fit neatly into standard accounting frameworks. Moreover, whether such investment should be fully additive to other investment remains a matter of debate. Addressing climate change will require both investment and complementary regulatory measures. Broadly, policies to mobilize private climate finance mirror those for private investment generally: raising risk-adjusted returns and alleviating key constraints. This chapter uses climate-related examples to illustrate these broader points.
Constraints and policies
Constraints on private investment exist at different tiers, from the largest geostrategic issues to idiosyncratic challenges and concerns at the level of the firm or project. Constraints can relate to issues broader than just investment, and there are often links between investment and other important macroeconomic variables, including output growth. Policies for addressing specific topics may therefore have overlapping objectives and consequences. The different tiers of constraints can also overlap. Investors’ expected returns depend on global-, country-, sector-, firm-, and project-specific factors (IEA and IFC 2023).
Foundations of the macroeconomic environment
Returns on most investments are often generated over long time horizons. How the concerned country and its policies will evolve over time can affect returns, so expectations about the evolution of the political, institutional, and macroeconomic environment may be an important consideration for investors (Mumtaz and Ruch 2023).
Political risk and institutional uncertainty can thus be important constraints on private investment (Brunetti and Weder 1998; Kher and Chun 2020).
Political risk and uncertainty might be inevitable to some degree, and can be a natural consequence of democratic processes. However, governments can act to reduce uncertainty and promote confidence, building resilience to both cyclical swings and structural shifts. They can do this most effectively by establishing a track record of institutional arrangements and policies that promote sustainable economic growth along with political, institutional, and financial stability. A sustainable approach to debt, credible monetary policy, low and stable inflation, effective governance, and consistent implementation of laws and regulations can help to promote stability. The predictability of government actions—most notably secure property rights, protection against arbitrary expropriation, defense of civil liberties, and judicial and bureaucratic independence—has long been recognized as a key driver of private investment (refer to, for example, Poirson 1998).
Credible monetary and fiscal policies are also critical from a direct macroeconomic standpoint: they shape interest rates (directly in the case of monetary policy; indirectly in
fiscal policy), and higher interest rates will increase the cost of finance for firms looking to borrow to invest. Monetary policy influences firms’ investment decisions, with investment falling in response to higher policy rates (Cloyne et al. 2018). Excessive government borrowing to fund deficits can put pressure on credit markets, tighten financial conditions, and crowd out private investment (Huang, Pagano, and Panizza 2020; Huang, Panizza, and Varghese 2018). Higher interest rates are therefore likely to push down private investment growth. Credible monetary and fiscal policies will not render a country immune to inflation shocks and the higher interest rates that might be required to return inflation to a low and stable path, but they should make the transition more straightforward. Over time, such policies can also help reduce the interest rate spread between EMDEs and benchmark global rates.
Steps to improve macroeconomic and institutional credibility and certainty may take time and can span multiple administrations. A consistent approach—ideally underpinned by broad consensus—may be necessary, often involving both short-term reforms and longer-term policy measures. By improving fundamentals, enhancing certainty, and fostering security, such reforms can provide stronger incentives for private investment (Fleta-Asín and Muñoz 2021).
Poor governance and economic crises are two important sources of perceived risk that have been globally prevalent in recent years, particularly in EMDEs (figure 4.2.A; Kher and Chun 2020). Moreover, growth prospects have dulled across much of the world: EMDE potential growth is estimated to have declined by one-third since the 2000s (Kose and Ohnsorge 2024). Fiscal positions worldwide have also been weakened by increases in spending in response to recent overlapping shocks, including the pandemic; a period of sustained high inflation has put pressure on monetary policies and frameworks in a range of countries; and there has been little long-term progress in improving the institutional conditions underpinning investment decisions (chapter 3). Enhancing institutional and macroeconomic stability can be particularly challenging for those EMDEs that lack it most, such as FCS and those with low per capita incomes. Yet it is in such countries that these efforts can be most beneficial (Chrimes et al. 2024).
Despite the prevalence of uncertainty in EMDEs, and the difficulty of obtaining reliable information, there is some evidence that private sector investments in these countries are not as risky as typically perceived (Gouled 2024). Policy efforts to share reliable information and raise awareness about credible opportunities for investment, for individual firms as well as for potential financial investors, can therefore be helpful.
Stability and uncertainty
Across countries, investment growth and output growth are likely to be correlated and mutually reinforcing (Kose et al. 2017). Prospects of stronger global GDP growth should mean, at an aggregate level, greater demand growth, potentially higher returns on a given investment, and increased profits, which can help finance new investment. Weaker global growth prospects, or perceptions of increased economic risks, could cause a shift in sentiment in favor of perceived “safer” investment decisions. This applies to narrowly defined fixed capital formation—firms will respond to the perceived outlook
FIGURE 4.2 Country risk and global uncertainty
EMDEs, particularly LICs, are generally assessed as much riskier investment environments than advanced economies. Global uncertainty has trended upward over the past two decades across country groups and most regions, particularly since the global financial crisis. Since 2010, the increase in uncertainty has been higher, on average, among LICs and advanced economies. Relative to other EMDE regions, the increase in uncertainty has been higher in Europe and Central Asia, the Middle East and North Africa, and Sub-Saharan Africa.
Sources: Ahir, Bloom, and Furceri (2022); PRS Group, International Country Risk Guide; World Bank.
Note: AEs = advanced economies; EMDEs = emerging market and developing economies; EAP = East Asia and Pacific; ECA = Europe and Central Asia; LAC = Latin America and the Caribbean; LICs = low-income countries; MNA = Middle East and North Africa; PPP = purchasing power parity; SAR = South Asia; SSA = Sub-Saharan Africa.
A. Share of countries, by risk category. Based on the International Country Risk Guide composite index for 2023. The index aggregates financial, economic, and political risks, and ranges between 0 and 100. Sample includes 34 AEs and 73 EMDEs, of which 14 are LICs. B.-D. Average global uncertainty index, weighted by GDP (in constant 2017 PPP-adjusted U.S. dollars). The data include 32 AEs and 111 EMDEs, of which 22 are LICs. Based on Ahir, Bloom, and Furceri (2022), who constructed a new index of uncertainty—the World Uncertainty Index (WUI)—for an unbalanced quarterly panel of 143 countries beginning in 1952. The index reflects the frequencies of the word “uncertainty” (and its variants) in Economist Intelligence Unit country reports. To make the WUI comparable across countries, the index scales raw counts by the total number of words in each report—that is, the number of “uncertainty” words per 1,000 words. A higher number means higher uncertainty and vice versa.
and risks in considering investment decisions and may be more cautious when prospects for growth are uncertain. It also applies to financial investment, which can be an important source of financing for firms undertaking fixed capital investment. Muted financial investment can be particularly detrimental for EMDEs, which are often seen as riskier than advanced economies. It is therefore not surprising that the slowdown of investment growth in EMDEs over the past decade was accompanied by slower global output growth, lower commodity prices, lower and more volatile capital inflows to EMDEs, a slowing pace of trade integration, and a substantial buildup of public and private debt (Kose and Ohnsorge 2024).
B. Global uncertainty
A. Country risk
D. Uncertainty levels, by EMDE region
C. Uncertainty levels, by country group
AEsEMDEs
Uncertainty and risks can be generated by global, international, or otherwise exogenous developments, as well as by domestic policy choices. The multiple overlapping shocks of recent years—including the COVID-19 pandemic, Russia’s invasion of Ukraine, global inflationary pressures, and renewed conflict in the Middle East—have directly raised costs for firms but have also introduced fresh uncertainties. These effects include an uptick in inflation globally and, as noted earlier, higher interest rates—which may be a necessary response to higher inflation but which increase the cost of finance and are thus likely to reduce private investment. Global uncertainty, which has intensified in recent years (figure 4.2.B), has increased more in LICs than in other EMDEs and in advanced economies (figure 4.2.C). Across five of six EMDE regions, uncertainty has been higher so far in the 2020s than in the previous two decades (figure 4.2.D).
Higher geopolitical risk has been associated with lower investment and employment (Caldara and Iacoviello 2022). In recent years, particularly since around 2015, trade frictions and global fragmentation have contributed to increased uncertainty, following decades of relatively limited volatility in international trade relations (Caldara et al. 2020). Uncertainties concerning trade procedures, trade costs, and the application of existing regulations all increase transaction costs; in turn, they are likely to dampen or delay investment (Handley 2014). The pandemic and subsequent overlapping shocks have also exposed vulnerabilities in global supply chains. Although some countries might see near-term increases in investment associated with a reconfiguration of trade links and supply chains, the overall impact on investment is highly likely to be negative (World Bank 2024a).
Many countries remain vulnerable to geopolitical and international economic developments beyond their control, whatever their engagement in such developments. Yet this vulnerability should not translate into helplessness or inaction. Beyond efforts to promote international cooperation to address risks and enhance prosperity, countries should also focus on building resilience to shocks and on domestic approaches to mitigating international uncertainty, without undermining the shared benefits of international trade and finance. Strengthening domestic macroeconomic policies can help countries manage the effects of exogenous shocks, even if they cannot fully mitigate those shocks. Fiscal responsibility (building both credibility and buffers), a coherent and credible foreign exchange rate regime, a sound monetary policy framework, a consistent approach to capital flows, and effective financial sector regulation can help promote resilience and foster stability in the face of adverse exogenous shocks.
Economywide structural policies
Other important factors driving private investment growth include economywide structural policies relating to international trade, finance, and other cross-border flows; the business environment; the tax system; and the financial sector. These themes also all have broader macroeconomic relevance.
International trade, nance, and other cross-border ows
Reducing restrictions on trade, finance, and other cross-border flows can help support private investment by opening opportunities for firms. They can sell goods or services to
a wider pool of potential consumers, increasing potential revenues, and can also source inputs (including physical assets, human capital, and finance) or participate in global value chains more efficiently. Through increased revenues or improved efficiencies, returns are higher—making new private investment more attractive.
A trend toward integration was a feature of the global economy for decades following World War II. The expansion of international trade and financial flows supported the development of the private sector and encouraged private investment, and was also a major factor underlying the unprecedented growth of global output and per capita incomes, and the reduction of poverty in that period (World Bank 2023b). These trends were clear even in EMDEs, although progress was typically more partial, or at least more gradual, than in advanced economies. There were also counterexamples in EMDEs. In some cases, rushed attempts at liberalization of cross-border trade and financial flows encountered challenges; in others, development success occurred despite an element of protectionism. Both support the view that a gradual approach to reforms involving trade integration and other cross-border flows is sometimes best.
Yet the global trend toward trade integration stalled in the late 2010s, and since then has reversed in certain ways. The frequency of new trade agreements has decreased, and challenges in the process of addressing trade disputes at the World Trade Organization have become more prominent (World Bank 2025). Tariffs and other trade-distorting measures, as well as “industrial policy” measures that subsidize domestic producers, have proliferated in advanced economies and EMDEs (World Bank 2025). Such policies have been justified on a variety of grounds, including a desire to protect or promote domestic industries and jobs, retaliation for measures adopted by competitors, and concerns related to international security. However, more restrictive trade policy may well constrain aggregate investment and output growth (Furceri et al. 2022; World Bank 2023c).
There are parallels with international capital flows, which can also be an important source of financing for investment in EMDEs. In principle, EMDEs should attract capital, because of the relatively high returns on capital investment that might be expected in capital-poor economies. Cross-border investment—whether foreign direct investment (FDI) or portfolio investment—can support fixed capital formation in the recipient economy. In practice, however, such capital flows to EMDEs are often constrained, including by policies explicitly aiming to limit them. The volatility of capital flows—particularly “sudden stops” and capital outflows—can be highly disruptive, not only for investment but also for the management of exchange rates and the financial sector. Although capital account openness may generally be an appropriate long-term objective for EMDEs, the best process for achieving it may be gradual, and there may be occasions when temporary, targeted capital-flow management measures can be appropriate to cushion disruptive developments (IMF 2020).
Notwithstanding the current headwinds to global trade and investment, policy makers should maintain a focus on removing explicit restrictions on trade and other crossborder flows that could inhibit private investment and on preventing the imposition of
new restrictive measures, where possible. In addition to deliberately restrictive policies, other frictions that impede trade and capital flows can weigh on the ability of firms to invest. These frictions—such as shipping, logistics, and procedural or processing costs— tend to be greater in EMDEs than in advanced economies (World Bank 2024a). They also tend to be a much larger share of the cost of trade than tariffs (Ohnsorge and Quaglietti 2023). Accordingly, measures to reduce these frictions can boost prospective returns for firms, in turn increasing the attractiveness of investment.
Increasing trade flows by reducing trade restrictions can significantly boost investment growth (Brenton, Farrantino, and Maliszewska 2022; Kose and Ohnsorge 2024; World Bank 2022a). Nontariff costs involved in border crossings can be reduced, for example, by simplifying time-consuming administrative procedures as well as unclear or extensive documentation requirements. Harmonizing inspection requirements and labeling standards between countries can also lower firms’ costs and smooth border crossings. Improving physical infrastructure, such as ports, airports, and roads, can reduce travel time and variability (Marius Adom and Schott 2024; World Bank 2022a).
Trade agreements can help solidify trade integration—not only through tariff reductions but also through broader trade facilitation measures. Even against the backdrop of a difficult global trading environment, there is potential for EMDEs to seek deeper cooperation with regional partners and other like-minded economies (World Bank 2025). Standardization of regulatory requirements across multiple jurisdictions can help streamline costs and develop economies of scale. Deeper trade agreements can also promote regional and global value chain participation by codifying intellectual property rights, competition, and investment protocols (Fontagné et al. 2023; Hofmann, Osnago, and Ruta 2017). These agreements can particularly benefit small countries and countries that are geographically isolated from trade hubs (Echandi, Maliszewksa, and Steenbergen 2022; World Bank 2020). All such measures—whether by reducing costs or raising revenues for firms, or by reducing uncertainty and increasing confidence in future growth—can promote private investment.
e business environment
A poor domestic business environment clouds the outlook for firms’ profitability and growth prospects, and weighs on private investment. Firms report a variety of challenges to their activities. Poor access to finance and high levels of crime and political instability are two of the three most commonly identified obstacles to doing business in EMDEs (figure 4.3.A). Firms in LICs identify these same two issues, plus infrastructure-related challenges, as their biggest obstacles. All of these constraints will weigh on private investment.
Infrastructure. Infrastructure is identified as the biggest obstacle for firms in EMDEs almost two-thirds more often than in advanced economies (13 percent versus 8 percent) and more than twice as often in LICs (19 percent). The reliability of a country’s infrastructure has a major impact on business prospects. Almost half of firms in LICs (47 percent) report electricity access as a major constraint on their activities, far above the 28 percent of firms in EMDEs and 23 percent of firms in advanced economies reporting
the same (figure 4.3.B).2 Reducing the costs associated with inadequate or unreliable power supply should be an important policy focus in EMDEs (Abeberese, Ackah, and Asuming 2021). The need is particularly acute in LICs and FCS, which tend to lag other EMDEs and be far behind advanced economies (Chrimes et al. 2024). There are different possible approaches, including policies that address cost recovery and pricing risks, with a view to encouraging private sector participation in the provision of electricity (Mawejje 2024).
Similar arguments can be made for other network-related infrastructure, including transportation (cited as a major constraint for one-quarter of firms in LICs, but only one-tenth of firms in advanced economies) and the internet (figure 4.3.C; Hjort and Tian 2025). Beyond the direct impact on individual businesses, easing these constraints can also support clustering and network effects, bringing in more firms from along the supply chain. Cheaper and more reliable utilities—whether funded by public or private means—can support economic activity and thereby increase investment. Moreover, the provision of infrastructure services can in some cases support broader institutional development: electricity provision can help bring firms into the formal sector and mobilize revenues (Blimpo et al. 2018).
Regulation. Effective and well-targeted regulation can promote the public interest, while also instilling certainty in the business climate for firms, and thus support private investment (Collier and Cust 2015). Conversely, poorly targeted, inefficient, duplicative, or inconsistently applied rules can add to costs, create uncertainties for businesses, and impose particular barriers for new entrants, holding back investment. Reforms to ensure that regulations are effective, consistent, and well implemented—without being unduly burdensome for firms—can help ease these constraints and have long been an important focus for the international development community (refer to, for example, World Bank 2022a).
Tax and tax administration. Taxation is often cited by firms as a major impediment to business activity and expansion. Reliable tax revenues are important for governments to provide infrastructure and public services necessary for a positive business environment, among other things. Tax revenues in EMDEs remain far below the rates observed in advanced economies (Benitez et al. 2023; Mawejje and Sebudde 2019). Poorly designed and inefficient tax administration can increase costs and uncertainties for firms, which can constrain private investment. Taxpayers in EMDEs face much higher compliance costs, measured in hours per year needed to prepare tax forms and pay taxes (Coolidge and Ilic 2009; Reva 2015). Lack of clarity around tax law, regulations, and policy; limited use of technology; and cumbersome tax administration procedures can lead to high compliance costs (Dom et al. 2022; Marcuss et al. 2013).
Almost 20 percent of firms in EMDEs excluding LICs—and 30 percent of firms in LICs—report tax administration as a major constraint to their activities, whereas only 7
2 Firm-level surveys of the major constraints to doing business are conducted separately from surveys of the biggest obstacles.
FIGURE 4.3 Obstacles to doing business in EMDEs
Firms in EMDEs report a variety of challenges to doing business, including unreliable access to electricity, low-quality transportation infrastructure, and weak tax administration. Access to finance is a major impediment in EMDEs. All of these constraints are more prevalent in LICs than in other EMDEs.
Biggest obstacles for firms in EMDEs
B. Firms identifying access to electricity as a major constraint
Firms identifying transportation as a major constraint
Firms identifying tax administration as a major constraint
Sources: International Monetary Fund, Financial Development Index; World Bank; World Bank Enterprise Surveys.
Note: AEs = advanced economies; EMDEs = emerging market and developing economies; LICs = low-income countries.
A. Figure shows the top three obstacles cited by firms, using the latest available year for each country. Bars show averages for the indicated country groups, based on up to 128 EMDEs, including 23 LICs. “Infrastructure” combines firms naming electricity and transportation; “Taxation” combines tax administration and tax rates; “Crime/instability” combines crime, theft, and disorder; and political instability; and “Labor” combines an inadequately educated workforce and labor regulations. Percentages reflect the share of firms in each country identifying that combined category as their single biggest obstacle.
B.-E. Solid blue bars show the median share of firms identifying specific obstacles to doing business. Orange whiskers show the interquartile range. Sample includes up to 23 AEs and 128 EMDEs, of which 23 are LICs.
F. Solid blue bars show the median financial development index for each country category. Orange whiskers show the interquartile range. Based on 2021 (latest year) data for 34 AEs and 130 EMDEs, of which 22 are LICs. Each indicator within the index is normalized between 0 and 1. The highest value of a given variable across time and countries is equal to one; all other values are measured relative to this maximum. The data are winsorized at the 5th and 95th percentiles to temper the effects of extreme outliers.
A.
D.
C.
percent do so in advanced economies (figure 4.3.D). This result is despite tax-to-GDP ratios that are generally significantly higher in advanced economies. Complex tax regulations, inefficient tax administration systems, excessive tax burdens, and high costs of regulatory compliance can reduce firm productivity (Dabla-Norris et al. 2017). Any of these issues can discourage formalization, raise uncertainty, increase costs, and thus reduce investment opportunities and incentives. Poorly designed tax policies can also cause resource misallocation that lowers aggregate investment (Djankov et al. 2010).
Labor. Availability of appropriate labor is another problem area faced by firms across country groups. In EMDEs, just over one-tenth of firms report labor issues as the primary obstacle to their activities. Yet demographic dynamics are shifting, with the working-age share of the population in many EMDEs beginning to shrink, even as population growth continues apace in much of Sub-Saharan Africa (Lam and Leibbrandt 2023). Some EMDE regions face a major jobs challenge as working-age populations continue to grow; however, other EMDEs could face labor shortages. Matching the skills of the labor force to labor demand is a challenge for all countries, with implications for investment. Strengthening investment in human capital can support the growth of private investment, including in EMDEs (Kasyanenko et al. 2023). The optimal focus for human capital development efforts will depend on a country’s labor force and demographic characteristics, but will always involve pursuing education and training of the labor force. Effective health care systems also help support labor force supply and worker reliability.
Even where policies are well designed to address these issues, entry by a firm into any market often requires significant up-front investment. The stakes can be particularly high for firms attempting to engage or expand in new or limited markets. For such “pioneering” firms, start-up costs and overheads in an uncertain, underdeveloped business environment can be particularly high and potentially opaque. Despite potential first-mover advantages to engaging in such environments, because of limited competition, they are often outweighed by the perceived costs and risks of moving first (Collier et al. 2021). These issues are particularly pertinent for FCS or LIC settings. There is therefore a potentially important role for governments and the international community to take proactive steps to smooth entry to markets for pioneering firms. How and where such intervention is warranted will be context-specific. Policy makers should focus on measures that can help build positive demonstration effects through successful market entries, while also ensuring a level playing field that enables, rather than stifles, competition so that consumers see benefits in the medium term.
Access to finance
Access to finance is reported as a key constraint on business activities by many EMDE firms. Almost two-fifths of firms in LICs, and more than one-fifth in other EMDEs, cite finance as an obstacle, compared with less than a tenth of firms in advanced economies (figure 4.3.E). Indeed, more than 20 percent of firms in LICs and 15 percent in other EMDEs report financing as the primary obstacle, whereas only 7 percent do so in advanced economies. The cost of finance is generally an important determinant of
investment decisions in any context, but it tends to be particularly constraining for firms operating in EMDEs, especially those economies with less-developed financial markets (Fiestas and Sinha 2011). Limited availability of financing dampens private investment, especially when combined with higher levels of uncertainty (also a factor in many EMDEs). Even in large EMDEs, financing costs can be a significant constraint on private investment. One study on utility-scale photovoltaic solar projects in EMDEs found that financing costs account for as much as half of the overall levelized cost of electricity (the average net present cost of electricity generation for a generator over its lifetime), which inhibits the expansion of renewable energy (IEA and IFC 2023).
One factor that tends to raise the cost of finance for businesses in many EMDEs is the relatively small size of firms. Even in major urban centers in certain developing countries, the average firm consists of just one person (Collier et al. 2021). This tendency may reflect the high degree of informality in some EMDEs, with perceived administrative impediments and costs encouraging small firms to operate informally. Financing of small firms, especially informal firms, often involves higher proportionate costs and a greater degree of uncertainty for financiers, given the lack of frameworks and official records relating to their operations. This is especially the case in countries where financial markets are less developed.
In addition, the mismatch between the short-term nature of bank financing in many EMDEs and firms’ much longer-term financing needs remains a major impediment to private sector investment, including infrastructure (Mawejje 2024). This is true irrespective of firm size. There is a stark difference in the average level of financial development between country groups. According to one index, the median score for advanced economies is 65 percent of the best-performing example; the equivalent score is just 11 percent for LICs and 26 percent for other EMDEs (figure 4.3.F). Policies that promote sound development of the financial sector and that sustainably deepen financial markets in EMDEs—focusing on the most important gaps in a particular country—can support private investment (Lee and Cardenas 2010).
Policy makers should also consider whether there are sector- or topic-specific constraints that could be tackled through tailored financial solutions. The scale of the global challenge of addressing climate change, for example, has led to increasing interest in climate-focused financial products, including the development of green, social, and sustainability-linked bonds. Decisions on investments will still generally be based on an assessment of risk-adjusted returns relative to financing costs, even if investors assign value to a “green” outcome, and financing is largely fungible. It is unclear how much investment financed through green vehicles is truly additional at an aggregate level (though green investment displacing environment-damaging investment would still have merit). There is some emerging evidence of a “greenium” on green bonds, implying an attractiveness to investors over other financial assets (Aido et al. 2023). It is too soon to gauge whether such products will have a lasting and meaningful impact on financing costs. However, the development of deeper and more liquid financial markets and the use of new financial technologies are likely to be a necessary, though not sufficient, condition for such offerings to play a larger role in many EMDEs (IEA and IFC 2023).
Externalities that lead to underinvestment
Another factor limiting private investment—and particularly socially productive private investment—may be the presence of externalities: namely, a mismatch between the private returns available to a firm considering an investment and the returns that would accrue to society as a whole if the investment were made (Jones and Summers 2022). Such externalities, which tend to lead to underinvestment, are evident, for example, in the case of infrastructure and in investments with environmental implications, including climate change mitigation and adaptation as well as the promotion of biodiversity. In such contexts, it may be difficult—and potentially inefficient—to use financial support instruments alone to overcome the market failure (Cull et al. 2024). Policies focused on specific issues or sectors that aim to internalize these externalities may be necessary to promote private investment.
Tax-related policies focused on externalities
A textbook approach to addressing externalities is through targeted taxes and subsidies. By subsidizing or taxing a specific externality (positive or negative, respectively), governments can adjust the incentives for firms, and thus influence investment in a socially beneficial way. In efforts to mitigate climate change, for example, carbon pricing is a potentially important instrument for addressing emissions-related externalities and channeling investment away from polluting output toward greener solutions—ensuring that polluters pay for the social costs of their pollution. Firms often report assigning low priority to investments that help mitigate climate change, such as improvements in energy efficiency (figure 4.4.A). If the societal benefits are more significant than the private benefits perceived by firms, green subsidies financed by carbon taxes could be used to adjust firms’ expected returns from mitigation efforts. Carbon pricing can also help drive investment to support technological change, including in EMDEs. Currently, most climate-related technological innovation happens in advanced economies and China (figure 4.4.B).
Carbon pricing can be implemented through a direct tax on carbon emissions and credits for emission reduction, through an emissions trading scheme (ETS), or through an international carbon market (World Bank 2023e). An ETS—sometimes referred to as a cap-and-trade system—puts a ceiling on the total level of greenhouse gas emissions in an economy, allocates emission allowances to firms, and allows those industries with low emissions to sell the allowances they do not need to larger emitters. A carbon tax is intended to set a direct price on carbon. In either case, the logic is that markets have underpriced the social cost of carbon emissions that are contributing to global warming. Estimates of the extent of this underpricing vary significantly, but by some methodologies run to the trillions of U.S. dollars a year (refer to, for example, Black et al. 2023). By attaching a cost to carbon emissions to reflect this underpricing, governments can force firms to internalize their externalities and thereby incentivize a shift in investment away from fossil fuels to lower-carbon technologies.
FIGURE 4.4 Energy transition investment incentives
The private sector has a critical role in climate change adaptation and mitigation. However, most firms in Europe and Central Asia and in the Middle East and North Africa report that investing in energy-efficiency measures is not a priority compared with other investments. Advanced economies and China dominate in terms of renewable energy patents.
A. Main reasons why firms in ECA and MNA do not invest in energy efficiency
B. Patents related to renewable energy
Sources: World Bank Enterprise Surveys; World Intellectual Property Organization.
Note: AEs = advanced economies; ECA = Europe and Central Asia; EMDEs = emerging market and developing economies; MNA = Middle East and North Africa.
A. Solid blue bars show the percentage of firms identifying specific reasons for not investing in energy-efficiency measures. Sample covers 36 economies in the ECA and MNA regions.
B. Average annual number of patents related to renewable energy, by country group. Based on 35 advanced economies and 78 EMDEs, of which 7 are low-income countries.
Carbon pricing is widely seen as the most efficient way to deliver on commitments to reduce greenhouse gas emissions. However, it involves a number of challenges, including questions about its global effectiveness if designed and implemented only at the national level. Implementing such climate change policies in some countries but not others may just displace polluting activities to the countries where they are not implemented, while harming energy-intensive industries in countries where they are implemented. The result may be no reduction in emissions globally and increased green investment only in the countries where the policies are applied. This challenge could be addressed through multilateral action, but agreement on a global scheme for carbon pricing has proved elusive, despite a range of proposals (refer to, for example, Black, Parry, and Roaf 2021). Some previously enthusiastic advanced economies have recently cooled toward carbon pricing measures.
However, reflecting the urgency of the climate change challenge, some countries or blocs have been pushing ahead with subglobal carbon pricing policies, sometimes complemented by “border adjustment” import measures intended to charge exporting countries for the carbon dioxide emitted in the production and transportation of their exported goods. Despite concerns about competitiveness, relocation, and carbon leakage, recent studies provide tentative evidence that policies to increase carbon costs have a positive investment effect. Firms tend to respond by adapting locally through investment in greener production methods rather than by relocating their production processes abroad (Trinks and Hille 2023). Carbon pricing is becoming more common internationally, albeit primarily in advanced economies, and progress has not been linear.
Policy instruments other than carbon taxation can be used to engineer incentives that reflect the externalities associated with greenhouse gas emissions. In some cases, tax policies designed to promote private investment in low-emission activities and sectors may be justified on these grounds. Many EMDEs use tax exemptions for various purposes, not all related to climate change. These exemptions provide a full or partial exemption of qualifying taxable income, often subject to conditions relating to the sector or location of the activity (Celani, Dressler, and Wermelinger 2022). Although such tax exemption policies can have their merits, including promoting investment, they also tend to lack transparency about their costs, which can be a drawback from a governance perspective in both advanced economies and EMDEs.
Industrial policies
Industrial policies—government interventions to promote activity in a specific sector or sectors of the economy—have been gaining renewed popularity in many countries— both advanced economies and EMDEs (EBRD 2024; Juhász, Lane, and Rodrik 2023). Protectionist motives, including defense of infant industries, competitiveness concerns, and economic and geopolitical security narratives, may have contributed to their renewed popularity. In some cases, the presence of market failures has been cited as justification for deploying industrial policies, for example, with recent climate-related industrial policy initiatives. Such policies include tax incentives or subsidies to a specific industry or group of firms, location-based policies, and firm-level interventions. They aim partly at reducing costs and uncertainty for potential investors in favored sectors. Although such policies are clearly relevant for investment, their net effect on overall private investment is far from obvious. In contrast, competition and open markets have tended to support investment (Pop and Connon 2020).
Concerns around industrial policy have often been related to the difficulty governments face in reliably “picking winners,” whether by sector or technology—a difficulty evident in past experience—and to worries that such interventions tend to be expensive with negative spillovers (IMF 2024). They could promote investment in the short term, but not necessarily in the most productive areas. Yet some other recent critiques suggest that governments do not necessarily need to identify winners; policies and programs to attract high-potential firms, screening out those with more limited prospects for growth and investment, can be sufficient (McKenzie 2023). Some successful economic transformations have, at least in part, been helped by a period of support for a specific industry or group of firms. Thus, industrial policies can promote technological progress by making it easier for firms to acquire knowledge from others’ experiences and therefore “stand on the shoulders of giants” in finding solutions to operational challenges (Aghion et al. 2016). In principle, such policies—to the extent that they provide incentives (in terms of increased returns or reduced costs to innovating firms)—could lead to higher private investment.
However, it is often argued that industrial policies tend to be “anticompetitive” and that their aggregate effects are unlikely to be positive overall. Even if effective domestically in
the near term, they can have complex spillover effects on trading partners, with businesses that might otherwise have been competitive losing out instead. Industrial policies can also distort private investment over a longer time frame—for example, by causing firms to defer investment decisions if they expect additional shifts in government incentives and policies. Often, concerns about industrial policy are related to its design and the practicalities of implementation (Rodrik 2009). Temporal considerations may also be relevant. Some studies have found that subsidies may positively influence investment in the short run, with the effects fading over a longer time horizon. This result suggests that firms may simply expedite existing investment plans without necessarily creating any additional long-term investment value (Mazzucato and Rodrik 2023).
In the realm of climate change mitigation and adaptation efforts, governments in some major economies are advancing large-scale interventions to encourage investment in clean energy and climate adaptation technologies (IEA and IFC 2023). The net effect of these interventions on EMDEs is unclear. These programs may spur technological innovation and progress against climate change in the countries launching them, which would represent a global good (Acemoglu et al. 2023). They could also have positive spillovers for EMDEs through diffusion. However, they may also make it more challenging for many EMDEs to compete for private capital, distorting markets and making it harder for green industries to become established in EMDEs, which could offset some potential cost advantages EMDEs may have over their advanced-economy counterparts (IEA and IFC 2023).
Robust empirical evidence on the effectiveness (or otherwise) of industrial policies is only gradually beginning to emerge, and careful evaluation of new initiatives will be important (McKenzie 2023). Where industrial policies are pursued, they should be evidence-based, targeted, and transparent. Very few industrial policy interventions are targeted at firms with fast-growing potential, and only a small proportion of interventions include sunset clauses, which could help contain fiscal risks (EBRD 2024). The focus should be on supporting pioneering, scalable investments in tradable sectors that create positive “information externalities,” helping reduce uncertainty about returns (Rodrik 2009). Industrial policies should be designed to support, rather than stifle, competition (Aghion et al. 2016). Even then, the aggregate impact on private investment remains uncertain.
Public-private investment partnerships
Attracting private sector participation and investment in public infrastructure projects is a priority for many governments. Infrastructure investment exemplifies common themes around constraints to investment outlays while also posing some specific issues. By nature, infrastructure projects tend to involve large up-front costs, long-term returns, and—in many cases—a public goods component. Governments and international organizations have long advocated private sector investment in infrastructure projects with public dimensions, with a view to enhancing efficiency, navigating fiscal constraints, and sharing risks, costs, and rewards between the public and private sectors. Although interest in public-private partnerships (PPPs) has fluctuated and evolved,
performance has been mixed (Bayliss and Van Waeyenberge 2018; Tan 2011; Trebilcock and Rosenstock 2015).
Private participation in infrastructure (PPI) financing in EMDEs increased significantly between 1990 and 2012, with the number of projects in progress annually rising from fewer than 100 to more than 600, and annual investment climbing from about 1 percent to about 3 percent of GDP. However, more recently, PPI in EMDEs has declined (World Bank 2024b). Between 2012 and 2021, the number of projects with private sector participation fell by almost two-thirds, from about 640 to 230 (figure 4.5.A). As a share of GDP, the value of PPI investment declined by 2.2 percentage points in this period, to 0.7 percent. The decline was widespread across all EMDE country groups. PPI engagement has been perpetually low among LICs: across a 24country sample, the total number of PPI projects recorded in any given year has ranged between 1 and 14 (figure 4.5.B). The decline in PPI in EMDEs over the past decade has occurred despite the existence of a “global savings glut” (Arezki et al. 2017).
The reasons for low PPI in EMDEs overlap with broader constraints on investment, but there are some distinct features as well. One factor is often a lack of “bankable” projects—projects that are sufficiently developed to enable investors (including financial investors) to take a clear view of returns and risks Poorly structured projects and those with inadequate information are often cited as inhibiting private investors from participating in public infrastructure (FSB 2018). Private sector appetite for involvement in infrastructure investment in Asia, for example, has been muted despite the region’s strong growth performance and prospects, as well as its relative abundance of capital (OECD 2015; Ray 2015).
Other challenges in the public-private nexus that complicate private involvement in infrastructure projects include governments’ desire to undertake or adjust projects for noncommercial reasons, including political objectives, which are likely to limit prospective commercial returns. Concerns about achieving profitability may also stem from doubts about the ability of infrastructure to generate adequate commercial revenue through cost-reflective tariffs (Harris 2003; Trimble et al. 2016). In Africa’s electricity markets, for example, 80 percent of countries fully recover operating costs, but only about 30 percent recover capital costs (figure 4.5.C; African Development Bank 2022; Briceno-Garmendia and Shkaratan 2011). Moreover, regulatory governance quality, a key pillar for private sector investment, is low because of limited independence and poor accountability (figure 4.5.D).
Various policy options exist for incentivizing private sector participation in infrastructure investment (Kessides 2005). Some form of PPP is used in most EMDEs. By some estimates, PPPs have recently contributed 15 to 20 percent of total EMDE infrastructure investment (Fleta-Asín and Muñoz 2021). PPPs can be attractive in helping both the public sector and private investors manage risks and uncertainties; for firms, the presence of guarantees and the combination of PPPs with other reform efforts can be particularly appealing (Cull et al. 2024).
FIGURE 4.5 Trends in private participation in infrastructure in EMDEs
PPI has fallen in EMDEs. The number of PPI projects has fallen significantly—by almost two-thirds from the 2012 peak through 2021—and PPI investment as a share of GDP has slumped. PPI engagement in LICs has also been low since 2012. In African electricity markets, most tariffs do not reflect costs. Most African electricity markets have regulatory and oversight bodies with well-defined legal mandates but score poorly on accountability and independence metrics.
A. PPI in EMDEs excluding LICs
B. PPI in LICs
Sources: African Development Bank (2022); World Bank Private Participation in Infrastructure (database); World Bank Public Participation in Infrastructure (database).
Note: EMDEs = emerging market and developing economies; LICs = low-income countries; PPI = private participation in infrastructure.
A. Blue bars show the average value of PPI investments as a percentage of GDP. Red lines show the total number of projects in a given year. Sample includes 102 EMDEs, excluding LICs.
B. Blue bars represent the average value of PPI investments as a percentage of GDP. Red lines show the total number of projects in a given year. Sample includes 24 LICs.
C. Solid blue bars show the percentage of countries with and without cost-reflective tariffs—electricity prices set at levels that fully recover production, transmission, and distribution costs. Based on a survey of electricity markets in 43 African countries.
D. Solid bars show the percentage of countries by regulatory pillar and performance. The regulatory pillars are legal mandate, clarity of roles, accountability, and independence. Regulatory performance is measured on a 0–1 scale: High = 0.8-1.0; Good = 0.60-0.79; Low = 0.50-0.59; Poor = 0.00-0.49. Based on a survey of electricity markets in 43 African countries.
Although PPPs can help inject private sector financing into otherwise underfunded priority sectors, certain trade-offs and risks for policy makers also exist. First, these investments entail explicit or implicit public liabilities, which may end up costing society more than the benefits they produce (Herrera et al. 2023). Moreover, private sector involvement will generally mean that the public sector forgoes at least some operational revenues (Fabre and Straub 2023). Second, the complexity and long-term nature of infrastructure projects involving the private sector can often lead to demands for renegotiation, which can increase public sector costs significantly over a project’s lifetime.
Governments are often in weak positions to renegotiate on favorable terms, especially in EMDEs, because of the typically limited choice of private sector partners in EMDEs willing and able to pursue bankable projects, as well as the difficulty of ignoring sunk political and fiscal costs. Careful initial contracting can reduce the risks, but there are many examples of EMDE taxpayers funding significant cost overruns in PPP projects, particularly in the transportation sector (Moore, Straub, and Dethier 2014).
Local or project-specific constraints and interventions
Beyond economywide and sector-specific constraints, more granular issues can also hold back private investment. At local or even individual project levels, there may be physical, social, logistical, or other challenges that increase risks or reduce returns from a given project, and thus discourage investment. Government intervention is not necessarily appropriate in such cases—it may not be efficient and could be discriminatory, conflicting with level playing field requirements. In some instances, however, targeted interventions could help unlock an investment that brings broad benefits.
This may be the case with particular infrastructure projects that, if delivered effectively, could bring in much broader private investment. Particularly for frontier or pioneering projects, there may be important demonstration effects from supporting a specific initial investment. Some investments can catalyze broader growth via direct and indirect multipliers as well as forward and backward linkages. Such investments might, for example, spark knowledge transfer, facilitate capacity building, or reduce the price of inputs (Collier et al. 2021).
Meanwhile, policies focused on local conditions, also known as place-based policies, are sometimes deployed to support regional or local development (Duranton and Venables 2018). These policies can include targeted financial support, or the establishment of special economic zones with specific incentives or regulatory carve-outs to promote investment (often, but not exclusively, in the form of FDI). Such policies are often motivated by a desire to address unequal geographic distribution of economic activity, including by fostering job creation in specific places, perhaps in disadvantaged, relatively poor-performing regions or localities. These policies can improve conditions by facilitating the productivity gains that can happen when firms and workers cluster in an area, and by addressing spatial mismatches (the disconnect between the location of available jobs and available workers). Some place-based subsidies have had positive direct microeconomic impacts on investment within a specific area, including in EMDEs. For example, evidence shows a positive impact on FDI from economic zoning status in South Asia (Galal 2024). However, the impact of place-based policies on aggregate investment (at the national level or more broadly) is less clear.
Microlevel interventions can also play an important role in supporting private investment. For example, targeted government training and mentorship programs can occur at the economywide level or be deployed in more surgical interventions with a narrower objective, which helps improve capabilities for business expansion and technological innovation in a specific area (Karlan et al. 2014; McKenzie and Woodruff 2014). A key consideration is whether such targeted funding brings enough additional improvements
that firms are persuaded to undertake positive and beneficial activities that they would not otherwise have pursued. Some recent empirical evidence indicates that certain government programs that provide such subsidies or support to firms have had a meaningful positive impact (McKenzie 2023).
As with PPPs, the success of such granular interventions has been mixed. The rationale for project-level interventions should be set out transparently and robustly, within a clear framework that details the criteria and operational guidelines for such interventions, with decision-making responsibility devolved to the right level, and with appropriate oversight and tools to ensure a consistent and transparent approach along with monitoring and evaluation.
Policy options and prioritization
There are many different constraints on private investment and many policy options that could be considered to reduce them. The optimal approach will be highly contextspecific. Policy makers design and implement reforms in complex environments—and amid competing pressures and priorities. They have limited fiscal and human resources, as well as finite political capital and legislative bandwidth. The capacity to implement different policies may also vary widely from country to country (EBRD 2024).
Policies aimed at sustainably raising private investment must do so by increasing expected returns (via a firm’s prospective costs or revenues) or by reducing perceived risks and uncertainties. They may do so through efforts to address an identified market failure or to remove other specific constraints. Decisions on the optimal approach to achieving these objectives must be based on an analysis of the country’s economy, the likely effectiveness and costs of the options available, implementation capacity, and the country authorities’ broader policy priorities.
Nevertheless, two empirical exercises offer insights into measures to increase private investment. One presents evidence that structural reforms tend to have a sustained positive impact on private investment. The other builds on the previous World Bank (2024a) analysis and on chapter 2 of this study. It considers features of private investment accelerations—and policies associated with those accelerations—across EMDEs over the past six decades. The evidence suggests that reforms often work best in packages, and that institutional quality affects both the likelihood of sparking a private investment acceleration and the size of a boost to private investment when a reform is undertaken.
These findings offer useful insights for policy makers, although they do not suggest a specific yet universally applicable prescription for sustainably boosting private investment. Studies have stressed the complexity of considerations and cautioned against overly simplistic approaches (Collier et al. 2021). This chapter stops short of universal recommendations but offers some important considerations for policy makers. It provides evidence that supports the case for structural reforms, and it advocates taking account of coherence and complementarities between policies, political and practical constraints (including in relation to implementation), and country characteristics. It also
offers some illustrative examples of countries that have successfully overseen increased private investment. Finally, it considers the role that the international community can play in supporting EMDEs, particularly LICs and FCS, in their efforts to boost private investment.
Structural reforms
Over time, advanced economies, EMDEs excluding LICs, and LICs have all made progress in implementing structural reforms in international trade and financial flows, the domestic financial sector, and domestic product markets. Compared to the 2000s, however, this reform drive slowed—or even stalled—after 2010 (figures 4.6.A-D). In the 1990s, EMDEs excluding LICs implemented 49 structural reforms per year, on average. During the 2000s, the count dropped to 34 per year; by the first half of the 2010s, it stood at 14 per year (figure 4.7.A). To formally assess the link between structural reforms and private investment, this chapter uses the local projections method to estimate the effects of major structural reform episodes—defined as a one-standarddeviation improvement in the aggregate reform index—on private investment (annex 4A).
The results of the empirical exercise show that structural reforms tend to have a positive impact on private investment. In EMDEs, major structural reforms generate a cumulative, statistically significant increase in private investment of about 2.2 percent in the three years following the reform (figure 4.7.B). The corresponding impact for advanced economies is also positive, but not statistically significant. For comparison, the literature has found that major reform episodes globally are associated with a statistically significant increase in output of about 1 percent in the five years following the reform (Alesina et al. 2024).3
The analysis also considers different types of reforms individually. Major trade reform initiatives in EMDEs boost investment, peaking at a cumulative 1.2 percent two years after the reform (figure 4.7.C). The positive response in private investment to substantive reforms relating to external finance is also significant, peaking at 2.4 percent in the third year after the reform, but the response is not significant for reforms relating to domestic finance (figures 4.7.D and 4.7.E). Product market reforms have a positive impact on private investment, peaking at 2.2 percent four years after the reform (figure 4.7.F).
Private investment accelerations
A separate exercise focuses on the features of private investment accelerations and considers policies that have been associated with these accelerations. This exercise extends the analysis on total investment accelerations in chapter 2 (box 4.1). A private investment acceleration is defined as a sustained period (at least six years) of relatively
3 Alesina et al. (2024) define a major reform episode as a 2-standard-deviation change in the aggregate reform index. In keeping with the wider literature, however, this exercise uses 1 standard deviation as the threshold.
FIGURE 4.6 Structural reforms across country groups
Many countries have undertaken major structural reforms—in international trade, external and domestic financing, and product markets—although progress has slowed. Advanced economies have a higher degree of liberalization, whereas the process has been slower in low-income countries.
AEsEMDEs excl. IndexLICsLICs
1990-992000-092010-14
Sources: International Monetary Fund, Structural Reform Database; World Bank. Note: The Structural Reform Database provides a comprehensive set of indicators on structural policies over 1973-2014. The database includes 29 AEs and 61 EMDEs, of which 5 are LICs. Bars show average reform indicators. Indicators range from 0 (less liberalization) to 1 (more liberalization). AEs = advanced economies; EMDEs = emerging market and developing economies; LICs = low-income countries.
rapid per capita private investment growth (at least 4 percent per year, on average), along with several other conditions.
The analysis finds that the frequency of private investment accelerations in EMDEs has declined. Specifically, the share of EMDEs that experienced a private investment acceleration in the decade beginning in 2010 was 18 percent. During a typical acceleration episode, private investment growth increased by an average of 7 percentage points—to 11 percent per year—and the episode lasted for seven years. Most such accelerations did not end in a recession or an economic crisis. These instances of private investment accelerations tended to coincide with periods of strong economic expansion: annual output growth was typically almost 2 percentage points higher during a private investment acceleration and growth in total factor productivity (output increases not explained by increases in inputs) tripled to 1.6 percent per year.
The results suggest that initial conditions shape the likelihood of a private investment acceleration: countries with higher institutional quality are significantly more likely to
B. External financing reforms
A. International trade reforms
D. Product market reforms
C. Domestic financing reforms
FIGURE 4.7 Structural reforms and private investment in EMDEs
Structural reform momentum peaked in the 1990s. Since then, the number of new major structural reforms per year has declined markedly. Structural reforms can support private investment growth in EMDEs. Specifically, reforms in trade, external finance, and product markets are associated with increased private investment growth in EMDEs.
Number of structural reforms per year
Impact of major trade reforms on private investment
Impact of major external finance reforms on private investment
E. Impact of major domestic finance reforms on private investment
F. Impact of major product market reforms on private investment
Sources: International Monetary Fund, Structural Reform Database; World Bank.
Note: AEs = advanced economies; EMDEs = emerging market and developing economies; LICs = low-income countries.
A. Number of major reforms per year in domestic and external finance, trade, and product markets. A major reform is defined as an improvement in a reform indicator of 1 standard deviation or more.
B. Dotted line shows the accumulated percent change in private investment following a major structural reform. Gray shaded area shows 90 percent confidence intervals. The reform indicator is the average of domestic financing, external financing, trade, and product market reform indicators. The x-axis represents the number of years following the reform. C.-F. Dotted line shows the accumulated percentage change in private investment following a major structural reform. Gray shaded area shows 90 percent confidence intervals. The x-axis represents the number of years following the reform. Sample includes 56 EMDEs, of which 5 are LICs.
B. Impact of major aggregate structural reforms on private investment
A.
D.
C.
experience one. Meanwhile, a higher capital-to-output ratio or a more overvalued exchange rate can lower the probability of triggering a private investment acceleration.
The exercise offers further evidence that reforms to liberalize international trade and financial flows enhance private investment. Moving from the median EMDE score on the trade restriction index to match the top quartile threshold would increase the probability of an investment acceleration, as would a similar shift in capital account openness. Fiscal reforms also have a significant impact. For example, one-quarter of EMDEs had a primary balance deficit of 2.7 percent of GDP or larger in the last year of the sample. Eliminating such a primary balance deficit increases the probability of a private investment acceleration by 2.7 percentage points.
The results also show that comprehensive reform packages can have a larger effect on private investment. The combined impact of these policy reforms—fiscal, trade, and financial flows—is markedly larger than the sum of the impacts of the individual reforms, and would increase the likelihood of a private investment acceleration by almost 11 percentage points. There is also a significant positive interaction effect between institutional quality and trade reforms. Improving institutional quality not only improves an economy’s probability of sparking a private investment acceleration but also amplifies the impact of trade reforms on private investment.
Complementarities and consistency
Successful implementation of individual reforms likely depends on the broader policy environment. Effective individual reforms are often implemented under the umbrella of a broader policy approach, involving policies that are coherent and sometimes complementary to one another. In most cases, multiple structural reforms are implemented simultaneously (figures 4.8.A and 4.8.B). Among EMDEs excluding LICs, 95 percent of trade and product market reforms and 94 percent of reforms related to external finance were implemented alongside at least one other reform within three years.
The effectiveness of trade liberalization in promoting private investment, however, may be muted if domestic industries face financial constraints, are burdened with excessive regulation, or have to navigate inefficient infrastructure. A variation of the local projections exercise with interaction terms was used to assess the effect of simultaneously implemented reforms (annex 4A). The results show that trade reforms conducted in isolation do not have a statistically significant impact, whereas those undertaken in combination with other reforms do show a significant positive impact (figures 4.8.C and 4.8.D). Accordingly, reforms to make an economy more open to trade often need to be accompanied by, or sequenced with, efforts to streamline regulations and improve access to finance and public infrastructure (Chang, Kaltani, and Loayza 2009). Such complementarities can build synergies that make the effectiveness of reforms more durable.
Packages of reforms may therefore be more beneficial than reforms pursued in isolation—a hypothesis strengthened by the results in box 4.1. Some output-focused analysis has advocated sequencing reform packages to help navigate trade-offs, beginning with addressing the most binding constraints on activity—often a combination of govern-
ance, business regulation, and external sector reforms (Budina et al. 2023). That research argues that private investment is a critical channel through which these reforms can increase output. Although the exact package of such “first-generation” reforms will vary depending on country circumstances and constraints, this framework may nevertheless be useful for policy makers.
Policy consistency is also important in achieving desired outcomes: a predictable policy path and an understanding of objectives can help create certainty for firms, which should incentivize private investment. Frequent shifts in policy, by contrast, are likely to add to uncertainty or increase costs for firms. This does not mean that policies should not change; instead, careful consideration should be given to the rationale for change and to clearly communicating it to the public. A variation of the local projections exercise used earlier, with interaction terms, was used to assess the effect of the timing of reforms with respect to the electoral cycles (annex 4A). Some evidence indicates that the timing of a reform relative to a country’s political cycle affects its impact on private investment: reforms introduced shortly before elections tend to be less effective than those executed in the early phase of a new administration (figure 4.8.E).
Country authorities should demonstrate commitment and patience to stay the course with well-planned reform agendas. Large-scale changes in policy direction should be considered carefully, and the rationale articulated to reassure investors. In addition, reforms are generally more effective when they are coherent with existing frameworks (Acemoglu, Johnson, and Robinson 2001). Policy inconsistencies can lead to regulatory uncertainty or increased compliance costs, with negative consequences for private investment—including the mobilization of private climate and infrastructure finance (World Bank and Energy Charter Secretariat 2023). Policy consistency can help cement popular support for reforms and their underlying objectives, facilitating their success.
Even well-conceived policies will be undermined if implemented poorly or inconsistently. Conversely, prospective investors are more likely to pursue new investments if they are confident in a government’s ability to deliver announced policies effectively. The success of policies thus relies on a supportive institutional framework (Rodrik 2009). It also hinges on capable public sector organizations for implementation. The capacity to design and implement policies effectively varies widely across EMDEs, with bureaucratic effectiveness often significantly lower in poorer countries (figure 4.8.F). Such variations in state capacity help explain differences in the effectiveness of reforms observed worldwide (Artuc et al. 2020; McKenzie 2023). The lessons that low- and middle-income countries can draw from development success stories depend in part on an understanding of relative bureaucratic capabilities (Juhász, Lane, and Rodrik 2023).
Enhancing institutional strength does not necessarily require creating new institutions. Measures to sharpen skills among officials; improve institutional structures, reporting lines, and accountabilities; and evaluate performance against objectives can all help (Besley et al. 2022).
Bureaucratic quality can have a significant impact on policy success (Barteska 2024). Institutional capacity has also been identified as a factor in the success of PPP engage-
FIGURE 4.8 Reform complementarities and consistency
Reforms are often executed in combination. Trade reforms have a positive impact on private investment when executed alongside other reforms. The positive impact of reforms tends to be higher when they are implemented in the year after an election. Implementation capacity tends to be higher in countries with higher GDP per capita.
A. Complementary reform shifts within three years
B. Share of reform shifts implemented with other sectoral reform shifts
C. Impact of trade reform on private investment without complementary reforms
D. Impact of trade reform on private investment with complementary reforms
Sources: International Monetary Fund; Varieties of Democracy, V-Dem Dataset; World Bank.
Note: Sample includes 29 AEs and 56 EMDEs, of which 5 are LICs. AEs = advanced economies; EMDEs = emerging market and developing economies; LICs = low-income countries; PPP = purchasing power parity.
A. Number of qualifying structural reform shifts within three years of a particular reform shift.
B. Percentage of reform shifts implemented with at least one other sectoral reform shift within three years.
C.D. Dotted lines show the accumulated percentage change in private investment following a major structural reform shift that was or was not preceded by complementary reforms within three years. Gray bands represent 90 percent confidence intervals.
E. Composite reform indicator is the average of the domestic financing, external financing, trade, and product market reform indicators.
F. Scatter plot of the bureaucracy index (2019) and log of GDP per capita (constant 2017 PPP-adjusted U.S. dollars).
BOX 4.1 Private investment accelerations
Private investment accelerations in emerging market and developing economies (EMDEs) have become less frequent since the global financial crisis. During 2010-19, about 20 percent of EMDEs experienced a private investment acceleration, compared with 35 percent in 2000-09. The typical acceleration in EMDEs lasted seven years. Private investment accelerations in EMDEs coincide with strong economic expansions. Annual output growth increases by almost 2 percentage points during a typical private investment acceleration. Comprehensive reform packages that stabilize the macroeconomy—by shoring up public finances, liberalizing the trade and capital accounts, adopting a credible monetary policy framework, and supporting strong institutions— increase the likelihood of private investment accelerations.
Private investment growth has slowed sharply in EMDEs in the past two decades, part of a broad trend of falling total investment growth across all economies that was exacerbated by the 2020 global recession (chapter 1; World Bank 2023d). In EMDEs, private investment growth declined from 11.8 percent in 2000-09 to 6.7 percent per year, on average, in 2010-23 (World Bank 2024c). The slowdown in private investment is especially concerning because private investment accounts for about 15 percent of gross domestic product (GDP) in EMDEs, almost three times the share of public investment. Raising private investment growth is an urgent policy priority because of the large investment required to achieve climate and development goals—up to 10 percentage points of GDP in additional investment per year (World Bank 2022b).
Previous investment accelerations offer lessons on how private investment growth can be boosted. This box examines episodes of private investment growth in EMDEs, and the policy actions that accompany them, using the methodology outlined in chapter 2 and de Haan, Stamm, and Yu (2025).a Chapter 2 provides an in-depth analysis of the transformative growth episodes that countries have experienced during accelerations of total investment (public and private). In the context of private investment, this box sheds light on the following questions:
• What are the key features of private investment accelerations?
• What policies have helped spark private investment accelerations?
Data and definitions
Private investment data are taken from the International Monetary Fund’s Investment and Capital Stock Dataset and defined as real gross fixed capital formation by the private sector. This box uses the same sample of 68 EMDEs and 35 advanced economies as in chapter 2; data are available for 1960-2019.b
Note: This box was prepared by Kersten Stamm.
a. World Bank (2024c) also discusses private investment accelerations in the context of South Asia.
b. Unlike chapter 2, this box excludes Jamaica from the sample because of limited data availability.
BOX 4.1
Private investment acceleration episodes are defined as sustained periods of at least six years with relatively rapid per capita private investment growth of at least 4 percent per year, on average. In addition, to ensure that an episode of high private investment growth qualifies as an acceleration, average per capita investment growth during the acceleration must be at least 2 percentage points higher than in the preceding six years. Furthermore, to rule out recoveries, the per capita private capital stock at the end of the acceleration must exceed its pre-episode peak.c An acceleration concludes when the average per capita growth rate of private investment since the start of the episode falls below 4 percent, or private investment growth turns negative. Investment accelerations are based on per capita investment growth rates, to take into account population growth dynamics, as is done in the literature on per capita GDP growth (Hausmann, Pritchett, and Rodrik 2005; Jong-A-Pin and de Haan 2011; Libman, Montecino, and Razmi 2019).
Features of private investment accelerations
Based on these criteria, between 1960 and 2019, there were 155 private investment accelerations in 82 economies (of which 70 occurred in 30 advanced economies and 85 in 52 EMDEs). During a private investment acceleration, private investment growth typically reached 13 percent per year, significantly higher than in other years (figure B4.1.1.A). Over the six decades covered by the data, the share of EMDEs that initiated a private investment acceleration was highest in the 2000s, when just over one-third of EMDEs had an acceleration. By the 2010s, the share of EMDEs that started an acceleration had fallen by half, to 18 percent (figure B4.1.1.B; chapter 1).
EMDEs experienced, on average, 1.3 private investment accelerations per country in the sample period, fewer than advanced economies (which experienced two private investment accelerations per country). The number and duration of accelerations varied across the six EMDE regions. The East Asia and Pacific (EAP) region had the highest average, with two accelerations per country. South Asia (SAR) averaged 1.7 private investment accelerations per economy, since 1960, and Latin America and the Caribbean (LAC) had 1.6. Sub-Saharan Africa (SSA) had the lowest number of private investment accelerations, with 0.8 per country on average since 1960 (figure B4.1.1.C). Of the EMDEs that did not have a private investment acceleration, half are located in the SSA region.
c. The methodology is outlined in annex 2A in chapter 2. There are also three additional criteria: within the first six years of an acceleration, at least five years must have positive per capita private investment growth; the per capita private investment growth rate in the first year of an acceleration must be positive; and per capita private investment growth in the second year of an acceleration must exceed that in the first year.
Private investment accelerations in EMDEs typically lasted seven years. About 80 percent of accelerations did not exceed nine years. EAP and ECA had the longest median duration (nine years), and SAR had the shortest median duration, at six years (figure B4.1.1.D). The vast majority of private investment accelerations in EMDEs tapered off, rather than ending with a recession or crisis. Of the 78 acceleration episodes in EMDEs that ended by 2019, the last year for which data are available, only 17 ended in a domestic recession—half of which coincided with a global recession, such as the global financial crisis. Using the definition of Laeven and Valencia (2020), 15 EMDEs had a currency, banking, or debt crisis within one year of the end of a private investment acceleration episode.
Private investment accelerations occurred alongside periods of strong economic expansion in EMDEs. Not only did investment grow at a faster pace, but these accelerations also coincided with higher output growth and faster total factor productivity (TFP) growth. Annual output growth increased by almost 2 percentage points, from 4.2 percent per year outside accelerations to 6 percent during accelerations. Growth of TFP more than tripled, from 0.5 percent outside accelerations to 1.6 percent per year during accelerations (figure B4.1.1.E).
These differences, though seemingly modest on an annual basis, suggest substantially better outcomes from a macroeconomic perspective over the span of an acceleration. For the typical seven-year acceleration episode, applying these output growth rates implies that output expands cumulatively by 50 percent during the episode, compared with 33 percent over the same period outside accelerations.
Drivers of investment accelerations
The conditions and policies that enable investment growth—including those related to the institutional environment, monetary frameworks, exchange rate competitiveness, and macroeconomic stability—have been the focus of a large body of empirical research. Although no silver-bullet solution exists, and circumstances matter, some common threads emerge from this study. Specifically, chapter 2 investigates the factors that contribute to sparking investment accelerations. The analysis in that chapter shows that initial conditions, including institutional quality, are important; comprehensive policies that stabilize the macroeconomy and liberalize trade and financial flows are correlated with a higher probability of starting accelerations; and these policies are more effective when institutional quality is high.
This box builds on the empirical exercise in chapter 2 to identify factors that have often helped spark private investment accelerations. In particular, it explores initial conditions such as institutional quality, proxied by the law and order index of the PRS Group’s International Country Risk Guide (ICRG) index (PRS Group
2023); a currency undervaluation index following Rodrik (2008); trade openness from Alesina et al. (2024); and capital account openness from Chinn and Ito (2008). The methodology is explained in annex 2A of chapter 2.
Broadly, the results show that comprehensive reform packages that stabilize the macroeconomy—by shoring up public finances, liberalizing the trade and capital accounts, adopting a credible monetary policy framework, and supporting strong institutions—increase the likelihood of private investment accelerations. In the sample of 103 economies, the unconditional probability of a private investment acceleration starting in any year is 3.4 percent, based on the number of identified accelerations and possible start years. The empirical results for factors that contribute to private investment accelerations are in line with those presented in chapter 2. This baseline probability can be raised substantially when institutional quality is high, or when countries undertake comprehensive reform packages.
The results also show that initial conditions matter for private investment accelerations. Countries with higher institutional quality are more likely to experience a private investment acceleration (table B4.1.1). Meanwhile, a higher capital-tooutput ratio or a more overvalued exchange rate reduces the probability of initiating an acceleration. Not all initial conditions can be targeted by policy makers, but institutional quality is an important exception—and it can be bolstered over time. Increasing institutional quality from the 25th percentile to the 75th percentile—the equivalent of improving the law and order index in Peru or Togo to match that of the Republic of Korea or Spain—would raise the probability of starting a private investment acceleration by about 4 percentage points.d
Reforms that liberalize international trade and financial flows, stabilize the economy, and consolidate government finances have a significant impact on the likelihood of initiating a private investment acceleration (table B4.1.2). Improving the primary balance by about 2.7 percentage points—which would allow an EMDE at the bottom quartile of primary balances in 2019 to eliminate its deficit—increases the probability of initiating an acceleration by about 2.7 percentage points. Similarly, moving from the median EMDE score on the trade restriction index to the top quartile would increase the probability by 2.2 percentage points in that year. Opening the capital account and improving the median EMDE score on the Chinn-Ito index (which measures a country’s capital openness) to the top quartile threshold would increase the probability of a private investment acceleration by 4.1 percentage points. BOX 4.1
d. This increase is based on the conditional probability and raises the probability from 12.5 percent to 16.6 percent, as shown in column 6 of table B4.1.1.
BOX 4.1 Private investment accelerations (continued)
FIGURE B4.1.1 Private investment accelerations
EMDEs experienced, on average, 1.3 private investment accelerations per country between 1960 and 2019. During these episodes, private investment growth rose by 7 percentage points, output growth by 1.8 percentage points, and TFP growth by 1.1 percentage points per year. Reforms, especially reform packages, are effective at sparking accelerations.
A. Private investment growth around private investment accelerations
B. Private investment accelerations in EMDEs
C. Number of private investment accelerations in EMDEs, by region
D. Duration of private investment accelerations in EMDEs, by region
E. Investment, output, and productivity growth during accelerations in EMDEs
F. Change in the probability of a private investment acceleration after reforms
Sources: Alesina et al. (2024); Chinn and Ito (2008); Haver Analytics; Investment and Capital Stock Dataset (IMF 2021); Kose et al. (2022); Penn World Table (Feenstra, Inklaar, and Timmer 2015); WDI (database); World Bank.
Note: Sample includes 68 EMDEs (and 35 advanced economies in panels A and F), spanning 85 private investment accelerations in EMDEs and 155 in total between 1960 and 2019. Identification of episodes follows chapter 2. EAP = East Asia and Pacific; ECA = Europe and Central Asia; EMDEs = emerging market and developing economies; LAC = Latin America and the Caribbean; MNA = Middle East and North Africa; SAR = South Asia; SSA = Sub-Saharan Africa; TFP = total factor productivity.
A. Year 0 indicates the start year of an acceleration episode. Solid line shows the median. Dashed lines show the 25th and 75th percentile of private investment growth in each year around an acceleration.
B. Bars show the share of EMDEs starting a private investment acceleration in each decade.
D.E. Bars and markers show medians.
F. Bars show the increase in the probability of a private investment acceleration following an improvement in economic policy by 1 standard deviation. The right bar shows the increase of an improvement in all variables simultaneously.
The results underscore how effective comprehensive reform packages can be in raising the probability of a private investment acceleration. The combined impact of the policies outlined earlier—improving the primary deficit and liberalizing the trade and capital account simultaneously—is larger than the sum of the impacts of the individual reforms, and would increase the probability of starting an acceleration by almost 11 percentage points (figure B4.1.1.F). In addition, the effect of liberalizing international trade flows is larger for countries with better institutional quality. Table B4.1.2 shows that the interaction between institutional quality and trade reform is positive and significant. Improving institutional quality therefore not only raises an economy’s probability of sparking a private investment acceleration but also increases the impact that economic reforms have on private investment.
Conclusion
There is an urgent need to increase investment to meet climate and development goals. Public investment alone will not be able to fill the gap. Accelerating private investment is therefore a policy priority for EMDEs. This chapter lays out a comprehensive set of policy options to boost private investment growth, recognizing that enacting reforms can be complex and that the right approach depends on country circumstances. This box shows that countries have been successful in boosting private investment growth. Over the past six decades, EMDEs have initiated 85 private investment accelerations, often following implementation of comprehensive reform packages and improvements in institutional quality.
BOX 4.1 Private investment accelerations (continued)
TABLE B4.1.1 Initial conditions and private investment accelerations
Laggedannualinflation
Governmentexpensesto-GDPratio
Source: World Bank.
Note: This table shows the estimated coefficients for the change in log-odds. Investment accelerations are identified as described in box 4.1. Robust standard errors in parentheses. ***, **, and * indicate significance at the 1, 5, and 10 percent levels, respectively.
BOX 4.1 Private investment accelerations (continued)
TABLE
B4.1.2 Correlates of private investment accelerations
LaggedIQ
LaggedGDPpercapita
Laggedcapitaloutputratio
Laggedundervaluationindex
LaggedglobalGDPgrowth
0.093 0.054 0.057 0.037 (1.39) (1.55) (0.87) (1.03) (0.53)
Changeintraderestrictionindex (percent) 0.012*** (2.73)
InteractionoflaggedIQandchangein traderestrictionindex(percent) 0.014** (2.49)
Changeincapitalaccountopenness 0.005*** 0.010*** (2.90) (4.00)
InteractionoflaggedIQandchangein capitalaccountopenness(percent) -0.000 (-0.48)
Changeinprimarybalance(percentof GDP) 0.033* 0.100** (1.87) (2.16)
InteractionoflaggedIQandchangein primarybalance(percentofGDP) 0.016 (1.54)
Adoptionorloweringofinflationtarget (dummy) 1.040*** 1.317*** (3.37)
InteractionoflaggedIQandadoption orloweringofinflationtarget(dummy) -0.103 (-0.57)
Source: World Bank.
Note: This table shows the estimated coefficients for the change in log-odds. Investment per capita growth accelerations are identified as described in box 4.1. IQ = institutional quality. Robust standard errors in parentheses. ***, **, and * indicate significance at the 1, 5, and 10 percent levels, respectively.
ments (Trebilcock and Rosenstock 2015). Policy implementation can fail not only because of limited institutional or administrative capability but also because of the absence of complementary measures needed to help make the chosen policy effective (Andrews, Pritchett, and Woolcock 2017).
Other country characteristics
These three requirements for successful policy implementation—including complementarities, coherence, and implementation capacity—apply to all countries, not just EMDEs. However, they are particularly pertinent for EMDEs, and may matter even more acutely in some EMDE subgroups.
All EMDEs face constraints. Individual country characteristics and circumstances are also important. Between these levels of generality and specificity, there are some commonalities within various EMDE subgroups. The challenges may be greatest for the most vulnerable economies: LICs, FCS, and some small states. These economies often have the weakest starting conditions: limited or inefficient public infrastructure, connectivity issues, low institutional capacity, scant fiscal space, and high uncertainty that often impede firms and hamper investment. In these cases, reforms may initially need to focus on market creation as much as on market development. Riskier investments may require more tailored financing options, with, for example, a larger role for equity; yet it is in these environments that such financial products and support are likely to be most limited (Collier et al. 2021; IEA and IFC 2023). In these countries, persuading firms to invest may also require improved regulatory provisions and oversight to promote formality, as well as measures to strengthen labor force skills. The task in such environments is often particularly difficult. Multiple complex issues may need to be fixed to sustainably strengthen the chain connecting individual policies to increased investment.
Options are narrower in countries with especially limited fiscal space, particularly where access to sovereign borrowing in international financial markets is severely constrained— most obviously in countries in debt distress. In FCS, political instability—in some cases, armed conflict—may make the sustainability of complex, multipronged approaches challenging, but such approaches may nevertheless be the right aspiration (Collier et al. 2021). A sectoral focus could help make the challenges more manageable (OECD 2021).
Small states may face hard limits to what can be achieved by their (necessarily) small bureaucracies with limited infrastructure, underscoring the importance of external support and relationships (including access to overseas financial products). It is sometimes possible to break out of a low-productivity equilibrium through a transformative shock, including in rare cases through pioneering, catalytic individual investments (Collier et al. 2021).
Country examples
Various EMDEs have succeeded in boosting private investment, supported by policy reforms, despite the challenges and trade-offs outlined in this chapter. There is no single, universally applicable optimal approach, but some constructive lessons emerge.
Reforms and private investment growth in Colombia, India, the Republic of Korea, and Türkiye
Colombia, India, Korea, and Türkiye are examples of countries that have implemented multiple macroeconomic and structural reforms in a short period of time, and that have experienced subsequent increases in investment growth following these reforms.4 Figure 4.9 shows that, for these countries during 1973-2012, reforms in the domestic financial sector, external financing, domestic product markets, and international trade coincided with periods of significant increases in private investment growth, as identified in World Bank (2024a). In all these cases, private investment acceleration episodes occurred following a sustained improvement across several of these indicators—although these structural reforms were also occurring alongside broader macroeconomic or political shifts.
Colombia. Colombia experienced an investment acceleration between 2001 and 2007 (figure 4.9.A; World Bank 2024a). During that time, private investment grew faster than public investment. During the acceleration, private investment grew at 12.2 percent—more than six times faster than during nonacceleration years—while public investment growth increased from 4.2 percent to 6.1 percent. The acceleration followed a difficult decade and was preceded by a set of reforms that significantly improved macroeconomic stability. First, a floating exchange rate arrangement was introduced in 1999. Second, in 2000, inflation targeting was adopted, accompanied by several legal measures to improve central bank independence and transparency. Third, government finances improved in the early 2000s, supported by the introduction of tax reforms. Domestic financial markets were strengthened through the privatization and liquidation of public banks as well as improved bank supervision. Significant improvements in administrative procedures also supported the business environment. A combination of top-tier macroeconomic reforms and economywide structural measures, coupled with a period of relative political stability, may have set the stage for the sustained acceleration in investment, including from the private sector.
India. India experienced an investment acceleration from 1994 to 1999 and from 2004 to 2012 (World Bank 2024a). Private investment per capita grew by 4.9 percent in the first episode and 4.5 percent in the second. In both cases, private investment grew faster than public investment. Major structural reforms began in 1991, targeting four major economic distortions (Ahluwalia 2002). First, tariff and nontariff barriers on imports were eased, especially for capital goods. The main reforms liberalizing trade were introduced in 1991, 1995, and 1996 (figure 4.9.B).
Second, capital account restrictions were loosened to allow greater capital inflows. Third, state control of the banking and insurance sectors was reduced to facilitate greater competition and efficiency, leading to increased private sector investment (Panagariya 2004). Reforms in the domestic financial sector and external financing, alongside trade
4 This section closely follows the template in country case studies presented in chapter 2.
FIGURE 4.9 Country examples: Structural reforms and private investment growth accelerations
Liberalizing structural reforms have often preceded or accompanied private investment growth acceleration episodes. Private investment grew more rapidly during reform periods—often across different areas—in the examples of Colombia, India, the Republic of Korea, and Türkiye.
a
liberalization measures, were implemented in the years before and during the investment acceleration. Finally, most public sector monopolies were dismantled—opening opportunities for more efficient private sector firms. These reforms strengthened the private sector, in part by promoting international investment and trade (Ahmad et al. 2018).
Korea. Korea experienced an investment acceleration from 1985 to 1996, and again from 1999 to 2007. An average 8.3-percentage-point increase in annual private investment growth underpinned these two acceleration episodes (World Bank 2024a). In between, however, the country experienced a recession associated with the Asian financial crisis. The investment accelerations were preceded by a comprehensive set of macroeconomic stabilization policies that reduced the number of price controls, removed restrictions on imports, enhanced price stability, strengthened fiscal positions, and improved current account balances. Comprehensive structural reforms that sought to liberalize capital markets and foreign investment also supported the surge in investment (figure 4.9.C; Vashakmadze et al. 2023). Extensive restructuring of corporations
B. India
A. Colombia
Sources: International Monetary Fund; World Bank.
Note: Gray bands highlight
period of investment acceleration as identified in World Bank (2024a). Private investment also grew faster than public investment during these highlighted episodes. Colored lines show liberalization indicator scores, by sector. Last observation is 2014.
D. Türkiye
C. Republic of Korea
and financial institutions strengthened financial soundness, governance, and profitability. In addition, a floating exchange rate system was adopted in late 1997, and an inflation-targeting regime with enhanced central bank independence was established in 1998. These policies supported a surge in investment and contributed to the economic recovery (Lee 2019).
Türkiye. Türkiye experienced an investment acceleration between 2003 and 2008, and then again from 2010 to 2014. Private investment per capita growth averaged 10.6 percent during the first episode and 4.6 percent during the second. In both episodes, private investment growth outstripped public investment growth (World Bank 2024a). Macroeconomic stabilization policies and structural reforms implemented in the early 2000s, partly in response to the 2000-01 economic crisis, laid the foundation for the first of these investment accelerations. Structural reforms were implemented in several areas, including enterprise restructuring and privatization, improvements to the business climate, trade liberalization, labor market liberalization, and comprehensive reform of the banking sector. Major reforms that liberalized external financing and domestic product markets were implemented during the investment acceleration (figure 4.9.D).
The role of the international community
Because of the structural challenges and the scale of the investment gap, EMDEs are unlikely to achieve the private investment increases they need. This is especially true for the most vulnerable economies, which will need significant external support. That support needs to be multifaceted, aiming essentially to raise the risk-adjusted returns expected by private sector investors or to address clearly identified market failures or constraints that are holding back otherwise viable investment.
First, the international community should work to provide an international environment conducive to private investment, including in EMDEs. Important actions include reducing geopolitical tensions, upholding a rules-based international system (including for trade and investment), and promoting cross-border integration. These steps can generate strong economic growth, improve efficiency, and foster a level global playing field, particularly for more vulnerable EMDEs. Large and wealthier economies should also pay due regard to the spillovers of their own policy choices on bystander EMDEs, especially where such policies may involve cross-border distortions. Specifically, in relation to investment in global public goods such as climate change, measures to facilitate, rather than impede, technology transfer (especially to poorer countries with more limited capacity) should be considered.
Second, the international community should more actively support “country-owned” policies in EMDEs, including reforms that can promote a sustained increase in private investment growth. International institutions—and other donors and civil society organizations—should prioritize measures that can support responsible investment, integrating them into wider policy programs. These measures might include, in particular, policies to promote human capital development and sustainable infrastructure investment. There may be particular roles for capacity building, including policies
to strengthen institutions and policy credibility, enhance and harmonize information flows and frameworks, and support governments in addressing externalities amid limited capacity—all of which could reduce uncertainty or costs for firms considering investment decisions. Linking policy and institutional reforms with project financing efforts can also help mitigate risk for firms and leverage complementarities (Lee and Cardenas 2020).
Third, concessional financing can support progress in the most vulnerable countries, which often have limited policy space—especially after the overlapping shocks of recent years. Alternatively, in some contexts, debt suspension or forgiveness initiatives by international creditors may open up space for vital investments in constrained EMDEs. Development finance institutions have an important role to play in providing countercyclical finance to support EMDEs when they are faced with temporarily adverse financial conditions. Backed by stronger financial positions, international donors may also be able to take on greater risks. These measures include supporting both economywide interventions and smaller-scale, pioneering and catalytic investments, especially in the most challenging contexts.
Finally, development finance institutions can further enhance ongoing initiatives to leverage their financing to encourage additional, sustainable private sector resources. This support is core to the mission of various arms of the World Bank Group—most notably the International Finance Corporation and the Multilateral Investment Guarantee Agency—but has also been a feature of recent efforts to integrate development operations. Examples include the new World Bank Group Guarantees Platform, as well as the Private Sector Window under the World Bank’s International Development Association, which includes a local currency facility, a blended finance facility, a risk mitigation facility, and a guarantee facility. Catalytic capital from public or philanthropic sources—particularly if combined with technical and strategic input—can help reduce risks and costs, enhance returns, and thus mobilize private capital (Juneja 2024).
Private investment needs are so large, and the drivers are so multifaceted and complex, that the international community will need to step up its support across all these areas. Individual EMDEs will also need to make sustained and concerted efforts. Unless significant progress is made in sustainably unlocking more private investment to support stronger growth, employment, and other development outcomes, established development goals will slip further out of reach. The resulting setbacks would severely affect human and economic outcomes in EMDEs, with adverse consequences for global stability and prosperity.
Conclusion
The private sector will be pivotal if EMDEs are to succeed in meeting large, growing, and urgent investment needs. Sustainably boosting private investment is a complex policy challenge that will likely involve reforms across different tiers of an economy, tailored to country circumstances and set against a backdrop of limited capacity and resources. The evidence presented in this chapter demonstrates that the challenges to
increasing private investment are often significant and multifaceted, and exist at different tiers of an economy. Some factors may be outside the direct and immediate influence of country authorities. The challenges should not be oversimplified. The number of new trade-distorting measures introduced in recent years, coupled with cuts to official development assistance, complicates the task for many EMDEs. Meanwhile, the scale of the increases required is also daunting and, without action, will grow further.
At the same time, the chapter provides reasons for optimism. Many countries have managed to increase private investment growth over a sustained period following significant policy reform efforts. Structural reforms, often in combination with other measures, seem to have a positive impact on private investment growth. Moreover, under the right terms, boosting private investment would be beneficial not just for firms but also for national authorities and their populations, and for the international community as a whole. Firms benefit from investing in environments with higher risk-adjusted returns and fewer constraints. For EMDEs, boosting private investment is essential to drive stronger growth, job creation, and improved development outcomes. It is also critical for achieving global development goals, making it firmly in the interest of the international community to support vulnerable EMDEs in mobilizing private investment. Policy makers at the domestic and international levels must renew their focus on reforms that boost private investment by improving firms’ risk-adjusted returns, addressing market failures, and easing constraints. Without such progress, investment gaps will continue widening, and development and climate goals will slip further out of reach both nationally and globally.
ANNEX 4A The effects of structural reforms on private investment
Local projections models are commonly used in macroeconomics to estimate the dynamic, causal effects of a shock, or an intervention, on an outcome (Jordà 2023). This chapter uses local projections to quantify the effects of structural reform liberalization on private investment. Specifically, it estimates the dynamic evolution of private investment following a major liberalizing reform—identified as an improvement of 1 standard deviation or more in a reform indicator for a country in a single year over the five-year period following the reform.
The model uses annual data for a balanced sample of 90 countries, including 29 advanced economies and 61 EMDEs, of which five are LICs, with a broad geographical representation. The sample period of 1973-2014 is chosen on the basis of data availability for all indicators.
Data on structural reforms are obtained from the International Monetary Fund (IMF) Structural Reforms Database. Specifically, the analysis uses variables in four areas of structural reform:
• Domestic financial sector. This indicator takes into account six variables: credit controls, interest rate controls, bank entry barriers, banking supervision, privatization, and securities market development.
• External current and capital accounts. These indicators contain information about policy in six areas: payments for goods imports, receipts from goods exports, payments for invisible imports, receipts from invisible exports, capital flows by residents, and capital flows by nonresidents.5
• Trade. This indicator measures product-level tariffs, for which simple and weighted averages are calculated; weights are based on each product’s import share.
• Product market. This indicator covers liberalization in the two network sectors (electricity and telecommunications) for which reliable data are available.
Indicators of regulation from the IMF database are scaled from 0 (low liberalization) to 1 (high liberalization). Differences across countries and over time indicate variations in the restrictiveness of policies and regulations within each sector.6 Five additional variables are used in the modeling exercise. Private investment is sourced from the IMF Investment and Capital Stock Dataset. GDP, consumer price inflation, and primary balance are sourced from the IMF’s World Economic Outlook databases. An indicator of the year of legislative or executive election is sourced from the Inter-American Development Bank’s Database of Political Institutions.
5 Invisible imports and exports are largely services.
6 Full documentation of the data compilation underlying the IMF Structural Reform Database is available at https://data.imf.org/en/datasets/IMF.RES:SRD.
The local projection method of Jordà (2005) has been used to trace the private investment dynamic following reforms (Alesina et al. 2024; Auerbach and Gorodnichenko 2013; Ramey and Zubairy 2018). This procedure does not impose dynamic restrictions embedded in vector autoregression specifications and is particularly suited to estimating nonlinearities in the dynamic response. Following Alesina et al. (2024), the following model is used:
group)
(4A.1)
where y is the log of private investment; αi represents country fixed effects, included to account for differences in countries’ average growth rates; γt represents time fixed effects, included to take into account global shocks such as shifts in oil prices or the global business cycle; I (income group) is a group dummy for advanced economies, EMDEs excluding LICs, and LICs; and Ri,m,t represents the reform index, which rises with the degree of liberalization—a liberalizing reform has a positive value of ΔRi,m,t and a more restrictive reform has a negative value. Xi,t is a set of control variables, including two lags of the dependent variable, two lags of the change in the reform indicator, and countryspecific time trends (growth of GDP, lag of inflation, lag of output gap, and year of election). Xi,t contains the output gap to control for reversion-to-mean growth. The output gap is calculated using the Hodrick-Prescott filter with high smoothing (λ = 100), as recommended in Jordà and Taylor (2016). Lags of inflation, the output gap, and election variables are included to control for endogeneity concerns. Reforms are more likely to happen under certain political and economic contexts (de Haan and Wiese 2022).7 Ri,m,t is either an aggregate reform index, the average of all subindicators, or a reform index for certain policies including reforms of the product market, domestic financing, external financing, and trade sectors. The reform variable ΔRi,m,t is treated as a continuous (rather than as a binary) variable, because individual reforms are best described as lying on a continuum rather than as dichotomic events of similar intensity (Alesina et al. 2024). Treating a continuous variable as discrete introduces measurement error.
Structural reforms can be complements or substitutes. A variation of the local projections model, with interaction terms, is used to assess the effect of simultaneously implemented reforms:
(income group)
group)
where INT represents different interaction terms:
• Global historical uncertainty, from Caldara and Iacoviello (2022)
• Timing in the electoral cycle, measured with respect to a year of election
7 De Haan and Wiese (2022) study the impact of binary labor and product market reforms on growth in Organisation for Economic Co-operation and Development countries using an augmented inverse probabilityweighted estimator to control for endogeneity. The reform indicator used here is continuous; therefore, the same technique cannot be applied to control for endogeneity. Instead, the estimation includes the variables that matter directly in the regression, which includes both time and country fixed effects.
• I (ref j t-3,...t ) is a dummy equal to 1 if a major reform of type j was passed in the prior three years. A major reform is defined as an improvement of 1 standard deviation or more in a reform indicator.
Equations (4A.1) and (4A.2) are estimated for each k = 1,…,5. Impulse response functions are computed using the estimated coefficients, and the confidence bands associated with the estimated impulse response functions are obtained from the estimated standard errors of the coefficients, based on robust standard errors clustered at the country level.
Two reforms are considered substitutes if, after a country has enacted one reform, the increase in private investment resulting from enacting the other reform decreases. Similarly, two policies are complements if, after a country has enacted one reform, the increase in private investment resulting from enacting the other reform increases. Using equation (A4.1.2), policies m and j are complements if δk,m/j ≥ 0 and are substitutes if δk,m/j ≤ 0.
References
Abeberese, A. B., C. G. Ackah, and P. O. Asuming. 2021. “Productivity Losses and Firm Responses to Electricity Shortages: Evidence from Ghana.” World Bank Economic Review 35 (1): 1-18.
Acemoglu, D., P. Aghion, L. Barrage, and D. Hémous. 2023. “Green Innovation and the Transition Toward a Clean Economy.” Working Paper 23-14, Peterson Institute for International Economics, Washington, DC.
Acemoglu, D., S. Johnson, and J. A. Robinson. 2001. “The Colonial Origins of Comparative Development: An Empirical Investigation.” American Economic Review 91 (5): 1369-401.
African Development Bank. 2022. Electricity Regulatory Index for Africa 2022. Abidjan: African Development Bank. https://africa-energy-portal.org/reports/electricityregulatory-index-africa-2022-eri.
Aghion, P., A. Dechezleprêtre, D. Hémous, R. Martin, and J. Van Reenen. 2016. “Carbon Taxes, Path Dependency, and Directed Technical Change: Evidence from the Auto Industry.” Journal of Political Economy 124 (1): 1-51.
Ahir, H., N. Bloom, and D. Furceri. 2022. “The World Uncertainty Index.” NBER Working Paper 29763, National Bureau of Economic Research, Cambridge, MA.
Ahluwalia, M. 2002. “Economic Reforms in India since 1991: Has Gradualism Worked?” Journal of Economic Perspectives 16 (3): 67-88.
Ahmad, J. K., F. M. Blum, P. Gupta, and D. Jain. 2018. “India’s Growth Story.” Policy Research Working Paper 8599, World Bank, Washington, DC.
Aido, S., C. Fu, F. Roch, and U. Wiriadinata. 2023. “How Large Is the Sovereign Greenium?” IMF Working Paper 23/080, International Monetary Fund, Washington, DC.
Alesina A., D. Furceri, J. D. Ostry, C. Papageorgiou, and D. P. Quinn. 2024. “Structural Reforms and Elections: Evidence from a World-Wide New Dataset.” Journal of the European Economic Association 22 (4): 1936-80.
Andrews, M., L. Pritchett, and M. Woolcock. 2017. Building State Capability: Evidence, Analysis, Action. Oxford, U.K.: Oxford University Press.
Arezki, R., P. Bolton, S. Peters, F. Samama, and J. Stiglitz. 2017. “From Global Savings Glut to Financing Infrastructure.” Economic Policy 32 (90): 221-61.
Artuc, E, R. J. Cull, S. Dasgupta, R. Fattal Jaef, D. Filmer, X. Gine, H. Jacoby, et al. 2020. “Toward Successful Development Policies: Insights from Research in Development Economics.” Policy Research Working Paper 9133, World Bank, Washington, DC.
Auerbach, A. J., and Y. Gorodnichenko. 2013. “Output Spillovers from Fiscal Policy.” American Economic Review 103 (3): 141-46.
Banga, A. 2025. “Development Is How We Compete, Grow, and Stay Secure.” Voices (blog), April 3, 2025. https://blogs.worldbank.org/en/voices/development-is-how-wecompete-grow-and-stay-secure.
Barteska, P. 2024. “Bureaucrats and the Korean Export Miracle.” Unpublished PhD thesis, London School of Economics and Political Science, London.
Bayliss, K., and E. Van Waeyenberge. 2018. “Unpacking the Public Private Partnership Revival.” Journal of Development Studies 54 (4): 577-93.
Benitez, J. C., M. Mansour, M. Pecho, and C. Vellutini. 2023. “Building Tax Capacity in Developing Countries.” IMF Staff Discussion Note 2023/006, International Monetary Fund, Washington, DC.
Besley, T., R. Burgess, A. Khan, and G. Xu. 2022. “Bureaucracy and Development.” Annual Review of Economics 14 (1): 397-424.
Bhattacharya, A., M. Dooley, H. Kharas, and C. Taylor. 2022. “Financing a Big Investment Push in Emerging Markets and Developing Economies for Sustainable, Resilient and Inclusive Recovery and Growth.” Grantham Research Institute on Climate Change and the Environment, London School of Economics and Political Science, London.
Black, S., A. Liu, I. Parry, and N. Vernon. 2023. “IMF Fossil Fuel Subsidies Data: 2023 Update.” IMF Working Paper 23/169, International Monetary Fund, Washington, DC.
Black, S., I. Parry, and J. Roaf. 2021. “Proposal for an International Carbon Price Floor among Large Emitters.” IMF Staff Climate Note 2021/001, International Monetary Fund, Washington, DC.
Blimpo, M., J. T. Mensah, K. O. Opalo, and R. Shi. 2018. “Electricity Provision and Tax Mobilization in Africa.” Policy Research Working Paper 8408, World Bank, Washington, DC.
Brenton, P., M. J. Ferrantino, and M. Maliszewska. 2022. Reshaping Global Value Chains in Light of COVID-19: Implications for Trade and Poverty Reduction in Developing Countries. Washington, DC: World Bank.
Briceno-Garmendia, C., and M. Shkaratan. 2011. “Power Tariffs: Caught between Cost Recovery and Affordability.” Policy Research Working Paper 5904, World Bank, Washington, DC.
Brunetti, A., and B. Weder. 1998. “Investment and Institutional Uncertainty: A Comparative Study of Different Uncertainty Measures.” Review of World Economics 134 (3): 513-33.
Budina, N., C. Ebeke, F. Jaumotte, A. Medici, A. Panton, M. Tavares, and B. Yao. 2023. “Structural Reforms to Accelerate Growth, Ease Policy Trade-Offs, and Support
the Green Transition in Emerging and Developing Economies.” Staff Discussion Note SDN/2023/007, International Monetary Fund, Washington, DC
Caldara, D., and M. Iacoviello. 2022. “Measuring Geopolitical Risk.” American Economic Review 112 (4): 1194-225.
Caldara, D., M. Iacoviello, P. Molligo, A. Prestipino, and A. Raffo. 2020. “The Economic Effects of Trade Policy Uncertainty.” Journal of Monetary Economics 109 (January): 38-59.
Celani, A., L. Dressler, and M. Wermelinger. 2022. “Building an Investment Tax Incentives Database: Methodology and Initial Findings for 36 Developing Countries.” OECD Working Papers on International Investment 2022/01, Organisation for Economic Co-operation and Development, Paris.
Chang, R., L. Kaltani, and N. V. Loayza. 2009. “Openness Can Be Good for Growth: The Role of Policy Complementarities.” Journal of Development Economics 90 (1): 3349.
Chinn, M., and H. Ito. 2008. “A New Measure of Financial Openness.” Journal of Comparative Policy Analysis 10 (3): 309-22.
Chrimes, T., B. Gootjes, M. A. Kose, and C. Wheeler. 2024. The Great Reversal: Prospects, Risks, and Policies in International Development Association (IDA) Countries Washington, DC: World Bank.
Cloyne, J., C. Ferreira, M. Froemel, and P. Surico. 2018. “Monetary Policy, Corporate Finance and Investment.” NBER Working Paper 23566, National Bureau of Economic Research, Cambridge, MA.
Collier, P., and J. Cust. 2015. “Investing in Africa’s Infrastructure: Financing and Policy Options.” Annual Review of Resource Economics 7 (1): 473-93.
Collier, P., S. Kriticos, S. Logan, and C. Sacchetto. 2021. “Strengthening Development Finance in Fragile Contexts.” LSE Research Online Documents on Economics 111560, London School of Economics and Political Science, London.
Coolidge, J., and D. Ilic. 2009. “Tax Compliance Perceptions and Formalization of Small Businesses in South Africa.” Policy Research Working Paper 4992, World Bank, Washington, DC.
Cull, R., I. Gill, A. Pedraza, C. Ruiz-Ortega, and F. Zeni. 2024. “Mobilizing Private Capital for the Sustainable Development Goals.” Policy Research Working Paper 10838, World Bank, Washington, DC.
Dabla-Norris, E., F. Misch, D. Cleary, and M. Khwaja. 2017. “Tax Administration and Firm Performance: New Data and Evidence for Emerging Market and Developing Economies.” IMF Working Paper 17/95, International Monetary Fund, Washington, DC.
De Haan, J., K. Stamm, and S. Yu. 2025. “Drivers of Investment Accelerations.” Structural Change and Economic Dynamics 73 (June): 196-210.
De Haan, J. and R. Wiese. 2022. “The Impact of Product and Labour Market Reform on Growth: Evidence for OECD Countries Based on Local Projections.” Journal of Applied Econometrics 37 (4): 746-70.
Djankov, S., T. Ganser, C. McLiesh, R. Ramalho, and A. Shleifer. 2010. “The Effect of Corporate Taxes on Investment and Entrepreneurship.” American Economic Journal: Macroeconomics 2 (3): 31-64.
Dom, R., A. Custers, S. Davenport, and W. Prichard. 2022. Innovations in Tax Compliance: Building Trust, Navigating Politics, and Tailoring Reform. Washington, DC: World Bank.
Duranton, G., and A. J. Venables. 2018. “Place-Based Policies for Development.” NBER Working Paper 24562, National Bureau of Economic Research, Cambridge, MA.
EBRD (European Bank for Reconstruction and Development). 2024. Transition Report 2024-25: Navigating Industrial Policy. London: EBRD.
Echandi, R., M. Maliszewska, and V. Steenbergen. 2022. Making the Most of the African Continental Free Trade Area: Leveraging Trade and Foreign Direct Investment to Boost Growth and Reduce Poverty. Washington, DC: World Bank.
Eyraud, L., H. Devine, A. P. Alva, H. Selim, P. Sharma, and L. Wocken. 2021. “Private Finance for Development: Wishful Thinking or Thinking Out of the Box?” IMF Departmental Paper 21/11, International Monetary Fund, Washington, DC.
Fabre, A., and S. Straub. 2023. “The Impact of Public-Private Partnerships (PPPs) in Infrastructure, Health, and Education.” Journal of Economic Literature 61 (2): 655-715.
Feenstra, R. C., R. Inklaar, and M. P. Timmer. 2015. “The Next Generation of the Penn World Table.” American Economic Review 105 (10): 3150-82.
Fiestas, I., and S. Sinha. 2011. “Constraints to Private Investment in the Poorest Developing Countries—A Review of the Literature.” Nathan Associates, London.
Fleta-Asín, J., and F. Muñoz. 2021. “Renewable Energy Public-Private Partnerships in Developing Countries: Determinants of Private Investment.” Sustainable Development 29(4): 653-70.
Fontagné, L., N. Rocha, M. Ruta, and G. Santoni. 2023. “The Economic Impact of Deepening Trade Agreements.” World Bank Economic Review 37 (3): 366-88.
Fouad, M., C. Matsumoto, R. Monteiro, I. Rial, and O. Aydin. 2021. “Mastering the Risky Business of Public-Private Partnerships in Infrastructure.” IMF Departmental Paper 21/11, International Monetary Fund, Washington, DC.
FSB (Financial Stability Board). 2018. Evaluation of the Effects of Financial Regulatory Reforms on Infrastructure Finance. Basel: FSB.
Furceri, D., S. Hannan, J. Ostry, and A. Rose. 2022. “The Macroeconomy After Tariffs.” World Bank Economic Review 36 (2): 361-81.
Galal, R. 2024. “Place-Based Preferential Policies and Firm Performance.” Policy Research Working Paper 10781, World Bank, Washington, DC.
Gouled, M. 2024. “5 Ways to Unlock Private Capital to Tackle Climate Change.” Voices (blog), August7, 2024. https://blogs.worldbank.org/en/voices/5-ways-to-unlockprivate-capital-to-tackle-climate-change.
Handley, K. 2014. “Exporting under Trade Policy Uncertainty: Theory and Evidence.” Journal of International Economics 94 (1): 50-66.
Harris, C. 2003. Private Participation in Infrastructure in Developing Countries: Trends, Impacts, and Policy Lessons. Working Paper 5. Washington, DC: World Bank.
Hausmann, R., L. Pritchett, and D. Rodrik. 2005. “Growth Accelerations.” Journal of Economic Growth 10 (4): 303-29.
Herrera, M., V. Foster, A. Musacchio, T. Ter-Minassian, and B. Turkgulu. 2023. Off the Books: Understanding and Mitigating the Fiscal Risks of Infrastructure. Washington, DC: World Bank.
Hjort, J., and L. Tian. 2025. “The Economic Impact of Internet Connectivity in Developing Countries.” Annual Review of Economics 17: 99-124.
Hofmann, C., A. Osnago, and M. Ruta. 2017. “Horizontal Depth: A New Database on the Content of Preferential Trade Agreements.” Policy Research Working Paper 7981, World Bank, Washington, DC.
Huang, Y., M. Pagano, and U. Panizza. 2020. “Local Crowding Out in China.” Journal of Finance 75 (6): 2855-98.
Huang, Y., U. Panizza, and R. Varghese. 2018. “Does Public Debt Crowd Out Corporate Investment? International Evidence.” CEPR Discussion Paper 12931, Centre for Economic Policy Research, Paris and London.
IEA (International Energy Agency) and IFC (International Finance Corporation). 2023. Scaling up Private Finance for Clean Energy in Emerging and Developing Economies. Paris: IEA.
IMF (International Monetary Fund). 2020. “Toward an Integrated Policy Framework.” IMF Policy Paper 20/46, IMF, Washington DC.
IMF (International Monetary Fund). 2021. “What’s New in the IMF Investment and Capital Stock Dataset.” IMF, Washington, DC.
IMF (International Monetary Fund). 2024. Fiscal Monitor: Fiscal Policy in the Great Election Year. Washington, DC: IMF.
Jones, B. F., and L. H. Summers. 2022. “A Calculation of the Social Returns to Innovation.” In Innovations in Public Policy, edited by A. Goolsbee and B. F. Jones, 13-59. Chicago: University of Chicago Press.
Jong-A-Pin, R., and J. de Haan. 2011. “Political Regime Change, Economic Liberalization and Growth Accelerations.” Public Choice 146 (1-2): 93-115.
Jordà, Ò. 2005. “Estimation and Inference of Impulse Responses by Local Projections.” American Economic Review 95 (1): 161-82.
Jordà, Ò. 2023. “Local Projections for Applied Economics.” Working Paper 2023-16, Federal Reserve Bank of San Francisco, San Francisco, CA.
Jordà, O., and A. M. Taylor. 2016. “The Time for Austerity: Estimating the Average Treatment Effect of Fiscal Policy.” Economic Journal 126 (590): 219-55.
Juhász, R., N. J. Lane, and D. Rodrik. 2023. “The New Economics of Industrial Policy.” NBER Working Paper 31538, National Bureau of Economic Research, Cambridge, MA.
Juneja, M. K. 2024. “How Blended Finance Can Reorient Cautious Private Investors to Infrastructure.” Getting Infrastructure Financing Right (blog), August 7, 2024. https:// blogs.worldbank.org/en/ppps/how-blended-finance-can-reorient-cautious-privateinvestors-to-i.
Karlan, D., R. Osei, I. Osei-Akoto, and C. Udry. 2014. “Agricultural Decisions after Relaxing Credit and Risk Constraints.” Quarterly Journal of Economics 129 (2): 597-652.
Kasyanenko, S., P. Kenworthy, F. U. Ruch, E. Vashakmadze, D. Vorisek, and C. Wheeler. 2023. “Investment in Emerging Market and Developing Economy Regions: Trends, Prospects and Policy Options.” Policy Research Working Paper 10369, World Bank, Washington, DC.
Kessides, I. 2005. “Infrastructure Privatization and Regulation: Promises and Perils.” World Bank Research Observer 20 (1): 81-108.
Kher, P., and D. Chun. 2020. “Policy Options to Mitigate Political Risk and Attract FDI.” World Bank, Washington DC.
Kose, M. A., S. Kurlat, F. Ohnsorge, and N. Sugawara. 2022. “A Cross-Country Database of Fiscal Space.” Journal of International Money and Finance 128 (November): 102682.
Kose, M. A., and F. Ohnsorge, eds. 2024. Falling Long-Term Growth Prospects: Trends, Expectations, and Policies. Washington, DC: World Bank.
Kose, M. A., F. Ohnsorge, L. S. Ye, and E. Islamaj. 2017. “Weakness in Investment Growth: Causes, Implications and Policies.” Policy Research Working Paper 7990, World Bank, Washington, DC.
Laeven, L., and F. Valencia. 2020. “Systemic Banking Crises Database II.” IMF Economic Review 68 (2): 307-61.
Lam, D., and M. Leibbrandt. 2023. “Demographic Challenges for Global Labor Markets in the 21st Century, Africa in a Changing World.” Working Paper 303, Southern Africa Labour and Development Research Unit and African Centre of Excellence for Inequality Research, University of Cape Town.
Lee, J.-W. 2019. “Twenty Years after the Financial Crisis in the Republic of Korea: The Development of Financial Markets, Policy Frameworks, and Institutions.” East Asian Community Review 2 (1): 75-100.
Lee, N., and M. Cardenas. 2020. “The Future of Private Finance for Development in Poor Countries.” Center for Global Development, Washington, DC.
Libman, E., J. Montecino, and A. Razmi. 2019. “Sustained Investment Surges.” Oxford Economic Papers 71 (4): 1071-95.
Marcuss, R., G. Contos, J. Guyton, P. Langetieg, A. Lerman, S. Nelson, B. Schafer, and M. Vigil. 2013. “Income Taxes and Compliance Costs: How Are They Related?” National Tax Journal 66 (4): 833-54.
Marius Adom, I., and I. Schott. 2024. “Input Delays, Firm Dynamics, and Misallocation in Sub-Saharan Africa.” Review of Economic Dynamics 53 (July): 147-72.
Mawejje, J. 2024. “Private Sector Participation in Infrastructure in Emerging Market and Developing Economies: Evolution, Constraints, and Policies.” Global Policy 15 (2): 465-74.
Mawejje, J., and R. K. Sebudde. 2019. “Tax Revenue Potential and Effort: Worldwide Estimates Using a New Dataset.” Economic Analysis and Policy 63 (September): 119-29.
Mazzucato, M., and D. Rodrik. 2023. “Industrial Policy with Conditionalities: A Taxonomy and Sample Cases.” Working Paper 2023-07, UCL Institute for Innovation and Public Purpose, University College London.
McKenzie, D. 2023. “Is There Still a Role for Direct Government Support to Firms in Developing Countries?” Policy Research Working Paper 10628, World Bank, Washington, DC.
McKenzie, D., and C. Woodruff. 2014. “What Are We Learning from Business Training and Entrepreneurship Evaluations around the Developing World?” World Bank Research Observer 29 (1): 48-82.
Moore, A., S. Straub, and J. J. Dethier. 2014. “Regulation, Renegotiation and Capital Structure: Theory and Evidence from Latin American Transport Concessions.” Journal of Regulatory Economics 45 (January): 209-32.
Mumtaz, H., and F. Ruch. 2023. “Policy Uncertainty and Aggregate Fluctuations: Evidence from Emerging and Developed Economies.” Policy Research Working Paper 10564, World Bank, Washington, DC.
OECD (Organisation for Economic Co-operation and Development). 2015. Infrastructure Financing Instruments and Incentives. Paris: OECD.
OECD (Organisation for Economic Co-operation and Development). 2021. “Investment Policy in Fragile Contexts.” In Middle East and North Africa Investment Policy Perspectives. Paris: OECD.
Ohnsorge, F., and L. Quaglietti. 2023. “Trade as an Engine of Growth: Sputtering but Fixable.” Policy Research Working Paper 10356, World Bank, Washington, DC.
Panagariya, A. 2004. “India in the 1980s and 1990s: A Triumph of Reforms.” IMF Working Paper 04/43, International Monetary Fund, Washington, DC.
Poirson, H. 1998. “Economic Security, Private Investment, and Growth in Developing Countries.” IMF Working Paper 98/4, International Monetary Fund, Washington, DC.
Pop, G., and D. Connon. 2020. “Industrial Policy Effects and the Case for Competition.” EFI Insight-Trade, Investment, and Competitiveness, World Bank, Washington, DC.
PRS Group (Political Risk Services) database. “The International Country Risk Guide (ICRG).” https://prsgroup.com/exploreour-products/icrg.
Ramey, V., and S. Zubairy. 2018. “Government Spending Multipliers in Good Times and in Bad: Evidence from US Historical Data.” Journal of Political Economy 126 (2): 850-901.
Ray, S. 2015. “Infrastructure Finance and Financial Sector Development.” ADBI Working Paper 522, Asian Development Bank Institute, Tokyo.
Reva, A. 2015. “Toward a More Business Friendly Tax Regime: Key Challenges in South Asia.” Policy Research Working Paper 7513, World Bank, Washington, DC.
Rodrik, D. 2008. “The Real Exchange Rate and Economic Growth.” Social and Economic Studies 56 (2): 365-412.
Rodrik, D. 2009. "Industrial Policy: Don’t Ask Why, Ask How." Middle East Development Journal 1(1): 1-29.
Stern, N. 2007. The Economics of Climate Change. The Stern Review. Cambridge, U.K.: Cambridge University Press.
Tan, J. 2011. “Infrastructure Privatization: Oversold, Misunderstood and Inappropriate.” Development Policy Review 29 (1): 47-74.
Trebilcock, M., and M. Rosenstock. 2015. “Infrastructure Public-Private Partnerships in the Developing World: Lessons from Recent Experience.” Journal of Development Studies 51 (4): 335-54.
Trimble, C., M. Kojima, P. A. Ines, and M. Farah. 2016. “Financial Viability of Electricity Sectors in Sub-Saharan Africa: Quasi-Fiscal Deficits and Hidden Costs.” Policy Research Working Paper 7788, World Bank, Washington, DC.
Trinks, A. and E. Hille. 2023. “Carbon Costs and Industrial Firm Performance: Evidence from International Microdata.” CPB Discussion Paper 445, CPB Netherlands Bureau for Economic Policy Analysis, The Hague, Netherlands.
Vashakmadze, T., J. Ha, D. Fukuzawa, J. Zhou, W. Choi, S. Chung, and J. Pyun. 2023. “Leveraging Global Integration and International Trade.” In Innovative Korea: Leveraging Innovation and Technology for Development, edited by H. Soh, Y. Koh, and A. Aridi, 121-63. Washington, DC: World Bank.
WDI (database). World Development Indicators. World Bank. https://databank. worldbank.org/source/world-development-indicators.
World Bank. 2019. Global Economic Prospects. June. Washington, DC: World Bank.
World Bank. 2020. The African Continental Free Trade Area: Economic and Distributional Effects. Washington, DC: World Bank.
World Bank. 2022a. “Business Enabling Environment Concept Note.” World Bank, Washington, DC.
World Bank. 2022b. Climate and Development: An Agenda for Action—Emerging Insights from World Bank Group 2021-22 Country Climate and Development Reports. Washington, DC: World Bank.
World Bank. 2023a. Global Economic Prospects. June. Washington, DC: World Bank.
World Bank. 2023b. Annual Report: A New Era in Development. Washington, DC: World Bank.
World Bank. 2023c. Unfair Advantage: Distortive Subsidies and Their Effects on Global Trade. Equitable Growth, Finance and Institutions Insight. Washington, DC: World Bank.
World Bank. 2023d. Global Economic Prospects. January. Washington, DC: World Bank.
World Bank. 2023e. State and Trends of Carbon Pricing 2023. Washington, DC: World Bank.
World Bank. 2024a. Global Economic Prospects. January. Washington, DC: World Bank.
World Bank. 2024b. Global Economic Prospects. June. Washington, DC: World Bank.
World Bank. 2024c. South Asia Development Update: Jobs for Resilience. April. World Bank, Washington, DC.
World Bank. 2025. Global Economic Prospects. January. Washington, DC: World Bank.
World Bank and Energy Charter Secretariat. 2023. Enabling Foreign Direct Investment in Renewable Energy Sector: Reducing Regulatory Risks and Preventing Investor-State Conflicts. Washington, DC: World Bank.
… Investment is the fuel for sustainable development.
António Guterres (2024)
Secretary-General, United Nations

CHAPTER 5
Foreign Direct Investment in Retreat: Policies to Turn the Tide

Foreign direct investment (FDI) inflows to emerging market and developing economies (EMDEs) have steadily weakened, to about 2 percent of gross domestic product (GDP) in the last several years—less than half the share at the peak in 2008. This trend jeopardizes economic development. FDI inflows are a vital source of funding to catalyze economic growth, facilitate domestic private capital mobilization, and create jobs. FDI inflows are especially critical for low-income countries (LICs), where domestic capital resources are scarce and infrastructure gaps are vast. In EMDEs, on average, a 10 percent increase in net FDI inflows is associated with a GDP boost of 0.3 percent after three years. The effects rise to 0.8 percent in countries with greater trade openness, stronger institutions, better human capital development, and lower informality. FDI inflows to EMDEs—composed mostly of greenfield investment—are strongly correlated with economic growth and international trade. Because of elevated trade tensions, policy uncertainty, and heightened macroeconomic and geopolitical risks, the outlook for FDI flows remains subdued. Policy makers in EMDEs need to accelerate domestic reforms that will help attract FDI and amplify its benefits. All countries need to work to advance global cooperation to uphold a rules-based system that promotes cross-border investment and trade flows.
Introduction
Investment growth across the world has trended down since the 2008-09 global financial crisis.1 In EMDEs, the average annual investment growth rate halved, dropping from about 10 percent in the 2000s to 5 percent in the 2010s—the slowest pace in three decades, reflecting weakness in both public and private investment growth (chapter 1). The slowdown occurred in all EMDE regions and income groups, and in commodityexporting and commodity-importing countries (Kose and Ohnsorge 2024).
The prolonged and widespread investment weakness in EMDEs has contributed to a large backlog of unmet infrastructure needs. Weak investment growth is undermining efforts to achieve key development goals, including tackling climate change and accelerating the energy transition, and reducing poverty and inequality. By some estimates, EMDEs need to invest at least an additional 1.4 percent of GDP through 2030 just to address climate change and the energy transition. These needs are especially large in LICs, which are estimated to require an additional annual investment of 8 percent of GDP through 2030 (chapter 1; World Bank 2022a).
Note: This chapter was prepared by Amat Adarov and Hayley Pallan, with contributions by Peter Pedroni.
1 “Investment” refers to gross fixed capital formation. For details about the slowdown in investment growth, refer to World Bank (2023a, 2024a). On investment needs, refer to Kose and Ohnsorge (2024), Rozenberg and Fay (2019), and World Bank (2022a).
FDI, which has averaged almost $2 trillion per year globally during the past decade, can be an important source of financing for investment needs in EMDEs, especially in countries with scarce domestic capital and large infrastructure gaps. For instance, over the period 2012-23, median net FDI inflows to EMDEs averaged about 3 percent of GDP—similar to the average levels of remittance inflows or net official development assistance inflows—while median portfolio inflows amounted to less than 1 percent of GDP over the same period.2 However, the potential benefits of FDI extend far beyond the provision of funding. FDI inflows can spur technology spillovers, efficiency gains, job creation, and productivity improvements, leading to higher workers’ compensation. FDI also enables domestic firms to access cross-border production networks and markets. Consequently, FDI can boost economic growth and foster equitable economic development, helping recipient economies address poverty and inequality, and bridge gender gaps.
FDI inflows bring private long-term capital to the recipient economy from abroad, while also promoting domestic private capital mobilization. FDI can spur the modernization of infrastructure and encourage the provision of goods and services by foreignowned firms to domestic companies, thereby enabling and expanding their business operations and inducing additional investment. FDI signals profitable investment opportunities, which can crowd in private investment by domestic and foreign investors. FDI can also aid the transition to cleaner energy and facilitate adaptation to climate change in EMDEs, by channeling capital to sustainable projects and climate-resilient infrastructure and by transferring environmentally friendly technologies and business practices.
The sharp increase in global FDI flows during the 2000s coincided with a growth acceleration in many EMDEs. However, that period was followed by a broad-based slowdown in FDI inflows during the 2010s as macroeconomic shocks and structural headwinds to investment were accompanied by a rise in global economic fragmentation fueled by concerns about access by foreign firms to domestic assets and sectors sensitive from a national security standpoint. Heightened trade tensions and fragmentation, alongside policy uncertainty and macroeconomic risks, are likely to continue to weigh on investment flows and reshape global FDI patterns—posing challenges for EMDEs and calling for prompt policy action.
Against this backdrop, this chapter presents a comprehensive assessment of FDI inflows to EMDEs. The analysis addresses the following main questions:
• How have global FDI flows evolved, particularly to EMDEs?
2 The analysis in this chapter focuses on net FDI inflows (gross FDI inflows less disinvestment), unless otherwise stated. The data on net FDI inflows are from the World Bank’s World Development Indicators database. FDI is defined as cross-border investment made by a resident in one economy in an enterprise residing in another economy, with the objective of establishing a lasting interest. This definition follows the Organisation for Economic Co-operation and Development Benchmark Definition of FDI (OECD 2009, 2025), which sets a consolidated framework for compiling FDI statistics and discusses specific criteria for determining the lasting interest, measurement issues, taxonomy, and other conceptual aspects. For measurement issues, including round-tripping and phantom FDI, refer to Aykut, Sanghi, and Kosmidou (2017) and Damgaard, Elkjaer, and Johannesen (2024).
• What are the macroeconomic implications of FDI for EMDEs?
• What are the main factors driving FDI?
• What policies can help EMDEs attract FDI and maximize its benefits?
Contributions. The chapter makes several contributions to the literature.
Review of FDI trends with a special focus on EMDEs. The literature on FDI has mostly explored short-run dynamics and devoted limited attention to EMDEs. This chapter offers a broader historical perspective on the evolution of FDI and examines the principal differences in FDI between EMDEs and advanced economies. It also analyzes the evolution of FDI during major adverse events, such as recessions and financial crises.
Examination of the macroeconomic implications of FDI. The chapter provides a detailed account of the macroeconomic effects of FDI with a focus on EMDEs, including its implications for economic growth and the energy transition. The analysis examines a wide range of effects across EMDEs and identifies the conditions under which the benefits of FDI have been greatest.
Analysis of the key factors driving FDI. The chapter offers a detailed analysis of push, pull, global, and bilateral drivers of FDI, including the implications of international integration and fragmentation. Although previous research has analyzed many of these factors separately, this chapter integrates them into a consistent empirical framework using consolidated bilateral FDI data for a large sample of countries over a period spanning several decades.
Priorities for national and global policy makers. The chapter presents a detailed set of policy interventions that governments in EMDEs can pursue to attract FDI and maximize its benefits in the context of arising challenges. It also examines global policy priorities needed to facilitate cross-border cooperation and reduce the potential costs of global economic fragmentation.
Findings. The chapter presents the following key findings.
FDI inflows to EMDEs as a share of GDP have weakened considerably, halving in 2012-23 relative to 2000-11. Net FDI inflows as a share of GDP in EMDEs have trended downward since the global financial crisis, reversing a prior two-decade rise driven by rapid financial integration, international trade growth, and the expansion of global value chains. During the boom years of 2000-08, FDI inflows to EMDEs grew fivefold, and their share of global FDI expanded from one-tenth to one-third. Since 2008, the nominal value of FDI inflows to EMDEs has averaged about $700 billion per year, yet inflows relative to EMDEs’ GDP have declined significantly. In EMDEs, the median FDI-to-GDP ratio peaked at about 5 percent in 2008 but has since more than halved, standing at just over 2 percent in 2023. Three-fifths of EMDEs experienced a decline in FDI inflows in 2012-23 relative to 2000-11. Recent FDI project announcements
suggest a decline in greenfield FDI inflows to EMDEs in 2024 by almost one-quarter relative to 2023.
FDI inflows to EMDEs are highly concentrated in a few large economies. Over two-thirds of total FDI inflows to EMDEs are received by just 10 countries. During 2012-23, about one-third of net FDI inflows to EMDEs went to China—the largest recipient country. The other largest destinations, Brazil and India, jointly received about one-sixth of FDI inflows to EMDEs. LICs accounted for just 2 percent of FDI inflows to EMDEs and less than 1 percent of global FDI inflows.
FDI inflows to EMDEs are nearly all greenfield investment and have been shifting toward the services sector. More than nine-tenths of FDI inflows to EMDEs are greenfield investment, which is generally more closely associated with domestic investment and economic growth in recipient economies than FDI inflows in the form of mergers and acquisitions (M&A).3 Since 2000, the sectoral composition of FDI has shifted significantly from manufacturing to services: the share of the latter increased from less than one-half in the early 2000s to almost two-thirds in 2019-23.
FDI can spur economic growth in EMDEs, but the magnitude of the effect varies, depending on country characteristics. Empirical analysis based on data for 74 EMDEs over 19952019 suggests that a 10 percent increase in FDI inflows is associated, on average, with a 0.3 percent boost to real GDP in EMDEs after three years. The effect is much larger— up to 0.8 percent—in countries with stronger institutions, lower informality, better human capital development, and greater trade openness. Conversely, in countries that lag in these dimensions, the benefits of FDI for output growth are much smaller—and in some cases, absent.
Conducive structural conditions are crucial for attracting FDI. Factors important for attracting FDI include solid macroeconomic fundamentals; high-quality institutions; political and regulatory stability; strong human capital and productivity growth; openness to trade and investment; and financial development. For instance, an improvement in institutional quality or the investment climate from the median to the highest quartile of the global sample can boost FDI inflows by up to one-fifth. A 1 percent increase in labor productivity can increase FDI inflows by up to 0.7 percent.
The outlook for FDI to EMDEs is subdued amid elevated trade tensions, policy uncertainty, and heightened macroeconomic and geopolitical risks. Trade and investment openness, as well as integration into global value chains, have historically been important factors for FDI flows. Investment treaties, for instance, are estimated to have boosted mutual investment flows between signatory states by more than two-fifths, on average. On the contrary, rising geopolitical tensions significantly inhibit cross-border investment: FDI flows between countries with the most pronounced differences in foreign policy are
3 “Greenfield FDI” refers to investments in new assets, when the foreign investor establishes a new venture in the recipient economy. “M&A” refers to acquisition of existing assets by a foreign enterprise in the recipient economy, also known as “brownfield” investments.
found to be about one-eighth below the global sample median. Trade growth has weakened significantly in 2020-24, to the slowest pace since 2000. Economic policy uncertainty has also reached the highest levels since the turn of the century, while the number of new trade and investment agreements implemented has dropped significantly. Tit-for-tat escalation of international trade disputes, waning investment integration, and rising restrictions on FDI—such as foreign ownership barriers and FDI screening measures, now increasingly adopted by many countries—will result in additional fragmentation of economic networks, dampening FDI inflows to EMDEs.
In light of these findings, EMDEs should follow a three-pronged strategy to attract FDI, amplify the benefits of FDI, and advance global cooperation to support FDI flows. The beneficial effects of FDI on growth and economic development are not guaranteed without sustained conducive conditions in recipient economies. Although specific policies depend on country circumstances, broad priorities for all EMDEs include reforms that foster a favorable investment climate, macroeconomic stability, strong institutions, human capital development, financial deepening, and reduction of economic informality. The right policies can steer foreign investment to projects that address pressing sustainable development issues and mobilize additional domestic capital. Reducing barriers to international trade and investment—still high in many EMDEs— including through investment treaties, is important to attract FDI directly and through enhanced trade and value chain integration. All of these policies are becoming even more important as EMDEs face rising global economic fragmentation. Policies that strengthen global cooperation to uphold a rules-based international system for investment and trade, channel FDI toward countries with the largest investment gaps, and provide technical and financial assistance for structural reform efforts are essential for boosting FDI inflows and enhancing their impact in EMDEs.
FDI: Recent trends and structural shifts
FDI plays a pivotal role in the world economy, channeling capital, technology, and expertise across borders. However, global FDI flows relative to GDP—and FDI inflows to EMDEs specifically—have trended downward since the global financial crisis. Both global and domestic factors have contributed to this decline, including weak macroeconomic conditions, higher debt levels and sovereign risk, geopolitical tensions and policy uncertainty, and a slowdown in structural reforms.
Global trends in FDI
The rise of international trade and financial integration, and the expansion of global value chains, was accompanied by an unprecedented surge in FDI that lasted through most of the 1990s and the 2000s. It was interrupted by the global downturn of 2001 and subsequently halted by the global financial crisis of 2008-09. The surge in FDI was especially strong in the run-up to the global financial crisis, with aggregate FDI flows peaking at more than $3 trillion in 2007—about 5 percent of global GDP (figure 5.1.A).
FIGURE 5.1 Global trends in FDI
FDI inflows relative to global GDP have steadily declined, from over 5 percent in 2007 to about 1 percent in 2023 and 2024. Following a rapid rise during 2000-08, FDI inflows to EMDEs relative to GDP have trended down. Historically, global FDI flows have been positively correlated with the growth rates of global output and gross fixed capital formation and, more strongly, with international trade.
Global FDI inflows, by destination
C. Global FDI inflows, investment, and GDP growth
D. Correlation of global FDI with GDP growth, investment growth, trade, and fragmentation
Source: World Bank.
Note: EMDEs = emerging market and developing economies; FDI = foreign direct investment.
A. Sample includes 36 advanced economies and 153 EMDEs.
B. Global net FDI inflows as a percent of world GDP. Gray markers show global recessions and downturns.
C. “Investment” refers to gross fixed capital formation.
D. “Investment” refers to gross fixed capital formation. Bars show correlation coefficients between the global FDI-to-GDP ratio and the following variables: real global GDP growth, real global investment growth, global trade as a share of GDP, and the geopolitical fragmentation index from Fernández-Villaverde, Mineyama, and Song (2024). Sample includes annual data over 1990-2023. ***, **, and * denote statistical significance at the 1, 5, and 10 percent levels, respectively.
The 2009 recession triggered by the financial crisis had a lasting adverse impact on global cross-border investment. FDI flows as a share of world GDP were lower in each of the years 2018 through 2024 than the average for 2000-17. The global recession was followed by a series of adverse developments—continued weak economic growth; trade disputes between major economies, the shocks of the COVID-19 pandemic and the Russian Federation’s invasion of Ukraine, which disrupted international supply networks and raised global inflation; and the consequent tightening of financial conditions. As a result, FDI inflows as a share of global GDP declined from over 5 percent in 2007 to about 1 percent in 2023 and 2024—the lowest level since the turn of the century (figure 5.1.B). Over the past decade, average annual aggregate FDI flows stood at less
B. Global FDI inflows
A.
than $2 trillion—more than two-fifths below the peak of 2007. Large fluctuations from year to year partly reflected the high volatility of FDI inflows related to mergers and acquisitions in advanced economies.
Historically, global FDI flows have been positively correlated with the growth rates of global output and investment (gross fixed capital formation) and, more strongly, with international trade, where the correlation has been close to 0.5 (figures 5.1.C and 5.1.D). On the contrary, rising fragmentation has been strongly associated with the decline in global FDI flows. With global GDP and investment projected to slow sharply in the near term and remain below the prepandemic average in the medium term—and with global trade hindered by higher trade restrictions and acute trade policy uncertainty—FDI inflows as a share of GDP may remain weak.
FDI inflows in EMDEs
The rise of cross-border production contributed to a rise in net FDI inflows to EMDEs in nominal terms. Between 2000 and 2008, net FDI inflows to EMDEs grew almost fivefold—from a little over $160 billion to almost $800 billion. Since then, the growth of net FDI inflows has not kept pace with GDP growth. In 2023, the FDI-to-GDP ratio in the median EMDE was just over 2 percent, less than half its peak of about 5 percent in 2008 (figure 5.2.A). As a result, FDI inflows to EMDEs, relative to GDP, reached similar FDI-to-GDP ratio levels of advanced economies, which also declined over the past 15 years (figure 5.2.B). The decline in FDI-to-GDP ratios was broad-based: in three-fifths of EMDEs, the average FDI-to-GDP ratio was lower in 2012-23 than in 2000-11 (figure 5.2.C).
Both global and domestic factors have contributed to the decline in FDI-to-GDP ratios. The deep recession triggered by the global financial crisis depressed fixed investment and FDI flows. The macroeconomic challenges many EMDEs experienced in the postcrisis period were exacerbated by the COVID-19 recession of 2020. These shocks contributed to heightened risks and uncertainty, weighing heavily on investors’ confidence in EMDEs (World Bank 2024a). An event study suggests that recessions in general have deep adverse effects on FDI lasting for over a year (box 5.1). High debt levels and increasing sovereign risk in some EMDEs, the postpandemic inflation surge, and subsequent monetary policy tightening in major economies have restrained financial markets and capital flows to EMDEs (Kose et al. 2021; UNCTAD 2024a).4
Elevated geopolitical tensions, including those associated with U.S.-China trade disputes, Russia’s invasion of Ukraine, and conflict in the Middle East, have further worsened the international investment climate (IMF 2023a). These tensions have fueled efforts to realign global value chains toward geopolitically aligned countries (friendshoring) and to localize production and supply chains in sensitive sectors and operations
4 The decline in FDI inflows to EMDEs also reflects a broader trend of slowing private debt and equity capital flows to developing countries (Ratha et al. 2023).
FIGURE 5.2 FDI in EMDEs
The median FDI-to-GDP ratio in EMDEs was just over 2 percent in 2023, less than half its peak of about 5 percent in 2008. Advanced economies experienced a sharper slowdown. The decline in FDI inflows to EMDEs was broad-based: the average FDI-to-GDP ratio was lower in 2012-23 than in 2000-11 in three-fifths of EMDEs. Announced greenfield FDI to EMDEs fell by almost one-quarter in 2024 relative to 2023.
A. FDI inflows to EMDEs
B. FDI inflows to advanced economies
C. Share of countries with declining FDI-to-GDP ratios
D. Correlation of FDI with GDP growth, trade, tariffs, and fragmentation
E. Announced greenfield FDI
F. FDI inflows to and outflows from EMDEs
Sources: fDi Markets database; World Bank.
Note: EMDEs = emerging market and developing economies; FDI = foreign direct investment; RHS = right-hand side.
A.B. Annual medians and interquartile ranges of FDI-to-GDP ratios. Balanced sample of 35 advanced economies and 134 EMDEs.
C. Share of countries with a decline in the FDI-to-GDP ratio from 2000-11 to 2012-23 and their GDP value as a share of aggregate group GDP (2023 values). Sample includes 35 advanced economies and 134 EMDEs.
D. Bars show correlation coefficients between annual average FDI-to-GDP ratio and the following variables: real GDP growth, trade as a share of GDP, import tariff rate, and the geopolitical fragmentation index from Fernández-Villaverde, Mineyama, and Song (2024).
Correlations are based on the period 1990-2023. *** and ** denote statistical significance at the 1 and 5 percent levels, respectively.
E. Announced greenfield FDI capital expenditures. Sample includes 141 EMDEs.
F. Median net FDI inflows and outflows as percent of GDP for period averages. Sample includes 107 EMDEs.
BOX 5.1 Dynamics of FDI around adverse events
Disruptive events—such as recessions, financial crises, and natural disasters—can be associated with a significant deterioration in foreign direct investment (FDI) inflows for both emerging market and developing economies (EMDEs) and advanced economies. During recessions, the growth of FDI inflows to EMDEs contracts by about 15 percentage points, on average. FDI remains weak for an additional year in the wake of recessions. FDI dynamics around financial crises and natural disasters yield less clear patterns.
Introduction
The behavior of FDI flows is linked to prevailing economic conditions. Not infrequently, countries face highly disruptive events. For example, between the early 1970s and 2020s, there were five global recession years, over 400 episodes of financial crises, and more than 200 episodes of large natural disasters—with at least a 2 percent loss of GDP—in the global sample of countries examined in this analysis. The dynamics of FDI flows around disruptive events are diverse, in terms of both the magnitude of the change in flows and the duration of the effect. The global financial crisis of 2008-09, for example, had a deep impact on FDI flows, especially for EMDEs (Kekic 2009). However, the effects of the COVID19 recession were more transitory, and FDI flows recovered quickly to prepandemic levels. This box takes a broad historical perspective, using event studies to examine whether major disruptive events have systematic effects on FDI.
This box addresses two questions:
• How does FDI evolve around recessions, financial crises, and natural disasters?
• How do the effects of adverse events differ between EMDEs and advanced economies?
The distinction between EMDEs and advanced economies is important given the differing nature of FDI inflows: in EMDEs, FDI primarily takes the form of greenfield investment, whereas in advanced economies it is more commonly directed to mergers and acquisitions.
Data and methodology
The analysis is based on a global sample of 186 countries, including 150 EMDEs, over the period 1971-2022. The adverse events include global and national recessions (sourced from Kose, Sugawara, and Terrones 2020), financial crises (from Laeven and Valencia 2020), and natural disasters (from the International Disaster Database, or EM-DAT). FDI is sourced from the World Bank’s World
Note: This box was prepared by Amat Adarov and Hayley Pallan.
BOX 5.1 Dynamics of FDI around adverse events (continued)
Development Indicators (WDI) database. Outliers—negative FDI values and values in the upper decile of the FDI growth distribution—are dropped. The event study framework regresses growth rates of real inward FDI flows on dummy variables for the adverse events at the time of the shock (t = 0) and three-year windows around the event (t - 3 and t + 3). The estimates are reported along with 90 percent confidence intervals to gauge statistical significance.
Global and national recessions
The analysis shows that global and national recessions are associated with a significant deterioration in FDI. FDI starts to weaken in the run-up to recessions, aggravating macroeconomic conditions. a In EMDEs, the growth of FDI inflows declines by about 15 percentage points in recessions relative to prerecession trends, on average. b The impact of global recessions tends to be even stronger in advanced economies, with FDI growth declining by about 25 percentage points (figures B5.1.1.A and B5.1.1.B; table B5.1.1). These effects are sizable in the context of long-run FDI trends: over the sample period, average annual FDI growth was about 5 percent in EMDEs and 11 percent in advanced economies.
Certain recessions, however, may produce much deeper adverse effects. In the case of the two most recent global recessions, in 2009 and 2020, FDI inflows to advanced economies were weakened much more severely during the 2009 episode than during the 2020 episode. By contrast, both recessions had similar effects on FDI inflows to EMDEs (figure B5.1.1.C).
In EMDEs, recessions have a more protracted impact on FDI than in advanced economies: EMDEs take about a year longer to recover. This effect may be due to the prevalence of greenfield FDI in EMDEs, which tends to be more sensitive to macroeconomic turbulence. Additional estimations for countries with available detailed data by sectors and the FDI mode of entry suggest that during recessions greenfield FDI tends to suffer a large dip. However, this effect is highly heterogeneous across countries and is not statistically significant (figure B5.1.1.D). Low-income countries (LICs) are particularly hard-hit by national recessions, during which FDI growth drops by about 28 percentage points.
Financial crises
Unlike in recessions, dynamics in FDI around financial crises, including debt, currency, and systemic banking crises, differ between EMDEs and advanced
a. The causality is bidirectional—a decline in output, in turn, also inhibits FDI inflows. Refer to the analysis in the section on the drivers of FDI.
b. The results are consistent with the dynamics of net FDI inflow in EMDEs around adverse events. For instance, during global recessions, annual net FDI in the sample dropped by 11 percent; outside global recessions, net FDI inflow growth averaged about 7 percent in the sample.
BOX 5.1 Dynamics of FDI around adverse events (continued)
FIGURE B5.1.1 FDI inflows to EMDEs around adverse events
Global and national recessions are associated with a significant decline in FDI inflows to EMDEs, with FDI remaining weak for an additional year in the wake of recessions. An assessment of FDI dynamics around financial crises and natural disasters yields less clear patterns.
A. Growth in FDI inflows to EMDEs around global recessions
B. Growth in FDI inflows to EMDEs around national recessions
C. Growth in FDI inflows during global recessions
D. Growth in FDI inflows to EMDEs during global recessions, by sector and mode
E. Growth in FDI inflows to EMDEs around financial crises
F. Growth in FDI inflows to EMDEs around natural disasters
Source: World Bank.
Note: Event studies show estimates of annual FDI growth regressed on dummy variables for the years of recessions, financial crises, and natural disasters, as well as the three-year windows around adverse events. Dashed lines and whiskers show 90 percent confidence intervals. EMDEs = emerging market and developing economies; FDI = foreign direct investment; M&A = mergers and acquisitions.
A.B. Global recession years are 1975, 1982, 1991, 2009, and 2020, following Kose, Sugawara, and Terrones (2020). National recession years are years with negative real GDP growth.
C.D. Bars show point estimates for the years of global recessions.
D. M&A estimate is scaled by a factor of 10.
E.F. Financial crisis years are from Laeven and Valencia (2020) and include systemic banking, debt, and currency crises. Natural disaster years for disasters with damage estimated to be 2 percent of GDP or higher are from the Centre for Research on the Epidemiology of Disasters' International Disaster Database, or EM-DAT.
BOX 5.1 Dynamics of FDI around adverse events (continued)
economies. Whereas no significant effects are observed in the case of advanced economies, the growth of FDI inflows to EMDEs tends to decline by about 7 percentage points in the year following financial crises (figure B5.1.1.E). Thus, on average, the impact of financial crises appears to be much milder than that of recessions, consistent with findings in the previous literature reporting greater resilience of FDI during financial crises outside recessions (Calderon and Didier 2009; Loungani and Razin 2001). This effect can also be attributed to “fire-sale FDI,” or a surge in FDI inflows around crises, as liquidity constraints for domestic firms lead to an increase in foreign acquisitions when asset values deteriorate (Krugman 1998). However, the latter effects are less relevant for EMDEs, which have only a small share of total FDI inflows in the form of mergers and acquisitions (M&A). c
However, financial crises are accompanied by much greater declines in FDI flows to LICs, which generally suffer from deeper debt sustainability challenges, shallow financial markets, and lower capacity to manage and mitigate financial risks than other EMDEs (table B5.1.1). FDI growth in LICs drops by over 20 percentage points in the year before and during a financial crisis.
Natural disasters
The event studies do not reveal clear patterns in FDI responses to natural disasters, including climate, biological, and geophysical disasters (figure B5.1.1.F; table B5.1.1). Natural disasters are examined both jointly and individually for each type. The responses of FDI, however, are highly heterogeneous across countries. The analysis suggests that FDI inflows tend to increase following natural disasters in both advanced economies and EMDEs. This effect is associated with large geophysical disasters and may be related to rising demand for rebuilding after such disasters—a market opportunity that encourages foreign capital inflows (similar findings are reported in Neise et al. 2022).
Conclusion
Recessions are associated with a sharp decline in FDI inflows in both advanced economies and EMDEs. Whereas FDI flows to advanced economies tend to recover relatively quickly after recessions, the adverse effects on FDI growth in EMDEs are more prolonged. Financial crises and recessions tend to produce particularly strong negative effects on the growth of FDI inflows to LICs. Given the importance of FDI for growth in many EMDEs, the results highlight the need to strengthen domestic policies to foster resilience to shocks and curtail the
c. Historically, M&A FDI flows have often been negatively affected by financial crises (Stoddard and Noy 2015). However, the 1997 Asian financial crisis was a notable exception and was associated with a rise of M&A FDI (Acharya, Shin, and Yorulmazer 2011; Aguiar and Gopinath 2005).
BOX 5.1 Dynamics of FDI around adverse events (continued)
TABLE B5.1.1 Growth of FDI inflows around adverse events
A.
B. National recessions
C.
D. Natural disasters
Source: World Bank.
Note: Table shows selected results of regressions of real growth rates of FDI inflows on dummy variables for the four types of adverse events during three-year windows around the event. Global recessions dates are from Kose, Sugawara, and Terrones (2020); national recession years are defined as years with negative real GDP growth; financial crisis years are from Laeven and Valencia (2020) and reflect episodes of systemic banking, currency, and debt crises; natural disasters resulting in damage equivalent to at least 2 percent of GDP are from Centre for Research on the Epidemiology of Disasters' International Disaster Database (EM-DAT). EMDEs = emerging market and developing economies; LICs = low-income countries. ***, **, * indicate statistical significance at the 1, 5, and 10 percent level, respectively.
risks of FDI retrenchments during periods of economic downturns and crises. LICs are particularly vulnerable to adverse shocks with limited capacity to address them, and therefore require financial and technical support from the global community to mitigate these challenges effectively.
(near-shoring and re-shoring). International and domestic economic policy uncertainty has also increased in the past decade, weighing on investor sentiment in EMDEs (World Bank 2024a).
Structural reforms in many EMDEs have stalled over the past decade—including reforms to improve the investment climate and tackle regulatory barriers to FDI. EMDEs, especially LICs, lag advanced economies in such critical dimensions for investment climate as rule of law, regulatory environment, and control of corruption.5
Historically, FDI inflows to EMDEs have been closely associated with economic growth and especially with foreign trade dynamics—more than FDI inflows to advanced economies (figure 5.2.D). The correlation between FDI inflows and trade, taken as a share of GDP, reached 0.8 in EMDEs in the past three decades. By contrast, higher import tariffs and rising economic fragmentation were strongly associated with a decline in FDI inflows.
Therefore, amid elevated trade tensions and global economic fragmentation, policy uncertainty, and weak macroeconomic backdrop, the outlook for FDI inflows to EMDEs remains challenging in the near term. Reflecting these developments and deteriorating investor sentiment, the recent data on FDI project announcements indicate a decline in greenfield FDI inflows to EMDEs in 2024 by almost one-quarter relative to 2023 (figure 5.2.E).
Most of the FDI received by EMDEs—almost 90 percent of the total cumulative FDI stock in the past decade—comes from advanced economies. About 45 percent of these investments were from the European Union and the United States. In general, EMDEs do not play a major role as a source of FDI to other EMDEs, and their FDI outflows are much smaller than inflows (figure 5.2.F). Between 2000 and 2023, net FDI outflows, defined as investment outflows less disinvestment, were equivalent to less than 0.5 percent of GDP in EMDEs, on average. Although advanced economies remain the source of most FDI inflows to EMDEs, FDI flows from EMDEs to other EMDEs— also referred to as “South-South FDI”—have grown faster than flows from advanced economies to other advanced economies during the 2000s and 2010s (Broner et al. 2023; Ratha et al. 2023). For LICs in particular, South-South FDI is significant and can help address development challenges, including job creation (Aykut and Ratha 2004; Saha et al. 2020).
FDI patterns across EMDE regions
FDI inflows to EMDEs are concentrated in the largest economies. Over two-thirds of total FDI inflows to EMDEs are received by just 10 countries. During 2012-23, nearly one-third of total FDI inflows to EMDEs went to China, making it the largest recipient
5 Structural reforms in EMDEs proceeded rapidly during major liberalization waves in the 1980s and 1990s However, following significant deregulation in such areas as international trade and finance, and labor and product markets, progress has stalled since the 2000s, as the scope for additional reforms narrowed and the reform momentum in many EMDEs waned (IMF 2019).
(figure 5.3.A).6 The other largest destinations, Brazil and India, received far lower shares of FDI inflows—about 10 and 6 percent of total FDI inflows to EMDEs, respectively. By contrast, only 2 percent of total FDI inflows to EMDEs went to LICs.
FDI inflows to EMDEs have long been concentrated in three geographic regions, which together represent more than 80 percent of total inflows to EMDEs. During 2012-23, East Asia and Pacific received more than two-fifths of FDI inflows to EMDEs. Latin America and the Caribbean (LAC) and Europe and Central Asia (ECA) were the other main regional destinations, receiving about one-quarter and one-sixth of FDI inflows to EMDEs, respectively (figure 5.3.B).
Median FDI-to-GDP ratios in EMDEs declined in most regions in 2012-23 relative to 2000-11, especially in ECA and LAC (figure 5.3.C). ECA experienced an FDI boom in the 2000s on the back of rapid liberalization in transition economies and their integration into trade and financial networks, both globally and in relation to the European Union (UNCTAD 2010). With the collapse of commodity prices in 2014-16 and rising geopolitical tensions related to Russia’s invasion of Ukraine in 2022, FDI inflows to many ECA countries declined significantly. Median FDI-to-GDP ratio in ECA declined from 5 percent to 3 percent. Four-fifths of ECA economies had FDI-to-GDP ratios lower in 2012-23 than in 2000-11, the largest share of any region (figure 5.3.D). Economies in LAC also experienced a decline in average FDI-to-GDP ratios during this period, as fragmentation of trade and financial networks contributed to downward pressures from macroeconomic challenges and commodity market volatility in many countries (World Bank 2023b). Median FDI-to-GDP ratio in LAC dropped from 5 percent to 4 percent during this period.
FDI by entry mode
The composition of FDI by entry mode differs significantly between EMDEs and advanced economies. Greenfield investment has accounted for over nine-tenths of FDI inflows into EMDEs since 2000. During 2012-23, while median greenfield FDI inflows were equivalent to 2.6 percent of GDP in EMDEs, M&A accounted for only 0.1 percent of GDP (figures 5.4.A and 5.4.B). By contrast, M&A is a much more prominent mode of FDI in advanced economies, comprising about 1 percent of GDP over the same period, the same level as greenfield FDI inflows. These differences reflect a greater number of companies in advanced economies that are large enough to be attractive acquisition targets for multinational enterprises (MNEs), along with deeper capital markets and stronger institutional and legal frameworks that lower the risks of large-scale acquisitions.
In EMDEs, both greenfield and M&A FDI as a share of GDP declined significantly over the past decade. Median greenfield FDI as a share of GDP in EMDEs fell by more than half between 2000-11 and 2012-23. Over the same period, M&A FDI as a share of GDP fell by about three-fourths. Recent data on FDI project announcements suggest
6 However, after a major collapse of FDI inflows to China in 2023, its share of total FDI received by EMDEs fell from one-third to one-tenth.
FIGURE 5.3 FDI in EMDEs, by region
Almost one-third of FDI inflows to EMDEs during 2012-23 went to China. Brazil and India were the next largest destinations but received much lower shares. EAP accounted for over two-fifths of FDI inflows to EMDEs during 2012-23. LAC and ECA were the other main regional destinations, receiving about one-quarter and one-sixth, respectively. In most regions, FDI-to-GDP ratios declined from 2000-11 to 2012-23.
Source: World Bank.
Note: EAP = East Asia and Pacific; ECA = Europe and Central Asia; EMDEs = emerging market and developing economies; FDI = foreign direct investment; LAC = Latin America and the Caribbean; LICs = low-income countries; MNA = Middle East and North Africa; SAR = South Asia; SSA = Sub-Saharan Africa.
A. Share of FDI net inflows among EMDEs. Sample includes up to 153 EMDEs.
B.-D. Sample includes 134 EMDEs, including 19 EAP, 20 ECA, 31 LAC, 15 MNA, 6 SAR, and 43 SSA economies.
C. Bars show median net FDI inflows as a share of GDP by region.
D. Horizontal line denotes 50 percent.
that greenfield FDI continued to weaken throughout 2024 relative to the previous year, and that more than two-thirds of EMDEs experienced a decline in greenfield FDI in 2024 (figures 5.4.C and 5.4.D)
Sectoral composition
The sectoral composition of FDI in EMDEs has changed significantly since the early 2000s. In both advanced economies and EMDEs, more than 60 percent of FDI inflows in recent years have gone to the services sector (figure 5.5.A). The share of services in total FDI inflows to EMDEs is now almost 20 percentage points higher than in 200004. Services-related FDI inflows in EMDEs have displaced manufacturing-related
B. Cumulative FDI inflows in EMDEs, by region
A. FDI inflows to EMDEs
D. Share of economies with lower average FDI-to-GDP ratios in 2012-23 than in 2000-11
C. FDI inflows to EMDEs, by region
FIGURE 5.4 FDI, by entry mode
The composition of FDI by entry mode differs significantly between EMDEs and advanced economies. Greenfield investment has accounted for over nine-tenths of FDI inflows into EMDEs since 2000, while FDI to advanced economies is about equally split between greenfield investment and M&A. In EMDEs, both greenfield and M&A FDI as a share of GDP declined significantly in 2012 -23 compared to 2000-11. Greenfield FDI in EMDEs declined throughout 2024 on a year-on-year basis.
C. Greenfield FDI inflows in EMDEs in 2024
D. Share of countries with declining greenfield FDI inflows
Sources: fDi Markets database; United Nations Conference on Trade and Development; World Bank.
Note: EMDEs = emerging markets and development economies; FDI = foreign direct investment; M&A = mergers and acquisitions.
A.B. Bars show group medians. Sample includes 36 advanced economies and 125 EMDEs. Greenfield FDI data available from 2003 onward.
C. Year-on-year change in announced greenfield FDI project capital expenditures. Sample includes 130 EMDEs.
D. Percent of countries that have a smaller value of announced greenfield FDI project capital expenditures in 2024 compared to 2023. Horizontal line denotes 50 percent. Sample includes 26 advanced economies and 111 EMDEs.
inflows, which dropped from about 45 percent in 2000-04 to less than 30 percent in 2019-23.
The growing role of services in EMDEs, and the associated realignment of cross-border production and domestic investment patterns, reflect long-run structural shifts in global production (UNCTAD 2015; World Bank 2023c). The services sector now accounts for more than two-thirds of GDP and creates more new jobs than other sectors (Nayyar, Hallward-Driemeier, and Davies 2021; World Bank and WTO 2023). Rapid technological progress, particularly the increasing importance of intangible capital and digitalization, is evident in the broad trend of “servitization” in manufacturing.
As a result, MNEs have been allocating an increasing share of their investment to the services sector. This shift was also facilitated by policies promoting FDI in the services
B. M&A FDI inflows
A. Greenfield FDI inflows
FIGURE 5.5 Sectoral FDI trends
In both advanced economies and EMDEs, about 60 percent of FDI inflows in 2019-23 went to the services sector. For EMDEs, this share was almost 20 percentage points higher than in 2000-04. Within services, the largest share of FDI in EMDEs goes to business activities. Within manufacturing, the largest share of FDI inflows is directed to motor vehicle production; within the primary sector, most FDI inflows go to mining and quarrying.
Sources: United Nations Conference on Trade and Development; World Bank.
Note: EMDEs = emerging market and developing economies; FDI = foreign direct investment; ICT = information and communication technology.
A. Stacked bars show sectoral FDI shares in total FDI for the period indicated. Sample includes 32 advanced economies and 86 EMDEs.
B.-D. Sample includes up to 97 EMDEs.
sector—according to UNCTAD’s Investment Policy Monitor Database, the share of investment incentives directed toward the services sector increased from about one-third in 2014-18 to almost one-half in 2019-23. However, the shift to services in FDI tends to be more beneficial for larger and more competitive EMDEs than for less developed countries that find it more challenging to capture the benefits of technology spillovers and upgrading of the production processes that come with FDI (UNCTAD 2024b). From a labor market perspective, the services sector tends to employ workers with higher skill levels than those in manufacturing or agriculture (World Bank 2024e). Therefore, it is important for EMDEs to strengthen their human capital development to take advantage of the structural shift of FDI toward services and ensure it is conducive to productivity growth and creation of better-paying jobs.
Within the services sector, the largest share of FDI in EMDEs during 2019-23 was in business activities—about one-third of the total (figure 5.5.B). Financial services ac-
B. FDI inflows in EMDEs, by services sector, 2019-23
A. FDI inflows, by sectoral group
D. FDI inflows in EMDEs, by primary sector, 2019-23
C. FDI inflows in EMDEs, by manufacturing sector, 2019-23
counted for about one-fifth, followed by trade and information and communication technology (ICT) services—nearly one-seventh each. Within manufacturing, the largest FDI inflows were in motor vehicle production (about one-fifth of FDI inflows into manufacturing), with food, electrical, metal, and petroleum products each accounting for about one-tenth (figure 5.5.C). In the primary sector associated with natural resource extraction, most FDI inflows were in mining and quarrying (figure 5.5.D).
Macroeconomic effects of FDI
Policy makers in EMDEs have commonly viewed FDI as an important source of economic growth and development, providing financing for domestic capital formation, technological spillovers, and jobs (Alfaro and Chen 2018; Henry 2003; UNCTAD 2001). Therefore, the weakening of FDI inflows is concerning, especially in light of EMDEs’ mounting investment needs to address infrastructure gaps and meet key development goals.
The growing focus of policy makers on climate change, poverty, and inequality has triggered additional policy interest in the potential benefits of FDI associated with the transfer of green technologies and socially responsible corporate practices. Although theoretical considerations point to a wide range of benefits of FDI, the evidence shown in empirical literature is mixed. This section examines the evidence on the macroeconomic effects of FDI, outlining transmission channels, synthesizing the literature, and reporting new empirical analysis of the impact of FDI on output.
Transmission channels
FDI entails a long-term ownership relationship between a foreign direct investor in the source economy and a foreign direct investment enterprise in the recipient economy. This lasting economic link enables a range of effects on the enterprise receiving FDI, many of which extend to the rest of the host economy. The strength of the spillovers depends in part on the willingness of the FDI enterprise to transfer the benefits it acquires from the foreign direct investor—corporate know-how and other competitive advantages—to local firms in the recipient economy. It also depends on the capacity of the domestic economy to absorb such spillovers. These effects work through the following transmission channels.
Effects on the foreign direct investment enterprise
A foreign direct investor—typically an MNE—can expand the productive capacity of its foreign direct investment enterprise by helping it accumulate capital, create jobs, and accelerate productivity improvements.7 Among these channels, transfers of environmentally friendly technologies and superior safety standards are increasingly important for sustainable development. Positive effects through these channels tend to be stronger for vertical FDI—the type of FDI that occurs within a value-added chain and is aimed at
7 For details, refer to Alfaro (2017); Amighini, McMillan, and Sanfilippo (2017); Hale and Xu (2016); Kose, Prasad, and Terrones (2009); and Mercer-Blackman, Xiang, and Khan (2021).
improving production efficiency—than for horizontal FDI, which takes place in the same industry and is aimed at expanding market access (Javorcik 2004; UNCTAD 2001).
Foreign-owned firms generally have greater capacity than domestic firms to access international cross-border production networks in both upstream and downstream industries, as well as final goods markets. MNEs can leverage access to resources, efficiency-enhancing innovations, and economies of scale across the world economy via trade, financial, and communications networks. Integration into cross-border production and supply chains can be particularly important for economies with small domestic markets and less competitive private sectors. In this regard, FDI inflows also provide signaling effects, demonstrating the commercial viability of investing in a given country or sector.8
Technology and knowledge spillovers
Positive spillovers to domestically owned firms may occur as they acquire more advanced technologies from FDI enterprises (Blalock and Gertler 2008; Ivarsson and Alvstam 2005). Similarly, domestic firms may improve their business processes and productivity by adopting the management practices and organizational know-how of foreign-owned firms to remain competitive (Fu 2011). Domestic sectors also benefit from efficiency and productivity spillovers from the outsourcing of activities by foreign-owned firms through value-added chains. In EMDEs, greenfield FDI has positive productivity spillovers, particularly to domestic firms in upstream sectors (Ahn, Aiyar, and Presbitero 2024).
Labor market spillovers
Human capital gains may extend beyond the foreign direct investment enterprise as workers who have gained experience in foreign-owned firms move to domestic companies, further boosting labor productivity in the recipient economy. Additionally, economic activity by foreign-owned firms generally helps to create new jobs, although the net effect on employment may be negative if competition from foreign firms crowds out jobs in domestic firms or if efficiency gains lead to redundancies.Jobs created via FDI tend to pay higher wages, while providing more training, although some studies suggest that a “race to the bottom” in labor standards is associated with FDI.9
Demand effects and access to value chains by domestic companies
Local sourcing by foreign-owned firms benefits domestic suppliers and boosts aggregate demand in the recipient economy (Javorcik 2004). FDI may facilitate access by domestic firms to international production networks and foreign markets. This transformational
8 For the relationship between FDI and global value chains, refer to Adarov and Stehrer (2021); Farole and Winkler (2014); and Qiang, Liu, and Steenbergen (2021). For the role of FDI in improving access to final goods markets, refer to Ekholm, Forslid, and Markusen (2007); Tintelnot (2017); and World Bank (2020).
9 For labor market benefits from FDI, refer to Chari, Henry, and Sasson (2012); Javorcik (2015); and Markusen and Trofimenko (2009). For labor market risks, refer to Hijzen et al. (2013) and Messerschmidt and Janz (2023).
impact may also include the provision of services such as digital connectivity and transportation infrastructure supporting the recipient economy at large (World Economic Forum 2020).
Competitive pressures
Foreign investor firms are generally more efficient than domestic ones and are likely to add to competitive pressures in domestic markets. This may stimulate productivity improvements by domestic firms but may also crowd out economic activity if less efficient domestic firms are unable to survive the increased competition (Alfaro and Chen 2018; Fons-Rosen et al. 2017; World Bank 2018). Greater competitive pressure in the recipient economy may also lead to second-order effects, such as expanding the variety and affordability of goods and services for domestic firms and households.
Macroeconomic and geopolitical risks
Large cross-border financial flows may induce currency volatility, add to balance of payments pressures, and contribute to financial asset bubbles. However, these risks are more relevant to portfolio investment than to FDI. Excessive reliance on foreign investment and the political influence that MNEs may wield as a result can also be concerns, particularly in recipient countries with large inward FDI stocks. Access by foreign firms to strategic domestic assets and sectors via FDI has increasingly fueled anxieties related to national security considerations and supply chain resilience (IMF 2023a; UNCTAD 2023; World Bank 2023c). These concerns have intensified re-shoring, friend-shoring, and global economic fragmentation.
Through these channels, FDI can also facilitate domestic private capital mobilization in recipient economies, beyond the private long-term capital that MNEs bring through new investment and retained earnings (Amighini, McMillan, and Sanfilippo 2017). In particular, foreign firms can stimulate economic activity in several ways. They help improve infrastructure—especially in countries that lack the resources to finance such investments themselves. They also provide goods and services to local businesses and generate demand for their output through upstream and downstream value-added linkages. Together, these effects can encourage greater domestic investment. Increased competitive pressures induced by foreign-owned firms also encourage domestic businesses to invest more. FDI inflows also provide a signal about profitable investment opportunities that may encourage additional private investment by both domestic and foreign investors.
The wide range of direct effects and spillovers from FDI can help EMDEs address pressing developmental challenges and accelerate progress toward key development goals. FDI can be instrumental in helping recipient economies address poverty and inequality challenges. It does so by facilitating job creation and human capital improvements that raise the productivity of domestic labor, and by enhancing access to goods and services—especially in rural areas and for disadvantaged communities. These dynamics are particularly important for LICs, which face deeper structural challenges and limited public and private investment capacity. Empirical work suggests that the
strength of these positive effects also depends on institutional quality and the level of economic development in the recipient country (Aloui, Hamdaoui, and Maktouf 2024; Huang, Sim, and Zhao 2020).
FDI can also improve the economic participation of women—by transmitting best practices on talent allocation to the recipient economy, providing women with job opportunities, and bridging pay gaps. Foreign affiliates of MNEs tend to have a greater share of female employees than domestic firms. That may reflect a greater tendency among MNEs to implement nondiscrimination policies in hiring, equal pay, promotion, training, and maternity leave. However, domestic legal and regulatory systems play an important role for how effectively MNEs contribute to gender equality and the effects are often greater for low- and midlevel jobs compared to higher-level positions.10
In addition, FDI can support the energy transition and climate change adaptation in EMDEs by providing capital for sustainable projects and climate-resilient infrastructure, and by transferring environmentally friendly technologies and business practices.
Impact of FDI on economic growth
Empirical studies of the impact of FDI on economic growth in EMDEs show mixed results—the estimates in most studies suggest positive effects of FDI, but the magnitudes of these effects vary considerably and are often only weakly statistically significant. For instance, a 1-percentage-point increase in FDI-to-GDP ratio is found to be associated with an increase in per capita GDP growth of about 0.7 percentage point in Borensztein, De Gregorio, and Lee (1998) and about 0.5 in Bengoa and Sanchez-Robles (2003). Other studies reported smaller effects—reaching about 0.4 percentage point (Alfaro et al. 2004; Alguacil, Cuadro, and Orts 2011) or 0.2 percentage point (Makki and Somwaru 2004) in response to an equivalent increase in the FDI-to-GDP ratio. Previous summaries of the empirical literature on FDI and economic growth have noted lack of consensus in the findings (Kose et al. 2009; Kose and Ohnsorge 2024).
The wide dispersion of estimated effects may be attributed to differences in the samples examined and the structural characteristics of the recipient economies that influence the growth effects of FDI. For instance, financial development, human capital, and institutional quality are factors found to be important in determining the effects of FDI.11
The extent to which structural characteristics affect the FDI-growth relationship varies across countries and over time. For instance, many studies have found that financial development has facilitated the growth effects of FDI, but this relationship may have weakened over time (Benetrix, Pallan, and Panizza 2022). Deeper and more efficient financial markets are likely to facilitate the funding of domestic firms that supply foreign
10 For details on FDI and the economic participation of women, refer to Heckl, Lennon, and Schneebaum (2025); Montinari (2023); and UNCTAD (2021).
11 For the role of institutional quality, refer to Alguacil, Cuadros, and Orts (2011) and Driffield and Jones (2013). For the implications of human capital, refer to Bengoa and Sanchez-Robles (2003); Borensztein, De Gregorio, and Lee (1998); Henry and Lorentzen (2003); and Wang and Wong (2011). For the role of financial development, refer to Alfaro et al. (2004) and Azman-Saini, Law, and Ahmed (2010).
firms with inputs. Nevertheless, the rapid growth of financial markets can also lead to an increased incidence of financial crises, dampening the growth benefits of FDI (Osei and Kim 2020).
The mode of entry may also matter, with greenfield FDI having greater growth effects than M&A FDI (Harms and Méon 2018; Luu 2016). However, some firm-level studies have found positive effects of M&A on productivity, fixed capital upgrading, and job creation in certain countries. For example, Bircan (2019) found that productivity in manufacturing firms in Türkiye improved after their acquisition by MNEs. Similarly, Ragoussis (2020) reported that wages increased in acquired enterprises in a sample of six EMDEs.
Growth effects of FDI tend to vary across recipient sectors. FDI in the manufacturing sector, especially in high-tech, capital-intensive, and high-skill industries, has been found to induce strong growth effects via increases in productivity, employment, and investment. The output effect of FDI in the services sector has been found to be less clear-cut, with some studies reporting insignificant or even negative impacts, which may be related to the prevalence of market-seeking M&A FDI in this sector. Likewise, the effects of FDI in the primary sector on growth have been found to be mostly negligible or, in some cases, negative. These findings may reflect the generally weaker economic linkages between the primary sector and the rest of the economy, lower technological spillovers between foreign and domestic firms compared to other sectors, and barriers to entry related to greater economies of scale in the primary sector.12
Likewise, empirical evidence on the impact of FDI on domestic fixed capital formation in the recipient economies is mixed. FDI may crowd in domestic investment by lowering the costs of adopting new technologies and generating additional demand for domestically produced inputs (Borensztein, De Gregorio, and Lee 1998). However, competitive pressures from FDI may also lead to offsetting effects (Ang 2009; Ashraf and Herzer 2014; Kamaly 2014). In addition, the net effects of FDI on domestic investment depend on macroeconomic conditions and structural characteristics of the recipient economy. For instance, financial development and strong institutions can reinforce the positive effects of FDI on domestic investment by lowering the costs of transactions, facilitating an efficient allocation of capital, and fostering a stable and predictable investment climate (Jude 2019; Mileva 2008; Mody and Murshid 2005). FDI effects on domestic investment tend to be greater for greenfield FDI—which, in contrast to M&A, involves construction of new facilities directly adding to the productive capital stock—and in the manufacturing sectors, particularly in export-oriented industries, where positive effects are facilitated by integration of domestic firms into global value chains and sourcing of domestically produced inputs by foreign-owned firms (Amighini, McMillan, and Sanfilippo 2017; Cipollina et al. 2012; Harms and Méon 2018).
12 For the effects of FDI in the manufacturing, primary, and services sectors, refer to Alfaro (2003), Alfaro and Charlton (2013), Aykut and Sayek (2007), Chakraborty and Nunnenkamp (2008), and Cipollina et al. (2012).
New empirical evidence
The mixed evidence reported in past empirical work on the FDI-growth relationship reflects significant heterogeneity in effects across countries that cannot be precisely estimated, as well as other methodological caveats. Conventional panel data estimation strategies often fail to take account of several issues—such as the two-way causality between FDI and growth, heterogeneity across countries, and the dynamic nature of the effects. To address these issues, a heterogeneous panel vector autoregression framework (Pedroni 2013) is used to quantify the effects of FDI on output growth in EMDEs based on a sample of 74 countries over the period 1995-2019. The detailed results of this analysis are reported in box 5.2.
In summary, the analysis finds a generally positive and statistically significant effect of FDI inflows on output in recipient economies. For the average EMDE, a 10 percent increase in real net FDI inflows leads to an increase in real GDP of 0.15 percent in the same year. The effect increases further to 0.3 percent after three years.
The effects of FDI, however, vary considerably across countries. In the 25 percent of countries with the largest effects, output increases by about 0.8 percent after three years in response to a 10 percent increase in FDI inflows. But output effects of FDI are significantly weaker in LICs than in other EMDEs. This heterogeneity is consistent with the results reported in previous empirical work and is generally attributed to differences in the absorptive capacity of recipient economies. These, in turn, are linked to such characteristics as low institutional quality, weak human capital development, shallow financial markets, and other factors (Alfaro et al. 2004; Borensztein, De Gregorio, and Lee 1998). The results show that some country-specific characteristics amplify these effects. In particular, countries with the largest output effects of FDI tend to have stronger institutions, better human capital development, lower levels of economic informality, and higher trade openness, on average.
FDI, the energy transition, and climate change
FDI can play an important role in supporting the energy transition and addressing climate change. In fact, the share of greenfield FDI involving investment in environmental technologies has been rising in recent years in both advanced economies and EMDEs (figure 5.6.A). FDI can facilitate the adoption of environmentally friendly technologies and business practices that contribute to the energy transition. It can also help to close investment gaps related to climate change issues.
Linkages between FDI and the environment
FDI inflows can exert both positive and negative effects on the environment in a recipient economy. The outcome depends on the recipient economy’s environmental regulations and how they influence the investment incentives of MNEs. According to the pollution haven hypothesis, foreign investors, especially those involved in highly polluting activities, are drawn to countries with more lenient environmental regulations, which impedes the energy transition and exacerbates environmental problems. By
BOX 5.2 Impact of FDI on economic growth: Heterogeneous PVAR analysis
The effects of foreign direct investment (FDI) on output growth are not clear-cut, because the literature to date does not provide consistent evidence. An empirical framework that accounts for the shortcomings of conventional estimations suggests that FDI inflows tend to have a positive impact on output in emerging market and developing economies (EMDEs). On average in EMDEs, a 10 percent increase in real net FDI inflows is followed by a 0.3 percent increase in the level of real GDP after three years. Countries with lower economic informality, higher trade openness, better human capital development, and stronger institutions tend to have larger output effects of FDI—up to 0.8 percent over the same period.
Introduction
The empirical literature presents mixed evidence on the effects of FDI on output growth. These results are sensitive to the country composition and sample period examined, and have been found to depend on recipient economy conditions such as human capital, institutional quality, and financial development (Alfaro et al. 2004; Borensztein, De Gregorio, and Lee 1998; Jude and Levieuge 2017).
Conventional panel data estimation frameworks generally do not address several empirical challenges in assessing the growth effects of FDI: (1) broad heterogeneity of the macroeconomic effects of FDI across countries, with the result that aggregate or partially pooled estimates tend to be statistically insignificant; (2) two-way causality between FDI and output growth, which may lead to inconsistent estimates; and (3) heterogeneous time horizons over which the effects of FDI may manifest.
To address these issues, this box employs a heterogeneous panel vector autoregressive (PVAR) framework developed by Pedroni (2013) to study the relationship between FDI and output growth. This approach makes it possible to incorporate fully endogenous covariates and to examine the mutual impacts of these variables over time, accounting for the heterogeneity of responses across countries. The analysis is based on strongly balanced annual data for 74 EMDEs spanning the period 1995-2019 (annex 5A provides methodological details). This box addresses the following questions:
• What are the effects of FDI inflows on output growth?
• How do EMDEs differ in terms of the growth impacts of FDI?
• What country characteristics help increase the positive effects of FDI?
Note: This box was prepared by Amat Adarov, Hayley Pallan, and Peter Pedroni.
BOX 5.2 Impact of FDI on economic growth: Heterogeneous PVAR analysis (continued)
Impact of FDI on economic growth
The model yields cumulative impulse responses for each country in the sample. The results suggest that, for most EMDEs, FDI inflows have a positive and statistically significant impact on output. On average, a 10 percent increase in real net FDI inflows is associated with an increase in real gross domestic product (GDP) of 0.15 percent in the same year, peaking after three years and flattening out afterward at about 0.3 percent (figure B5.2.1.A). a In most countries, the effects are positive and significant. In the quartile of countries with the largest effects, a positive FDI shock leads to an increase in output of 0.8 percent after three years. However, the analysis also shows that, for about a quarter of countries in the sample, the positive effects are absent or insignificant.
These results highlight the highly heterogeneous impacts of FDI on output growth across countries, consolidating a wide variety of estimates in past empirical studies, which reported positive, negative, and insignificant output effects of FDI. Previous literature has attributed such variation to differences in the absorptive capacity of the recipient economy, the sectoral composition of FDI, and the mode of entry (Alfaro 2003; Alfaro et al. 2004; Aykut and Sayek 2007; Borensztein, De Gregorio, and Lee 1998; Harms and Méon 2018).
Country characteristics that impact the effects of FDI
Further analysis explores the origins of heterogeneity and identifies common patterns in the effects of FDI conditional on various structural characteristics of recipient economies. Separating the sample of EMDEs into low-income countries (LICs) and higher-income EMDEs suggests that the growth impacts of FDI are significantly weaker in LICs (figure B5.2.1.B). A review of the properties of subsamples with strong and weak responses of output to FDI—defined as the lower and upper quartiles of the estimated coefficient—points to certain structural characteristics that magnify the positive effects of FDI (figures B5.2.1.C-F; additional results are reported in table B5.2.1).
In particular, better institutions—such as a sound business environment, control of corruption, and strong regulatory quality—amplify the growth effects of FDI. Trade openness (measured as the sum of exports and imports as a percent of GDP) is higher by 16 percentage points in the high-FDI impact sample compared to the low-FDI impact sample. Educational attainment also matters: the share of the population with completed secondary education is higher by
a. The magnitude of the FDI shock (10 percent) roughly corresponds to the average annual growth of real net FDI inflows for the EMDE sample used in the analysis, excluding outliers. Median growth of FDI inflows to EMDEs is about 5 percent, with a standard deviation of 38.
BOX 5.2 Impact of FDI on economic growth: Heterogeneous PVAR analysis (continued)
FIGURE B5.2.1 Macroeconomic impacts of FDI inflows in EMDEs
A 10 percent increase in real net FDI inflows is associated with a 0.15 percent increase in real GDP in the same year, peaking at 0.3 percent after three years. The output effects of FDI are much weaker in LICs than in other EMDEs. Countries with greater growth effects from FDI inflows tend to have better institutions, lower levels of economic informality, higher trade openness, and better human capital development.
A. Impact of FDI on output
B. Impact of FDI on output, by income group
C. Trade openness
D. Human capital
Institutional quality
0-6, 6 = highest
Sources: PRS Group, International Country Risk Guide (ICRG); World Bank.
= highest
Note: Sample includes 74 EMDEs, 11 of which are LICs. Whiskers indicate 90 percent confidence intervals. EMDEs = emerging market and developing economies; FDI = foreign direct investment; LICs = low-income countries; PVAR = panel vector autoregression; RHS = right-hand side.
A. Impulse response functions from the baseline heterogeneous PVAR specification (bivariate model with short-run orthogonalization). Solid lines show the average GDP responses to an FDI inflow shock for the full EMDE sample and for the upper and lower quartile of the distribution of impulse responses. Dashed lines show associated 90 percent confidence bands.
B. Bars show the GDP response to an FDI inflow shock three years after impact.
C.-F. “High FDI impact” and “low FDI impact” samples consist of countries with estimated GDP responses to an FDI inflow shock above the 75th percentile and below the 25th percentile, respectively. Bars indicate averages. “Trade openness” is the sum of exports and imports (in percent of GDP), “human capital” is the share of the population with completed secondary education, and “informality” is informal employment (in percent of total employment). Institutional quality measures are ICRG indexes. A higher index value is associated with better institutional quality.
BOX 5.2 Impact of FDI on economic growth: Heterogeneous PVAR analysis (continued)
TABLE B5.2.1 Characteristics of countries with high and low growth effects of FDI
A. Macroeconomic conditions
C.
D. Informal economy
E. FDI entry mode
Sources: PRS Group, International Country Risk Guide (ICRG); World Bank Country Policy and Institutional Assessment (CPIA) data set.
Note: “FDI” refers to real net FDI inflows. “High FDI impact” and “low FDI impact” samples consist of countries with the estimated GDP response to an FDI shock above the 75th percentile and below the 25th percentile, respectively. “Difference between samples A and B” reports the difference between the sample means of the high- and low-FDI impact groups. Sample includes 74 EMDEs; each quartile includes 18 EMDEs. Higher values of the institutional quality indexes reflect better institutional outcomes. EMDEs = emerging market and developing economies; FDI = foreign direct investment; M&A = mergers and acquisitions.
BOX 5.2 Impact of FDI on economic growth: Heterogeneous PVAR analysis (continued)
10 percentage points in the high-FDI impact countries. Countries with high informality tend to have lower returns to FDI. In the low-FDI impact sample informal employment (as a share of total employment) is higher by about 16 percentage points compared to the high-impact sample. Countries with larger output effects also tend to have a greater intensity in greenfield FDI, confirming the findings in previous literature (Harms and Méon 2018).
Conclusion
The analysis presented in this box suggests that FDI has a positive and statistically significant effect on economic growth, on average, in EMDEs. The magnitudes of these effects, however, vary substantially across the sample, which helps explain inconclusive results reported in the existing empirical literature. Structural differences between countries with a high impact of FDI on output and those with a low FDI impact help explain these diverse effects and provide support for reforms that improve the quality of institutions, reduce economic informality, facilitate human capital development, and foster economic integration.
contrast, the pollution halo hypothesis suggests that FDI can promote the energy transition and environmental sustainability in the recipient economy through the transfer of environmentally friendly technologies and capital by MNEs, improvements in the energy efficiency in business activities, and the introduction of renewable energy technologies with positive spillovers to domestic enterprises (Cole, Elliott, and Zhang 2017; Copeland 2008).
Both the “halo” and “haven” effects have influenced FDI location decisions, and empirical studies to date do not provide clear evidence supporting the dominance of either hypothesis. Some studies find that stringent environmental regulations tend to deter FDI associated with high pollution, but others reported only a weak impact of environmental laws on FDI inflow.13 However, more recent analysis shows that FDI specifically related to environmental technologies, such as renewable energy, has been boosted by stronger climate policies in recipient economies (Jaumotte et al. 2024; Pienknagura 2024).
Several empirical studies suggest that foreign-owned enterprises tend to produce less pollution than domestic firms, supporting the pollution halo hypothesis (Eskeland and
13 Negative effects of environmental regulations on FDI are found in Bialek and Weichenrieder (2015), Chung (2014), and Mulatu (2017). Refer also to a related discussion of “investment leakage”—the loss of industrial production due to relocation to countries with less stringent environmental standards—in De Beule, Schoubben, and Struyfs (2022). Javorcik and Wei (2003) and Poelhekke and Van der Ploeg (2015) found a weak relationship between environmental laws and FDI.
Harrison 2003; Xiahou, Springer, and Mendelsohn 2022). In a meta-analysis of 65 studies, Demena and Afesorgbor (2020) reported a generally negative relationship between FDI and environmental emissions. However, some studies focusing on individual countries or regions also reported a positive association between FDI and emissions (Abdo et al. 2020; Acharyya 2009; Blanco, Gonzalez, and Ruiz 2013).
Transmission channels
The mixed empirical evidence on the environmental effects of FDI may be related to differences in the strength of various transmission channels, including the following.
Implementation of green technologies
Foreign direct investors can influence the decisions of their foreign subsidiaries, branches, and affiliated enterprises, to invest in green production processes, which typically involves spending on environmentally friendly technologies, business operations, machinery, and equipment (Balaguer, Cuadros, and García-Quevedo 2023). FDI may facilitate greater specialization in green technologies in recipient economies (Castellani et al. 2022).
Transition to renewable energy
FDI can promote a shift in energy consumption toward renewables through technological spillovers that promote more energy-efficient practices (Doytch and Narayan 2016). Recent analysis finds that FDI has been shifting toward activities that consume renewable energy and away from the use of fossil fuels (Knutsson and Flores 2022). Investments that involve renewable energy tend to outperform those reliant on fossil fuels in terms of risk and return, and the cost of capital tends to be lower for renewable energy companies than for fossil fuel companies (IEA and Centre for Climate Finance & Investment 2021). The transition to renewable energy can help mitigate economic volatility and uncertainty driven by reliance on fossil fuels and elevated commodity market volatility. Amid the accelerating transition to renewable energy, FDI inflows are likely to increase to countries that supply critical minerals essential for the energy transition (Hund et al. 2020).
Energy e ciency
Foreign-owned firms tend to be more energy efficient than their domestic counterparts. For instance, using sectoral analysis for a global sample of countries, Borga et al. (2022) showed that the carbon intensity of foreign-owned firms is lower than that of domestic firms. Brucal, Javorcik, and Love (2019) came to similar conclusions regarding the energy intensity of manufacturing plants in Indonesia.
Green management strategies
Foreign-owned firms tend to use environmental management systems more intensively than domestic companies (Albornoz et al. 2009; Kannen, Semrau, and Steglich 2021). Firm-level analysis using data from World Bank Enterprise Surveys finds that foreign
FIGURE 5.6 FDI, the energy transition, and climate change
The share of greenfield FDI projects involving investment in the environmental technology sector has increased in recent years, alongside an increase in the stringency of environmental policies. In EMDEs, environmental policy stringency is positively correlated with FDI inflows. FDI restrictions in climate-sensitive sectors are generally greater in EMDEs than in advanced economies.
A. Share of FDI capital expenditures in the environmental technology sector
C. Correlation between environmental policy stringency and FDI inflows as a share of GDP
B. Environmental policy stringency
Sources: fDi Markets database; Organisation for Economic Co-operation and Development, FDI Regulatory Restrictiveness Index; World Bank.
Note: EMDEs = emerging market and developing economies; FDI = foreign direct investment; LICs = low-income countries.
A. Capital expenditures associated with FDI announcements. Environmental technology sectors are defined by fDi Markets and include electric vehicles, wind technologies, and other sectors that are intensive in environmental technologies.
B.C. The environmental policy stringency index incorporates information on market-based, non-market-based, and technology support policies (Botta and Kozluk 2014; Kruse et al. 2022). Sample includes 24 advanced economies and 9 EMDEs between 1990 and 2020.
C. Asterisks denote statistically significant correlations at 1 percent (***) or 5 percent (**) levels.
D. Sample includes 32 advanced economies and 51 EMDEs. Averages for 2010-20.
companies are more likely to pursue green management strategies and prioritize environmental concerns in their operations (Kannen, Semrau, and Steglich 2021). Furthermore, a larger share of foreign-owned firms than domestic firms tends to meet various environmental goals, including the use of strategic objectives and the monitoring of energy consumption (OECD 2022). MNEs may also have reputational incentives to locate their operations in countries with strict environmental regulations (Poelhekke and Van der Ploeg 2015).
Climate change adaptation
FDI can be an important source of funding to help EMDEs address the rising challenges of climate change—especially with respect to meeting climate adaptation needs. The
D. FDI restrictiveness in climate-sensitive sectors
current lack of FDI directed toward climate mitigation and adaptation needs is associated with the uncertain investment environment, large costs, and the long horizons of climate-related investment projects (Botwright and Stephenson 2023). Unclear countrylevel plans for adaptation, the scarcity of information on climate risks and costs, and insufficient risk reduction incentives for private investors also tend to limit private investment in climate adaptation (World Bank 2021a).14
Nature preservation
The continued decline in biodiversity has massive adverse consequences—by some estimates, the collapse of ecosystems could result in a 2.3 percent annual decline in global real GDP by 2030 (World Bank 2021b). FDI can help to finance projects focused on nature preservation and implement sustainable practices (Karadima 2021). At the same time, the ecological footprint associated with FDI can be significant, particularly in the extractive and manufacturing sectors (Doytch, Ashraf, and Nguyen 2024). This impact underscores the importance of environmental standards and regulations to mitigate these risks and promote environmentally friendly FDI.
The strength of these transmission channels and the net effects of FDI on the energy transition and environmental sustainability depend on country characteristics and may also vary by sector (Borga et al. 2022; Doytch, Ashraf, and Nguyen 2024; Kannen, Semrau, and Steglich 2021). Thus, the positive environmental effects of FDI have been found to be stronger in countries with higher income levels, better human capital, and stronger institutions, particularly those with less corruption (Cole, Elliott, and Fredriksson 2006; Lan, Kakinaka, and Huang 2012).
Implications for EMDEs
Internationally comparable data on the stringency of environmental policy over time are limited, especially for developing countries. However, available data for a sample of 24 advanced economies and 9 EMDEs since the 1990s indicate that environmental policy has generally become more stringent (figure 5.6.B). Such stringency has been significantly positively correlated with FDI inflows in EMDEs, although the correlation is weak in advanced economies (figure 5.6.C). Stricter environmental regulations thus do not appear to have discouraged FDI inflows in EMDEs at least in this limited sample of countries. Among environmental policies, technology support policies, such as rules promoting low-carbon research and development expenditures in the public sector and price support for solar and wind technologies, tend to be more strongly correlated with FDI than market-based policies that involve emissions trading schemes or pollution taxes and non-market-based policies implementing hard limits on pollutants.
Many EMDEs are highly vulnerable to climate change, and FDI can provide important financial support toward climate adaptation and mitigation. Certain economic sectors have been identified as more susceptible to the adverse effects of climate change, includ-
14 Such barriers weaken private sector spending on climate adaptation, estimated to have been about 1.6 percent of total spending on climate adaptation in 2017-18 (World Bank 2021a).
ing agriculture, electricity, fishing, forestry, and transportation.15 These climate-sensitive sectors also tend to have significant funding gaps for climate change adaptation. To some extent, these gaps could be reduced by FDI. However, regulatory restrictions on FDI in many of these sectors in EMDEs tend to be stronger than in other sectors, as well as stronger than in advanced economies (figure 5.6.D).
Drivers of FDI
As shown in the previous sections, FDI can boost economic growth and development— provided that recipient economies nurture a conducive environment. Especially for LICs and small and capital-scarce economies, FDI can be an important source of funding, technology spillovers, and improved access to foreign markets. The recent trend toward fragmentation of international trade and investment networks has made EMDEs particularly vulnerable to declines in FDI, underscoring the need to promote and sustain FDI inflows. This section examines the key factors that can foster FDI, drawing on the literature and evidence from new empirical analysis.
Motives for FDI
FDI flows depend on the motives that drive companies based in one country to acquire ownership of productive assets located in another. In brief, market-seeking FDI and export-platform FDI are driven by the desire of MNEs to gain access to broader international markets for their goods and services. MNEs may also seek to optimize their crossborder production processes and secure access to productive inputs at lower costs, and these aims may drive efficiency-seeking, resource-seeking, and strategic asset-seeking FDI.
Companies may also attempt to mitigate regulatory obstacles to trade and production by engaging in regulatory-arbitrage FDI to exploit differences in regulatory frameworks between countries. This type of FDI includes tariff- and non-tariff-barrier-jumping FDI. More specifically, FDI can be used to take advantage of a laxer regulatory environment and avoid labor market, financial market, and other regulations or market restrictions. For instance, when import tariff protection or nontariff barriers are high, MNEs can use FDI to gain access to the recipient market as an alternative to more costly exports (Adarov and Ghodsi 2023; Javorcik and Spatareanu 2005). A particular type of regulatory-arbitrage FDI is phantom FDI, which is motivated by MNEs’ profit shifting and tax optimization. Such capital flows are often routed through offshore financial centers and shell companies and may not involve any real economic activity in recipient economies (Aykut, Sanghi, and Kosmidou 2017; Damgaard, Elkjaer, and Johannesen 2024).
These corporate motives for FDI are influenced by a wide range of pull and push factors in the recipient and source economies, as well as by global and bilateral factors. Push factors are structural characteristics and macroeconomic conditions in the source country
15 For a discussion on the role of FDI in climate adaptation and mitigation, refer to Botwright and Stephenson (2023), UNCTAD (2022b), and World Economic Forum (2023). For a discussion of climate-sensitive sectors, refer to Lovei (2017), Oh et al. (2019), UNCTAD (2022a), and World Bank (2012).
that encourage FDI outflows. Pull factors are characteristics of recipient economies that attract FDI inflows. Bilateral factors refer to the strength of social, political, legal, and economic ties between the source and recipient economies. Global factors—such as global economic growth and financial conditions, commodity market fluctuations, shifts in risk and uncertainty, and other common shocks—also affect FDI flows.
Insights from the literature
Among the push factors that tend to encourage FDI outflows from the source country are its weak growth prospects, macroeconomic risks, political instability, rising production costs, and deterioration of the regulatory environment. On the pull side, some of the main factors boosting FDI inflows are the recipient economy’s market size or its proximity to large markets in other countries; the availability of inputs that offer higher productivity at lower costs; financial deepening; better quality of institutions and infrastructure; and a favorable regulatory environment. At the global level, FDI is facilitated by reductions in international transportation and communication costs. Shifts in risk perceptions and liquidity may also lead to synchronized cross-border capital flows, forming a global financial cycle. However, the latter is more relevant for portfolio investment than for FDI.16
Factors relating to the bilateral ties between FDI source and recipient economies include mutual transaction costs, trade and investment treaties, migration, political relations, information frictions, and regulatory barriers such as FDI screening mechanisms— regulations for authorizing or prohibiting FDI on grounds of national security or strategic policy considerations.17
Empirical evidence suggests that the importance of these factors may vary across FDI recipient sectors. For instance, in manufacturing and services, market size and output growth tend to play important roles in driving FDI. Trade openness has been found to matter for FDI in manufacturing, particularly export-oriented sectors.18 FDI in exportoriented manufacturing sectors is also facilitated by currency depreciation in the recipient economy, as domestic assets become cheaper in foreign currency terms and exports become more competitive (Blonigen 1997; Walsh and Yu 2010). Other pull factors found to encourage FDI, especially in tradable sectors, include financial development, labor market flexibility, and high-quality infrastructure (Kinoshita 2011).
16 For the implications of financial development for FDI, refer to Desbordes and Wei (2017); for the role of human capital, Noorbakhsh, Paloni, and Youssef (2001); for institutions, Bailey (2018) and Benassy-Quere, Coupet, and Mayer (2007); and, for infrastructure, Mensah and Traore (2024). For a discussion of global financial cycles, refer to Adarov (2022); Claessens, Kose, and Terrones (2011); and Miranda-Agrippino and Rey (2021).
17 For the association between trade and FDI, refer to Adarov and Stehrer (2021), Blanchard et al. (2021), and Blonigen and Piger (2014). The role of geopolitical factors is discussed in Aiyar et al. (2023) and Aiyar and Ohnsorge (2024); regulatory divergence in Fournier (2015); and migration networks in Kugler and Rapoport (2007). Implications of information frictions related to the familiarity with the investment environment and financial market efficiency for FDI inflows and their persistence are discussed in Khraiche and de Araujo (2021).
18 Refer to Chen, Geiger, and Fu (2015), Kinoshita (2011), and Makki, Somwaru, and Bolling (2004) for the heterogeneous effects of trade openness, market size, and other country characteristics on sectoral FDI.
By contrast, FDI in the primary sector, largely driven by resource-seeking motives, is much less sensitive to macroeconomic conditions in the recipient economy (Walsh and Yu 2010). Although the quality of institutions still matters for FDI in the primary sector in general, some studies find that its role has varied across subsectors: institutions have little impact on FDI in extractive sectors, but strong institutions that promote democracy and property rights have been beneficial to FDI in agriculture (Campos and Kinoshita 2003; Rygh, Torgersen, and Benito 2022).
New empirical evidence
To assess the key drivers of FDI in a single consistent framework, a structural gravity model is applied to bilateral FDI flows data for a global sample of 188 countries over the period 2000-19. The gravity model—a workhorse empirical tool in international trade and investment analysis—explains FDI flows between any given pair of countries by their economic sizes, geographical distance, structural characteristics, macroeconomic conditions, policy factors, and strength of bilateral linkages and mutual barriers to capital flows (methodological details are provided in annex 5B).
Macroeconomic factors and structural characteristics
Market size. The results produced by the gravity model show that the market size of the recipient economy, as measured by its GDP, is positively associated with FDI inflows (table 5B.1). A 1 percent increase in the real GDP of a recipient country is associated with an increase of about 1 percent in FDI inflows (figure 5.7.A).19 This result is consistent with a meta-analysis of the literature and points to the significance of marketseeking motives underpinning FDI (Blonigen and Piger 2014).
The results also suggest that a recipient economy’s proximity to other sizable markets matters, providing evidence of the export-platform FDI motive. FDI inflows increase by about 0.5 percent for every 1 percent increase in the recipient country’s surrounding market potential, measured by the aggregate output of other countries weighted by the inverse of their distance to the recipient country. The capacity to bring this type of FDI is particularly beneficial for small economies whose own market size and production capacity make them less attractive as an FDI destination (Ekholm, Forslid, and Markusen 2007).
Productivity and technological intensity. Higher labor productivity facilitates FDI inflows: a 1 percent increase in labor productivity is associated with an increase in FDI inflows of about 0.7 percent (figure 5.7.A). Moreover, improvements in labor skills and research and development investment in the recipient economy relative to the source country encourage investment inflows from the latter to the former (table 5B.1). These results suggest that human capital development and technological progress should be among the priorities for EMDEs seeking to boost their FDI inflows.
19 Because the gravity model uses a nonlinear exponential specification, the estimated coefficients of logtransformed variables can be directly interpreted as elasticities, while the marginal effects of nontransformed variables are computed as 100*(e b - 1), where e is the exponent and b is the estimated coefficient from the gravity model. Annex 5B provides further details.
Financial market development. The analysis shows that countries with betterdeveloped financial markets tend to attract more FDI: an increase in the long-run average private-credit-to-GDP ratio of 1 percentage point is associated with an increase in FDI inflows of about 0.6 percent (figure 5.7.A). This result is consistent with findings in the literature showing that deep and liquid financial markets reduce the costs of financial transfers between MNEs and their foreign affiliates and business partners, and can thus facilitate FDI (Jude 2019; Mileva 2008).
Other country characteristics. The costs of starting a business and sovereign risk are among the factors that can negatively affect FDI inflows. Both factors affect investors’ perceptions of risk-adjusted returns on planned investment, particularly for greenfield investment (Cai, Gan, and Kim 2018). Therefore, elevated debt levels and rising debtservice burdens in many EMDEs constitute serious risks to FDI inflows (World Bank 2024a). The results also highlight the significance of natural resource-seeking motives of FDI, which are important for commodity-exporting EMDEs (table 5B.1). Large natural resource discoveries can also trigger FDI inflows into sectors other than the primary sector (Toews and Vezina 2022). Although empirical evidence generally suggests that FDI in extractive sectors tends to yield little growth dividend in recipient economies, access to critical minerals needed for the energy transition has gained importance as a motive of FDI (UNCTAD 2024a).
Quality of institutions
Strong institutions are especially important for greenfield FDI—the dominant form of FDI in EMDEs—which is often associated with substantial initial sunk costs and long planning horizons of investment projects. An investor-friendly business environment in the recipient economy is critical for attracting FDI. The results suggest that an improvement in the investment climate or institutional quality from the median to the highest quartile of the global sample tends to boost FDI inflows by up to one-fifth (figure 5.7.B).20 Likewise, the analysis shows that improvements in other institutional dimensions, such as quality of government bureaucracy, are conducive to FDI (table 5B.1).
Economic integration and fragmentation
Investment integration. Investment agreements are found to be associated with a significant boost in FDI: on average, investment treaties tend to increase FDI flows between signatory states by over two-fifths, controlling for other factors (figure 5.7.C). Further, the results indicate that statutory FDI restrictions significantly inhibit FDI flows: tightening FDI restrictions from the median to the highest quartile of the global sample tends to reduce FDI by over 7 percent.21 These results also corroborate previous findings (Ghosh, Syntetos, and Wang 2012; Mistura and Roulet 2019).
20 In this exercise, investment climate and institutional quality are measured by the International Country Risk Guide investment profile and rule of law indexes, respectively. The estimates reported in table 5B.1 are converted to marginal effects in the context of the sample median and interquartile ranges to ease interpretation.
21 A tightening of FDI regulations, measured by the Organisation for Economic Co-operation and Development FDI Regulatory Restrictiveness Index, from the most liberal level in the sample (for instance, Portugal and Slovenia) to the most restrictive (for instance, Libya), is associated with a decline in FDI inflows by four-fifths.
FIGURE 5.7 Drivers of FDI
Better macroeconomic conditions and strong institutions help to attract FDI. International economic integration—including through trade openness, investment treaties, and participation in global value chains—also promotes FDI. By contrast, statutory restrictions on FDI and geopolitical tensions inhibit FDI.
A. Effects of an improvement in macroeconomic characteristics on FDI inflows
B. Effects of an improvement in institutions on FDI inflows
C. Effects of investment integration and diplomatic disagreement on FDI inflows
Sources: Bailey, Strezhnev, and Voeten (2017); CEPII; Organisation for Economic Co-operation and Development, FDI Regulatory Restrictiveness Index; PRS Group, International Country Risk Guide (ICRG); United Nations Conference on Trade and Development; World Bank.
Note: The marginal effects are based on gravity model estimates reported in table 5B.1. Methodology details are reported in annex 5B. FDI = foreign direct investment; GVC = global value chain.
A. Bars show marginal effects on FDI inflows of a 1 percent increase in real GDP and labor productivity, and a 1-percentage-point increase in the average private-credit-to-GDP ratio.
B. Bars show marginal effects on FDI inflows of an increase from the sample median to the top quartile of ICRG law and order and investment profile indexes.
C. Bars show marginal effects on FDI inflows of the existence of an investment treaty with the FDI source country, an increase from the sample median to the top quartile of the FDI Regulatory Restrictiveness Index and an index measuring diplomatic disagreement with the FDI source country (Bailey, Strezhnev, and Voeten 2017).
D. Bars show marginal effects on FDI inflows of a 1-percentage-point increase in trade openness (sum of exports and imports as a percent of GDP) and GVC participation (value-added trade as a percent of exports).
Geopolitical factors. Escalating geopolitical tensions in recent years have undermined progress made in global economic integration and raised the risks of a retrenchment in FDI. To gauge the role of geopolitical factors in determining FDI, the analysis uses the bilateral diplomatic disagreement index constructed by Bailey, Strezhnev, and Voeten (2017) based on the similarity of United Nations voting patterns by a given pair of countries. The index ranges from 0 to 5, with higher values indicating a greater degree of diplomatic disagreement between pairs of countries. The results suggest that greater geopolitical disagreement between country pairs is associated with lower FDI flows
D. Effects of trade integration on FDI inflows
between them. Mutual FDI flows tend to be lower by about one-eighth between pairs of countries that are in the top quartile of this index than between those at the global sample median (figure 5.7.C). The results corroborate and expand recent empirical evidence on greenfield FDI (Aiyar, Malacrino, and Presbitero 2024).
Trade linkages. International trade is an integral part of cross-border production sharing and is closely intertwined with FDI (Adarov and Stehrer 2021). The analysis indicates that countries that are more open to trade tend to receive more FDI—an extra 0.6 percent in FDI for each percentage-point increase in the ratio of exports plus imports to GDP (figure 5.7.D). Greater integration into global value chains is also found to be conducive to both inward and outward FDI (table 5B.1).
Global economic fragmentation and FDI
The rise in geopolitical tensions in recent years has been accompanied by increased restrictions on FDI flows and international trade. Although EMDEs are generally more open to cross-border capital flows now than they were in the early 2000s, progress with global financial integration has stalled in recent years. EMDEs maintain more restrictive investment environments than advanced economies. Major economies are contemplating further trade and investment restrictions, jeopardizing FDI flows to EMDEs.
Rising geopolitical tensions
The global financial crisis and the associated global recession of 2009, the disruptions to global supply networks in 2020 and 2021 resulting from the COVID-19 pandemic, and worsening relations between some major economies have all had negative consequences for international trade and investment. The number of new investment agreements implemented since 2010 has more than halved relative to the first decade of the century, contributing to the slowdown in FDI flows (figure 5.8.A; UNCTAD 2024a). Moreover, in the past three years, the number of terminations of international investment treaties exceeded the number of new treaties signed over the same period (UNCTAD 2024a). Similarly, while trade growth fell to the slowest pace since 2000, trade integration has also slowed: the number of new trade agreements fell from an average of 11 in the 2010s to only 6 in the 2020s (figure 5.8.B; World Bank 2024a, 2025). Meanwhile, negotiations on reforming and reviving the multilateral trading system have stalled.
Given these developments, geopolitical risk has risen notably in recent years, reaching its highest levels since 2003 (figure 5.8.C). Economic policy uncertainty has also climbed to the highest levels since the turn of the century, in part reflecting global supply chain disruptions and macroeconomic shocks triggered by the COVID-19 pandemic (figure 5.8.D). High trade policy uncertainty undermines trade and output growth (World Bank 2024a). One outcome of elevated uncertainty is that cross-border investment has become increasingly concentrated in a declining number of MNEs (Ragoussis, Rigo, and Santoni 2024). Given the strong relationship between international trade and crossborder financial flows, these adverse trends are likely to put additional downward
pressure on FDI in EMDEs (Nebe, Economou, and Abruzzese 2024; UNCTAD 2024a).
FDI flows show increasing signs of decoupling along geopolitical fault lines (ECB 2024; UNCTAD 2024a; World Bank 2024d). The United States has reduced its sourcing from China while concurrently increasing its trade and FDI linkages with India, Mexico, and Viet Nam (Alfaro and Chor 2023; Freund et al. 2024; Kallen 2025). Russia’s invasion of Ukraine in 2022 was followed by rapid divestment by foreign firms from Russia (Evenett and Pisani 2023; World Bank 2023c).
The net effects of further fragmentation on FDI patterns are not yet fully clear, in part reflecting the fact that major adjustments of FDI activities involve substantial costs and require time to implement by MNEs; in the environment of high policy uncertainty, many investors adopt a “wait-and-see” approach (Blanchard et al. 2021; Myles 2025). Global economic fragmentation so far has primary affected certain “strategic” industries, such as ICT, transportation, and professional, scientific, and technical services (Tan 2024).
That said, recent surveys of global investors indicate that rising geopolitical risk, supply chain disruptions, and a more restrictive business regulatory environment are among the key factors shaping investors’ decisions that could significantly shift their usual FDI location choices (Citi 2025; Kearney 2025). Amid rising trade tensions and geopolitical risks, MNEs have been increasingly considering strategies to de-risk their business activities by shifting their production and trade toward geopolitically aligned countries (friend-shoring), toward countries in geographic proximity (near-shoring), or back to their home countries with local sourcing of intermediate inputs (re-shoring). Tit-for-tat escalation of international trade disputes and restrictions on cross-border investment will result in additional fragmentation of economic networks.
Higher trade costs driven by tariff hikes may incentivize MNEs to use FDI as an alternative way to gain access to the market of the country imposing tariffs (tariffjumping FDI). By contrast, higher tariffs increase the cost of production along global value chains, discouraging efficiency-seeking FDI. Most MNEs, however, are neither purely market-seeking nor efficiency-seeking, and the net effects of tariffs depend on specific investment project characteristics (Blanchard et al. 2021).22
Amid rising geopolitical tensions, the largest economies—China, the European Union, and the United States—experienced sizable contractions in both their inward and outward FDI flows in the past five years (figure 5.8.E). Outward FDI flows from the European Union and the United States more than halved as a share of GDP in 2018-23 relative to 2013-17. In these economies, the five-year average of FDI outflows as a share of GDP fell to a 20-year low during 2018-23.
22 Refer also to Roeger and Welfens (2022) for analysis of the cost effects of import tariffs offsetting the tariffjumping effect on FDI.
FIGURE 5.8 Global economic fragmentation
The formation of investment and trade agreements has slowed, while risk and policy uncertainty have risen notably in the 2020s. Major economies have experienced a slowdown in their inward and outward FDI between 2013-17 and 2018-23. Connector economies managed to capitalize on the trade and investment reorientation strategies of China and the United States to drive up their FDI inflows from one or both of these countries in recent years.
Sources: Baker, Bloom, and Davis (2016); Caldara and Iacoviello (2022); fDi Markets; Fernández-Villaverde, Mineyama, and Song (2024); United Nations Conference on Trade and Development; World Bank; World Trade Organization.
Note: EU = European Union; FDI = foreign direct investment; RHS = right-hand side; U.S. = United States.
A. Data include new international investment agreements in force as of April 2025.
B. Average number of new trade agreements in force per year, calculated through September 2024. Sample excludes agreements signed by the United Kingdom.
C. Diamonds show five-year averages of the monthly Caldara and Iacoviello global geopolitical risk index, and bars show five-year averages of the quarterly Fernández-Villaverde, Mineyama, and Song fragmentation index, where the last observations are April 2025 and 2024Q1, respectively.
D. Period averages of the monthly Baker, Bloom, and Davis economic policy uncertainty index. Last observation is March 2025.
E. Bars show average annual net FDI inflows or outflows.
F. Bars show cumulative values of announced greenfield
and 2020-24, by source economies.
and
Nam in
B. Trade agreements
A. Investment agreements
D. Economic policy uncertainty
C. Fragmentation and geopolitical risk F. Greenfield FDI inflows to connector economies
However, some EMDEs may also benefit from the reorientation of FDI flows driven by tariff-jumping and export-platform motives of FDI, occurring when an MNE establishes production in a host country primarily to export goods or services onward to thirdcountry markets rather than to serve the host country market itself. More specifically, FDI may be redirected to geopolitically aligned countries or those that satisfy criteria for political stability, regulatory quality, and other factors conducive to investment. Such developments have been reported with regard to the redirection of FDI flows to “connector” economies that have a favorable mix of FDI policies and structural characteristics. “Connector” countries are geopolitically nonaligned countries and can serve as conduits in trade and investment flows between geopolitical blocs (Aiyar and Ohnsorge 2024; Gopinath et al. 2024). Some connector economies—for instance, Indonesia, Mexico, Morocco, Poland, and Viet Nam—managed to capitalize on the trade and investment reorientation strategies of China and the United States to drive up FDI inflows from one or both of these countries in recent years (Bloomberg 2023; figure 5.8.F).
FDI screening and other regulatory restrictions
Fragmentation trends are likely to be accelerated by the increasing use of regulatory restrictions on international investment and trade aimed at reducing FDI and trade exposures to nonaligned geopolitical blocs.
Over the years, EMDEs have gradually eased statutory FDI restrictions—legal limits on the extent of foreign equity ownership, employment, investment, and other limitations on foreign firms. However, progress by EMDEs in reducing regulatory restrictions on FDI inflows made in the 2010s has stalled and reversed recently (figure 5.9.A). Since 2019, the number of restrictive FDI measures announced in EMDEs and their relative share in all FDI policy measures have increased. The level of restrictions remains much higher in EMDEs than in advanced economies, on average, particularly for foreign investors’ equity and foreign personnel (figure 5.9.B). Overall, capital accounts have remained more open in advanced economies than in EMDEs, especially LICs.
FDI screening mechanisms have become more widespread in recent years (figure 5.9.C). The number of countries with FDI screening in place more than doubled in the past decade, from 17 countries in 2014 to 41 countries in 2023. Some countries have adopted a general safeguard clause on national security in their investment laws. Others have imposed restrictions on FDI in specific sectors deemed to be sensitive from a national security standpoint, such as limits on foreign participation, which may provide formal grounds for rejecting unwanted FDI. Sectors deemed security-sensitive have included semiconductors, ICT, and critical energy and transportation infrastructure (Aiyar et al. 2023; IMF 2023a). Screening of outward FDI by advanced economies may also pose a potential threat to FDI flows to EMDEs (Myles 2024).
Likewise, the number of restrictions and trade-distorting policy measures has escalated in recent years (figure 5.9.D). Among newly introduced trade-distorting policies, the use of
FIGURE 5.9 Regulatory and policy restrictions
Announced FDI policy measures in EMDEs have become more restrictive in the 2020s. Regulatory restrictions on FDI remain much higher in EMDEs than in advanced economies, with the exception of FDI screening mechanisms. The number of countries with FDI screening in place more than doubled in the past decade, and the number of trade-distorting policy measures has escalated in recent years.
A. Announced FDI policy measures in EMDEs
B. Regulatory FDI restrictions
Sources: Global Trade Alert database; Organisation for Economic Co-operation and Development, FDI Regulatory Restrictiveness Index; UNCTAD (2024a); World Bank.
Note: EMDEs = emerging market and developing economies; FDI = foreign direct investment; RHS = right-hand side.
A. Sample includes 83 EMDEs. The line shows the number of announced restrictive FDI measures, and bars show the share of announced restrictive FDI measures in all announced FDI policy measures. 2025 includes announcements between January and April 2025.
B. Averages of indexes for overall FDI restrictions, foreign equity limits for FDI, foreign personnel restrictions, and screening and approvals for FDI. Sample includes 32 advanced economies and 51 EMDEs, and covers the period 2016-20.
C. Number of countries with FDI screening mechanisms in place, introduced, or expanded.
D. Data include policy measures affecting goods trade. Implemented interventions that discriminate against foreign commercial interests. Contingent trade-protective measures include trade defense instruments such as safeguard investigations and anticircumvention, antidumping, and countervailing measures. Subsidies cover state loans, financial grants, loan guarantees, production subsidies, and other forms of state support, excluding export subsidies. Adjusted data (for reporting lags) as of April 9, 2025.
subsidies has risen sharply since the pandemic. These policies have often been coupled with “buy local” provisions that further incentivize localized production and reduce reliance on foreign-sourced inputs.
As a result of these developments, further reconfiguration of global value chains will likely be accompanied by a shift in FDI to alternative locations, possibly including the source economies. For example, U.S. firms have recently diverted some investment from China to Mexico and Viet Nam, and U.S.-based MNEs in some sectors, such as semiconductors, plan to establish more activity within the United States (Alfaro and Chor
D. Trade-distorting policy measures
C. Inward FDI screening mechanisms
2023; Kurilla 2024; World Bank 2024d). Such reconfiguration of trade and investment networks could hinder global economic growth. For instance, re-shoring may lead to global output losses of up to 5 percent (IMF 2023b; Javorcik et al. 2022).
Unlike advanced economies, many EMDEs have continued to adopt policies favorable to foreign investors. Over four-fifths of the policy measures adopted by developing countries in 2023 were conducive to foreign investment, especially investment facilitation measures taken to increase the transparency and efficiency of investment-related regulations (UNCTAD 2024a). Similarly, FDI screening mechanisms are more widespread among advanced economies than EMDEs. As of 2023, about 40 countries had investment screening mechanisms in place, and a further 8 countries were expected to implement new ones. However, only 10 EMDEs had established screening mechanisms, and none were expected to implement new ones (UNCTAD 2023).
Policy priorities
The challenges associated with escalating trade tensions and fragmentation, policy uncertainty, and macroeconomic risks jeopardize global FDI flows and call for redoubled policy efforts in EMDEs. A comprehensive policy strategy should focus on a threepronged approach: attract FDI, amplify FDI benefits, and advance global cooperation to mitigate the costs of fragmentation. Key policy priorities include strengthening institutions, promoting macroeconomic stability, deepening financial markets, easing restrictions on cross-border investment and trade, reducing economic informality, and improving human capital. These policies can also help EMDEs to leverage FDI inflows to address key development challenges, including reduction of poverty and inequality, job creation, climate change, and greater economic inclusion for women. Coordinated global efforts are needed to uphold a rules-based international system for investment and trade, channel FDI toward countries with the largest investment gaps, and provide support for structural reforms.
Attract FDI
To attract FDI to their economies, policy makers in EMDEs should improve institutional quality, promote macroeconomic stability, and ease trade and investment restrictions. They should also pursue FDI-specific policies—in particular, easing regulatory restrictions on FDI. Other FDI-specific policies should be implemented after carefully considering their potential effects and trade-offs, because evidence of their effectiveness has been mixed.
Strengthen institutions and foster an investment-friendly business environment
In light of heightened geopolitical tensions, EMDEs should seek to assuage investor concerns by demonstrating a strong and stable commitment to improving the investment environment. EMDEs generally, and LICs in particular, have far lower institutional quality than advanced economies (figures 5.10.A-D). Yet progress in the quality of the business regulatory environment, control of corruption, and other institutional measures has largely stalled during the past decade in both LICs and EMDEs excluding LICs.
Besides other factors important for the investment climate, expropriation risks can adversely affect investor sentiment (Akhtaruzzaman, Berg, and Hajzler 2017; Busse and Hefeker 2007).
Structural reforms should be prioritized, especially in economies that are lagging in terms of institutional quality, such as many in Sub-Saharan Africa. Besides facilitating FDI inflows and bolstering their positive macroeconomic effects directly, strengthening institutions is important for improving other key structural characteristics conducive to FDI inflows, such as human capital development and financial market depth.
Promote macroeconomic stability, growth, and financial markets
Reforms promoting economic growth and macroeconomic stability are critical to attracting FDI. Policies that facilitate financial development and reduce sovereign risk also improve the investment climate. EMDEs—and LICs in particular—have much less developed financial markets than advanced economies. Sovereign risk in EMDEs also tends to be worse than in advanced economies, with only marginal improvement between 2000-11 and 2012-23 (World Bank 2024a). Although economic growth in EMDEs is stabilizing, significant downside risks remain.
Reduce barriers to cross-border trade and financial flows, including through investment and deep trade agreements
More open economies tend to be attractive destinations regardless of FDI motive. Integration agreements, especially those with deep trade and investment integration provisions, have been effective in facilitating cross-border investment (Mattoo, Rocha, and Ruta 2020; World Bank 2023b). Regional integration can be increasingly important for EMDEs to facilitate a conducive investment environment and mitigate the adverse effects of global economic fragmentation (Baek et al. 2023; Parente and Moreau 2024; UNCTAD 2024b). For the effectiveness of such agreements, it is crucial to align domestic investment laws with the standards set out in international agreements, ensure streamlined investment processes—via simplification of work permits, electronic access to laws and regulations, and technology transfer promotion—facilitate navigation of the country’s regulatory landscape, and strengthen institutions that prevent and resolve investor disputes (World Bank 2024f). To facilitate integration, regional infrastructure improvements are critical, and support for small and medium enterprises—via transparency of regulations and simplified procedures—are important because regional FDI is more likely to involve small and medium enterprises rather than large MNEs (UNCTAD 2024b).
Investment treaties are particularly effective in encouraging FDI in sectors and projects with higher sunk costs and capital intensity, which may face greater challenges in raising private sector funding (Colen, Persyn, and Guariso 2016). For instance, the African Continental Free Trade Area has the potential to increase FDI received in Africa by up to about 85 and 120 percent from countries in the region and from the rest of the world, respectively (Echandi, Maliszewska, and Steenbergen 2022).
FIGURE 5.10 Quality of institutions
Progress with institutional reform has stalled in the past decade. EMDEs score lower than advanced economies across a range of measures of institutional quality. Institutions tend to be especially weak in LICs. These conditions hinder both FDI inflows and their macroeconomic benefits.
A. Investment climate
Index, 0-12, 12 = highest
excl.
C. Democratic accountability
Index, 0-6, 6 = highest
2000-112012-242000-112012-242000-112012-24
excl. LICs LICsAdvanced economies
D. Business regulatory environment
Index, 1-6, 6 = highest
EMDEs excl. LICsLICs
Sources: PRS Group, International Country Risk Guide (ICRG); World Bank; World Bank, Country Policy
(CPIA) database.
Note: Bars show group medians of institutional quality index values. EMDEs = emerging market and developing economies; FDI = foreign direct investment; LICs = low-income countries.
A.-C. ICRG’s investment profile, control of corruption, and democratic accountability indexes. Sample includes 36 advanced economies and 102 EMDEs, of which 18 are LICs.
D. CPIA’s business regulatory environment index. Sample includes 83 EMDEs, of which 22 are LICs.
Ease FDI restrictions
The trend in EMDEs has been to reduce FDI restrictions, but policies in EMDEs still tend to be more restrictive than those in advanced economies (figure 5.9). Reductions in statutory restrictions on FDI have been found to boost cross-border investments (Mistura and Roulet 2019). For instance, in Türkiye, the reduction of FDI screening, accompanied by a simplified registration process for foreign firms, was associated with a tenfold increase in FDI inflows between 2003 and 2006 (World Bank 2021c).
Carefully consider investment promotion agencies, special economic zones, and fiscal incentives
Investment promotion agencies (IPAs) can establish a broad framework of arrangements to attract foreign investors with such goals as job creation and productivity and technology spillovers (EBRD 2024; Harding and Javorcik 2011, 2013; Steenbergen 2023). IPAs
B. Control of corruption
can facilitate a strategic approach to FDI that is consistent with national development strategies. Among other objectives, IPAs can help steer investment toward sectors with the greatest needs and projects that support the energy transition and sustainable development. However, the effectiveness of IPAs depends on the quality of monitoring, evaluation, and other investment management processes (OECD 2019; World Bank 2021c, 2022b). EMDEs, especially LICs, often suffer from the poor quality of their investment management processes and need to accelerate structural reforms to improve relevant institutions and regulatory frameworks (Adarov and Panizza 2024; World Bank 2024c).
Special economic zones (SEZs)—specific geographic areas within which governments establish preferential regulations for private investors—have been used to attract FDI via tax incentives, import duty exemptions, special customs procedures, land access, streamlined employment regulations, and other measures.23 After the creation of the Masan SEZ in the Republic of Korea in 1970, for example, the SEZ succeeded in attracting more than $80 million in FDI in 1975, which resulted in over a tenfold increase in the share of locally sourced inputs in the country’s electronics sector over 1971-86 (Aggarwal 2012; Farole 2011b). In Poland, 14 SEZs had, by 2018, cumulatively attracted investments worth $35 billion and created nearly half a million jobs (UNCTAD 2019). Although SEZs can help attract FDI and steer investment to where it is needed most, they can also be costly, and the net benefits are not always clear. By some estimates, many of the over 5,000 SEZs active in the world fail to generate significant investment or create much positive economic impact (UNCTAD 2019).
Taxes and subsidies can alter the incentives of MNEs to invest in a country. However, fiscal incentives should be used judiciously by policy makers to avoid market distortions and ensure that their long-run economic benefits outweigh the costs. FDI can be stimulated through investment allowances, as well as tax credits and deductions related to investment and reinvested earnings. Fiscal incentives can also be implemented to steer or discourage FDI in certain sectors or business activities. For instance, emissions can be penalized, or accelerated depreciation may be offered to investors (Sauvant, Stephenson, and Kagan 2021; Wermelinger 2023). Subsidies have also been used extensively to increase the attractiveness of certain locations or sectors for foreign investors. However, subsidies can also be costly and distortive, and thus their net long-run benefits must be carefully assessed. For instance, subsidies given with the goal of job creation may lead to employment in MNEs, but without an increase in employment in nontargeted firms and with little improvement in human capital and technology (Burger, Jaklic, and Rojec 2012; Delevic 2020). Similarly, tax incentives can lead to a loss in government revenue (UNCTAD 2000).
Amplify FDI benefits
Beyond attracting FDI, it is equally important for EMDEs to accelerate policy interventions that amplify the social and economic benefits of FDI. The policies outlined in the
23 For SEZs, refer also to Farole (2011a), Javorcik and Steenbergen (2017), UNCTAD (2019), and World Bank (2017).
following sections—some of which also help to attract FDI—can help ensure that EMDEs reap benefits that align with country-specific needs.
Undertake reforms to maximize the positive effects of FDI
A range of country-specific conditions and policies can support stronger positive effects of FDI. For example, stronger institutions not only promote FDI inflows but also help to improve the effects of FDI on output growth. The empirical analysis in this chapter suggests that FDI may fail to generate significant growth benefits when country characteristics are not conducive. The results indicate that facilitating trade integration, improving the quality of institutions, fostering human capital, and decreasing informality can all boost the macroeconomic benefits of FDI. With supportive conditions in place, FDI can help trigger sustained investment accelerations, facilitate job creation, and support potential output growth in recipient countries.24
Channel FDI to areas that generate greater impact
It is critical for EMDEs to implement policies to attract FDI that generates greater returns in terms of macroeconomic outcomes, including private capital mobilization and creation of new jobs. Greenfield FDI is particularly important in EMDEs for output growth and domestic investment. Manufacturing sector FDI has often delivered especially large macroeconomic benefits for recipient countries. With conducive reforms, FDI can also help reduce poverty and income inequality, and increase economic opportunities for women. For example, recent evidence shows that foreign affiliates of MNEs tend to have a higher share of female employees than domestic firms, and legal frameworks promoting nondiscrimination in hiring, equal pay, and promotion are important for reducing wage disparities between men and women.25
Ensure that FDI supports the energy transition and helps address climate change
Policy makers should aim to align their FDI frameworks and related environmental policies more closely with key development goals. Policies in recipient countries can incentivize investment in projects that contribute to climate adaptation and mitigation. They can also encourage greater use of renewable energy and clean technologies while strengthening biodiversity and nature conservation. Recent analysis, however, suggests that private investment in climate adaptation has not been sufficient. FDI can boost the contribution of private capital to addressing these pressing issues (World Bank 2021a, 2021b).
Advance global cooperation
EMDEs can take steps to mitigate risks and reenergize FDI by avoiding restrictive measures and promoting global economic cooperation, including through multilateral organizations.
24 For investment accelerations and implications for potential output, refer to World Bank (2024g) and Kose and Ohnsorge (2024), respectively.
25 For the effects of FDI on poverty reduction and income inequality, refer to Aloui, Hamdaoui, and Maktouf (2024) and Huang, Sim, and Zhao (2020). For the implications of FDI for gender equality, refer to Heckl, Lennon, and Schneebaum (2025), Montinari (2023), and UNCTAD (2021).
Improve global cooperation to mitigate risks
Despite rising geopolitical tensions, cooperation through international fora should be reinforced wherever possible, with the goal of restoring a rules-based order. In 2024, for example, 125 members of the World Trade Organization reached an agreement to strengthen cross-border cooperation on FDI to support sustainable development and investment in developing countries. The agreement aims to enhance the transparency and predictability of investment-related measures, facilitate interactions between investors and governments, and encourage sustainable investment.
When formal agreements are not feasible, establishing a consultative framework can be helpful. The United Nations Conference on Trade and Development, for example, recently launched a Multi-Stakeholder Platform on IIA Reform to foster cross-country dialogue and identify ways to fast-track reforms to bolster international investment agreements (UNCTAD 2024a). The OECD/G20 Inclusive Framework on BEPS (base erosion and profit shifting) is another example. The framework is designed to create a level playing field for high-tax and low-tax jurisdictions by eliminating distortions affecting investment, which give rise to profit shifting by MNEs. This is particularly important for EMDEs adversely affected by profit shifting in terms of losses of government revenue (Crivelli, De Mooij, and Keen 2016). The framework will also help create a more favorable business environment, as competition for investment will be more likely to occur through nontax measures (Owens and Wamuyu 2024).
Enhance multilateral support for private capital mobilization and structural reforms, especially in LICs
The global community should accelerate policy initiatives that can help direct FDI flows to countries with the largest investment gaps, especially LICs. Technical and financial assistance are essential to support the implementation of reforms critical for promoting FDI inflows and maximizing their benefits. LICs have particularly large investment gaps but limited capacity to implement the necessary structural reforms.
Multilateral development banks and development finance institutions have taken an increasingly active role in mobilizing private capital. In 2023, these institutions mobilized a record $88 billion in private capital for investment in low- and middle-income countries (AfDB et al. 2025). Greater cooperation among multilateral institutions can maximize such outcomes. The World Bank and the African Development Bank, for example, formed a partnership to provide electricity to 300 million people in Africa by 2030, an initiative that is expected to generate $9 billion in private investment for renewable energy (World Bank 2024c). The World Bank’s recent initiatives to accelerate global policy efforts to reduce barriers to private investment, such as the Private Sector Investment Lab and the new World Bank Group Guarantee Platform, can help mitigate risks for private investors and mobilize private capital in EMDEs, including FDI (Bjerde et al. 2024; World Bank 2024b).
For much of the last 50 years, global economic integration has powered the growth and development of EMDEs—with FDI constituting one of the main propellants. Slowing
momentum in global integration could leave EMDEs—especially LICs—in a particularly precarious position, given their large investment gaps. It risks derailing progress toward key development goals. Turning the tide will depend on robust policy responses, at both national and global levels.
Conclusion
Investment growth in EMDEs has slowed markedly over the past decade. This slowdown has left vast infrastructure gaps unmet and severely hampered efforts to end global poverty and inequality, and address the urgent challenges of climate change. FDI offers an important source of funding to close investment gaps and can bring multiple additional benefits by boosting economic growth, facilitating private capital mobilization, creating jobs, and contributing to progress toward development- and climate-related goals.
In EMDEs, the median ratio of net FDI inflows to GDP dropped from a peak of almost 5 percent in 2008 to just over 2 percent in 2023. This decline was widespread, with the FDI-to-GDP ratio lower in three-fifths of EMDEs in 2012-23 relative to 2000-11. The weakness in FDI is likely to continue in the near term in light of subdued growth prospects and loss of reform momentum in EMDEs, elevated global trade tensions, policy uncertainty, and heightened geopolitical risks.
A three-pronged strategy involving national and global policy interventions is needed to attract FDI, nurture its positive effects, and advance global cooperation to support FDI flows. Attracting more FDI and unlocking its full potential to boost economic growth require sustained policies to strengthen institutions, improve the investment climate, liberalize trade and investment, foster stable macroeconomic conditions, reduce economic informality, and improve human capital development. These policies are critical especially for LICs that lag behind in most of these dimensions. FDI can play an instrumental role in mobilizing additional private capital, and reforms that enhance the potential of FDI to crowd in domestic private investment should be prioritized.
Cooperative policy efforts at both bilateral and multilateral levels are essential to uphold a rules-based system that promotes cross-border investment flows and mitigates the costs of fragmentation. The balance of risks and opportunities should be considered judiciously by policy makers in the design of FDI policies to avoid market distortions and uphold a nondiscriminatory regulatory framework. The global community should also accelerate policy initiatives that can help direct FDI flows to countries with the largest investment gaps, especially LICs, including through the provision of technical and financial assistance to aid implementation of the structural reforms critical for promoting FDI inflows and maximizing their benefits.
ANNEX 5A Impact of FDI on economic growth: Data and methodology details
This annex describes the data and the methodological framework used in the estimation of the effects of FDI on economic growth discussed in box 5.2.
Data and sample
The analysis is based on strongly balanced annual data of 74 EMDEs spanning the period 1995-2019. Real net FDI inflows, real GDP, and real gross fixed capital formation data (all in constant 2015 U.S. dollars) are from the World Bank’s World Development Indicators database, as are private credit, trade openness (sum of exports and imports as a share of GDP), and educational attainment data. Total factor productivity (TFP) and employment data are from Penn World Table 10.1. Institutional quality indexes are from the PRS Group’s International Country Risk Guide (ICRG) and the World Bank’s Country Policy and Institutional Assessment data sets. Greenfield FDI and M&A FDI data are obtained from the United Nations Conference on Trade and Development. Informal employment and output are from Elgin et al. (2021).
Estimation framework
The analysis employs a heterogeneous panel vector autoregression (PVAR) framework developed by Pedroni (2013) to study the relationship between FDI and output growth. This approach addresses a range of limitations in conventional panel data estimation approaches that have been used to study the growth effects of FDI, including crosscountry heterogeneity of the macroeconomic effects of FDI, two-way causality between FDI and output growth, and heterogeneous time horizons over which the effects of FDI may manifest. These caveats may result in inconsistent or imprecise estimates.
The approach used in this chapter accounts for cross-country heterogeneity and interdependence among countries. Besides ensuring consistent estimation of endogenous responses—given that the underlying dynamics are likely to be heterogeneous for the relationship between FDI and growth in a broad sample—this approach also enables the analysis of country characteristics that can accentuate or temper the causal mechanisms through which FDI affects growth. If unaddressed, latent heterogeneity would arise in the lagged dependent variables of the vector autoregression (VAR), leading to inconsistent estimation. Addressing other limitations in the related empirical literature, this framework can be implemented for a relatively short annual time series—a binding constraint for EMDEs—in contrast to estimating individual country VAR models.
The baseline estimations use a bivariate heterogeneous PVAR system that includes the log of FDI and the log of output. The equations are estimated in their demeaned log differenced forms so that, for example, the initial two-variable system can be represented by the following vector, for countries i = 1, …, N and years t = 1, …, T: ΔZit = (ΔlnFDIit , ΔlnGDPit)'. The estimation procedure includes the following steps:
Step 1. A VAR model based on the specified variables is estimated individually for each country i of the sample. This can be represented as Ri (L)ΔZit = µ it where
such that Ri,j represents the country-specific matrices of VAR coefficient estimates for lags j = 1, …, Pi where the country-specific lag lengths are selected using the standard Akaike Information Criterion.
Step 2. These country VAR models are then supplemented with one additional globallevel VAR, based on the cross-sectional averages of the same variables, namely ,
so that the VAR for the cross-sectional averages takes the analogous form
Each of these VAR systems is then inverted into its respective orthogonalized vector moving average representation from which impulse responses can be derived, namely ΔZ ZZ Zit = Ai (L)εit , where
for the country-specific VAR models, and analogously for the global VAR model based on the cross-sectional averages.
The objects of interest are the responses of the log levels. The VAR estimation is done using the stationary log-differences form, and the responses of the variables of interest are recovered by accumulating the resulting impulse responses.
The baseline analysis uses the standard Cholesky decomposition of the short-run covariance matrix, which implies a recursive short-run impact matrix. The ordering of the variables in the system implies that FDI affects output in the same year, because of the direct effect on capital formation incorporated in GDP and productivity spillovers affecting growth. By contrast, FDI is assumed to respond to changes in GDP with a lag because both greenfield and brownfield investment transactions require time to plan and implement in the recipient economy by foreign investors.
For any given orthogonalization of the shocks, the correlation between country-specific shocks εit and global shocks εt can be used to obtain consistent estimates of the loading vector Λi and to decompose the composite εit shocks into common global εt shocks and idiosyncratic country-specific εit shocks in a standard factor representation form . These Λi loadings can in turn be used to obtain the country-specific impulse responses to the idiosyncratic and common shocks as and .
This approach yields a cross-sectional distribution of N country-specific impulse responses to each shock.
As a robustness check, a second scheme is based on the Cholesky decomposition of the long-run covariance matrix which implies a recursive long-run response matrix,
sometimes also referred to as a Blanchard and Quah (1989) decomposition. The ordering of the endogenous variables is the same as in the first scheme but is applied to the long-run covariance matrix rather than the short-run covariance matrix. This approach allows for the assessment of long-run growth responses to permanent shocks in FDI. As part of robustness checks, the analysis also explored models with alternative ordering schemes and a five-variable system that included net FDI inflows, TFP, employment, gross fixed capital formation, and GDP as endogenous variables. The results in all cases were consistent with the baseline model.
ANNEX 5B Drivers of FDI: Methodology and estimation details
This annex describes the data and the methodological framework used in the estimation of the factors that affect bilateral FDI flows.
Data and sample
The analysis uses bilateral FDI data from the International Monetary Fund, Organisation for Economic Co-operation and Development, United Nations Conference on Trade and Development, and national sources, consolidated by the World Bank (World Bank Group Harmonized Bilateral FDI Database, Steenbergen et al. 2022). The data for the macroeconomic variables are obtained from CEPII Gravity, the World Bank’s World Development Indicators, and Penn World Table 10.1 databases. Institutional quality indexes are from the PRS Group’s ICRG data set. The FDI restrictiveness index is from the Organisation for Economic Co-operation and Development. The FDI openness index is from the International Monetary Fund’s Structural Reform Database. The investment treaty variable is developed using data from the Electronic Database of Investment Treaties (Alschner, Elsig, and Rodrigo 2021). The bilateral geopolitical disagreement index based on Bailey, Strezhnev, and Voeten (2017) is sourced from CEPII. The country-specific geopolitical risk index is from Caldara and Iacoviello (2022). Bilateral global value chain (GVC) participation is computed as the share of GVC-related output of an exporter in its gross exports to an importing country, based on data from Borin, Mancini, and Taglioni (2021). Nominal variables are converted to 2015 constant U.S. dollars. The sample includes 188 economies over the period 2000-19.
Gravity model methodology
Under the gravity framework (Bergstrand 1989; Tinbergen 1962), bilateral FDI flows or stocks between FDI source and recipient countries i and j in the basic form are modeled as a function of their economic size, proxied by GDP, and the distance between them. The later empirical literature, in order to capture multilateral and bilateral resistance factors, incorporates a range of additional variables—macroeconomic conditions and structural characteristics of the source and recipient countries, global factors, and bilateral frictions, such as the existence of an integration agreement, and social and cultural proximity (Anderson and van Wincoop 2003). This analysis consolidates a variety of push, pull, and bilateral factors in a single consistent framework and uses harmonized
global bilateral FDI data to gauge their relative importance. Most of these characteristics can be captured via country-year and country pair fixed effects. However, because the goal of the analysis is to identify country-specific and bilateral factors influencing FDI flows, the following specification is estimated as a baseline:
where FDIijt denotes the real value of FDI flow from country i to country j in year t; GDPit and GDPjt are the real GDP values of the source and recipient countries (in logs); and distij is the bilateral population-weighted distance between them (in log). Yijt is the vector of other bilateral variables that are conjectured to explain FDI flows from country i to country j, such as the existence of a common border, investment and trade treaties between the countries, and other variables outlined further.
The vectors of variables Xit and Xjt include country-specific factors that may affect FDI. These variables enter symmetrically in the gravity model specification—that is, they are included for both the source and the recipient country. Conceptually, the characteristics of the source country i can be viewed as “push” factors, and those of the recipient country j as “pull” factors affecting FDI flows. For clearer exposition, the explanatory variables are partitioned into several thematic categories: macroeconomic characteristics, institutional quality, and economic integration and fragmentation.
Macroeconomic characteristics. The set of variables includes real GDP of the source and recipient countries (in logs); surrounding market potential of the recipient country, computed as the GDP of all countries, weighted by the distance to the recipient country, excluding the latter (log); bilateral exchange rate (source country currency to the recipient country currency, log); private credit as a percent of GDP; sovereign risk (based on Fitch, Moody’s, and S&P ratings, converted to a numerical scale from 1 to 21, where higher values indicate higher risk); labor productivity (output per hour worked, log); cost of business start-up procedures as a percent of gross national income per capita; and natural resource rents as a percent of GDP.
Furthermore, to gauge the importance of relative human capital and technological intensity differential between the source and destination countries on a bilateral basis, the model incorporates the following variables.
Relative skill endowment, computed as follows: where skilled and unskilled are the population shares with and without tertiary education, respectively. Higher values indicate relatively more skilled labor in the recipient country j than in the source country i
Research and development (R&D) expenditure ratio differential, computed as the ratio of R&D expenditures in the recipient country (share of GDP) to the R&D expenditures in
the source country (share of GDP). Higher values indicate greater R&D intensity in the recipient country relative to the source country.
In line with the literature, each specification includes bilateral gravity variables capturing geographic and cultural proximity between country pairs: population-weighted distance (log), and dummy variables for a common border, common language, common colonizer in the past, common origin of the country’s legal system, and common religion.
Institutional quality. The set of variables includes ICRG indexes of investment profile, law and order, bureaucracy quality, and political risk. Higher values of these indexes indicate better institutional quality.
Economic integration and fragmentation. The vector of variables includes the following bilateral variables: an investment agreement dummy variable (= 1 if there is a bilateral or multilateral investment agreement between the source and the destination countries); a trade agreement dummy variable; the diplomatic disagreement index (higher values indicate greater diplomatic disagreement between the source and the destination countries, based on Bailey, Strezhnev, and Voeten 2017); and bilateral GVC participation (share of GVC-related output in bilateral trade). Country-specific variables include the FDI openness index; the FDI restrictiveness index; trade openness (the sum of exports and imports as a percent of GDP); and the geopolitical risk index (Caldara and Iacoviello 2022).
The model is estimated via a Poisson pseudo-maximum likelihood estimator, which accounts for zero FDI flows and allows for consistent estimation of fixed effects (Santos Silva and Tenreyro 2006). To mitigate possible collinearity, the explanatory variables listed above are included in the model sequentially, controlling for the canonical gravity variables—log of GDP of the source and recipient countries, log of bilateral distance, and dummy variables for common border, language, religion, historical colonizing country, and origin of the legal system. In addition, each specification includes country fixed effects for source and recipient countries to control for time-invariant country characteristics, as well as year fixed effects to control for common shocks such as global commodity shocks and changes in global risk perception. Standard errors are clustered by country pair and year. In addition to the baseline specification, the impact of investment treaties between the source and the recipient countries is estimated using country pair fixed effects and year fixed effects to mitigate endogeneity issues. For robustness, in addition to the full-sample baseline specification, the model was also estimated dropping offshore financial centers (both FDI source and destination countries)—the results were similar to the baseline model.
Because the model has a nonlinear exponential form, the estimated coefficients for the variables expressed in logarithms directly convey elasticities; for other variables the marginal effect—the impact on FDI in percent—is computed as 100(e b - 1), where e is the exponent and b is the estimated coefficient.
TABLE 5B.1 Determinants of FDI
A. Macroeconomic characteristics
A1. Market size
RealGDP(log)
Surroundingmarketpotential(log)
A2. Macroeconomic conditions
Exchangerate,source-to-recipientcurrency(log)
Financialdevelopment(privatecredit,percentofGDP)
Sovereignriskrating(1-21;21=highrisk)
A3. Productivity and competitiveness
Relativeskillendowment
R&Dexpenditureratiodifferential
Laborproductivity(log)
Costofstartingabusiness(percentofGNIpercapita)
Naturalresourcerents(percentofGDP)
B. Institutional quality
Investmentprofileindex,ICRG(0-12;12=high)
Lawandorderindex,ICRG(0-6;6=high)
Bureaucracyqualityindex,ICRG(0-6;6=high)
Politicalriskindex,ICRG(0-100;100=lowrisk)
C. Economic integration and fragmentation
C1. Investment integration
C2. Trade integration Tradeagreement
Tradeopenness(sumofexportsandimports,percentofGDP)
C3. Geopolitical factors
Diplomaticdisagreementindex(0-5;5=highdisagreement)
Source: World Bank.
Note: The table shows estimated coefficients from gravity model regressions of bilateral real net FDI flows (in logs) on a set of countryspecific and bilateral variables. Additional details are provided in annex 5B. For brevity, only point estimates are shown, along with their statistical significance based on standard errors clustered by country pair and year. FDI = foreign direct investment; GNI = gross national income; GVC = global value chain; ICRG = International Country Risk Guide. *, **, *** indicate significance at the 10, 5, and 1percent levels, respectively.
References
Abdo, A. B., B. Li, X. Zhang, J. Lu, and A. Rasheed. 2020. “Influence of FDI on Environmental Pollution in Selected Arab Countries: A Spatial Econometric Analysis Perspective.” Environmental Science and Pollution Research 27 (22): 28222-46.
Acharyya, J. 2009. “FDI, Growth and the Environment: Evidence from India on CO2 Emissions during the Last Two Decades.” Journal of Economic Development 34 (1): 4358.
Acharya, V., H. S. Shin, and T. Yorulmazer. 2011. “Fire Sale FDI.” Korean Economic Review 27: 163-202.
Adarov, A. 2022. “Financial Cycles around the World.” International Journal of Finance and Economics 27 (3): 3163-201.
Adarov, A., and M. Ghodsi. 2023. “Heterogeneous Effects of Non-tariff Measures on Cross-border Investments: Bilateral Firm-level Analysis.” Review of International Economics 31 (1): 158-79.
Adarov, A., and U. Panizza. 2024. “Public Investment Quality and Its Implications for Sovereign Risk and Debt Sustainability.” Policy Research Working Paper 10877, World Bank, Washington, DC.
Adarov, A., and R. Stehrer. 2021. “Implications of Foreign Direct Investment, Capital Formation and Its Structure for Global Value Chains.” World Economy 44 (11): 324699.
AfDB (African Development Bank), Asian Development Bank, Asian Infrastructure Investment Bank, Corporacion Andino de Fomento, European Bank for Reconstruction and Development, European Development Finance Institutions, European Investment Bank, et al. 2025. Mobilization of Private Finance by Multilateral Development Banks and Development Finance Institutions. Washington, DC: International Finance Corporation.
Aggarwal, A. 2012. “SEZ-led Growth in Taiwan, Korea, and India: Implementing a Successful Strategy.” Asian Survey 52 (5): 872-99.
Aguiar, M., and G. Gopinath. 2005. “Fire-Sale Foreign Direct Investment and Liquidity Crises.” Review of Economics and Statistics 87 (3): 439-52.
Ahn, J., S. Aiyar, and A. F. Presbitero. 2024. “Productivity Spillovers from FDI: A Firm-Level Cross-Country Analysis.” Working Paper 15/2024, Bruegel, Brussels.
Aiyar, S., J. B. Ahn, A. Habib, D. Malacrino, D. Muir, and A. Presbitero. 2023. “Geopolitics and the Cost of FDI Fragmentation.” In Geoeconomic Fragmentation: The Economic Risks from a Fractured World Economy, edited by S. Aiyar, A. Presbitero, and M. Ruta, 117-26. Paris: Centre for Economic Policy Research.
Aiyar, S., D. Malacrino, and A. Presbitero. 2024. “Investing in Friends: The Role of Geopolitical Alignment in FDI Flows.” European Journal of Political Economy 83: 102508.
Aiyar, S., and F. Ohnsorge. 2024. “Geoeconomic Fragmentation and ‘Connector’ Countries.” CEPR Discussion Paper 19352, Centre for Economic Policy Research, London.
Akhtaruzzaman, M., N. Berg, and C. Hajzler. 2017. “Expropriation Risk and FDI in Developing Countries: Does Return of Capital Dominate Return on Capital?” European Journal of Political Economy 49 (September): 84-107.
Albornoz, F., M. A. Cole, R. J. R. Elliott, and M. G. Ercolani. 2009. “In Search of Environmental Spillovers.” World Economy 32 (1): 136-63.
Alfaro, L. 2003. “Foreign Direct Investment and Growth: Does the Sector Matter?” Working Paper, Harvard Business School, Boston, MA.
Alfaro, L. 2017. “Multinational Activity in Emerging Markets: How and When Does Foreign Direct Investment Promote Growth?” Geography, Location, and Strategy Advances in Strategic Management 36: 429-62.
Alfaro, L., A. Chanda, S. Kalemli-Ozcan, and S. Sayek. 2004. “FDI and Economic Growth: The Role of Local Financial Markets.” Journal of International Economics 64 (1): 89-112.
Alfaro, L., and A. Charlton. 2013. “Growth and the Quality of Foreign Direct Investment.” In The Industrial Policy Revolution I, edited by J. E. Stiglitz and J. Y. Lin, 162204. London: Palgrave Macmillan.
Alfaro, L., and M. X. Chen. 2018. “Transportation Cost and the Geography of Foreign Investment.” In Handbook of International Trade and Transportation, edited by B. Blonigen and W. W. Wilson, 369-406. London: Edward Elgar Publishing.
Alfaro, L., and D. Chor. 2023. “Global Supply Chinas: The Looming ‘Great Reallocation.’” NBER Working Paper 31661, National Bureau of Economic Research, Cambridge, MA.
Alguacil, M., A. Cuadros, and V. Orts. 2011. “Inward FDI and Growth: The Role of Macroeconomic and Institutional Environment.” Journal of Policy Modeling 33 (3): 48196.
Aloui, Z., M. Hamdaoui, and S. Maktouf. 2024. “Does Governance Matter to Ensure Significant Effect of Foreign Direct Investment on Poverty Reduction? Evidence from Developing and Emerging Countries.” Transnational Corporations Review 16 (2): 200058.
Alschner, W., M. Elsig, and P. Rodrigo. 2021. “Introducing the Electronic Database of Investment Treaties (EDIT): The Genesis of a New Database and Its Use.” World Trade Review 20 (1): 73-94.
Amighini, A. A., M. S. McMillan, and M. Sanfilippo. 2017. “FDI and Capital Formation in Developing Economies: New Evidence from Industry-Level Data.” NBER Working Paper 23049, National Bureau of Economic Research, Cambridge, MA.
Anderson, J. E. and E. van Wincoop. 2003. “Gravity with Gravitas: A Solution to the Border Puzzle.” American Economic Review 93 (1): 170-92.
Ang, J. B. 2009. “Financial Development and the FDI-Growth Nexus: The Malaysian Experience.” Applied Economics 41 (13): 1595-601.
Ashraf, A., and D. Herzer. 2014. “The Effects of Greenfield Investment and M&As on Domestic Investment in Developing Countries.” Applied Economics Letters 21 (14): 9971000.
Aykut, D., and D. Ratha. 2004. “South-South FDI Flows: How Big Are They?” Transnational Corporations 13 (1).
Aykut, D., A. Sanghi, and G. Kosmidou. 2017. “What to Do When Foreign Direct Investment Is Not Direct or Foreign: FDI Round Tripping.” Policy Research Working Paper 8046, World Bank, Washington, DC.
Aykut, D., and S. Sayek. 2007. “The Role of the Sectoral Composition of Foreign Direct Investment on Growth.” In Do Multinationals Feed Local Development and Growth?, edited by L. Piscitello and G. D. Santangelo, 35-59. Amsterdam: Elsevier.
Azman-Saini, W. N. W., S. H. Law, and A. H. Ahmad. 2010. “FDI and Economic Growth: New Evidence on the Role of Financial Markets.” Economics Letters 107 (2): 211-13.
Baek, N., K. Chahande, K. M. Eklou, T. Kinda, V. Nahata, U. Rawat, and A. Stepanyan. 2023. “ASEAN-5: Further Harnessing the Benefits of Regional Integration amid Fragmentation Risks.” IMF Working Paper 23/191, International Monetary Fund, Washington, DC.
Bailey, M., A. Strezhnev, and E. Voeten. 2017. “Estimating Dynamic State Preferences from United Nations Voting Data.” Journal of Conflict Resolution 2 (61): 430-56.
Bailey, N. 2018. “Exploring the Relationship between Institutional Factors and FDI Attractiveness: A Meta-Analytic Review.” International Business Review 27 (1): 139-48.
Baker, S. R., N. Bloom, and S. J. Davis. 2016. “Measuring Economic Policy Uncertainty.” Quarterly Journal of Economics 131 (4): 1593-636.
Balaguer, J., A. Cuadros, and J. García-Quevedo. 2023. “Does Foreign Ownership Promote Environmental Protection? Evidence from Firm-Level Data.” Small Business Economics 60: 227-44.
Benassy-Quere, A., M. Coupet, and T. Mayer. 2007. “Institutional Determinants of Foreign Direct Investment.” World Economy 30 (5): 764-82.
Benetrix, A., H. Pallan, and U. Panizza. 2022. “The Elusive Link between FDI and Economic Growth.” CEPR Discussion Paper 17692, Centre for Economic Policy Research, London.
Bengoa, M., and B. Sanchez-Robles. 2003. “Foreign Direct Investment, Economic Freedom and Growth: New Evidence from Latin America.” European Journal of Political Economy 19 (3): 529-45.
Bergstrand, J. H. 1989. “The Generalized Gravity Equation, Monopolistic Competition and the Factor-Proportions Theory in International Trade.” Review of Economics and Statistics 71 (1): 143-53.
Bialek, S., and A. Weichenrieder. 2015. “Do Stringent Environmental Policies Deter FDI? M&A versus Greenfield.” CESIFO Working Paper 5262, Center for Economic Studies, University of Munich.
Bircan, Ç. 2019. “Ownership Structure and Productivity of Multinationals.” Journal of International Economics 116 (January): 125-43.
Bjerde, A, M. Diop, A. Kant, H. Matano, A. van Trotsenburg, and W. Zhang. 2024. “New Platform Leverages Power of Guarantees to Boost Private Financing.” Voices (blog), July 15, 2024. https://blogs.worldbank.org/en/voices/new-platform-leveragespower-of-guarantees-to-boost-private-financing.
Blalock, G., and P. J. Gertler. 2008. “Welfare Gains from Foreign Direct Investment through Technology Transfer to Local Suppliers.” Journal of International Economics 74 (2): 402-21.
Blanchard, O. J., and D. Quah.1989. “The Dynamic Effects of Aggregate Demand and Supply Disturbances.” American Economic Review 79 (4): 655-73.
Blanchard, E. J., A. U. Santos-Paulino, C. Trentini, and E. Milet. 2021. “Implications of Rising Trade Tensions for FDI Projects.” Transnational Corporations Journal 28 (2): 161-83.
Blanco, L., F. Gonzalez, and I. Ruiz. 2013. “The Impact of FDI on CO2 Emissions in Latin America.” Oxford Development Studies 41 (1): 104-21.
Blonigen, B. A. 1997. “Firm-Specific Assets and the Link between Exchange Rates and Foreign Direct Investment.” American Economic Review 87 (3): 447-65.
Blonigen, B. A., and J. Piger. 2014. “Determinants of Foreign Direct Investment.” Canadian Journal of Economics 47 (3): 775-812.
Bloomberg. 2023. “These Five Countries Are Key Economic ‘Connectors’ in a Fragmenting World.” Bloomberg, November 2, 2023. https://www.bloomberg.com/news/ articles/2023-11-02/vietnam-poland-mexico-morocco-benefit-from-us-china-tensions.
Borensztein, E., J. De Gregorio, and J.-W. Lee. 1998. “How Does Foreign Direct Investment Affect Economic Growth?” Journal of International Economics 45 (1): 11535.
Borga, M., A. Pegoue, G. M. H. Legoff, A. S. Rodelgo, D. Entaltsev, and K. Egesa. 2022. “Measuring Carbon Emissions of Foreign Direct Investment in Host Economies.” IMF Working Paper 22/86, International Monetary Fund, Washington, DC.
Borin, A., M. Mancini, and D. Taglioni. 2021. “Economic Consequences of Trade and Global Value Chain Integration: A Measurement Perspective.” Policy Research Working Paper 9785, World Bank, Washington, DC.
Botta, E., and T. Kozluk. 2014. “Measuring Environmental Policy Stringency in OECD Countries: A Composite Index Approach.” OECD Economics Department Working Paper 1177, OECD Publishing, Paris.
Botwright, K., and M. Stephenson. 2023. “Climate Foreign Direct Investment: Here’s Everything You Need to Know.” World Economic Forum (blog), July 26, 2023. https:// www.weforum.org/stories/2023/07/climate-foreign-direct-investment-everything-youneed-to-know/.
Broner, F., T. Didier, S. L. Schmukler, S.L. and G. Von Peter. 2023. “Bilateral International Investments: The Big Sur?” Journal of International Economics 145 (November): 103795.
Brucal, A., B. Javorcik, and I. Love. 2019. “Good for the Environment, Good for Business: Foreign Acquisitions and Energy Intensity.” Journal of International Economics 121 (November): 103247.
Burger, A., A, Jaklic, and M. Rojec. 2012. “The Effectiveness of Investment Incentives: The Slovenian FDI Co-financing Grant Scheme.” Post-Communist Economies 24 (3): 383-401.
Busse, M., and C. Hefeker. 2007. “Political Risk, Institutions and Foreign Direct Investment.” European Journal of Political Economy 23 (2): 397-415.
Cai, P., Q. Gan, and S. Kim. 2018. “Do Sovereign Credit Ratings Matter for Foreign Direct Investments?” Journal of International Financial Markets, Institutions and Money 55 (July): 50-64.
Caldara, D., and M. Iacoviello. 2022. “Measuring Geopolitical Risk.” American Economic Review 112 (4): 1194-225.
Calderon, C., and T. Didier. 2009. “Will FDI Be Resilient in this Crisis?” In Latin America Beyond the Crisis: Impacts, Policies and Opportunities, Washington, DC: World Bank.
Campos, N. F, and Y. Kinoshita. 2003. “Why Does FDI Go Where It Goes? New Evidence from the Transition Economies.” IMF Working Paper 03/228, International Monetary Fund, Washington, DC.
Castellani, D., G. Marin, S. Montresor, and A. Zanfei. 2022. “Greenfield Foreign Direct Investments and Regional Environmental Technologies.” Research Policy 51 (1): 104405.
Chakraborty, C., and P. Nunnenkamp. 2008. “Economic Reforms, FDI, and Economic Growth in India: A Sector Level Analysis.” World Development 36 (7): 1192-212.
Chari, A., P. B. Henry, and D. Sasson. 2012. “Capital Market Integration and Wages.” American Economic Journal: Macroeconomics 4 (2): 102-32.
Chen, G., M. Geiger, and M. Fu. 2015. Manufacturing FDI in Sub-Saharan Africa: Trends, Determinants, and Impacts. Washington, DC: World Bank.
Chung, S. 2014. “Environmental Regulation and Foreign Direct Investment: Evidence from South Korea.” Journal of Development Economics 108 (May): 222-36.
Cipollina, M., G. Giovannetti, F. Pietrovito, and A. F. Pozzolo. 2012. “FDI and Growth: What Cross-Country Industry Data Say.” World Economy 35 (11): 1599-629.
Citi. 2025. “Foreign Direct Investment: Global Implications of ‘America First’ Policies.” Citigroup Global Markets, New York.
Claessens, S., M. A. Kose, and M. E. Terrones. 2011. “Financial Cycles: What? How? When?” NBER International Seminar on Macroeconomics 7 (1): 303-44.
Cole, M. A., R. J. R. Elliott, and P. G. Fredriksson. 2006. “Endogenous Pollution Havens: Does FDI Influence Environmental Regulations?” Scandinavian Journal of Economics 108 (1): 157-78.
Cole, M. A., R. J. R. Elliott, and L. Zhang. 2017. “Foreign Direct Investment and the Environment.” Annual Review of Environment and Resources 42 (1): 465-87.
Colen, L., D. Persyn, and A. Guariso. 2016. “Bilateral Investment Treaties and FDI: Does the Sector Matter?” World Development, 83 (July): 193-206.
Copeland, B. R. 2008. “The Pollution Haven Hypothesis.” In Handbook on Trade and the Environment, edited by K. P. Gallagher, 60-70. Cheltenham, U.K.: Edward Elgar Publishing.
Crivelli, E., R. De Mooij, and M. Keen. 2016. “Base Erosion, Profit Shifting and Developing Countries.” FinanzArchiv/Public Finance Analysis 73 (3): 268-301.
Damgaard, J., T. Elkjaer, and N. Johannesen. 2024. “What Is Real and What Is Not in the Global FDI Network?” Journal of International Money and Finance 140 (February): 102971.
De Beule, F., F. Schoubben, and K. Struyfs. 2022. “The Pollution Haven Effect and Investment Leakage: The Case of the EU-ETS.” Economics Letters 215 (June): 110536.
Delevic, U. 2020. “Employment and State Incentives in Transition Economies: Are Subsidies for FDI Ineffective? The Case of Serbia.” Transnational Corporations 27 (2): 31-63.
Demena, B. A., and S. K. Afesorgbor. 2020. “The Effect of FDI on Environmental Emissions: Evidence from a Meta-Analysis.” Energy Policy 138 (March): 111192.
Desbordes, R., and S. J. Wei. 2017. “The Effects of Financial Development on Foreign Direct Investment.” Journal of Development Economics 127 (July): 153-68.
Doytch, N., A. Ashraf, and C. P. Nguyen. 2024. “Foreign Direct Investment and Forest Land: A Sectoral Investigation.” Environmental and Sustainability Indicators 22 (June): 100353.
Doytch, N., and S. Narayan. 2016. “Does FDI Influence Renewable Energy Consumption? An Analysis of Sectoral FDI Impact on Renewable and Non-Renewable Industrial Energy Consumption.” Energy Economics 54 (February): 291-301.
Driffield, N., and C. Jones. 2013. “Impact of FDI, ODA and Migrant Remittances on Economic Growth in Developing Countries: A Systems Approach.” European Journal of Development Research 25 (2): 173-96.
EBRD (European Bank for Reconstruction and Development). 2024. Transition Report 2024-25: Navigating Industrial Policy. London: EBRD.
ECB (European Central Bank) 2024. Economic Bulletin. Issue 7. ECB, Frankfurt.
Echandi, R., M. Maliszewska, and V. Steenbergen. 2022. Making the Most of the African Continental Free Trade Area: Leveraging Trade and Foreign Direct Investment to Boost Growth and Reduce Poverty. Washington, DC: World Bank.
Ekholm, K., R. Forslid, and J. R. Markusen. 2007. “Export-Platform Foreign Direct Investment.” Journal of the European Economic Association 5 (4): 776-95.
Elgin, C., M. A. Kose, F. Ohnsorge, and S. Yu. 2021. “Understanding Informality.” CEPR Discussion Paper 16497, Centre for Economic Policy Research, London.
EM-DAT (The International Disaster Database). Centre for Research on Epidemiology of Disasters (CRED), UCLouvain, Brussels. Accessed on December 9, 2023. https:// emdat.be.
Eskeland, G. S., and A. E. Harrison. 2003. “Moving to Greener Pastures? Multinationals and the Pollution Haven Hypothesis.” Journal of Development Economics 70 (1): 1-23.
Evenett, S. J., and N. Pisani. 2023. “Geopolitics, Conflict, and Decoupling: Evidence of Western Divestment from Russia during 2022.” Journal of International Business Policy 6 (4): 511-40.
Farole, T. 2011a. “Special Economic Zones: What Have We Learned?” Economic Premise, No. 64. World Bank, Washington, DC.
Farole, T. 2011b. Special Economic Zones in Africa: Comparing Performance and Learning from Global Experience. Washington, DC: World Bank.
Farole, T., and D. Winkler, eds. 2014. Making Foreign Direct Investment Work for SubSaharan Africa. Washington, DC: World Bank.
Fernández-Villaverde, J., T. Mineyama, and D. Song. 2024. “Are We Fragmented Yet? Measuring Geopolitical Fragmentation and Its Causal Effects.” NBER Working Paper 32638, National Bureau of Economic Research, Cambridge, MA.
Fons-Rosen, C., S. Kalemli-Ozcan, B. E. Sorensen, C. Villegas-Sanchez, and V. Volosovych. 2017. “Foreign Investment and Domestic Productivity: Identifying Knowledge Spillovers and Competition Effects.” NBER Working Paper 23643, National Bureau of Economic Research, Cambridge, MA.
Fournier, J. M. 2015. “The Negative Effect of Regulatory Divergence on Foreign Direct Investment.” OECD Economics Department Working Paper 1268, OECD Publishing, Paris.
Freund, C., A. Mattoo, A. Mulabdic, and M. Ruta. 2024. “Is US Trade Policy Reshaping Global Supply Chains?” Journal of International Economics 152 (November): 104011.
Fu, X. 2011. “Processing Trade, FDI, and the Exports of Indigenous Firms: Firm-Level Evidence from Technology-Intensive Industries in China.” Oxford Bulletin of Economics and Statistics 73 (6): 792-817.
Ghosh, M., P. Syntetos, and W. Wang. 2012. “Impact of FDI Restrictions on Inward FDI in OECD Countries.” Global Economy Journal 12 (3): 1850265.
Global Trade Alert (database). Accessed on April 9, 2025. https://globaltradealert.org.
Gopinath, G., P.-O. Gourinchas, A. F. Presbitero, and P. Topalova. 2024. “Changing Global Linkages: A New Cold War?” IMF Working Paper 24/0076, International Monetary Fund, Washington, DC.
Guterres, A. 2024. Quoted in United Nations Conference on Trade and Development World Investment Report 2024. Geneva: United Nations.
Hale, G., and M. Xu. 2016. “FDI Effects on the Labor Market of Host Countries.” Working Paper 2016-25, Federal Reserve Bank of San Francisco.
Harding, T., and B. Javorcik. 2011. “Roll Out the Red Carpet and They Will Come: Investment Promotion and FDI Inflows.” Economic Journal 121 (557): 1445-76.
Harding, T., and B. Javorcik. 2013. “Investment Promotion and FDI Inflows: Quality Matters.” CESifo Economic Studies 59 (2): 337-59.
Harms, P., and P. G. Méon. 2018. “Good and Useless FDI: The Growth Effects of Greenfield Investment and Mergers and Acquisitions.” Review of International Economics 26 (1): 37-59.
Heckl, P., C. Lennon, and A. Schneebaum. 2025. “How Is Global Commerce Affecting the Gender Composition of Employment? A Firm-Level Analysis of the Effects of Exposure to Gender Norms via Trade and FDI.” Labour Economics 94 (June): 102696.
Henry, P. B. 2003. “Capital-Account Liberalization, the Cost of Capital, and Economic Growth.” American Economic Review 93 (2): 91-6.
Henry, P. B., and P. L. Lorentzen. 2003. “Domestic Capital Market Reform and Access to Global Finance: Making Markets Work.” NBER Working Paper 10064, National Bureau of Economic Research, Cambridge, MA.
Hijzen, A., P. S. Martins, T. Schank, and R. Upward. 2013. “Foreign-Owned Firms around the World: A Comparative Analysis of Wages and Employment at the MicroLevel.” European Economic Review 60 (May): 170-88.
Huang, K., N. Sim, and H. Zhao. 2020. “Does FDI Actually Affect Income Inequality? Insights from 25 Years of Research.” Journal of Economic Surveys 34 (3): 630-59.
Hund, K., D. La Porta, T. P. Fabregas, T. Laing, and J. Drexhage. 2020. Minerals for Climate Action: The Mineral Intensity of the Clean Energy Transition. Washington, DC: World Bank.
IEA (International Energy Agency) and Centre for Climate Finance & Investment. 2021. Clean Energy Investing: Global Comparison of Investment Returns. Paris: IEA.
IMF (International Monetary Fund). 2019. World Economic Outlook. October. Washington, DC: IMF.
IMF (International Monetary Fund). 2023a. “Geoeconomic Fragmentation and Foreign Direct Investment.” In World Economic Outlook. Washington, DC: IMF.
IMF (International Monetary Fund). 2023b. “How Will Trend Growth in China Impact the Rest of Asia?” In Regional Economic Outlook. Washington, DC: IMF.
Ivarsson, I., and C. G. Alvstam. 2005. “Technology Transfer from TNCs to Local Suppliers in Developing Countries: A Study of AB Volvo’s Truck and Bus Plants in Brazil, China, India, and Mexico.” World Development 33 (8): 1325-44.
Jaumotte, F., J. Kim, S. Pienknagura, and G. Schwerhoff. 2024. “Policies to Foster Green FDI: Best Practices for Emerging Market and Developing Economies.” Staff Climate Note 2024/004, International Monetary Fund, Washington, DC.
Javorcik, B. 2004. “Does Foreign Direct Investment Increase the Productivity of Domestic Firms? In Search of Spillovers through Backward Linkages.” American Economic Review 94 (3): 605-27.
Javorcik, B. 2015. “Does FDI Bring Good Jobs to Host Countries?” World Bank Research Observer 30 (1): 74-94.
Javorcik, B., L. Kitzmuller, H. Schweiger, and M. Yildirim. 2022. “Economic Costs of Friend-Shoring.” CEPR Discussion Paper 17764, Centre for Economic Policy Research, London.
Javorcik, B., and M. Spatareanu. 2005. “Do Foreign Investors Care about Labor Market Regulations?” Review of World Economics 141 (3): 375-403.
Javorcik, B., and V. Steenbergen. 2017. “Analysing the Impact of the Kigali Special Economic Zone on Firm Behaviour.” Working Paper F-38419-RWA-1, International Growth Centre, London.
Javorcik, B., and S. J. Wei. 2003. “Pollution Havens and Foreign Direct Investment: Dirty Secret or Popular Myth?” Contributions in Economic Analysis & Policy 3 (2).
Jude, C. 2019. “Does FDI Crowd Out Domestic Investment in Transition Countries?” Economics of Transition and Institutional Change 27 (1): 163-200.
Jude, C., and G. Levieuge. 2017. “Growth Effect of Foreign Direct Investment in Developing Economies: The Role of Institutional Quality.” World Economy 40 (4): 71542.
Kallen, C. 2025. “How Is Geopolitical Fragmentation Reshaping U.S. Foreign Direct Investment?” FEDS Notes. Board of Governors of the Federal Reserve System, Washington, DC.
Kannen, P., F. O. Semrau, and F. Steglich. 2021. “Green Gifts from Abroad? FDI and Firms’ Green Management.” Kiel Working Paper 2200, Kiel Institute for the World Economy, Kiel, Germany.
Kamaly, A. 2014. “Does FDI Crowd In or Out Domestic Investment? New Evidence from Emerging Economies.” Modern Economy 5 (4).
Karadima, S. 2021. “How FDI Can Help in the Fight against Biodiversity Loss.” Investment Monitor (blog), August 10, 2021. https://www.investmentmonitor.ai/ features/fdi-biodiversity-loss-environment-challenge/.
Kearney. 2025. “World at Inflection: The 2025 FDI Confidence Index.” Kearney Foresight Global Business Policy Council.
Kekic, L. 2009. “The Global Economic Crisis and FDI Flows to Emerging Markets.” Columbia FDI Perspectives 15. Columbia Center on Sustainable Investment, Columbia University, New York.
Khraiche, M., and P. de Araujo. 2021. “The Effect of Information Frictions on FDI Persistence.” Economic Modelling 94 (C): 14-27.
Kinoshita, Y. 2011. “Sectoral Composition of Foreign Direct Investment and External Vulnerability in Eastern Europe.” IMF Working Paper 11/123, International Monetary Fund, Washington, DC.
Knutsson, P., and P. I. Flores. 2022. “Trends, Investor Types and Drivers of Renewable Energy FDI.” OECD Papers on International Investment 2022/02, OECD Publishing, Paris.
Kose, M. A., P. Nagle, F. Ohnsorge, and N. Sugawara. 2021. Global Waves of Debt. World Bank: Washington, DC.
Kose, M. A., and F. Ohnsorge, eds. 2024. Falling Long-Term Growth Prospects: Trends, Expectations, and Policies. Washington, DC: World Bank.
Kose, M. A., E. Prasad, K. Rogoff, and S.-J. Wei. 2009. “Financial Globalization: A Reappraisal.” IMF Staff Papers 56 (1): 8-62.
Kose, M. A., E. S. Prasad, and M. E. Terrones. 2009. “Does Openness to International Financial Flows Raise Productivity Growth?” Journal of International Money and Finance 28 (4): 554-80.
Kose, M. A., N. Sugawara, and M. E. Terrones. 2020. “Global Recessions.” Policy Research Working Paper 9172, World Bank, Washington, DC.
Krugman, P. 1998. “Fire-Sale FDI.” In Capital Flows and the Emerging Economics: Theory, Evidence, and Controversies, edited by S. Edwards, 43-58. Chicago: University of Chicago Press.
Kruse, T., A. Dechezleprêtre, R. Saffar, and L. Robert. 2022. “Measuring Environmental Policy Stringency in OECD Countries—An Update of the OECD Composite EPS Indicator.” OECD Economics Department Working Paper 1703, OECD Publishing, Paris.
Kugler, M., and H. Rapoport. 2007. “International Labor and Capital Flows: Complements or Substitutes?” Economics Letters 92 (2): 155-62.
Kurilla, M. 2024. “What Is the CHIPS Act?” Council on Foreign Relations (blog), April 29, 2024. https://www.cfr.org/in-brief/what-chips-act.
Laeven, L., and F. Valencia. 2020. “Systemic Banking Crises Database II.” IMF Economic Review 68 (2): 307-61.
Lan, J., M. Kakinaka, and X. Huang. 2012. “Foreign Direct Investment, Human Capital and Environmental Pollution in China.” Environmental and Resource Economics 51 (2): 255-75.
Loungani, P., and A. Razin. 2001. “How Beneficial Is Foreign Direct Investment for Developing Countries?” Finance and Development 38 (2).
Lovei, M. 2017. “Climate Impacts on African Fisheries: The Imperative to Understand and Act.” Nasikiliza: Sharing Stories of Development from Africa (blog), November 11, 2017. https://blogs.worldbank.org/en/nasikiliza/climate-impacts-on-african-fisheriesthe-imperative-to-understand-and-act.
Luu, H. 2016. “Greenfield Investments, Cross-Border M&As, and Economic Growth in Emerging Countries.” Economics and Business Letter 5 (3): 87-94.
Makki, S. S., and A. Somwaru. 2004. “Impact of Foreign Direct Investment and Trade on Economic Growth: Evidence from Developing Countries.” American Journal of Agricultural Economics 86 (3): 795-801.
Makki, S. S., A. Somwaru, and H. C. Bolling. 2004. “Determinants of Foreign Direct Investment in the Food-Processing Industry: A Comparative Analysis of Developed and Developing Economies.” Journal of Food Distribution Research 35 (3): 60-67.
Markusen, J. R., and N. Trofimenko. 2009. “Teaching Locals New Tricks: Foreign Experts as a Channel of Knowledge Transfers.” Journal of Development Economics 88 (1): 120-31.
Mattoo, A., N. Rocha, and M. Ruta. 2020. Handbook of Deep Trade Agreements. Washington, DC: World Bank.
Mensah, J. T., and N. Traore. 2024. “Infrastructure Quality and FDI Inflows: Evidence from the Arrival of High-Speed Internet in Africa.” World Bank Economic Review (38) 1: 1-23.
Mercer-Blackman, V., W. Xiang, and F. Khan. 2021. “Understanding FDI Spillovers in the Presence of GVCs.” Policy Research Working Paper 9645, World Bank, Washington, DC.
Messerschmidt, L., and N. Janz. 2023. “Unravelling the ‘Race to the Bottom’ Argument: Foreign Direct Investment and Different Types of Labour Rights.” World Development 161 (1): 106097.
Mileva, E. 2008. “The Impact of Capital Flows on Domestic Investment in Transition Economies.” European Central Bank Working Paper 871, European Central Bank, Frankfurt.
Miranda-Agrippino, S., and H. Rey. 2022. “The Global Financial Cycle.” In Handbook of International Economics, edited by G. Gopinath, E. Helpman, and K. Rogoff, 1-43. Amsterdam: Elsevier.
Mistura, F., and C. Roulet. 2019. “The Determinants of Foreign Direct Investment: Do Statutory Restrictions Matter?” OECD Working Paper on International Investment 2019/01, OECD Publishing, Paris.
Mody, A., and A. P. Murshid. 2005. “Growing Up with Capital Flows.” Journal of International Economics 65 (1): 249-66.
Montinari, L. 2023. “Harnessing Foreign Direct Investment for Gender Equality.” In Joining Forces for Gender Equality: What Is Holding Us Back? Paris: OECD Publishing.
Mulatu, A. 2017. “The Structure of UK Outbound FDI and Environmental Regulation.” Environmental and Resource Economics 68 (1): 65-96.
Myles, D. 2024. “US Outbound Screening Countdown Enters Final Stretch.” FDI Intelligence, August 9, 2024. https://www.fdiintelligence.com/content/d48a22b0-d8ec57da-86be-782d6ebdcfa2.
Myles, D. 2025. “Tariff Uncertainty Threatens US FDI Appeal.” FDI Intelligence, April 9, 2025. https://www.fdiintelligence.com/content/d69bcc8a-5a55-4392-8b7c-3cc95e8 d1e78.
Nayyar, G., M. Hallward-Driemeier, and E. Davies. 2021 At Your Service? The Promise of Services-Led Development. Washington, DC: World Bank.
Nebe, M., P. Economou, and L. Abruzzese. 2024. Shifting Shores: FDI Relocations and Political Risk. Washington, DC: Multilateral Investment Guarantee Agency, World Bank.
Neise, T., F. Sohns, M. Breul, and J. Revilla Diez. 2022. “The Effect of Natural Disasters on FDI Attraction: A Sector-Based Analysis over Time and Space.” Natural Hazards 110 (2): 999-1023.
Noorbakhsh, F., A. Paloni, and A. Youssef. 2001. “Human Capital and FDI Inflows to Developing Countries: New Empirical Evidence.” World Development 29 (9): 1593-610.
OECD (Organisation for Economic Co-operation and Development). 2009. OECD Benchmark Definition of Foreign Direct Investment 2008. Fourth Edition. Paris: OECD Publishing.
OECD (Organisation for Economic Co-operation and Development). 2019. “Monitoring and Evaluation: A Brief Guide for Investment Promotion Agencies.” OECD Investment Insights. OECD Publishing: Paris.
OECD (Organisation for Economic Co-operation and Development). 2022. FDI Qualities Indicators. Paris: OECD Publishing.
OECD (Organisation for Economic Co-operation and Development). 2025. OECD Benchmark Definition of Foreign Direct Investment 2025. Fifth Edition. Paris: OECD Publishing.
Oh, J. E., M. Cordeiro, J. A. Rogers, K. Nguyen, D. Bongardt, L. T. Dang, and V. A. Tuan. 2019. Addressing Climate Change in Transport. Volume 1: Pathway to Low Carbon Transport. Washington, DC: World Bank.
Osei, M. J., and J. Kim. 2020. “Foreign Direct Investment and Economic Growth: Is More Financial Development Better?” Economic Modelling 93 (December): 154-61.
Owens, J., and R. Wamuyu. 2024. “How Will Countries Compete for FDI in Light of the New Global Tax Environment?” Columbia FDI Perspectives 390. Columbia Center on Sustainable Investment, Columbia University, New York.
Parente, R. M., and F. Moreau. 2024. “The Dynamics of Trade Integration and Fragmentation in LAC.” IMF Working Paper 24/253, International Monetary Fund, Washington, DC.
Pedroni, P. 2013. “Structural Panel VARs.” Econometrics 1 (2): 180-206.
Pienknagura, S. 2024. “Climate Policies as a Catalyst for Green FDI.” IMF Working Paper 24/46, International Monetary Fund, Washington, DC.
Poelhekke, S., and F. Van der Ploeg. 2015. “Green Havens and Pollution Havens.” World Economy 38 (7): 1159-78.
Qiang, C. Z., Y. Liu, and V. Steenbergen. 2021. An Investment Perspective on Global Value Chains. Washington, DC: World Bank.
Ragoussis, A. 2020. “How Beneficial Are Foreign Acquisitions of Firms in Developing Countries? Evidence from Six Countries.” In Global Investment Competitiveness Report. Washington, DC: World Bank.
Ragoussis, A., D. Rigo, and G. Santoni. 2024. “The Rising Concentration of Foreign Direct Investment.” Policy Research Working Paper 10815, World Bank, Washington, DC.
Ratha, D., E. J. Kim, A. Mahmood, S. Plaza, W. Shaw, and X. Zhu. 2023. Market Finance for Development: Taking Stock. Washington, DC: Multilateral Investment Guarantee Agency, World Bank.
Roeger W., and P. J. J. Welfens 2022. “The Macroeconomic Effects of Import Tariffs in a Model with Multinational Firms and Foreign Direct Investment.” International Economics and Economic Policy 19 (2): 245-66.
Rozenberg, J., and M. Fay, eds. 2019. Beyond the Gap: How Countries Can Afford the Infrastructure They Need while Protecting the Planet. Washington, DC: World Bank.
Rygh, A., K. Torgersen, and G. R. Benito. 2022. “Institutions and Inward Foreign Direct Investment in the Primary Sectors.” Review of International Business and Strategy 33 (2)
Saha, A., J. Thorpe, P. O’Flynn, and H. Bucher. 2020. Designing for Impact: SouthSouth Trade and Investment. Geneva: International Trade Centre.
Santos Silva, J. M. C., and S. Tenreyro. 2006. “The Log of Gravity.” Review of Economics and Statistics 88 (4): 641-58.
Sauvant, K. P., M. Stephenson, and Y. Kagan. 2021. “Green FDI: Encouraging CarbonNeutral Investment.” Columbia FDI Perspectives 316. Columbia Center on Sustainable Investment, Columbia University, New York.
Steenbergen, V. 2023. “What Makes an Investment Promotion Agency Effective? Findings from a Structural Gravity Model.” Policy Research Working Paper 10376, World Bank, Washington, DC.
Steenbergen, V., Y. Liu, M. P. Latorre, and X. Zhu. 2022. “The World Bank’s Harmonized Bilateral FDI Databases: Methodology, Trends, and Possible Use Cases.” World Bank, Washington, DC.
Stoddard, O., and I. Noy. 2015. “Fire-Sale FDI? The Impact of Financial Crises on Foreign Direct Investment.” Review of Development Economics 19 (2): 387-99.
Tan, J. 2024. “How Widespread Is FDI Fragmentation?” IMF Working Paper 2024/179, International Monetary Fund, Washington, DC.
Tinbergen, J. 1962. Shaping the World Economy: Suggestions for an International Economic Policy. New York: Twentieth Century Fund.
Tintelnot, F. 2017. “Global Production with Export Platforms.” Quarterly Journal of Economics 132 (1): 157-209.
Toews, G., and P.-L. Vezina. 2022. “Resource Discoveries, FDI Bonanzas, and Local Multipliers: Evidence from Mozambique.” Review of Economics and Statistics 104 (5): 1046-58.
UNCTAD (United Nations Conference on Trade and Development). 2000. Tax Incentives and Foreign Direct Investment: A Global Survey. Geneva: United Nations.
UNCTAD (United Nations Conference on Trade and Development). 2001. World Investment Report 2001: Promoting Linkages. Geneva: United Nations.
UNCTAD (United Nations Conference on Trade and Development). 2010. World Investment Report 2010: Investing in a Low-Carbon Economy. Geneva: United Nations.
UNCTAD (United Nations Conference on Trade and Development). 2015. World Investment Report 2015: Reforming International Investment Governance. Geneva: United Nations
UNCTAD (United Nations Conference on Trade and Development). 2019. World Investment Report 2019: Special Economic Zones. Geneva: United Nations.
UNCTAD (United Nations Conference on Trade and Development). 2021. Multinational Enterprises and the International Transmission of Gender Policies and Practices. Geneva: United Nations.
UNCTAD (United Nations Conference on Trade and Development). 2022a. “Investment Policy Trends in Climate Change Sectors, 2010-2022.” Investment Policy Monitor 9.
UNCTAD (United Nations Conference on Trade and Development). 2022b. Foreign Direct Investment in LDCs: Investment Trends and Policies since LDC IV and the Way Forward. Geneva: United Nations.
UNCTAD (United Nations Conference on Trade and Development). 2023. “Evolution of FDI Screening Mechanisms.” Investment Policy Monitor 25.
UNCTAD (United Nations Conference on Trade and Development). 2024a. World Investment Report 2024. Geneva: United Nations.
UNCTAD (United Nations Conference on Trade and Development). 2024b. Global Economic Fracturing and Shifting Investment Patterns. Geneva: United Nations.
Walsh, J. P., and J. Yu. 2010. “Determinants of Foreign Direct Investment: A Sectoral and Institutional Approach.” IMF Working Paper 10/187, International Monetary Fund, Washington, DC.
Wang, M., and M. C. Wong. 2011. “FDI, Education, and Economic Growth: Quality Matters.” Atlantic Economic Journal 39 (2): 103-15.
WDI (database). World Development Indicators. World Bank. https:// databank.worldbank.org/source/world-development-indicators.
Wermelinger, M. 2023. “What Can Governments Do to Boost FDI for Sustainable Development?” Columbia FDI Perspectives 354. Columbia Center on Sustainable Investment, Columbia University, New York.
World Bank. 2012. “Climate-Smart Agriculture.” World Bank, Washington, DC.
World Bank. 2017. “Special Economic Zones: An Operational Review of Their Impacts.” World Bank: Washington, DC.
World Bank. 2018. Global Investment Competitiveness Report 2017/2018: Foreign Investor Perspectives and Policy Implications. Washington, DC: World Bank.
World Bank. 2020. World Development Report 2020: Trading for Development in the Age of Global Value Chains. Washington, DC: World Bank.
World Bank. 2021a. Enabling Private Investment in Climate Adaptation and Resilience. Washington, DC: World Bank.
World Bank. 2021b. The Economic Case for Nature: A Global Earth-Economy Model to Assess Development Policy Pathways. Washington, DC: World Bank.
World Bank. 2021c. “Investment Policy and Promotion: Attracting Foreign Investment and Maximizing Impact for the Local Economy.” World Bank, Washington, DC.
World Bank 2022a. “Climate and Development: An Agenda for Action—Emerging Insights from World Bank Group 2021-22 Country Climate and Development Reports.” World Bank, Washington, DC.
World Bank. 2022b. “Investment Policy and Promotion Operational Guide.” World Bank, Washington, DC.
World Bank. 2023a. Global Economic Prospects. January. Washington, DC: World Bank.
World Bank. 2023b. The Promise of Integration: Opportunities in a Changing Global Economy. Latin America and the Caribbean Economic Review. April. Washington, DC: World Bank.
World Bank. 2023c. Changing Foreign Direct Investment Dynamics and Policy Responses—White Paper for Japan’s G7 Presidency. Washington, DC: World Bank.
World Bank. 2024a. Global Economic Prospects. June. Washington, DC: World Bank.
World Bank. 2024b. “Private Sector Investment Lab.” World Bank, Washington, DC. https://www.worldbank.org/en/about/unit/brief/private-sector-investment-lab.
World Bank. 2024c. “New Partnership Aims to Connect 300 Million to Electricity by 2030.” Press release, April 17, 2024.
World Bank. 2024d. World Bank East Asia and the Pacific Economic Update. October 2024: Jobs and Technology. October. Washington, DC: World Bank.
World Bank. 2024e. Services Unbound: Digital Technologies and Policy Reform in East Asia and Pacific. East Asia and Pacific Development Studies. Washington, DC: World Bank.
World Bank. 2024f. “African Continental Free Trade Area (AfCFTA): Supporting Implementation with a Focus on Investment.” World Bank, Washington, DC.
World Bank. 2024g. Global Economic Prospects. January. Washington, DC: World Bank.
World Bank. 2025. Global Economic Prospects. January. Washington, DC: World Bank.
World Bank and WTO (World Trade Organization). 2023. Trade in Services for Development: Fostering Sustainable Growth and Economic Diversification. Geneva: WTO.
World Economic Forum. 2020. “Digital FDI Policies, Regulations and Measures to Attract FDI in the Digital Economy.” White Paper, World Economic Forum, Geneva.
World Economic Forum. 2023. “Guidebook on Facilitating Climate FDI.” White Paper, World Economic Forum, in collaboration with fDi Strategies, Geneva.
Xiahou, Q., C. H. Springer, and R. Mendelsohn. 2022. “The Effect of Foreign Investment on Asian Coal Power Plants.” Energy Economics 105 (January): 105752.
Developing economies face an investment shortfall of historic proportions. Even as development needs rise, investment has slowed sharply. This study presents the World Bank’s most comprehensive assessment of investment in emerging and developing economies. It explains why investment matters, why it has stalled, and how to reignite it. History shows that robust investment spurts drive faster growth, more jobs, higher productivity, and deeper poverty reduction. Reversing the slowdown is possible—with strong business and governance conditions, credible fiscal and monetary frameworks, well-targeted public investment, and deeper international cooperation. Reigniting investment is not just a national priority—it is a global imperative.
Investment is the cornerstone of economic growth and sustainable development. This volume provides the most comprehensive and rigorous assessment of investment dynamics in emerging and developing economies to date. Drawing on cutting-edge research and rich case studies, the volume explores the drivers of public, private, and foreign investment; highlights the transformative power of investment accelerations; and distills practical policy lessons. At a time when emerging and developing economies face a massive investment shortfall and financing needs are mounting, this book offers both a diagnosis of the challenges and a road map for reigniting momentum. It is an essential resource for policy makers, scholars, and practitioners committed to unlocking investment as an engine of inclusive and sustainable development.
Ugo Panizza
Pictet Chair in Finance and Development, Geneva Graduate Institute, and Vice President, Centre for Economic Policy Research
Geopolitical tensions, shrinking aid, and strained public budgets are squeezing investment just as emerging market and developing economies (EMDEs) face soaring financing needs. This timely volume offers a clear and compelling analysis of shifting investment patterns—how they have evolved, why these shifts matter, and how to reverse the decline. It is essential reading for policy makers and practitioners working to foster sustainable growth in EMDEs.
Beata Javorcik
Chief Economist, European Bank for Reconstruction and Development, and Professor of Economics, University of Oxford
ISBN 978-1-4648-2304-6